
Abstract
In order to investigate the effects of unsteady aerodynamic loads on the driving safety and comfort of trains running on bridges, a three-dimensional and multi-body system model of train–track–bridge was established and the dynamic responses of the coupling system were calculated by combining the finite element software ANSYS with the multi-body dynamics software SIMPACK. The driving safety and comfort of a train running on a bridge under steady and unsteady aerodynamic loads were compared and analyzed. The effects of different crosswind speeds on the driving safety of the train running on the bridge under unsteady aerodynamic loads were studied. It is found that the index values of the driving safety and comfort of the train at the speed of 200–300 km/h without the wind loads are smaller (meaning safer) than those of the train under the wind loads. When the average speed of crosswind is 20 m/s, the driving safety assessment results of the train are better and its comfort assessment results are more conservative with considering the unsteady aerodynamic loads than the steady wind load case. When the average speed of crosswind is smaller than 10 m/s and the train speed is 250 km/h, the driving safety and comfort of the train on the bridge meet the requirements, and the level of stability can reach “good” or above. Through the analysis of driving safety of the train on the bridge under different crosswind speeds, the threshold values of safe driving were obtained, which can provide a better basis for the safe operation of trains on bridges.
Introduction
The disturbance effects of aerodynamic loads on trains is stronger and stronger due to their increasing driving speed and lightweight design. Concerns regarding the driving safety and comfort of trains running on bridges under high crosswinds are highlighted. Many researchers have carried out a large number of studies on the wind-induced safety issues of trains (Baker, 2010, 2013; Cheli et al., 2012; He et al., 2018; Li et al., 2019; Rocchi et al., 2018; Zhang et al., 2018). However, these existing studies are far from sufficient.
In terms of wind loads on trains, Yu et al. (2016) studied the effects of steady and unsteady aerodynamic loads on the driving safety of high-speed trains under different crosswind speeds. It is concluded that the unsteady aerodynamic loads have more significant influences on the safety of high-speed trains. Combining wind tunnel tests and numerical simulations, Cheli et al. (2010) studied the dynamic response of trains under crosswind, and defined a characteristic wind speed curve to evaluate the driving safety of trains under crosswind. Yu et al. (2014) also determined an average wind speed curve and its confidence interval for the driving safety of high-speed trains under random wind conditions by studying the effects of unsteady aerodynamic loads on high-speed trains. However, these studies only focus on trains running on roads rather than on bridges. When a train runs on bridges, its aerodynamic performance can be affected by the bridge and its driving stability can be constrained by the coupling effects between the train and the bridge. Zhang et al. (2016) investigated the coupling vibration mechanism of a wind–train–bridge system and demonstrated the influence of basic factors, such as average wind speed, buffeting of wind turbulence, track irregularity, train vibration on light rail, and bridge stiffness. It is shown that the turbulent wind and track irregularity have greater influence on the train acceleration. Xu et al. (2007) effectively predicted the dynamic responses of the train-cable-stayed bridge coupling system under crosswinds by measuring the aerodynamic coefficients and flutter derivatives, and revealed that the bridge vibration generated by the strong crosswind and train could aggravate the driving safety and comfort of trains. Xia et al. (2008) established a dynamic model of a wind-train-bridge system by simulating the fluctuating wind field above the bridge, and analyzed the dynamic responses of the bridge and the driving safety and stability of the train. It is found that the crosswind has great influence on the train-bridge system. Li et al. (2019) studied the crosswind aerodynamic characteristics of high-speed trains on streamlined bridge-deck by wind tunnel test, and the experimental results indicate that when the high-speed train (HST) is on the downstream track of the bridge-deck, it experiences significant changes in its aerodynamics depending on the angle of attack (α) of the oncoming flow. However, only the steady aerodynamic loads are considered in their research on trains running on the bridge without considering the unsteady aerodynamic loads, or the influence of wind deflection angle is not considered. Under the action of unsteady aerodynamic loads, the safety and comfort of the train running on the bridge under the influence of wind yaw angle have been much less studied in the literature.
Aiming at resolving the problem discussed above, in this article, the finite element software ANSYS and multi-body dynamics software SIMPACK were used to jointly simulate the train–track–bridge multi-body system using a rigid-flexible coupling method and thus to calculate and analyze the dynamic responses, namely, the driving safety and comfort, of trains under steady and unsteady aerodynamic loads. Finally, some main conclusions were presented.
Establishment and verification of a train–track–bridge coupling vibration system
The train–track–bridge coupling vibration system model consists of two parts: a train model which is a rigid body system and established in SIMPACK 2019x and a track–bridge model which is a flexible system and modeled as a sub-structure in ANSYS 15.0. The train–track–bridge coupling vibration system is jointly simulated through data exchange at the contact points between the train and track based on their interactions. Then, the established multi-body system model is validated by calculating the nominal force to obtain the maximum residual acceleration of the system. Li et al. (2018b) indicated that the system is balanced in the initial state and the established model is acceptable if the residual acceleration of the multi-body system is less than 0.01 m/s2. Otherwise, the model has errors and needs to be re-examined and modified. In this study, the nominal force and initial static equilibrium state of the train–track–bridge multi-body system model were calculated before the dynamic analysis. It is shown that the maximum residual acceleration of the system model is 3.56 × 10⁻⁷ m/s2, which proves that the system model is appropriate. The whole train–track–bridge coupling vibration system model is shown in Figure 1.

Train–track–bridge coupling vibration system model.
Multi-body dynamic model of train
In order to establish a refined realistic train model, the CRH2 type of train (Xu, 2017; Yang, 2018) used in China is adopted here with nonlinear damping. The train model consists of one body, two bogies, four wheel sets, and eight axle boxes. Due to the nonlinear factors of bogies (lateral damper, vertical damper, anti-snaking damper and lateral stiffness of bolster guide), the vertical and lateral movements of the train are considered using the coupling relationship. The multi-body dynamic train model has 50 degrees of freedom (DOFs) in total, as listed in Table 1. In this study, the cross-level, longitudinal irregularity, and alignment irregularity of the track are taken into consideration, and they are used as the input of excitations. In order to determine the maximum speed for safe and comfortable operation of the train, the critical speed of the vehicle must be calculated. The critical speed of the vehicle is determined by the structure of the vehicle itself. According to the curve in Figure 2, when the speed goes down to about 390 km/h, the lateral vibration of the wheelset quickly converges to the balance position, which is the nonlinear critical speed of the vehicle system.
Freedom degrees for the multi-body dynamic model of train.

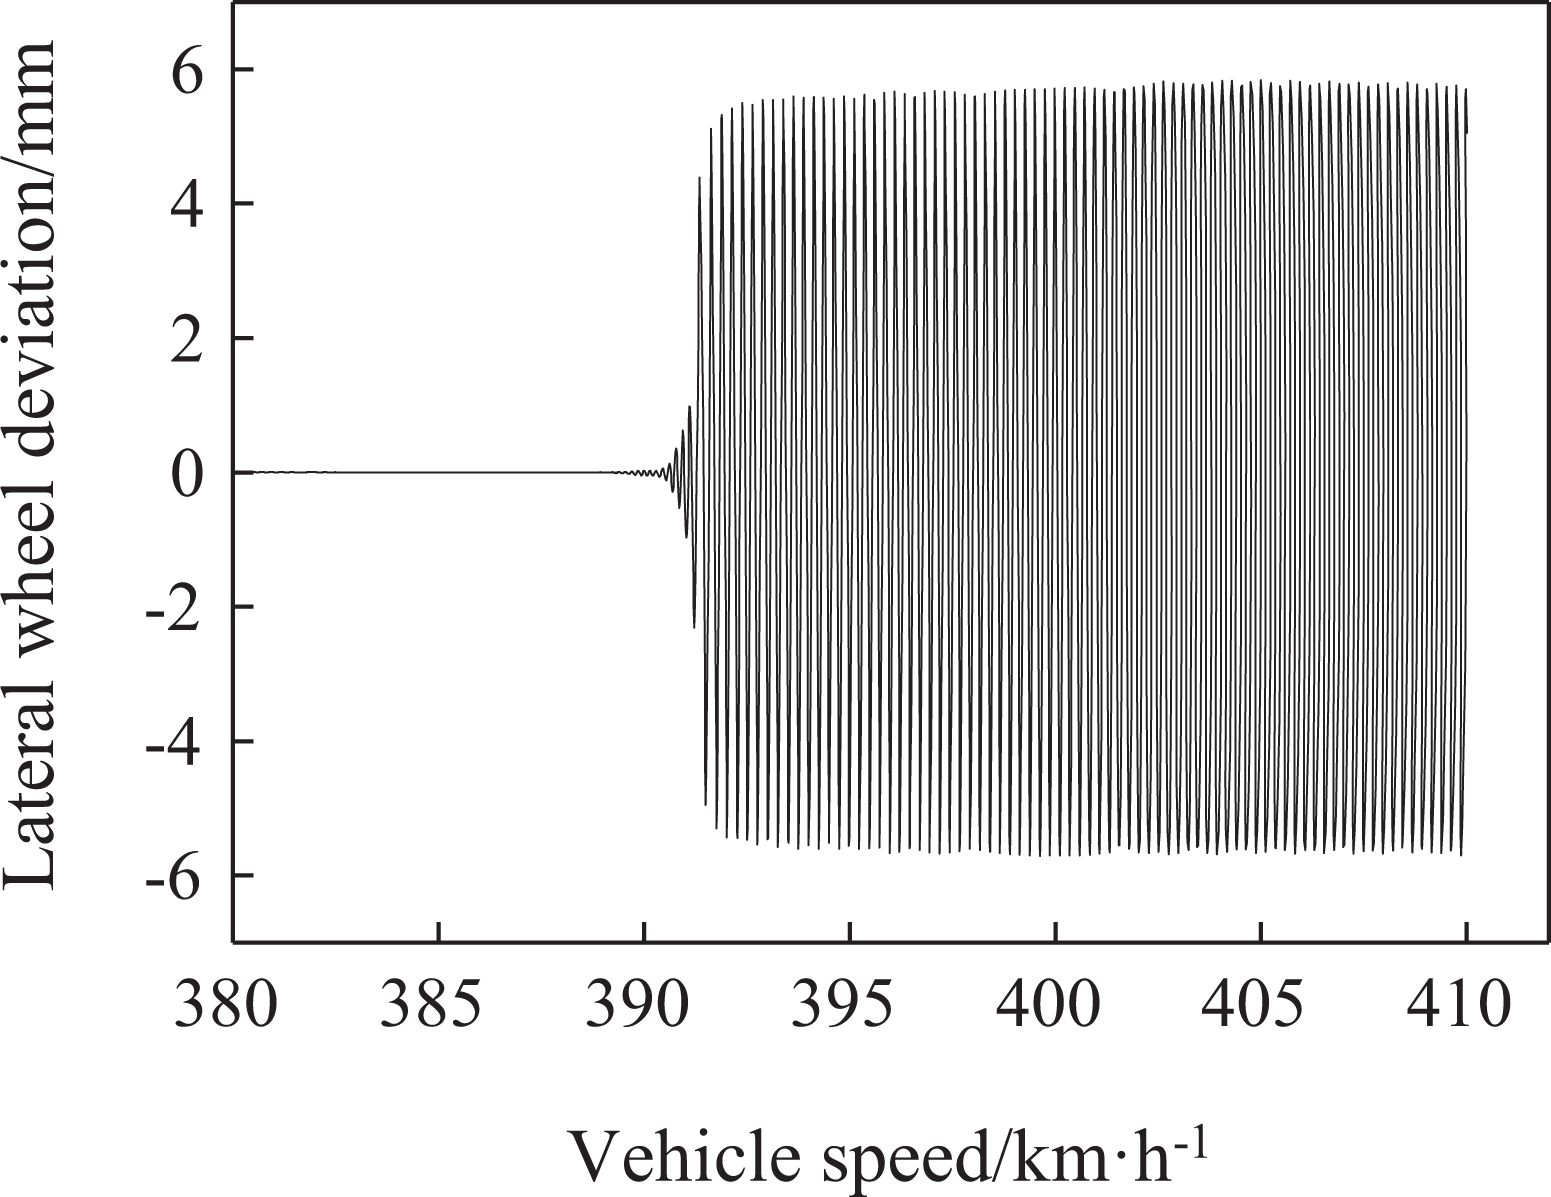
The relation curve between the lateral wheel displacement and the speed.
Establishment of track–bridge multi-body system model
In the past, the coupling vibration analysis between vehicles and bridges in SIMPACK was mainly carried out using the dummy coupling method or the equivalent flexible track method. For the dummy coupling method, the dummy element is used as the connecting part between the flexible body (bridge) and the rigid body (trains). For the equivalent flexible track method, the bridge model and the track are regarded as a whole and the vehicle-bridge system is decoupled where the bridge is not explicitly modeled in the system as a flexible body. The excitation to the bridge is only provided by the wheel-rail force and other loads cannot be applied on the bridge structure. For both methods, there is no a flexible track in the track–bridge multi-body system model.
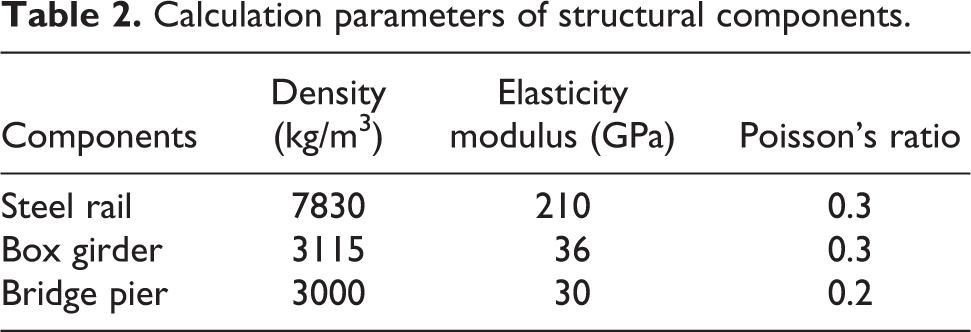
In this article, a new method is used to establish a fine flexible track model in SIMPACK, and the vehicle–track–bridge coupled vibration analysis is realized. The bridge is divided into three spans, and the length of each span is 32 m. The cross section of each span is a box girder with a single box and chamber with its geometries shown in Figure 3(a). The pier with a rectangular hollow section and 0.5 m thick wall is made up of C30 concrete, as shown in Figure 3(b). Before the track and bridge are imported into the SIMPACK as flexible body structure models, the first step is to perform a sub-structure analysis on them in the ANSYS to generate the required *.cdb and *.sub information files. The rails, box girders, and piers are connected by nonlinear spring and damping elements to form a multi-flexible body system model. A three-dimensional shape of the bridge is imported in the SIMPACK through CAD interfaces, which only considers that the train passes the left side track of the bridge, as shown in Figure 4. In the multi-body system, the track on the bridge is deemed as a flexible structure and is established according to the parameters of the UIC60 rail. For the establishment of flexible track, the *.ftr file containing the track information and the *.fbi file generated in SIMPACK need to be imported through the flex track module. The longitudinal spacing of fasteners used for the track model is 0.6 m, and the calculation parameters of each structural component are shown in Table 2.
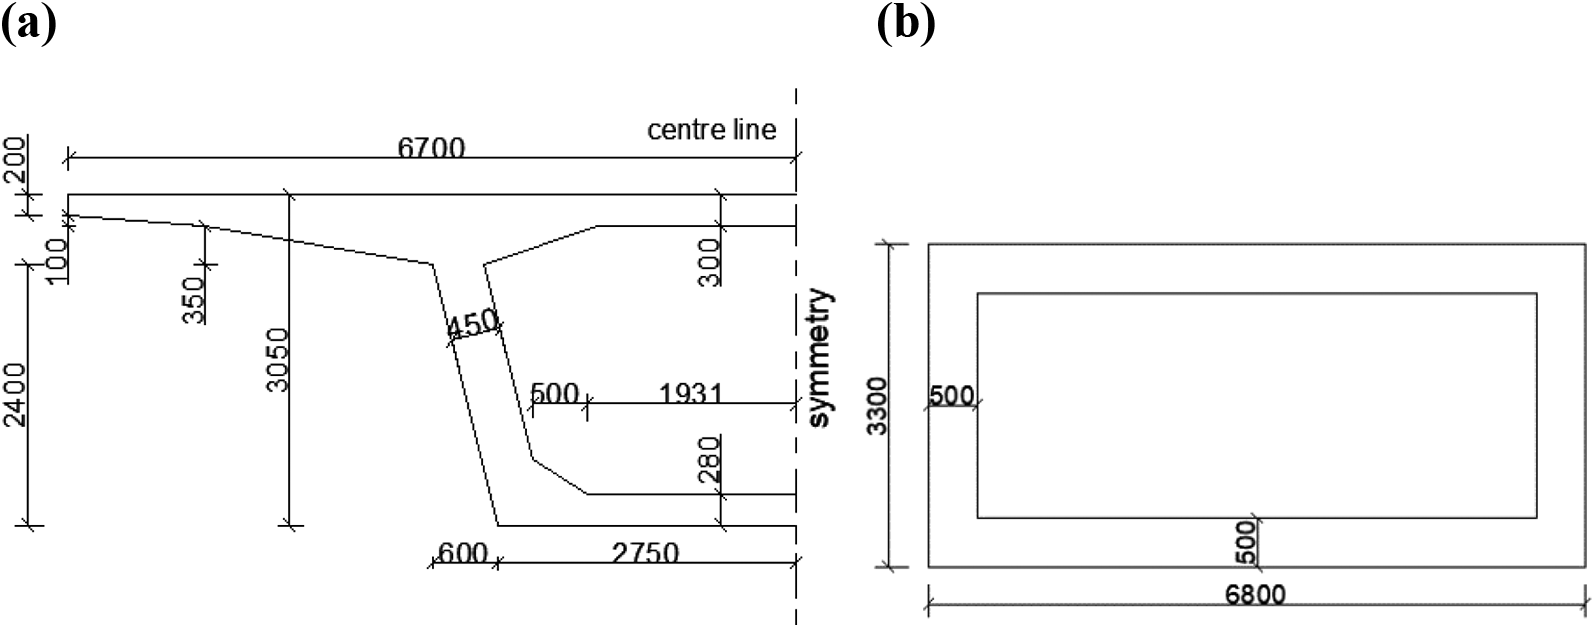
Cross section of simply supported beam bridge: (a) section geometry of box girder (unit: mm) and (b) section geometry of pier (unit: mm).
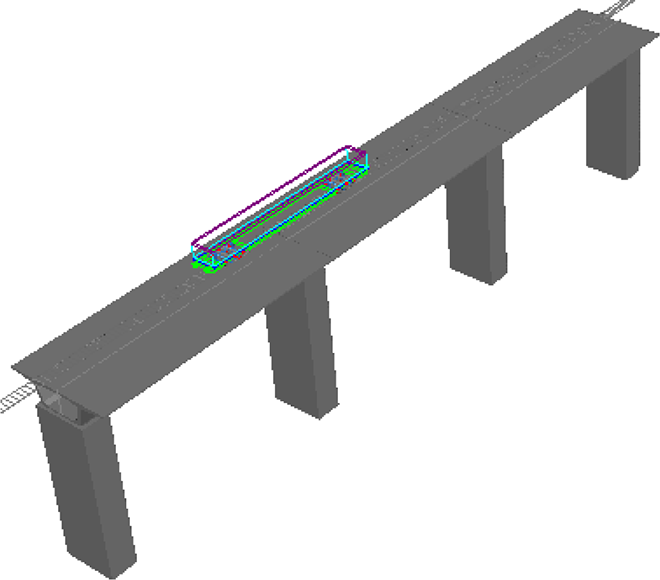
A train passing the left side track of the bridge.
Calculation parameters of structural components.
Verification of train–track–bridge coupling vibration system
Using the same parameters of the trailer model, bridge, and track as in Yang (2018), the train–track–bridge coupling vibration analysis model is established using the wheel-rail coupling method. Yang (2018) compared the SIMPACK calculation results and ANSYS transient dynamic analysis results to verify the SIMPACK analysis method. The calculation results in this study were compared with those in Yang (2018) with a train speed of 300 km/h, as listed in Table 3. It can be seen that the calculation results in this study are very consistent with Yang (2018), which validates the feasibility of the train–track–bridge coupling vibration method of this study.
Calculation results comparison between this study and the literature.

Modeling of unsteady aerodynamic loads on the train
Loading method of aerodynamic loads on the train
In actual crosswind loads, the wind pressure of the train should be distributed on the train body surface. However, such an aerodynamic loading method is too complicated and cannot be implemented in SIMPACK. Therefore, the aerodynamic force and aerodynamic moment are used as the concentrating loads acting on the center point of the car body in the simulation. The whole process of aerodynamic loads on the train includes a loading process, a continuous acting process, and an unloading process.
Since the coordinates of dynamics model of the SIMPACK train are different from the coordinates of the aerodynamic loads on the train, the calculated data of wind loads should be converted to the SIMPACK coordinate system. In order to weaken the abrupt effect of train aerodynamic load, the loading time of 0.5 s was adopted. The lateral force is loaded as shown in Figure 5 for the wind speed of 20 m/s and the train speed of 200 km/h.
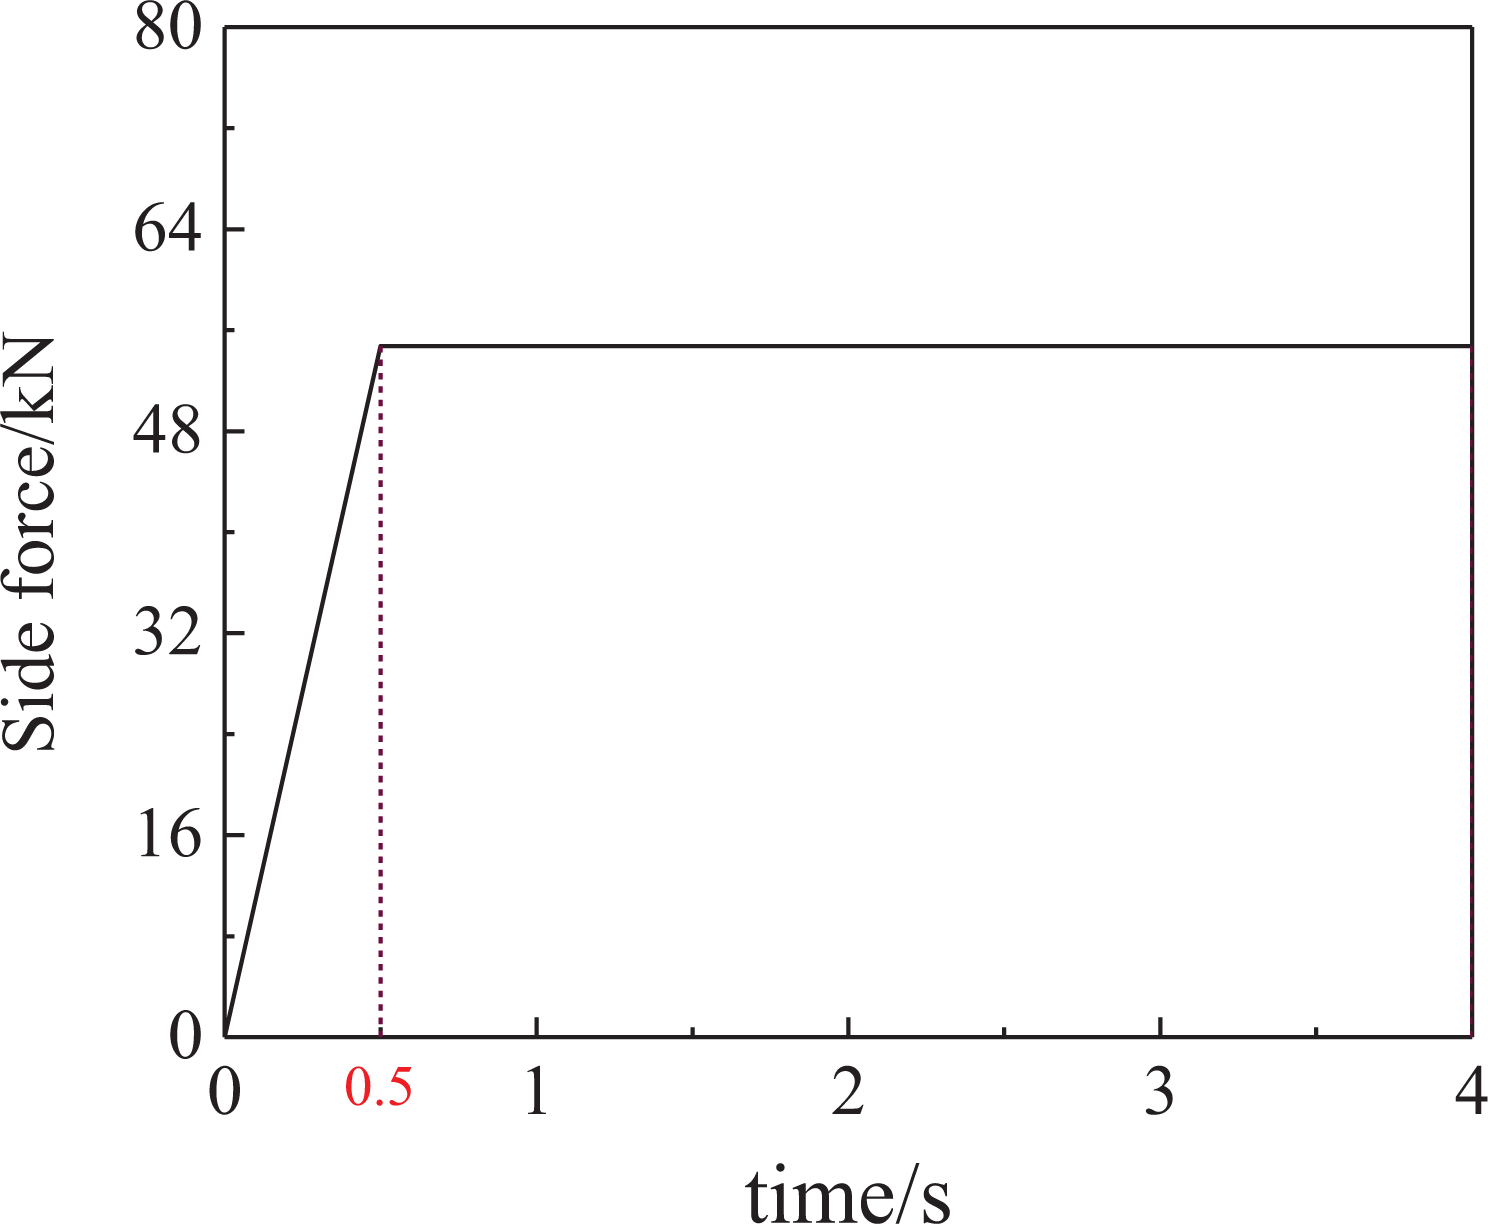
Loading process diagram of aerodynamic loads.
Numerical simulation analysis of aerodynamic coefficients
In this section, we took a double-line simple box girder for HSTs and a CRH2 train as the research object. The CRH2 train is 3.5 m high and 3.38 m wide. The train is located above the track on the left side (the windward side of the bridge), the bottom of the train is 0.5 m from the bridge deck, the bridge extends 50 m longitudinally, and the train center is located at the longitudinal center of the bridge.
The simplified three-dimensional model of the train-bridge is calculated and analyzed by CFD (computational fluid dynamics software). Gird division was realized in ICEM and solved by Fluent. Hu et al. (2013; 2016) and Yang et al. (2009) have demonstrated that the shear stress transport (SST) k-ω turbulence model is appropriate for simulating the flow around bluff bodies due to its relatively high efficiency and accuracy. Therefore, the SST k-ω turbulence model was used here for simulating the aerodynamic coefficients of the train and bridge models. The characteristic length is taken as the height H of the girder section. The setting of the calculation domain not only satisfies the blocking rate of less than 5% but also sets up enough length of the wake area to prevent backflow in the calculation. In order to meet the requirements of calculation accuracy, the whole flow field adopts hexahedral grids, the grid near the wall area is densified, the height of the first-layer gird is 0.001 m, and the Y+ value of the vehicle is about 5, which meets the calculation requirements.
The grid can be considered satisfactory if it is refined until the detected values no longer change greatly under the premise of guaranteed grid quality and satisfied parameters (such as Y+ value). The grid independence was verified by three comparative studies with the total number of cells being 3,076, 000, 3,998,000, and 4,760,000, respectively. As a result, the mesh scheme with 3,998,000, cells was adopted to balance the calculation accuracy and high efficiency. The train-bridge grid is shown in Figure 6.

The diagram of grid division: (a) train segment grid and (b) train–bridge surface grid.
As for the boundary conditions, the velocity-inlet was used at the inlet of the flow field. The pressure-outlet was applied at the outlet of the flow field. The free slip boundary was adopted for the front and rear wall surfaces, and the symmetry boundary was adopted for the upper and lower wall surfaces. The flow field of the train–bridge system at a total of seven wind yaw angles, including 0°, 15°, 30°, 45°, 60°, 75°, and 90°, were simulated in this article. According to the minimum grid size and wind speed, 0.001 s was selected as the time step.
In order to consider the influence of relative wind speed generated by the vehicle movement on the aerodynamic characteristics of the vehicle bridge system, the wind loads are calculated using the synthetic wind speed in this article, as shown in Figure 7. The resultant wind speed u is the vector combination of the crosswind speed w and the reverse train speed −v, where a is the wind yaw angle, β is the wind yaw angle, and the wind at a = 90° is defined as the crosswind.
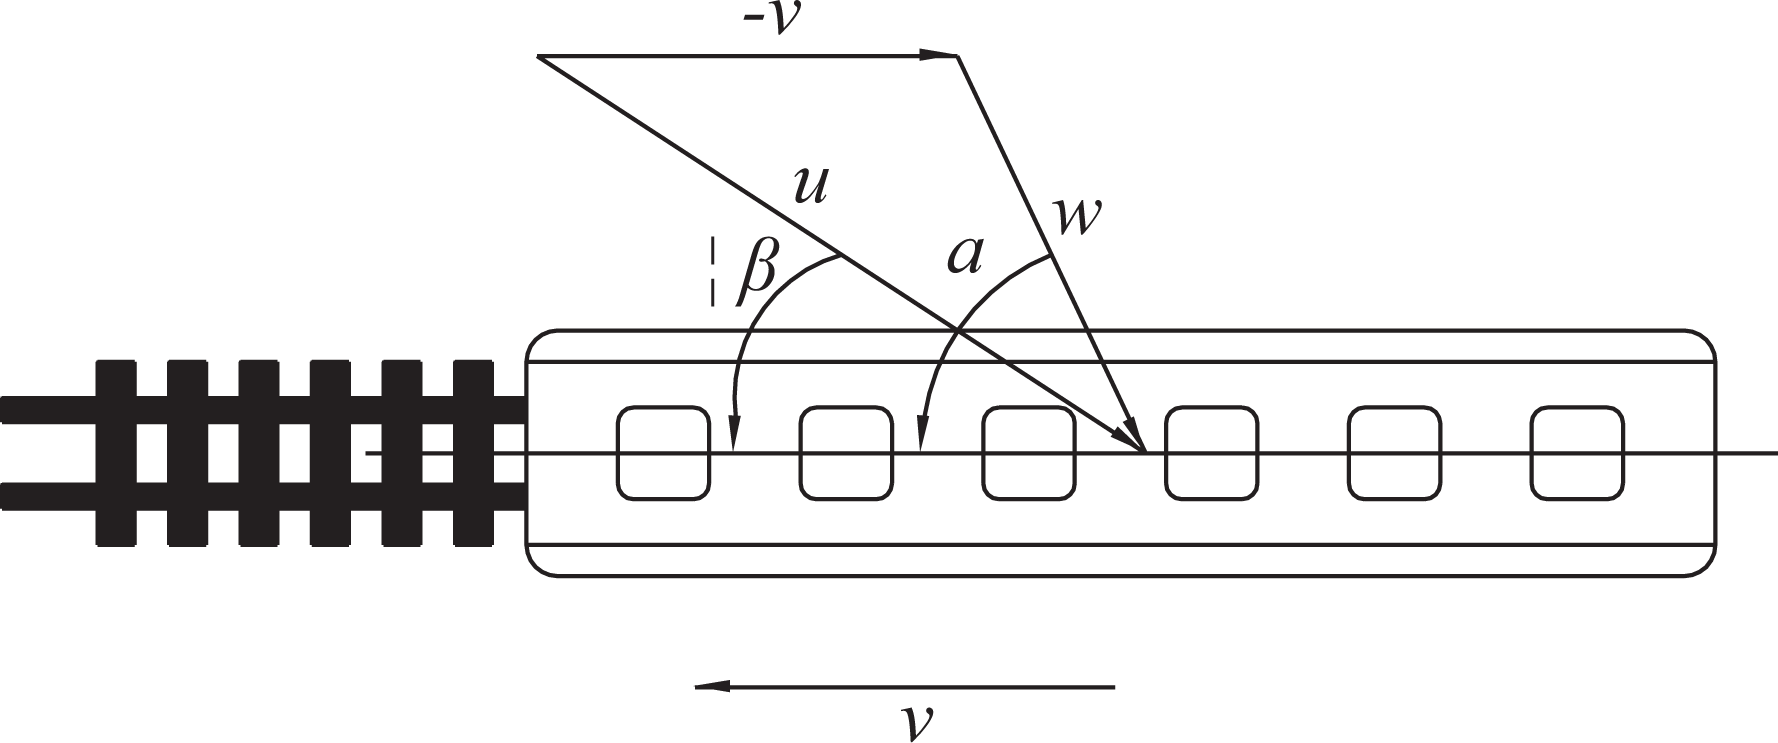
Velocity vector composite (Li et al., 2014).
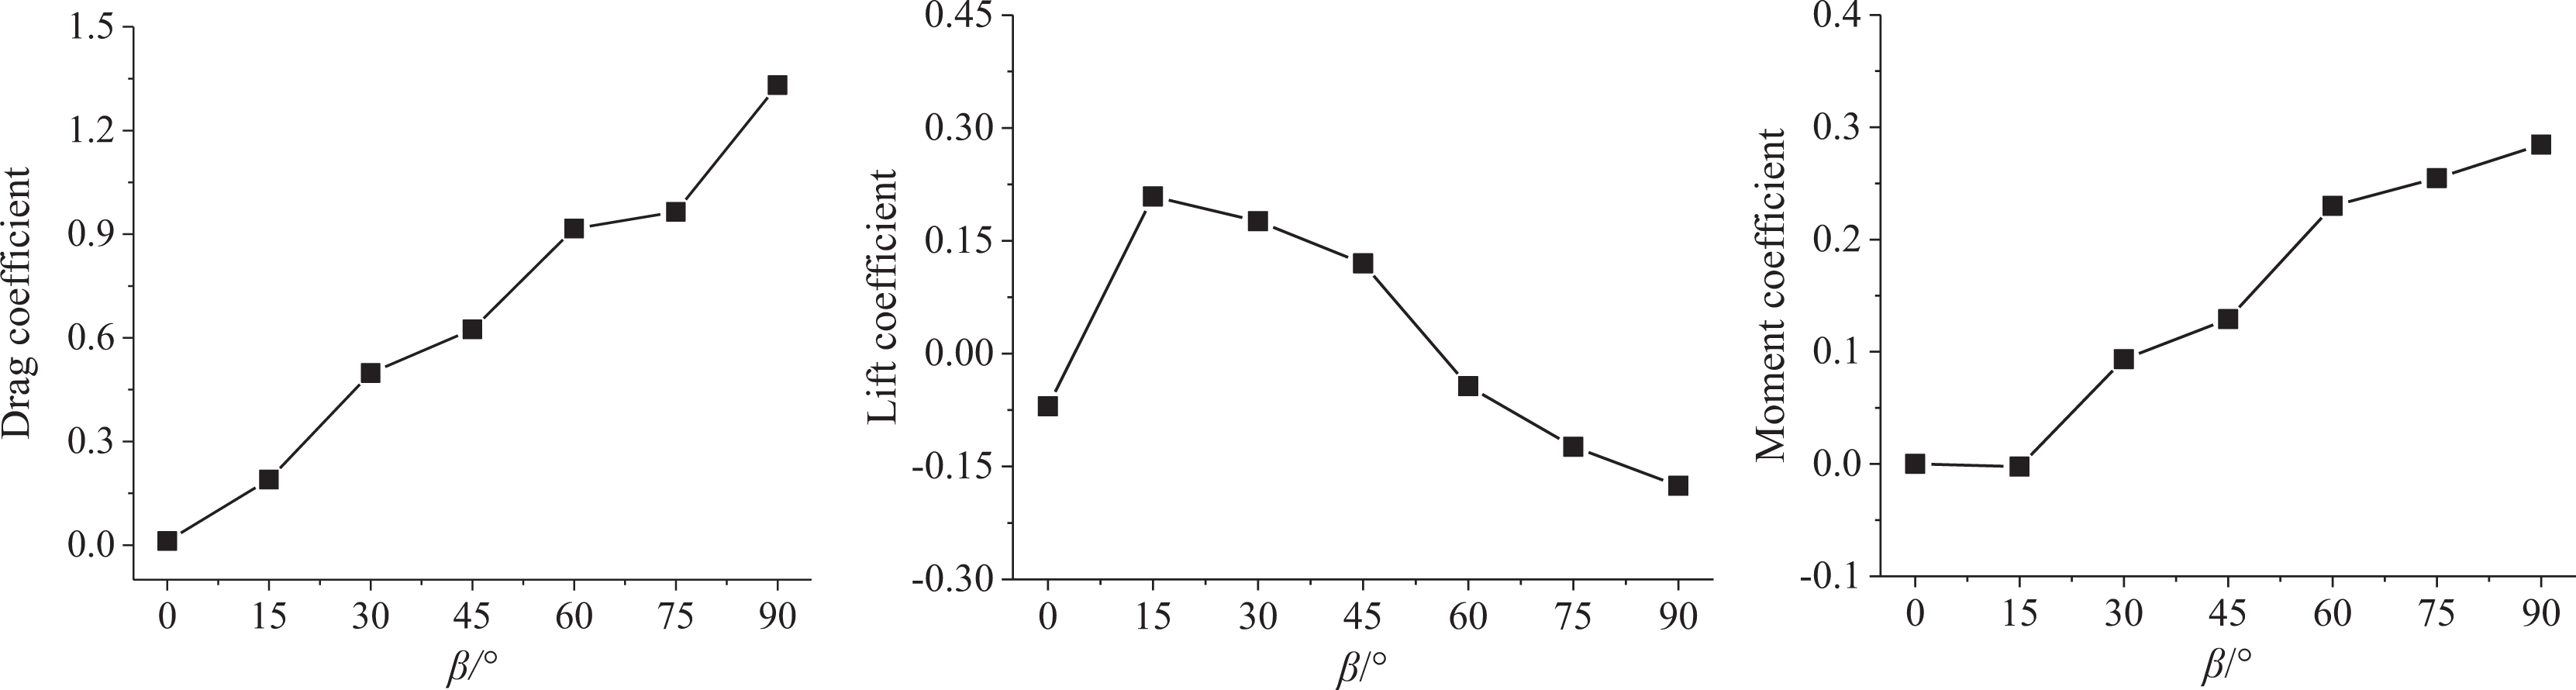
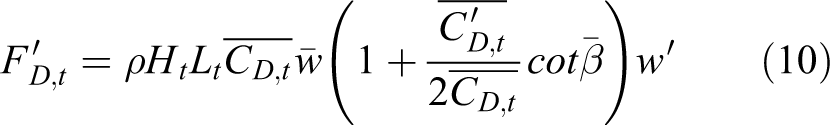
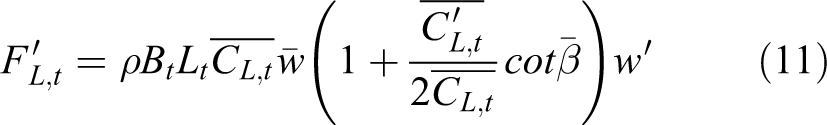
Aerodynamic force and moment coefficients are important factors that affect the aerodynamic performance of trains, and the three-component force coefficients of the train in crosswind environment are given below (Yu et al., 2014): Drag force coefficient Lift force coefficient Moment coefficient
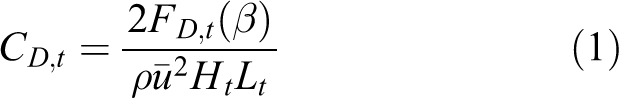
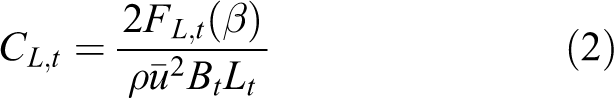
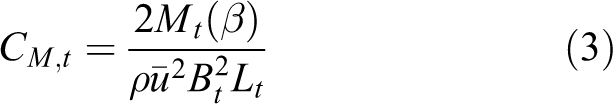
where subscript t represents train, ρ is the air density and
Figure 8 shows the variation of the vehicle’s component forces and moment coefficients with different wind yaw angles. It can be seen that the drag coefficient and moment coefficient of the train increase with the increase in the wind yaw angle, and reach the maximum at 90°, which is not conducive to the train running on the bridge. The lift coefficient of the train increases first and then decreases with the increase in the wind yaw angle, and reaches the maximum value when the wind yaw angle is 15°.
Variation of force coefficients of train on bridge with wind yaw angle.
In crosswind environments, the aerodynamic force coefficients and moment coefficient of the train only depend on the wind yaw angle. Using the sine function fitting method, the relationship between the aerodynamic coefficients and wind yaw angle of trains can be obtained as follows

The correlation coefficient of the above three fitting formulas is 0.9841, 0.9802, and 0.9818, respectively, and the variance is 0.02035, 0.00278, and 0.001531, respectively, meaning the fitting results have high accuracy.
Based on the quasi steady theory, the steady wind loads on the bridge can be expressed as follows: Drag force Lift force Moment
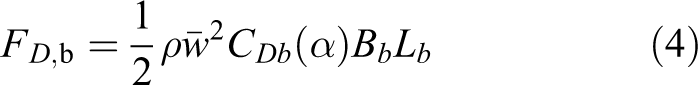

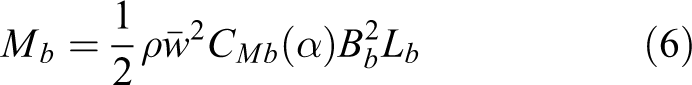
where the subscript b represents bridge;
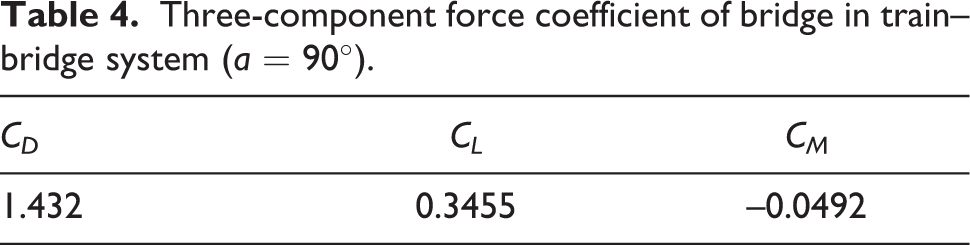
Three-component force coefficient of bridge in train–bridge system (a = 90°).
Unsteady aerodynamic loads of train
In this study, the longitudinal component of the turbulent wind speed on the running train under crosswind is mainly considered. The turbulent wind speed time-history acting on running trains can be defined based on the turbulent wind speed spectrum model of the moving point proposed by Hu et al. (2019). It was obtained under an average wind speed of 20 m/s and the time interval of 0.144 s. The upper limit of frequency is 4 Hz and the train speed is 200 km/h, as shown in Figure 9. Among them, the wind field was classified as type B according to the related wind-design code of China (JTG/T 3360-01:2018, 2018).
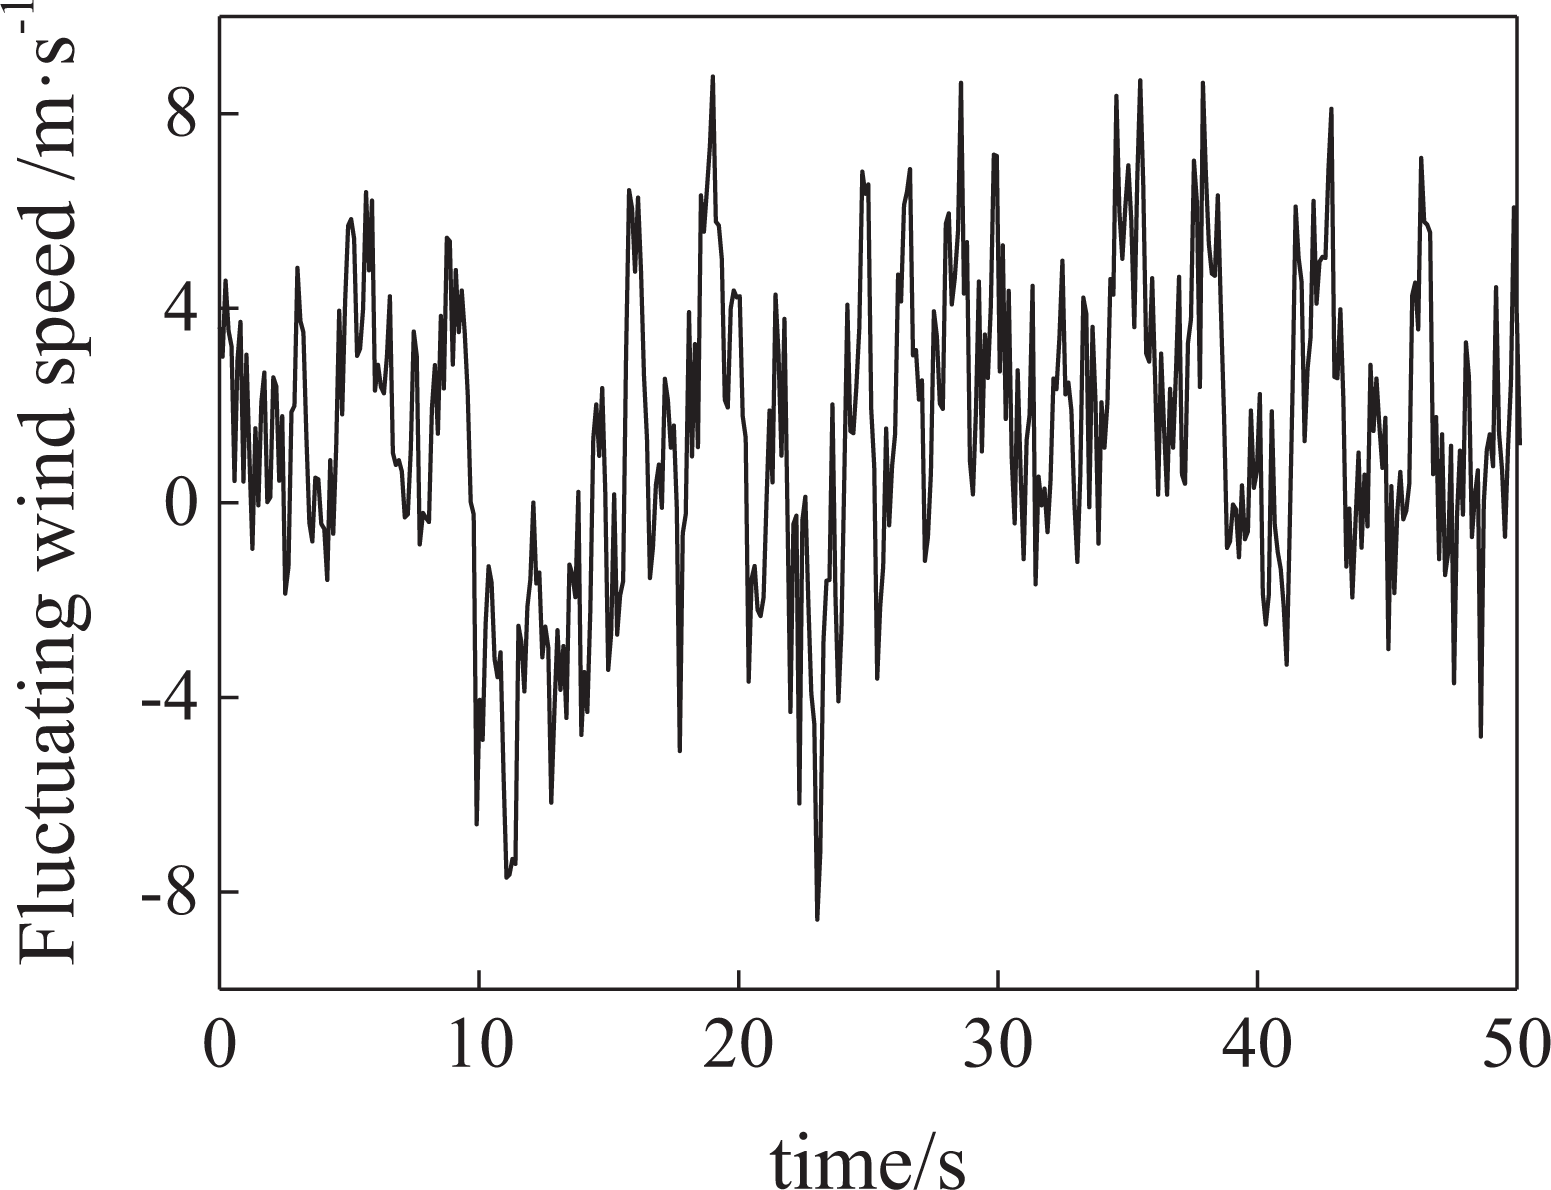
Time-history of fluctuating wind speed relative to the train.
As described in the quasi-steady assumption by Yu et al. (2015), the unsteady aerodynamic forces, usually composed of an average value

where u′ is the turbulent wind speed, β is the yaw angle, and A is the reference area.
According to the definition of aerodynamic coefficients, the average value of the unsteady aerodynamic force`F and the turbulence value of the unsteady aerodynamic force F′ can be expressed as


where
Based on the geometric relationship, the high order quantity of the turbulent term is negligible, and the turbulent quantity β′ could be approximated. Therefore, the turbulent values of the unsteady aerodynamic forces
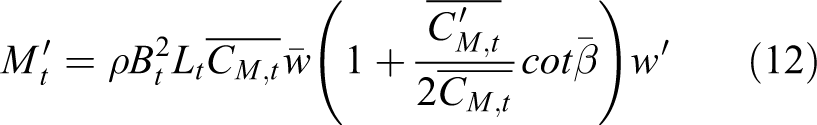
where
Analysis of driving safety and comfort of train running on the bridge
Effects of steady aerodynamic loads on the bridge
According to the train–track–bridge coupling vibration system discussed above, the dynamic responses of trains under two different cases were analyzed. One case is the steady aerodynamic loads acting on the train alone and the other one is the steady aerodynamic loads acting on bridge and train simultaneously, in which the train speeds are both set as 200 km/h and the average wind speeds are both set as 20 m/s. The dynamic responses of train running on the bridge are listed in Table 5.
Dynamic responses of train running on the bridge.

The results in Table 5 indicate that the aerodynamic loads on this particular short-span bridge has insignificant influence on the dynamic response of the train. Therefore, only the aerodynamic loads acting on the train is discussed in the following.
Effects of unsteady aerodynamic loads on driving safety and comfort of train on the bridge
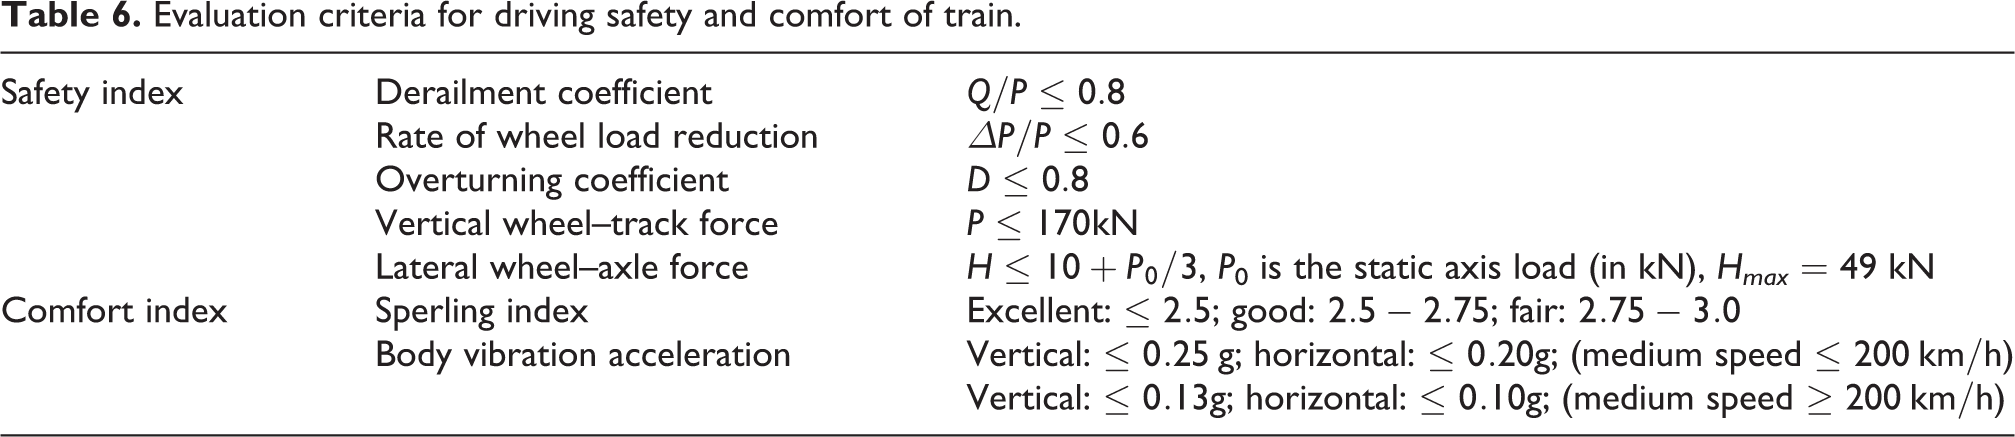
The driving safety and comfort of the train on the bridge under steady and unsteady aerodynamic loads were calculated and analyzed here. The driving safety of trains is usually measured by the derailment coefficient (Q/P), wheel load reduction rate (▵P/P), vertical wheel–track force (P), and lateral wheel–axle force (H). In the worst-case combination of wind loads and various forces, the train may overturn so that the overturning stability needs to be considered. The overturning coefficient (D) can be used to identify whether the train can overturn under the worst-case combination of lateral wind force, centrifugal force, lateral vibration inertia force, and other factors. In addition, the comfort is another index for trains, which is defined by the stability index (Sperling index) and the maximum vibration acceleration of the train body. The limit of each index is given in relevant specifications of China (GB/T 5599:1985, 1985) and the literature by Deng et al. (2019) and Li et al. (2018a), as listed in Table 6.
Evaluation criteria for driving safety and comfort of train.
Train’s responses play a critical role in the driving safety control of train. For a train speed of 200–300 km/h and the average crosswind speed of 20 m/s, the safety analysis results of the train on the bridge under steady and unsteady aerodynamic loads are shown in Figure 10. It can be seen that all the safety index values of the train are significantly affected by the train speed, which increases as the train speed increases. Moreover, each safety index value meets the requirements without considering the wind loads, which is lower than that under wind loads. However, under unsteady aerodynamic loads, when the train speed exceeds 275 km/h, the lateral wheel–axle force (Figure 10(e)) exceeds the limit. In comparison, under steady aerodynamic loads, the corresponding train speed is about 280 km/h. Each safety index value under the unsteady aerodynamic loads is always greater than that under the steady aerodynamic loads. Therefore, the risk in derailing and overturning is relatively higher under the unsteady aerodynamic loads than under steady loads. The variation trend of each safety index value is basically the same under the steady and unsteady aerodynamic loads. The derailment coefficient (Figure 10(a)), rate of wheel load reduction (Figure 10(b)), overturning coefficient (Figure 10(c)), and vertical wheel–track force (Figure 10(d)) all smaller than the safety limits within the train running speed range. The lateral wheel–axle force (Figure 10(e)) of train body is significantly affected by wind speed. When the train speed exceeds 250 km/h, the adverse effect of train speed on the lateral wheel–axle force (Figure 10(e)) is intensified. In general, taking the effects of unsteady aerodynamic loads into consideration is more conservative for the safety assessment results.
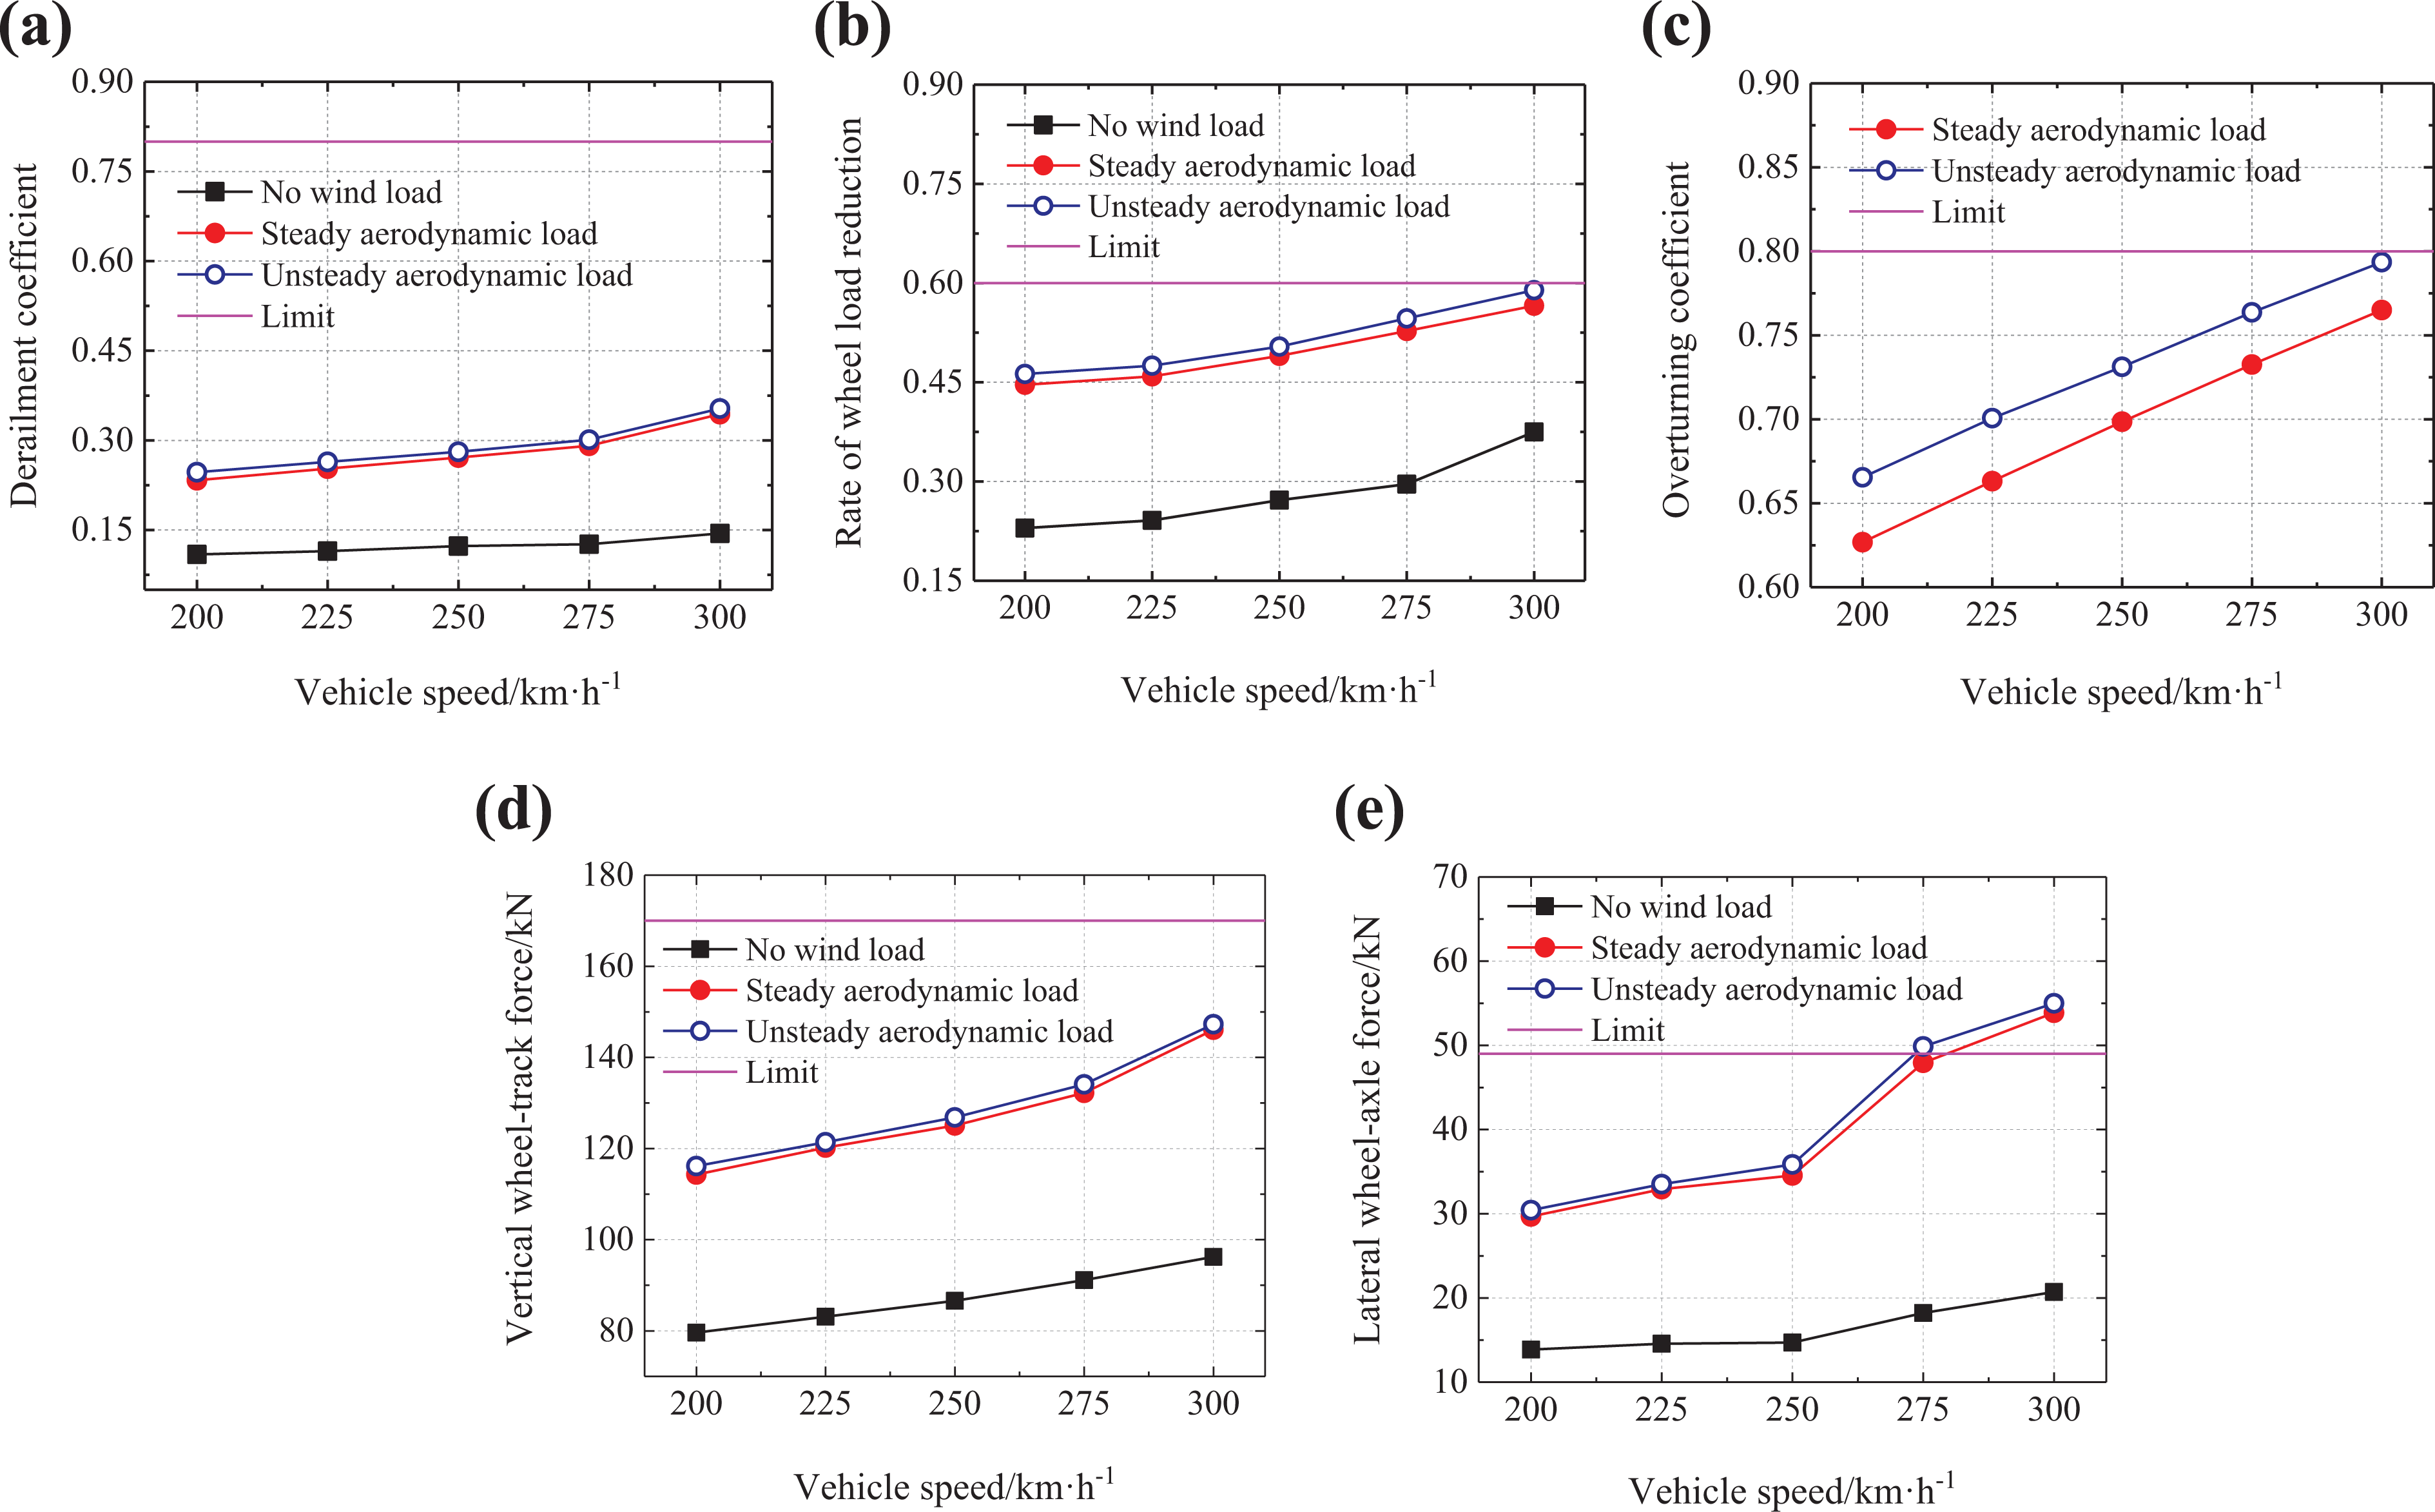
Relationship between the maximum value of train safety index and the speed of train running on the bridge with an average wind speed of 20 m/s: (a) derailment coefficient, (b) rate of wheel load reduction, (c) overturning coefficient, (d) vertical wheel–track force, and (e) lateral wheel–axle force.
The driving comfort of trains was determined by the vibration acceleration and comfort index of train body in this study, and the results of the train on the bridge at different train speeds under both steady and unsteady aerodynamic loads are shown in Figure 11. It is revealed that each comfort index value is below the limit without wind loads and smaller than that with wind loads. The train speed insignificantly affects the vertical body acceleration and Sperling index value. The vertical acceleration (Figure 11(a)) and the vertical Sperling index (Figure 11(b)) of the train body are less affected by the train speed and the aerodynamic load. The vertical body stability under the steady aerodynamic loads is better than that under the unsteady aerodynamic loads. The lateral body acceleration (Figure 11(c)) and Sperling index (Figure 11(d)) are significantly impacted by the aerodynamic loads. Under the unsteady aerodynamic loads, when the train speed is larger than 255 km/h, the lateral body acceleration (Figure 11(c)) does not meet the requirements. However, in comparison, under the steady aerodynamic loads, the corresponding train speed is 260 km/h (Figure 11(c)), resulting in poor driving comfort of the train on the bridge. It is indicated that the unsteady aerodynamic loads have greater influences on the lateral body movement than the steady aerodynamic loads. It can be concluded that taking the unsteady aerodynamic loads into consideration can render a conservative assessment of the driving comfort of trains.

Relationship between the maximum value of train comfort index and the speed of train running on the bridge with an average wind speed of 20 m/s: (a) vertical body acceleration, (b) vertical body Sperling index, (c) lateral body acceleration, and (d) lateral body Sperling index.
Driving safety control of train running on the bridge under unsteady aerodynamic loads
Based on the analysis above, the unsteady aerodynamic loads generally have more significant influence on the driving safety and comfort of trains on bridges in crosswind environment (a wind angle of 90°). The following part focuses on the analysis of the maximum index value of the safety and comfort of train on the bridge under the unsteady aerodynamic loads with different train speeds and crosswind speeds and the analysis results are shown in Figures 12 and 13.
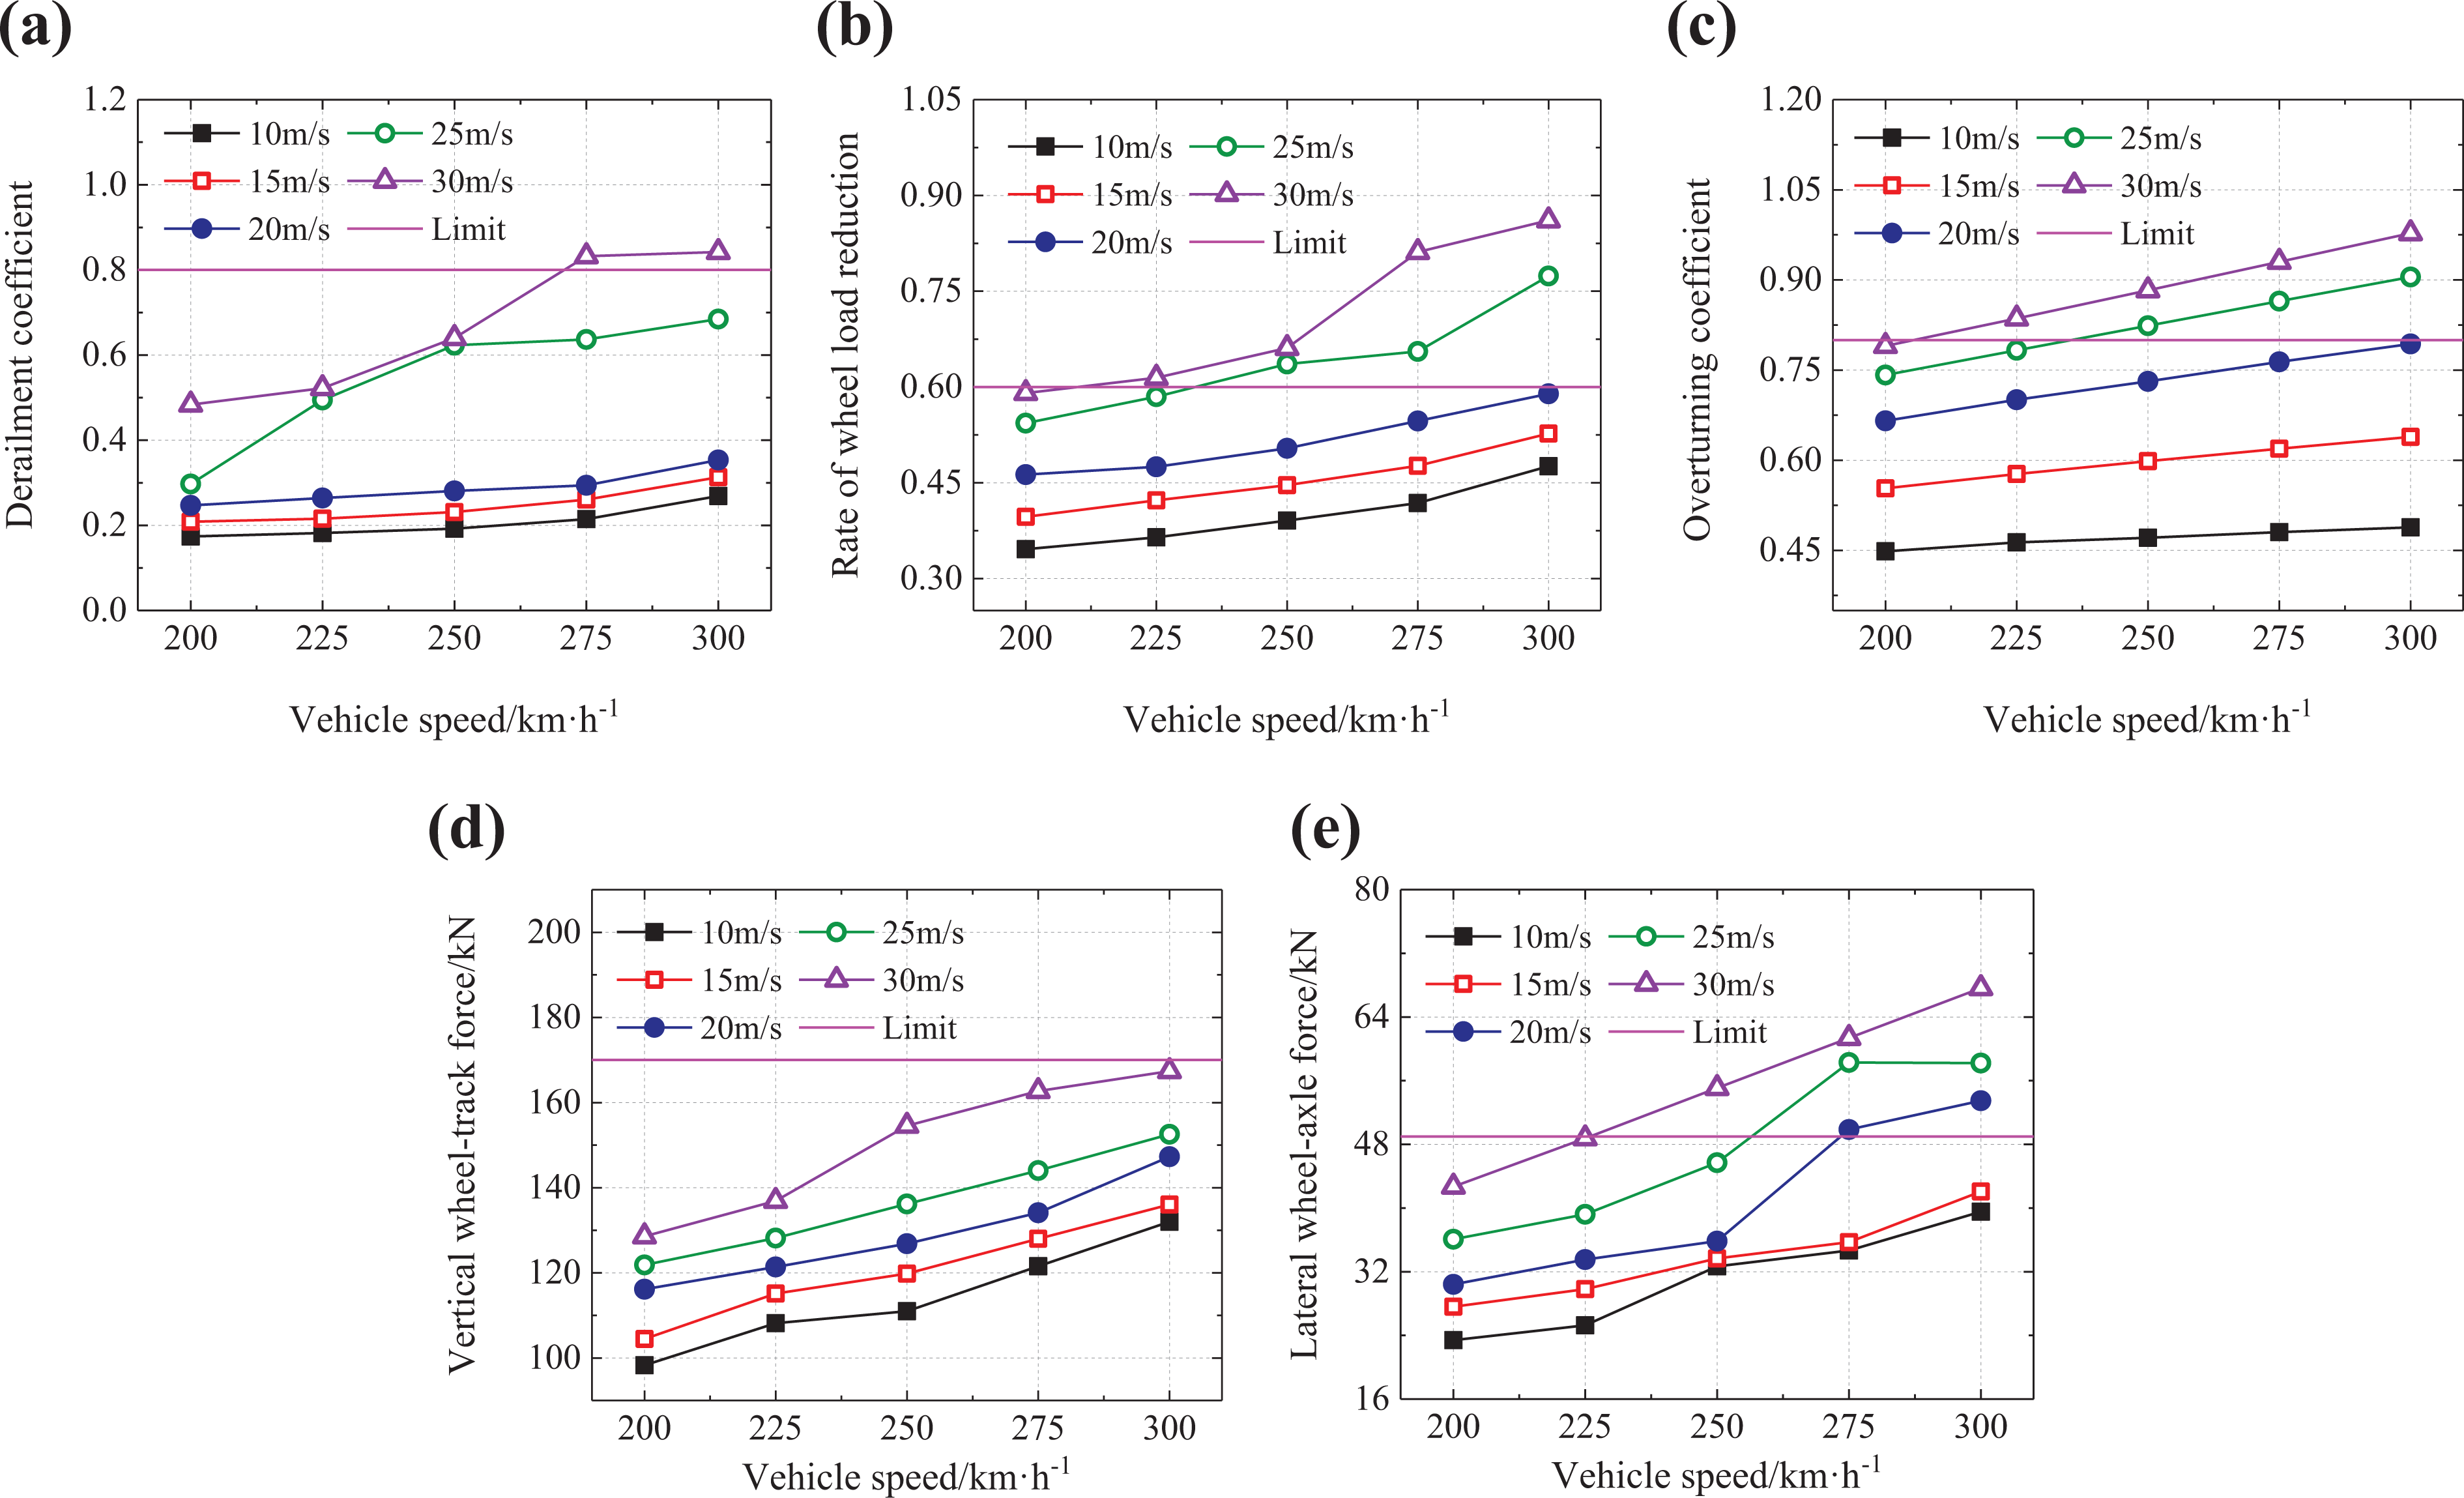
Driving safety index of train running on the bridge under the unsteady aerodynamic loads with different train speeds and crosswind speeds: (a) derailment coefficient, (b) rate of wheel load reduction, (c) overturning coefficient, (d) vertical wheel–track force, and (e) lateral wheel–axle force.
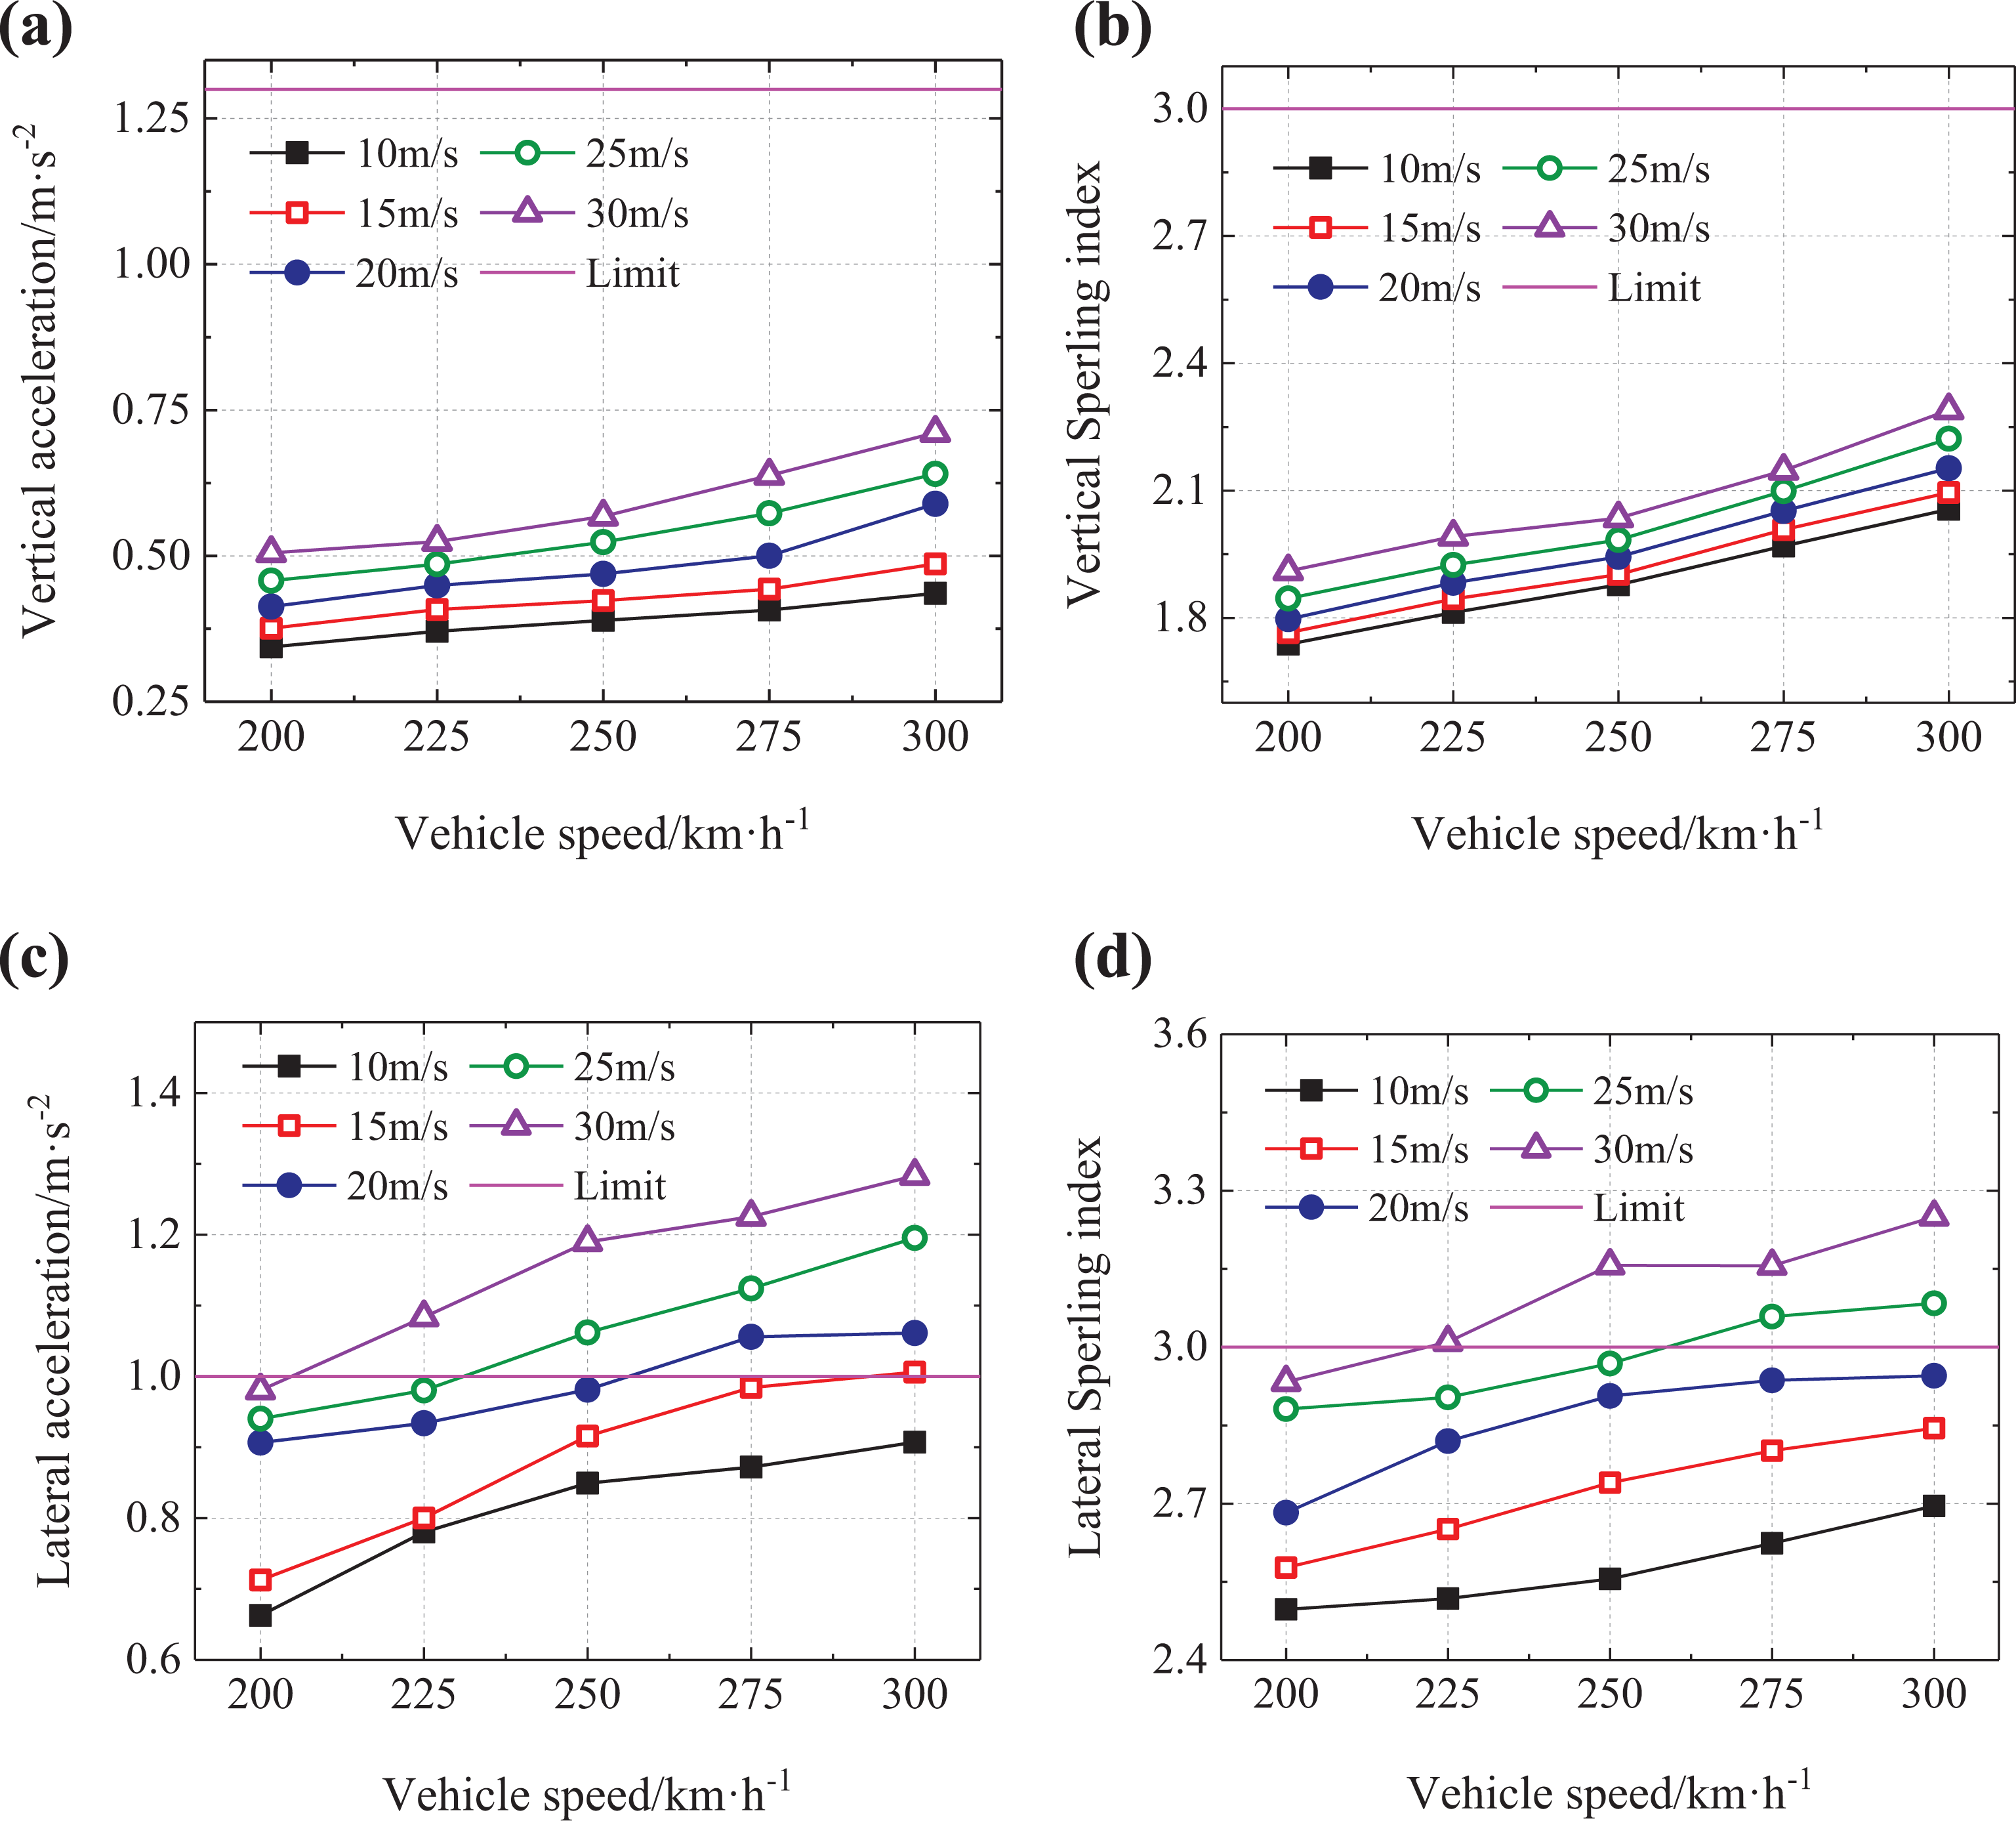
Comfort index of train running on the bridge under the unsteady aerodynamic loads with different train speeds and crosswind speeds: (a) vertical body acceleration, (b) vertical body Sperling index, (c) lateral body acceleration, and (d) lateral body Sperling index.
In Figure 12, it is shown that the speed of train and wind can greatly affect the driving safety of train on the bridge. When the driving speed is controlled at 200–300 km/h and the wind speed is not more than 15 m/s, the vehicle safety index values all meet the requirements. Under the wind speed of 20 m/s, when the train speed exceeds 275 km/h, the lateral wheel–axle force (Figure 12(e)) no longer meets the requirements, but the other safety index values are not over the limit value. When the wind speed is 25 m/s and the train speed exceeds 230 km/h, the rate of wheel load reduction (Figure 12(b)) and overturning coefficient (Figure 12(c)) exceed the safety limits, and when the train speed increases to 255 km/h, the lateral wheel–axle force (Figure 12(e)) does not meet the requirements. However, when the wind speed reaches 30 m/s, the derailment coefficient (Figure 12(a)), the rate of wheel load reduction (Figure 12(b)), the overturning coefficient (Figure 12(c)), and the lateral wheel–axle force (Figure 12(e)) of train all exceed their limits at different driving speeds, with the control train speed being only 205 km/h. The wind speed seems to have more influences on the lateral wheel–axle force (Figure 12(e)) than the vertical wheel–track force (Figure 12(d)). Compared with other safety index values, the vertical wheel–track force (Figure 12(d)) is less affected by the wind speed, and does not exceed the limit within the range of 10–30 m/s wind speed. However, when the wind speed exceeds 30 m/s, it is difficult to meet the requirements of each safety indexes, and the driving safety cannot be guaranteed, which indicates the bridge should be closed to traffic.
As for the comfort indexes shown in Figure 13(a) and (b), the vertical body vibration acceleration and Sperling index do not exceed the comfort limit and are less affected by the wind speed with a train speed of 300 km/h and a wind speed of no more than 30 m/s. The lateral vibration acceleration (Figure 13(c)) and the lateral Sperling index (Figure 13(d)) of the train body are greatly affected by the given wind speed 15–30 m/s, and the lateral acceleration (Figure 13(c)) of the train body exceeds the limit value at different speeds. Only when the wind speed is 10 m/s, the lateral acceleration (Figure 13(c)) of the train body within the given range of running speed all meets the safety limit value. When the wind speed is at 30 m/s and the train speed reaches 225 km/h, the vehicle body lateral stability index (Figure 13(d)) exceeds the comfort limit. When the wind speed is not more than 20 m/s, the train body’s lateral Sperling indexes (Figure 13(d)) meet the requirements within the driving speed range. When the wind speed is 10 m/s and the speed is not more than 250 km/h, the train body’s stability level can reach “excellent” (see criteria in Table 6). When the train speed reaches 205 km/h and the wind speed of 30 m/s, the train body lateral Sperling index (Figure 13(d)) meets the requirements, but the level of ride comfort and stability was only “qualified.”
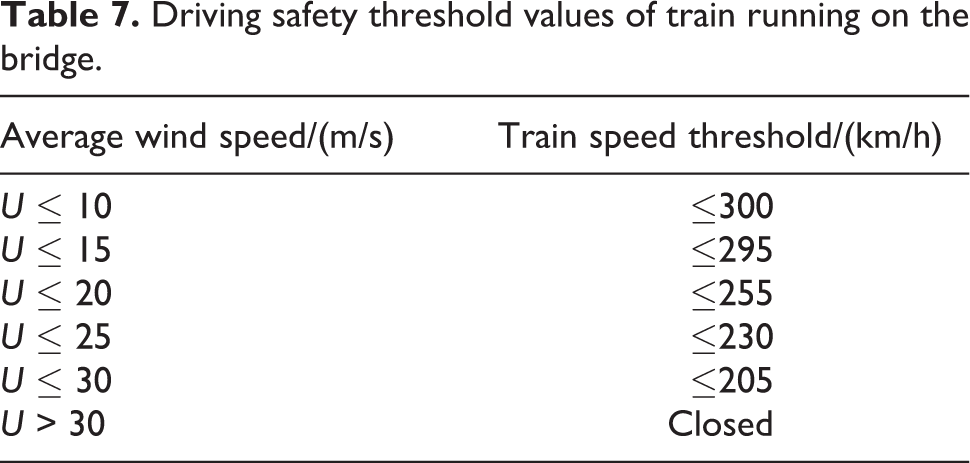
In the high crosswind environments, the driving safety and comfort of trains on bridges is ensured mainly by controlling the train speed. According to the above analysis, the train speed thresholds required for the driving safety and comfort of trains on the studied bridge under each average crosswind speed are listed in Table 7 to provide a basis for the safety operation of trains running on the bridge.
Driving safety threshold values of train running on the bridge.
Conclusion
Based on the joint simulation method with finite element software ANSYS and multi-body dynamics software SIMPACK, a three-dimensional coupling vibration analysis model of a train–track–bridge system was established. Besides, the driving safety and comfort of a train running on a bridge under steady and unsteady aerodynamic loads were analyzed, and the control speed of the train on the bridge under unsteady aerodynamic loads was defined. The main conclusions, while limited to this particularly studied case, are drawn as follows:
The index values of the driving safety and comfort meet the requirements without wind loads at a train speed of 200–300 km/h and are lower than those with wind loads being considered. When the average wind speed is 20 m/s, the safety and comfort index values under the unsteady aerodynamic load are always greater than the steady aerodynamic load values. Compared with the effect of steady aerodynamic load, under the effect of unsteady aerodynamic load, the risk coefficient of derailment and overturning of train is higher, and the ride comfort of train on bridge is worse. Taking the effect of unsteady aerodynamic loads into account can make the assessment on driving safety and comfort more conservative. Under the unsteady aerodynamic load, when the wind speed reaches 30 m/s, the derailment coefficient, wheel load reduction rate, overturning coefficient of the train, and lateral wheel–axle force exceed the limit value under different driving speeds, and the driving safety speed on the bridge is limited to 205 km/h. The lateral vibration acceleration and the lateral Sperling index of the car body are greatly affected by the wind speed. When the wind speed is in the range of 15–30 m/s, the lateral acceleration of the car body exceeds the limit value at different train speeds. When the wind speed is 10 m/s and the train speed is not more than 250 km/h, the train body stability level can reach “excellent.” When the train speed reaches 205 km/h and the wind is 30 m/s, the train body lateral Sperling index met the requirements, but the level of ride comfort and stability was only “qualified.” In order to ensure the safety and comfort of trains on the bridge, the threshold values of train speed are determined for trains on this specific bridge under each average wind speed on the basis of simulation results. Under different wind speeds, the speed limit of the train running on the bridge is different. However, when the wind speed exceeds 30 m/s, the bridge should be closed to traffic.
In this article, only a single train is considered. When multiple trains and two trains passing each other, the dynamic response of the bridge and trains under crosswind is also worth considering, and it will be studied in the future.
Footnotes
Declaration of conflicting interests
The author(s) declared no potential conflicts of interest with respect to the research, authorship, and/or publication of this article.
Funding
The author(s) disclosed receipt of the following financial support for the research, authorship, and/or publication of this article: This work was supported by the National Natural Science Foundation of China under grant nos 51822803, 51878080, and 51778073; the Hunan Provincial Natural Science Foundation of China under grant nos 2018JJ1027 and 2018JJ3538; and the Innovative Project of Superiority Characteristic Key Discipline of Civil Engineering (Changsha University of Science & Technology) under grant no. 18ZDXK10; and Postgraduate Research Innovation Project (Changsha University of Science & Technology) under grant no. CX2019SS10.