
Abstract
A modified concrete capacity design method is available to predict the ultimate tensile strength (Nu ) of screw anchors. Screw anchors commonly fail in a combination of concrete breakout and pullout modes. This combined mode is not distinguished from the breakout mode in the modified concrete capacity design method, which may cause confusions to designers. To investigate the Nu of the combined mode (Ncomb ), this study included 144 unconfined tension tests on screw anchors from three manufacturers in three diameters and two effective embedment depths (hef ) per diameter. Approximately 80% of the tested anchors failed in the combined mode. The differences in Ncomb among the three manufacturers were insignificant despite their varied thread design. Ncomb was found to be linearly correlated to the parameter hef 1.3 but was found independent of the anchor diameter. A regression model was developed to specifically predict Ncomb . The model showed a good fit with the test results.
Introduction
Screw anchors are a type of post-installed mechanical anchors used in various concrete structure applications such as bridges, power transmission tower base, and tunnels (Eligehausen et al., 2006). Screw anchors offer several advantages over other mechanical anchors (undercut and expansion anchors). The most common method to install screw anchors is by an electric screwdriver, thus reducing the installation time to only a few seconds, which is fast and convenient and reduces installation errors at the job site. Also, screw anchors can be easily removed using the electric screwdriver. Another advantage of screw anchors is the smaller required spacing between anchors and critical edge distance relative to expansion anchors. This is because screw anchors rely on the mechanical interlocking between the screw threads and the drilled hole wall instead of the high expansion forces, which can damage a large area of the concrete surrounding the installed expansion anchors. A combination of these advantages has increased the use of screw anchors in concrete construction (Chen, 2018; Eligehausen et al., 2006; Olsen et al., 2012).
As shown in Figure 1, under tensile loading, the failure modes of a screw anchor depend on the effective embedment depth (hef ) of the anchor. The concrete breakout (CB) failure mode governs for shallow hef , and a combined failure mode of pullout (PO) and CB controls for deeper hef before the steel failure strength (Nsa ) is reached. The CB failure is identified when a concrete cone is formed from the tip of the anchor and extends to the concrete surface (Eligehausen et al., 2006; Fuchs et al., 1995). In the combined mode, the anchor is initially pulled out for a certain distance, and then a secondary CB cone is formed from the embedded end, extending to the concrete surface. The breakout cone in the combined mode extends to partial embedment depth of the anchor and varies in depth (Eligehausen et al., 2006; Mohyeddin et al., 2016; Olsen et al., 2012). When the cone is shallow, the failure mode may be classified as the PO mode (Figure 1), which is described as the anchor is pulled out of the drilled hole together with or without a small portion of fractured concrete in the near surrounding area (Eligehausen et al., 2006).
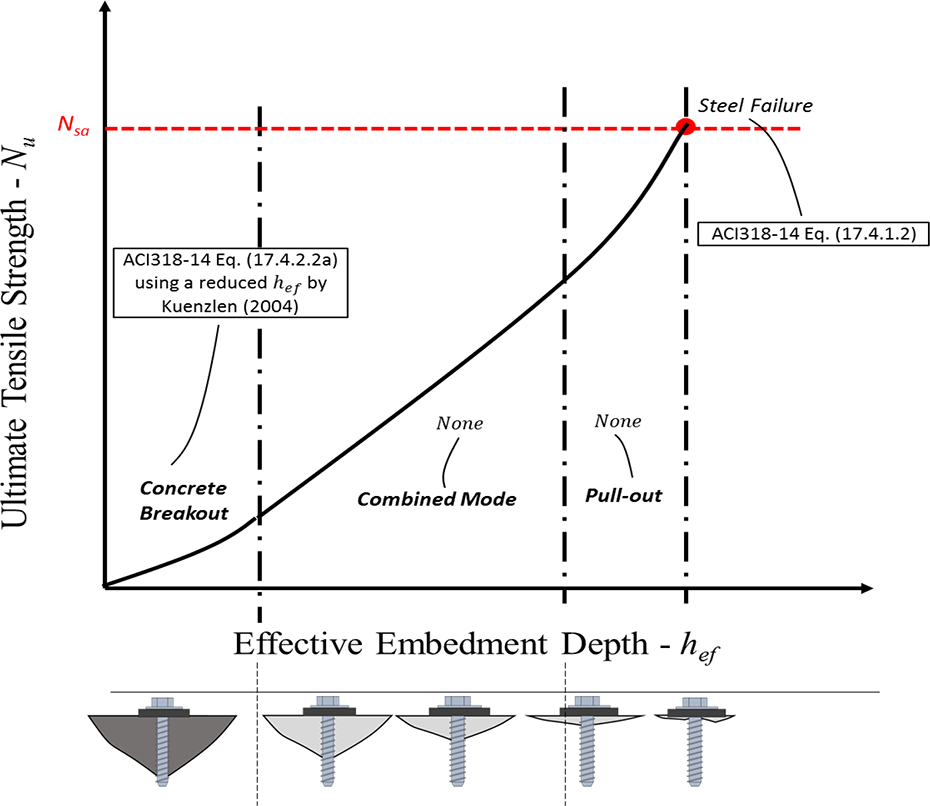
Effect of embedment depth on failure modes of screw anchors.
The ultimate tensile strength of CB mode (Nb ) for expansion and undercut anchors can be predicted by the original concrete capacity design (CCD) method developed by Fuchs et al. (1995) (equation (1)) and used in ACI 318-14 (2014)

where Nb
is the basic CB tensile strength of a single anchor (lbf), kc
is the calibration factor equals to 35 (for US customary unit) for a post-installed anchor in uncracked concrete,
Based on the CCD method, Kuenzlen (2004) developed a modified CCD method for screw anchors (Olsen et al., 2012). The modified CCD method was developed based on an available European (metric) database of 500 tension test results on screw anchors with a diameter (d) ranging from 0.31 to 0.71 in (8–18 mm) and hef
ranging from 1.2 to 4.3 in (30–110 mm). The ultimate tensile strength (Nu
) of screw anchors in both the CB and combined modes were compared with Nb
predicted by equation (1), using hef
based on the geometric parameters in Figure 2 by equation (2), which assumes no load transfer near the embedded end (0.5ht
+ hs
) of the screw anchor. The measured Nu
showed about 20% lower than the predicted Nb
by equations (1) and (2). Therefore, a reducing factor of 0.85 was added to equation (2) to obtain a reduced hef
(

Illustration of screw anchor geometric parameters (after Olsen et al., 2012).


where ht is the thread pitch (the distance between two adjacent primary threads), hs is the length of the anchor tip, and hnom is the nominal embedment depth.
Later, Olsen et al. (2012) evaluated the modified CCD method based on a database of total of 853 test results, which extended the range of d and hef to 0.25–0.75 in (6.5–19 mm) and 1–5 in (25.4–127 mm), respectively. A good fit was shown between the modified CCD method and the test results for hef > 1.57 in (40 mm); the average ratio of predicted Nb to measured Nu = 1.10 with a coefficient of variance (COV) = 15%.
Recently, Mohyeddin et al. (2019) conducted 180 tension tests on one type of screw anchors. In the study, about 60% of anchor failed in the combined mode and Mohyeddin et al. (2019) proposed a prediction model (equation (4)) specific to the combined mode with an assumption that the failure strength of the combined failure mode equals to the superposition of the strength of the cone failure in the upper cone part and the strength of the PO in the lower part of the screw anchor. The regression coefficient (k 2) in this equation was found to be 13.4 with an R 2 = 0.885 based on the test results. Note that the PO strength part of this equation was based on the test data in the PO failure mode in Mohyeddin et al.’s (2019) study
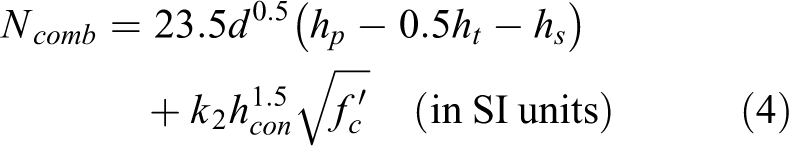
where Ncomb is the ultimate tensile strength of the screw anchor failed in the combined failure mode, hp is the length of lower part of the screw anchor without the concrete cone in the combined failure mode, hcon is the length of upper part of the screw anchor with the concrete cone in the combined failure mode, and k 2 is the regression coefficient.
A mechanistic form of how the combined failure mode is composed of the PO mode and CB mode is well presented in equation (4), and it is interesting to calculate Ncomb by equation (4) mathematically, which can be further compared to the test results. However, the direct superposition of the strengths of two failure modes in equation (4) needs to be re-considered and further analyzed and improved, and Ncomb is not as sensitive to hcon , as shown in equation (4). Also, it is impractical to obtain hp and hcon , which can only be measured after the test and vary from test to test for the same test scenario, in the design stage.
Mohyeddin et al. (2019) focused on using equation (4) to obtain the minimum strength, and, except the R 2 = 0.885 of the regression results, no discussion or other details on the comparison of Ncomb predicted by equation (4) and measured Ncomb were provided to evaluate this model.
Research significance
Tension test data on screw anchors, which is currently lacking for anchors manufactured in the United States, were generated for a variety of anchor sizes and manufacturers. The combined mode commonly showed lower strength resistance than the CB mode. The modified CCD method does not distinguish CB from combined mode, which is inconsistent with the design methods in the ACI code for mechanical anchors and may result in inaccurate strength predictions. Therefore, a prediction model specific to the combined mode is required. The investigation focused on identifying the combined mode and developing a specific prediction model for this failure mode.
Description of experiment
Tested anchors
An experimental plan for unconfined static tension tests on screw anchors in uncracked concrete is shown in Table 1. To include varieties of anchor types, screw anchors from three manufacturers in Figure 3 were included: TitenHD (THD) from Simpson Strong-Tie (SST), KWIK HUS-EZ (KH-EZ) from Hilti, Wedge-Bolt+ (WB) from DeWalt (formerly Powers Fastening). It is noticeable that ht , hs , and length of the threads vary among the three manufacturers (Hilti, 2017; Powers, 2017; Simpson Strong-Tie, 2016). Note that the grade and type of anchor steel can affect the ultimate strength and behavior of screw anchors. As shown in Figure 1, at large hef , if Nsa of steel is reached, steel failure mode controls. Nsa is equal to the multiplication of the ultimate tensile strength of the steel (futa ) and the cross-area of the anchor, thus setting the upper limit of ultimate strength for an anchor in tension. The effect of steel grade is more prominent when the anchor is installed at relatively large hef because either the steel failure mode controls or Ncomb is close to Nsa such that the steel is under plastic deformation, which affects the load–displacement behavior of the anchor. Also, when installed at large hef , if the anchor is made of ductile steel, the load–displacement behavior of this anchor will be ductile rather than brittle. In this study, the anchors from three manufacturers are all made of carbon steel, and futa of them are all close to 110,000 lbf/in2 (758 MPa). Thus, the effect of steel type is excluded and the effect of steel grade on the ultimate tensile strength of screw anchors in the combined failure mode was minor.
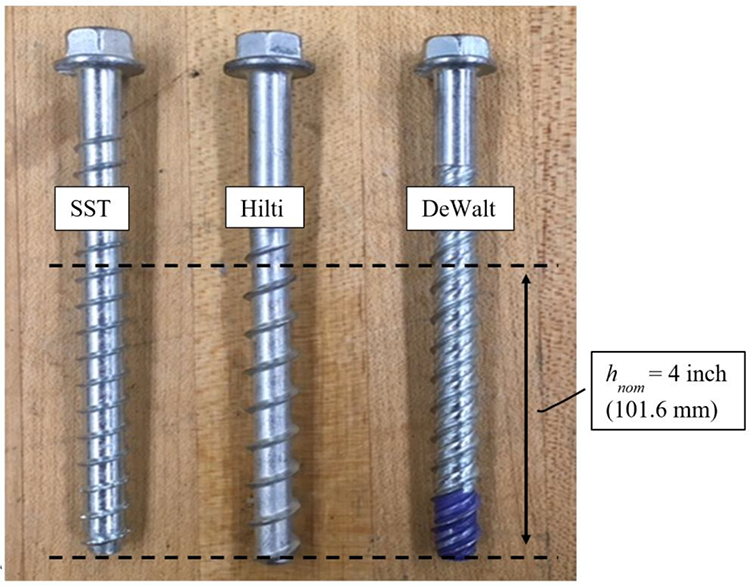
Screw anchors (d = 1/2 in (12.7 mm)) from three manufacturers.
Testing plan for screw anchors (1 in = 25.4 mm).

SST: Simpson Strong-Tie.
Two geometric parameters were investigated: (1) three d: 1/2, 3/8, and 1/4 in (12.7, 9.525, and 6.35 mm) and (2) two hnom (a deep and a shallow one) per diameter. Note that hnom = 2 in (50.8 mm) was tested instead of hnom = 2 ½ in (63.5 mm) for DeWalt anchors of d = 1/4 in (6.35 mm) due to the limited sizes (lengths) manufactured. The hnom was selected based on the specified values in the product catalogs (Hilti, 2017; Powers, 2017; Simpson Strong-Tie, 2016), and each of them was smaller than the length of the thread portion of the anchor (Figure 3) for each d-hnom testing scenario per manufacturer. Each testing scenario was repeated eight times per manufacturer, resulting in a total of 144 tests (Table 1).
Properties of tested concrete slabs
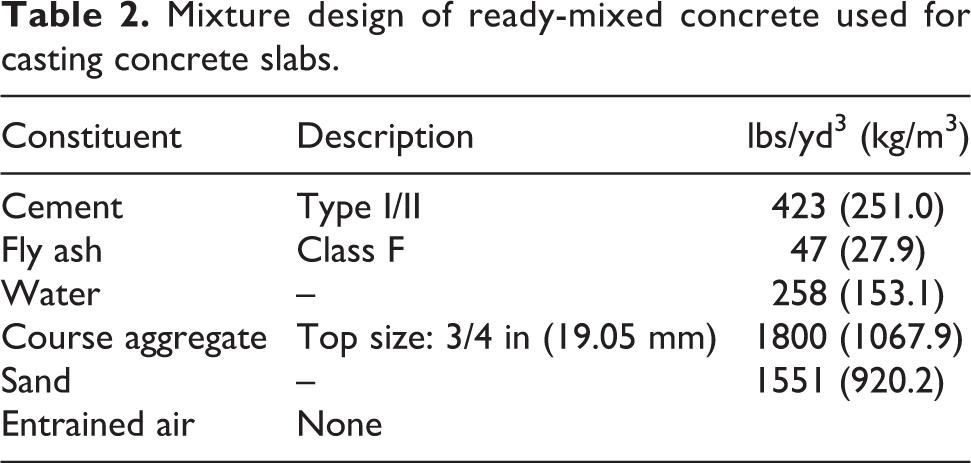
To execute the planned anchor testing, five 4 ft × 4 ft × 1 ft (1.2 in × 1.2 in × 0.3 m) concrete slabs were cast on 23 May 2017 from one batch of concrete. In the meantime, nine 4 in× 8 in (100 mm × 200 mm), diameter × length, cylinders were cast to obtain compressive strength (
Mixture design of ready-mixed concrete used for casting concrete slabs.
Description of anchor tests
The testing on the SST and Hilti initiated on 6 Feb 2018 and was completed in about 1 month. During this period, concrete was more than 250 days old and average
The anchors were installed in predrilled holes in the concrete slabs. The holes were drilled at the spacing and edge distances, which are larger than the required critical spacing and critical edge distance specified in the manufacturer catalogs and ACI 318-14 to avoid group, spacing, and edge effects on Nu of a single anchor. Since SST and DeWalt only specify the critical edge distances, the critical spacing defined in ACI 318-14 (3 × hef ) was applied (ACI 318-14, 2014; Hilti, 2017; Powers, 2017; Simpson Strong-Tie, 2016). An example of the installation layout of the SST and Hilti screw anchors with d = 1/4 in (6.35 mm) and hnom = 4 in (101.6 mm) is shown in Figure 4.
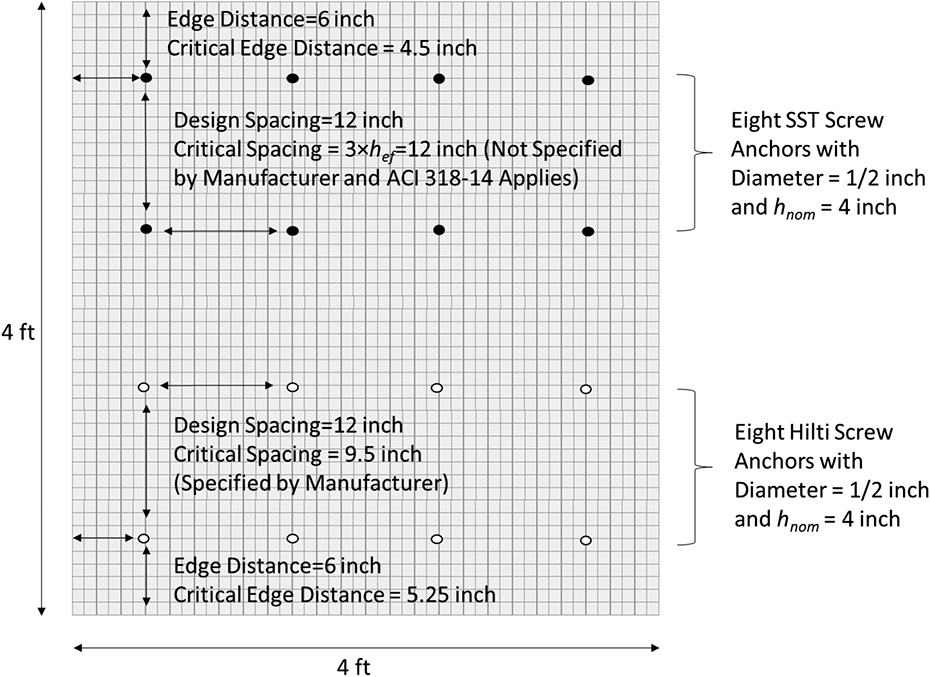
Anchor installation layout for SST and screw anchors with diameter = 1/2 in and hnom = 4 in on the 4 ft × 4 ft × 1 ft concrete slab (1 in = 25.3 mm, 1 ft = 304.8 mm).
The commonly used DeWalt Rock Carbide drill bits were used to drill the holes for SST and Hilti anchors as no special requirements are specified by the manufacturers (Hilti, 2017; Simpson Strong-Tie, 2016). DeWalt Wedge bits were used to drill the holes for the DeWalt screw anchors as specified by the manufacturer (Powers, 2017). Following the manufacturer installation instructions, the dust in the holes was cleaned by compressed air followed by a secondary cleaning using a tube brush (ASTM E488/E488M-15, 2015; Hilti, 2017; Powers, 2017; Simpson Strong-Tie, 2016). Then the screw anchors were installed using an impact wrench.
The setup of the unconfined anchor tension testing (Figure 5) was assembled according to ASTM E488/E488M-15 (2015). An Enerpac Per1321 hydraulic pump and an OTC hollow center hydraulic ram were used to apply the tension load on the anchor, which was measured by an Interface 1220AF-50k through-type load cell. A linear variable differential transformer (LVDT) with an accuracy of 0.001 in (0.0254 mm) was used to record the displacements of the anchors. The base fixture for the LVDT was placed on the concrete slab surface such that the displacement of the anchor relative to the slab surface was recorded. The measuring arm of LVDT was directly rested on the top of the tested anchor without inference from the loading fixture (Figure 5). The loading was applied by controlling the valve of the hydraulic pump manually, and the loading rate was controlled such that the peak load occurred after 1–3 min (typically around 80 s) from the start of each testing according to ASTM E488/E488M-15 (2015).
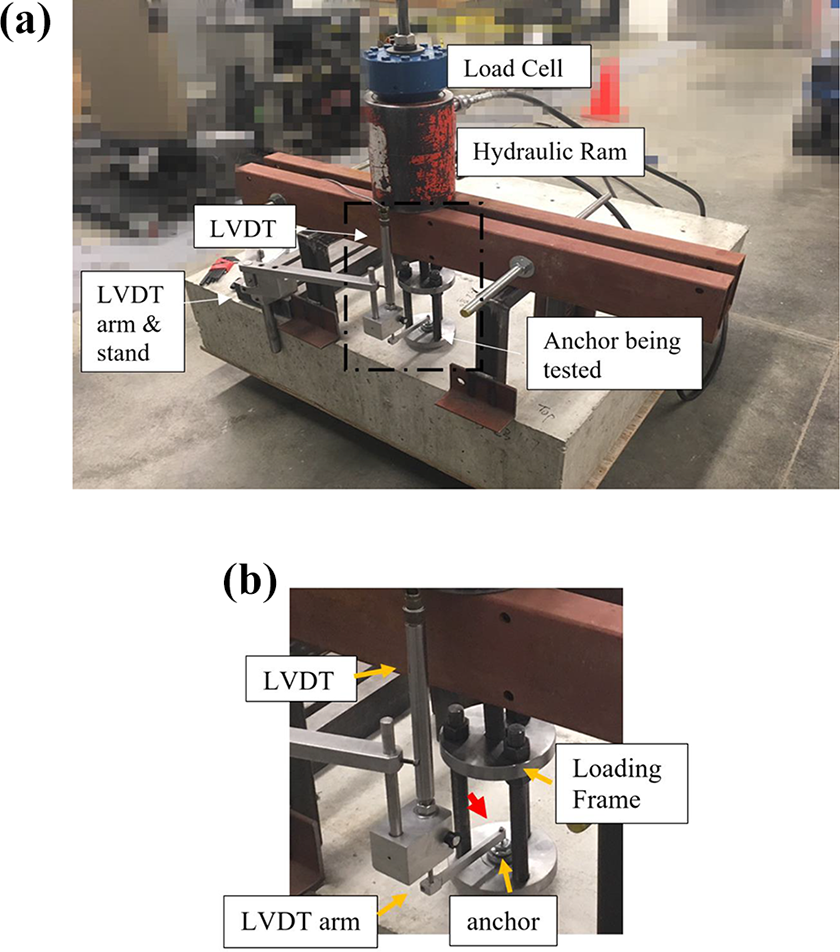
(a) Unconfined anchor tension test setup and (b) LVDT arm is directly placed on top of the tested anchor.
Test results
Failure modes
The individual results of all the tests are tabulated in Table A1 in Supplemental Appendix 1. The statistics of the test results are shown in Table A2 in Supplemental Appendix 1. The combined mode dominated about 80% of the tests for both shallow and deep embedment depths per diameter. The size of cones varied among the repeats per d-hnom scenario; the depth of the cone ranged from about 20%–67% of the embedment depth (Figure 6(a)). Only 11 tests were clearly classified as the PO mode (Figure 6(b)). However, those in PO did not show lower strength than the combined mode. The anchors failed with concrete cones that covered the more 70% of hnom were treated as the CB mode (Figure 6(c)). Seven tests were CB, which also showed no difference in strength compared to the combined mode. The majority of the anchors that failed in single CB or PO modes (18 tests) occurred only once or twice out of the eight repeats for a single test scenario (Table A1), which are insufficient to be compared statistically with the rest seven or six repeats from the same scenario. Thus, the tests in CB and PO modes were excluded from further analysis. Also, all (8) 1/4–2 ½ in (6.5–63.5 mm) SST anchors and near half (5) of the Hilti anchors failed in the steel mode (Figure 6(d)). Since the steel failure is well predicted by equation (17.4.1.2) in ACI 318-14 (2014), 13 tests in this failure were excluded from further analysis in this study. Hence, the following sections focus on the combined mode using 113 test results.
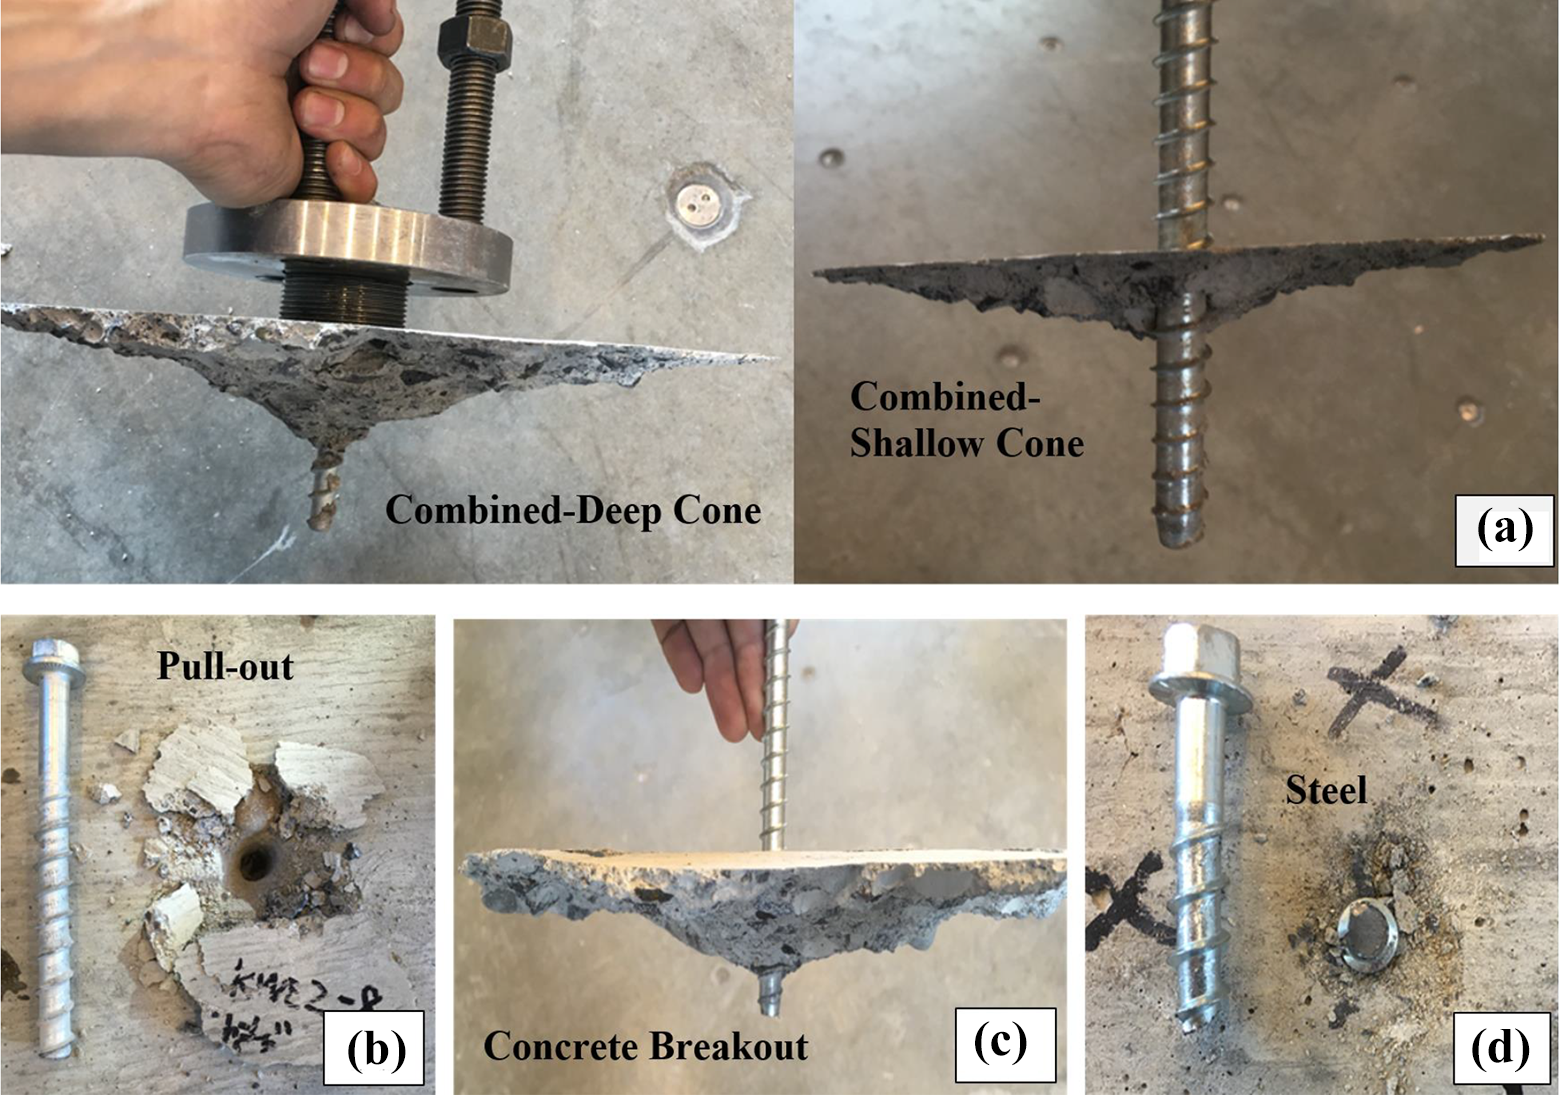
Dominant failure modes: (a) combined, (b) pullout, (c) breakout, and (d) steel.
Manufacturer comparison
The values of average Ncomb are included in Table A2 in the Supplemental Appendix 1. The comparisons of Ncomb among the three manufacturers for each d-hnom scenario are shown in Figure 7. Note that 1/4–2 ½ in (6.5–63.5 mm) d-hnom scenario is not included as only two tests resulted in the combined mode in this scenario. The differences in Ncomb are not significant (<15%) for most d-hnom scenarios. However, for 1/2–4 in (12.7–101.6 mm) scenario, significant differences exist between Hilti and DeWalt (21%). Also, for 1/4–1 ½ in (6.35–38.1 mm) scenario, SST showed higher strength than Hilti and DeWalt (23% and 28%, respectively).
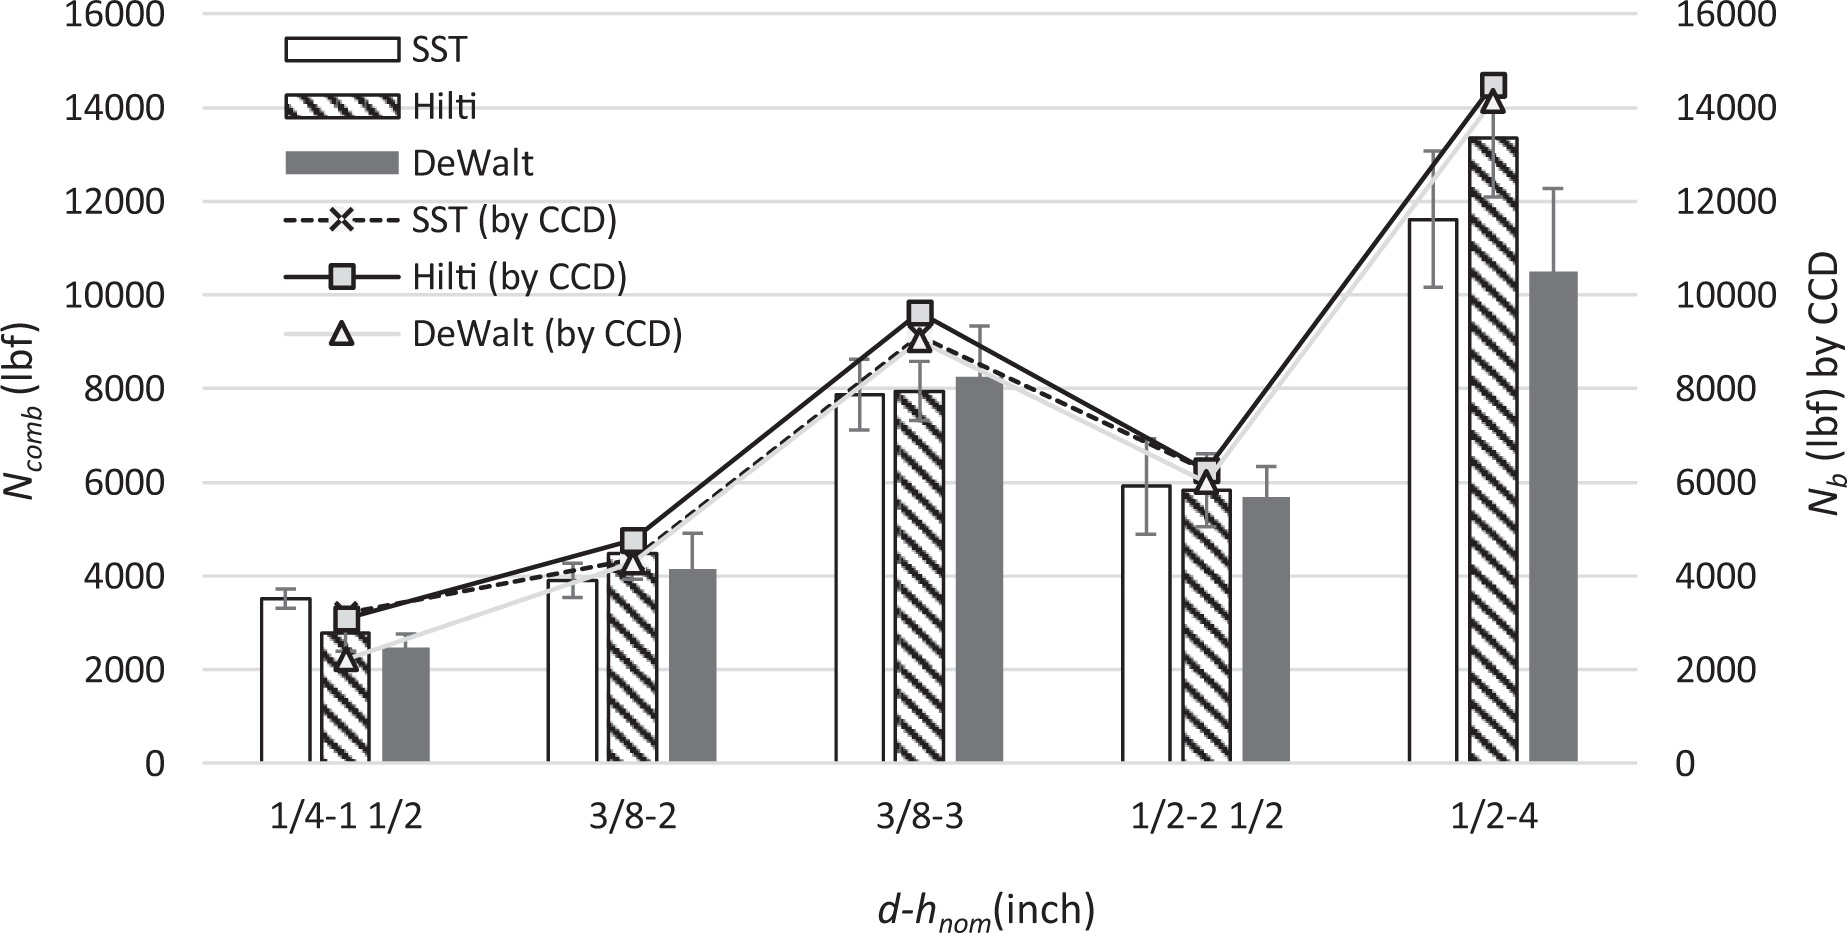
Comparison of Ncomb among three investigated manufacturers (note: 1 in = 25.4 mm; 1 lbf = 4.45 N).
These differences are mainly due to the differences in anchor geometry designs (mainly ht and hs ), which determine the slight differences of hef at the same hnom among the manufacturers as shown in Table 1 according to equation (2). As shown in Table A2, at similar/same hef , the values of Ncomb were close to each other among the three manufacturers. For example, at hef = 1.7 in (43.18 mm), the average Ncomb of Hilti (5825 lbf (25.9 kN)) was close to that of SST (5916 lbf (26.3)); also, the average Ncomb of DeWalt at hef = 1.32 in (33.6 mm) (4137 lbf (18.4 kN)) was close to that of SST at hef = 1.34 in (4469 lbf (19.9 kN)). The values Nb predicted by the original CCD method are also shown in Figure 7.
However, differences in Ncomb still existed between different manufacturers for certain case; at hef = 3.72 in (94.5 mm), Hilti (13,356 lbf (59.4 kN)) showed higher average Ncomb than DeWalt (11,617 lbf (51.7 kN)). These differences might due to other factors, including the shapes and dimensions, roughness, and spiral windings of the screw threads. Based on Figure 7 and Table A2, a strong relation between COV and d-hef cannot be established; for SST, lower d-hef showed lower COV, while lower d-hef resulted in higher COV for Hilti, and, for DeWalt, the COVs for different d-hef combinations are close to each other. For all the scenarios of the manufacturer, diameter, and hnom (Table 1), the COVs of eight test repeats are less than 20% and the majority of the COVs are less than 15% (Table A2), which are typical for anchor testing.
Generally, the differences in Ncomb
among the three investigated types of screw anchors for the investigated test scenarios are small, which is consistent with the results in Kuenzlen’s (2004) study. However, a recent study by Mohyeddin et al. (2020) shows that Nu
of screw anchors was highly related to the anchor types, especially the thread profile of the anchors, and the differences in Nu
were extremely high between certain anchor types. The reason of inconsistence between Mohyeddin et al.’s (2020) study and this study or Kuenzlen’s (2004) study might be explained as follows: (1) the types (mainly the thread profile design) of screw anchors selected were relatively similar to each other in this study and Kuenzlen’s (2004) study, which would not cause significant discrepancy in the performances of these anchors. While in Mohyeddin et al.’s (2020) study, among the six investigated screw anchor types, a certain type might have a unique design compared to the others, seeing that the differences among several anchor types are not high and are similar to the observations in this study and Kuenzlen’s (2004) study. (2) Some results in Mohyeddin et al.’s (2020) study are questionable. For instance, for the “S5” type screw anchors at hnom
= 2.17 in (55 mm), Nu
of the anchors installed at the higher strength concrete (
Relationship between Ncomb and hef
Using equation (2), hef was obtained for each d-hef per manufacturer. Ncomb against hef for each diameter is shown in Figure 8. A linear correlation between Ncomb and hef 1.3 is evident (R 2 = 0.92). Also, d showed a minor effect on Ncomb , since the difference between d = 1/4 and 3/8 in (6.35 and 9.525 mm) at hef = 1.5 in (38 mm) and between d = 1/4 and 1/2 in (6.35 and 12.7 mm) at hef = 2.2 in (56 mm) was small. Also, the curve of Nb predicted by the original CCD method using equations (1) and (2) is shown in Figure 8. As shown in Figures 7 and 8, the CCD method overestimated Ncomb because the CB cones of the combined mode did not start from the embedded end. These results are consistent with the results in Kuenzlen’s (2004) study. Moreover, the estimation errors from the CCD method are larger with deeper effective embedment depth.
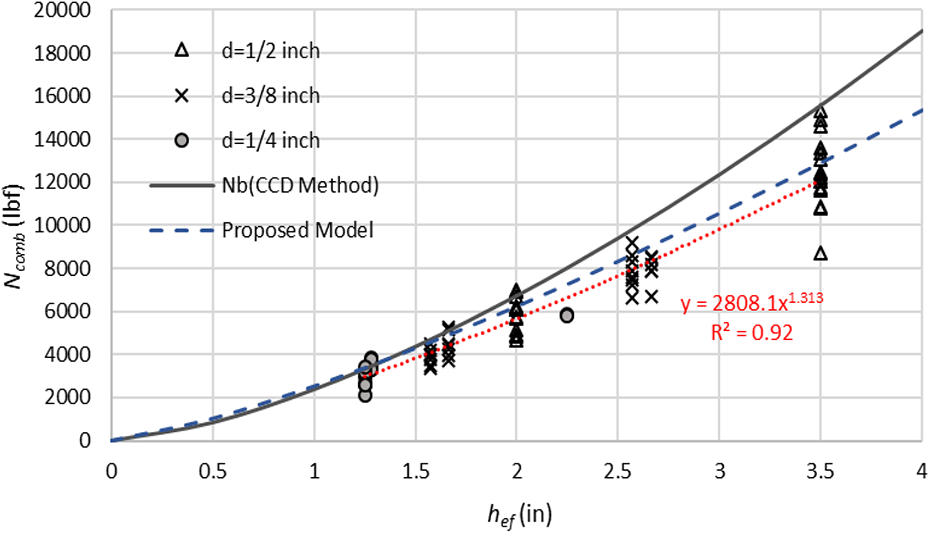
Ncomb versus hef per diameter (note: 1 in = 25.4 mm; 1 lbf = 4.45 N).
Comparison to predicted strength by modified CCD method
Based on the modified CCD method, the predicted Nb was calculated by equations (1) and (3). In Figure 9, the predicted Nb values are compared with the measured Ncomb ’s from 113 tests in the combined mode. The modified CCD method was developed based on a database that included both CB and combined failure for screw anchors (Kuenzlen, 2004). Therefore, as expected, Ncomb was well predicted by this method evident by a generally good fit between the mean ratio of the predicted Nb to the measured Ncomb = 0.96 with a COV = 16.4%, R 2 = 0.89, and standard error of estimate (SEE) = 1137 lbf (5.06 kN). However, in the design methods for other mechanical anchors in the ACI code, the design strength of each failure mode is obtained individually, either by design equations or based on the 5% fractiles of experimental results, then the lowest strength controls the design (ACI 318-14, 2014). Thus, a prediction model specific to Ncomb is proposed in the following section based on the results of screw anchors in combined modes in this study.
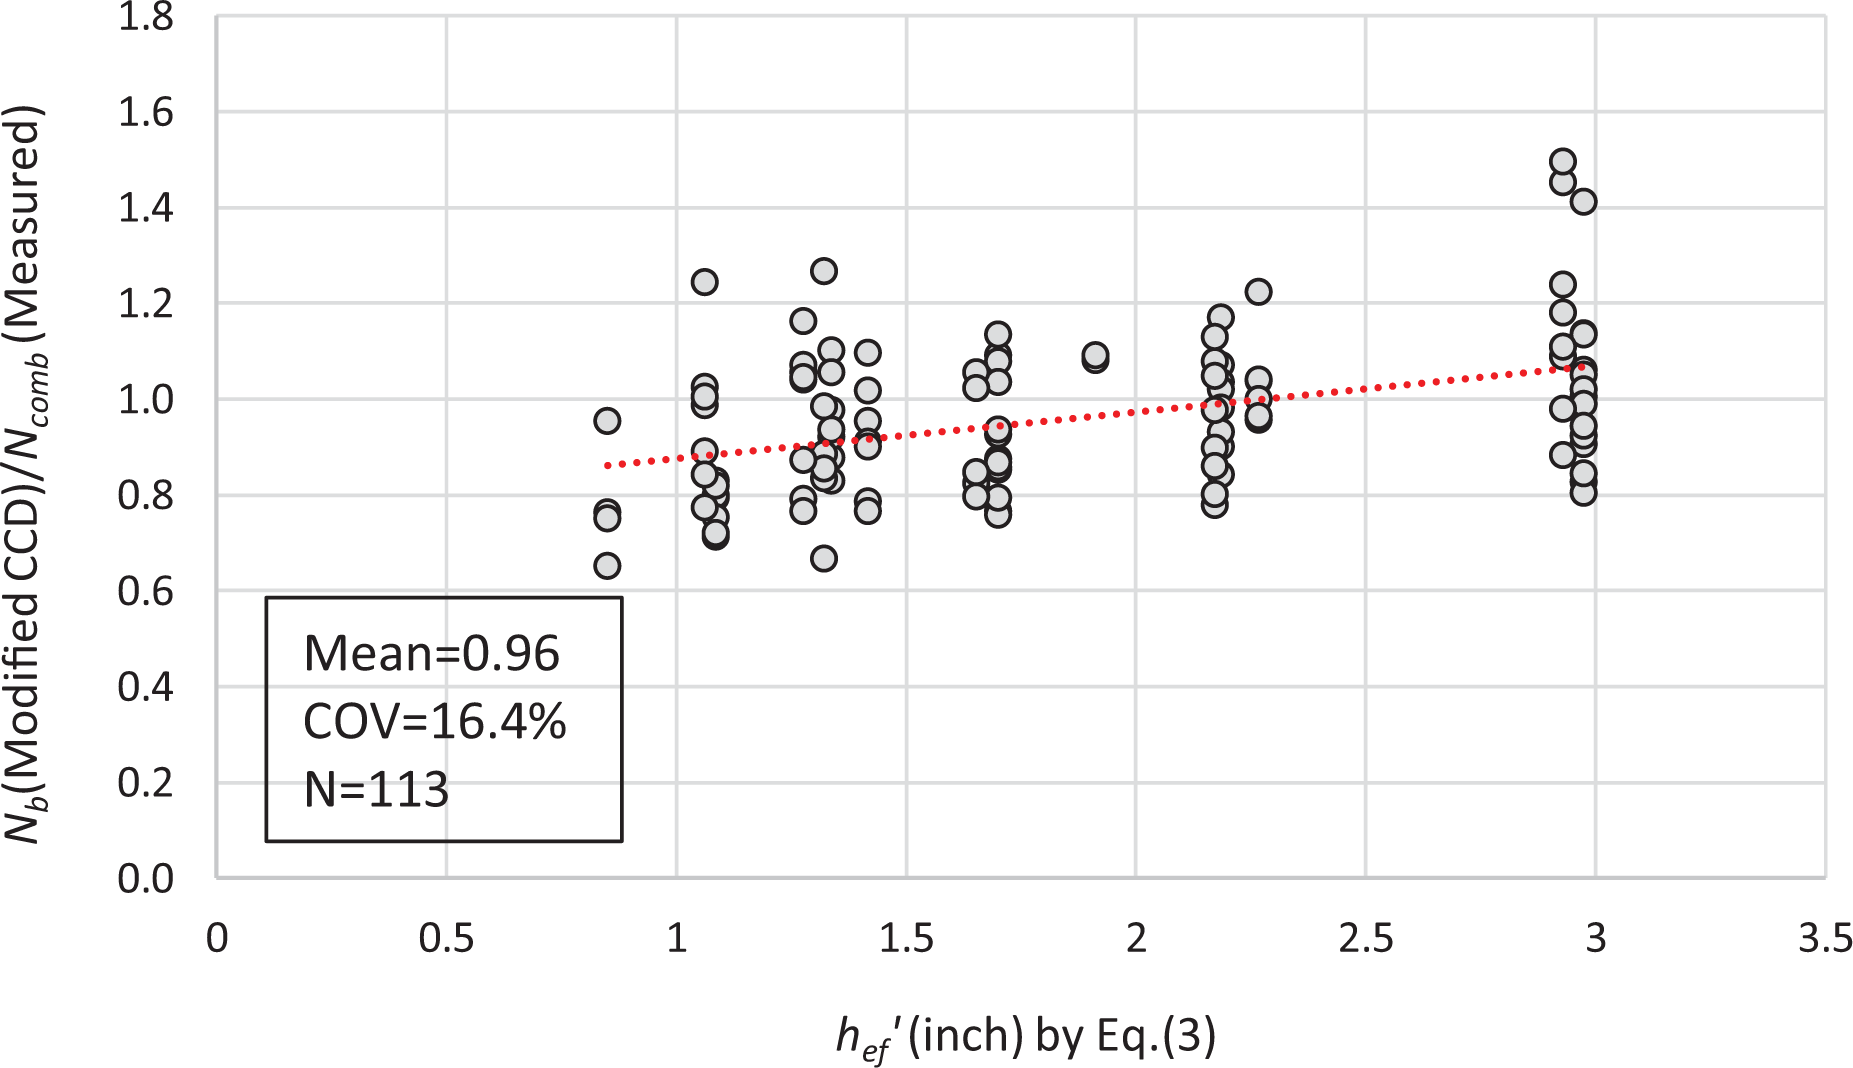
The ratio of predicted Nb by the modified CCD method to the measured Ncomb per hef (note: 1 in = 25.4 mm.).
Comparison to predicted strength by a newly proposed model
The prediction model in equation (4) was also used to obtain the predicted Ncomb to compare with the measured Ncomb in this study (Figure 10). As seen in Figure 10, although there are several points near 1.0 and the mean ratio is 1.18, the variance is extremely high (COV = 58%), and many points are showing inaccurate predictions with the ratios higher than 2 or lower than 0.5. Therefore, the prediction model in equation (4) does not result in reasonable predictions of Ncomb for test results in this study. The followings reasons can explain the discrepancy of Ncomb predicted by equation (4) and measured Ncomb . First, in Mohyeddin et al.’s (2019) study, an individual type of screw anchor was investigated, the corresponding conclusion and observation cannot be applied to other types of screw anchors without further investigation and calibration or modification. Second, tests on anchors are known to have the characteristics of high variances and require a high number of repeats to draw a conclusion statistically. In Mohyeddin et al.’s (2019) study, there were only five repeats per test scenario, and the number of those in the combined failure mode further reduced to two or three per scenario. Thus, the measured cone depths might not be representative of all cases. Finally, for each test scenario in this study, among the eight repeats, the cone depth varied and was not correlated to individual Ncomb , while Ncomb in equation (4) is sensitive to the cone depth. Therefore, it is expected that measured Ncomb will not fit into equation (4) ideally.
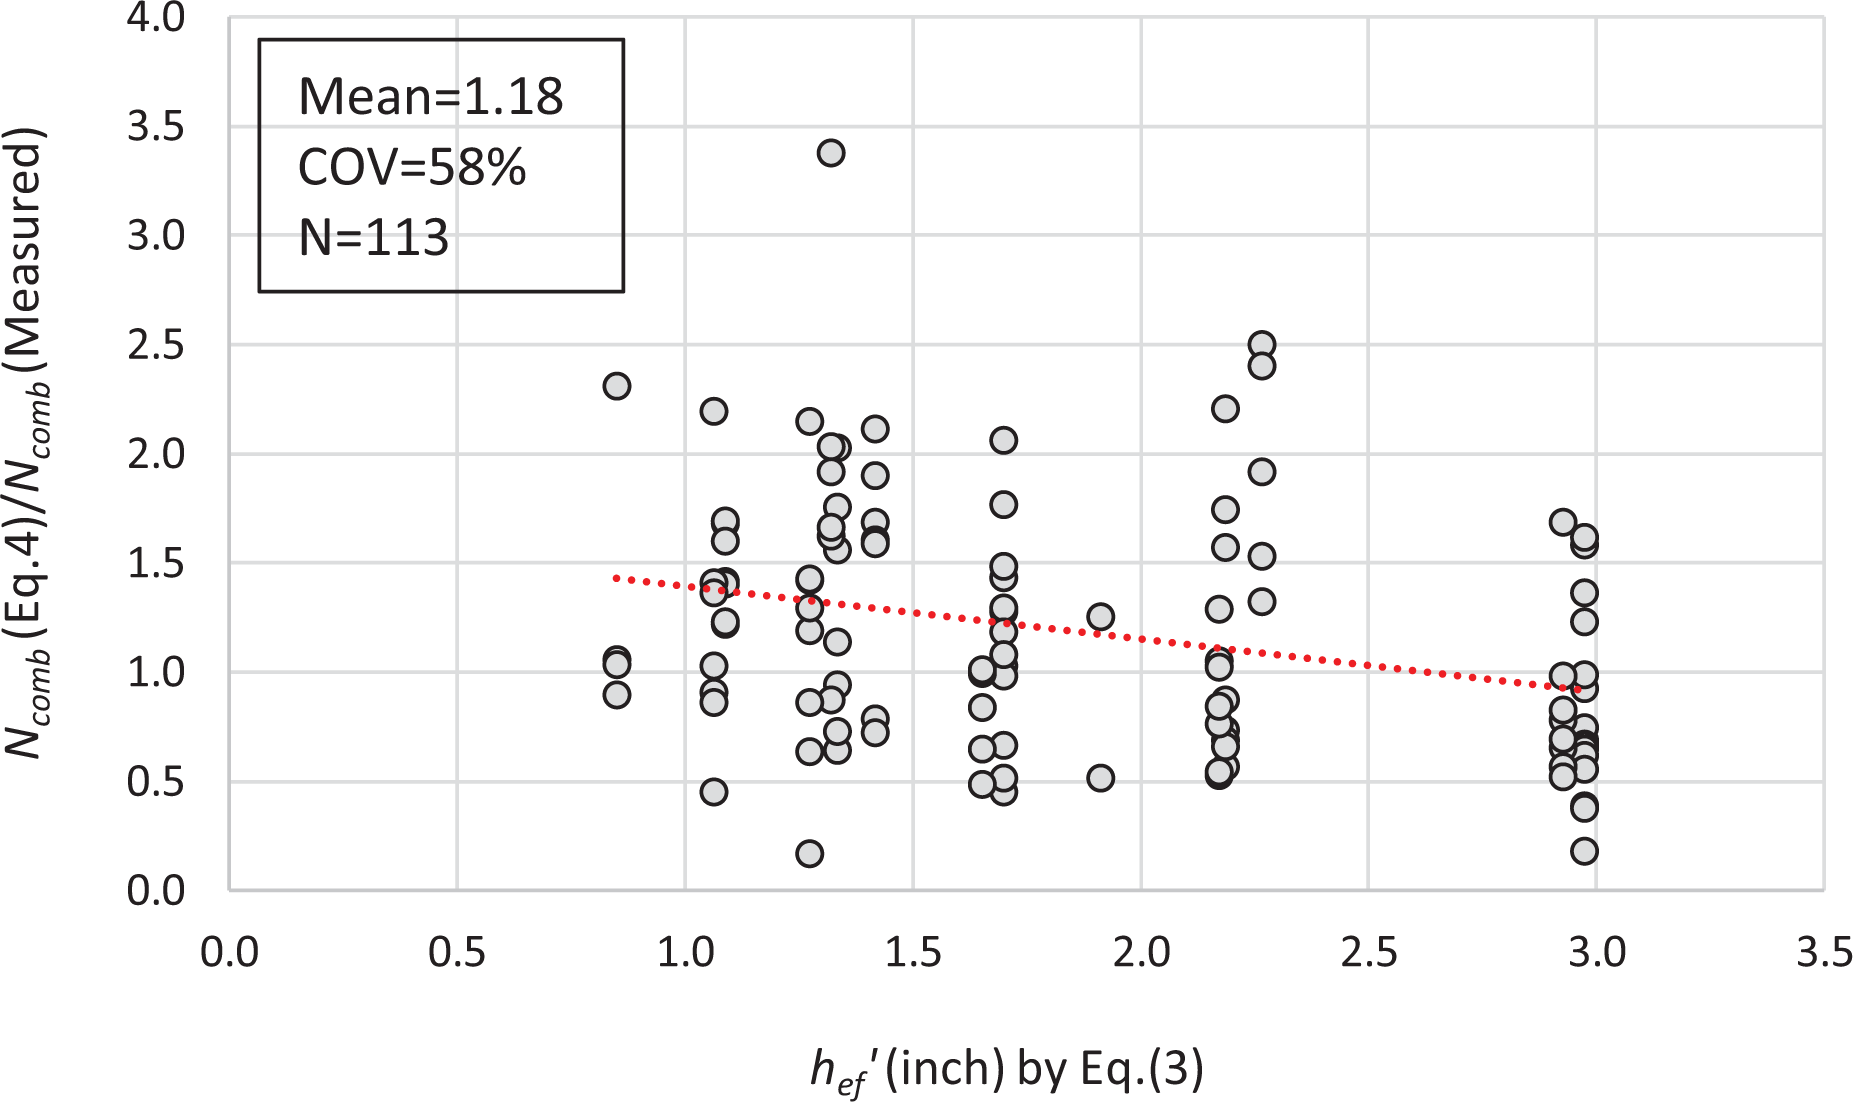
The ratio of predicted Ncomb by equation (4) to the measured Ncomb per hef (note: 1 in = 25.4 mm.).
Regression model on combined failure mode
Using the results in the combined mode, a regression of Ncomb
including independent variables, dm
and
The regression results showed a good fit with the test results, with an adjusted R 2 = 0.90 and SEE = 1062 lbf (4.72 kN), which are slightly better than those by Kuenzlen’s method above. Note that m was found to be insignificant to the regression model (P-value = 0.3381). This is expected as d showed minor effect on Ncomb in this study and the literature (Kuenzlen, 2004). Thus, dm was excluded from the prediction model. The predicted Ncomb by the proposed model (equation (5)) is also compared to the test results, as shown in Figure 8
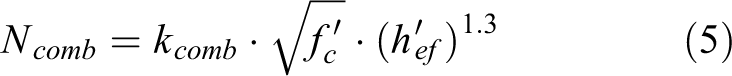
where kcomb
= 46 is the calibration factor and
The ratios of the predicted Ncomb by the proposed model (equation (5)) to the measured Ncomb are shown in Figure 11. Compared to the prediction by the modified CCD method (mean ratio = 0.96) (Figure 9), a more conservative prediction (mean ratio = 1.13) was obtained by the proposed model. However, among the 113 data points, using the modified CCD method resulted in more underestimated data points: 70 points < 1.0 with 21 points < 0.8 (Figure 9), while the proposed model had only 27 points < 1.0 with no point lower < 0.8 (Figure 11). Moreover, several points for the modified CCD method locate in the region below 0.6 (Figure 9), and no point for the proposed model is within this region (Figure 11). Also, for the proposed model, the COV, R 2, and SEE of the predicted Ncomb are lower. In addition, the predicted Ncomb is more independent of hef (trend-free) (Figure 11); this indicates that equally accurate predictions of Ncomb for screw anchors at different hef were obtained using the proposed model, while the modified CCD method resulted in less accurate results as hef increases. This advantage of the proposed model might become more prominent if hef increases to a higher range than the investigated range in the study. Overall, an improvement for predicting Ncomb was observed when the proposed model was used. Comparisons between the proposed model and the modified CCD method should be further conducted with more data, which include more variations in the design parameters. Note that the scatters of the data at the same hef (as shown in Figures 9 and 11) are due to the variances within the repeats of each test scenario of the measured Ncomb results and the differences in measured Ncomb among the three manufacturers (Figure 7), and not caused by the prediction models. The variances of test repeats for each test scenario per manufacturer are shown in Table A2 in Supplemental Appendix 1. It is also due to the scatter of the experimental data that the proposed model cannot guarantee to result in an accurate prediction for every single test per test scenario; the proposed model results in accurate estimations for partial data points and underestimates or overestimates the other data points for the same test scenario. For example, as shown in Figure 11, for hef equals to around 3 in (76 mm), most data points of the ratio of predicted Ncomb over measured Ncomb are around 1.0 (at the range of 0.8–1.3), while the rest three data points are higher than 1.4.
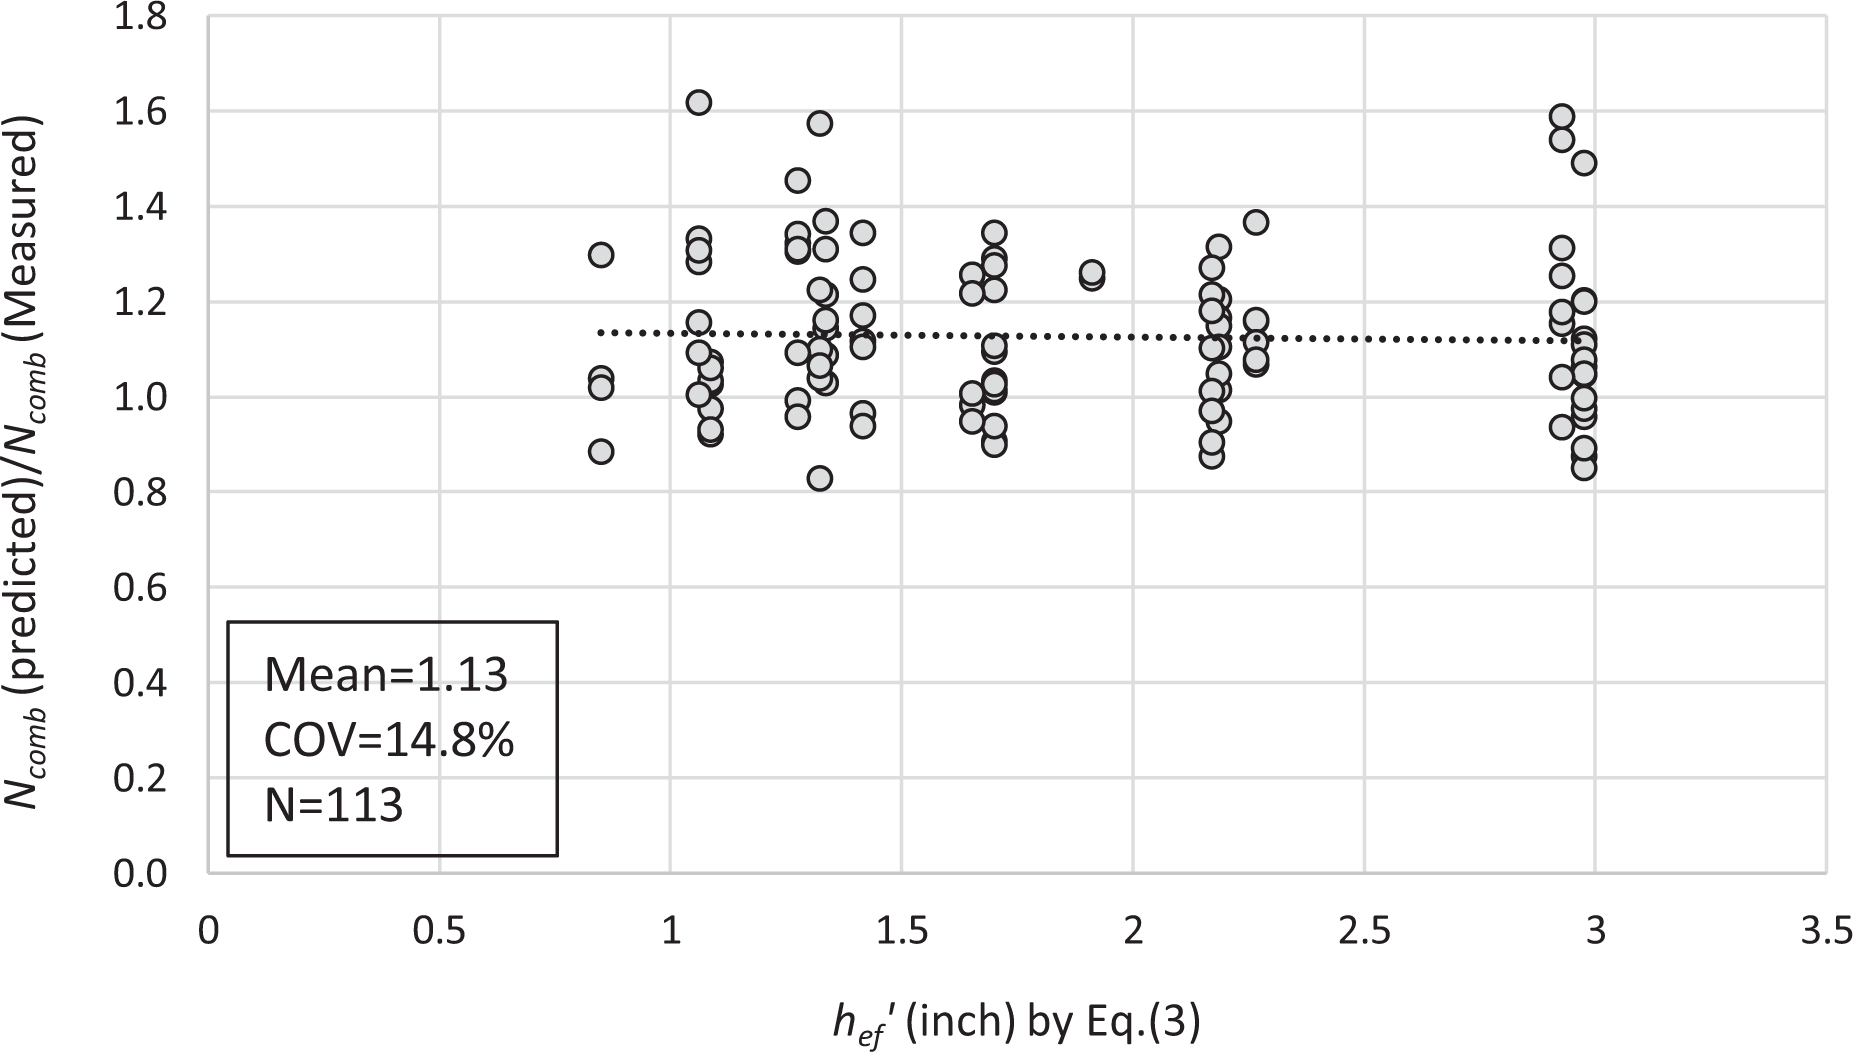
The ratio of Ncomb predicted by the regression model to the measured results per hef (note: 1 in = 25.4 mm.).
Finally, in addition to Nsa in steel failure mode predicted equation (17.4.1.2) in ACI 318-14 (2014) and Nb in CB mode predicted by the modified CCD method (Kuenzlen, 2004), Ncomb can be predicted by equation (5) for screw anchors in the combined (PO and CB) mode. Then, the final design tensile strength takes the minimum values of design strength for each failure mode, including the strength reduction factors in ACI 318-14 17.3.3 (2014).
Summary and conclusion
Screw anchors are gaining popularity in concrete structure construction. Currently, a modified CCD method including an effective embedment depth (hef
) with a reducing factor of 0.85 (
As test data on screw anchors are scarce in the United States, this study included 144 unconfined tension tests on screw anchors of three diameters with two embedment depths per diameter from three manufacturers, which were selected based on the specified embedment depths (one embedment depth is deeper than the other one) in the manufacturer catalogs.
The combined failure mode was investigated separately from the CB mode. Majority of the tests (113 out of 144) failed in the combined mode for both embedment depths per tested diameter. Differences in Nu in the combined mode (Ncomb ) among three investigated manufacturers per hnom were mainly due to their slightly different hef obtained from equation (2). Moreover, Ncomb was found to be dependent on parameter hef 1.3 (R 2 = 0.92) and independent of diameter.
The results of Ncomb were first compared with the original CCD method by equations (1) and (2). The CCD method overestimated Ncomb and the accuracy of the estimation decreases as hef increases. Then, the results were compared with the modified CCD method by equations (1) and (3). A general good fit is shown: mean ratio of predicted Nb to measured Ncomb = 0.96 with a COV = 16.4%; R 2 = 0.89 and SEE = 1137 lbf (5.06 kN). Furthermore, a regression model (equation (5)) was developed to predict Ncomb specifically. This model showed improved results: mean ratio of predicted Ncomb to measured Ncomb = 1.13 with a COV = 14.8%; R 2 = 0.90 and SEE = 1062 lbf (4.73 kN). However, the proposed model did not show significantly better predictions of Ncomb than the modified CCD method based on the test data in this study. More test data with more diameters, embedment depths, concrete strength, and manufacturers of screw anchors are required to further evaluate the proposed model.
Future work
The prediction model of equation (5) applies to the screw anchors of investigated manufacturers and design parameters. Future studies should expand the tested database to include more diameters, embedment depths, concrete strength, and manufacturers of screw anchors and then combine with the European database in Kuenzlen’s (2004) study to calibrate equation (5), thus increasing its applications to more screw anchor types and widened range of design parameters (d, hef
, and
Supplemental material
Supplementary_files - Investigation of a combined failure mode for screw anchors under tension
Supplementary_files for Investigation of a combined failure mode for screw anchors under tension by Zhao Chen, Somayeh Nassiri and Anthony Lamanna in Advances in Structural Engineering
Footnotes
Acknowledgements
In-kind support from Simpson Strong-Tie is gratefully acknowledged along with technical advice from Marlou Rodriguez, Dan Harmon, Ryan Vuletic, Chris LaVine, and Blake Breda from Simpson Strong-Tie.
Declaration of Conflicting Interests
The author(s) declared no potential conflicts of interest with respect to the research, authorship, and/or publication of this article.
Funding
The author(s) received no financial support for the research, authorship, and/or publication of this article.
Supplemental material
Supplemental material for this article is available online.
References
Supplementary Material
Please find the following supplemental material available below.
For Open Access articles published under a Creative Commons License, all supplemental material carries the same license as the article it is associated with.
For non-Open Access articles published, all supplemental material carries a non-exclusive license, and permission requests for re-use of supplemental material or any part of supplemental material shall be sent directly to the copyright owner as specified in the copyright notice associated with the article.