




Abstract
To improve both seismic performance and thermal insulation of low-rise housing in rural areas of China, this study proposes a load-bearing prefabricated composite wall panel structure that achieves appropriate seismic performance and energy efficiency using field-assembled load-bearing prefabricated composite wall panels. A 1:2 scale prototype built using load-bearing prefabricated composite wall panel is subjected to quasi-static testing so as to obtain damage characteristics, load-bearing capacity and load–displacement curves in response to a simulated earthquake. As a result, seismic performance indicators of load-bearing capacity, deformation and energy-dissipating characteristics, are assessed against the corresponding seismic design requirements for rural building structures of China. Experimental results indicate that the earthquake-resistant capacity of the prototype is 68% higher than the design value. The sample has a ductility factor of 4.7, which meets the seismic performance requirement mandating that the ductility factor of such concrete structures should exceed 3. The design can be further optimized to save the consumption of material. This shows that the load-bearing prefabricated composite wall panel structure developed here has decent load-bearing capacity, ductility and energy dissipation abilities, a combination of which is in line with the seismic design code. A new construction process proposed here based on factory prefabrication and field assembly leads to a considerable reduction of energy consumption.
Keywords
Introduction
Located between the circum-Pacific earthquake zone and the Euro-Asian earthquake zone, China is one of the most earthquake-prone countries in the world. A review of historical data reveals that earthquakes in China are mostly characterized by high frequency, shallow hypocentres, great intensity and wide distribution (Huang et al., 2014; Jia et al., 2013; Wang et al., 2018; Bai et al., 2019). Since the Tang Shan earthquake in 1976, a multitude of destructive earthquakes took place in China, with the majority of which occurring in broad and densely populated rural areas (Tian and Su, 2006). Most rural building structures in China are self-built, primarily in masonry, brick, or wood and often exhibit poor seismic performance (Cao et al., 2014; Tan et al., 2013). During the 2008 Great Wenchuan earthquake (8.0 Ms), such rural buildings were subject to severe damage or even total collapse.
The sintering of clay to make solid bricks for rural buildings consumes large amount of coal, with associated CO2 emissions, and the manufacturing process emits a significant amount of dust, which can lead to severe environmental pollution (Cao et al., 2015). According to Ji (2018), 1770–2077 kg of coal is needed to produce 10,000 solid bricks in China. Such issues are barriers to the promotion of energy conservation technology in rural building structures. Therefore, there exists an urgent need to develop an integrated technology that can simultaneously enhance the seismic performance and energy efficiency of rural building structures.
To enhance the seismic performance and energy efficiency of rural building structure, this article details the development of the load-bearing prefabricated composite wall panel (LPCP) to serve as the primary load-bearing and thermal insulation component for establishing the rural building structure with appropriate seismic performance and energy efficiency based on factory prefabrication and field assembly. The proposed LPCP is a sandwich construction, with a central thermal insulation layer enclosed between two steel mesh–reinforced concrete layers. The reinforced-concrete layers are connected through an array of two-way diagonal reinforcing bars so as to form a steel mesh–reinforced concrete composite plate (Figure 1). The insulation thickness can be adjusted in accordance with the regional climate condition and energy efficiency requirements. The strength, spacing and diameter of the reinforcing bars in the reinforcement mesh as well as the strength and thickness of the concrete layers is determined based on structural calculations.
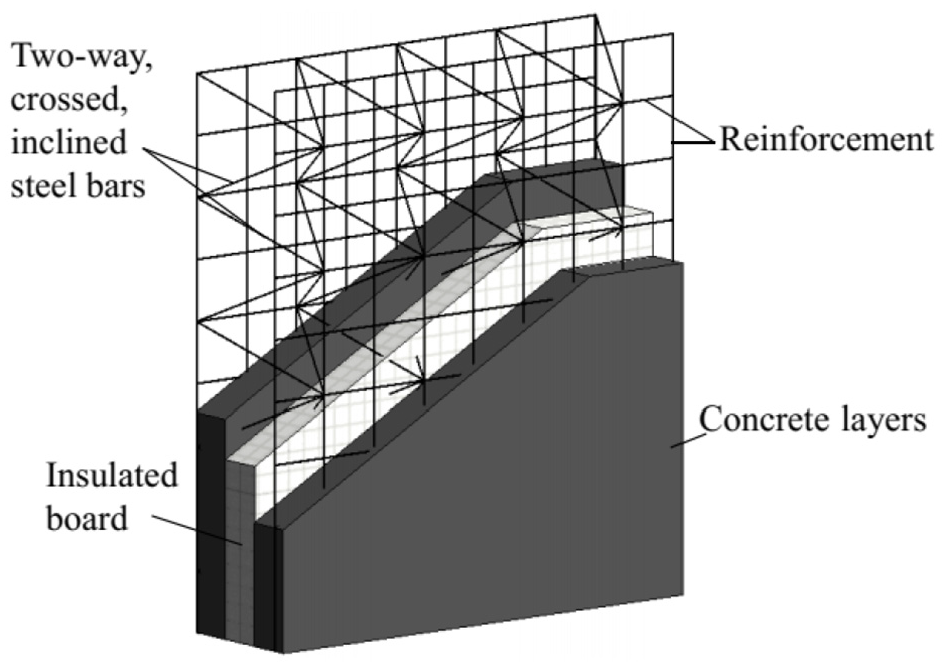
Schematic of load-bearing prefabricated composite wall panel.
Wang (2015) examined the statistical data of China Real Estate Evaluation Centre concerning the difference of reinforced-concrete structure constructions between industrialized construction method and the traditional cast-in-place concrete construction method. It was found that the former method reduced the energy consumption by 20%–30%, material loss by 60%, construction rubbish by 83%, and recyclable materials by 66% compared to the latter method, a combination of which eventually leads to the reduction of carbon emission. In short, industrialized construction method offers faster and safer manufacturing, better predictability to completion time, superior quality, less workers on site, less resource wastage and a more environmentally friendly solution than the conventional construction process (Ferdous et al., 2019; Lacey et al., 2018). Thus, it is advised to construct LPCP building by the industrialized construction method based on in-factory prefabrication and field assembly of the construction parts, which not only deliver the advantage of reinforced-concrete structure but can also reduce the energy consumption and carbon emission.
Research indicates that this type of sandwich plate exhibits good load-bearing capacity and ductility with the presence of axial vertical load (Benayoune et al., 2007; Mohamad and Hassan, 2013; Rodrigo et al., 2013), eccentric vertical load (Benayoune et al., 2006; Mohamad and Mahdi Muhammad, 2011), bending (Benayoune et al., 2008; Isabella et al., 2015; Ramachandra et al., 2014; Smitha et al., 2014), shear force (Liu, 2013; Mowrtage and Karadogan, 2009; Wu and Dare, 2006), compressive-bending-shear composite load (Kabir, 2005) and seismic load (Janardhana et al., 2014; Magliulo et al., 2014; Retamales et al., 2013), making it suitable to be used as the main load-bearing component in multi-storey building structures. This conclusion provided an idea that the LPCP, a kind of seismic-resistant and energy-saving prefabricated sandwich wall panel, also could be applied in the multi-storey buildings to improve the seismic resistance in the rural area of China. Thus, Huang et al. (2014, 2018) investigated the seismic performance of the LPCP by testing and numerical simulation. The results indicated that the seismic performance indexes such as bearing capacity, deformation capacity and energy-dissipation capacity can meet the corresponding seismic fortification requirements. However, LPCP is a kind of prefabricated component, which needs to be transported to the site for assembly to form a structure. Connections method between components, components and foundations, and whether the aseismic performance indicators of the assembled structure can meet the requirements of aseismic fortification still needs further research.
To address this gap in the knowledge, this article details the design, construction and testing of a 1:2 scale model of an LPCP building structure. Quasi-static testing was undertaken to obtain damage characteristics, yield load and load–displacement curves of the building structure in response to the simulated seismic conditions. This work allows us to determine whether a suite of seismic performance indicators, for example, load-bearing capacity, ductility and energy-dissipating ability, can meet the seismic performance requirements of rural building structure.
LPCP prototype testing
Reference building
The specimen is prototyped based on a rural building in the City of Leshan in China’s Sichuan Province. This reference building is 13.2 m tall and has a storey height of 3.3 m. The standard floor layout and the cross-section plot of the building are shown in Figure 2. The seismic precautionary intensity is set to 7 according to the code for design of buildings of China (National Standards of P.R.C, GB50011-2010, 2010). Here, the seismic precautionary intensity refers to the seismic intensity prescribed by the national regulation for benchmarking the seismic performance of buildings in the local area. It is calculated as the seismic intensity the local area has more than 10% likelihood to experience within five decades. The seismic intensity refers to the extent to which the ground and buildings are damaged during an earthquake. Level 7 of seismic precautionary intensity corresponds to a design basic acceleration of ground motion of 0.1g (g is the gravitational acceleration). The site type is Category-II, corresponding to the third group of seismic ground motion. It is classified based on an array of factors, including the thickness of the construction site cover layer and the equivalent shear wave velocity within the soil layer. It is used to reflect the cumulative amplification effect of the ground condition on the bedrock’s seismic vibration. In this case, the test site ground primarily consists of gravel soil, with a cover layer thickness of 20.7 m and a soil layer equivalent shear wave velocity of 245 m/s, which makes it a Category-II site according to the regulation of building seismic performance. The floor, roof and wall panels are all based on the newly proposed LPCP. A representative portion of the reference structure was the room located at the intersection of line 2–3 and line A–B at the ground floor of the building, as shown in the shaded part of Figure 2. The length and height of the wall and the floor in this room are all 3300 mm. The wall thickness is 200 mm, which contains a 100 mm thick thermal insulation sandwich layer and two 50 mm thick concrete surface layers. The floor is 160 mm thick, with the thermal insulation sandwich layer in the middle being 60 mm thick, and the concrete layers on both sides being 50 mm thick. The walls are connected with cast-in-place concrete structural columns, and the walls are connected to the floor using cast-in-place concrete ring beams. The rationale behind this design lies in the fact that the cast-in-place concrete is cheap to make, easy to implement, making it suitable for rural areas with limited economic and construction technology levels.
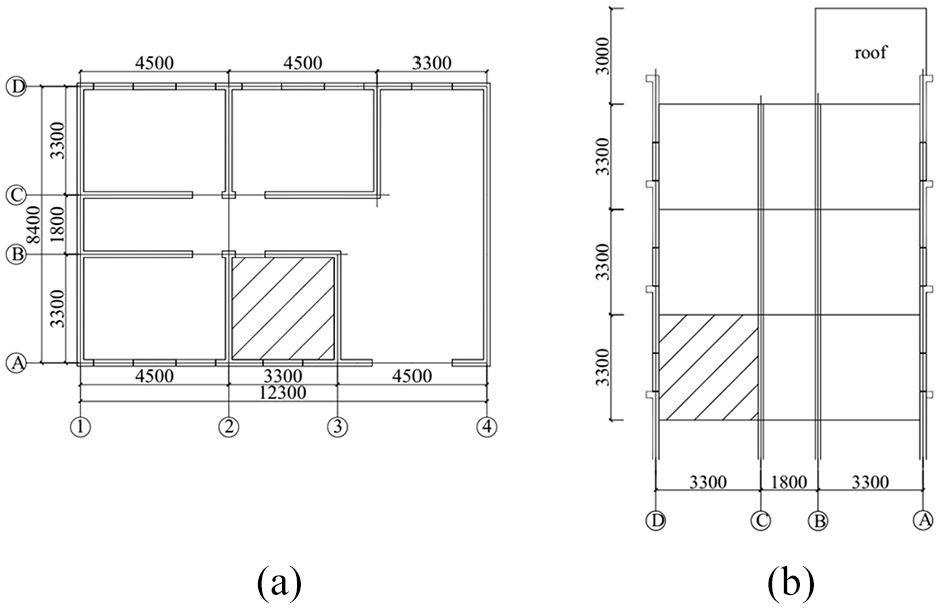
Standard floor layout and cross-section view of building prototype: (a) standard floor layout and (b) crossed-section drawn.
Scaled test specimen
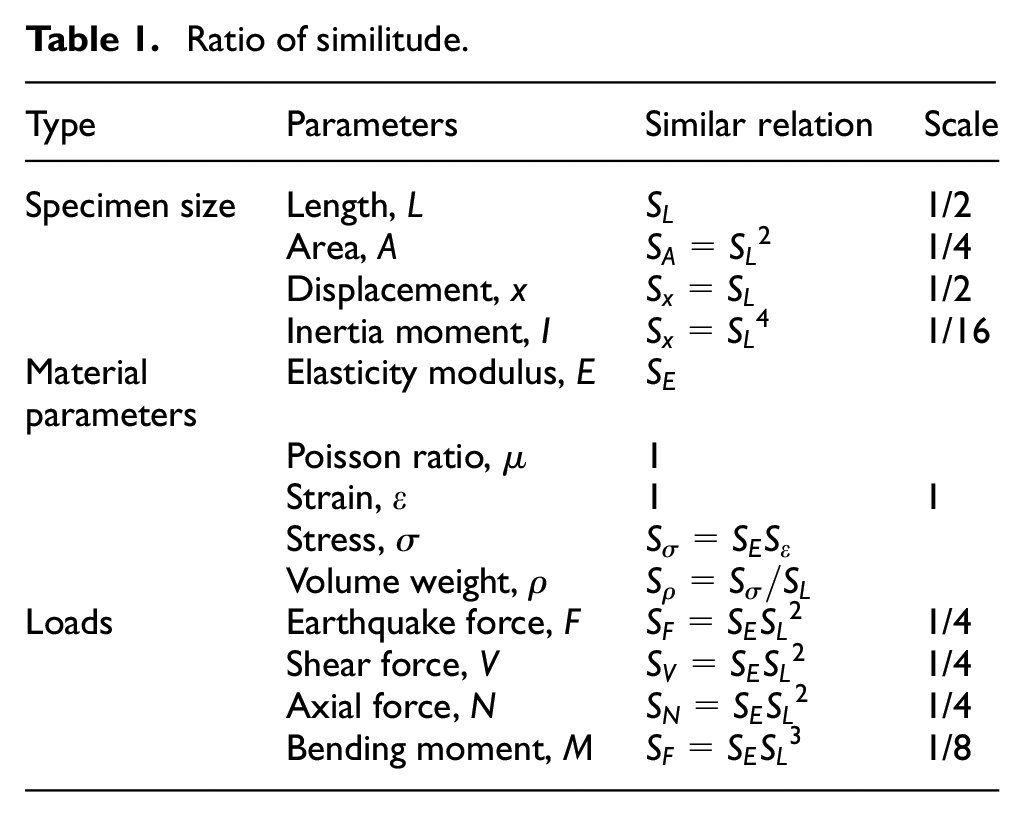
The test specimen is a 1:2 scale model of the representative portion of the prototype building. The specimen size, material parameters and loads were calculated using similarity theory (Huang, 2013) and dimensionless analysis are shown in Table 1.
Ratio of similitude.
The floor layout and the cross-sectional view of the specimen are shown in Figure 3. The floor has a plan area of 1670 mm × 1670 mm, being 20 mm larger than the room (1650 mm × 1650 mm) to facilitate its connection to the wall. For the sake of simplification, the door and window openings are both located at the centre of the wall.
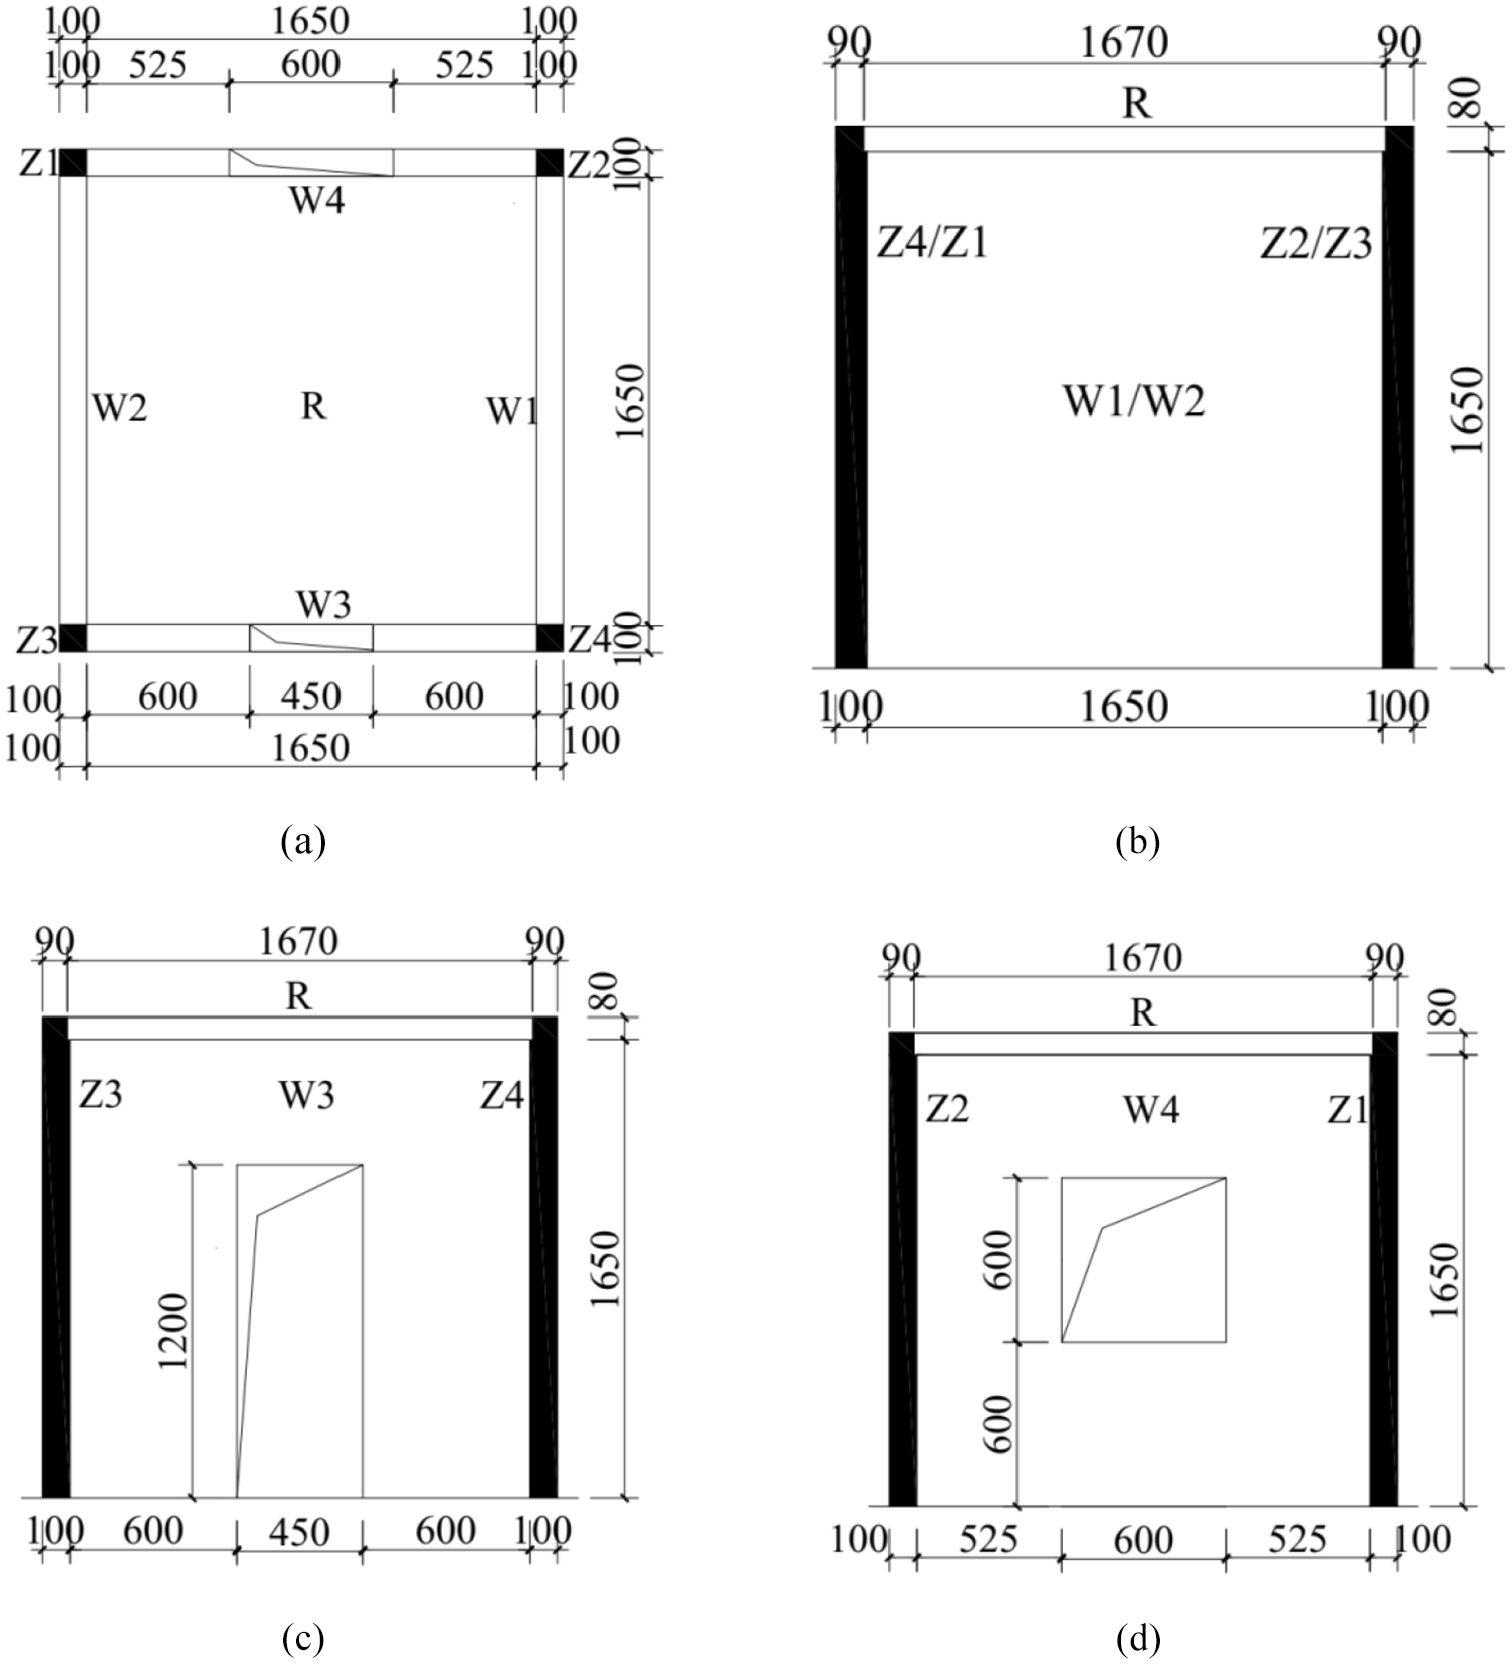
Floor layout and cross-sectional view of the test specimen: (a) plane figure, (b) side elevation, (c) front elevation and (d) back elevation.
The dimensions of wall and floor and the associated reinforcement strategy are shown in Figure 4. The width and height of the wall are both 1650 mm. The wall thickness is 100 mm, with the thermal insulation layer and two concrete layers on both sides being 50 mm and 25 mm thick, respectively. The length and width of the floor are both 1670 mm. The floor thickness is 80 mm, with the thermal insulation layer and concrete surface layers on both sides being 30 mm and 25 mm thick, respectively. A galvanized steel wire mesh with 2 mm diameter steel wire diameter and 200 mm spacing is placed at the centre of the concrete layer, which is connected with a set of two-way slanted galvanized steel wires also being 2 mm in diameter and at 200 mm centres.
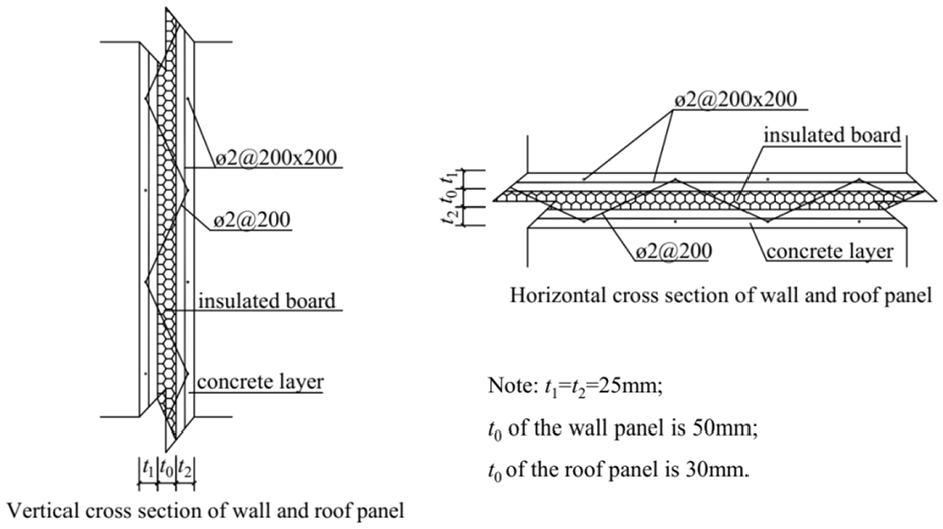
The specimen cross-sectional details.
Figure 5 shows how a wall is connected to other walls, floor and foundation. Inter-wall connection is established based on cast-in-place concrete structural columns being 100 mm × 100 mm. The longitudinal bars are based on four plain round reinforcing bars of 8 mm in diameter. Stirrups are plain round reinforcing bars are 4 mm in diameter with 75 mm spacing. The connection between wall and floor is through cast-in-place concrete ring beams, with a cross-section of 90 mm × 80 mm. The longitudinal reinforcement consists of four plain round reinforcing bars 6 mm in diameter, transverse reinforcement consists of plain round reinforcing bars 4 mm in diameter with 100 mm spacing. The anchor connection between wall and foundation is established by extending the longitudinal galvanized steel wire in the wall to a height above the foundation by 1/3 of the overall height.
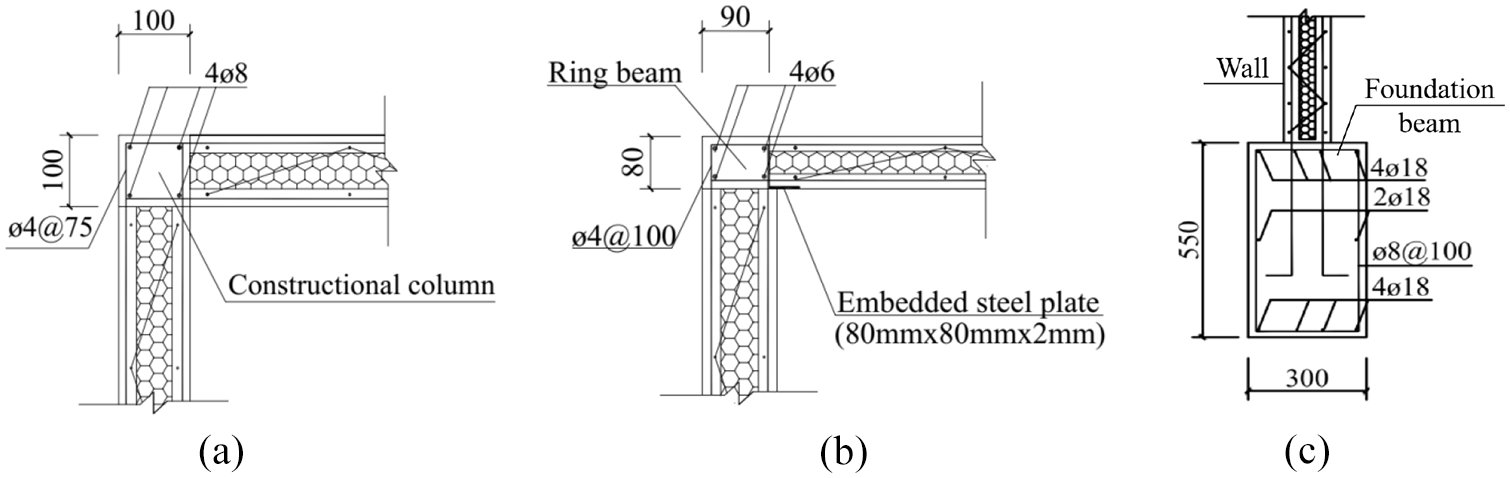
Connection between wall and other walls, floor and foundation beam: (a) connection between walls, (b) connection between wall and roof panel and (c) connection between wall and foundation beam.
Materials
The test specimen mainly consists of concrete and reinforcing bars. The foundation is made of regular concrete with a design strength of 35 MPa, and all the other components are made of fine-stone concrete with a design strength of 30 MPa. The corresponding compositions are shown in Tables 2 and 3, respectively. The main purpose of the present testing is to assess the overall seismic performance of the upper building structure as well as the reliability of the connections between components. To prevent the foundation from undergoing damage before the upper structure, the design strength of the foundation concrete is higher than those of the other components. Besides, considering that all the other components except for the foundation are relatively small, fine-stone concrete is used to build those components so as to facilitate the pouring and vibration operations.
Composition of fine-aggregate concrete of 35 MPa mix as proportion of cement content.

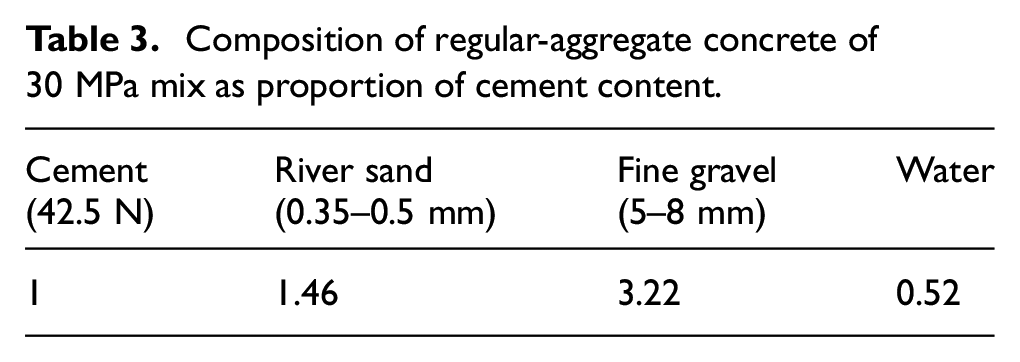
Composition of regular-aggregate concrete of 30 MPa mix as proportion of cement content.
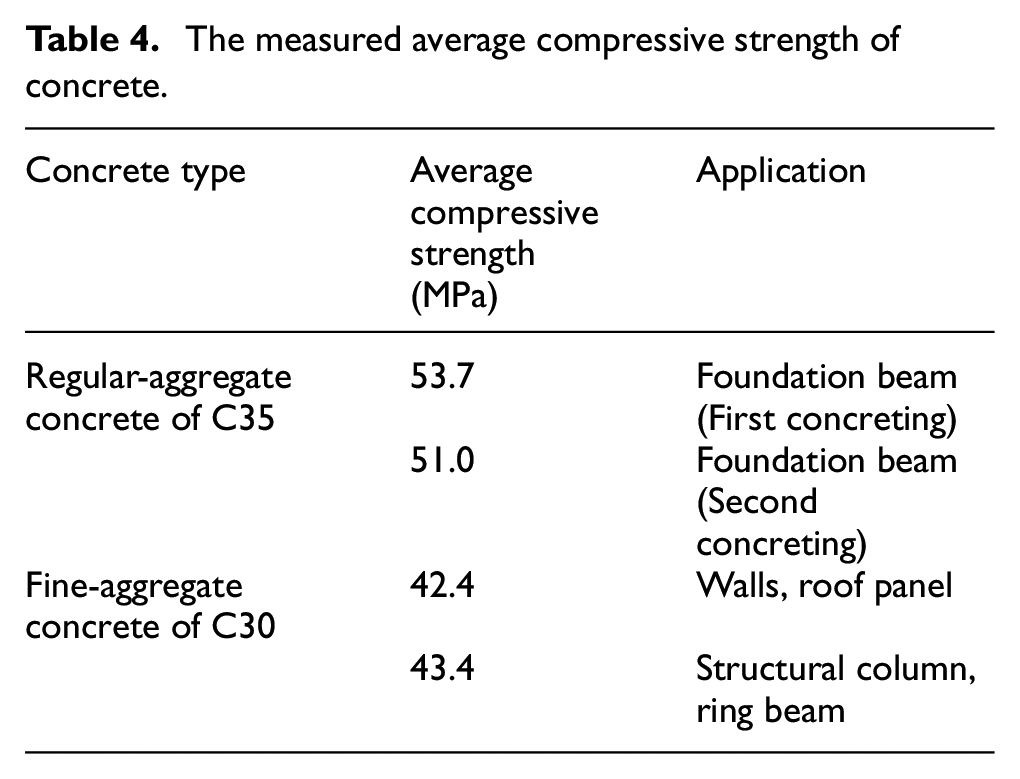
The measured concrete strengths are shown in Table 4. The strength measurements were carried out at a factory of prefabricated parts in the city of Leshan. The concrete of all the prefabricated parts are commercially available self-made concrete produced by the factory, whose actual strength typically exceeds the design value. Table 5 shows the measured strengths of the reinforcing bars.
The measured average compressive strength of concrete.
Mechanical properties of steel bar and zinc-coated wire.

Specimen fabrication
The specimen was prepared through factory prefabrication and field assembly so as to mimic the industrial workflow for constructing buildings with LPCP. The key steps included are as follows: setup of foundation form, binding of foundation reinforcing bars, reservation of structural column reinforcing bars, pouring and curing of foundation concrete (first time), prefabrication of LPCP, installation of LPCP, binding of structural column and ring beam reinforcing bars, pouring and curing of structural column and ring beam concrete, pouring and curing of foundation concrete (second time) and establishment of specimen. The foundation was cast in a two-step process. Initially one-third of the foundation height was cast, to fix the reinforcing bars. After the LPCP was in place, the remaining foundation concrete was poured together with the structural column and the ring beam, so as to establish the connection between foundation and the component above it.
Testing
Test setup
Both vertical and horizontal loads are applied in the present testing. During the experiment, vertical load is first applied, followed by the application of horizontal load while maintaining a constant vertical load. The vertical load is applied to mimic the load from the top of the room and the live load from the floor. Through calculation, it is determined that the load from the top of the room is 50 kN, while the live load from the floor is 0.5 kN/m2.
The horizontal load is applied through multiple cycles to model the pattern of reciprocating force and deformation change during an earthquake. The seismic precautionary intensity is set to 7, and the design basic acceleration of ground motion is set to 0.1g. Calculation indicates that with a horizontal earthquake, the ultimate capacity of the specimen is predicted to be 220 kN. The horizontal load is applied in a stepwise cyclic manner towards a positive direction. The incremental change of each cycle is set to 1/10 of the predicted ultimate capacity, that is, starting off from 20 kN and adding load in a cyclic stepwise manner until the specimen failure.
Loading apparatus
The specimen is mounted to the ground base slot through four 65-mm diameter and 900-MP yield strength anchor bolts. Meanwhile, horizontal supports are set at both sides of the foundation to prevent the foundation from undergoing lateral movement during loading process (Figure 6). The field picture of loading devices is shown in Figure 7.
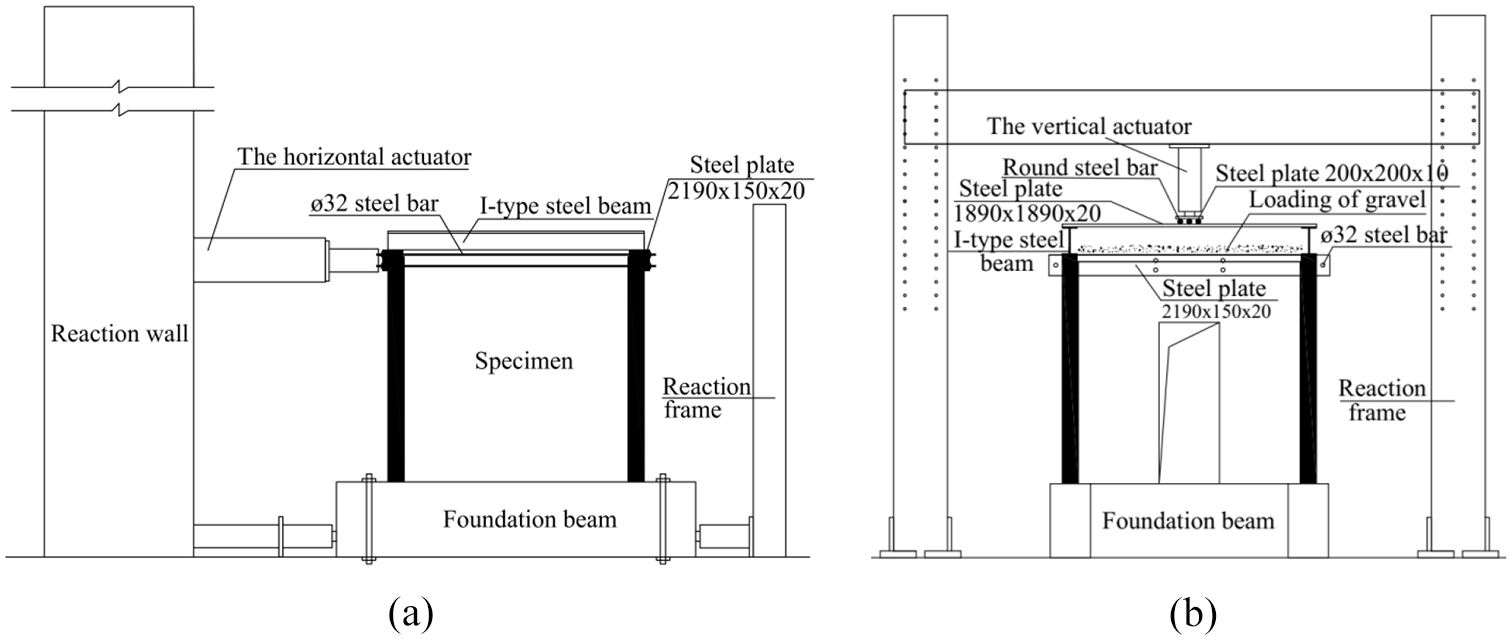
Schematic diagrams of horizontal and vertical loading devices: (a) device for horizontal loading and (b) device for vertical loading.

Field picture of loading device.
The load transferred from the top of the room was simulated with a vertical servo actuator (maximum force is 2 MN). First, 50 kN of concentrated load was applied to a 200 mm × 200 mm × 10 mm steel plate through the vertical servo actuator; the load was in turn propagated to a large steel plate being 1890 mm×1890 mm×20 mm, which converted the concentrated load to a linear load being applied to an I-type steel beam. The I-type beam propagates the load to a ring beam. Four rolling bars, 32 mm in diameter, were placed between the small steel plate and the large steel plate to ensure that the specimen could move freely within ±100 mm during the horizontal loading process. A live load of 0.5 kN/m2 was applied through gravel uniformly distributed on the floor of the specimen.
The load step was 20 kN according to a simple calculation. When the specimens cracked, the testing load was controlled by displacement and each load step with an increment of 3.0 times of the crack displacement Δcr. When the wall was completely failed or the loading decreased to 0.85 times the ultimate load, the test stopped. The horizontal load was applied through a horizontal servo actuator (maximum force is 2 MN) mounted to the counter wall. A 600mm×300mm×20 mm rectangular steel plate was placed at the front of the horizontal servo actuator, which was connected to a 1890 mm × 1890 mm × 20 mm thick rectangular steel plate at the front of the specimen through four bolts of 36 mm diameter and 500 MPa yield strength. This configuration allowed the horizontal load to be evenly propagated to the ring beam at the front of the specimen. A ball joint was placed in a built-in force sensor in the horizontal servo actuator, which allowed the horizontal servo actuator to rotate in response to the movement of the specimen so as to ensure the stability of the horizontal loading process.
Experimental measurement
The parameters measured during the present testing were: (1) horizontal displacement, (2) corresponding lateral load at the top of the specimen and (3) the growth and distribution of cracks in the specimen.
The horizontal displacement at the top of the specimen is measured with a laser displacement sensor located at the centre of the specimen ring beam. Meanwhile, a dial indicator was used to measure the sliding displacement of the foundation at the centre of the specimen foundation during the loading process so as to eliminate the impact of foundation slippage on the measurement of specimen displacement. The horizontal load was controlled and measured through the control unit of the horizontal servo actuator.
To facilitate the observation of crack growth, a layer of white lime paint was uniformly applied to the surface of the specimen wall, and a 100 mm × 100 mm grid was drawn on the paint using a pencil. During the loading process, a real-time observation of the crack initiation, growth and distribution was conducted, with the shape and direction of the cracks marked out. Evolution of the horizontal load was recorded, and a tape measure and a crack observer are employed to record the length and width of the crack.
Results
Ultimate capacity
The cracking, ultimate and failure loads of the sample and the corresponding horizontal displacements are shown in Table 6. The cracking load was recorded when the first visible crack appears on the surface of the sample; the ultimate load corresponds to the peak load the sample was able to withstand during the loading process; the failure loads was recorded when the load-bearing capacity of the sample drops to 85% of the ultimate load.
Measured horizontal loads and displacements of specimen.

Damage process
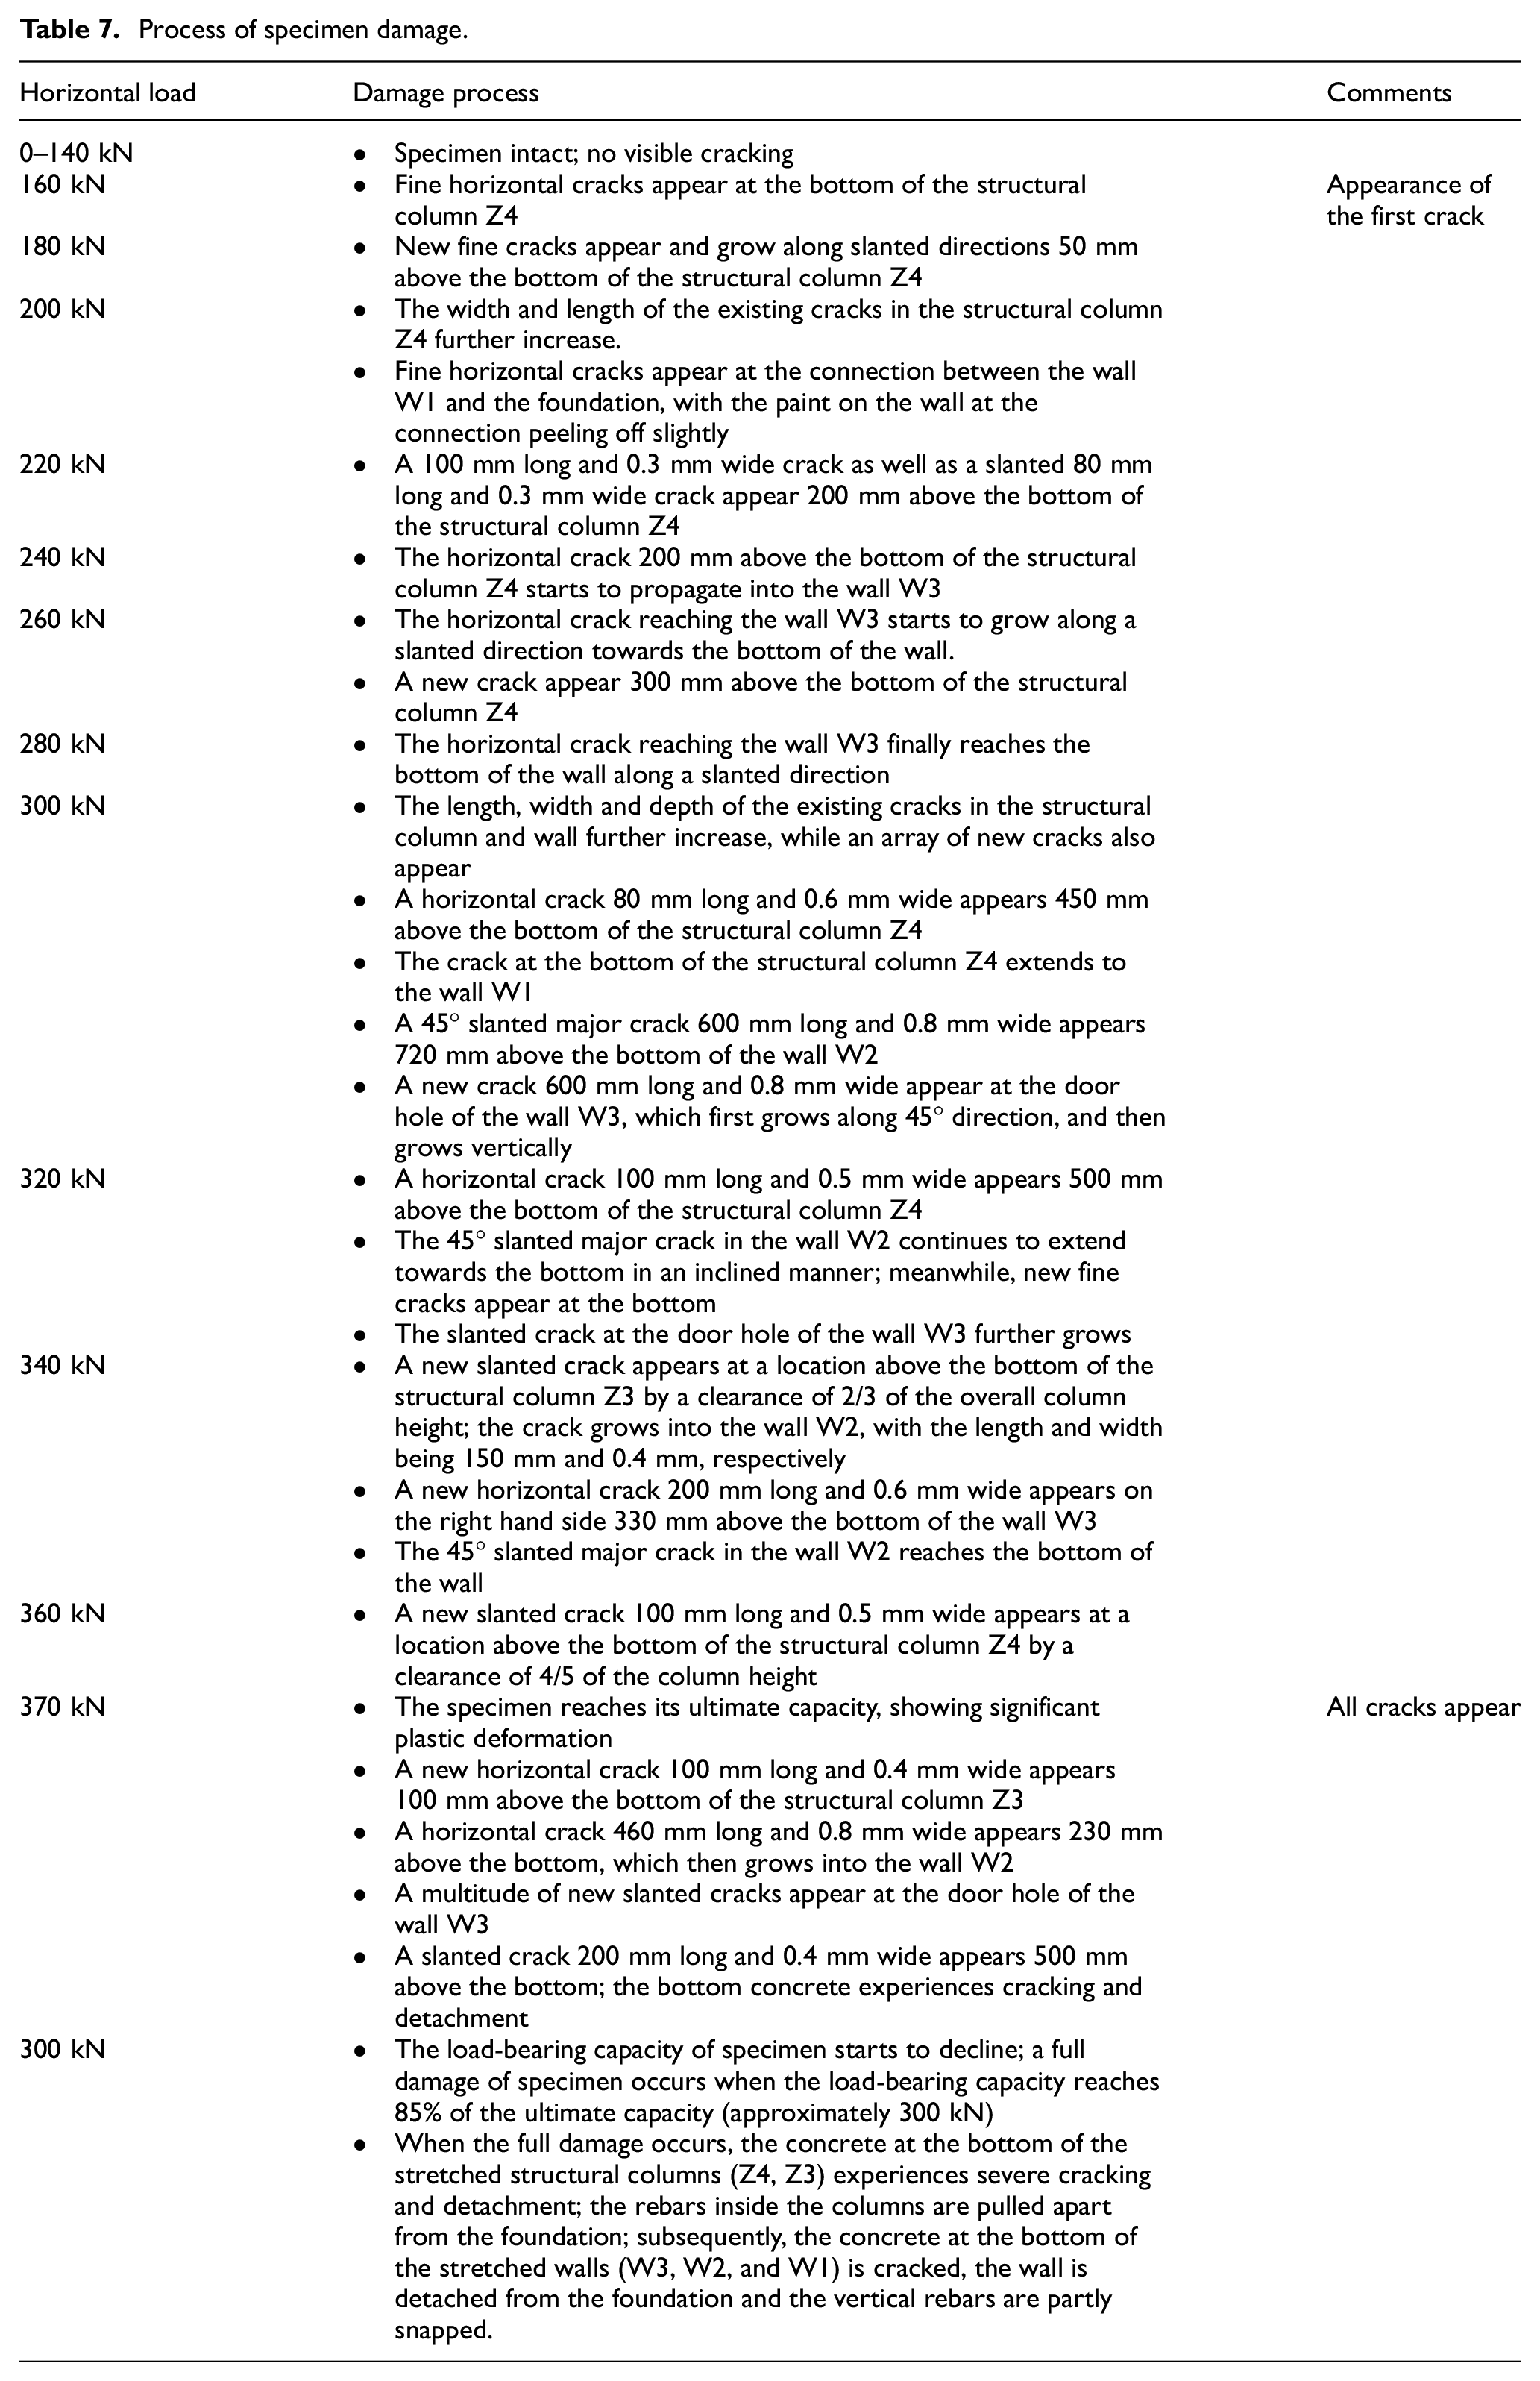
Table 7 shows the damage process of the specimen under the vertical load Fv = 50 kN and floor live load qv = 0.5 kN/m2, while the initiation, growth and distribution of the cracks were shown in Figure 8.
Process of specimen damage.
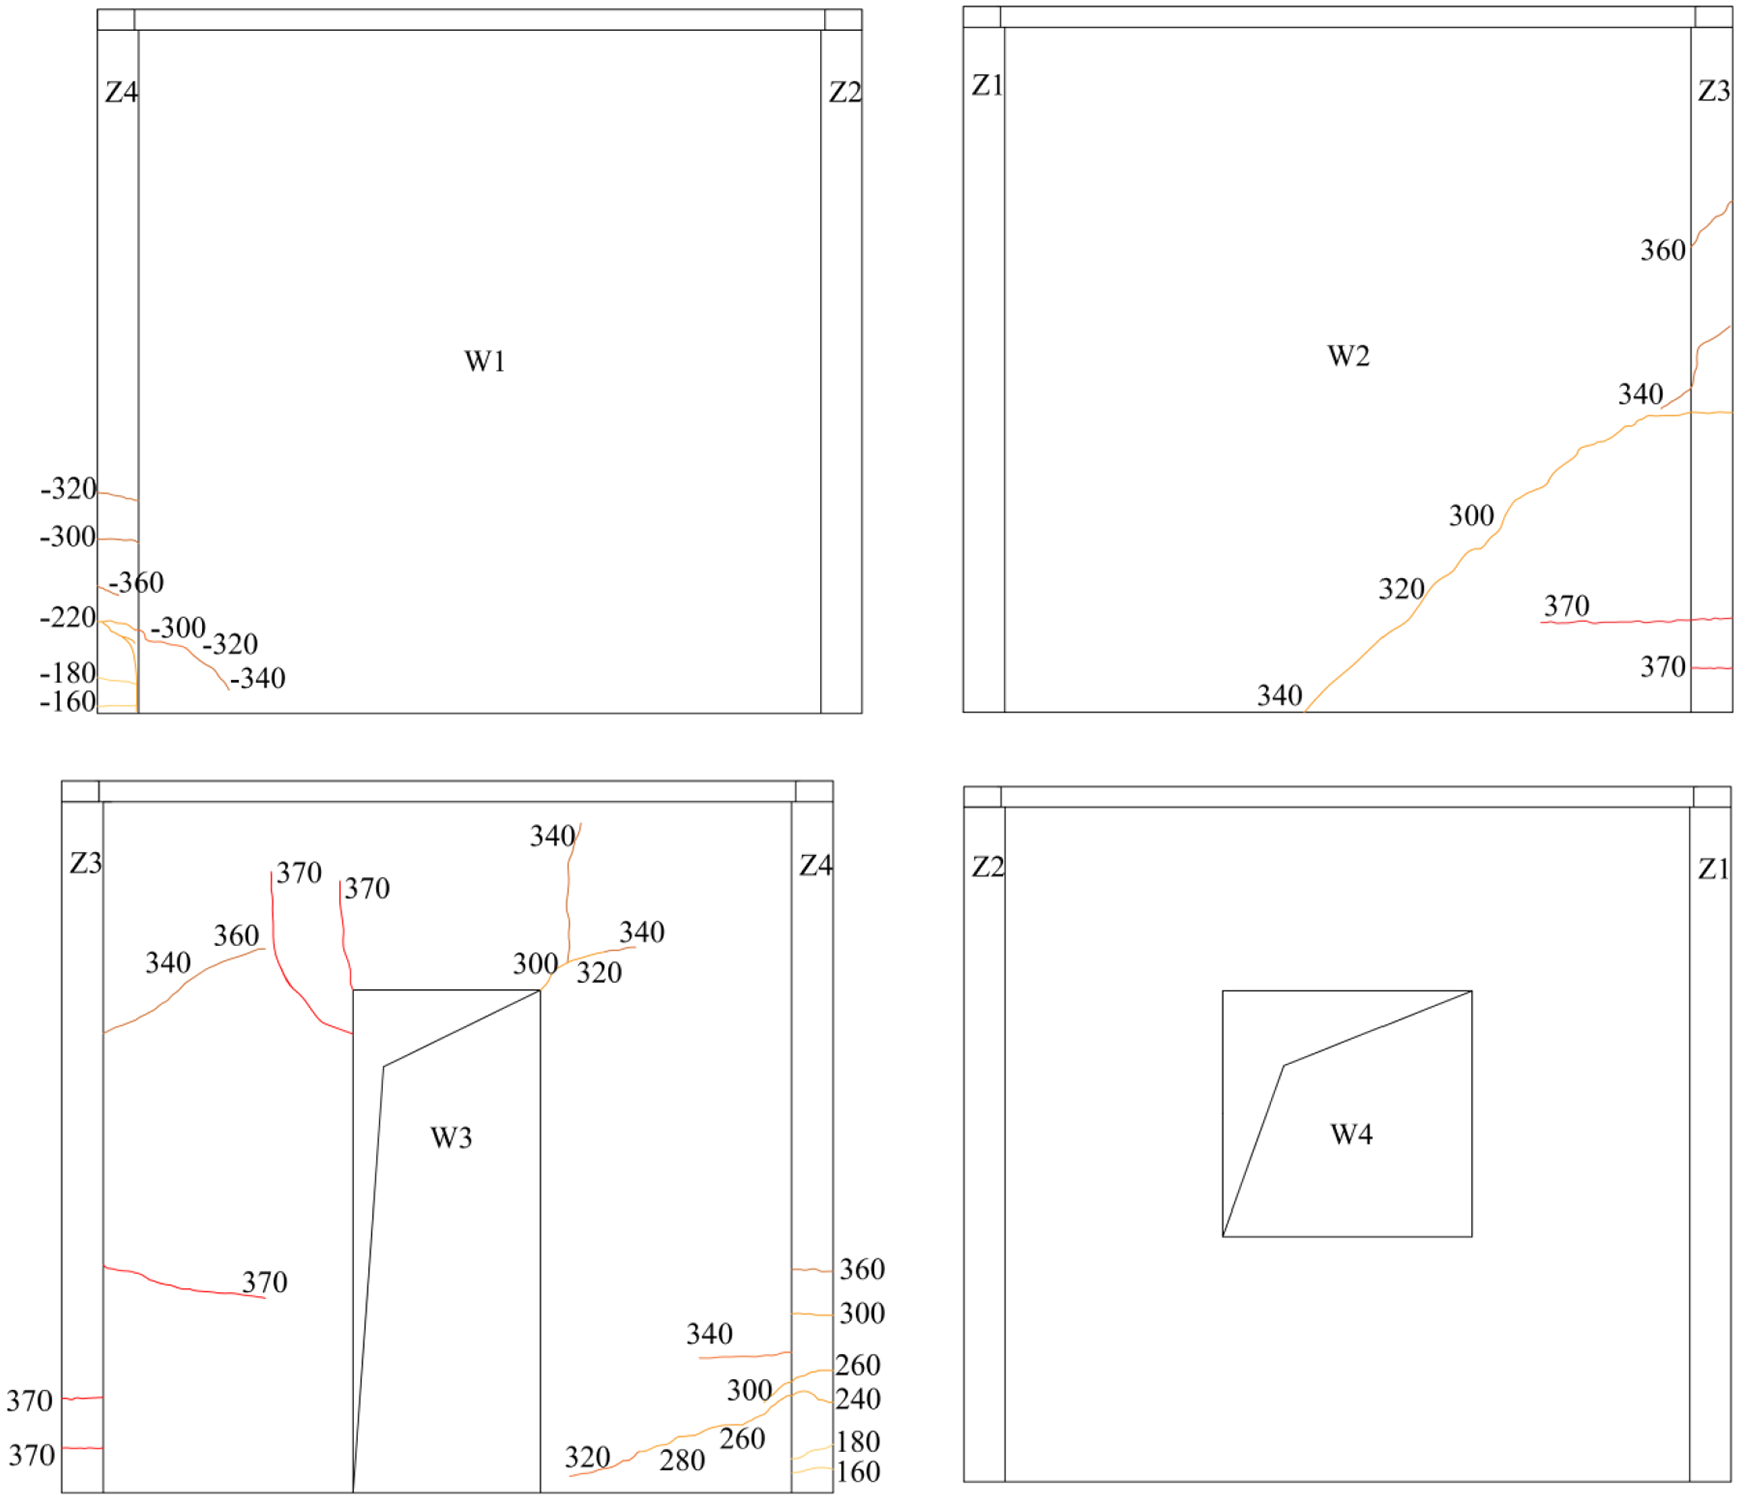
Growth and distribution of cracks of the four walls in the specimen.
Discussion
Ultimate capacity
The ultimate capacity of the specimen is measured to be 370 kN, which is 68% higher than the predicted ultimate capacity (220 kN). It satisfies the required load-bearing capacity, with a large safety margin, indicating that the predicted ultimate capacity is conservative. It is recommended that further study could be maintaining the safety and reducing cost of the wall by decreasing the strength of the concrete to some extent. For instance, the strength of the roof and wall should be reduced from the current 43.4 MPa to 25–30 MPa, while the foundation’s strength could be reduced from the current 53.7 MPa (the first pouring) and 51 MPa (the second pouring) to 30 MPa which may lead to cost reduction. The ratio of cracking load to ultimate load is 0.43, while the corresponding ratio of displacements is 0.22, which indicates that the specimen undergoes substantial deformation as it evolves from the cracking stage to the ultimate capacity stage, and a brittle damage is avoided. The specimen’s ratio of damage load to ultimate load is 0.81, while the corresponding ratio of displacements is 2.2, which indicates that the specimen still retains its load-bearing capacity and ductility to some extent after the ultimate load is reached.
Damage characteristics
The damage and crack growth processes of the sample are summarized below:
During damage of the specimen, the overall integrity of the building structure can be maintained, indicating that the building structure assembled based on cast-in-place concrete structural columns and ring beams exhibits a decent level of structural robustness.
The final damage of the specimen is found to be as follows: the concrete at the bottom of the structural column (Z1, Z2) on the loading side undergoes a marked cracking, with the reinforcing bars on the loading side within the column pulled apart. Subsequently, the walls on the loading side (W1, W2, W3) gradually detach from the foundation, the galvanized steel wires in the walls are pulled apart, with the specimen’s load-bearing capacity dropping to 85% of the ultimate capacity, which signifies the occurrence of full damage. Therefore, one needs to reinforce the connections among foundation, structural columns and walls during the design.
With the presence of both horizontal stepwise cyclic loading towards positive direction and the vertical loading, most cracks are inclined, being located at the middle and bottom sections of the wall as well as the opening on the loading side. This pattern indicates that the middle and bottom sections of the wall and the opening are the main load-bearing locations and the weak part of the whole structure (as shown in Figure 9). As such, these locations need to be reinforced during the design. Meanwhile, it is found that the growth of cracks in the wall is uneven and inadequate. To further improve the wall’s energy-dissipating ability, one needs to optimize the building structure based on LPCP.
The thermal insulation sandwich layer is not detached from the concrete layers on both sides, indicating that the various components of LPCP can function in a concerted manner, and the wallboard shows a decent overall integrity.
From the initial loading to the final damage, the specimen roughly undergoes five stages, namely elastic stage, cracking stage, yield stage, limit stage, and damage stage, which shows that the specimen undergoes significant change before the final damage, exhibiting a good ductility.

Fully damaged patterns of the four walls in the specimen.
Hysteresis curve and skeleton curve
Figure 10(a) shows the load–displacement curve (hysteresis curve) obtained from the simulated earthquake-induced cyclic loading. It can be seen in Figure 10(a) that during the initial loading, the load–displacement curve is roughly linear, while the residual deformation is insignificant, that is, the specimen is in elastic regime. As the horizontal load reaches 160 kN, cracks start to appear in the specimen, and residual deformation occurs. As a result, the load–displacement curve is transformed from a linear curve to a loop curve, that is, a hysteresis loop appears. This indicates that the specimen starts to dissipate the earthquake energy. With an increase of load, the number of cracks in the specimen keeps increasing, the residual deformation becomes increasingly pronounced, the area covered by the hysteresis loop gradually ramps up, and the hysteresis loop starts to exhibit a reversed S shape. A combination of these observations indicates that the specimen’s dissipation of seismic energy increases gradually and slippage occurs. As the ultimate load 370 kN is reached, the specimen’s load-bearing capacity starts decreasing, the area of hysteresis loop further increases, and the slippage becomes more pronounced. This trend continues to progress until the load-bearing capacity drops to 85% of the ultimate capacity, a point marking the occurrence of full damage. It can be observed from the hysteresis curve that the earthquake-induced deformation characteristics and energy-dissipation processes associated with the building structure based on LPCP highly resemble that of the shear wall structure with reinforcing bar concrete. Therefore, one can refer to the shear wall structure with reinforcing bar concrete for earthquake-resistant design.
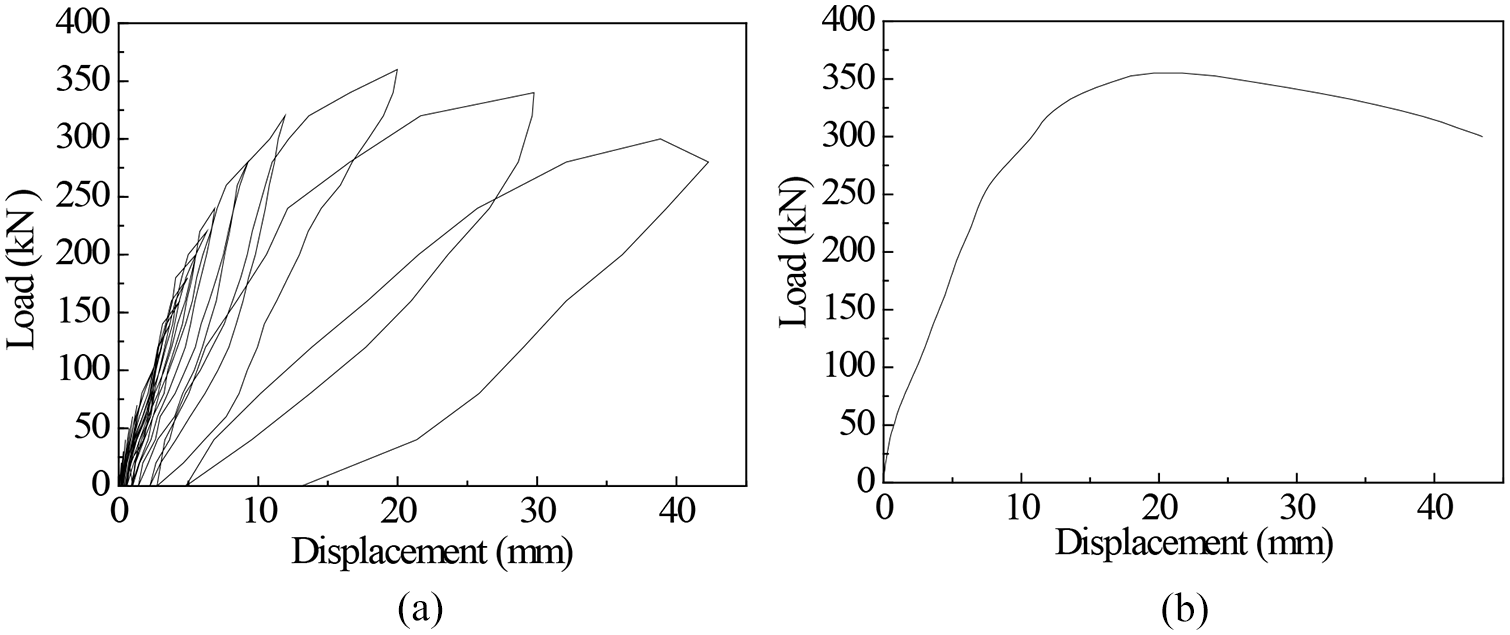
Hysteresis curve and hysteretic skeleton curve of specimen: (a) hysteresis curve and (b) hysteretic skeleton curve.
By drawing an envelope curve passing through the peak of each load hysteresis curve as derived from the cyclic loading process, one can obtain the skeleton curve of the specimen, as shown in Figure 10(b). Before cracks in the specimen appear, the skeleton curve is almost linear, corresponding to a large structural stiffness and the elastic state. As the cracks start to appear, the slope of the curve starts to decline, that is, the specimen’s horizontal displacement gradually increases for a given incremental load. As the ultimate load is reached, the specimen’s load-bearing capacity starts to drop all the way to 85% of the ultimate capacity, marking the occurrence of full damage. The decline curve is relatively shallow, indicating that the specimen, after the ultimate capacity is reached, still retains a portion of its load-bearing capacity and ductility.
Stiffness degradation curve
The specimen’s stiffness degradation curve is shown in Figure 11. The specimen’s stiffness degradation process mainly consists of three stages: (1) rapid decrease of stiffness stage, which corresponds to the process from the point with initial appearance of fine cracks in the concrete to the point with apparent cracks visible to naked eyes; the increase of displacement during this stage is relatively small, while the drop of stiffness is substantial (71%), that is, from 142.86 kN/mm to 41.42 kN/mm. (2) Moderate decrease of stiffness stage, which corresponds to the point where the specimen undergoes cracking to the point where the ultimate capacity is reached; during this stage, the decrease of stiffness becomes much smaller, that is, from 41.42 kN/mm to 18.03 kN/mm, a 12.6% decrease. (3) Slow decrease of stiffness stage, which corresponds to the point where the ultimate capacity is reached to the point where the full damage occurs; during this stage, the displacement is substantially raised, whereas the decrease of stiffness is small, that is, from 18.03 kN/mm to 6.90 kN/mm, a 7.8% decrease.
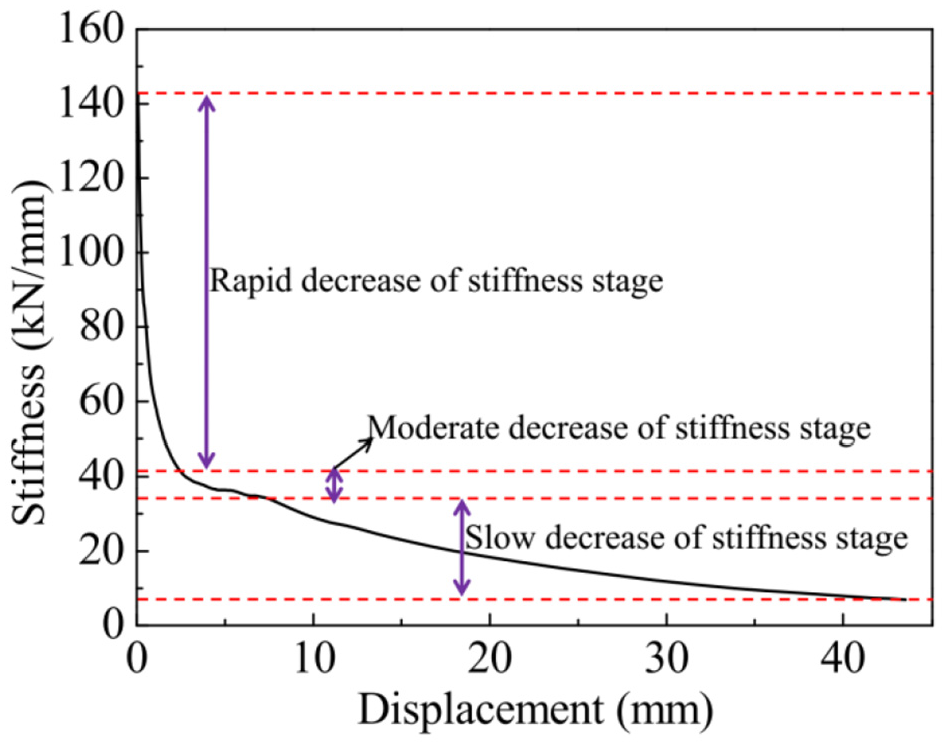
Stiffness degradation curve of specimen.
Ductility factor
The ductility factor μ denotes the ratio of maximum displacement Δ u to the yield displacement Δ y when specimen damage occurs, and is used here to assess the structural ductility. Due to the absence of an apparent yield point on the specimen’s skeleton curve (Figure 10(b)), one can use the generalized yield moment method (GYMM) to determine the yield point (Liu, 2007; Huang et al., 2018). Figure 12 outlines the key steps of this method: draw a tangential line OH going through the origin O, and draw a horizontal line that passes through the peak load at G; suppose these two lines intersect each other at point H; draw a perpendicular line through H, which intersects the skeleton curve at I; extend the line OI to cross the line HG at point H′; draw a perpendicular line through H′, which intersects the skeleton curve at point B, which is a decent approximation of the yield point. The yield load and displacement obtained from the aforementioned GYMM were 280 kN and 9.25 mm, respectively. And the maximum displacement was 43.48 mm as showed in Table 6. It is found through calculation that the specimen’s ductility factor is 4.7 according to dived the maximum displacement by the yield displacement, which satisfies the seismic regulation dictating that the concrete structural ductility factor should exceed 3. This indicates that the building structure based on LPCP has decent ductility.

Schematic diagram of generalized yield moment method.
Energy-dissipating ability
The specimen’s energy-dissipating ability can be analysed based on working index, which can be calculated using equation (1):

where Pi and Δi denote the peak load value and the corresponding displacement for the ith cyclic loading; Py and Δy denote the yield load and displacement values, respectively (Jiang and Gu, 2007; Huang, 2013). It is found through calculation that the specimen’s working index is 20.62, which is much larger than those of other composite wallboard structures, for example, the fibre gypsum board composite wall filled with concrete with a working index of 7–8. One can thereby conclude that the newly proposed building structure based on LPCP can deliver a strong energy-dissipating effect.
Conclusion
This study investigated the overall seismic performance of the LPCP building structure which is formed by the connection of cast-in-place concrete ring beam and column based on the results of the previous studies, and obtained the conclusions as follow:
The structure has a high load-bearing capacity, decent ductility and strong energy-dissipating ability, allowing it satisfies the seismic performance requirements concerning China’s rural building structure. Meanwhile, the construction workflow based on factory prefabrication and field assembly is conductive to energy conservation, making this technology particularly promising.
The present building structure assembled based on cast-in-place concrete structural columns and ring beams exhibit good structural robustness. Meanwhile, during the loading process, various components in the LPCP can function in a concerted manner, the wall panel has strong integrity.
The middle and lower sections of the wall and its connection with the foundation are the key load-bearing location and the weak part of the entire structure. Hence, it recommends to reinforce these places during the design.
The seismic performance of the LPCP structure is conservative for rural building, it can be considered to reduce the weight and size of the components to meet the transportation and installation conditions of rural areas. On the contrary, the dry connection method can be used to replace the connection method of cast-in-place to lower environmental impact.
Future work
The prefabricated concrete wall panels currently suffer from a series of issues, including the large size and weight, a stringent requirement on the transportation and installation, and high sensitivity to the rural areas road condition, transportation vehicles, mechanical equipment and construction technology. Future research needs to focus on reducing the weight and size of the LPCP so as to faciliate the transportation in the rural area.
The interconnection of LPCP parts is critical for ensuring the seismic performance of the overall building structure. Hence, future research will study the impact of various interconnection methods on the seismic performance of the LPCP building structures so as to meet the relevant regulations in the rural area.
The stepwise cyclic loading towards positive direction used in the present experiments cannot authentically mimic the actual earthquake condition. It is thereby advised to conduct improved seismic performance experiments if possible that can more authentically reflect the impact of an earthquake, for example, shaking table test.
Footnotes
Declaration of Conflicting Interests
The author(s) declared no potential conflicts of interest with respect to the research, authorship and/or publication of this article.
Funding
The author(s) disclosed receipt of the following financial support for the research, authorship and/or publication of this article: The author would like to thank for the financial sponsorship of Southwest Jiaotong University, which provided the first fund to open this research subject (grant no. 10101X10096060). This project has also been supported financially by the Project of Young Scientists Fund (grant nos. 51808454 and 51508472), the Science and Technology Innovation Project of the Fundamental Research Funds for the Central Universities (grant no. 10101B10096033) and the Science and Technology Citizen-Benefitting Project of Chengdu City (grant no. 2015-HM01-00063-SF).
