



Abstract
In this article, the static shear behavior of large-headed studs embedded in ultra-high-performance concrete was investigated by push-out test and numerical analysis. A total of nine push-out specimens with single and grouped studs embedded in ultra-high-performance concrete and normal strength concrete slabs were tested. In the testing process, only shank failure appeared without cracks occurring on the surface of ultra-high-performance concrete slab when the steel–ultra-high-performance concrete specimens reached ultimate shear capacity. The shear capacity of specimens with large studs embedded in ultra-high-performance concrete slab increased by 10.6% compared those in normal concrete, and the current design codes such as Eurocode4, AASHTO LFRD 2014, and GB50017-2003 all underestimate the shear capacity of such kind of steel–ultra-high-performance concrete composite structures according to experimental results. Numerical models were established using ABAQUS with introducing damage plasticity material model. The influence of stud diameter, concrete strength, thickness of clear cover, and spacing of studs on the static shear behavior was thoroughly investigated via parametric analysis. Based on the experimental and numerical analysis, the existence of wedge block and the decrease of axis force are beneficial for improving the shear capacity of stud shear connectors.
Keywords
Introduction
In steel–concrete composite structures, shear connector between concrete slab and steel beam can not only provide effective shear connection but also distribute large horizontal force in the slabs within such structures (Hawkins and Mitchell, 1984). Currently, different types of shear connectors, including headed studs, perfobond ribs, waveform strips, and so on, have been used in the steel–concrete composite structures (Ahn et al., 2010; Cândido et al., 2010; Jeong et al., 2009; Shariati et al., 2012). The headed stud is the most widely used connector in practical application due to its convenient installation. It should be noted that its shear connecting effect was contributed by many factors, such as headed studs’ dimension, material property, distribution spacing, and mechanical properties of concrete slab and so on (An and Cederwall, 1996; Nguyen and Kim, 2009; Qi et al., 2017, 2019).
Previous researches focus on investigating headed studs with diameter smaller than 22 mm used as shear connectors in steel–concrete composite structure. The calculation methods for stud shear strength have been specified in current design codes (Eurocode4 (EC4); AASHTO LRFD, 2014; MOHURD, 2003). However, it should be noted that small-headed studs have some disadvantages in application, such as problems of group studs effect, safety of construction, and large amount of welding work. Increasing the stud diameter can significantly improve the shear capacity and simultaneously reduce total number of studs and welding time (Lee et al., 2005; Shim et al., 2004). Some studies have been conducted on investigating the shear behavior of large-headed stud embedded in normal strength concrete (NSC) slab via experimental test and numerical analysis (Badie et al., 2002; Hanswille, 2002; Shim et al., 2001; Topkaya et al., 2004). Results show that longitudinal splitting cracks tend to appear on the concrete slab since the transverse splitting force in concrete slab below the large stud is larger than the small-headed stud. In addition, with respect to normal strength concrete (NSC) slabs, durability problems such as freeze–thaw cycles and various chemical problems still remain as a big challenge up to now (Gheitasi and Harris, 2015; Lachemi et al., 2007; Umphrey et al., 2007; Yang et al., 2018).
Ultra-high-performance concrete (UHPC), as one kind of composite materials, has much better mechanical properties compared with NSC, such as higher compressive strength, tensile strength, static and dynamic modulus of elasticity and durability (Kim et al., 2015; Magureanu et al., 2012; Qi et al., 2016). It has been employed in steel–concrete composite structures to enhance structural stiffness and reduce stress level under service vehicle loads in recent years. Afterward, it can significantly reduce the risk of fatigue cracking during the life cycle of such structure (Cao et al., 2017; Dieng et al., 2013; Pan et al., 2016; Wang et al., 2017).
Some researches have focused on studying the shear behavior of headed stud embedded in the UHPC slab. Cao et al. (2017) investigated the static and fatigue behavior of short-headed studs with diameter of 13 mm embedded in a thin UHPC layer. The test results showed that shank failure caused the failure of specimens. Kim et al. (2015) investigated the static behavior of headed studs with diameters of 16 and 22 mm via push-out test; the experimental results indicated that no splitting cracks were observed on the UHPC surface, and the shear capacity of the structure was improved. Luo et al. (2015a, 2015b) depicted that embedding headed stud in steel fiber–reinforced cementitious composites (SFRCC) can obviously improve the mechanical behavior of the structure through test and numerical analysis. Kruszewski et al. (2018) investigated the push-out behavior of headed shear studs welded on the surface of thin plates and embedded in UHPC through casting. The experimental results indicated that the shear capacity was higher than the value predicted by design codes such as AASHTO and EC4.
According to present researches, it could be found that most of these studies mainly focus on small-headed studs embedded in the UHPC slabs. However, the systematic research on the shear behavior of single and grouped studs with diameters larger than 25 mm embedded in UHPC slabs is seldom studied in addition to some previous studies by the authors (Wang et al., 2018, 2019). Moreover, although the shear capacity was improved with headed stud embedded in the UHPC, the improving mechanism on the shear capacity in steel–UHPC composite structures has not been explained clearly in previous researches. Owing to the lack of comprehensive research, large-headed stud as shear connectors are rarely used in the steel–UHPC composite structures.
In this study, three groups of push-out specimens for single and group large-headed studs embedded in UHPC were carried out. Failure modes and shear behavior including shear bearing capacity and load-slip curve are examined and analyzed. Numerical analysis was performed for further understanding the effect of main parameters on the shear behavior of large stud as shear connectors in UHPC and interaction mechanism between the headed studs and UHPC. According to experimental and numerical analysis results, the shear bearing capacity improvement mechanism of large-headed stud embedded in UHPC was clarified.
Push-out tests
Test setup
Nine push-out specimens with large studs were prepared in the laboratory according to GB500017-2003 (MOHURD, 2003) and the fabrication details of push-out test specimens are shown in Figure 1. The large-headed studs embedded in NSC and UHPC slabs were designed. The information of specimens was shown in Table 1.
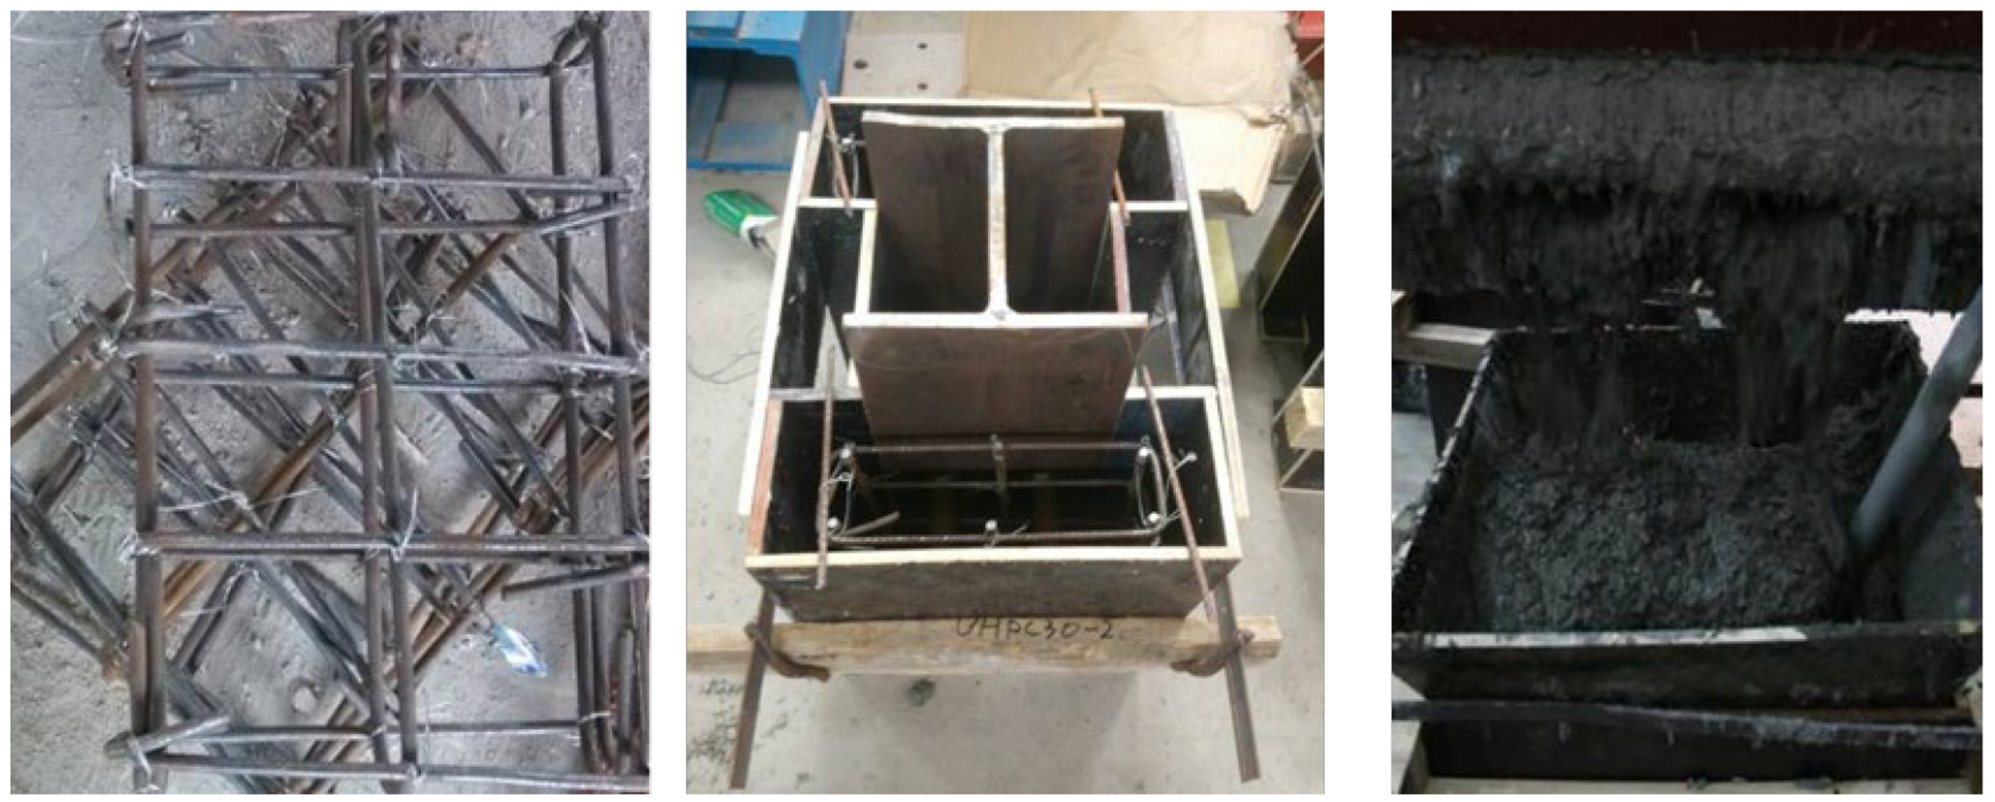
Fabrication of push-out test specimens.
Test parameters and specimen dimensions.

b: concrete slab thickness; c: concrete cover thickness; hstud: height of the stud; dstud: diameter of the stud, S = single headed stud, G = grouped headed stud; NSC: normal strength concrete; UHPC: ultra-high-performance concrete.
For specimens of U30G, six studs were welded on each steel surface. The height, width, and thickness of concrete slab were 1150 mm, 660 mm, and 150 mm, respectively. With respect to specimens U30S and N30S, only two studs were welded on each steel surface to connect slabs and the steel beam. All the concrete slabs of the push-out specimens were reinforced by hot-rolled plain bars with yield strength of 400 MPa. The longitudinal reinforcement ratio was 0.785% and the bar diameter was 10 mm. The lateral reinforcement with diameter of 8 mm provided with central spacing 110 mm resulting in a reinforcement ratio of 0.67%. It should be noted that the stud shank diameter used in this study was 30 mm which was larger than the normal stud, and the aspect ratio of them was 4. The measured yield strength and ultimate tensile strength of stud were 400.4 and 520.2 MPa, respectively, which meet the Type B requirements specified in AWS.D 1.1 (Code-Steel, 2000). The steel beam manufactured using H steel with the dimension of 250 mm × 250 mm × 14 mm × 14 mm and the yield strength was 400 MPa. Dimensions and more details of specimens were shown in Figure 2 and Table 1.

Details of specimens: (a) single large stud; (b) group large stud.
The mixture details of UHPC and normal strength concrete were listed in Table 2. Broken stone with diameters ranged from 5 mm to 8 mm and the river sand were added in UHPC in order to decrease the shrinkage and cost. Straight and end-hooked steel fibers of length 13 mm were mixed together with 2% volume fraction. The normal strength concrete (NSC) does not contain the steel fibers. The compressive strength, tensile strength, and modulus of elasticity of UHPC and NSC were listed in Table 3.
Composition of UHPC and NSC.
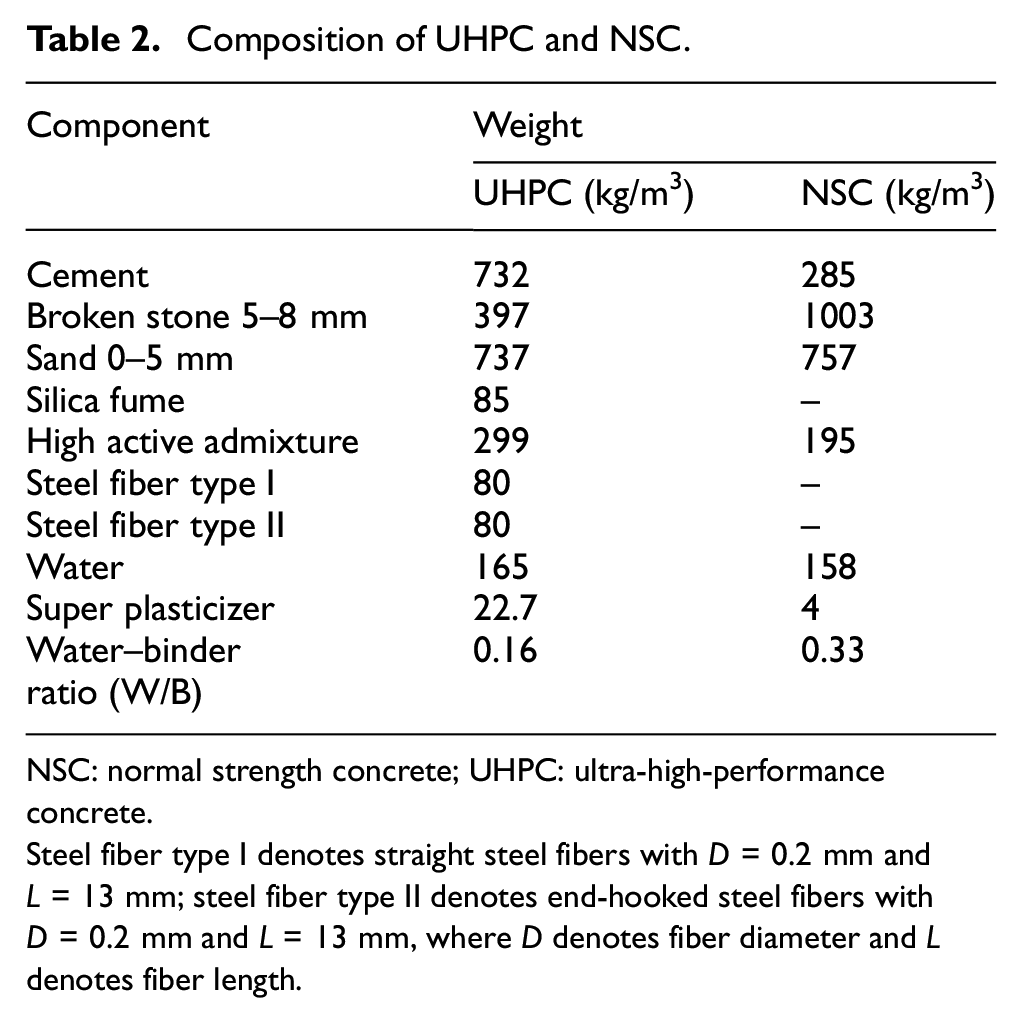
NSC: normal strength concrete; UHPC: ultra-high-performance concrete.
Steel fiber type I denotes straight steel fibers with D = 0.2 mm and L = 13 mm; steel fiber type II denotes end-hooked steel fibers with D = 0.2 mm and L = 13 mm, where D denotes fiber diameter and L denotes fiber length.
Material properties of concrete.
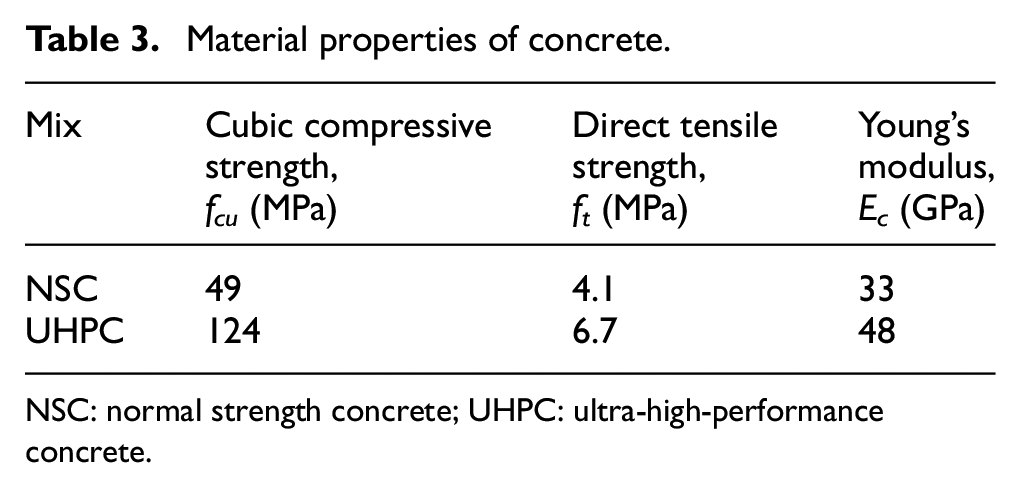
NSC: normal strength concrete; UHPC: ultra-high-performance concrete.
Each push-out specimens was equipped with three displacement transducers with measuring capacity of 100 mm. The displacement transducers were used to record the slip and vertical separation between the concrete slab and steel profile as shown in Figure 3. The specimens were loaded using an electrohydraulic servo pressure testing machine with capacity of 5000 kN. Aiming at avoiding stress concentration, a steel plate was set on the top of the specimens. A preloading was imposed before formal loading process to ensure the function of the test machine. The displacement control was adopted in the testing process and the loading ratio was set to 0.005 mm/s.
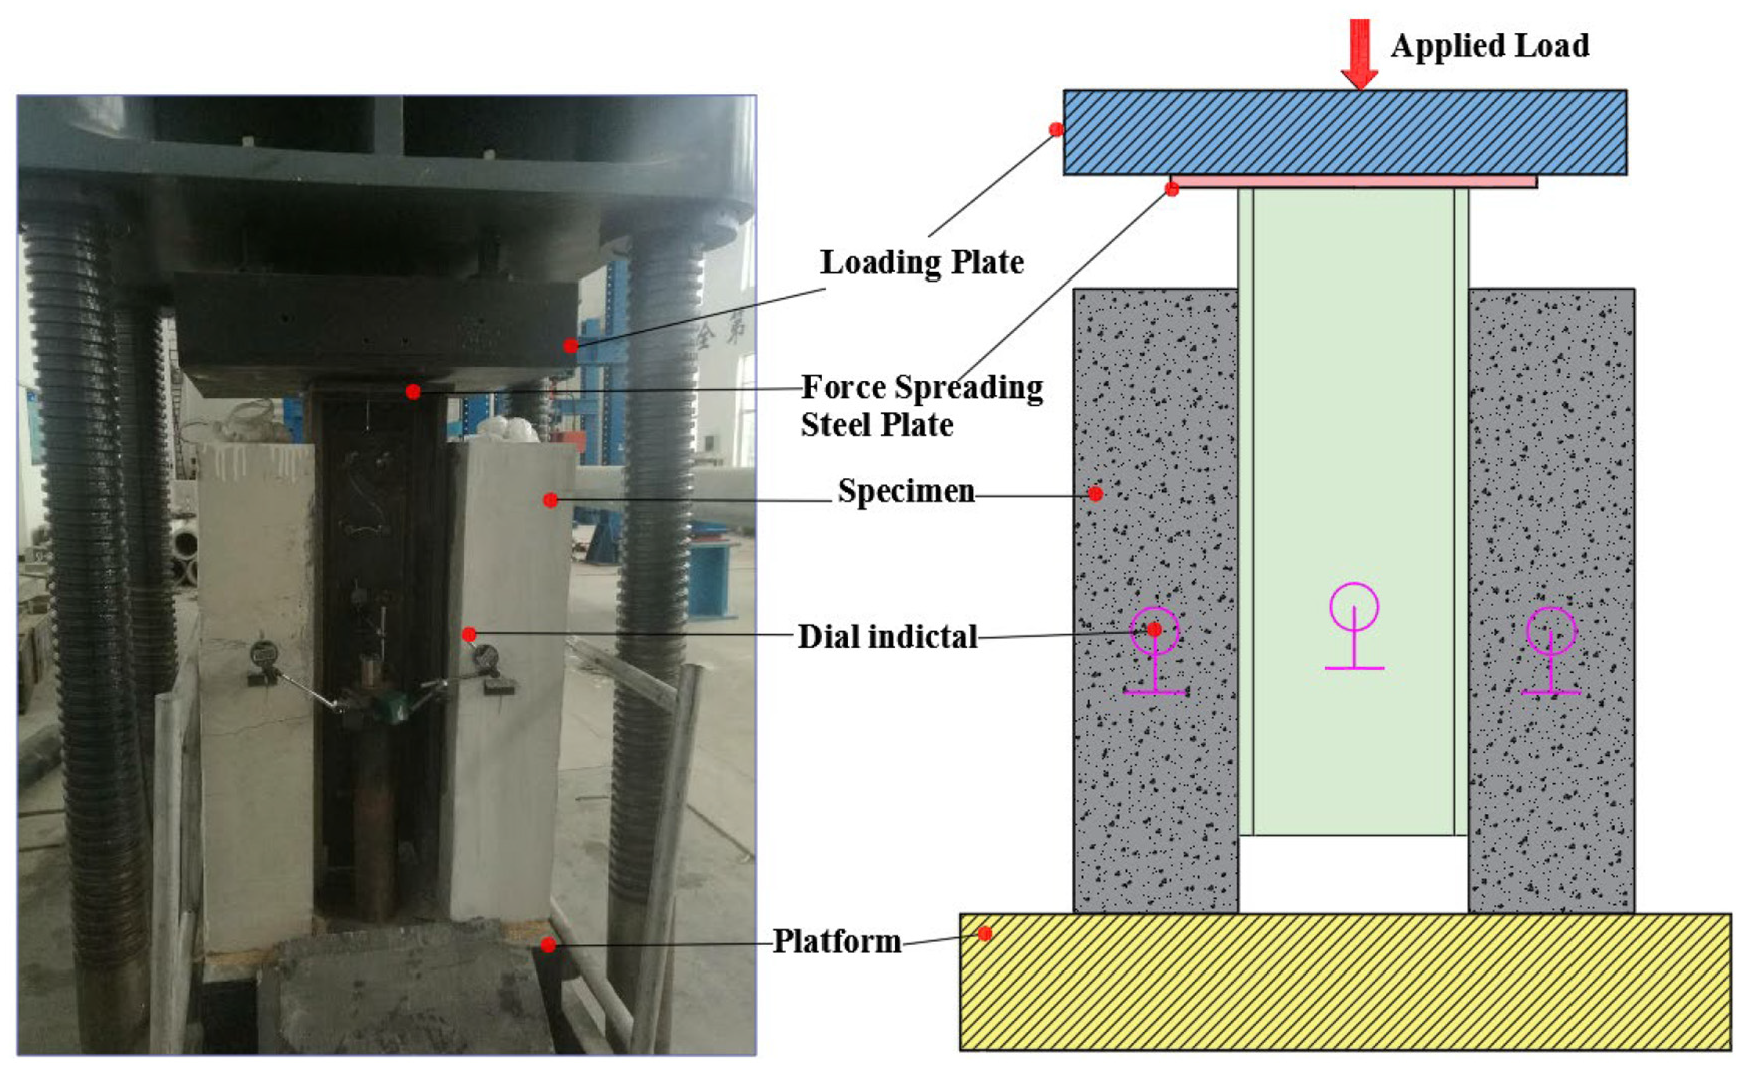
Push-out test setup.
Experimental results
Failure mode and crack pattern
Combined failure of the stud and concrete slab occurred for specimens of N30S and the crack of slab initiated around the shank hole. With increasing of applied load, the micro crack around the shank hole extended to splitting cracks and the diagonal cracks appear on the slab surface obviously after the test was ended, as shown in Figure 4(a). Different from N30S, only shank failure occurred for specimens of U30S and U30G and only UHPC spalling appeared on the surface of UHPC slab as shown in Figure 4(b) and (c). Based on the failure mode, it can be inferred that the normal strength concrete slab cannot bear the shear force transferred by large-headed studs to concrete slab, when the cover thickness is less than 30 mm. Because the transverse splitting force below the stud increased as the stud diameter increased. However, it is obvious that larger tensile strength of UHPC provides more resistance to splitting cracks than normal strength concrete.
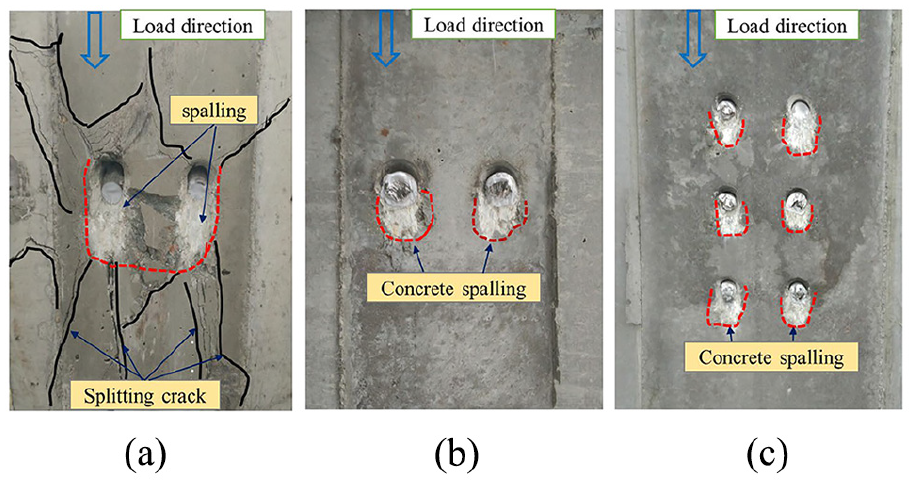
Failure mode of test specimens: (a) N30S; (b) U30S; (c) U30G.
Moreover, the superior mechanical properties of UHPC, such as the high compressive and tensile strength, high modulus elasticity, are beneficial for resisting the splitting force.
Shear capacity
The experimental results of all push-out test specimens are summarized in Table 4. Comparing specimens N30S with U30S, it can be found that the shear capacity of specimen N30S is 12% lower than that of U30S. The phenomenon indicated that the shear strength increased when the studs were embedded in UHPC due to the high strength and modulus elasticity of UHPC. The shear capacity of U30G is 2.6 % lower than U30S, indicating that the grouped effect can be neglected in this experiment.
Summary of test results.
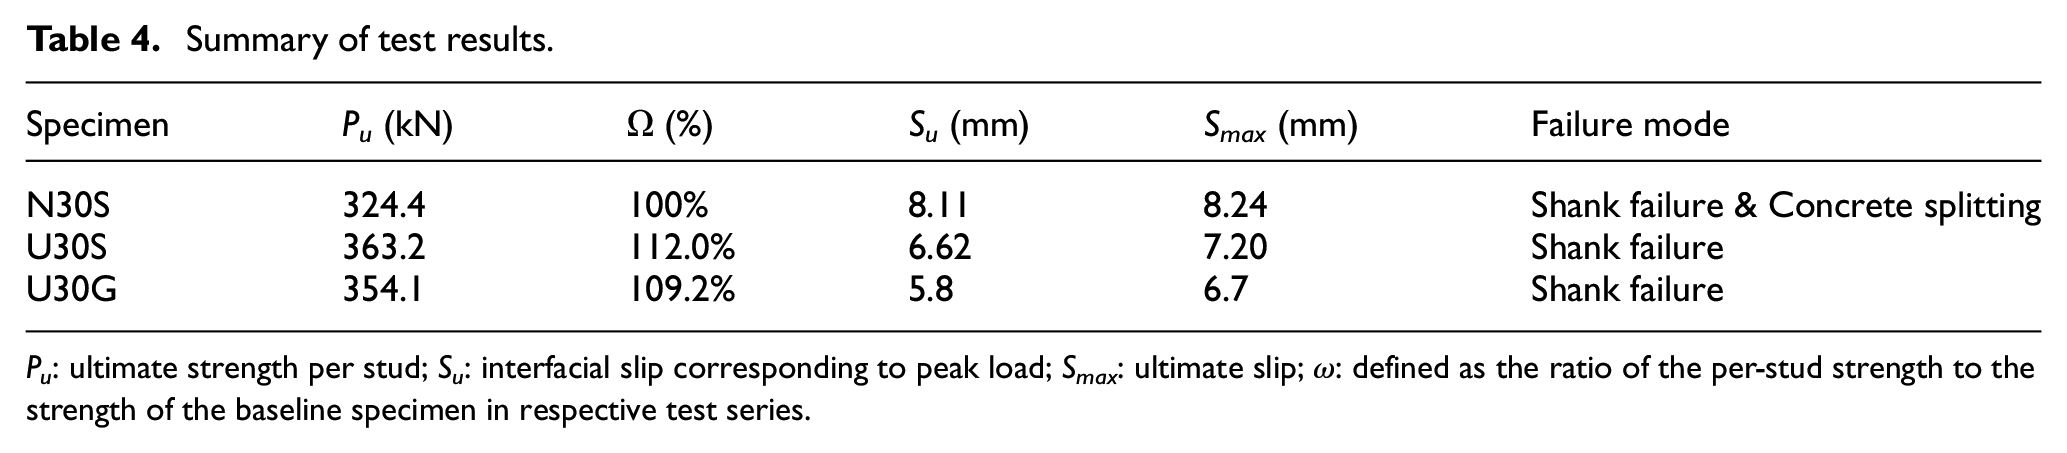
Pu: ultimate strength per stud; Su: interfacial slip corresponding to peak load; Smax: ultimate slip; ω: defined as the ratio of the per-stud strength to the strength of the baseline specimen in respective test series.
Shear load-slip curve
The shear load-slip curves characterized the static shear behavior of push-out test specimens, including the shear stiffness, maximum strength, structural ductility, and so on. The load-slip curves of all specimens are plotted in Figure 5. It could be observed that the test curves showed ductile plastic plateaus before fracture of specimens due to the studs fracture. The ultimate slip of N30S is 8.11 mm which is 12.6% and 21% higher than that of U30S and U30G, respectively. Moreover, observing from the secant slope of load-slip curve in elastic stage, it was found that the shear stiffness obviously increased when the large-headed stud embedded in UHPC. In addition, it should be noted that the shear stiffness of U30G is also obviously smaller than U30S indicating the effect of group studs on shear stiffness should be noted.

Load-slip curves of push-out specimens: (a) load-slip of N30S; (b) load-slip of U30S; (c) load-slip of U30SG; (d) average load-slip of N30S, U30S, and U30SG.
Numerical analysis
General
To obtain accurate results from numerical analysis, all components in the shear connection were assumed to be properly molded. ABAQUS explicit module was used to model the push-out specimens considering the characteristic of material, interaction, and geometric non-linearity (Han et al., 2017). Detailed descriptions were outlined in the following sub-section and the reliability and accuracy were verified by the test results.
Material constitution
Concrete
The characteristics of compressive strength and tensile strength of UHPC were taken into consideration in numerical analysis. As shown in Figure 6, the UHPC material constitutive model was governed by equations (1) and (2) according to Qi et al. (2018)

where

where
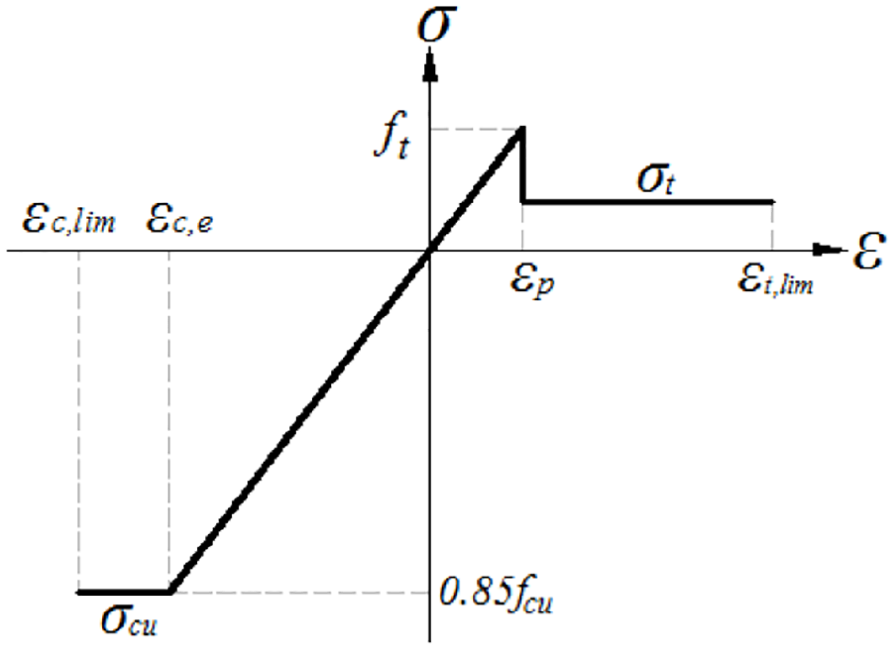
The constitutive model of UHPC.
Damage plasticity model (CDP) was introduced in the advanced numerical analysis. In CDP model, damage variable can be defined by equations (3) and (4). The damage threshold of UHPC under compression and tension were assumed to appear when the peak stresses were reached


where
Steel beam, reinforcement, and shear studs
The elastoplastic model recommended by Han et al. (2017) was selected to model the stress–strain relationship of the steel beam, reinforcement, and large studs. Considering the mechanical characteristics of steel, the compression and tension behavior were assumed to be similar. The elastic modulus of studs, reinforcement, and steel beam is 195, 195, and 210 GPa, respectively, and the yield strength is 500, 400, and 400 MPa respectively.
Model setup and boundary condition
The finite element analysis (FEA) models were built based on the push-out specimens and some slight simplifications were made. As shown in Figure 7, the push-out FEA model was accurate for biaxial symmetrical specimens. C3D8R was used to simulate the concrete, studs, and steel plate, while T3D2 was selected to simulate the rebar embedded in the UHPC slab. The general contact algorithm was used to define the normal behavior and tangential behavior, and the friction coefficient of 0.4 was set for surface between the stud and UHPC slab according to Xu and Liu (2016). The friction force between the steel beam and UHPC slab was not taken into account in this study. The mesh scale for concrete slab, steel beam, and stud was different; the overall mesh scale was 25 mm approximately, whereas the smallest mesh scale was 3 mm (Nguyen and Kim, 2009).

Parametrical FEA push-out model.
Concerning the boundary condition, the bottom concrete surface designed as surface 1 was restrained from moving all three directions. The symmetry boundary condition was applied to surface 2. Surface 2 was taken as symmetric in Z axis indicating that all the nodes located on this surface should be constrained from moving in Z direction. The uniaxial displacement load along Y direction was applied to all nodes belonging to the load surface. All nodes of reinforcement element were tied to related nodes of concrete elements. The loading rate selected in the FEA was around 0.2 mm/s according to Xu and Sugiura (2014).
Analysis reliability
Considering the real situation such as material constitution, loading method, and boundary condition, the verification study was carried out based on the push-out specimens. The analysis model has good convergence because of good mesh quality, reasonable incremental step, and proper contact condition. Comparing the load-slip curve acquired from the FE analysis with the experimental results, it can be found that the numerical results show good agreement with the test results as presented in Figure 8. Due to the reliable numerical analysis, the parametric analysis can be conducted based on the proposed model in this study.
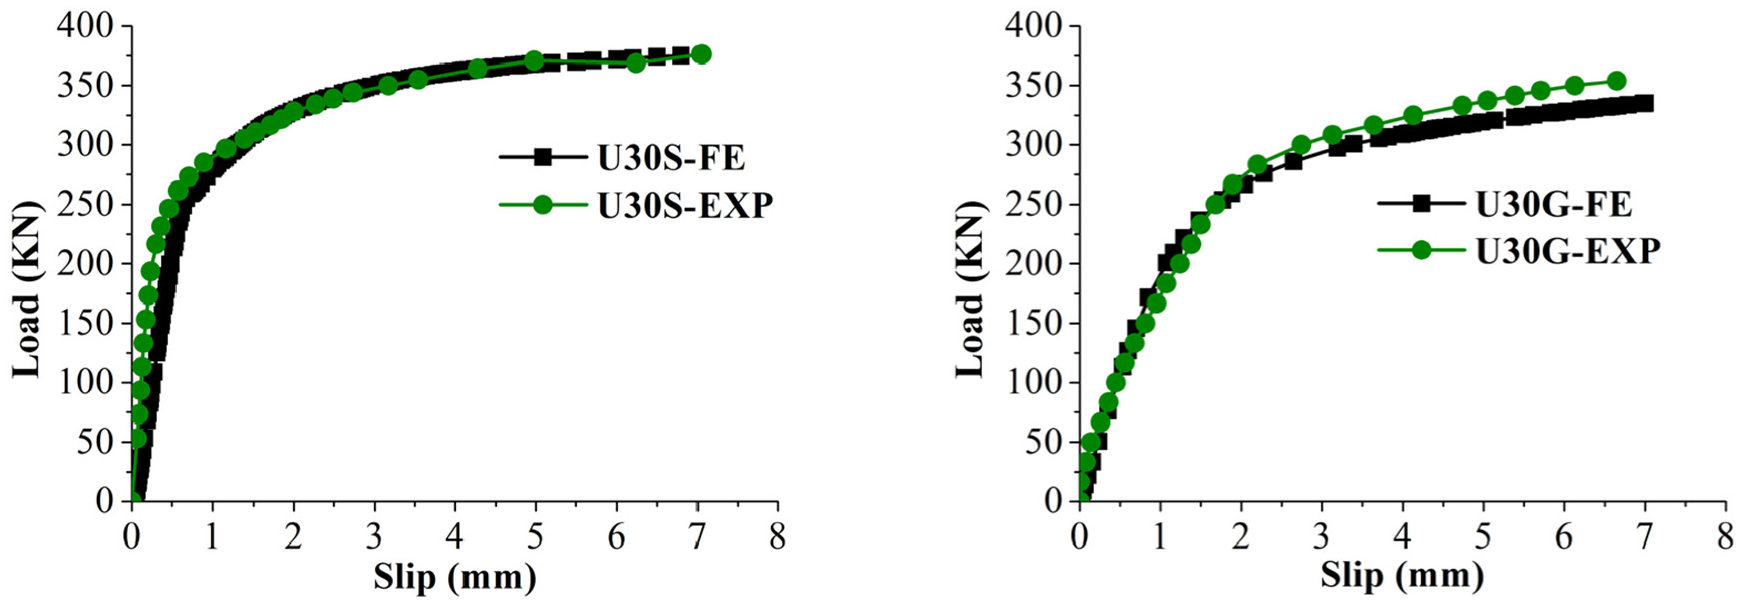
Comparison of the FEA and test results.
Because of the good grid quality, reasonable incremental step setting, and correct contact condition setting, the analysis model has good convergence.
Parametric study
Crucial parameters including compressive strength of UHPC, stud diameter, cover thickness over the stud head, and spacing in the direction transverse to the shear force were considered in parametric study. In the numerical analysis, the material of steel beam and studs were identical to those in experimental test, and elasticity modulus and tensile strength of UHPC were set according to the FHWA-HRT-06-103 (Graybeal, 2006).
Concrete strength
The concrete strength varied from 100 MPa to 200 MPa was arranged in order to investigate the contribution of concrete strength to the shear behavior of steel–UHPC composite structure. Figure 9 shows the ultimate shear capacity per stud of specimens with different concrete strengths. It can be seen that the concrete strength has negligible influence on the shear capacity when the stud diameter was smaller than 30 mm, whereas the influence of concrete on the shear capacity should not be neglected when the stud diameter is larger than 30 mm.
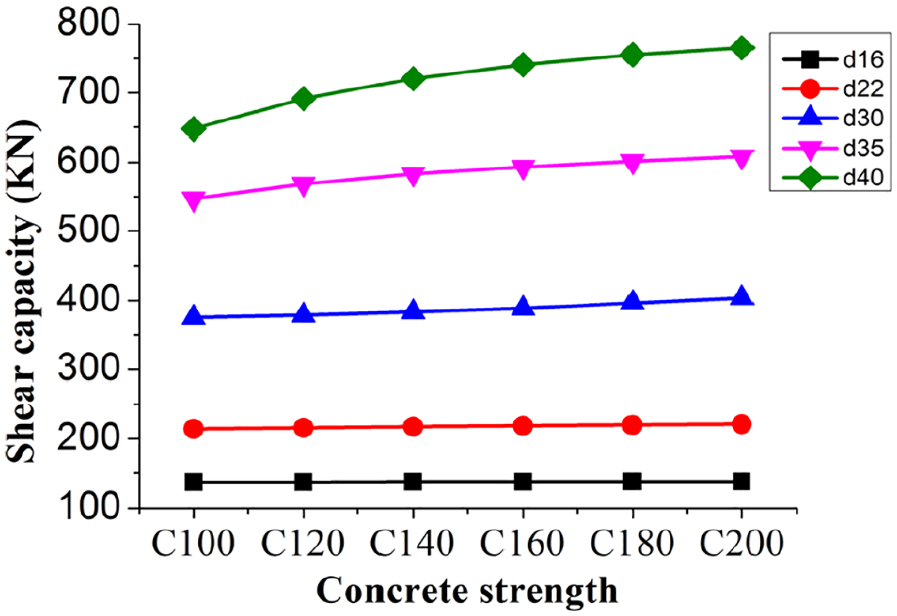
The influence of concrete strength on Shear capacity per stud.
Stud diameter
Generally speaking, stud diameter as one important parameter influences not only the shear capacity but also the shear stiffness. The diameter of studs ranged from 16 to 40 mm was investigated in the study, and the calculated ultimate shear capacity per stud was presented in Figure 10. It can be seen that the ultimate shear capacity increased nearly in proportion to the increasing of stud diameter, and the ultimate shear capacity increased by nearly 370% when stud diameter increased from 16 to 30 mm. Test results acquired in this study is similar to the conclusion obtained by Ding et al. (2017).
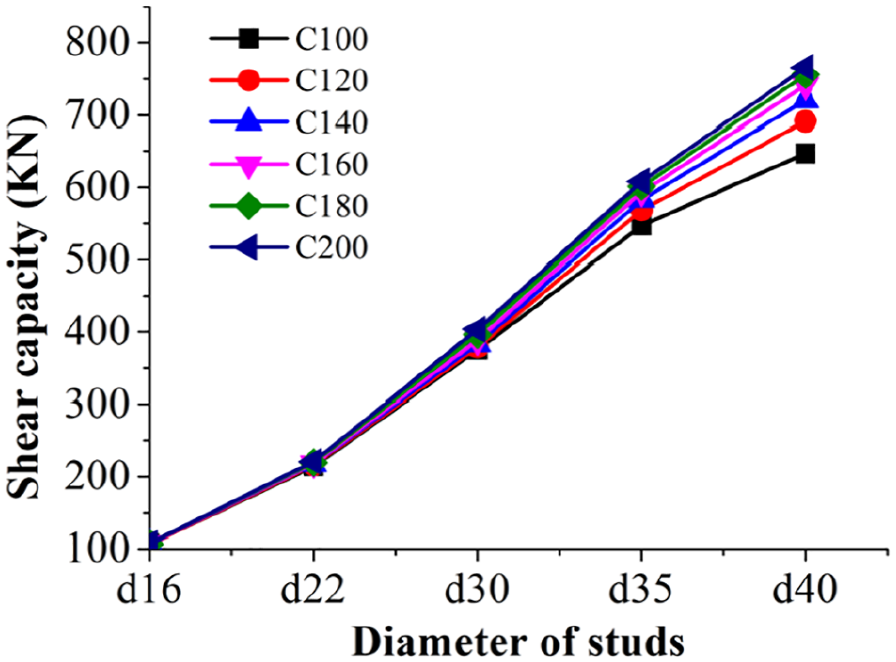
The influence of stud diameter on Shear capacity per stud.
Cover over the headed stud
With respect to steel–concrete structure, the cover over the headed stud (clear cover) is important to (a) prevent the chlorides penetrating it and then insulate the studs to the air, to (b) act as fire protection coating, and to (c) prevent the spalling of concrete. The numerical analysis (see Figure 11) was performed to investigate the shear behavior of stud with the clear cover of 5, 10, and 15 mm considering the influence of the stud diameter and concrete strength. The clear cover has no obvious influence on the shear capacity under different stud diameter and concrete strength. Thus, it is believed that the clear cover over shear connectors tends to act as protection in steel–UHPC composite structure. It is recommended that the value of clear cover should not be less than the specified value in current design codes with consideration of durability of the structure.
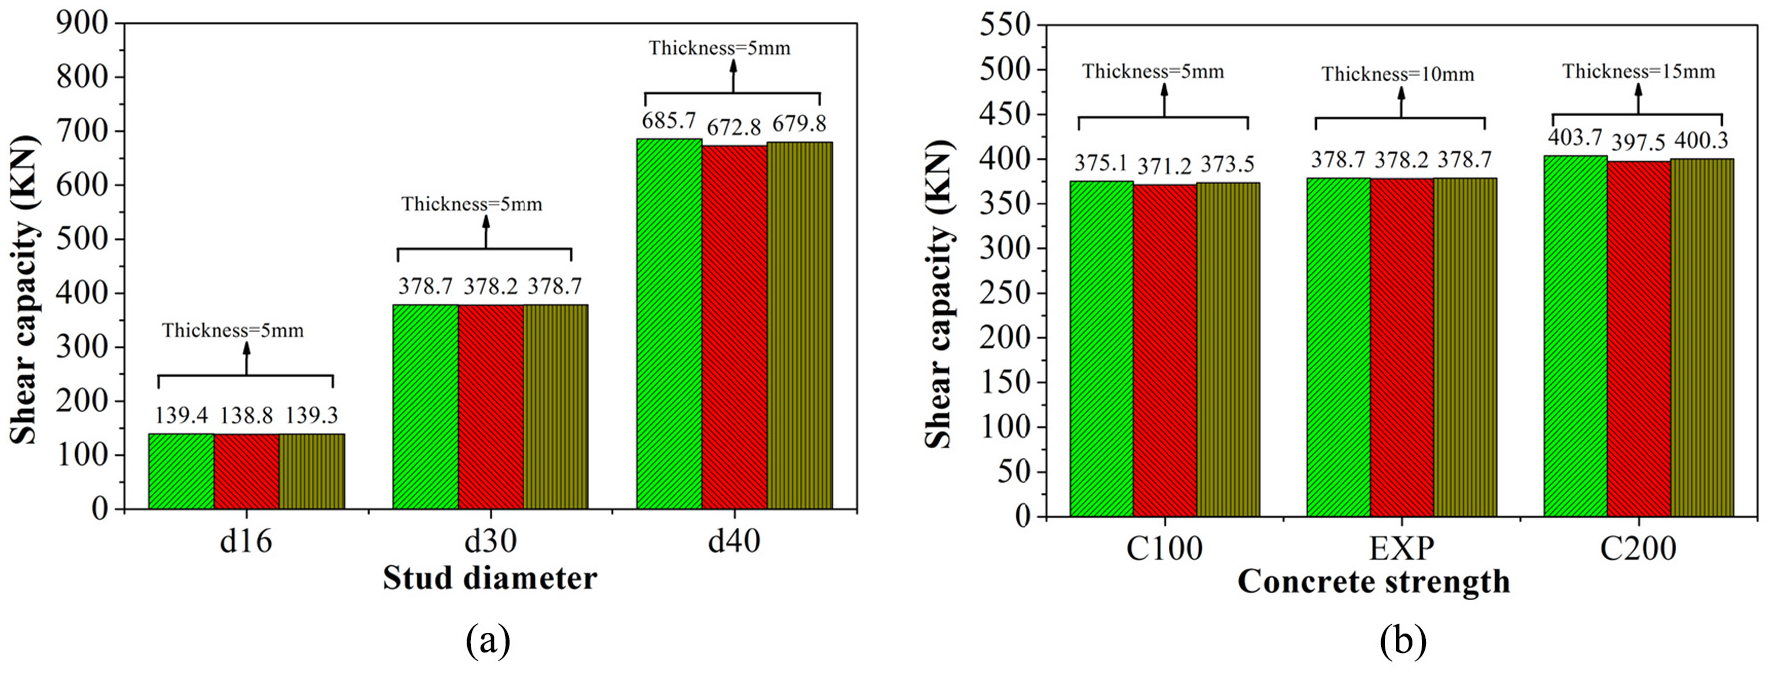
The influence of thickness of clear cover on Shear capacity per stud: (a) the influence under different stud diameter; (b) the influence under different concrete strength.
Spacing in the direction transverse to the shear force
The spacing of studs in the direction transverse to the shear force specified in EC4 is larger than 2.5 d for the normal steel–concrete composite structure. Parametric analysis was carried out on the spacing of 2.5 d and 4 d. It is found that load-slip curves under two different spacing are similar as shown in Figure 12, and the difference of maximum stress distribution of UHPC slab under the spacing of 2.5 d and 4 d is small as presented in Figure 13. Thus, it can be inferred that the specification in EC4 on the spacing in the direction transverse to the shear force is suitable for steel–UHPC composite structure.
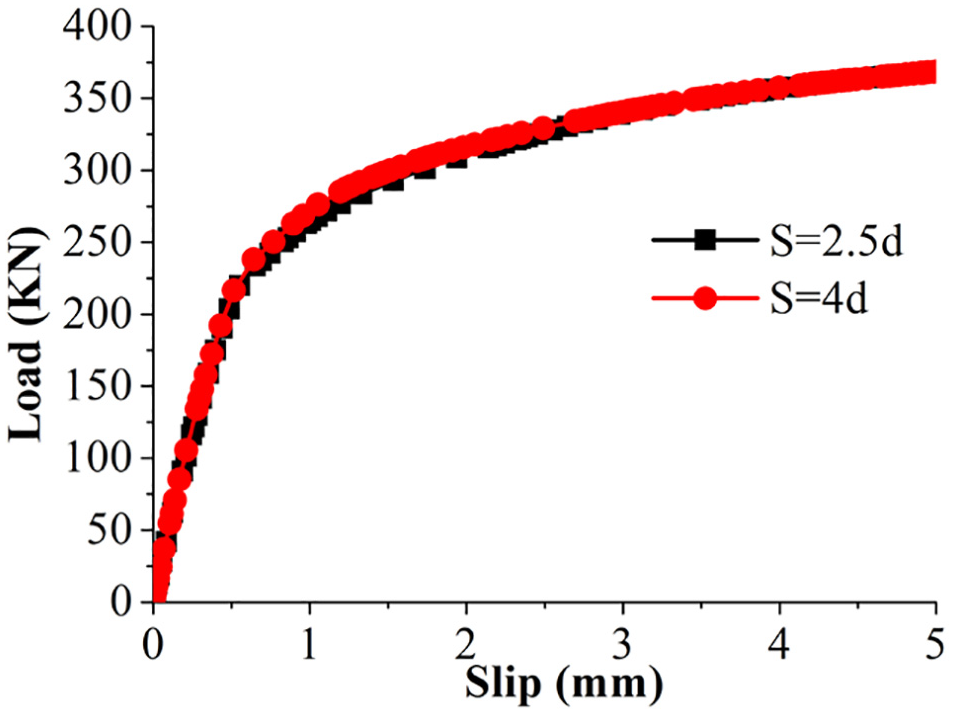
The load-slip under different spacing of stud.

The stress distribution of UHPC slab under different spacing of stud: (a) 2.5d and (b) 4d.
Results and discussion
Shear capacity evaluation in the specification
Currently, there are no shear capacity calculations for the large-headed stud embedded in the UHPC. Thus, the experimental and part of numerical analysis results were compared with calculation results acquired based on the calculation method in EC4, AASHTO LFRD (2014), and GB50017-2003 (MOHURD, 2003). However, the accuracy and applicability of these specifications for evaluating the large-headed stud embedded in the UHPC slabs should be more concerned.
The shear capacity of per stud shear connector provided in EC4 is expressed as


where
As provided in AASHTO LFRD (2014), the nominal stud shear resistance determined by

where ϕsc is the resistance factor for shear connectors, it is equal to 0.85 in steel–concrete composite structures, whereas it was set to be 1 based on the mechanical performance of UHPC according to Wang et al. (2019) in this investigation.
In GB50017-2003 (MOHURD, 2003), the allowable shear capacity Pu of one stud is calculated according to equation (8)

where fc is the compressive strength of concrete cubes; γ is the ratio of the minimum tensile strength to yielding strength of the stud, it is equal to 1.3 based on the tensile strength and yielding strength used in this article.
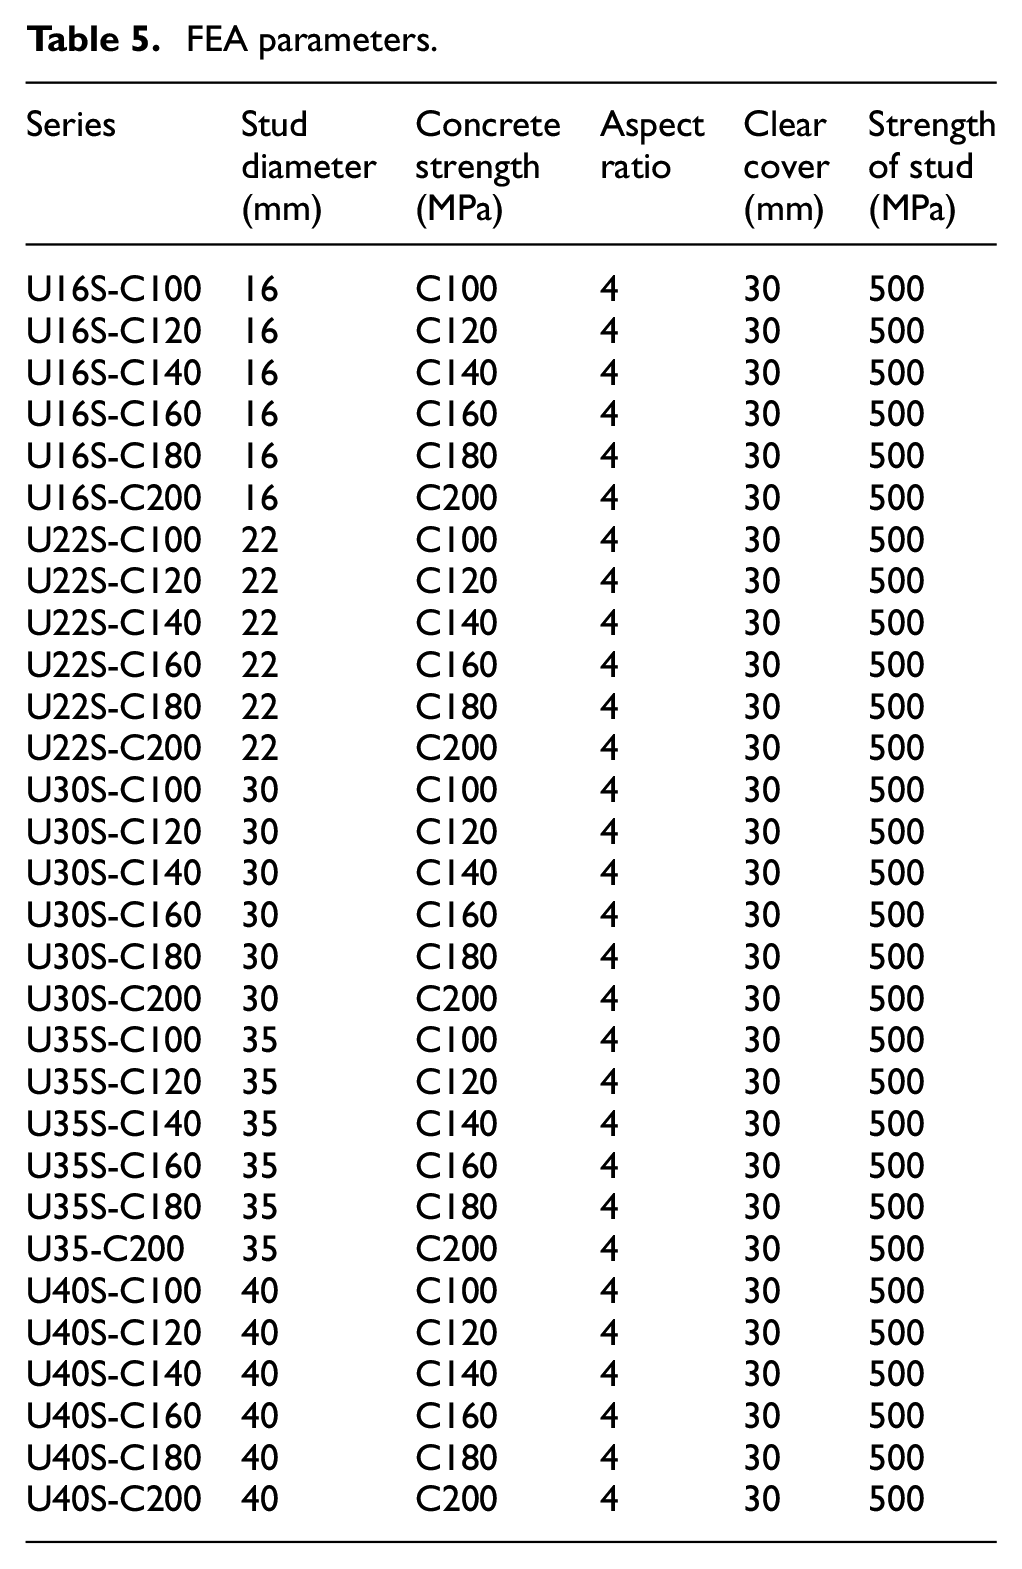
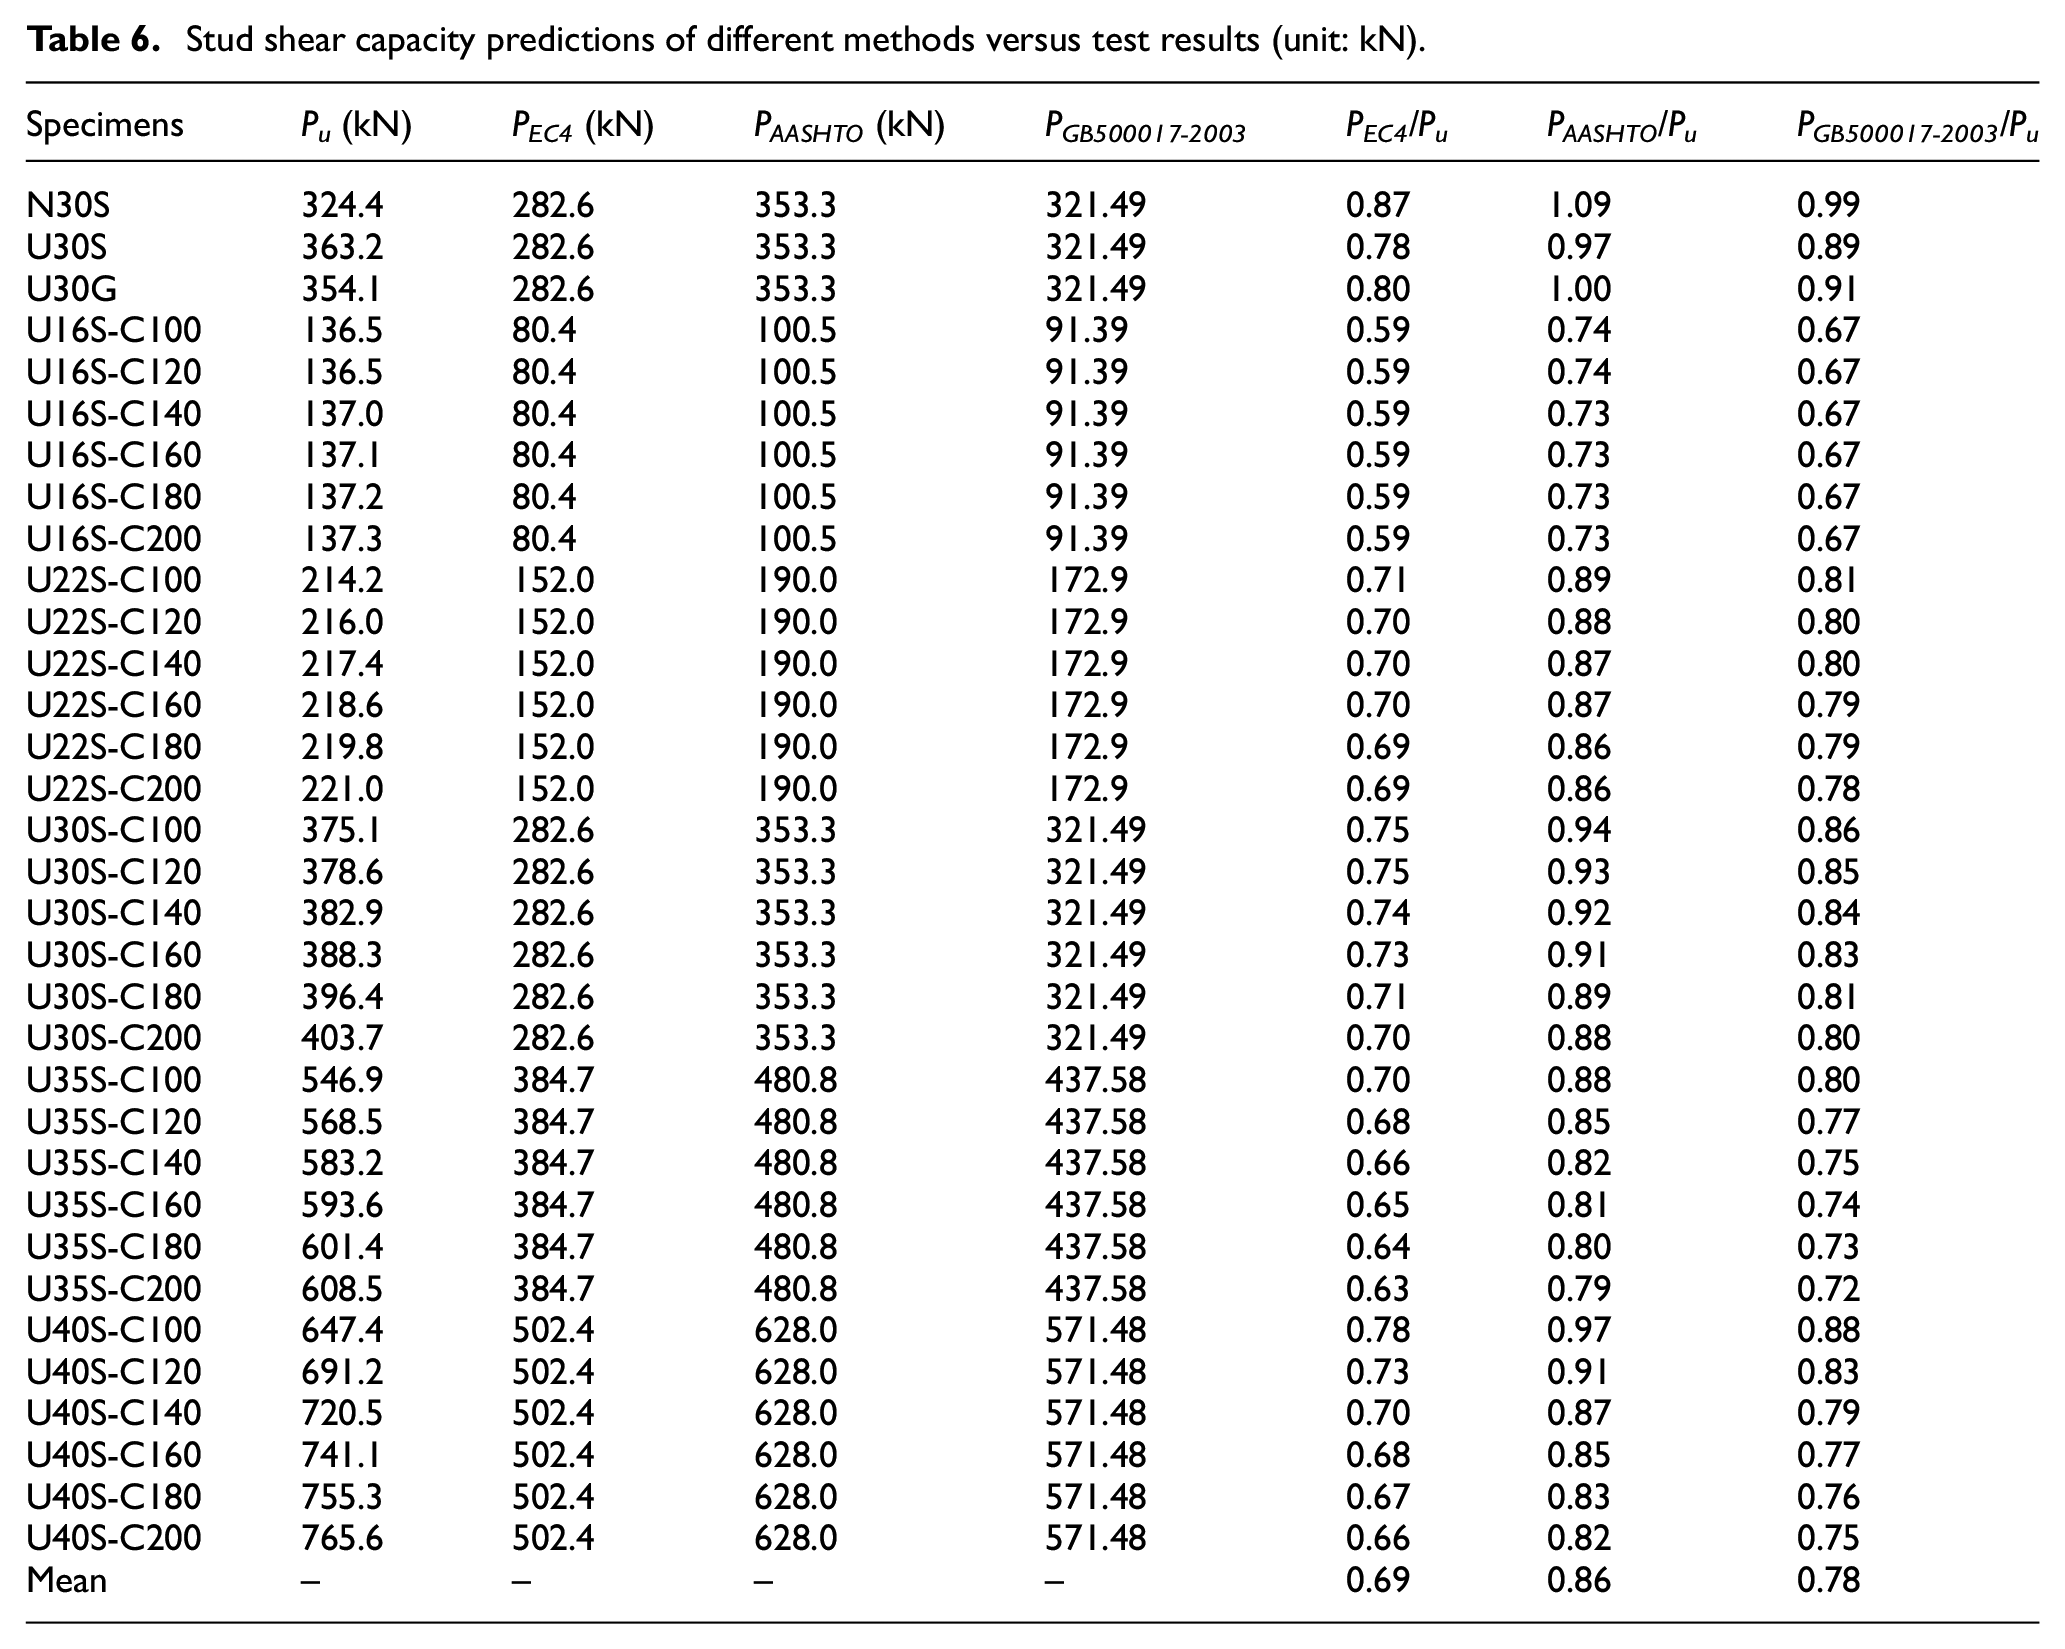
More parameters are shown in Table 5; the shear capacity predictions of different methods versus experimental and numerical results are presented in Table 6. It can be found that the current design codes are all relatively conservative and the shear capacity of all push-out specimens is underestimated. It indicates that the shear capacity is significantly improved when the stud is embedded in the UHPC slab. In addition, it can be seen that the mean value of P AASHTO /P u , P EC4 / P u and P GB500017-2003 /P u ratio is 0.86, 0.69, and 0.78, respectively. Thus, it can be inferred that the AASHTO LFRD (2014) is more applicable to calculate the shear capacity of steel–UHPC composite structures.
FEA parameters.
Stud shear capacity predictions of different methods versus test results (unit: kN).
Stress mechanism and failure development
From the experimental study and numerical analysis above, it can be observed that the shear capacity of larger-headed stud embedded in the UHPC slab is larger than that embedded in the NSC slab. In addition, it should be noted that the shear capacity of them all controlled by the shank failure model. It can be seen that the high stress area located in the root of stud, and the stress level of the stud head is very low. Moreover, it is interesting to find that the triangle zone named wedge block (Jebara, 2018; Nellinger et al., 2017; Pavlović et al., 2013) appears in the compression region of the concrete according to the deformation diagram of stud and stress distribution of UHPC slab as shown in Figure 14.
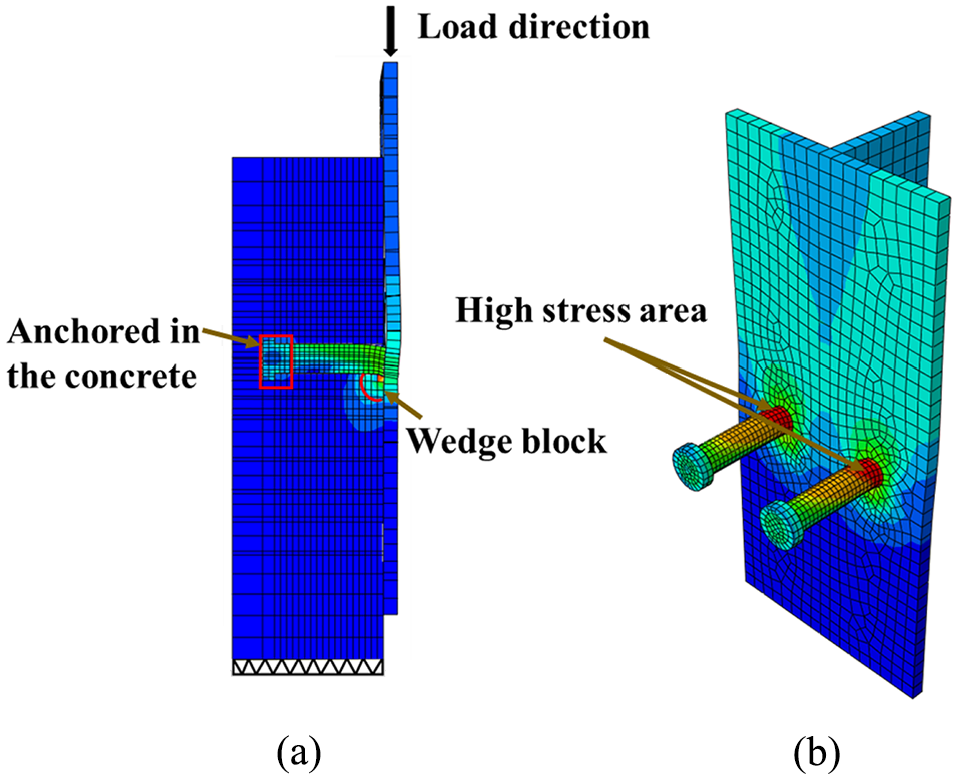
Mises stress of the model: (a) Mises stress of the model at ultimate state; (b) Von Mises stresses of studs.
Wang et al. (2019) reported that the shear wedge block contribution could not be neglected when the stud was embedded in UHPC slab due to high compressive and tensile strength and considerable elasticity modulus of UHPC. The concrete wedge block would be sheared off from the concrete slab together with the studs be fractured at failure, resulting in additional shear contribution on the stud shear strength due to concrete tension. Thus, the shear strength of stud embedded in UHPC is improved.
The mechanical mechanism and the shear strength enhancement of the studs embedded in UHPC can also be explained from another perspective. For the push-out specimens, the root of the shear stud is welded on the flange of the steel beam. Thus, the steel beam is like a fixed constraint on the root of the stud, and the stud can be analyzed according to the elastic foundation beam model, as shown in Figure 15. In Figure 15, K is the reaction coefficient of concrete; it increases with the increase of elastic modulus of concrete.
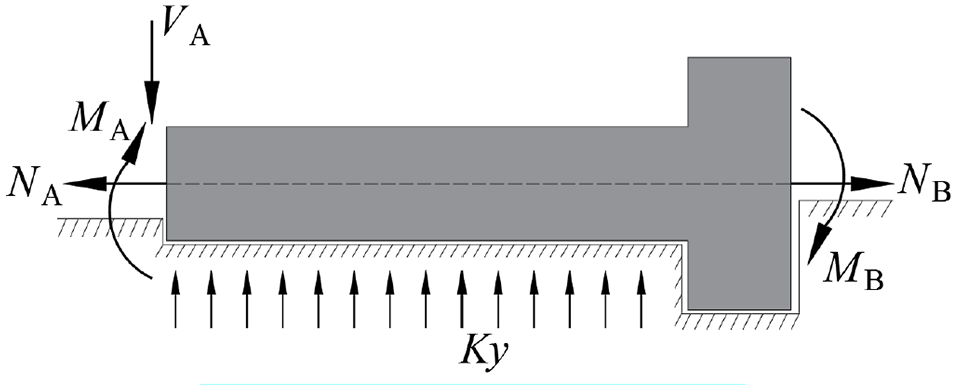
Mechanical model of stud embedded in UHPC.
The ultimate slip of stud embedded in UHPC is smaller than that embedded in NSC (see Figure 5(d)) due to KUHPC > KNSC. In addition, the height of concrete crushing zone and yield zone in front of stud shear connector embedded in NSC is higher than that embedded in UHPC at the failure process, for the reason of larger peak compressive strain and ultimate compressive strain of UHPC. The angle between the axis of the stud and the concrete slab (θ) increases with the decrease of concrete crushing zone and yield zone. The relationship between the axial force of stud and concrete strength and θ is shown in equation (9) (Nie, 2005).

where fcu is compressive strength of concrete; θ is the angle between the axis of the stud and the concrete slab.
Based on the equation (9), it can be found that the axial force of stud decreases with increase of fcu and θ. According to Lin and Liu (2015), there is a correlation between the shear force and the axial force of studs, and the reduction of the axial force of the studs is beneficial to the increase of the shear strength of the studs. Thus, the shear strength of stud embedded in UHPC is larger than that in NSC.
Based on the analysis above, the improvement mechanism of the stud embedded in UHPC to the shear capacity can be thoroughly understood; meanwhile, the reason for underestimating of current codes to shear capacity of UHPC–steel composite structures can be figured out. In addition, it can be seen that only the contribution of stud to the shear capacity but no partial factor was considered in the equation (7). According to equation (7), the mean value of P AASHTO /P u is 0.86 in stud shear capacity predictions results, which indicated that the shear strength of stud embedded in UHPC is improved by about 14% due to the contribution of wedge block and decrease of axis force.
Conclusions
This article investigated the static shear behavior and validity of large stud (single and group studs) embedded in the UHPC slab via push-out test and numerical analysis. The following conclusions can be drawn in this article:
Based on the test results, the matching of large-headed studs with UHPC is better than that with NSC. The shank and concrete failure occurred for the large-headed stud embedded in the NSC slab, whereas only shank failure occurred for the large-headed stud embedded in the UHPC slab. In terms of shear capacity, the shear capacity of steel–UHPC composite structure was increased by about 10% compared with the normal steel–concrete composite structure.
According to the parametric analysis, the influence of concrete strength on the shear capacity of steel–UHPC composite structure is not obvious, whereas the ultimate shear capacity of the steel–UHPC composite structure increases in proportion to the increase of stud diameter. The thickness of clear cover under different stud diameters and concrete strengths has negligible influence on the shear capacity, and the thickness value should be specified according to EC4 considering the structure durability. Moreover, the specification on the spacing in the direction transverse to the shear force in EC4 is suitable for the steel–UHPC composite structure according to numerical analysis.
The shear capacity of the large headed stud embedded in UHPC is underestimated according to EC 4, AASHTO LFRD 2014, and GB50017-2003. The AASHTO LFRD 2014 is more applicable to this kind of large headed stud compared with other design codes.
The axis force of the stud embedded in UHPC decreases, which is beneficial for improving the shear resistance of stud. Besides, the formation of wedge block enhances the shear capacity of stud.
Footnotes
Declaration of Conflicting Interests
The author(s) declared no potential conflicts of interest with respect to the research, authorship, and/or publication of this article.
Funding
The author(s) disclosed receipt of the following financial support for the research, authorship, and/or publication of this article: This study was supported by the National Key R&D Plan (2017YFC0703402) and Joint Funds of National Natural Science Foundation of China (U1934205). The financial support is gratefully appreciated.
