
Abstract
Steel reinforced shotcrete lining (SRSL) support is the primary structure to maintain the stability and mobilize the self-bearing capacity of surrounding rock. However, the structural design of SRSL in underground excavation still relies on experience-based method and lack of quantitative mechanical analysis. This paper aims to propose a modified analytical model of support characteristic curve (SCC) that represents the mechanical behavior of SRSL structures in underground construction, through which the interface bond-slip behavior between steel arch and shotcrete layer is taken into consideration. Four-point bending test of SRSL composite beam was carried out to study the bearing mechanism and failure performance. Test results show that the shotcrete-steel interface is prone to slip failure which significantly reduces the overall strength of SRSL. The laboratory test is complemented by non-liner finite element parametric studies considering the bond-slip properties to clarify the design principles and to obtain the flexural stiffness of tunnel primary lining structures. Based on above studies, the simplified formulas for the SCC of SRSL is constructed. The research results provide a theoretical basis for the design and application of SRSL structure in related projects.
Keywords
Introduction
In the process of underground excavation, the combined support system consists of steel arch and shotcrete is the primary support structure to close the fracture of rock mass, to maintain its stability, and to mobilize its self-bearing strength (Figure 1) (Bjureland et al., 2019; Carranza-Torres and Diederichs, 2009; Oreste et al., 2018; Song et al., 2019; Vojtasik et al., 2017). However, the steel-concrete bond-slip behavior is generally considered to be one of the decisive factors affecting the failure mechanism of composite structures (Kabir et al., 2019). In the above-ground composite structures, stirrups or shear studs are widely arranged to prevent the interface slippage, but due to the complexity of underground construction, there is no structural measures to maintain the integrity of primary support structure, which may lead to large-scale shotcrete cracking and instability failure of steel arch, causing serious engineering problems (Figure 2) (Gao et al., 2019; Zhang et al., 2017).

Steel reinforced shotcrete lining support structure.

Field failure.
Current design process widely adopts the experience-based method (European Committee for Eurocode 7, 2004; Ministry of Transport of the People’s Republic of China, 2018). This method adapts to the complexity of underground conditions, yet fails to quantitatively evaluate the rock-support interaction. The convergence-confinement method (Alejano et al., 2010; Dias, 2011; Fahimifar and Ranjbarni, 2009) effectively supplemented above deficiencies by intersecting the ground reaction curve (GRC) and support characteristic curve (SCC) to obtain the equilibrium requirement for support structures. But one of the reasons for that this method hasn’t been widely accepted in engineering industry is that the conventional analytical model of SCC cannot accurately represent the actual working conditions of primary structures in underground excavation. SCC describes the relationship between support resistance and support deformation (Oreste, 2003). Most research adopts ideal elastoplastic model assuming that the shotcrete layer and steel arch perfectly work together, which neglects the influence of bond-slip failure, leading to the invalidation of conventional SCC. The objective of this paper is therefore to propose a modified method on the construction of SCC for the primary support structures in the convergence-confinement method of tunnel support design, considering the weakening effect of steel arch-shotcrete layer interface bond-slip failure behavior.
Experimental tests
In this study, test specimen was prepared using shotcrete with I-shaped steel and steel mesh reinforcement. Four-point loads were adopted to investigate the flexural stiffness and failure properties. The details of specimen construction and mixture proportions of shotcrete are as follows.
Specimen details
Figure 3 shows the structural diagram of SRSL support in underground engineering. The total thickness of lining H is usually 240 mm while the height of steel arch section Hs is 180 mm. Due to the low tensile strength of concrete, steel reinforcement mesh with diameter Dr of 6 mm is usually arranged on one or both sides of the steel arch to share the tensile force. The thickness of concrete on the side close to surrounding rock and on the side close to tunnel space are Hrock (30 mm) and Hspace (30 mm), respectively. The thickness of protective layer between concrete edge and reinforcing mesh is Tpl (10 mm).

Analytical objects cross-sectional details of tested specimen.
Mixture proportions of shotcrete
The mixture properties of shotcrete are listed in Table 1. Ordinary Portland cement produced in Zibo, China, which is widely used in tunnel engineering, is selected in the preparation of laboratory specimens. The properties of this kind of cement is shown in Table 2. Naphthalene series water reducing agent with a ratio of 2%, which is a kind of superplasticizer, was adopted to ensure 15% water reducing rate. River sand with the fineness modulus of 2.8 is selected as the fine aggregate. Hard gravel with particle size distribution of 5 to 15 mm is selected as coarse aggregate, in which the amount of gravel with particle size less than 5 mm is about 5%, the amount of 5 to 10 mm particle is 75%, and the amount of 10 to 15 mm particle is 20%. Additionally, early strength agent which can improve the early strength of concrete is often used in shotcrete to improve the initial bearing strength. According to the application results on site, the initial setting time of shotcrete didn’t exceed 5 min, and the final setting time was no more than 10 min.
Proportion of materials in shotcrete mixture (kg/m3).

Cement properties.

Experimental results and discussion
In pure bending test, three vertical displacement meters were arranged to observe the vertical deflection as shown in Figure 4. Figure 5 shows the test process and the load-deflection (P-δ) curve. Based on the test phenomenon, the curve can be divided into following stages:
o-a stage (Elastic): Shotcrete and steel work together, the P-δ curve is a straight line.
a–b stage (Crack propagation): Cracks appear from the loading point to the fixed point where shear force exists. Then cracks begin to appear in the tension area of the pure bending section and expand to a certain height. In this stage, although the specimen has cracked, the section steel and shotcrete still work together.
b–c stage (Interface slip): With the propagation of the cracks in the bending-shear section and the compression area in the pure bending section, the shotcrete-steel bond strength decreases, slippage occurs, steel and the concrete gradually separate and unable to work together, the reinforcement mesh in the compression area starts to bend upward, and the stiffness of the specimen decreases obviously.
c–d stage (Concrete crushing): After the bond-slip stage, with the crushing of concrete in the compression area, a large turning point appears in the P-δ curve, and the bending capacity of the SRSL specimen decreases gradually.
d–e stage (Steel bearing): Due to the occurrence of bond-slip and the crushing of concrete, the concrete in the compression area is out of work. The section steel is the primary bearing object, which greatly improves the overall ductility.

Loading scheme of pure bending test.

Deformation process of pure bending test.
Numerical analysis
In this section, a three-dimensional non-linear finite element model of SRSL structure is constructed based on finite element software ANSYS. Both geometrical and material non-linearities were considered and the shotcrete-steel bond-slip behavior is simulated. The correctness of laboratory test and numerical test results is verified mutually.
Material model
Shotcrete
In order to obtain the mechanical properties of shotcrete materials used in tunnel, shotcrete cubic compressive properties were investigated from testing 150 × 150 × 150 mm3 concrete cube specimens (Ge et al., 2020) which is presented in Figure 6(a). The uniaxial stress-strain relationship of concrete adopts the following equations (Kabir et al., 2019) while ε0 and εcu are the strain corresponding to maximum and ultimate stress, respectively. εc and σc are the concrete compressive strain and corresponding stress.


Where ε0 = 0.002, εcu = 0.0033.

Material stress-strain curve: (a) shotcrete and (b) steel.
The multi-linear isotropic strengthening model MISO is used in the constitutive relation of concrete, which can reflect the yield and failure behavior of shotcrete more accurately by inputting a series of data points.
Steel
The material properties of steel were defined based on tensile test of three specimens from actual tunnel arch. The average yield strength of the steel is 296.13 MPa, the ultimate tensile strength is 449.94 MPa, and the elongation of the specimen is 35.67%. The elastic modulus is 206 GPa. Figure 6(b) shows the constitutive model for steel with a yielding stage.
Element selection
This paper adopts the separate method to construct simulation model, that is, SOLID65 element without reinforcement is used to simulate shotcrete, LINK8 element is used to simulate steel mesh, and SOLID45 is used to simulate steel arch.
SOLID65 element has the special functions of cracking and crushing which represents the mechanical behavior of concrete, and it can meet the requirement of defining the nonlinear constitutive relationship of shotcrete by multilinear isotropic strengthening model (MISO). In tunnel construction, C25 shotcrete, the cubic compressive strength of which is 25 MPa, is the most widely used type of concrete. William-Warnke five parameter failure criterion model is adopted in the simulation. The standard value of axial compressive strength is fck = 16.7 MPa, and that of axial tensile strength is ftk = 1.78 MPa. The shear transfer coefficient of open crack is βt = 0.5, and that of closed crack is βc = 0.95. The default value of 0.6 is used as the release coefficient of tensile stress.
Element LINK8 is used to simulate the reinforcement mesh, which can bear axial tension and compression, but cannot bear bending moment. That is consistent with the mechanical characteristics of the steel reinforcement mesh. The elastic modulus of steel mesh is 200 GPa, Poisson’s ratio is 0.3.
The SOLID45 element is used for the section steel simulation, which is a three-dimensional eight-nodes solid structure element. It can bear bending moment, shear force and axial force, and can simulate the mechanical properties of section steel, such as plasticity, large deflection and large strain.
COMBIN39 element is selected to simulate the interface slip between steel arch and shotcrete layer. This element has the nonlinear function by inputting a force-deformation curve (F-D curve) representing the bond-slip constitutive relationship. COMBIN39 elements with length of 0 is arranged on the interface along normal, longitudinal and transverse directions. Because the normal deformation is much greater than the other directions, the normal interaction is simplified as a spring element with large stiffness coefficient only bearing compression. With very small shear stress, the transverse interaction is considered as complete bond contact. The longitudinal direction is the main direction of bond-slip behavior, which adopts the model recommended by Che (2008).
Element division is shown in Figure 7. The boundary condition of the component is consistent with the laboratory test.

Finite element model.
Simulation results and model validation
Figure 8 shows the stress nephogram and the comparison of P-δ curves obtained from laboratory test and numerical simulation. There are three times of stiffness degradation during the test. The difference rate of strength at point b is 3.98%, which indicates that the numerical simulation results are in good agreement with the laboratory test.

P-δ curve comparison of numerical and laboratory results.
Figure 9 shows the COMBIN39 elements on steel-shotcrete interface and the relationship between vertical load and interface slippage deformation of four points from the middle span to one end of the specimen. The value of slippage deformation is defined as the displacement between two overlapped nodes. The results indicate that the interface slip behavior is more obvious in shear-bending section than pure bending section due to the existence of shear force. When the vertical load reaches 75% of the ultimate value, the growth rate of slippage is accelerated obviously.

Interface bond-slip F-D curves.
Parametric analysis
The influence of multi-parameters including reinforcement mesh location, concrete strength, the diameter and position of reinforcement mesh, the thickness of protective layer are analyzed in this section.
Analysis scheme
Reinforcement mesh location
Grid mesh consists of steel reinforcement is usually laid on one or both sides of the steel arch to ensure the integrity of support structure. There are mainly four schemes in underground excavation as shown in Figure 10.

Layout schemes.
Other parameters schemes
The position of steel arch is represented by the position coefficient ζ. In tunnel support, the thickness of shotcrete on the side near the surrounding rock is usually 40 mm, and that on the side near the free space is usually 20 mm. Therefore, the SRSL specimen with the height of 240 mm is selected in this section because the height of section steel is 180 mm, which is consistent with the experimental research. The steel position coefficient ζ is defined as the ratio of the concrete thickness at the surrounding rock side to the concrete thickness at the free side (ζ = Hrock/Hspace).
The number of test scheme is represented as Ik-AiBjCmDn(k = 1∼4). Among them, I represents the simulation schemes, and k represents the four analysis parameters considered (1-concrete strength, 2-reinforcement diameter, 3-position of steel arch, 4-thickness of protective layer). A represents concrete strength, i represents 5 concrete strength values; B represents reinforcement diameter, j represents 5 diameter values of reinforcement mesh; C represents position coefficient, m represents 4 values of position coefficient; D represents thickness of protective layer, n represents 5 values of thickness of protective layer. See Tables 3 and 4 for specific values.
Specimen parameters.

Number scheme of specimens.

Results analysis
Reinforcement mesh location
Figure 11 shows the P-δ curve of SRSL specimens under different reinforcement mesh layout schemes. In the elastic stage, there is no obvious difference in the stiffness and strength, which indicates that the reinforcement mesh, steel, and concrete are in good synergistic condition. With the propagation of concrete cracks, the bottom layer of reinforcement shared more tensile force, so the cracking strength of BRS is higher than that of TRS. Figure 11 indicates that the strength of BRS scheme is about 7.6% higher than that of NRS, and 6.0% higher than that of TRS, which proved that the reinforcement mesh on the tension side has a certain influence on lining strength, but the contribution is limited. The primary contribution of steel mesh is to ensure the adhesion of shotcrete and to maintain the integrity of lining structures.

P-δ curve of SRSL specimens with different layout schemes.
Concrete strength
Figure 12 shows the P-δ curve of SRSL specimens with different concrete strength. According to the numerical calculation results, when the concrete strength is C15, C20, C25, C30, C40, the stiffness of specimens is 0.05554, 0.06834, 0.08181, 0.09472, 0.11604 kN/m, respectively. Compared with I-A3B2C4D1, the stiffness difference rate of the other four specimens is 32.1%, 16.5%, 15.8%, 41.8%. It can be seen that shotcrete plays an important role in elastic stage. However, in the cracking stage, shotcrete with lower tensile strength fails in the tension area, and the tensile force is shared by section steel and reinforcement mesh, so there is limited contribution of concrete strength to the cracking stage. On the other hand, for shotcrete strength lower than C30 (shotcrete with cubic compression strength of 30 MPa), the stiffness difference between elastic stage and cracking stage is negligible, which means that the elastic stiffness can be approximately assumed as the initial stiffness under this condition.

P-δ curve of SRSL specimens with different concrete strength.
Diameter of reinforcement
Figure 13 shows the P-δ curve of SRSL specimens with different reinforcement mesh diameters. The reinforcement diameter shows more obvious effects on the stiffness of the cracking stage than that of the elastic stage for the reason that it shared more tensile force after shotcrete cracking. Reasonable design of reinforcement mesh diameter can ensure the integrity and bearing capacity of lining structures after shotcrete cracking, which is conducive to the full play of each component.

P-δ curve of SRSL specimens with different reinforcement mesh diameters.
Steel arch location
Figure 14 shows the P-δ curve of SRSL specimens with different steel locations. The location coefficient of section steel shows little influence on the strength and stiffness of the elastic stage due to the synergistic effect in this stage. Ultimate strength of component with ζ of 2 is the lowest, and the strength reaches the highest when ζ is 1. In addition, considering the different stress modes such as positive bending and reverse bending, the components arranged symmetrically are more favorable to the effectiveness of strength.

P-δ curve of SRSL specimens with different steel locations.
Thickness of protective layer
Figure 15 shows the P-δ curve of SRSL specimens with different thickness of protective layer. It can be seen that the thickness of the protective layer has limited effect on the elastic stage and the cracking stage. This is because the thickness of protective layer does not change the concrete strength, but only affects the position of steel mesh. High compressive strength and low tensile strength are typical characteristics of concrete. Under the action of flexural moment, the concrete in the protective layer quickly fails under tension, and the tensile force is mainly shared by the reinforcement mesh at the bottom. Theoretically, lower reinforcement mesh has greater effect on overall flexural strength, which is proved by Figure 15.

P-δ curve of SRSL specimens with different protective layer thickness.
Stiffness analysis
In order to construct the SCC analysis model of SRSL, the initial stiffness of specimen in the elastic stage should be defined first. As shown in last section, the stiffness of SRSL before and after shotcrete cracking shows little difference regarding low-strength shotcrete (The cubic compressive strength of shotcrete in tunnel is usually no more than C30), which can be approximately assumed as the initial stiffness. For the synergistic stage (elastic stage) of composite structure, the deformation of steel and concrete is the same, and the equivalence relationship is as follows:

Where MsKs and McKc are the bending strength and bending stiffness of steel arch and shotcrete respectively, M Keq are the flexural force and equivalent stiffness of SRSL component. Since M = Ms+Mc:

Where Eeq teqν is the equivalent elastic modulus and thickness and Poisson’s ratio of SRSL. b is the width of SRSL. Also, there is the same equation under uniaxial compression

Where Ds Dc are the compressive stiffness of steel arch and shotcrete, respectively, while Deq is the equivalent compressive stiffness of SRSL component.
From equations (2) and (3), following equations can be derived


Then according to the mechanics of materials, the midspan deflection can be calculated by the following formula

Results of deflections from laboratory, numerical and theoretical are compared in Table 5.
Comparison of deflection results of test and calculation.

It can be seen that the above analysis results show good consistency, which proves the correctness of the stiffness calculation method and lays a foundation for the subsequent SCC analysis.
SCC construction of SRSL arch
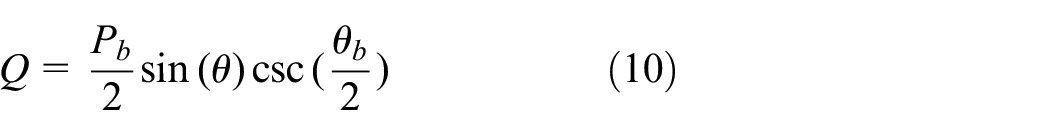
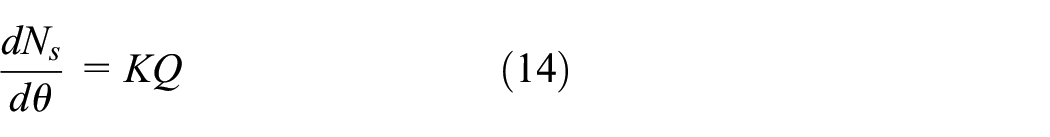
The analytical model of SRSL arch SCC is based on a micro element along the circumferential direction as shown in Figure 16(a). M is the bending moment, N is the axial force, Q is the shear force, q is the rock deformation pressure, R is the centroid radius of the lining structure cross-section, and θb is the micro element angle. Under the action of rock pressure, each internal force on one side increases by a differential increment on the other side, thus the equilibrium conditions can be established to deduct the equations of each internal force. Carranza-Torres and Engen (2017) deducted the equations of radial deformation ur, axial force N, bending moment M, and shear force Q based on Figure 16(a).

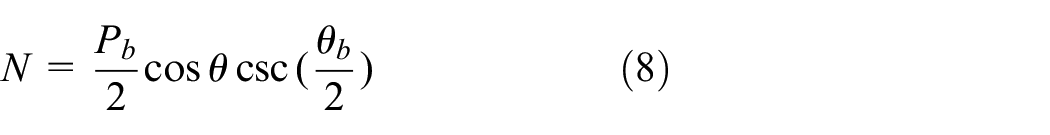
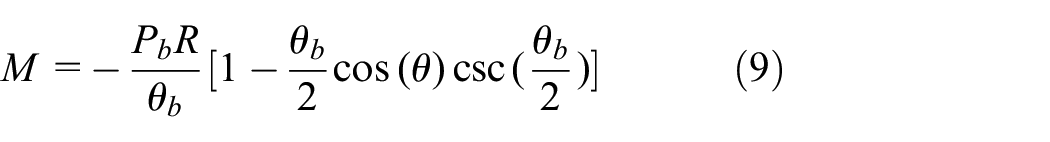

Force analysis of SRSL: (a) force equilibrium and (b) section stress.
Where
It can be obtained from the force balance condition:


Where Nr, Mr, Nc, Mc, Ns, Ms is the axial force and bending moment of reinforcement mesh, shotcrete and section steel respectively. As shown in Figure 16(b), Z1 and Z2 is the position of neutral axis of shotcrete and steel, respectively. τbs and εbs are the tangential stress and strain on the shotcrete-steel interface. It can be concluded that when no slip occur, Z1 = Z2 = Z0 and εbs = φ(Z2−Z1) = 0. Z0 and φ can be obtained by solving equations (11) and (12).
The following relationships exist on the shotcrete-steel interface:
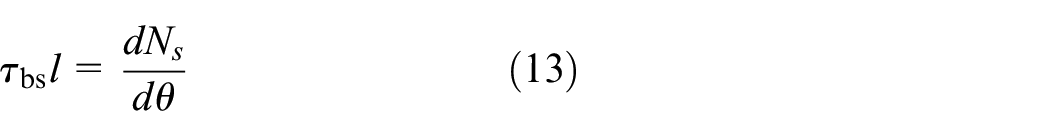
Where l is the section perimeter of steel. The critical stress of interface slip is defined as τ0. When
It is proved in some research (Wang, 2004) that the relationship between
Where,
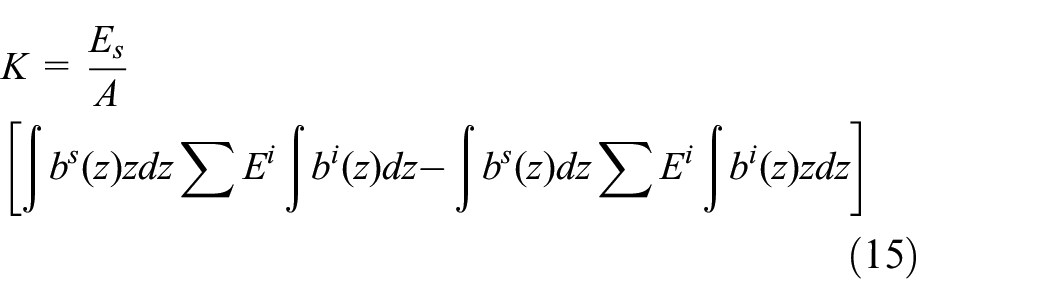
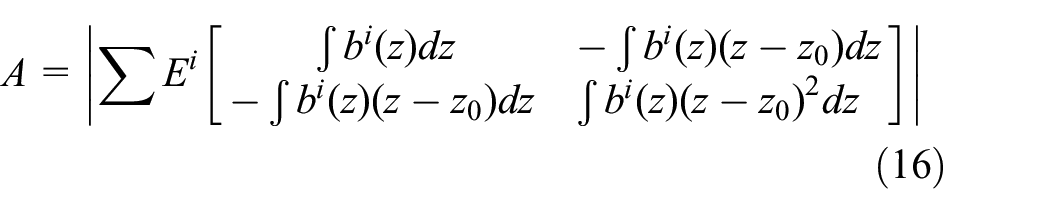
b i(z) includes bs(z) br(z) bc(z) which are function of section width of steel, reinforcement mesh and shotcrete along Z axis respectively.
According to equation (10), the distribution form of

Analytical model of SCC of SRSL: (a) distribution of
Figure 17(b) shows the analytical model of convergence-confinement method. The ground reaction curve is usually obtained through Kastner equations, or through monitoring data and numerical calculation results based on a particular tunnel engineering. GRC reflects the relationship between required support resistance and corresponding rock deformation. By intersecting the GRC and SCC, the support strength demand and allowable deformation of primary lining structure can be determined.
The balance equation at the critical point is
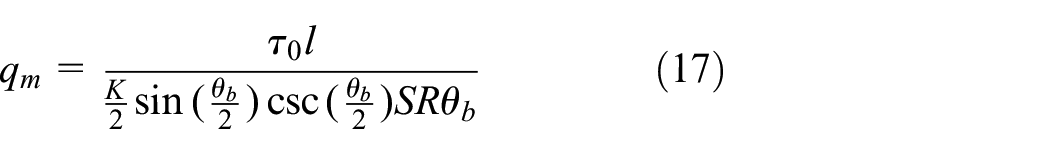

The above research results indicate that bond-slip strength τ0 directly affects the critical support resistance. As θb approaching 0, Q tends to be 0 and qm tends to be infinite, which means that the circular lining structure in ideally smooth contact with the surrounding rock does not bear the shear force and is not controlled by the bond-slip behavior. However, most of the rock-lining contact in underground excavation is rough, and tunnel section shape is mostly multicentric circular with inevitable shear force, which means the bond-slip behavior should be fully considered.
Conclusion
A simplified analytical approach was presented for the construction of SCC of primary lining structures considering the steel arch-shotcrete layer bond-slip behavior, which is proved to be seriously harmful to maintaining lining integrity based on laboratory test results.
Enhancing shotcrete strength can significantly improve initial stiffness of lining structure because the influence of shotcrete strength on initial stiffness can reach 41.8%. In this paper, the stiffness calculation method of composite lining structure is verified by experimental and numerical results to construct the analytical model of SCC of support lining.
After shotcrete cracking, the steel-shotcrete interface slip occurs, but the steel arch is usually still in good bearing state, which ensures that the lining structure has good ductility after cracking. Therefore, the steel arch should be reasonably designed as the strength reserve of underground lining structures.
The interface bond-slip failure is mainly related to the shear force distribution of components, so the bond-slip effect can be ignored for the axisymmetric circular lining with smooth contact. For other cases, when the external load reaches 75% of the ultimate load, the bond-slip phenomenon is obvious. The critical support resistance of ideal elastoplastic SCC model can be derived based on critical bond-slip strength so as to provide reference for the implementation of convergence-confinement method in underground design.
Footnotes
Acknowledgements
The authors of this article are so grateful to the anonymous reviewers for their valuable comments and modification suggestions on the improvement of this paper.
Declaration of conflicting interests
The author(s) declared no potential conflicts of interest with respect to the research, authorship, and/or publication of this article.
Funding
The author(s) disclosed receipt of the following financial support for the research, authorship, and/or publication of this article: This work was supported by the Doctoral Research Foundation of Shandong Jianzhu University (grant/award number: XNBS20106).