
Abstract
With the help of Structural Health Monitoring (SHM) methods, it is possible to identify the occurrence of damage at its early stages and prevent fatality and financial damages. Great advances in signal processing methods in combination with Machine learning tools have led to better achieve this goal. In the present paper, the two major techniques, that is, Empirical Mode Decomposition (EMD) and Discrete Wavelet Transform (DWT) are combined with Artificial Neural Network (ANN) through processing raw acceleration responses measured on a scaled jacket type offshore platform which was constructed and tested as a benchmark structure at K.N. Toosi University of Technology. In this way, ANN was trained by the signals obtained from EMD and DWT for three different conditions of the jacket platform to determine the relative damage severity. The envelope of the obtained signal’s energy (ENV) as an appropriate damage index was used to determine the damage location. The results of the application of this procedure on the case study indicated that DWT, compared to EMD, is a more reliable signal processing method in damage detection due to better noise reduction.
Keywords
Introduction
Jacket type offshore platforms are widely used to extract oil and gas at sea. These structures are susceptible to damage due to tough environmental conditions, so damage detection plays a vital role in ensuring the proper performance of them. Dynamic vibration-based damage detection methods in the field of structural health monitoring (SHM) have gone through rapid development in recent decades owing to the advances in sensor technology, wireless data transmission, and artificial intelligence (Doebling et al., 1996; Rytter, 1993). These methods can be divided into modal methods and signal processing methods. Kim and Stubbs (1995) have formulated a theory on damage localization and its severity by referring directly to changes in mode shapes of damaged jacket platform versus the undamaged one. Later, Shi et al. (2007) proposed a new algorithm, utilizing partial mode shapes assessed by eigenvalue analysis and identified by the ARMA method to locate damage successfully in a numerical study. The spread of damage is another concern in the field of health monitoring of jacket platforms. Aghajani Delavar and Bargi (2018) have predicted damage spread in a jacket platform (SPD12) by considering plastic hinges with pushover analysis. This study showed that the main damages spread from braces. So later in another paper, they proposed SMA bars as braces to reduce force in structural members and increase the jacket platform lifetime (Aghajani Delavar and Bargi, 2020). Another method in dynamic vibration-based methods is based on signal processing. The extracted signals from the sensors installed on the structure, cannot be analyzed directly to detect damage unless the damage is very severe. Therefore, these signals must be processed to obtain the required structural parameters for damage detection. Considering signals from real structures to be non-stationary and nonlinear, time-frequency techniques in signal processing, for example, Wavelet Transform (WT) and Empirical Mode Decomposition (EMD), have been promising tools with good performance in damage detection and SHM. Newland (1993) as the first researcher has applied WT in vibration analysis and presented the theoretical background. Many researchers have studied different types of WT methods in structural damage detection. Continuous Wavelet Transforms (CWT), Discrete Wavelet Transforms (DWT), and Stationary Wavelet Transform (SWT) are mostly used as signal processing techniques in SHM fields. CWT is capable of damage localization in beam and plate structures due to its precise resolution but its performance can be easily influenced by noise in each mode, so the least noisy modes lead to the most reliable results (Fan and Qaio, 2009; Hou et al., 2000; Khatam et al., 2007; Rucka and Wilde, 2006; Solís et al., 2018). Serra and Lopez (2017) proposed a combined wavelet domain method. It first refines the damaged structure’s response with SWT to reduce noise, then utilizes CWT for localizing damage based on its multi-scale analysis. Asgarian et al. (2016) utilized the Wavelet Packet Transform (WPT) to calculate the Rate of Signal Energy (RSE) of acceleration responses from a jacket type offshore platform. This method can determine damage location accurately but not the severity. Later, Wang and Shi (2018) applied Energy Curvature Difference (ECD) on signals decomposed from WPT to identify damage severity besides damage location.
Among wavelet techniques, DWT has the fastest operation time based on requiring few scales with down-sampling. Up-sampling causes SWT to have a slower process than DWT despite having a similar scale and CWT which has many continuous scales, is the slowest wavelet algorithm (Yang and Oyadiji, 2016). Kaloop and Hu (2016) proved that the energy of DWT has higher performance in damage detection than CWT due to lower correlation coefficient values. Also, sensitivity to stiffness change by DWT is more than CWT (Vafaei and Adnan, 2014).
EMD is one of the signal processing methods. It is capable of decomposing a response signal into Intrinsic Mode Functions (IMFs) which are oscillatory functions. This method is known for its ability to analyze non-linear and non-stationary signals which results in being an appropriate method in damage detection. Yang et al. (2004) used EMD for detecting damage locations in the reference building (SAC) by identifying damage spikes. The satisfaction of this procedure depends on noise level, damage severity, etc. Xu and Chen, (2004) presented the applicability of EMD in structural damage detection in the case of sudden stiffness reduction. The damage occurrence time and damage location are respectively determined by damage spikes and spatial distribution of spikes in decomposed signals from EMD. This method is not recommended for cumulative structural damage detection. Rezaei and Taheri (2011) proposed an EMD energy damage index to confirm notch presence and its quantification on a cantilever steel beam. This method only requires one sensor in the vicinity of damage so considered to be simple and cost-effective. It is worth mentioning that this index is sensitive to support condition and the variation in dynamic loading may cause a higher index for intact signals which erroneously interpreted as damage signal.
EMD in comparison to other instantaneous time-frequency methods such as Hilbert Vibration Decomposition (HVD) and Local Mean Decomposition (LMD), has better performance in analyzing nonlinear signals (Beheshti-Aval et al., 2019).
Artificial Neural Networks (ANN) are powerful methods for solving problems such as modeling, function approximation, classification, feature extraction, optimization, control, system identification, and data analysis (Haykin, 1994). These methods can be used in system dynamic behavior modeling and SHM problem-solving. Many researchers have applied different types of ANNs such as Multi-Layer Perceptron (MLP) or combined networks for damage detection in various structures (Elshafey et al., 2010; Hakim and Razak, 2014; Hore et al., 2016; Kim et al., 2008; Mehrjoo et al., 2008; Raptodimos and Lazakis, 2018; Suresh et al., 2004). Taha and Lucero (2005) applied DWT as a signal processing tool in combination with MLP to create an index for damage location detection. In this method, ANN is trained by intact wavelet coefficients. The difference between ANN predictions and real data shows the probability of damage but not damage severity. Kim and Melhem (2004) also utilized DWT for denoising signals which leads to better damage localization and time instant determination. They proposed artificial neural networks for damage severity detection despite its time-consuming procedure.
Many other papers are also available in the field of SHM that use the combination of ANN and WT for damage detection, which make sense (Cao et al., 2017; Hamidian et al., 2018; Jiang and Adeli, 2007; Samant and Adeli, 2001; Yam et al., 2003; Yi et al., 2013).
Based on the literature review, DWT and EMD are trustworthy among signal processing methods. So this study presents new results on the application and comparison of the two widely used signal processing methods, EMD and DWT, through a damage detection method using ANN.
Raw acceleration responses extracted from installed sensors on the prototype offshore platform are decomposed by EMD and DWT in four levels of decomposition. The sensors with higher energy envelopes by decomposed signals, introduce a higher probability of damage occurrence and the vicinity of damage. Also, the damage severity is achieved by the aid of a multilayer perceptron neural network which is trained with DWT and EMD obtained energy signals. The energy of error signals, extracted (real) and predicted signals from the network, is calculated for both healthy and damaged scenarios. Subsequently, the relative error between the healthy reference condition of the platform and damaged scenarios could lead to damage occurrence probability and its severity. Finally, the concluding remarks about EMD and DWT performance showed that DWT is more effective than EMD in damage detection, mainly due to better noise reduction and significantly less computational time. Since these methods are classified as non-destructive methods, they do not interrupt the serviceability of the structure.
Theoretical background
Empirical mode decomposition (EMD)
EMD analysis is an empirical method for decomposing signals into smoothed, single-frequency components called Intrinsic Mode Functions (IMFs). This procedure omits very high-frequency components and noise from raw signals that contribute to better damage detection. For performing EMD on signals, two basic assumptions should be considered (Huang et al., 1998).
In the total length of the desired signal (data), the number of extreme and zero-crossing points must be equal or differ just by one, which leads to the signal’s oscillation.
The mean of the maxima and minima envelopes should be zero at each point of the signal.
This causes the symmetry of the signal and prevents undesirable oscillations.
The signal decomposition is performed with the help of a sifting process that includes the following steps:
1- Finding data local extremes.
2- A spline curve is passed through maximum data values. This process is done for local minimum values to achieve upper and lower envelope curves.
3- The average of these two curves, m1, is calculated and subtracted from the original signal, x(t), to gain the first component, h1.

4- For satisfying the two above-mentioned conditions, the process is repeated for k times.

5- In each repetition, a stop criterion is controlled. If this amount is reduced to a certain extent, the above process will stop.
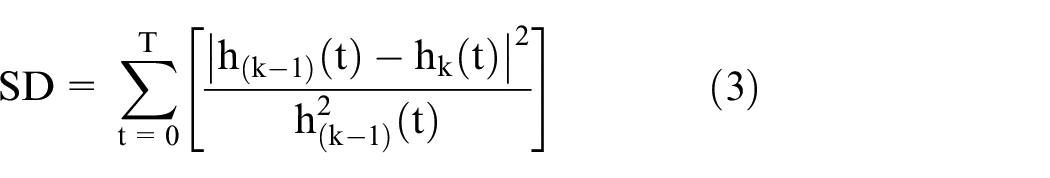
6- The last component obtained from the above process is considered as the first IMF.

7- The residue is obtained by subtracting the first IMF from the original signal.

8- The residue is considered as the main signal again and steps 1 to 7 are repeated to compute the next IMFs. This procedure is continued until the sifting process is not possible anymore or the residue is lower than a predetermined limit. In this case, the residue would be constant or uniform.
9- The original signal can be reconstructed from obtained IMFs.
Discrete wavelet transform (DWT)
This transform is similar to Fourier transform (FT) except the fact that wavelet basic functions can be shifted and scaled which causes local data examination and the capability of wavelet to capture hidden signals’ aspects (Mallat, 1998).
DWT is more suitable than continuous methods for signal pre-processing and time series analysis because the converted data with DWT does not have additional components, therefore the inversed transform can be applied to each category of time-frequency data. To compute a discrete wavelet, instead of using s and
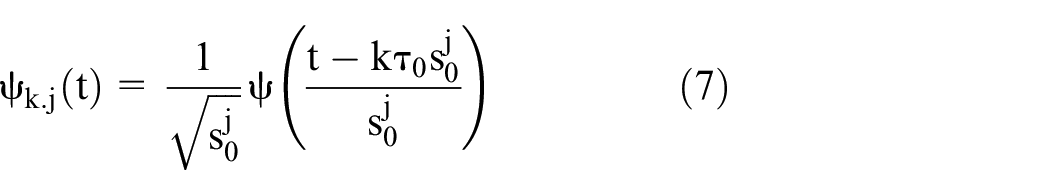
where k and j are integers and
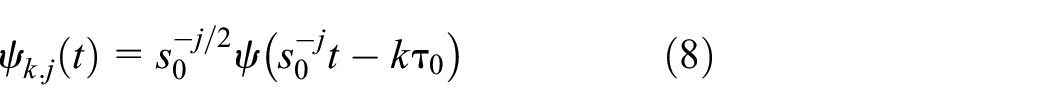
By applying the above formulation, the wavelet discrete coefficients are achieved:

In Figure 1, the approximation (A) and detail (D) components after decomposition are shown.
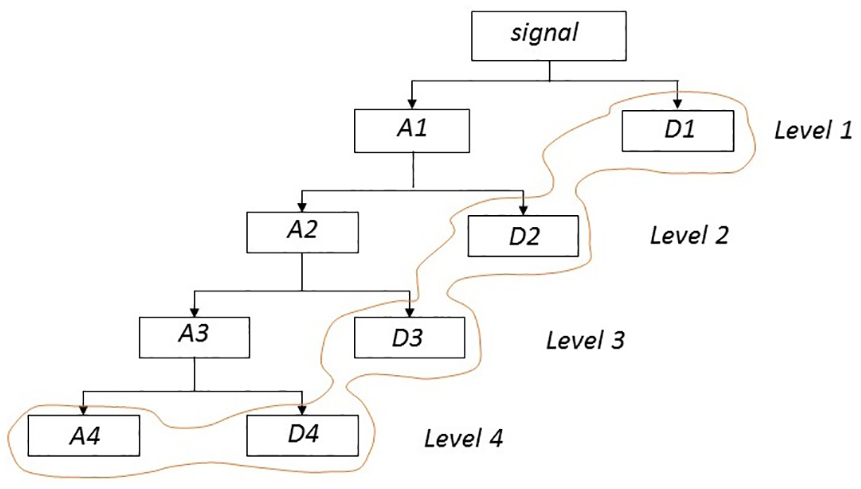
Outputs of DWT.
The level of decomposition is considered based on better frequency resolution till the smoothest signal is achieved. In Figure 2(a) and (b), DWT and EMD decomposition process in 4 levels are shown. The appropriate selection of mother wavelet (basic function) is of great importance. This may depend on the regularity, symmetry, and signal reconstruction ability (Ovanesova and Suarez, 2004) or it can be determined by trial and error (Taha and Lucero, 2005). In this paper, after implementing different mother wavelets on the dataset, 10 scenarios’ acceleration responses, db3 (Daubechies, 1992) are chosen based on smoother signals at the last decomposition level.
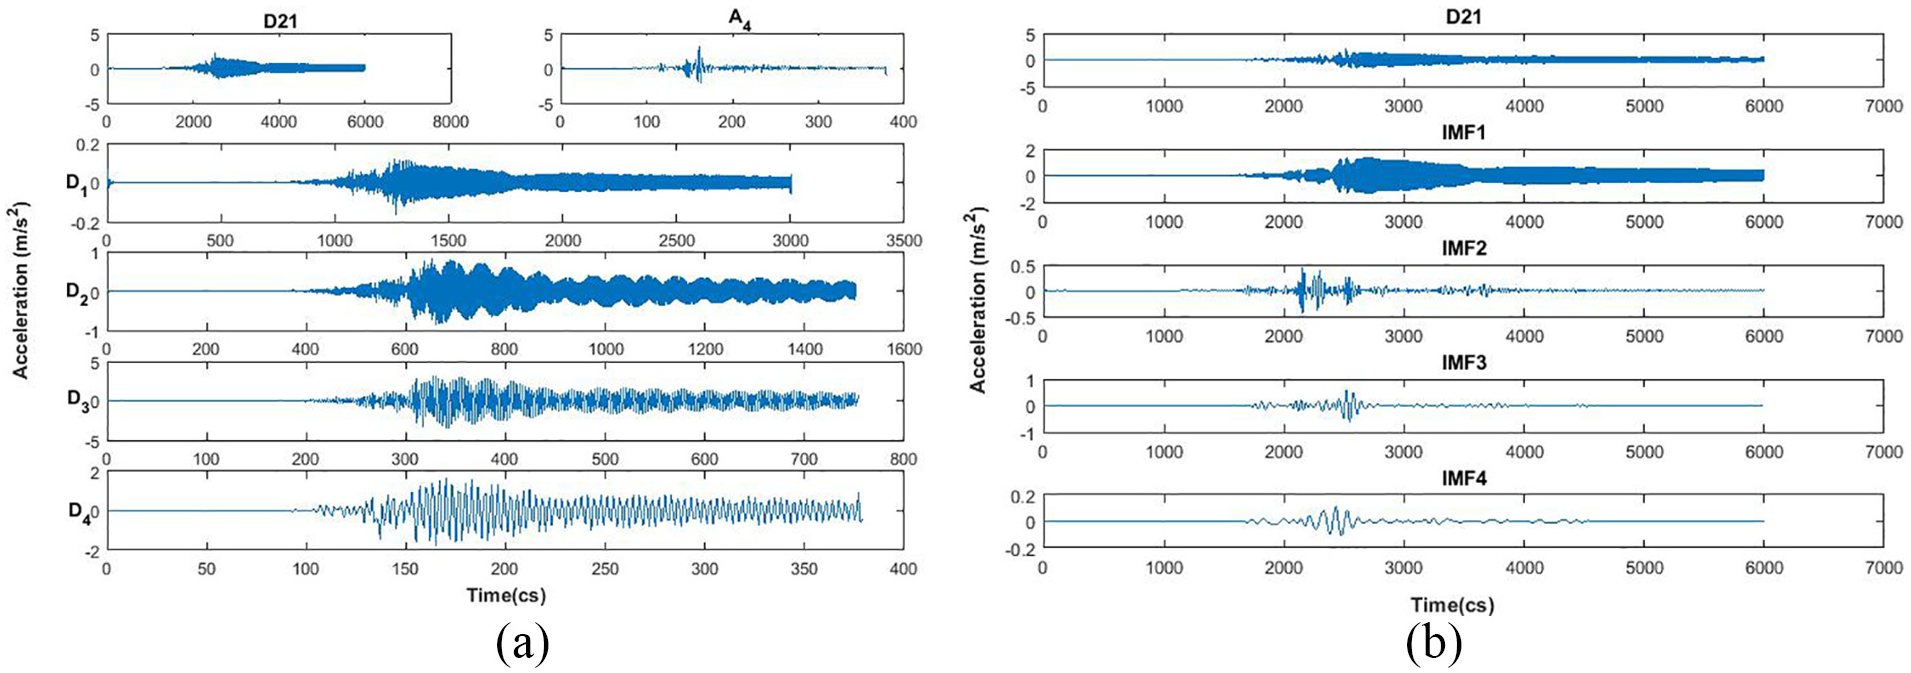
DWT and EMD decomposition process in four levels: (a) Decomposition of D21 acceleration response with DWT. (b) Decomposition of D21 acceleration response with EMD.
Multi-layer perceptron networks (MLP)
These networks are appropriate tools for SHM according to pattern recognition with accurate nonlinear mapping that leads to damage identification and classification. Proper layer and neurons’ number selection, would contribute to the integrity of the aforementioned networks.
In this paper, MLP is utilized to identify the probability of damage occurrence and its severity in the jacket platform. This MLP consists of two hidden layers with five neurons based on trial and error. The function of the training process is “newff” and the transfer functions are “logsig” and “purelin.” Indeed, the performance function is based on Mean squared error. Also, the method which is used in the calculation of MLP’s weights is backpropagation. The input data is divided into three parts: the training, validation, and test ratios are 70%, 15%, and 15%, respectively.
Application of ANN in dynamic feature extraction
Here, the output acceleration responses from sensors are processed by EMD and DWT at first. Then a supervised neural network in a healthy condition of the platform is trained with wavelet coefficients and IMFs separately. In both signal processing methods, predicted responses from the network are compared to the targets (extracted or real responses) and the energy of this error signal is computed. This MLP (trained by healthy signals) is utilized for damaged scenarios as well and by calculating the relative error between error signals’ energy of damaged scenarios and the average of some healthy scenarios, the severity of damage is obtained. The proposed methodology based on EMD through MLP is summarized here:
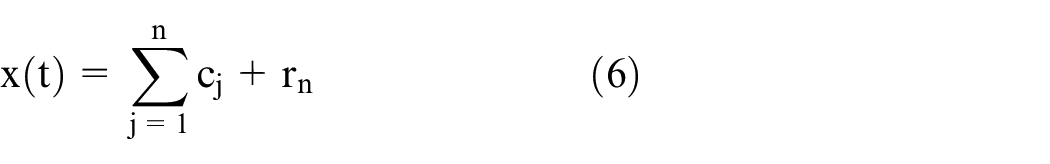
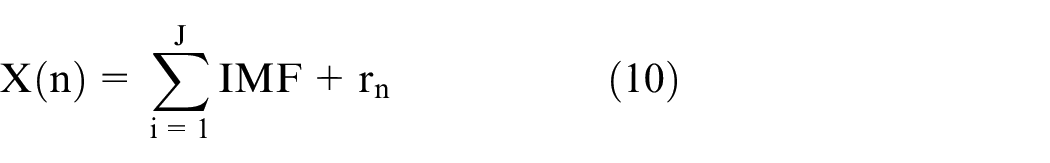
An arbitrary signal is composed of IMFs and the residual signal:
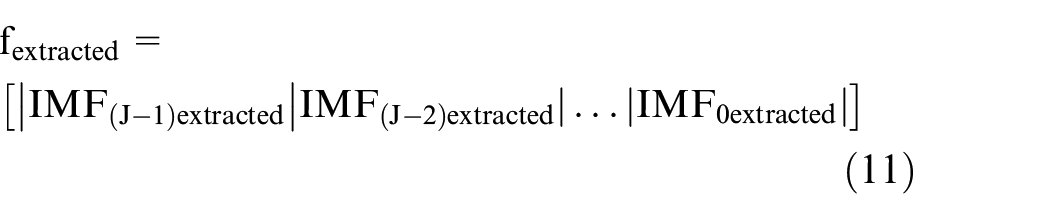
Here an EMD factor (f) is introduced below.
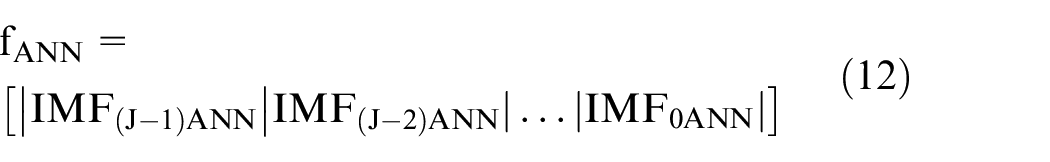
The error between extracted and ANN factors (


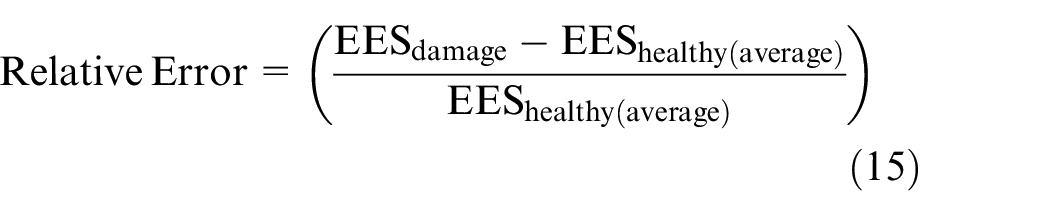
It is necessary to find this energy for several healthy scenarios at first, reaching to healthy average, then compute the relative error between any damaged scenario’s EES and the healthy (average) EES.
This procedure is repeated for wavelet coefficients in combination with ANN to find its accuracy against the EMD-NN method. Instead of using IMFs, wavelet coefficients (approximation and detail signals) are applied. As far as we know, the aforementioned procedure is proposed for the first time in this paper and the whole algorithm is shown in Figure 3.
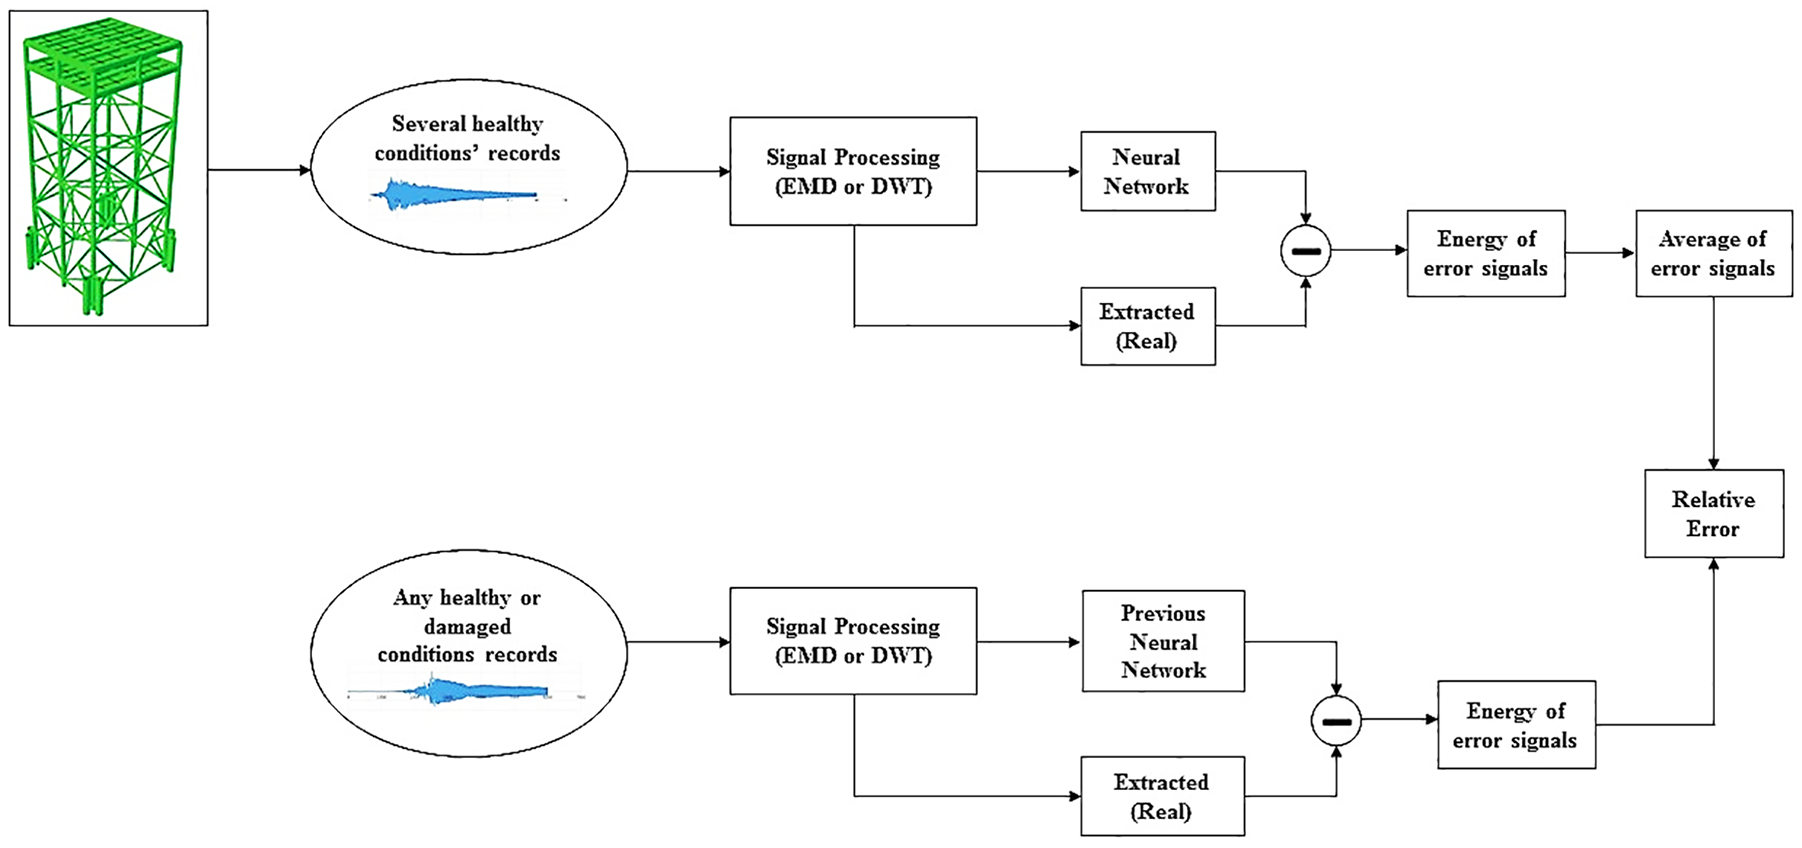
Proposed damage probability and severity detection.
The envelope of obtained signals’ energy
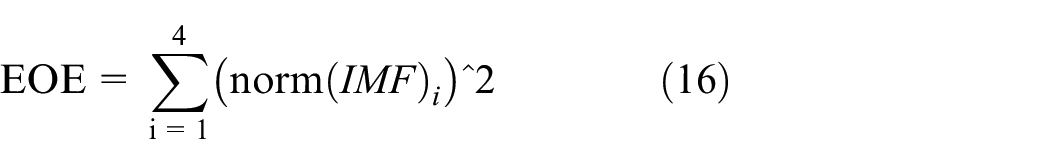
In the EMD and DWT domain, the energy envelope of IMFs and wavelet coefficients would result in damage location estimation which is one of the SHM concerns. In this paper, signals are decomposed in four levels and the mother wavelet in DWT is considered db3. The energy of decomposed signals from EMD (EOE) and wavelet (EOW) in both damaged and undamaged structure (platform) are computed below:
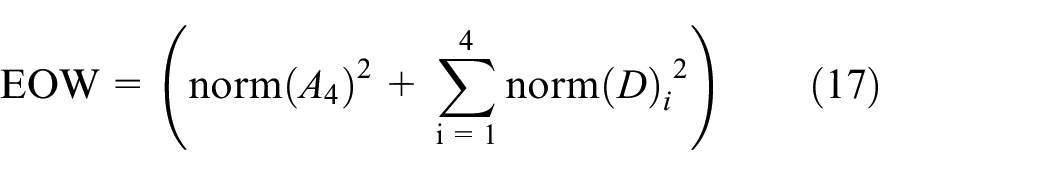
The ratio of damaged platform signals to the undamaged in each domain is proposed as a damage location index that the prominent value depicts the damage vicinity.

En, and Ed stand for the energy of non-damaged and damaged signals that calculate from (16) and (17).
Case study: Damage detection in jacket type offshore platform
To evaluate the aforementioned methods, an experimental test on a scaled offshore platform, which is built in the KNTU structural laboratory and inspired by one of the Persian Gulf’s offshore platform, is implemented. The dimensions of the lab platform are scaled by a factor of 1/15. Due to operating constraints, the thickness of members, welding, and the impossibility of constructing a platform with Young’s modulus of 1/15 to Young’s modulus of steel, the platform will have different dynamic characteristics to the main platform. Initial designs have been made according to the market research of steel sections with the thicknesses of 2, 3, 4, 5, and 6 mm, which are also excellent in weldability. For determining steel yield stress, several samples of accessible steel sections have been examined by tensile tests. Designers considered fy = 265–285 MPa (Asgarian et al., 2016) for the steel yield stress.
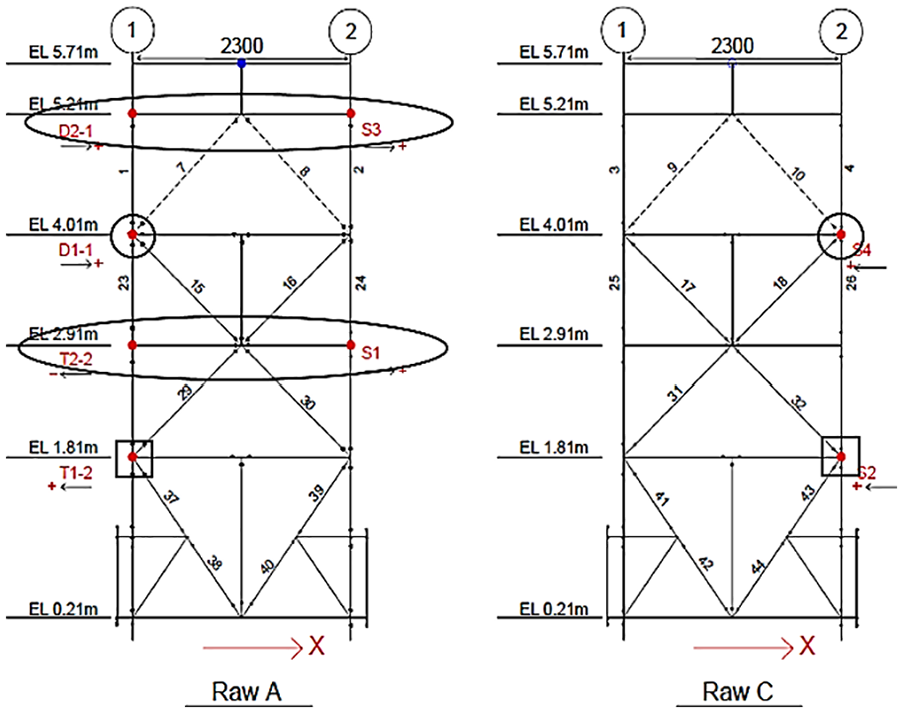
The deck mass is assumed by 15 mm plates on the first and second floors. The diameter of the legs is 48 mm and the thickness is 3 mm, also the braces diameter and thickness are 34 mm and 3 mm, respectively. The intersectional beams with box sections, used in the deck, are 60 × 40 × 3 mm. In joints positions, the legs thicknesses are increased by 5 mm due to joints cans. Full penetration welds are considered at connections and CO2 gas is used in this procedure (Asgarian et al., 2016). The plans and elevations of the jacket platform are shown in Figure 4.

Scaled jacket platform’s plan and elevation (in mm).
Pile and soil are discarded in the scaled platform and the boundary conditions are hinge-based on the fully rigid foundation of the lab.
Manufacturers used a mass shaker as the vibration device for producing harmonic excitation which consists of two rotating masses that are connected by four gearwheels and was installed on platform deck (Figure 5). It is activated by a three-phase motor, but for converting single-phase electric power to the motor, a transducer is used.

Vibration device for producing harmonic excitation and its position.
This set can apply sinusoidal load in the range of 0.0–10 Hz within 0.1 Hz intervals, also the amount of force applied to the structure can increase by adding one-kilogram mass to the system.
In this paper, vibration loading is conducted by the increase in applied frequency from 1 Hz to 5 Hz by 0.2 Hz intervals. To measure the acceleration response of the structure, manufacturers used eight accelerometers in the x-direction. These accelerometers are connected to a 24-channel data logger TMR and all data is stored continuously on the computer. Due to the limited number of accelerometers, the arrangement is based on having access to different levels of the platform.
The severity of damage via ANN with EMD and DWT
This method deals with the severity of damage and the intended ANN will use DWT coefficients and IMFs from EMD.
By different loading on the offshore platform, acceleration signals in each sensor are recorded for 60 s by 0.01 s time step. Both the ENV method and the NN used in this paper are not sensitive to loading type and its duration due to the calculations based on proportion to base state (healthy scenario). These signals are processed by EMD and DWT so the sub-signals would be considered for the ANN (Figure 3). Four left-handed accelerometers are considered as the inputs of ANN and the rest of them (right-handed) are the desired targets. Here in Figure 6, the location of the corresponding input and target sensors are shown.
Corresponding sensors as inputs and targets for ANN.
The vibration tests on the platform were conducted under the indoor laboratory conditions of the KNTU Structural laboratory on four consecutive days between 9 a.m. and 10 a.m. Under the same monitored laboratory temperature, ergo the influence of temperature variations, sun radiation, temperature gradient, and wind are negligible. Only the operating conditions and measurement errors might be of concern which have less significant impact on the damage detection process, especially that the raw signals are processed by EMD and DWT that are good D21, D11, T22, and T12 are considered as inputs for neural network and S3, S4, S1, and S2 as targets to teach the network. The relative errors on the energy of the error signal (between healthy and damaged cases) are achieved. It is valuable to mention that this method can recognize lower levels of damage besides severe damages. The applied three scenarios are base state (scenario1), removing brace 15 (scenario 7) and replacing braces 15 and 30 with denoted one (scenario10).
According to the results, wavelet is more capable of denoising signals than EMD (Figure 7). In the wavelet domain the error signal’s value (Figure 7(a)-3) and standard deviation from error histogram (Figure 7(a)-4) are lower, also outputs match targets better than the EMD method (Figure 7(a)-1). Obviously, the correlation coefficient (R) in the wavelet domain is closer to 1 which leads to more acceptable regression (Figure 7(a)-2). This procedure is done for four input accelerometers so the wavelet and EMD energy of the error signal can then be calculated for all sensors and the summation of them is intended. The process is repeated for other loading conditions.
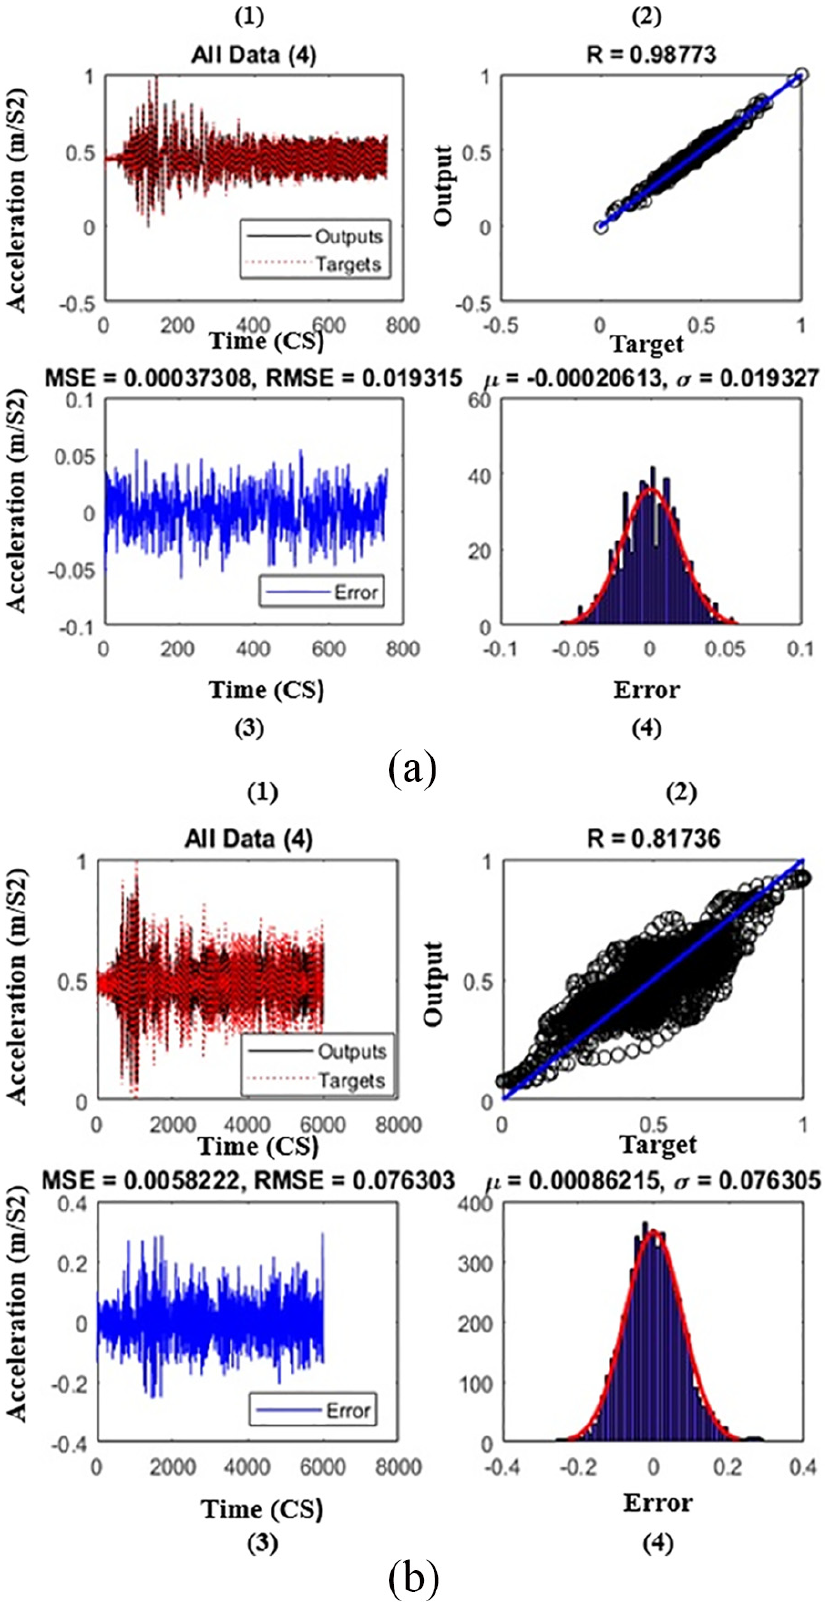
NN energy results in DWT and EMD domain: (a) Training NN with DWT energy for the base state. (b) Training NN with EMD energy for the base state.
By considering several loading conditions (different frequencies), the average of base state signals’ energy could be computed in EMD and Wavelet domain so the results would be a reference to reach the severity of damage in other scenarios. It is worth mentioning that differences between energies are not caused by the level of synchronization with natural frequencies of the model because the proposed method calculates the proportion of damage to healthy scenarios. In Table 1 wavelet and EMD error signals energy during base state (healthy) observations of jacket platform are displayed.
Wavelet and EMD energy of error signals for base state (healthy) observations.
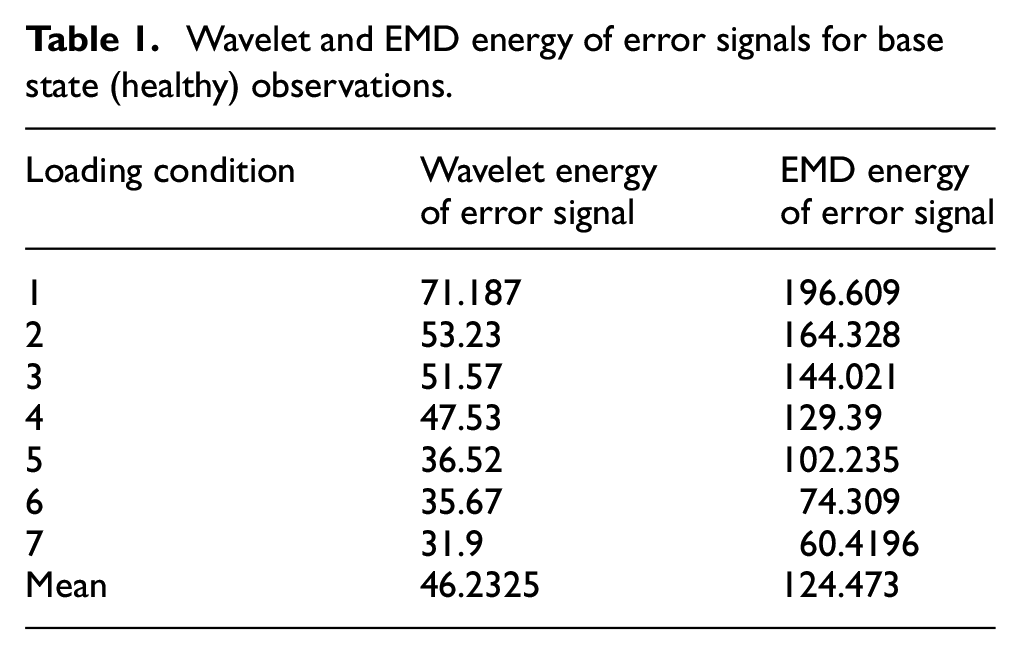
As mentioned, EMD is less capable of denoising the signal so higher energy of error signal in the EMD domain means that ANN is not trained as efficiently as in the wavelet domain.
Near a hundred extracted signals had been examined by the aforementioned algorithm (Figure 3). We considered the signals obtained from three different states of the platform including the healthy state, moderate damage in a few members, and severe damage. It was observed that the damage index for the healthy state of the platform does not exceed 0.3. Now, the proper threshold to differentiate the healthy data from damaged data can be calculated through the average of the data plus three times the standard deviation of the healthy data (threshold = mean ± 3σ). This threshold corresponds to 99.73% of the data within the threshold range. Since the mean is close to zero and the standard deviation is 0.1, then the threshold will be 0.3. Now, any data with a damage index higher than 0.3 is considered as not healthy or damaged, and any data with a damage index higher than the double of the threshold, 0.6, is considered as severe damage.
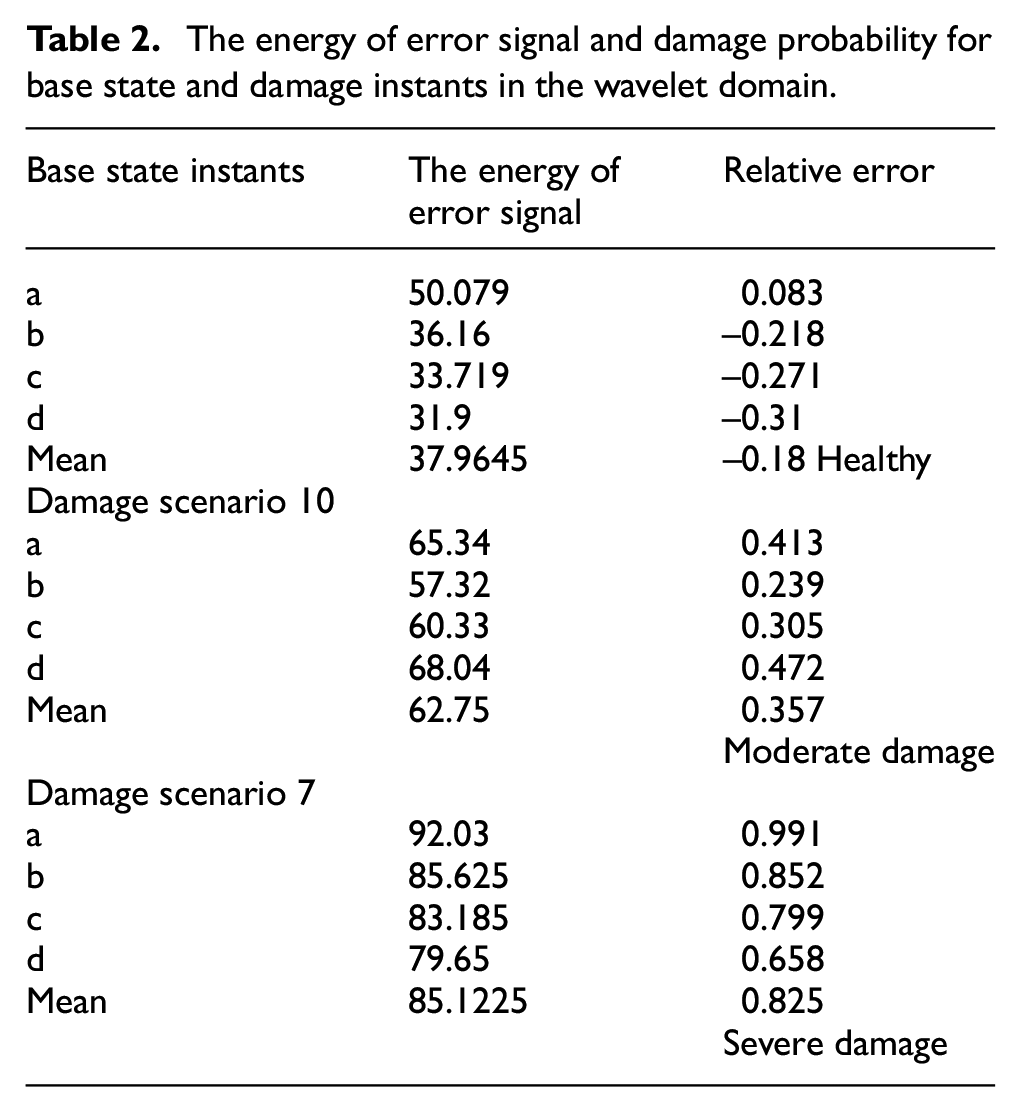
Tables 2 and 3 show the results of this process. The third column shows the relative error between different scenarios and base state mean calculated in Table 2. Negative relative errors define healthy structures with lower energy than the reference. Here relative errors lower than 0.3 are considered healthy, between 0.3 and 0.6 could be moderate damage, and higher than 0.6 could be assumed as severe damage.
The energy of error signal and damage probability for base state and damage instants in the wavelet domain.
The energy of error signal and damage probability for base state and damage instants in the EMD domain.

By using equations (11)–(15) the energy of error signal and damage severity are calculated. As it is seen, scenario number 10 has a lower level of damage than scenario number 7, so removing one member is more critical than replacing one or even two members with a lower diameter. The average of the energy of the error signal in scenario 10 is very high which definitely leads to damage occurrence. This procedure is repeated in the EMD domain and the ratio of damage scenarios 10 and 7 to the base state are 1.46 and 2.24 in Wavelet domain and 1.34 and 1.91 in EMD domain respectively. These results declare that DWT could create a better distinction between healthy and damaged scenarios.
Damage scenarios for energy ratio envelope
The common damage scenarios occurred in platforms are generated in the tested structure on hinge-based condition (Table 4). Braces and legs diameters decreased to 27.6 mm and 42 mm respectively in scenarios by replacing members with lower diameter ones. The natural frequency of each scenario is obtained by applying Fourier transform on acceleration response.
Damage scenarios.
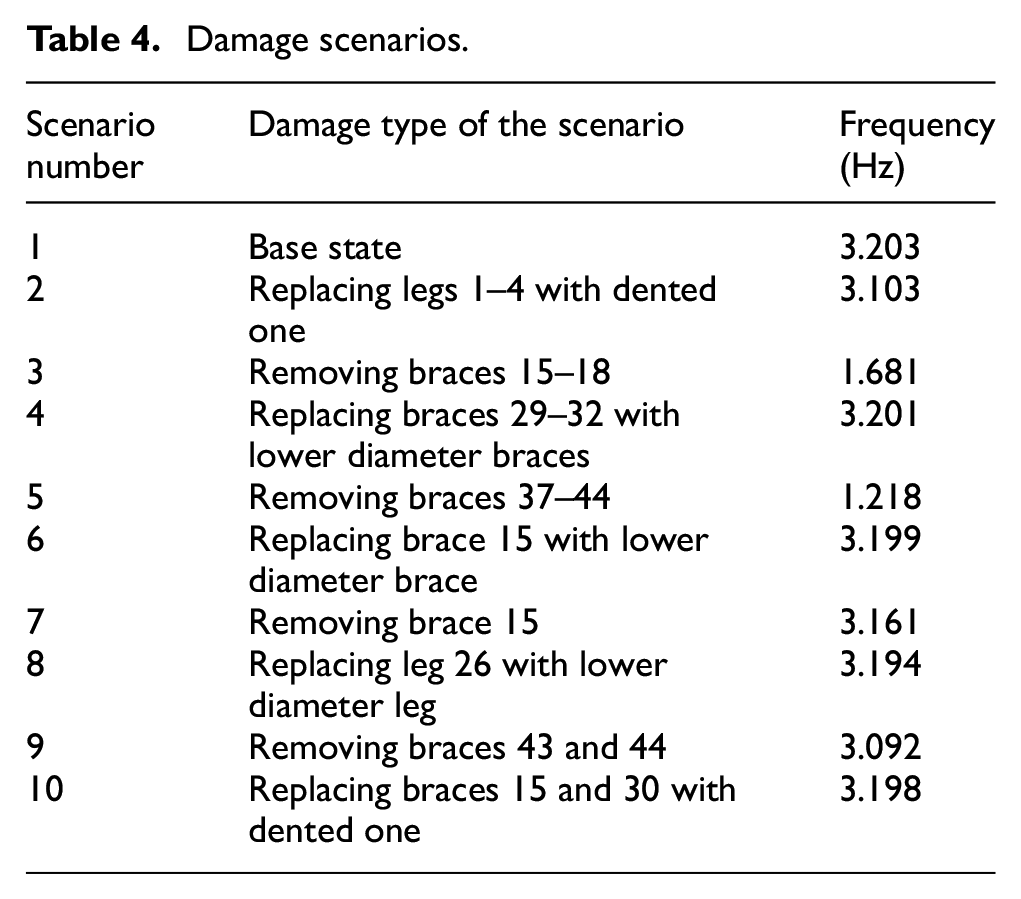
Scenarios 1 to 5 are carried out on the laboratory model and in all cases, symmetric damages are applied to this regular structure. The loading direction is x and x-direction accelerometers (D21, D11, T22, and T12) are recorded because correspondence sensors show the same results. In these scenarios, we can achieve damaged floors. Scenarios 6 to 10 have asymmetric damages and all eight x-direction sensors were recorded. Higher energy envelopes (for IMFs in EMD and Wavelet coefficients) in each scenario are significant (Figure 8).
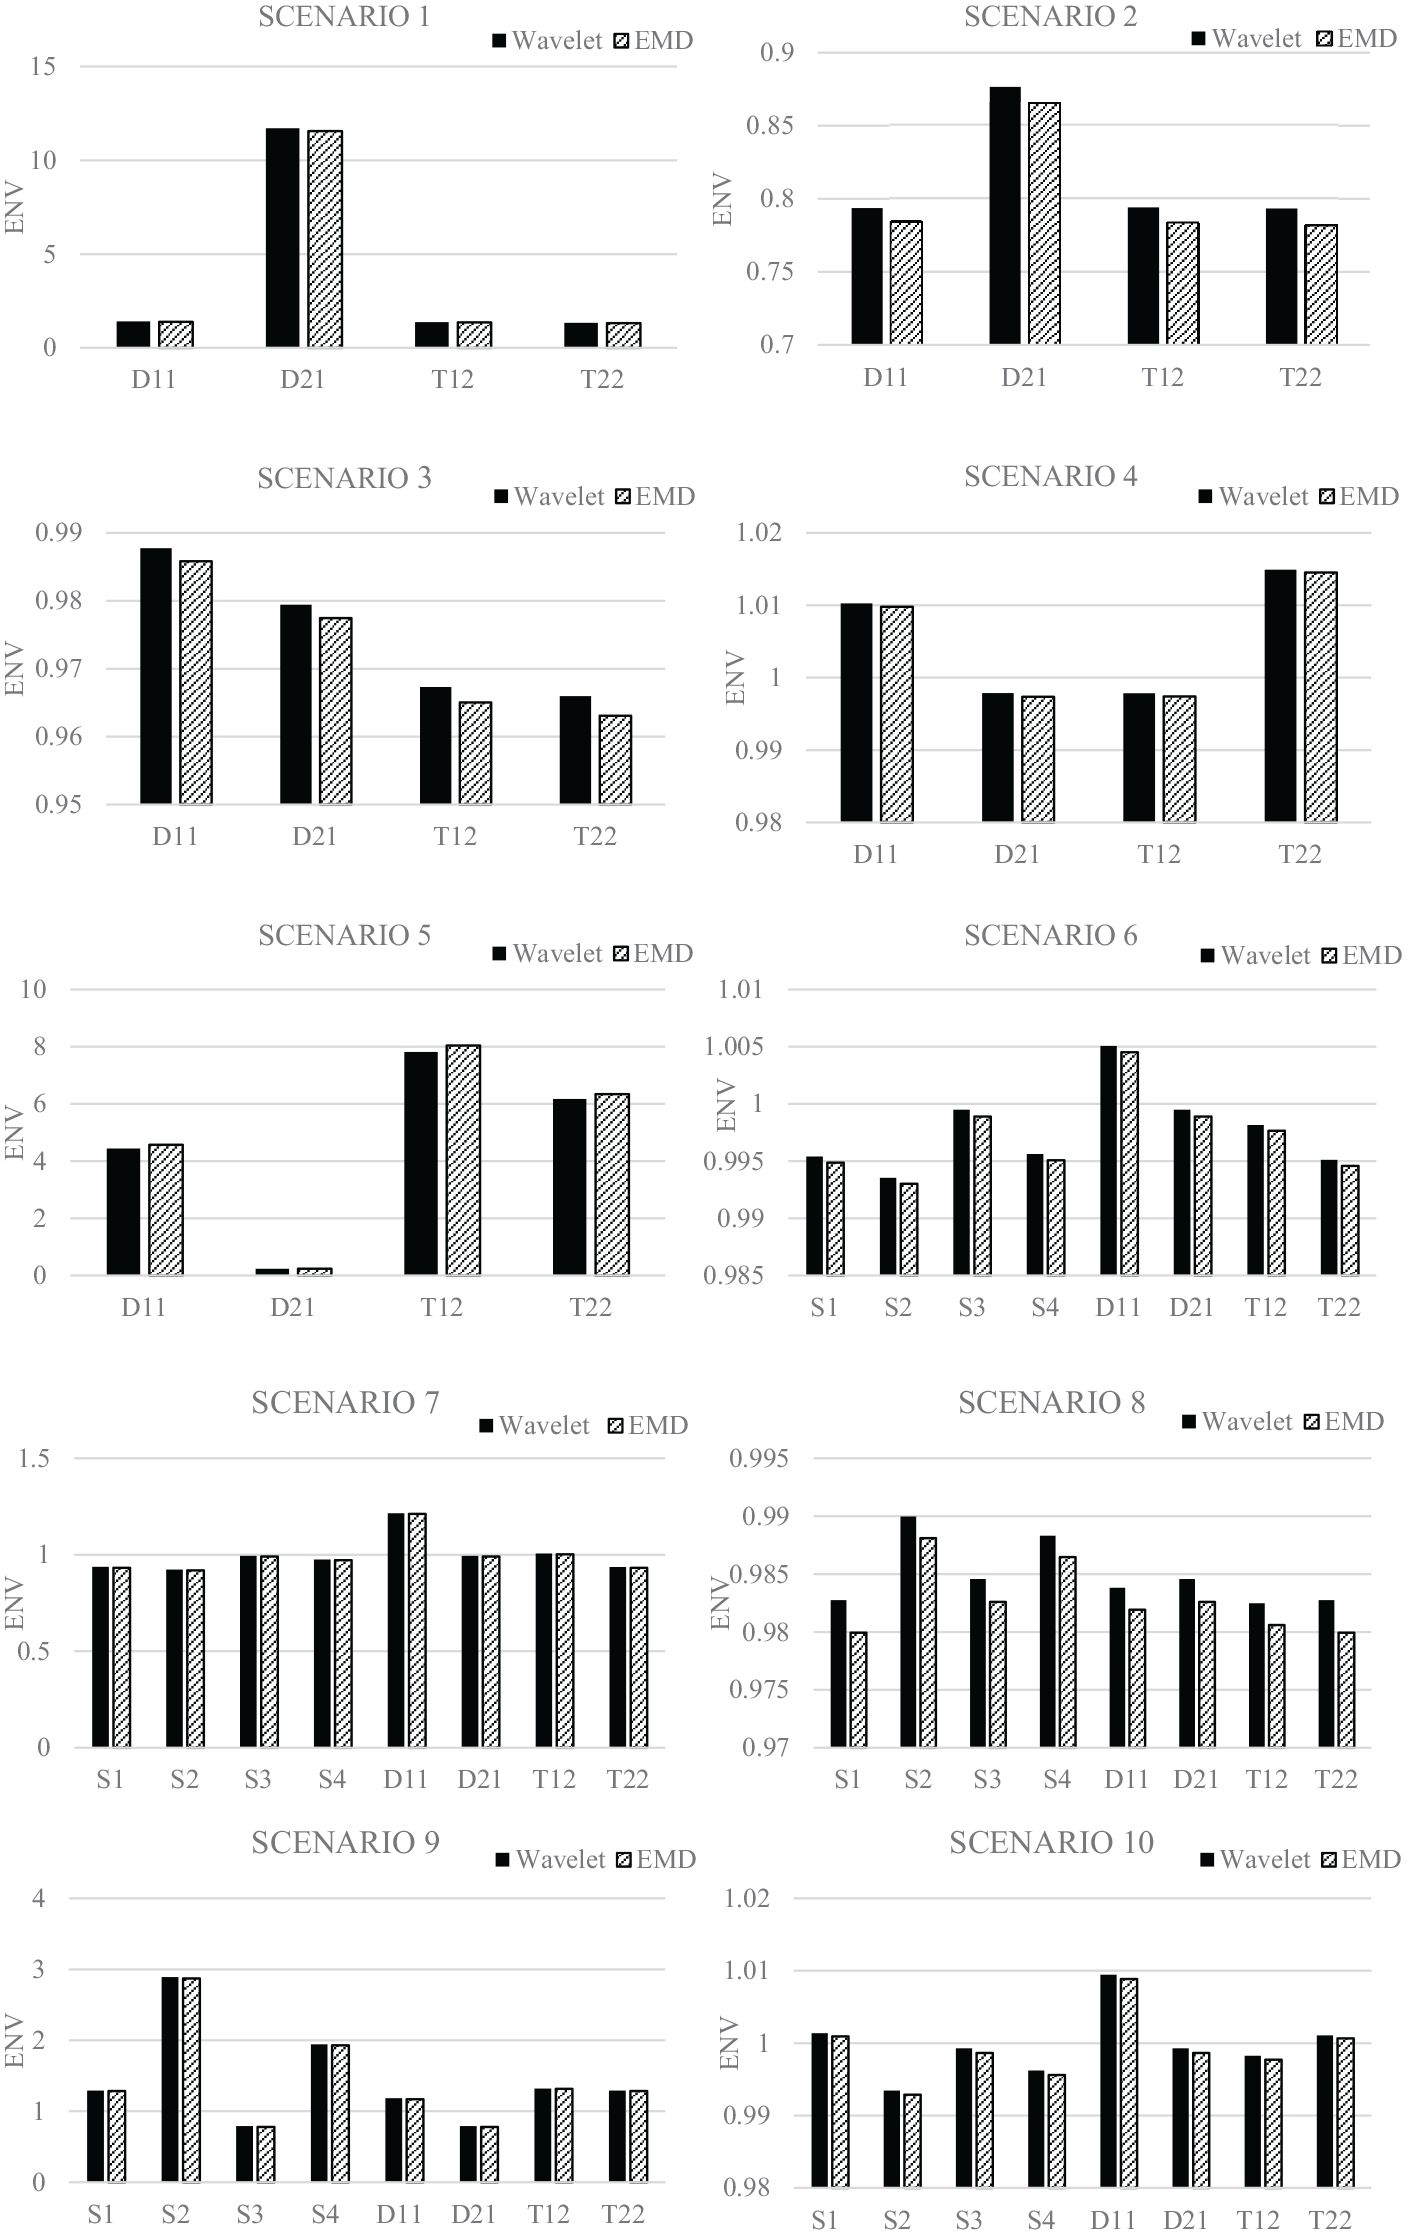
Energy ratio envelope for each damage scenario.
Results and discussion
The damage location is approximately achieved in this method by considering sensors with a higher ratio of energy envelopes. From Figure 9, it is obvious that sensors located in damaged vicinity have higher ENV in comparison to other sensors. For instance, in scenario 3, braces 15-18 are removed so sensor D1-1 shows desirable ENV due to its near distance to damage location. By this method, the conformity of ENV and damage location is proven in both wavelet and EMD domain. Also, the severity of damage as indicated completely in part 6 is obtained by EMD and wavelet transform through a neural network (MLP). It is noteworthy to mention that the wavelet has more desirable results than EMD caused by a better denoising process. The correlation coefficient in the wavelet domain is closer to 1 which expresses acceptable regression.
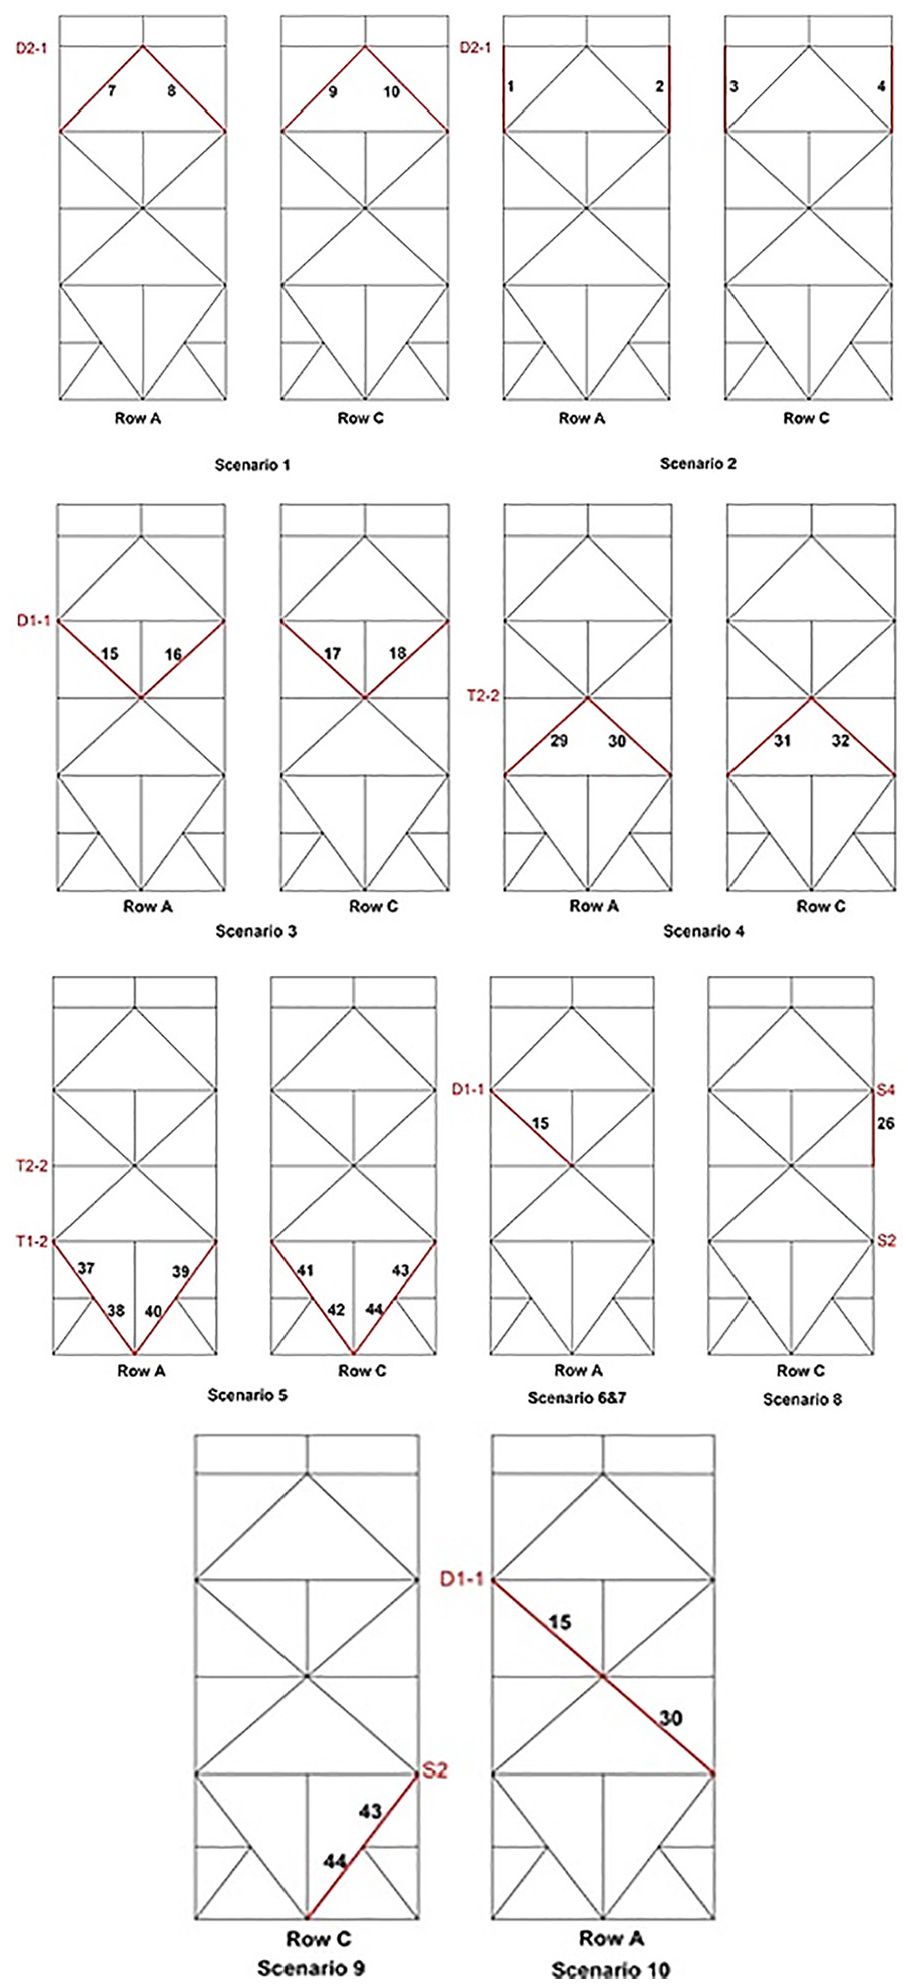
The conformity between damage location and the sensor with the highest ENV.
Conclusion
In this study, two competitive major signal processing methods that is, Empirical Mode Decomposition (EMD) and Discrete Wavelet Transform (DWT) were applied to raw acceleration responses of scaled Khaje Nasir Toosi University (KNTU) benchmark jacket type offshore platform. These signal processing methods have been used in numerous researches for damage detection purposes but never in a comparative issue to achieve each efficiency. It was found that DWT is more sensitive to damage than EMD due to better noise reduction. Moreover, the application of DWT is simpler and the computational time is less compared to EMD.
This research proposes Energy Ratio Envelope (ENV) on acceleration responses of the platform in EMD and wavelet domain for detection of damage location. It was observed that the damage occurred in members located near sensors with a higher ENV index. The severity of damage and its presence were obtained by the relative error between any damaged scenarios’ Energy of Error Signal (EES) and the healthy EES. EES was also conducted by comparison between extracted signals and signals predicted from ANN. Thus, the gap between the damaged scenario EES and the healthy EES indicates the severity of the damage. The mentioned methods are not sensitive to loading type, support conditions, and types of connections while most SHM techniques are sensitive to these conditions. Also in both methods, energy indices are used instead of applying modal parameters such as mode shapes or frequency which are not sensitive to damage. It is worth mentioning that these methods can identify damage occurrence with fewer sensors in comparison to common methods in SHM.
Footnotes
Acknowledgements
The experimental data of the scaled jacket type offshore platform was provided by the third author. POGC (Pars Oil and Gas Company) under project No. 132 (Investigation of Structural Health Monitoring of Steel Jacket Offshore Platforms) has supplied financial support for this investigation.
Declaration of conflicting interests
The author(s) declared no potential conflicts of interest with respect to the research, authorship, and/or publication of this article.
Funding
The author(s) received no financial support for the research, authorship, and/or publication of this article.