
Abstract
Through assuming reasonable constitutive relation of materials, finite element analysis (FEA) models of joints consisting of prestressed concrete-encased steel beams and concrete-encased concrete filled steel tube (CFST) columns were established by soft ABAQUS, and the simulated results were compared with tested ones. On this basis, the nonlinear analysis on the total loading process was conducted, and the stress variation of concrete, profile steel skeleton, steel bar skeleton, and prestressing tendons were observed at yield, peak, and ultimate loads; the influence of axial compressive ratio, steel tube ratio, stirrup ratio, and prestressing level on lateral load-displacement curves at column top and shear force-shear angle in joint core were investigated, and the shear capacity formulae of joint core were developed. It could be concluded that, the lateral peak loads and shear capacity could be improved with the increase of axial compressive ratio, steel tube ratio, stirrup ratio, and prestressing levels in varying degrees, and the ductility of joints will reduce with the increase of axial compressive ratio. Additionally, the shear capacity calculated by proposed practical formula was a little lower than FEA results, which could keep the joints safety and could be used in engineering design.
Introduction
Prestressed concrete-encased steel (CES) frames, also called prestressed steel reinforced concrete (SRC) frames, could well realize the requirements of long-span, heavy-load and earthquake resistance of buildings due to the combined advantages of both CES frames and ordinary prestressed reinforced concrete (RC) ones, which have been widely studied and used in China in recent years (Fu et al., 2010; Kurosawa et al., 2019; Song et al., 2015; Xiong et al., 2018; Xu et al., 2020). In conventional prestressed CES frame structures, prestressed CES beams and concrete-encased cross-shaped steel columns were adopted as members (Fu et al., 2007; Mirza et al., 2004; Ricles et al., 1994), but since prestressing tendons and steel bars derived from beams could probably penetrate the flanges and webs of profile steels in joint zone, which come from CES columns, some defects including complicated details and shear capacity reduction in joint zone will commerce. To resolve previous issues, concrete-encased concrete filled steel tube (CFST) columns were proposed to replace ordinary concrete-encased cross-shaped steel columns to construct a novel type of prestressed CES frame structure (Wang et al., 2016a, 2017).
In order to ensure the continuity of steel tubes in the joint, and facilitate the reinforcements layout and concrete pouring, the details of the beam-column joint area proposed in this paper were illustrated in Figure 1. Here, the steel beam are welded on the outside of the steel tube; two annular internal diaphragms with the same thickness as steel flanges are welded on the inside of steel tube at the position of the steel flanges to ensure the internal force transmission of the steel flanges; the upper and lower longitudinal steel bars and prestressing tendons in beams pass through the joint area from both sides of steel tube; the stirrups in core area are welded on both sides of the steel web. Certainly, other connecting forms, such as external diaphragm, partial external diaphragm, and through-bolts with end plate, could also be accepted (Li et al., 2020).
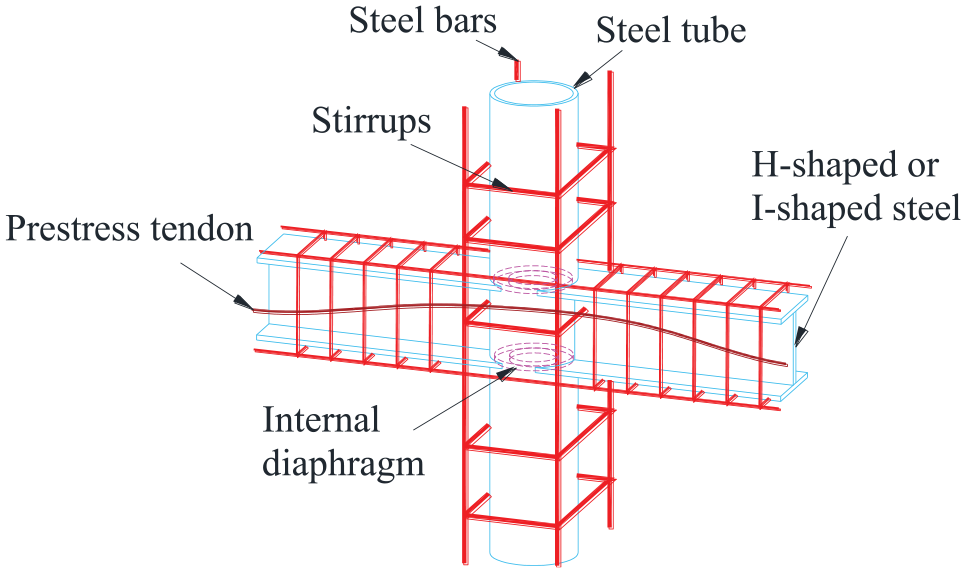
Joint details.
At present, extensive studies on concrete-encased CFST columns have been conducted, especially in the aspects of axial compression, combined compression and bending, earthquake resistance, and staged construction performance (An et al., 2014; Han et al., 2014; Ji et al., 2014a, 2014b; Qian et al., 2016; Yuan et al., 2018), which behaved perfect mechanical properties and ductility. Hence, the concrete-encased CFST columns have been popularized and applied in China, and related design methods have been adopted into the China Engineering Construction Standardization Association: 2005. Furthermore, owing to the high bending capacity, large cross-sectional stiffness, and favorable seismic performance, prestressed concrete-encased steel beams are especially valid for structures with demands of crack width and section depth limitation (Wang et al., 2009; Xue et al., 2009; Yao et al., 2014, 2018), and the corresponding design approaches have been improved, which have been provided in China’s standard JGJ 369-2016. However, there are still a lack of research on performance of the composite joints made up of concrete-encased CFST columns and prestressed concrete-encased steel beams.
In recent years, due to the emergence of various section forms for beams and columns, more and more attentions have been paid to the seismic behavior and shear capacity of beam-column joints (Behnam et al., 2018; Ding et al., 2017; Wang et al., 2016b), where the joint types with concrete-encased CFST columns are mainly focused on its connection with steel beams or RC beams. Liao et al. (2014) tested the composite joint consisting of concrete-encased CFST column to steel beams or reinforced concrete beams, and the influence of joint types, axial compression ratio, and concrete slab were observed. Qian et al. (2017) established a fined finite element numerical model of concrete-encased CFST column to steel beam joint with floor slab, and pointed out that the shear force in the joint core was resisted by the concrete in and out of steel tube, the steel tube, the stirrups as well as the steel beam web; Li et al. (2020) experimentally evaluated the hysteretic behavior of steel beam to concrete-encased CFST column joints on the basis of different connection details proposed, and it was found that joints with the external diaphragm and through-beam details exhibited the most favorable seismic performance; Wang et al. (2020) developed a novel on-site assembled connection between concrete-encased CFST columns and steel beams, and numerical and analytical results illustrated that this innovative connection performed favorable structural behavior; Nie et al. (2012) carried out experimental study and finite element analysis on the joints of concrete-encased CFST columns and RC beams with outer stiffening ring, and it was concluded that this type of joint showed good seismic performance and bending failure at beam ends could be guaranteed. Moreover, Deng et al. (2006) investigated the hysteretic behavior of prestressed RC beam to concrete-encased CFST column joints, and found that the shear capacity in joint core improved greatly due to the existence of the steel tube.
Since there were few reports on design methods of the novel composite joints consisting of prestressed concrete-encased steel beams and concrete-encased CFST columns, finite element analysis (FEA) joint models were established by software ABAQUS in this article according to preceding tests, and subsequently the failure process and mechanical mechanism were further investigated. Based on extensive parameter analysis including axial compression ratio, steel tube ratio, stirrup ratio, and prestressing level, prediction formulae of shear capacity in joint core were proposed, which could provide somewhat supports for designing the new type of connection.
Experiment overviews
In preliminary experimental study performed by our group (Wang and Luo, 2019), structural hysteretic performance on three prestressed concrete-encased steel beam to concrete-encased CFST column joint specimens, named SJ-1, SJ-2, and SJ-3 were conducted subjected to lateral low cyclic loading, where the detailed configuration of these specimens are presented in Figure 2. For convenience of analysis, the prestressing tendons were lay out in straight line in upper portion of beams, and the prestressing levels λ were assumed as 0.39, 0.59, and 0.50 respectively. Here, the prestressing level is calculated by equation (1), where the contribution of steel web is neglected.
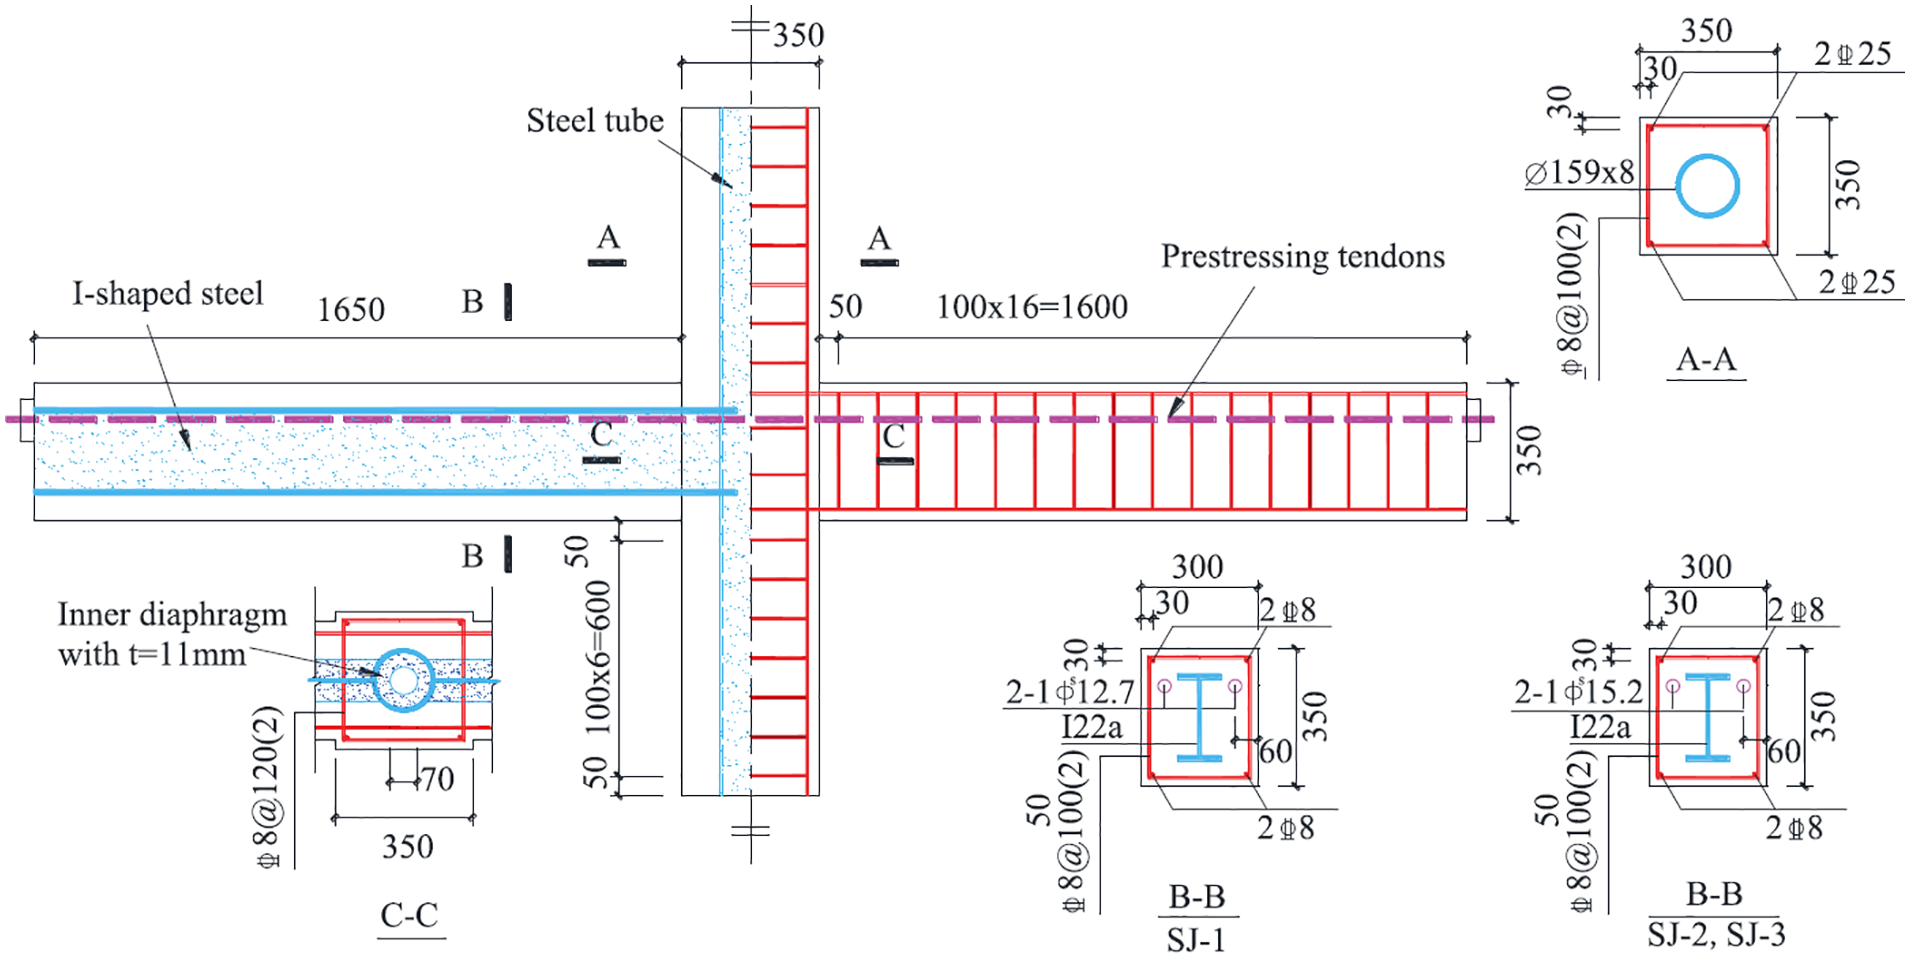
Size and reinforcement of interior joint specimens.
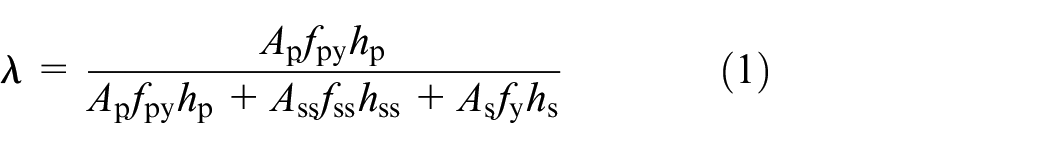
Where, Ap, Ass, and As are the cross-sectional areas of tendons, tensile I-shaped steel flange and tensile steel bars in beam, respectively; fpy, fss, and fy are the tensile yielding strength of tendons, I-shaped steel and steel bars; hp, hss, and hs are the distances from centroid of tendons, tensile steel flange and tensile longitudinal steel bars to extreme compressive fiber, respectively.
In these specimens, the strength grade of concrete was C40, the grade of steel bars including longitudinal rebars and stirrups was HRB400, and the prestressing tendons adopted the steel strands, where the grades of 1670 and 1860 were respectively for nominal diameter of 15.2 and 12.7 mm (
The loading test setup was shown in Figure 3. During the experiment process, the vertical load was firstly imposed on the top surface of the upper column by a self-balancing apparatus, which was composed of a hydraulic jack, two rigid welded steel bases, and four high-strength rods, where the second-order effects was not considered because the vertical load acted along the column axis. In accordance with the definition developed by Ji et al. (2014a), the axial compression ratios for joint specimens SJ-1, SJ-2, and SJ-3 were computed as 0.34, 0.17, and 0.34, respectively. In the subsequent tests, the vertical load kept a constant magnitude, and the lateral low cyclic loads were applied on the side of upper column top by an MTS actuator, where displacement control method was used. As can be concluded from the test results, shear failure was eventually found in the core region of the three joint specimens, as shown in Figure 4.
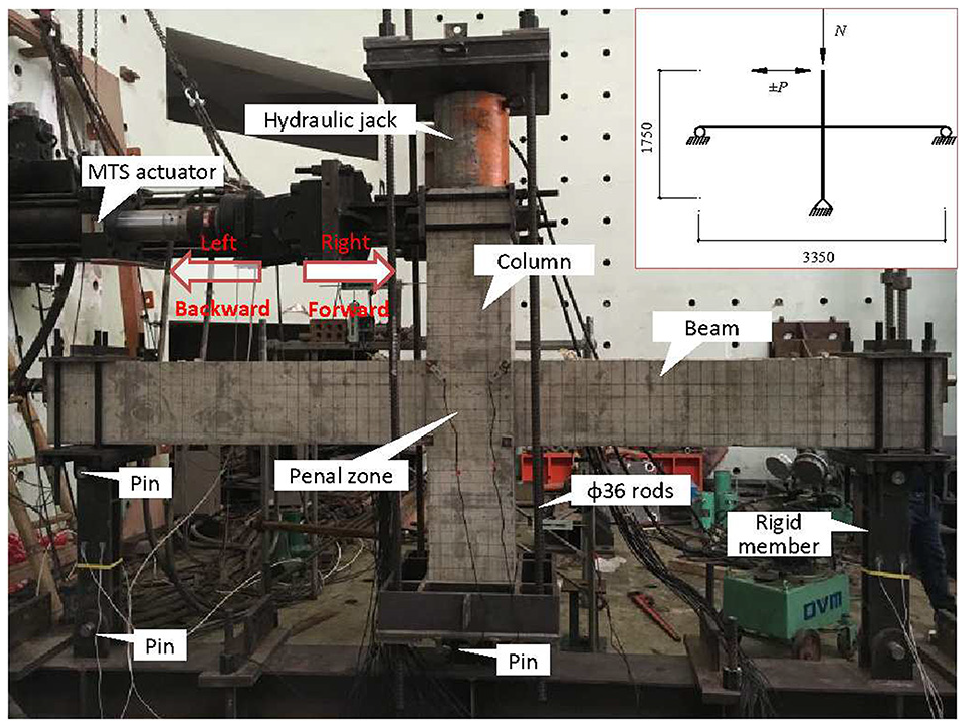
Loading test setup.

Failure modes for joint specimens: (a) SJ-1, (b) SJ-2, and (c) SJ-3.
Establishment of FEA models
Material constitutive relationship
Concrete
Since damage and stiffness recover behaviors could be considered under repeated loading, concrete damage plastic (CDP) model is used to simulate the behavior of concrete in ABAQUS (Hibbitt et al., 2003).
Axical stress-strain laws of concrete
Due to appreciable confinement effects on concrete between steel tube and stirrups, the concrete in concrete-encased CFST column is divided into three parts, including concrete in steel tube, outer concrete confined by stirrups and concrete cover. Meanwhile, neglecting the confinement of I-shaped steel beam, the concrete in prestressed concrete-encased steel beam could be categorized into two portions, concrete confined by stirrups and concrete cover. Thus, various constitutive relations were used for concrete in different position.
For concrete in steel tube subjected to compression, a steel tube confined model proposed by Han et al. (2007) was used; Han et al. (2014) also proposed a stirrup confined concrete model used in ABAQUS, which will be applied into concrete confined by stirrups in beams and outer concrete confined by stirrups in columns. For concrete cover under compression and entire concrete under tension, the uniaxial constitutive models recommended in China’s code GB50010-2010 were used.
Damage variables and stiffness recovery factors
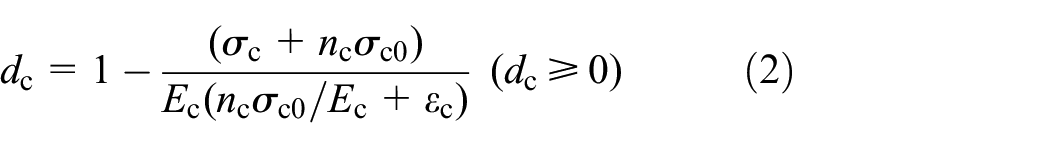
The concrete damage variables dc and dt could be computed by equations (2) and (3) according to focal point method (Li et al., 2011; Sinha et al., 1964), where nc and nt denote concrete damage index factors in compression and tension respectively; σc and σt are concrete stress in compression and tension respectively; σc0 and σt0 are uniaxial compressive and tensile strength respectively. Through many attempts of computation, the values were recommended: nc = 2 and nt = 1 for concrete in steel tube; nc = 1.2 and nt = 1 for that confined by stirrups in beams and columns; nc = 1 and nt = 1 for concrete cover. In computation, the stiffness recovery factors ωt and ωc were assumed to 0 and 0.7 respectively.

Other parameters
Through existing study (Nie et al., 2013), some parameters in this paper are determined as follows: the expansion angle ψ is 36°; the flow potential eccentricity ζ is taken as 0.1; the ratio between initial biaxial and uniaxial compressive yield strength σb0/σc0 assumes 1.16; the parameter Kc, which control the projected shape of concrete yield surface on the partial plane, is defined as 0.67, and the viscosity coefficient μ for 0.0015.
Steel tube, I-shaped steel, longitudinal rebars, and stirrups
The constitutive relations of steel tube, I-shaped steel, longitudinal rebars, and stirrups assumed the kinematic hardening model, and the Back-Stress model was used to simulate the Bauschinger effect of steel under the repeated loading. The axical stress-strain (σs-εs) curves is expressed in equation (4), where Es is the elastic modulus of the steel, fy and εy are the yield stress and strain.

Prestressing tendons
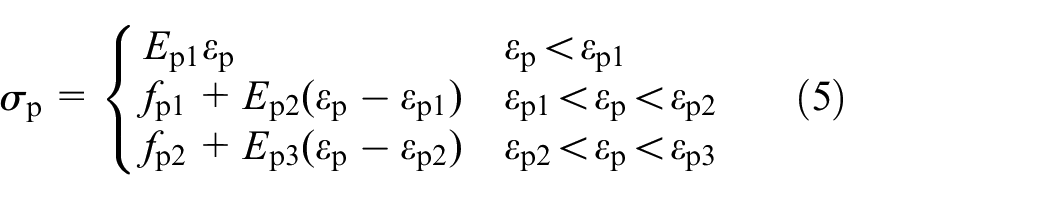
A three-fold line model established by Zheng et al. (2012) was used to describe the constitutive relationship of prestressing tendons. The stress-strain (σp-εp) relation is given in equation (5), where Ep1 and Ep2 are separately the elastic stiffnesses in the proportional and non-proportional stages, and Ep3 is the yield stiffness after the nominal yield point; fp1 and εp1 denote the stress and strain at the proportional limit point, fp2 and εp2 are the ones at nominal yield point; fp3 and εp3 are the ultimate stress and strain.
Element type, contact and constraints
Figure 5 presents the FEA model of prestressed concrete-encased steel beam to concrete-encased CFST column joint, where the concrete was simulated by 8-noded three-dimensional hexahedron element C3D8R with reduced integration; the steel tube and I-shaped steel adopted reduced integration 4-noded shell element S4R; for longitudinal rebars, stirrups, and prestressing tendons, 2-node three-dimensional truss elements T3D2 was used.
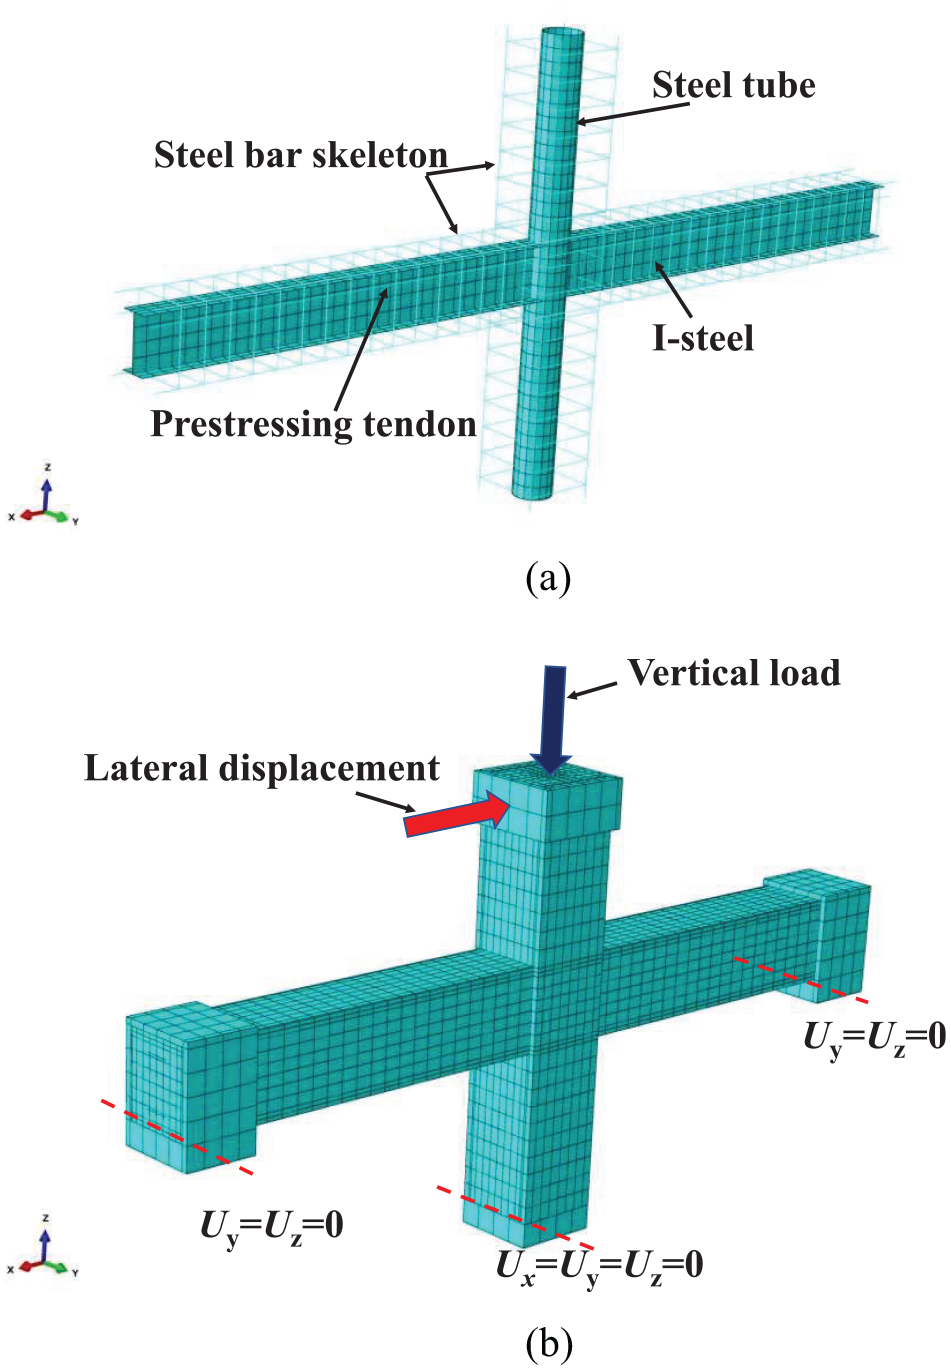
FEA model of prestressed composite joint: (a) embedded steel skeleton and (b) constraints and loading.
In this model, only the contact between steel tube and inner as well as outer concrete in columns was considered, where Hard Contact technology was used in the normal direction, and the friction complied with the coulomb friction criterion in the tangential direction (Han et al., 2007; Li et al., 2011). In order to enhance the computing efficiency, slippage between concrete and other steels was neglected, where Embed technology was used.
Before the constraints acted at two beam ends and vertical load applied on top face of column, prestressing tendons were tensioned by use of Falling Temperature Method. The constraints and load application on the FEA model were presented in Figure 5(b). The fixed hinge constraint was applied to the bottom of the column, and the movable hinge constraints at horizontal direction were set for two beam ends. The vertical load was imposed on the top face of the column and kept constant, and the horizontal load was applied to the side of the column top by displacement control method.
Calculated results
Hysteresis curves
Figure 6 compares the predicted and tested load-displacement (P-Δ) hysteretic curves. As can be concluded that: (1) the unloading stiffnesses of calculated curves were consistent with tests; (2) reversed loading curves passed through the reversed yield point, which lead to larger reversed loading stiffnesses and a plump shape, which is due to the fact that; (3) no obvious descending branches were found in the envelop of calculated hysteretic curves; (4) the predicted peak loads for three specimens were close to the tests, with differences of about 9.0%, 8.8%, and 7.3% respectively. The reason of calculated curves with larger reversed loading stiffness, plump shape, and no obvious declining tendency could be that it is difficult to consider the values of stiffness recovery factors ωt and ωc accurately during the process of crack reclosure in the CDP model.
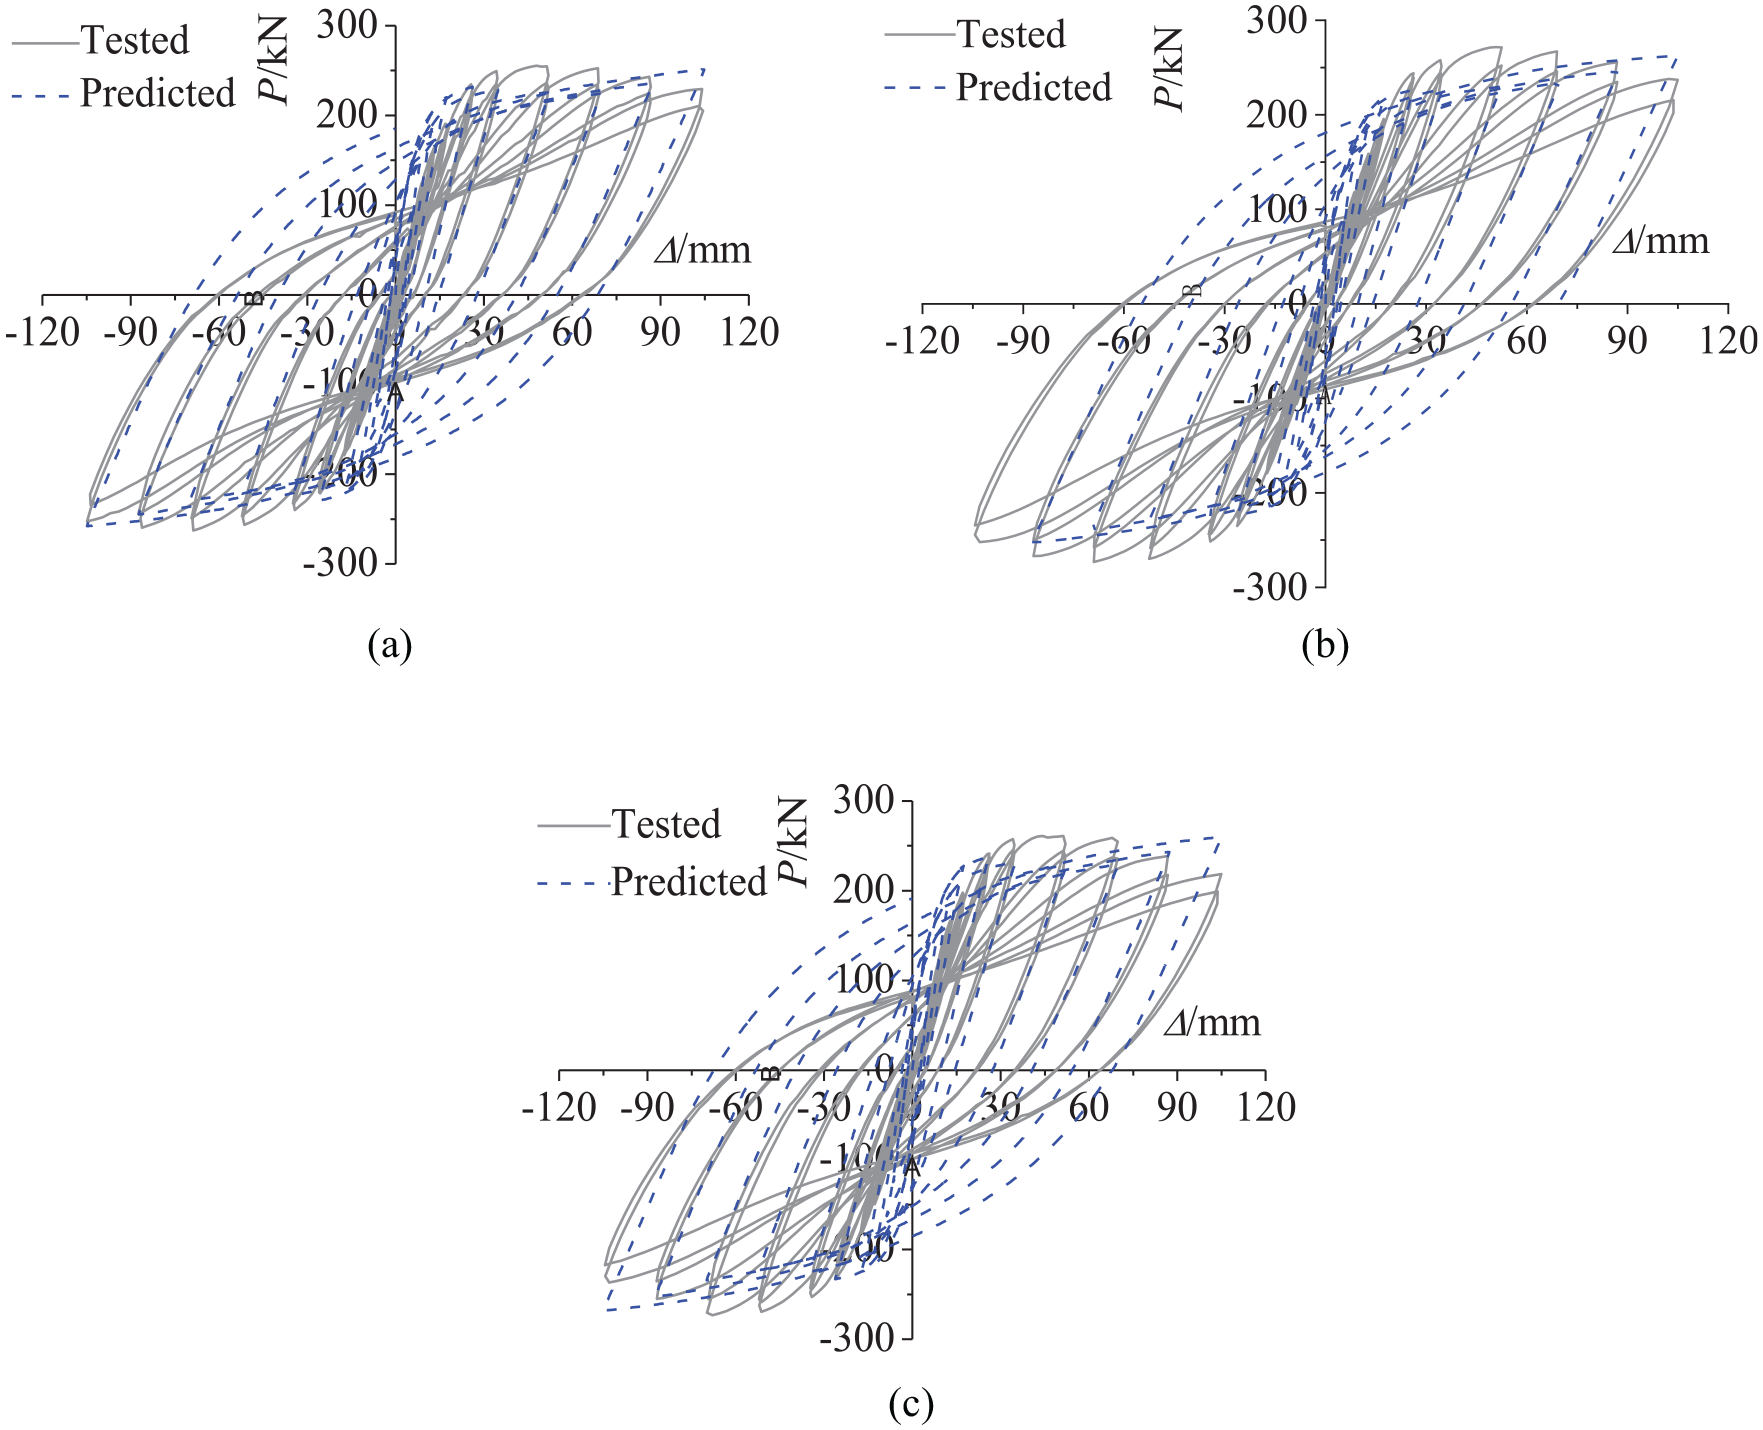
Hysteretic curves comparison between prediction and tests: (a) SJ-1, (b) SJ-2, and (c) SJ-3.
Monotonic curves
The predicted monotonic load-displacement curves and the tested hysteretic curves at column top are presented in Figure 7. It can be found that: (1) the predicted peak loads of specimens were close to the tested values, with differences of 7.45%, 14.76%, and 8.26%, respectively; (2) the calculated monotonic curves exhibited descending branch after peak loads, and the declined tendency was coincide with the test curves, which could better reflect the mechanical performance of the joints subjected to lateral loads. Therefore, the following study on loading process and mechanical mechanism for this type of joints will be conducted based on monotonic loading curves.
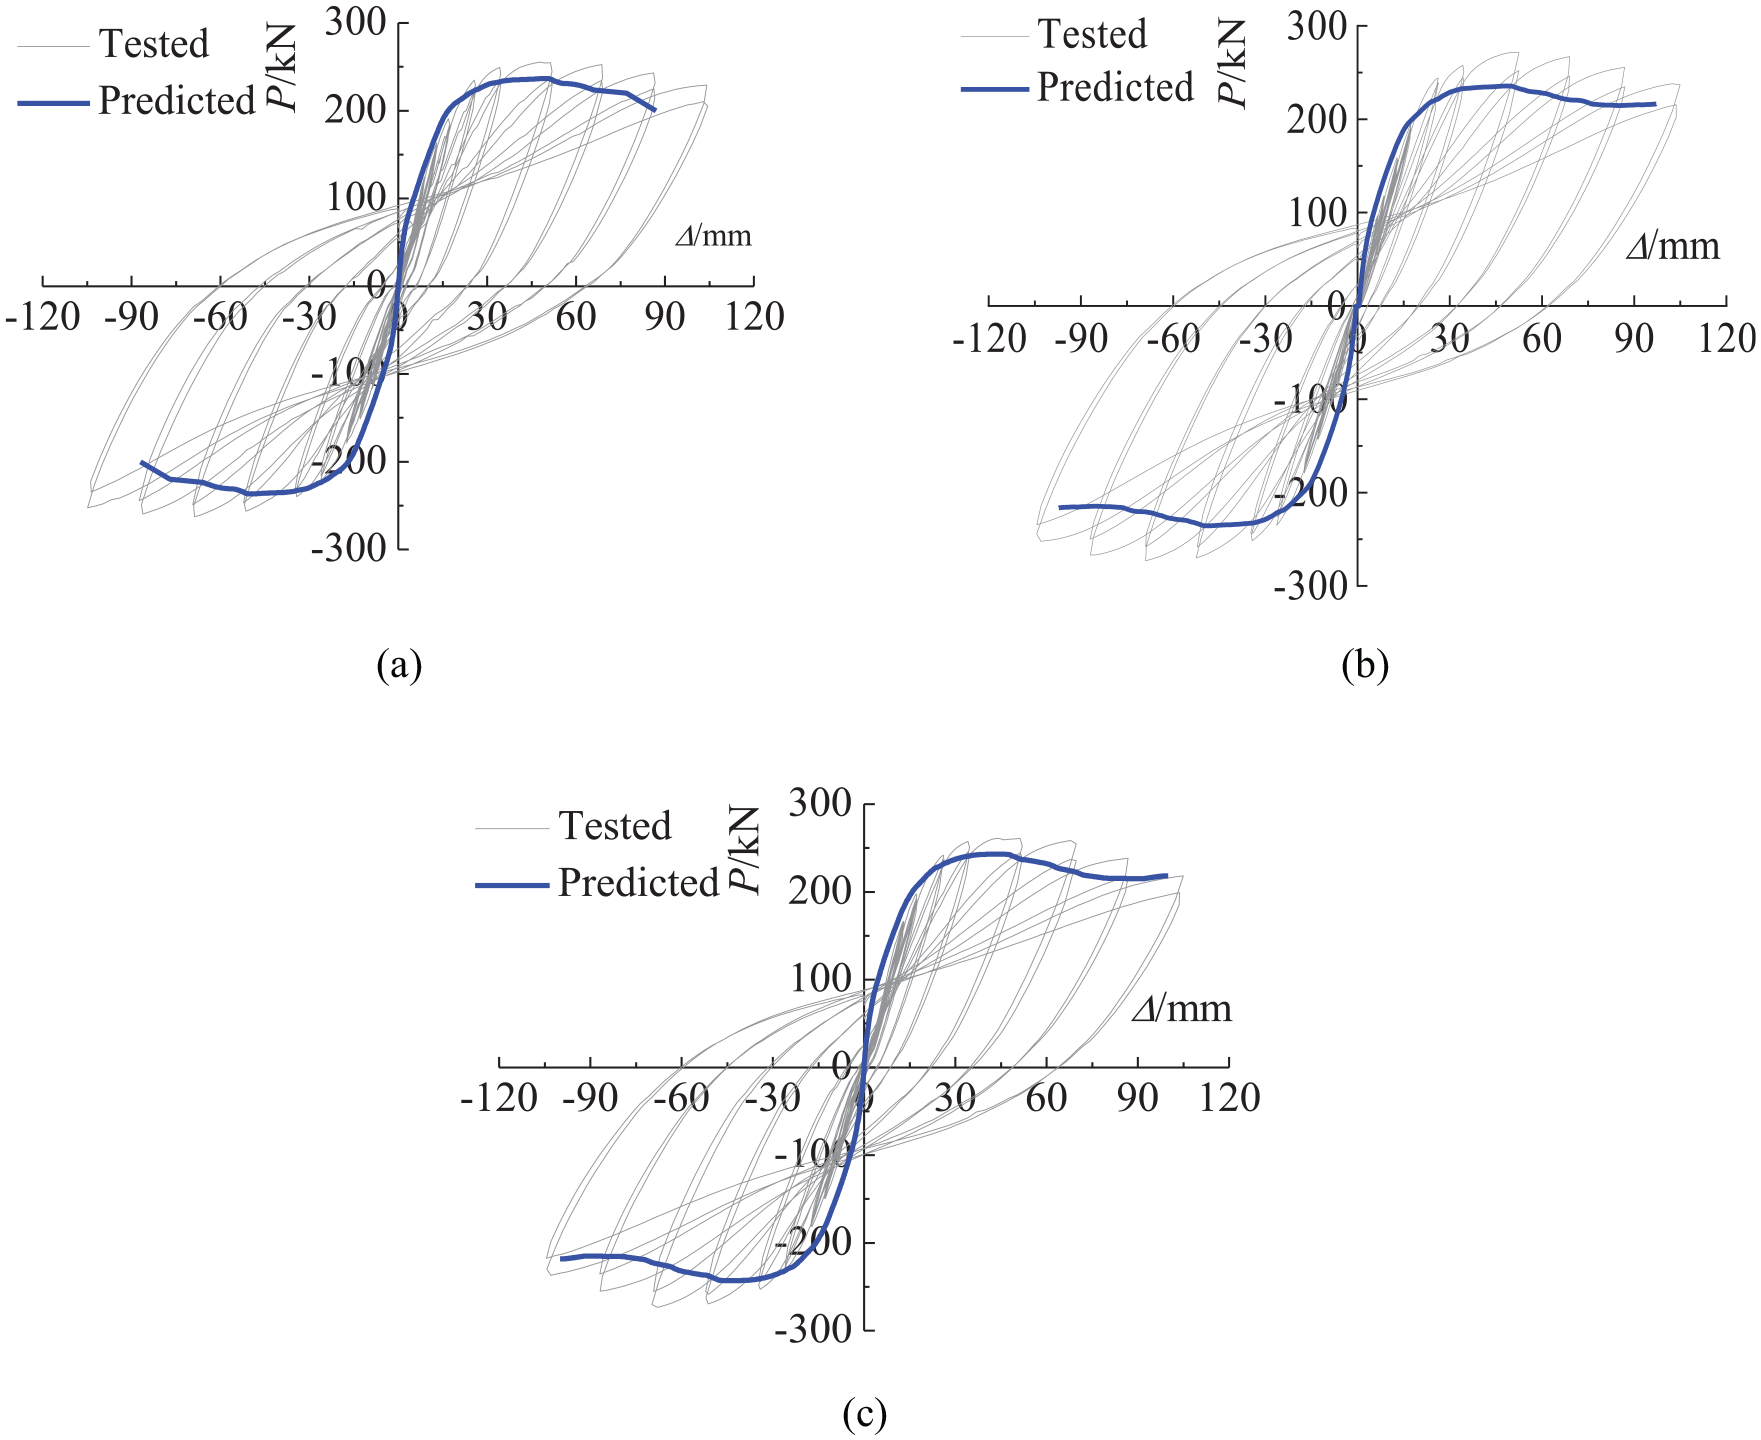
Comparison of predicted monotonic curves and tested hysteretic curves: (a) SJ-1, (b) SJ-2, and (c) SJ-3.
Failure patterns
The concrete damage could approximately reflect the failure patterns of joints. Figure 8 shows the distribution of concrete compression and tension damage (DAMAGEC and DAMAGET) for FEA joint models when the monotonic horizontal loads reached the peak values. It can be seen that the joint core area and two beam ends are severely damaged under compression with the values of damage variables exceeding 0.8, which indicated that the concrete in joint core and at beam ends of FEA models were crushed. Besides, the distribution of tension damage on beams and columns denoted that bending cracks appeared along the axis of beam and column members. By comparison, it could be found that the failure patterns predicted by FEA models are basically consistent with that of tests, which could be used for following analysis.

Failure patterns of FEA joint models: (a) SJ-1, (b) SJ-2, and (c) SJ-3.
Loading process analysis
Figure 9 presents a typical monotonic load-displacement curve at column top, where points A, B and C responds to the conditions of yield, peak load, and failure respectively; Py and Δy respectively stand for the initial yield load and yield displacement; Pmax and Δmax denote peak load and the corresponding displacement; Pu and Δu are the ultimate load and corresponding displacement, and Pu takes 0.85Pmax. In this paper, FEA model SJ-2 will be used to study the mechanical behavior during the whole loading process, and the detailed stresses of concrete and steels will be observed at the above three points.

Typical lateral load-displacement monotonous curves.
Yield point
Figure 10 presents the principal compressive stress distribution of concrete as well as the Mises stress pattern of profile steel skeleton, steel bar skeleton and prestressing tendons at the yield point for joint specimen SJ-2. As can be found that at this point the concrete in the core region had initially formed a diagonal compressive strut, and the principal compressive stresses at the lower and upper ends for left and right beams connected to the column were relatively large; the steel tube in the joint core had almost reached yield, and the upper and lower flange at the steel beam ends had also showed somewhat yielding. Simultaneously, it also indicated that part of the steel beam web connected to the steel tube in joint core were on the verge of yielding. In addition, the stirrups and prestressing tendons in the joint core zone had reached the yield stage, but the longitudinal rebars and stirrups at the beam and column ends behaved no yielding.
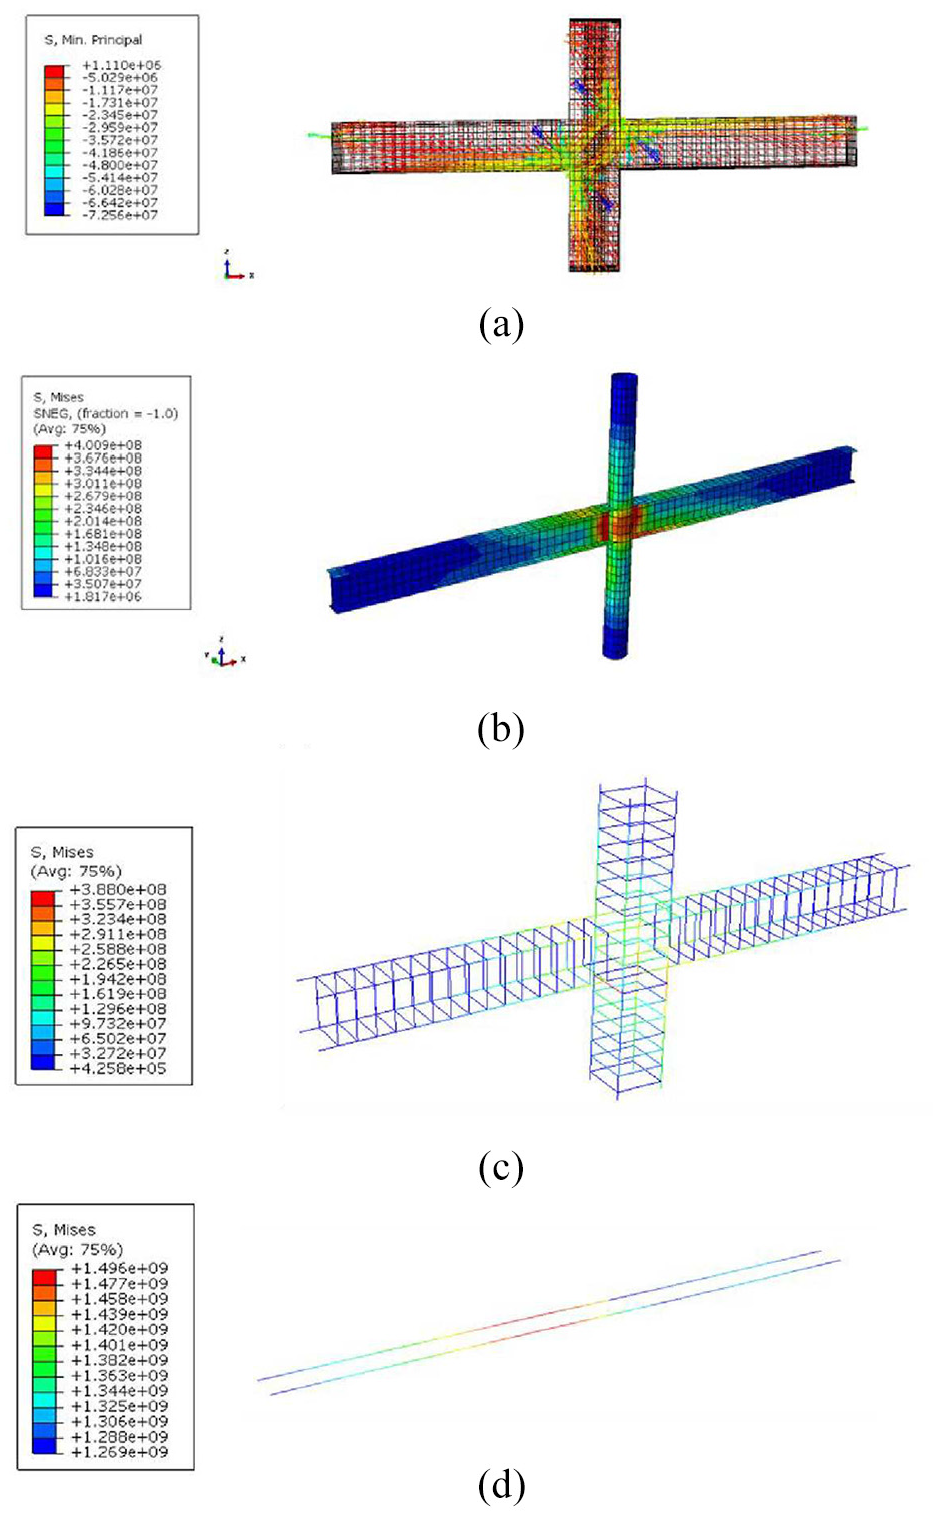
Stress distribution at yield point: (a) concrete, (b) profile steel skeleton, (c) steel bar skeleton, and (d) prestressing tendons.
Peak load point
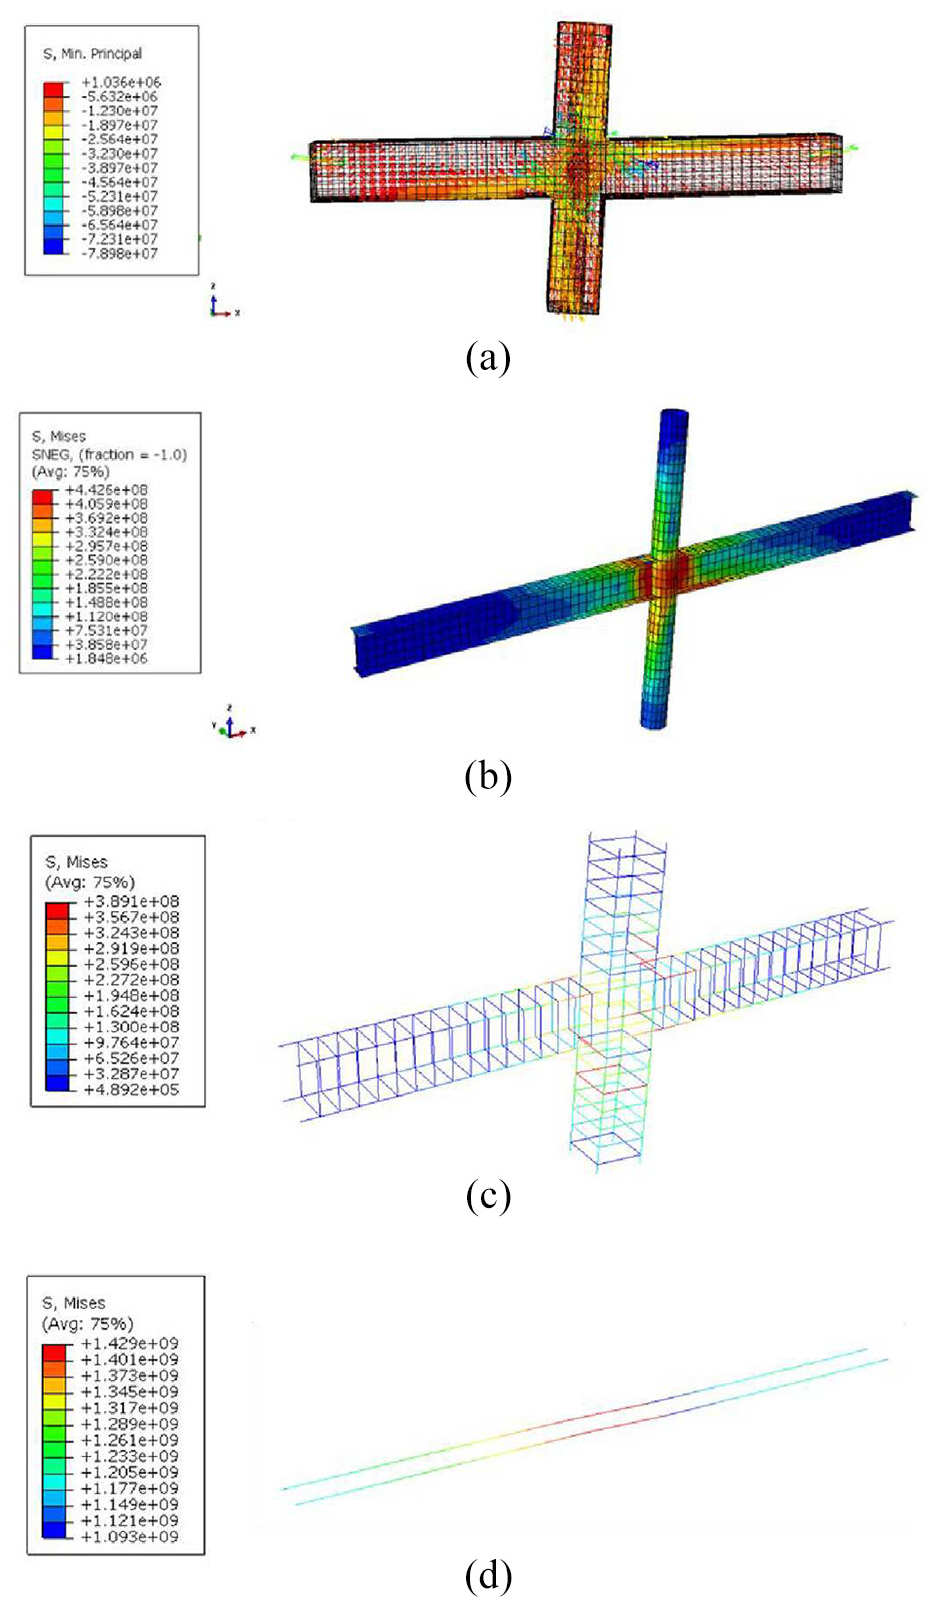
As the horizontal load at column top reached to the peak value, the stress distribution of concrete and reinforcement were shown in Figure 11. It can be found that the concrete at the joint core and beam ends had been crushed, which means that the shear capacity of the joint core reached the maximum correspondingly. Moreover, steel tube and steel beam webs in the joint core had also got completely yield, which means that the steel beam webs could resist a certain amount of shear force excepted for steel tube. At this point, the yield scope of stirrups and prestressing tendons in joint core expanded, and the stress of longitudinal rebars at beam and column ends continued to raise.

Stress distribution at peak load point: (a) concrete, (b) profile steel skeleton, (c) steel bar skeleton, and (d) prestressing tendons.
Failure point
When the horizontal load dropped to about 85% of the peak value, the failure status reached. Figure 12 gives the stress distribution of joint. Since the concrete exceeded the peak strain and its stress-strain curve entered the descending section, the principle compressive stress in joint core region reduced to some extent as compared to peak load point, while the yield range of flanges and web of I-steel beam in the joint core further broadened, with Mises stress increased slightly. Besides, it can be noted that the longitudinal bars and stirrups at beam ends reached to yield, and the maximum stress of the prestressed tendons fallen off slightly due to the crushed concrete.
Stress distribution at failure point: (a) concrete, (b) profile steel skeleton, (c) steel bar skeleton, and (d) prestressing tendons.
In summary, it can be concluded from prementioned analysis that as the horizontal load at column top reached the peak point, the steel tube, stirrup, and prestressed tendon arrived the yield status and concrete crushed in the joint core region, which can be used as a symbol for predicting the shear capacity in panel zone.
Shear capacity analysis in joint core
Shear force and shear deformation
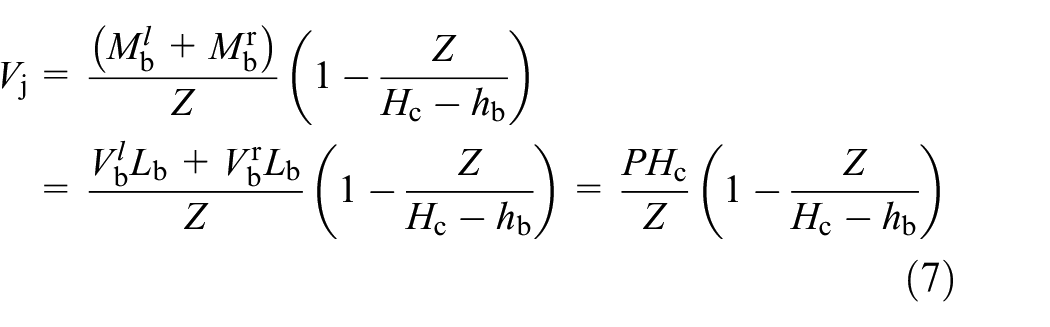
Since the axial force acted on the column top was in the axial direction and influence of second-order effect was neglected, the moment equilibrium equation could be established as expressed by equation (6) from Figure 13(a), and the shear force Vj at joint core could be computed by equation (7) based on Figure 13(b). Where, Mbl and Mbr represented the left and right beam moments at the side of column respectively; Mct and Mcb denoted the top and bottom column moment at the side of beam respectively; Vbl and Vbr were respectively the shear at left and right beam ends, and Vct and Vcb were the shear at top and bottom column ends; Nct and Ncb were the axial compressive loads in upper and lower columns; Hc was the distance from the bottom hinge support to the loading point; Z stood for the distance between couples of the resultant compressive and tensile forces in beam cross section.
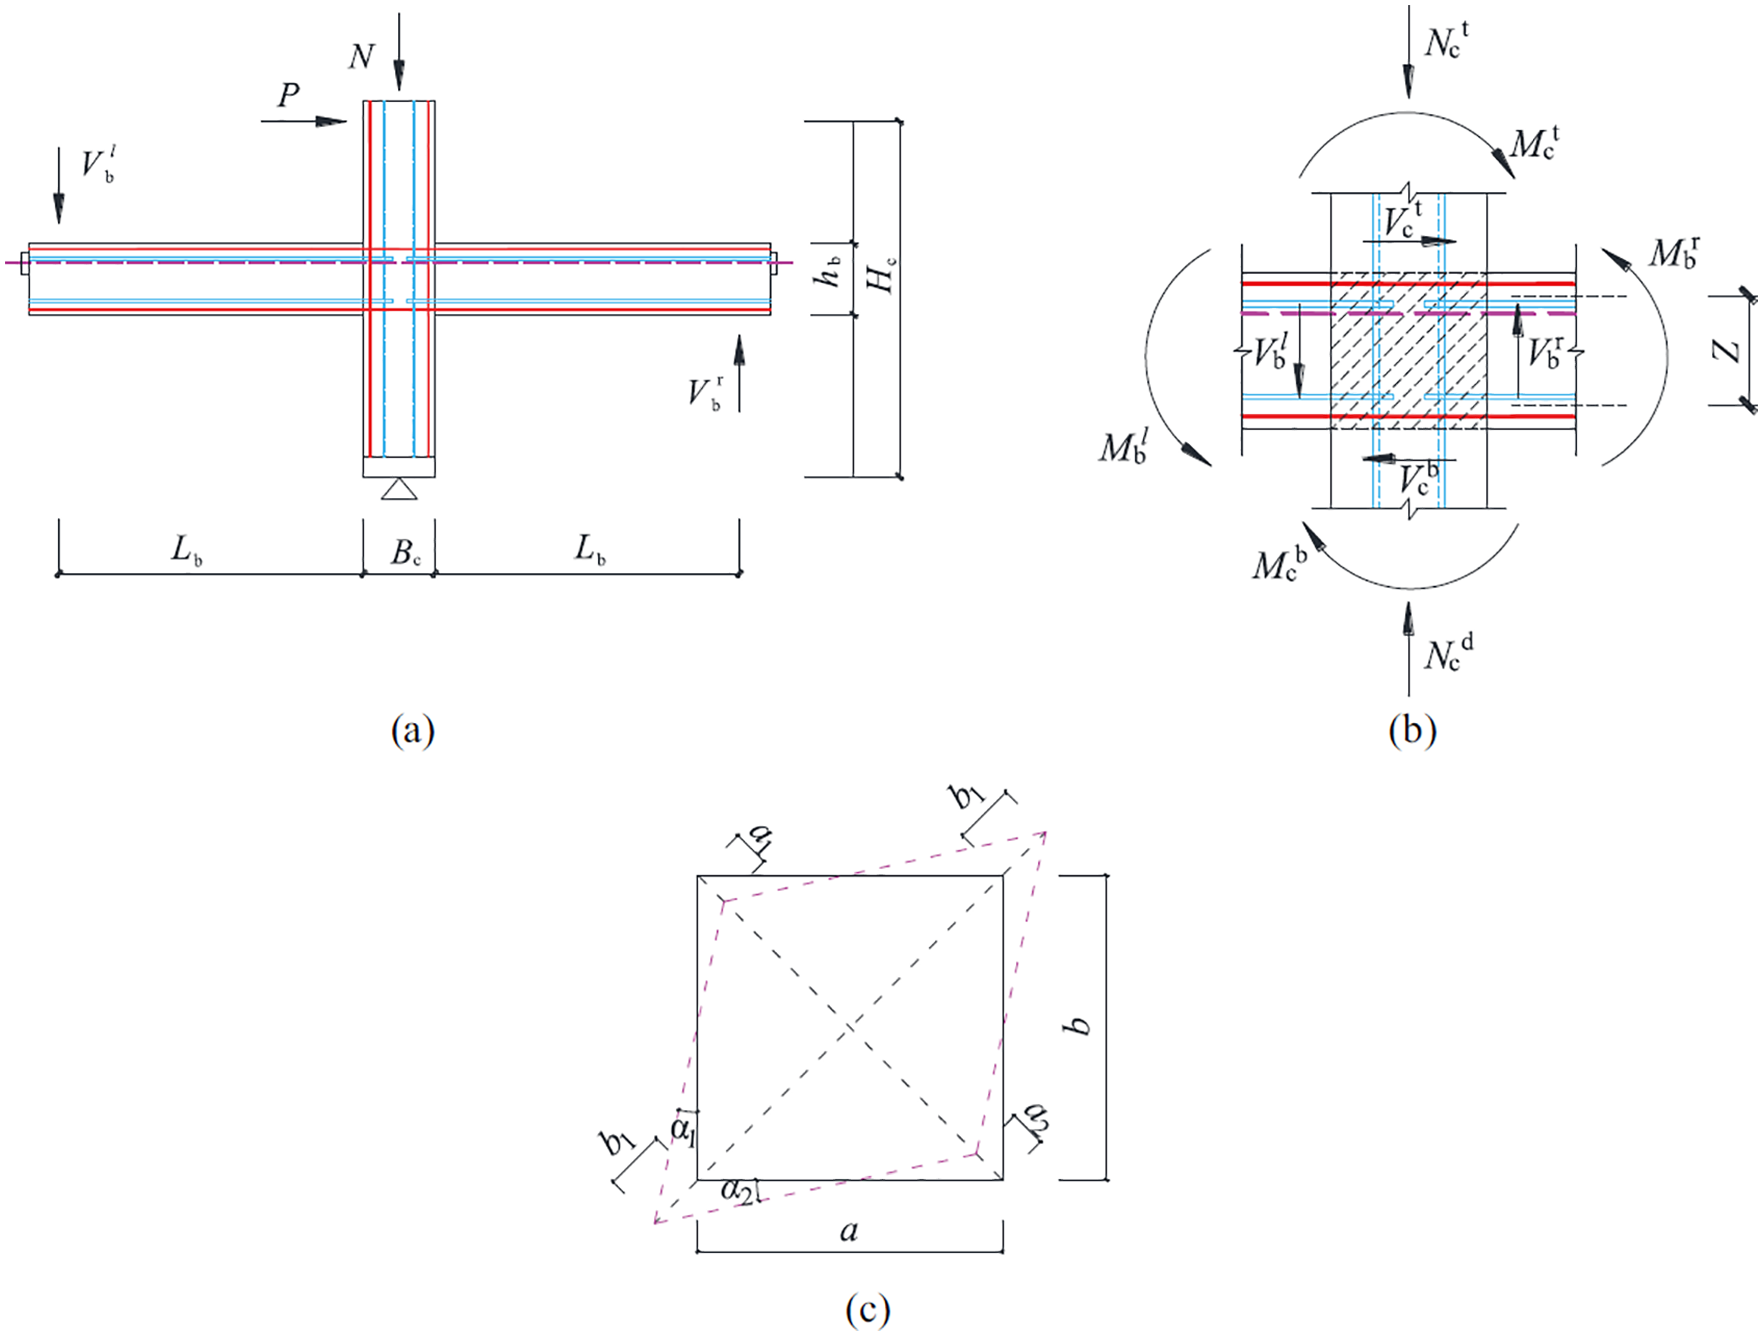
Calculation of shear force and shear deformation in joint core: (a) loads on beam-column joint, (b) load distribution at joint core, and (c) shear deformation of joint core.

When subjected to horizontal displacement, the joint core will change from rectangle to diamond as shown in Figure 13(c), where α1 and α2 are the angles between the diamond edge after deformation and the initial rectangle edge. Thus, the shear angle γj used as shear deformation could be expressed by equation (8), where a and b are the edge lengths of joint core; a1 and a2 as well as b1 and b2 are respectively the amount of shortening and elongation on the diagonal of the joint core zone.

Parametric study
To study the shear performance and develop shear capacity formula for the joint core, a large amount of FEA models with various axial compression ratio n0, steel tube ratio ρss, stirrup ratio ρsv in joint core and prestressing level λ were established, and the scope of analysis parameters are listed Table 1.
Analytical parameters.

Axial compression ratio
The influence of axial compression ratio n0 on the lateral load-displacement (P-Δ) curves at column top and the shear force-shear angle (Vj-γj) relation in joint core was presented in Figure 14(a). As can be seen, both horizontal peak load and the peak shear force improved with the increase of axial compression ratio, and the incremental magnitude was considerable when axial compression ratio was less than 0.5; as axial compression ratio improved, the displacement at peak load as well as the shear angle at the peak shear force gradually reduced, which means that the ductility of the joint core was getting deterioration.
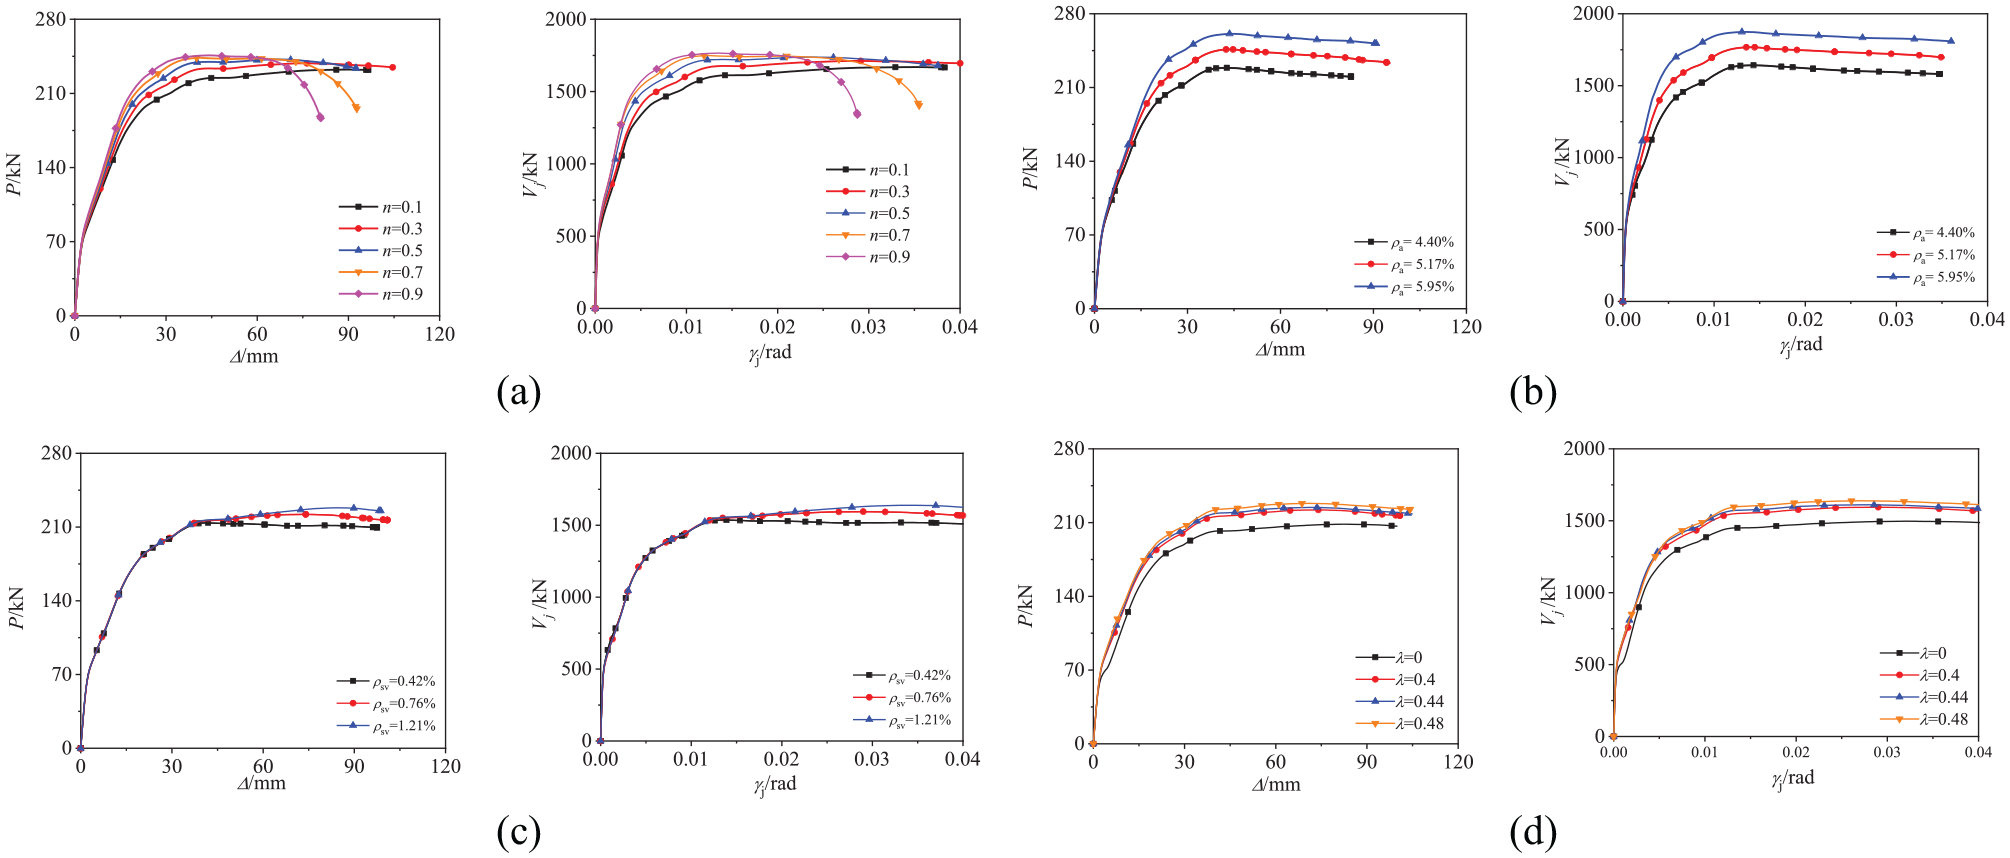
Influence of variable parameters on P–Δ and Vj–γj curves: (a) Axial compressive ratio, (b) steel tube ratio, (c) stirrup ratio, and (d) prestressing level.
Steel tube ratio
Figure 14(b) presented the lateral load-displacement curves and corresponding shear force-shear angle relation at various steel tube ratios. As can be concluded that the peak values of horizontal loads and shear forces significantly improved with the increase of steel tube ratio, which indicated that the ratio of steel tube had a conspicuous effect on the shear capacity of joint core. Additionally, the steel tube ratio has little impact on the ductility of joint specimens because the descent slopes under different steel tube ratios were analogical for load-displacement and shear force-shear angle relations.
Stirrup ratio
Referring to Figure 14(c), the affections of the stirrup ratio in the joint core on lateral load-displacement and shear force-shear angle relation were similar. With the increase of the stirrup ratio, both the peak value of horizontal load and the shear force raised slightly, and ductility of load-displacement and shear force-shear angle curves improved to some extent.
Prestressing level
The influence of prestress level on the curves of lateral load-displacement and shear force-shear angle at joint core was illustrated in Figure 14(d). It can be found that, the lateral stiffness of the specimens without prestressing was distinctly lower than that of the prestressed ones after cracking. As the prestressing level increased, the lateral stiffness and shear stiffness of the models increased rarely, while the peak load and the peak shear force in joint core improved, which were approximately proportional to prestressing level. In addition, the curves of horizontal load-displacement at the column top and shear-shear deformation in joint core under diverse prestressing levels exhibited the semblable shapes.
Shear capacity evaluation
Contribution of steel tube and stirrups
Ignoring the influence of steel beam webs connected to the steel tubes, the contributions of shear capacity Vj in joint core region were mainly from four aspects: the steel tube, the stirrups, the concrete in and outside of the steel tube, as well as the prestressing tendons, according to the aforementioned analysis and JGJ138-2016. As a result, the shear forces carried by steel tube and stirrups in joints (Vss and Vs) can be respectively determined as follows.


Where, fss and fyv are the yield stress of steel tube and stirrups in tension respectively; Ass and Asvj are the cross-sectional areas of steel tube and horizontal stirrups in joint core respectively; hb0 denotes the effective cross section depth of the beam, and a′s represents the distance from the compression steel bars to the outer compressive fiber of the concrete; s stands for the stirrup spacing in joint core.
Contribution of prestressing tendons
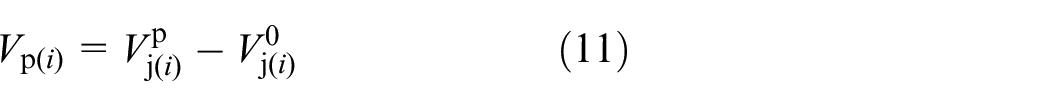
The shear capacity carried by prestressing tendons in joint core for any FEA model joint i, which was represented by Vp(i), can be evaluated by the shear capacity reduction of prestressed joint model to non-prestressing one in the same condition, which were expressed by equation (11). Where, Vpj(i) and V0j(i) were the shear capacities in FEA model joint core with or without prestressing.
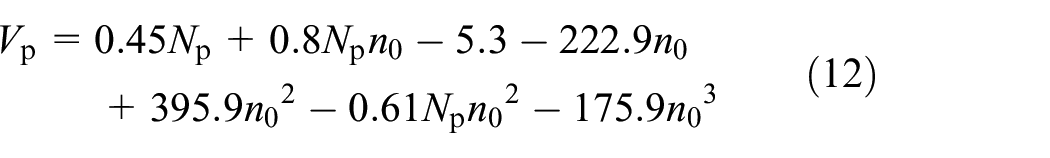
Through amounts of computation, it could be found that the shear capacity of prestressing tendons Vp was related to the effective prestressing force Np and the axial compressive ratio n0, and it could be expressed as equation (12) by surface fitting, where Np = peAp, σpe and Ap were the effective prestress and cross-sectional area of prestressing tendons respectively.
Contribution of concrete
According the assumption that the shear capacity of joint core was made up of the contributions of steel tube, stirrups, prestressing tendons, and concrete. Thus, the shear capacity carried by concrete Vc(i) for any prestressed joint, numbered i, can be calculated by the following equation.

Based on linear fitting, the shear capacity of concrete Vc can be determined by equation (14). Here, N is the axial force acted on the column top, bj and hj are the width and depth of the cross section of joint core region.

Shear capacity in joint core
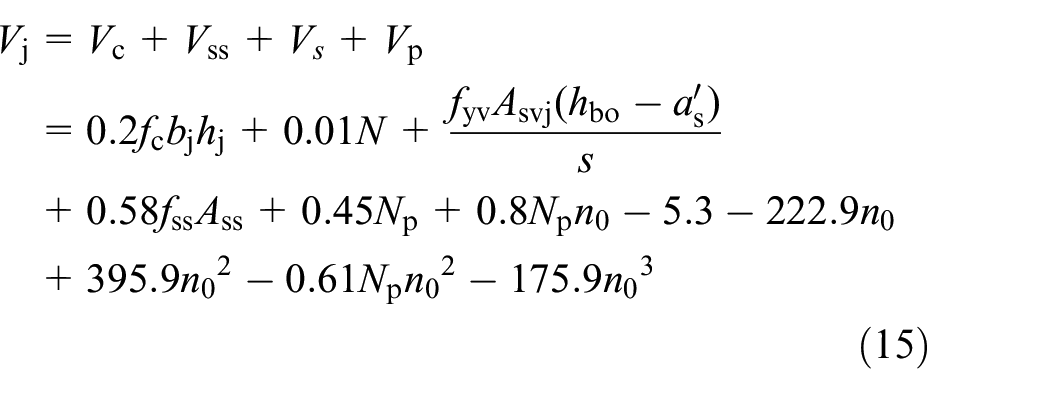
From previous analysis, the shear capacity formula of joint core area Vj can be expressed as below by superposition of contribution of concrete, stirrups, steel tube, and prestressing tendons.
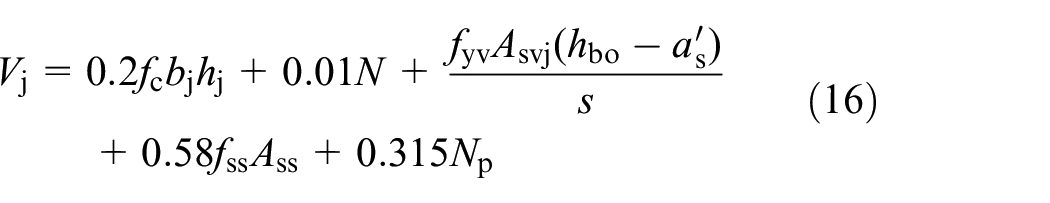
Since the computation of shear capacity of prestressing tendons in equation (15) is not convenient for engineering design, the former proposed shear capacity for prestressing tendons Vp was adjusted herein. Through taking the lower envelope of the calculated result, Vp equal to 0.315 Np can be assumed, thus the practical formula of the joint shear capacity Vj could be expressed as below:
Verification on the proposed formulae
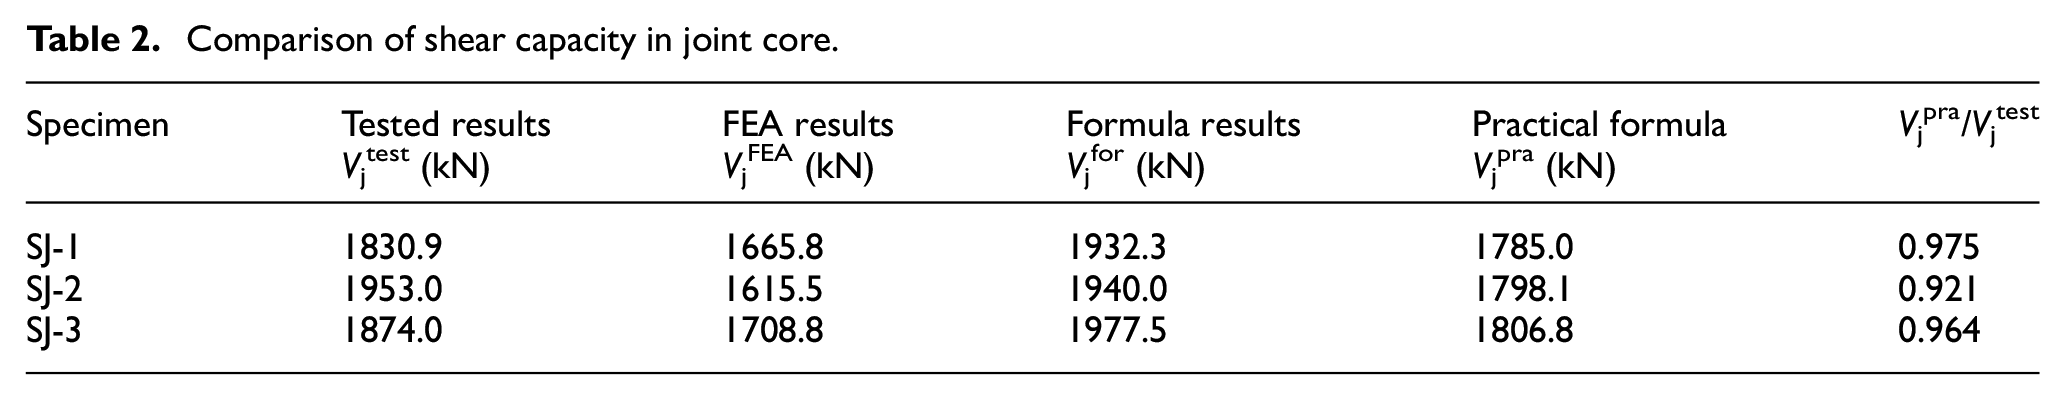
Table 2 listed the shear capacities of joint core for three tested prestressed joints separately from tests, FEA model, proposed formula shown in equation (15), and practical formula expressed by equation (16), which were denoted by Vjtest, VjFEA, Vjfor, and Vjpra respectively. It can be obtained that the FEA results of the three specimens were lower than that of tests, while results of proposed formula which is established from a great many of FEA models were more consistent with the tested results. In addition, the shear capacity ratio between equation (16) and test results Vjpar/Vjtest was 0.975, 0.921, and 0.964 with a mean value of 0.953, indicating that the proposed practical formula for predicting the shear capacity were reasonable and could be applied for engineering design.
Comparison of shear capacity in joint core.
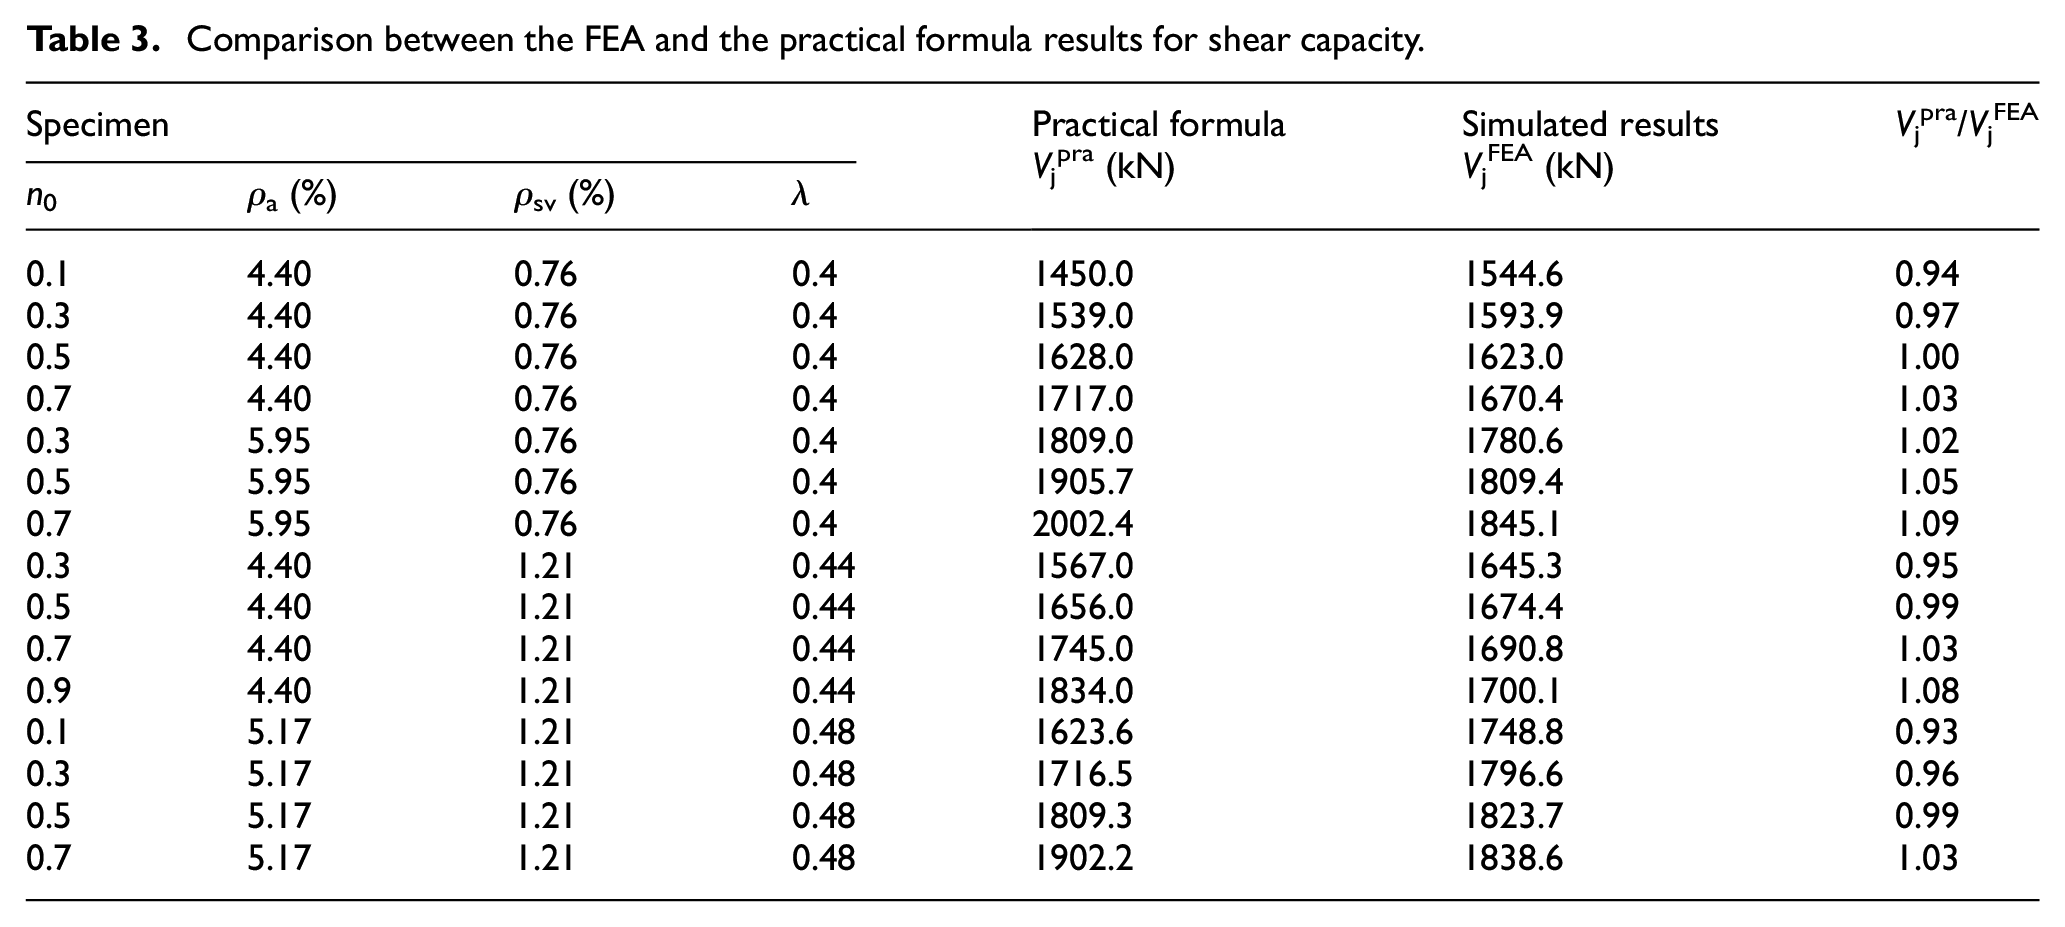
In addition, Table 3 shows the comparison between the simulated and the practical formula results of some FEA joint models. It could be concluded that the calculated results of practical formula were close to that of FEA models, which indicated that the practical formula proposed in this paper could be used to predict the shear capacity.
Comparison between the FEA and the practical formula results for shear capacity.
Discussion
Currently, the effect of floor slab in joints was not considered in this test. To investigate the force transfer pattern and shear capacity for prestressed concrete-encased CFST columns with slabs, the mechanical performance and nonlinear analysis of the composite frame joints considering the influence of floor slab will be further carried out in the future study.
Conclusions
(1) The calculated monotonic lateral load-displacement curves from FEA joint models are agree well with tests, which could be used to investigate the mechanical behavior of prestressed composite joints.
(2) When the lateral loads reached the peak values, the steel pipe, stirrups, prestressing tendons reached yield and concrete was crushed in joint core, which could be used as a symbol for the shear capacity calculation.
(3) The shear capacity of joint core could be improved to some extent by increasing the axial compressive ratio, steel ratio, stirrup ratio as well as prestress level; however, the ductility of joint will be reduced by enhancing the axial compressive ratio.
(4) The predictions of practical formula agree well with tests and FEA results, which could be used in engineering design.
Footnotes
Acknowledgements
The authors appreciate the support of the National Science Foundation of China (51878589), Postdoctoral Research Foundation of China (2019M651762), Six Talent Peaks Project in Jiangsu Province (2017-JZ-038), Science and Technology Planning Project of Yangzhou City (YZ2018068). The writers are also grateful to the reviewers for their useful comments and suggestions.
Declaration of conflicting interests
The author(s) declared no potential conflicts of interest with respect to the research, authorship, and/or publication of this article.
Funding
The author(s) received the support of the National Science Foundation of China (51878589), Postdoctoral Research Foundation of China (2019M651762), Six Talent Peaks Project in Jiangsu Province (2017-JZ-038), Science and Technology Planning Project of Yangzhou City (YZ2018068).