
Abstract
Based on investigation of rural buildings in china, there are more than 20% of the masonry structures constructed in 1970s. Thus, the old blue bricks (OBB) and old red bricks (ORB), which demolished from the typical brick masonry structures was built in 1970s, was chosen in the test. During demolishing the OBB and ORB, the original mortar was destroyed. Thus, the 1:7.8 cement mortar was chosen instead of original mortars and the 1:5 cement mortar was chosen as the reinforcement mortar. In order to know the performant of the reinforcement methods, there are three-level test plan was put forward in the study. Firstly, the mechanical properties of OBB and ORB and mortars was tested; Secondly, the experiment tested the shear strength of the reinforced and unreinforced masonry specimens along mortar joints; Thirdly, there are four walls (OBB reinforced wall and unreinforced wall, ORB reinforced wall and unreinforced wall) have been made for the pseudo-static tests. This research conducted physical performance tests on masonry bricks, masonry components, and masonry walls of typical masonry structures. Through experiments, the shear capacity of the masonry structure reinforced by high-strength mortar and steel bars can be obtained.
Keywords
Introduction
The typical masonry structures were the most common structural form adopted, which distribute north of China where earthquake fortification intensity is Mw8. This type of masonry structure is a single-layer masonry structure as shown in Figure 1(a) and (b), which uses double-slope wooden roofs. The load-bearing elements are the masonry walls, which thickness are 240–370 cm GB 50203-2011, 2011; GB50023-2009, 2009. The two types of bricks (Figure 1(c)) used in the test have different materials made (The OBB consists mainly of clay. The ORB is composed of clay, shale, and coal gangue) and the production processes are also different (ORBs are burned with fire which is then extinguished, meaning that the kiln and bricks cool naturally whereas OBBs are cooled with water after the firing process is completed).
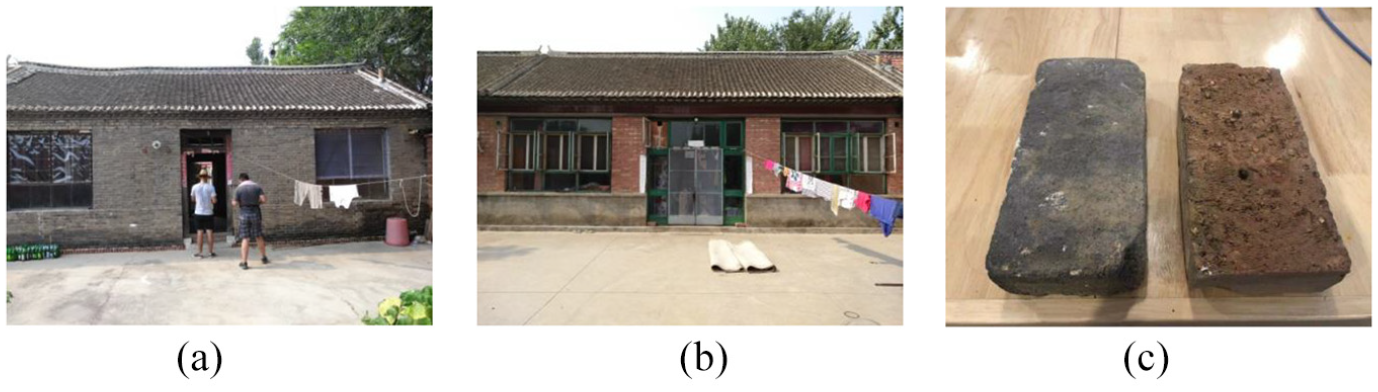
Typical brick masonry structure: (a) structural elevation (OBB), (b) structural elevation (ORB), and (c) OBB and ORB.
Through analyses of the earthquake disasters from 2001 to 2013 in China, there are 40%–50% of typical Chinese masonry structures were severely damaged under magnitude of the earthquake is greater than 5 (Yao et al., 2018). However, the rural structures that were built in 1970s have insufficient seismic performance (Yao et al., 2017). Therefore, it is necessary to strengthen the rural masonry structure in the 1970s in China.
At present, there are two ways to strengthen masonry structures: (1) Reinforce the outer surface of masonry load-bearing walls, such as using engineered cementations composite, fiber reinforced mortars (PP-FRM), carbon fiber reinforced polymer (CFRP), and other materials to reinforce the masonry walls (Bernat-Masoa et al., 2015; Ismail and Ingham, 2013; Ismail et al., 2011; Lin et al., 2014; Papanicolaou et al., 2007; Yavuz Yardin, 2016). (1) Strengthening the mortar joints of masonry structure can improve the seismic performance of the structure (Ismail and Ingham, 2016; Messali, 2017; Saleem, 2016; Triller, 2019). Reinforcement masonry walls are commonly used as a primary lateral load resisting system in buildings in regions of moderate or high seismicity (Yao, 2018; Yao, 2019). Experimental investigations on brick walls to study the effect of reinforcement on deformation, stiffness, and strength have been carried out (Dizhur, 2013). The literature studies shown that reinforcement steel bars are used to improve the plane shear capacity and achieved improvement in ductility capacity (Lingeshwaran and Poluraju, 2020). Francesca da Porto obtained basic mechanical characterization of the construction systems, and reproduced the behavior of single-story reinforced masonry buildings provided with deformable roofs (Da Porto et al., 2010). Xin-qiang et al. (2017) tested the new masonry wall and obtain the result that high strength mortar can improve the shear resistance of the masonry wall. The above researches aimed to reinforcement the masonry structure at the construction stage. Therefore, it is very necessary to carry out research on the reinforcement of existing masonry structures. The method that reinforcing brick masonry walls with high-strength mortar and steel bars in the horizontal joints, need to be studied by experiment.
Mechanical properties of building materials
Typical OBB and ORB compressive strength
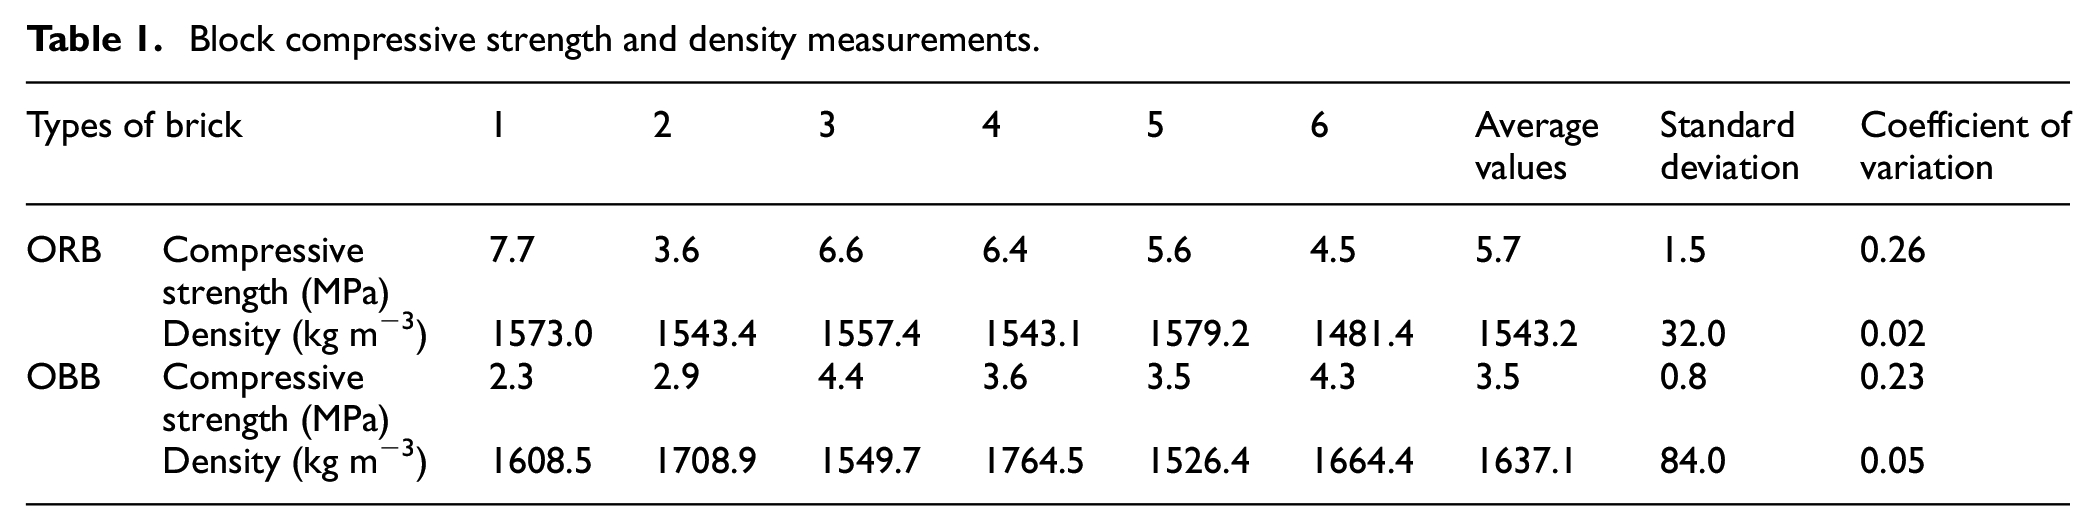
The size of the two type of bricks is 240 mm × 115 mm × 53 mm (GB/T 2542-2012, 2012). Drilling six cylinders from the two types of bricks, which size is about 48.5 ± 0.8 mm in diameter and 53 mm tall. From the Table 1, the variation coefficients of compressive strength of OBB and ORB are 0.26 and 0.23, respectively. The bricks are brittle and composed of heterogeneous materials, thus the compressive strength coefficients are within a reasonable range. The different materials and the different production processes used on the two types of bricks lead to that ORB have 64% higher average compressive strength than OBB. However, OBB have a higher density than ORB.
Block compressive strength and density measurements.
Mortar compressive strength
The most commonly used mortar type is 1:7.8 cement mortars (JGJ/T 98-2010, 2010). Therefore, original masonry walls use 1:7.8 cement mortar. The reinforcement mortar use 1:5 cement mortar (JGJ/T 70-2009, 2009). The size of the specimen is 70 mm×70mm× 70mm. Table 2 shows that the compressive strength of 1:5 cement mortars is double times of the 1:7.8 cement mortar.
Results of compressive strength tests of two kinds of mortar blocks.
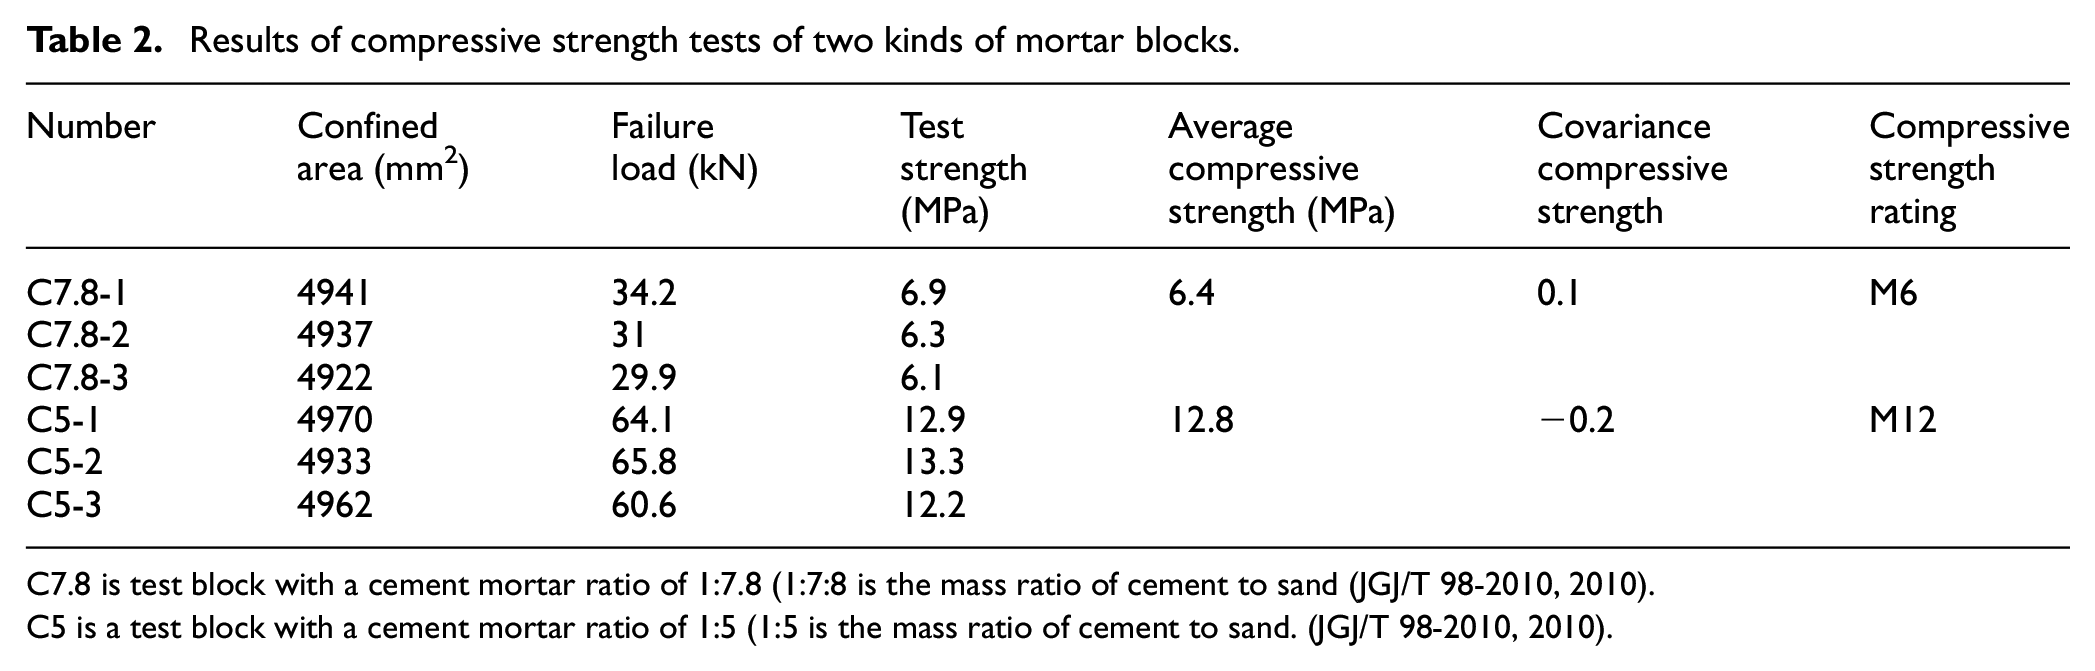
C7.8 is test block with a cement mortar ratio of 1:7.8 (1:7:8 is the mass ratio of cement to sand (JGJ/T 98-2010, 2010).
C5 is a test block with a cement mortar ratio of 1:5 (1:5 is the mass ratio of cement to sand. (JGJ/T 98-2010, 2010).
Steel bar tensile strength
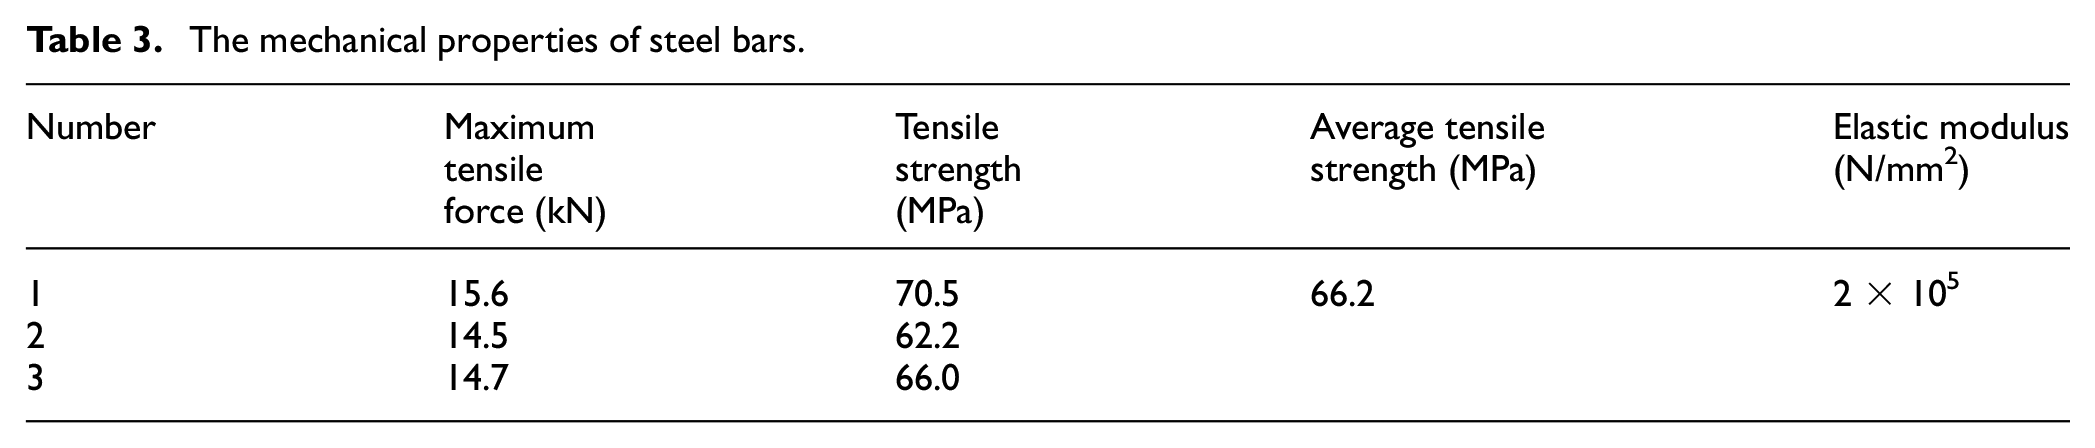
The mortar joint thickness of masonry buildings is approximately 10 mm in China (Xin-qiang et al., 2017), thus choosing Φ6 mm steel bar as reinforcement bar. The mechanical properties of steel bars were measured, which introduced in Table 3 (GB 50003-2011, 2011).
The mechanical properties of steel bars.
Shear strength of masonry along mortar joints
The shear strength of masonry specimens was measured with double-sided shear method. The reinforcement method is shown in the Table 4 and Figure 2(a)–(d). The loading mode follows standard for test method of basic mechanic properties of masonry (GB/T 50129-2011, 2011).
Mortar joint reinforcement process.
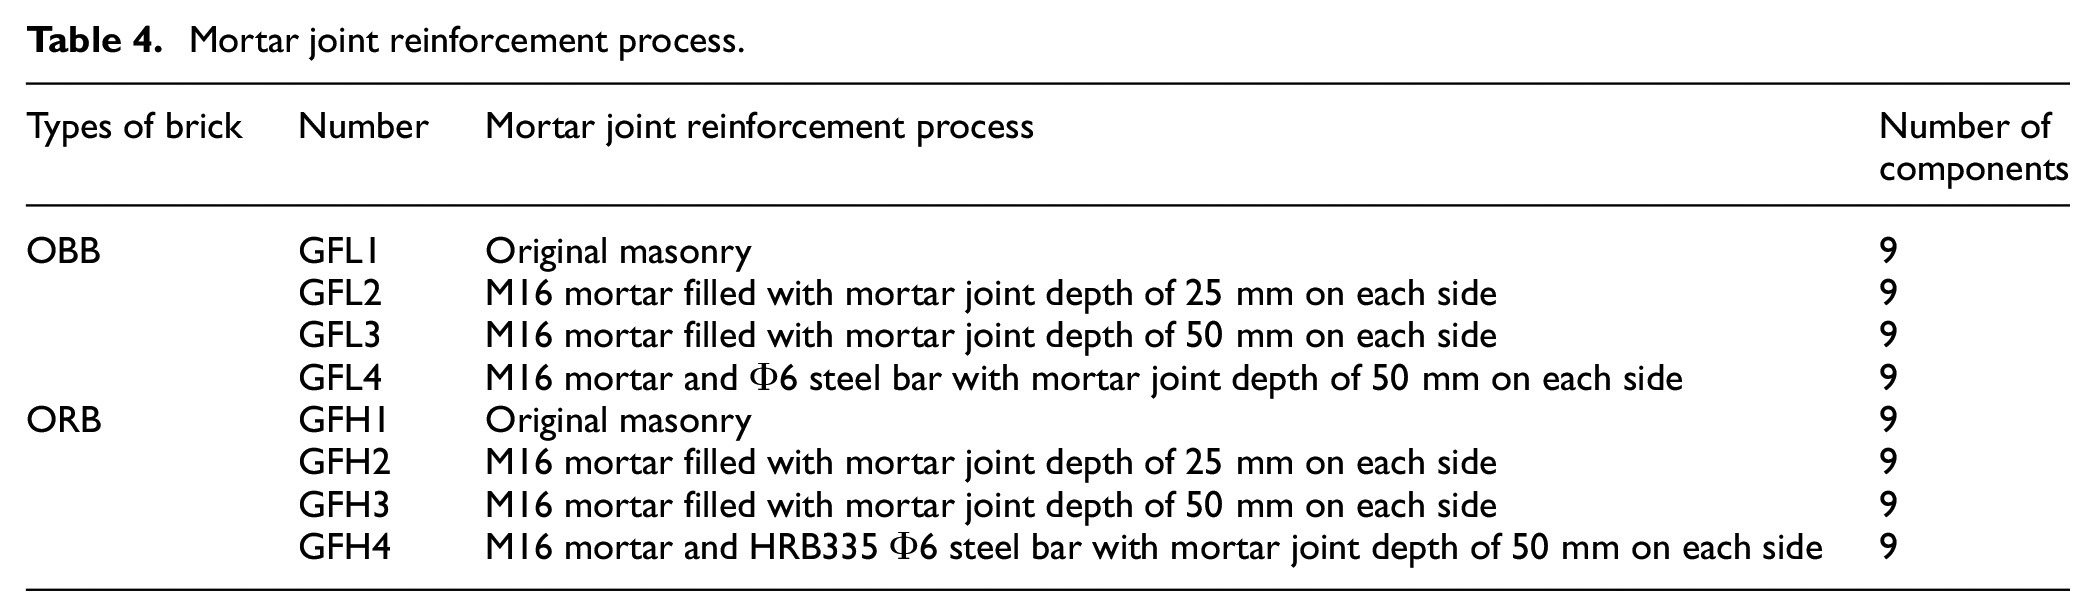
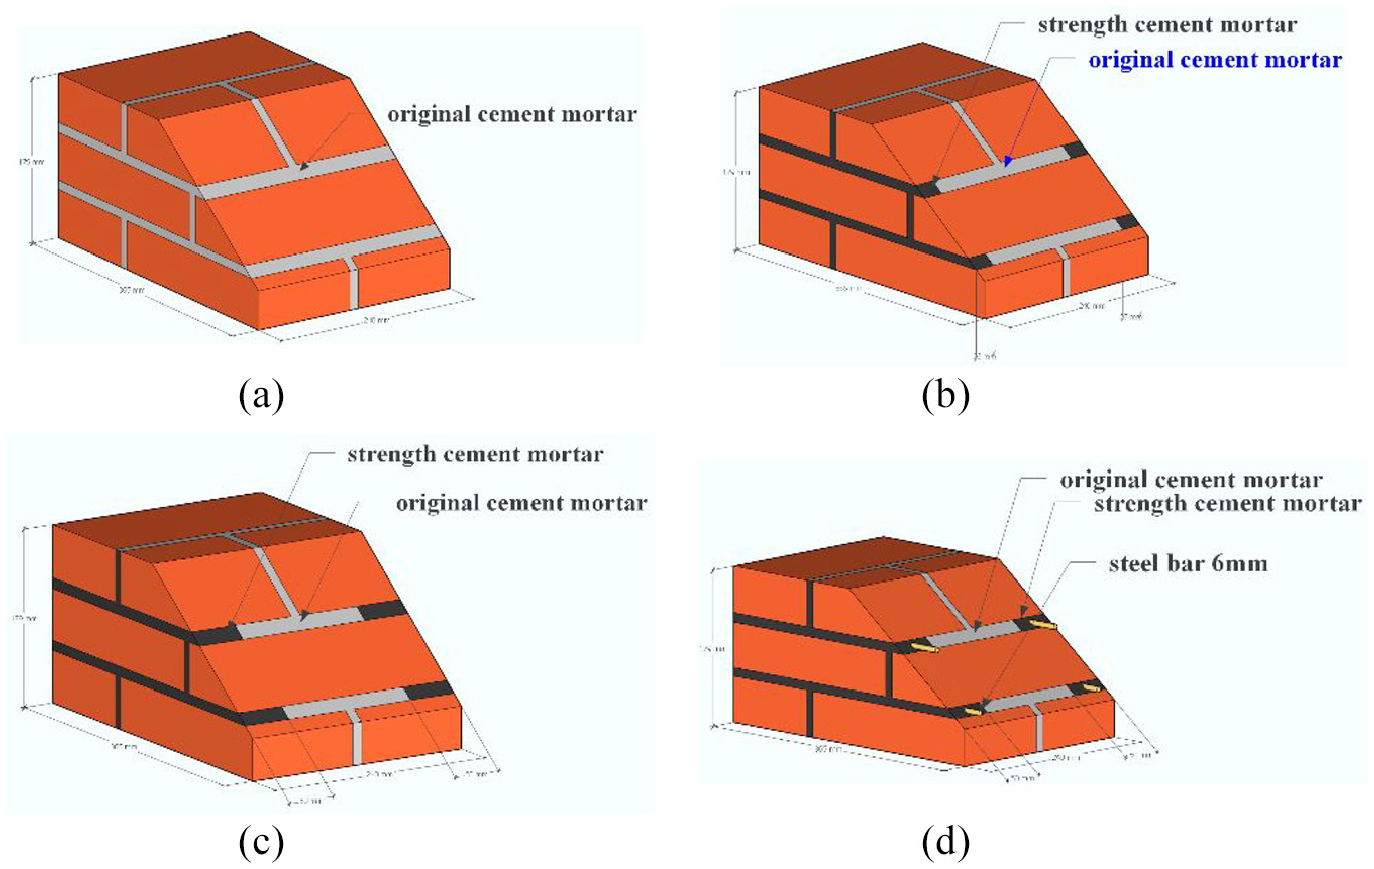
Reinforcement scheme: (a) GFL1 and GFH1, (b) GFL2 and GFH2, (c) GFL3 and GFH3, and (d) GFL4 and GFH4. (a) Unreinforcement msonry section view. (b) Mortar reinforcement depth 25 mm section view. (c) Mortar reinforcement depth 50 mm section view. (d) Mortar reinforcement depth 50 mm and steel bars section view.
The shear strength along the mortar joint cross-section of the specimens could be calculated by equation (1), and this calculated value should be accurate to within 0.1 N/mm2:
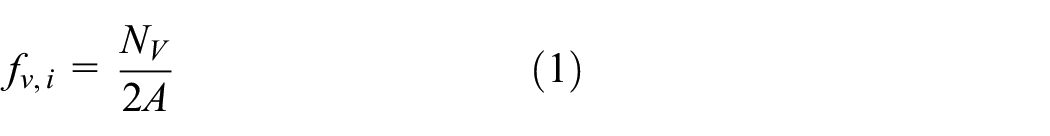
where, parameter
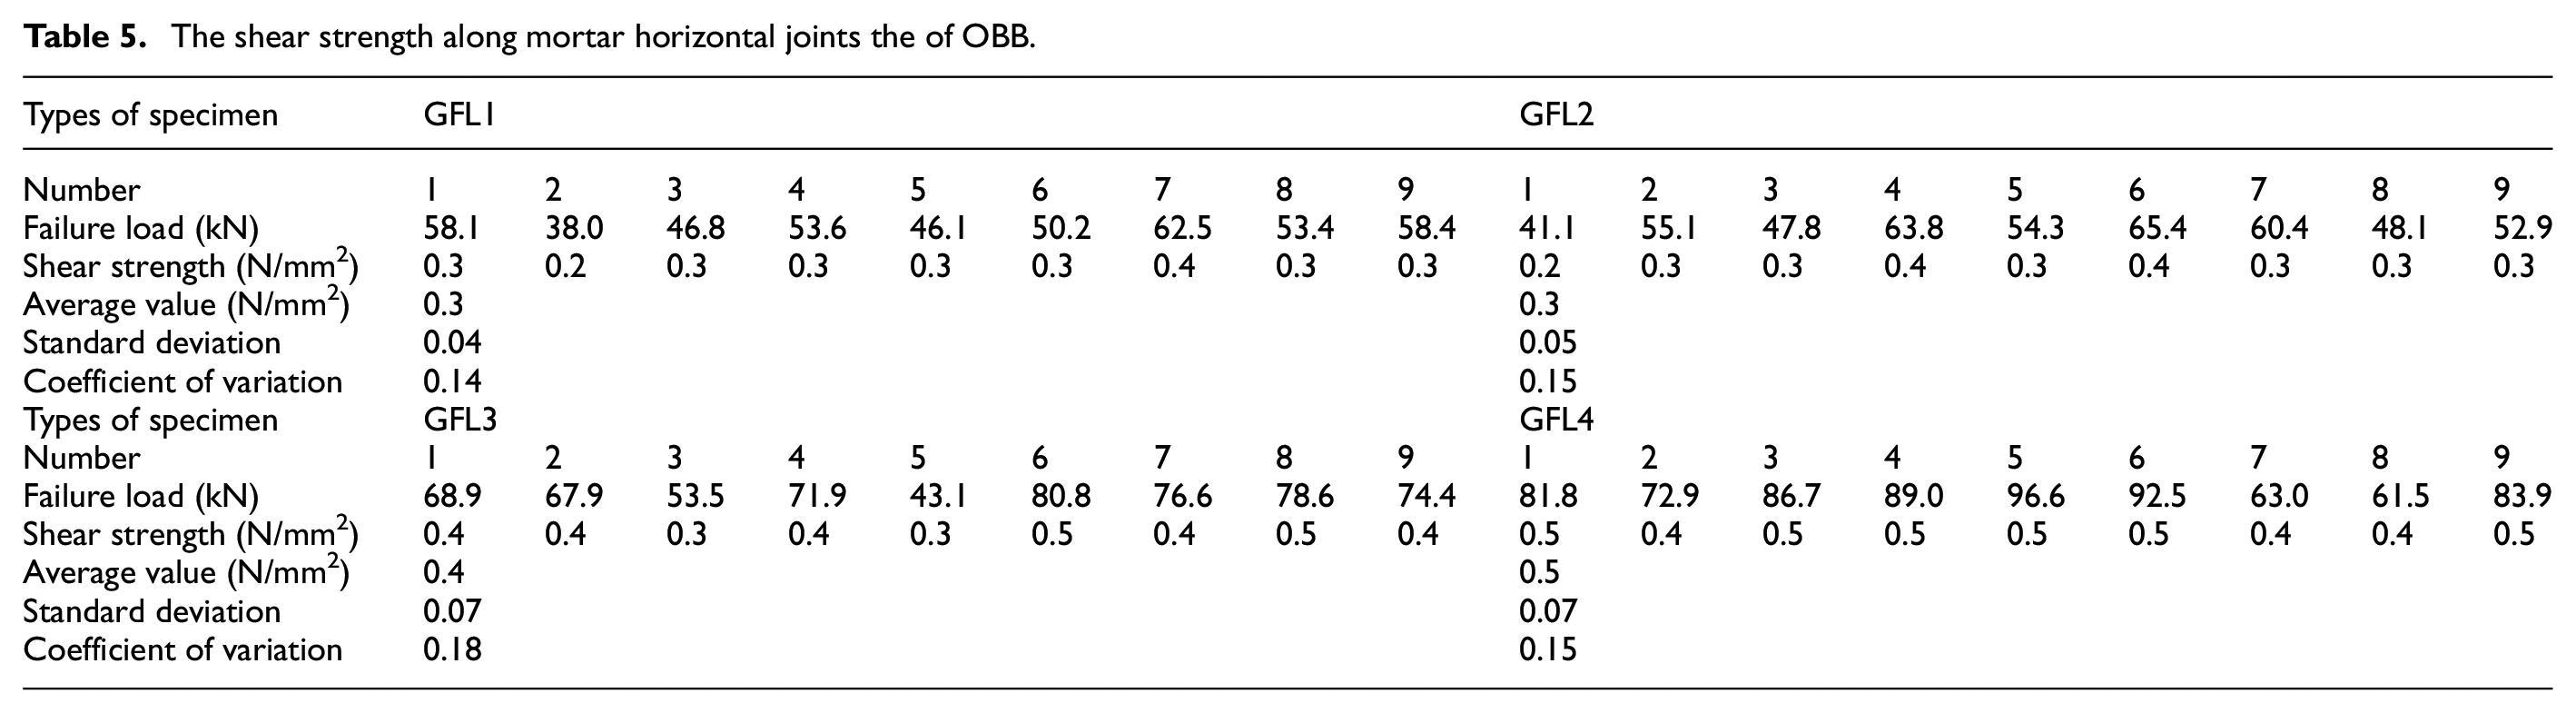
The shear strength along the mortar joint sections of OBB and ORB, which using three reinforcement methods, are respectively calculated by equation (1). It can be known form Tables 5 and 6 that the standard deviation and coefficient of variation which are not more than 0.1 and 0.3, respectively. The test data discrepancies are reasonably in line with standards of China (GB 50003-2011, 2011).
The shear strength along mortar horizontal joints the of OBB.
The shear strength along mortar horizontal joints the of OBB.
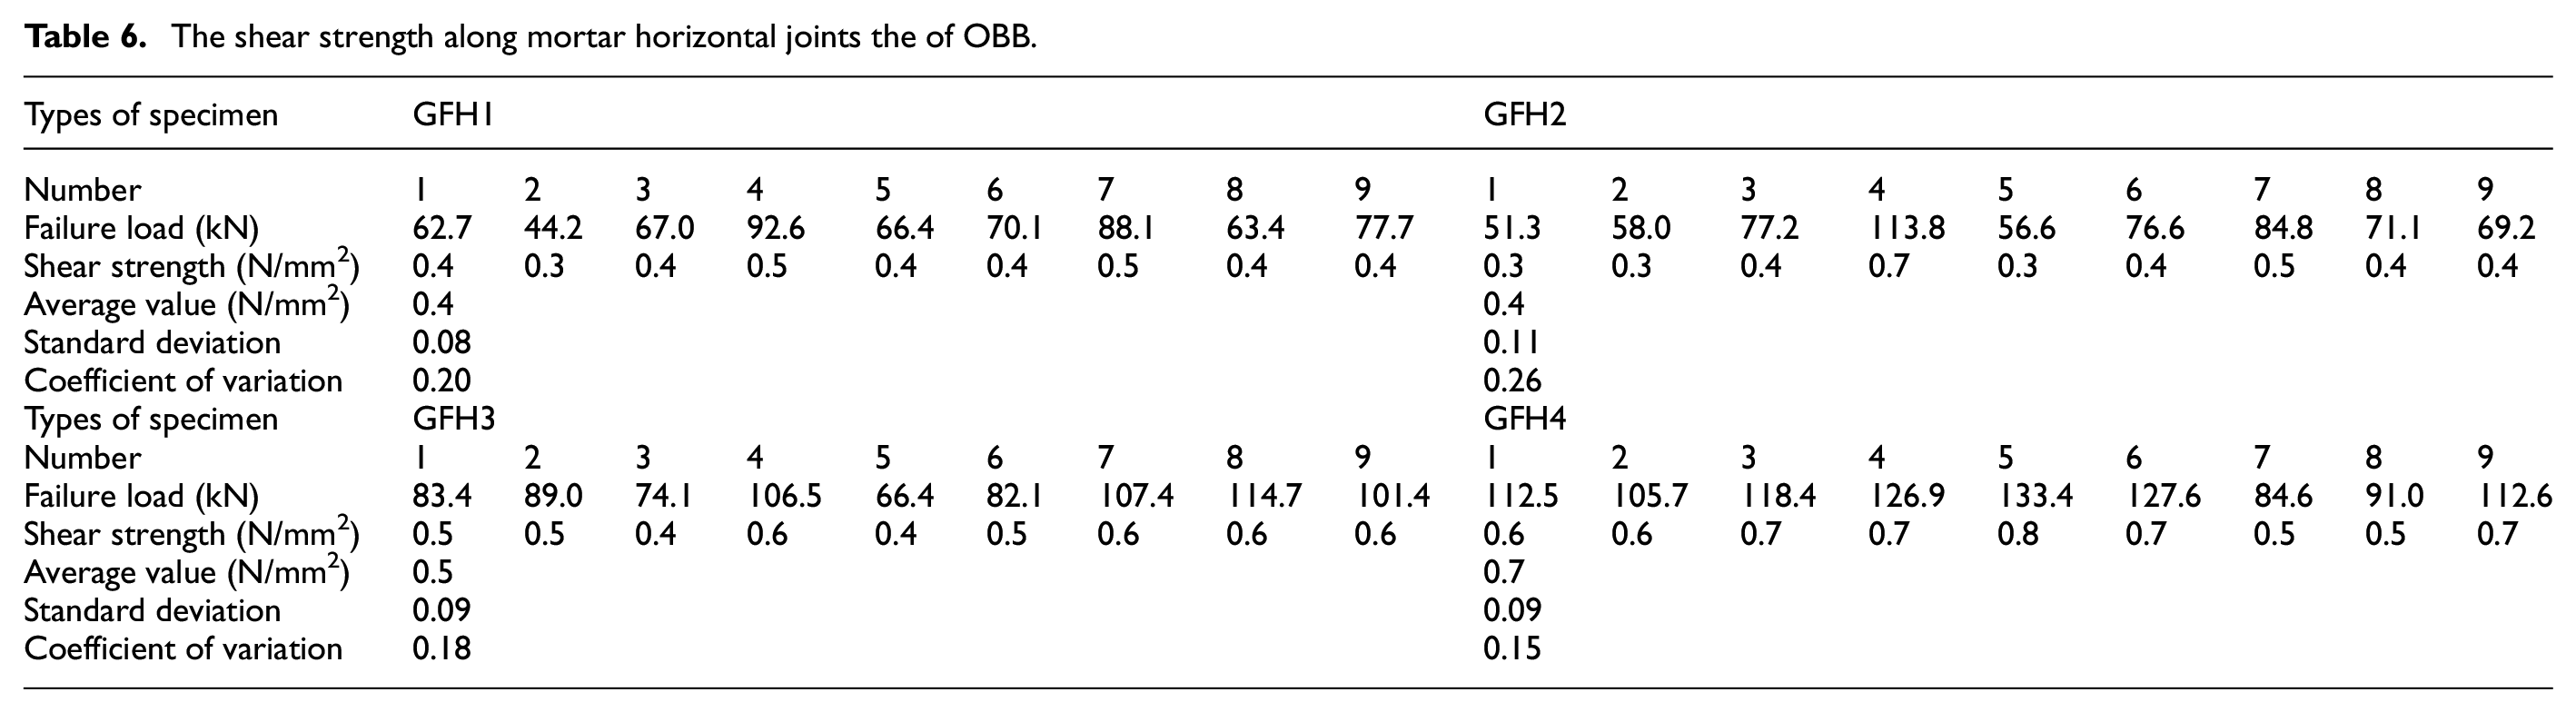
Figure 3 shows that the OBB and ORB specimens increased in shear strength with increased reinforced mortar joint depth. When the joints reinforcement depth is 50 mm, shear strength shows a significant enhancement trend, and when the mortar joint reinforcement uses steel bars, shear strength is significantly increased. The ORB specimens have higher shear strength than that of the OBB specimens.
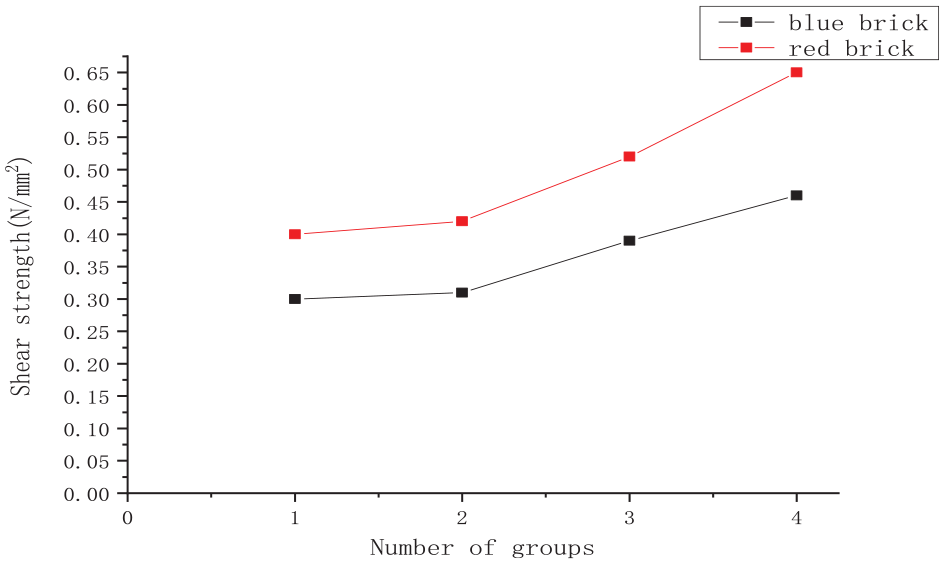
Average shear strength of OBB and ORB reinforced with different method.
Quasi-static masonry wall test
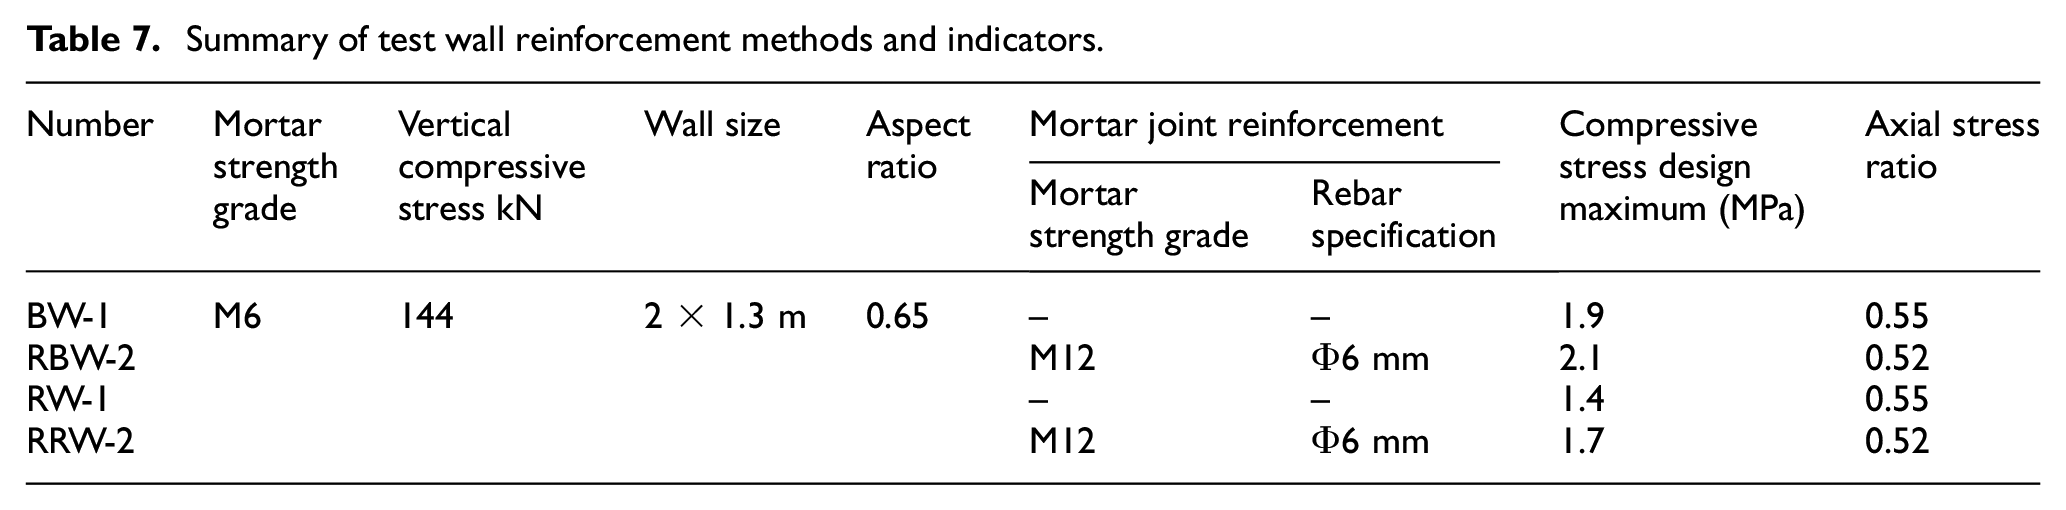
From the shear strength tests on masonry specimens along the joint section, the specimens with the best seismic performance are those reinforced using M12 mortar whose mortar joint depths of 50 mm on each side with Φ6 steel bar inside. In order to know, the seismic performance of the masonry wall that reinforced with high-strength mortar and steel bars in the horizontal joints. The test used four (non-opening) masonry walls, which include two unreinforced masonry walls and two reinforced masonry walls. The quasi-static test used ORB and OBB with 1:7.8 cement mortar, 1:5 reinforcement cement mortar, and Φ6 steel bars (Figure 2(d), Table 7). The masonry walls are 2000 mm × 240 mm × 1300 mm which show in Figure 4. To simulate the vertical pressure stress conditions of an actual wall, it is necessary to provide compressive stress through a vertical jack.
Summary of test wall reinforcement methods and indicators.
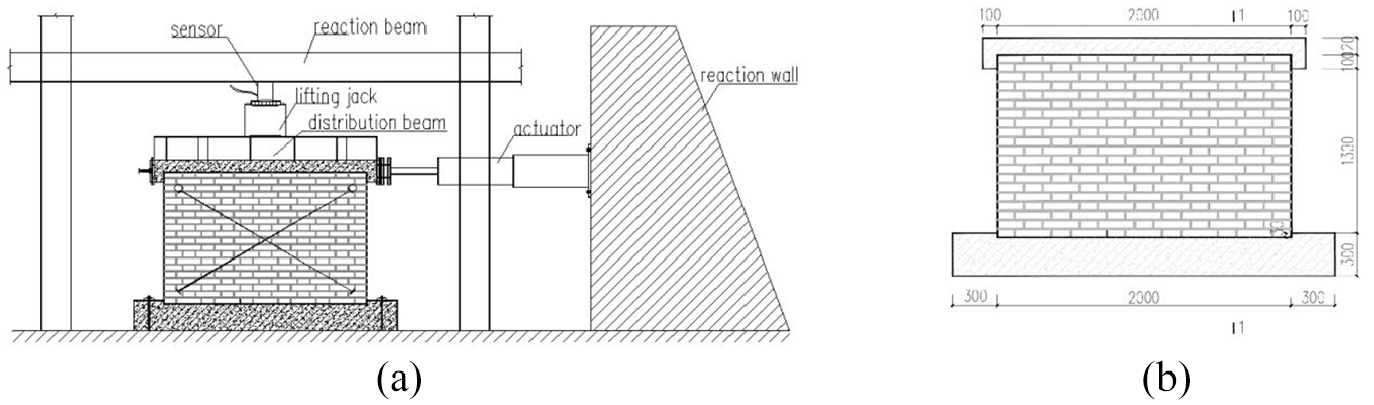
(a) Quasi-static test wall fixing, actuator, and reaction frame arrangement and (b) the size of the wall.
The masonry wall bearing capacity can be expressed as:

Where, N is the vertical concentrated load;
Based on stander (GB5001-2001, 2001), the vertical concentrated load of 144 kN is applied to the wall (the vertical compressive stress is 0.3 MPa).
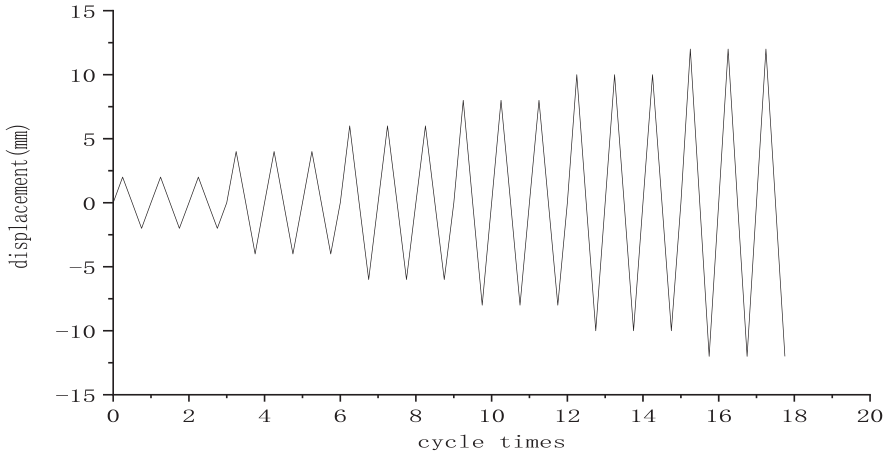
The experiment used a variable amplitude equal-mixing loading method for controlled displacement loading (JGJ 101-1996, 1996). Firstly, 50% of the vertical predetermined load was applied to the wall and kept stable; secondly, the horizontal load is pre-loaded to the wall specimen and control horizontal displacement Δ = 0.1 mm is repeatedly loaded twice. By applying a 144 kN vertical concentrated load (the vertical compressive stress of the wall is 0.3 MPa), the horizontal loading is controlled based on the loading point displacement on the wall, and the displacement of each stage is increased by 2 mm, as show in Figure 5. Before the wall cracks, each displacement stage is cycled once. After the wall crack, each stage of the displacement is cycled three times until either the specimen breaks or the horizontal load drops to 85% of the ultimate load.
Schematic diagram of the loading system.
Physical quantities such as shear force and masonry wall displacement are observed using sensors and displacement gauges to obtain parameters such as the hysteresis curve, skeleton curve, and ductility coefficient. Through visual observation, macroscopic phenomena such as crack development and failure state of the wall in each stage can be obtained.
Macroscopic phenomena and hysteresis curve analysis
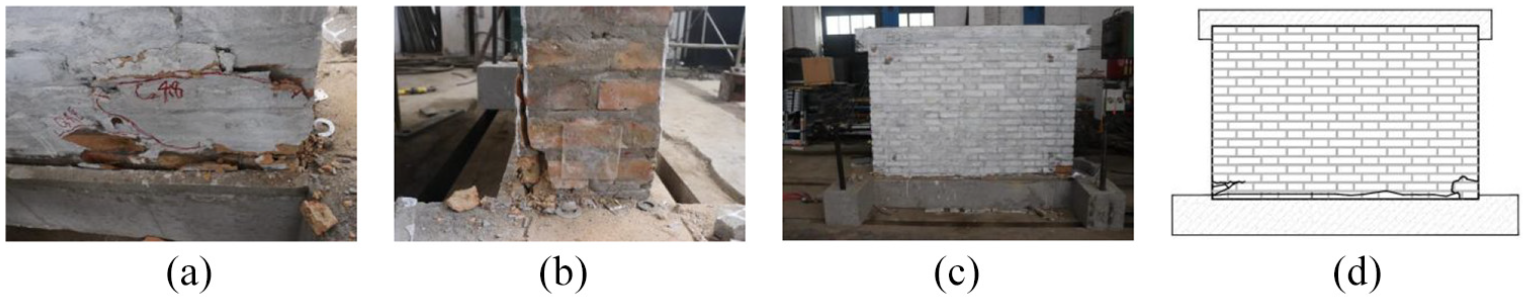
The damage of the BW-1 is shown in the Figure 6. When the horizontal load was 135.40 kN and horizontal displacement was 1.05 mm, long vertical cracks appeared in the lower left corner of the wall. With a horizontal load of 165.35 kN and horizontal displacement of 5.88 mm, more obvious cracks generated in the left and right lower corners of the wall and long transverse cracks are produced in the middle joints of the fifth and sixth layer of bricks. With the horizontal load of 132.65 kN and horizontal displacement of 7.62 mm, transverse cracks appear in the middle of the fifth and sixth layer of bricks and the vertical oblique cracks are wider to 12 mm.
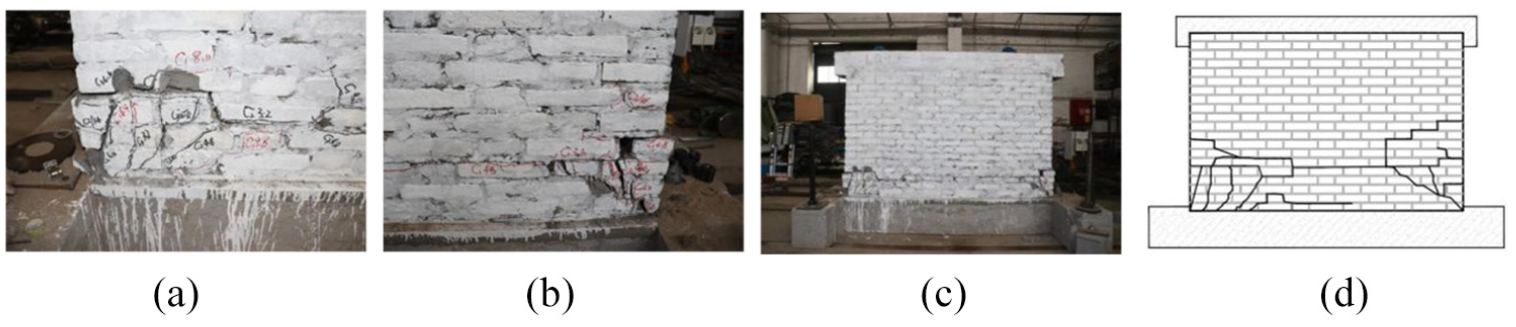
Damage and cracking of specimen BW-1: (a) cracks generated in the left lower corners, (b) cracks generated in the right lower corners, (c) diagram of wall failure, and (d) schematic diagram of wall failure.
The damage of the RBW-2 is shown in the Figure 7. With horizontal load of 164.16 kN and horizontal displacement of 1.98 mm, horizontal crack occurs along the mortar joint between the fourth and fifth layer of bricks on the right side of the wall, and extends to the crack at the third brick in the subsequent loading level cycle. With a horizontal thrust of 213.01 kN and horizontal displacement of 12.02 mm, more obvious cracks appear in the left and right lower corners of the wall, and long transverse cracks are generated in the middle of the second and third layer of bricks. When the horizontal load is increased to 176.23 kN and horizontal displacement increases to 14.32 mm, transverse cracks in the middle of the second layer of bricks are produced, blocks in the left and right corners are significantly damaged, and vertical oblique cracks widen to 6 mm.
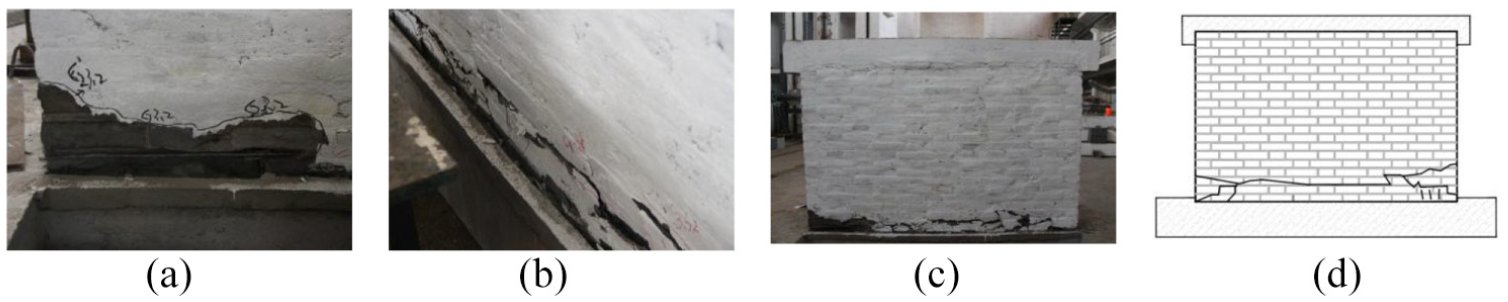
Damage and cracks in specimen RBW-2: (a) cracks generated in the left lower corners, (b) cracks generated in the right lower corners, (c) diagram of wall failure, and (d) schematic diagram of wall failure.
The damage of the RW-1 is shown in the Figure 8. When a horizontal load of 156.03 kN and horizontal displacement of 1.13 mm are applied, long vertical cracks appear in the left and right corners of the RW-1. With horizontal load of 202.89 kN and horizontal displacement of 7.94 mm, more cracks are generated in the lower corners and the right side of the wall. The RW-1 shows a wide vertical crack. With a horizontal load of 161.52 kN and horizontal displacement of 9.87 mm, the wall sheet has an X-shaped through-slope crack 15 mm wide. The quasi-static wall is not connected to the bottom. The brick in the lower right corner of the wall produced cracks as shown in the Figure 8. And then the next step of the test, the crack in the lower right corner widened continuously and developed into a weak point of the wall. so that there was no crack in the wall in the upper right corner.
Damage and cracks in specimen RW-1: (a) cracks generated in the left lower corners, (b) cracks generated in the right lower corners, (c) diagram of wall failure, and (d) schematic diagram of wall failure.
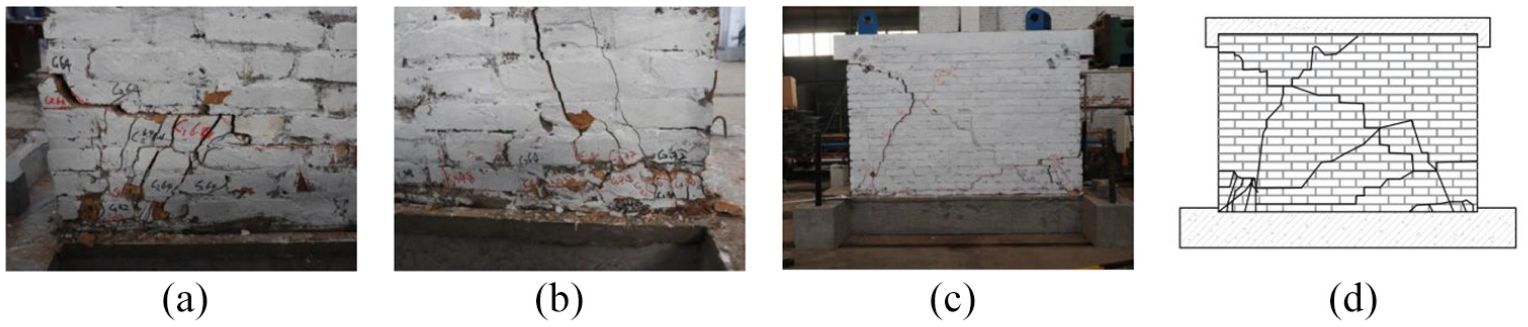
The damage of the RRW-2 is shown in the Figure 9. With horizontal load of 171.13 kN and horizontal displacement of 2.03 mm, oblique cracks appear along the mortar joint in the lower left corner of the wall, and bricks around the crack are broken and fall off. With horizontal load of 286.61 kN and horizontal displacement of 15.87 mm, more obvious cracks are generated in the left and right lower corners of the wall and long transverse cracks appear in the middle mortar joints of the second and third of the bricks. With a horizontal load of 239.65 kN and horizontal displacement of 18.37 mm, transverse cracks are produced in the middle of the second and third layer of the bricks, bricks in the lower corner of the wall are greatly damaged, and the vertical oblique crack widens to 4 mm.
Damage and cracks in specimen RRW-1: (a) cracks generated in the left lower corners, (b) cracks generated in the right lower corners, (c) diagram of wall failure, and (d) schematic diagram of wall failure.
After cracks appeared in BW-1 and RW-1, the ultimate load was quickly reached with the increase the loading grade and the hysteresis curve area was relatively narrow, as show in Figure 10(a) and (c), indicating low seismic energy consumption capacity. Reinforced wall specimens RBW-2 and RRW-2 had longer elastic phases than the unreinforced wall specimens (RW-1 and BW-2). After the reinforced wall specimens cracked, the hysteresis curve areas are larger than those of the unreinforced masonry walls, and the hysteresis curve maintains certain fullness with increased loading level, as show in Figure10(b) and (d), indicating that the energy dissipation capacity of the two clay brick specimens improved after reinforcement. The damage of RWB-2 and RRW-2, which were reinforced with M16 mortar and HRB335 Φ6 steel bar with a mortar joint depth of 50 mm on each side, is obviously better than that of the unreinforced walls (BW-1 and RW-1). Under the action of the same circular force, the reinforced walls sustain light damage and the hysteresis curve shows more circular times. Compared with the unreinforced walls, only the bottom four layers of brickwork in the reinforced walls are destroyed. Additionally, the reinforced walls only sustain narrow cracks and do not produce X-shaped cracks, maintaining their original integrity.
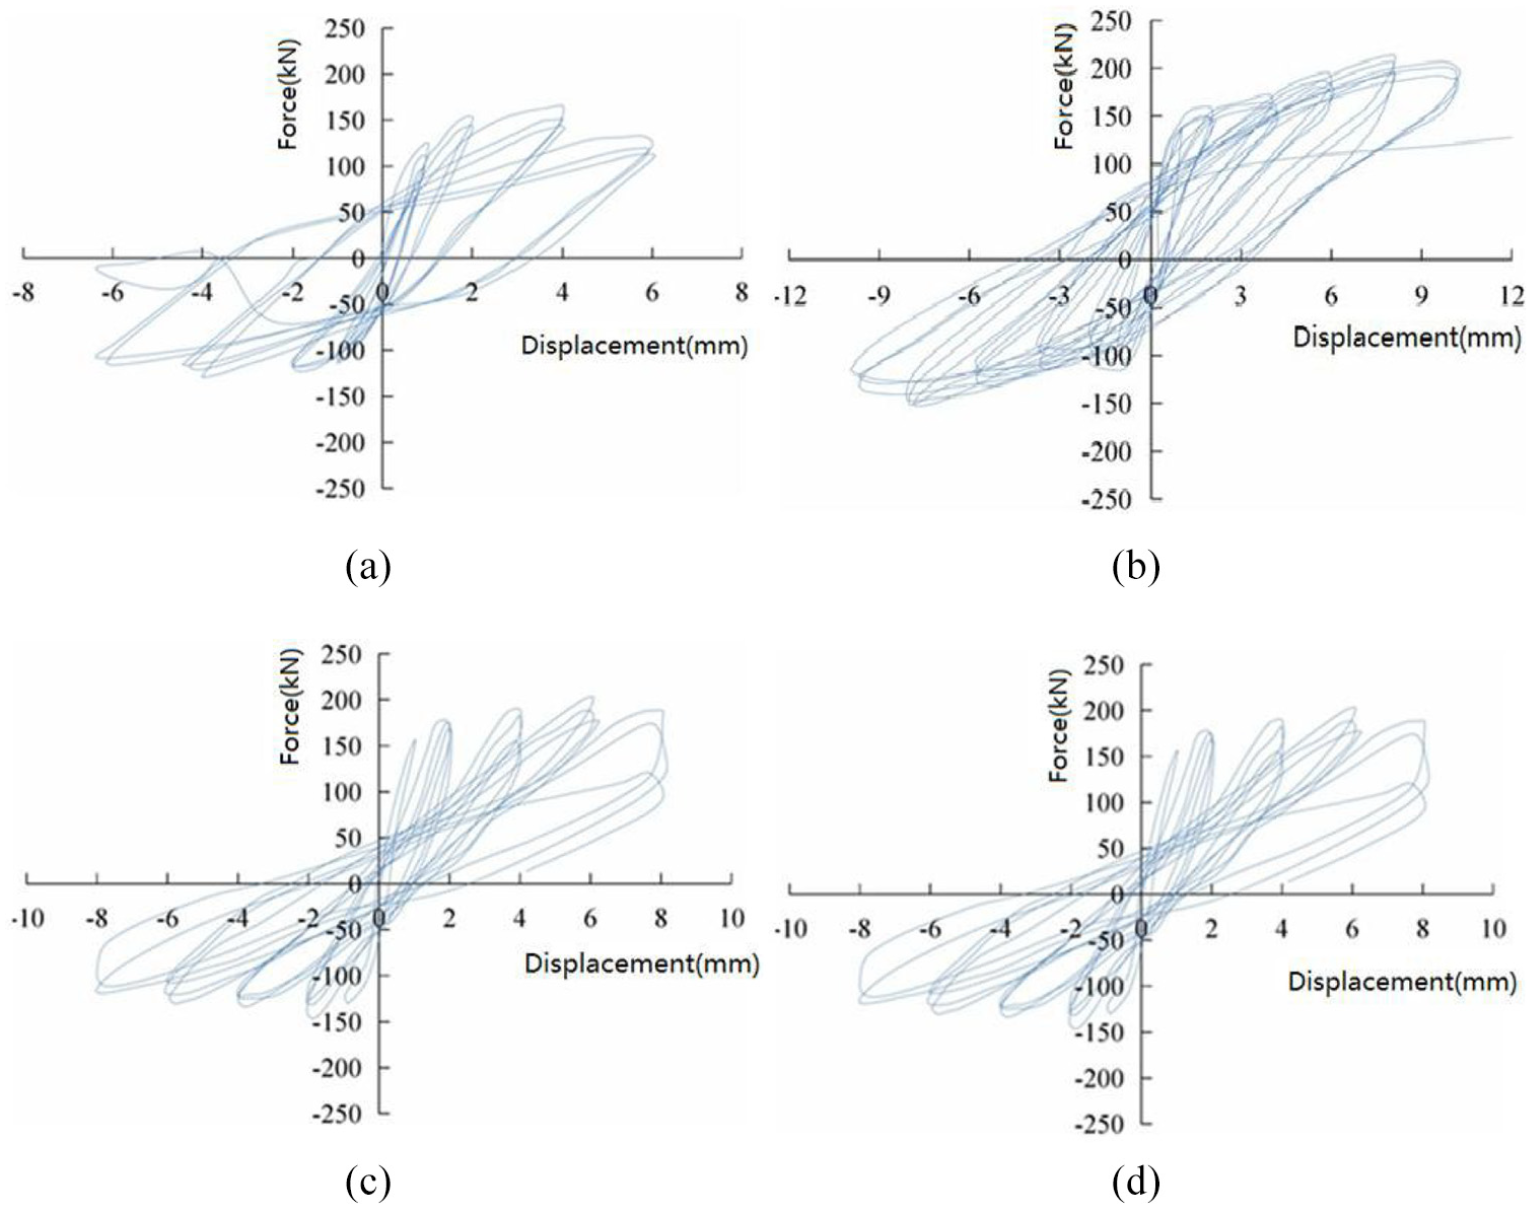
Hysteresis curve of specimen: (a) BW-1, (b) BRW-1, (c) RW-1, and (d) RRW-1.
Skeleton curve analysis
As show in Table 8 and Figure 11, the bearing capacity and skeleton curves of each masonry wall specimen that the cracking load of RBW-2 and RRW-2 respectively increased 5.7% and 9.7% compared to the unreinforced walls, and displacement was approximately 1 mm greater in reinforced walls. During the ultimate failure stage, RBW-2 and RRW-2 had cracking loads that were 28.8% and 41.3%, respectively, higher than unreinforced walls, and the displacement of the reinforced masonry wall was approximately 7 mm larger. During the failure stage, RBW-2 and RRW-2 had cracking loads 43.6% and 47.2% higher, respectively, and displacement was 7–9 mm greater. After the pseudo-static test, the reinforced walls retained greater shear resistance than the ultimate failure bearing capacity of the unreinforced walls.
Comparison of bearing capacity and displacement results for each stage.
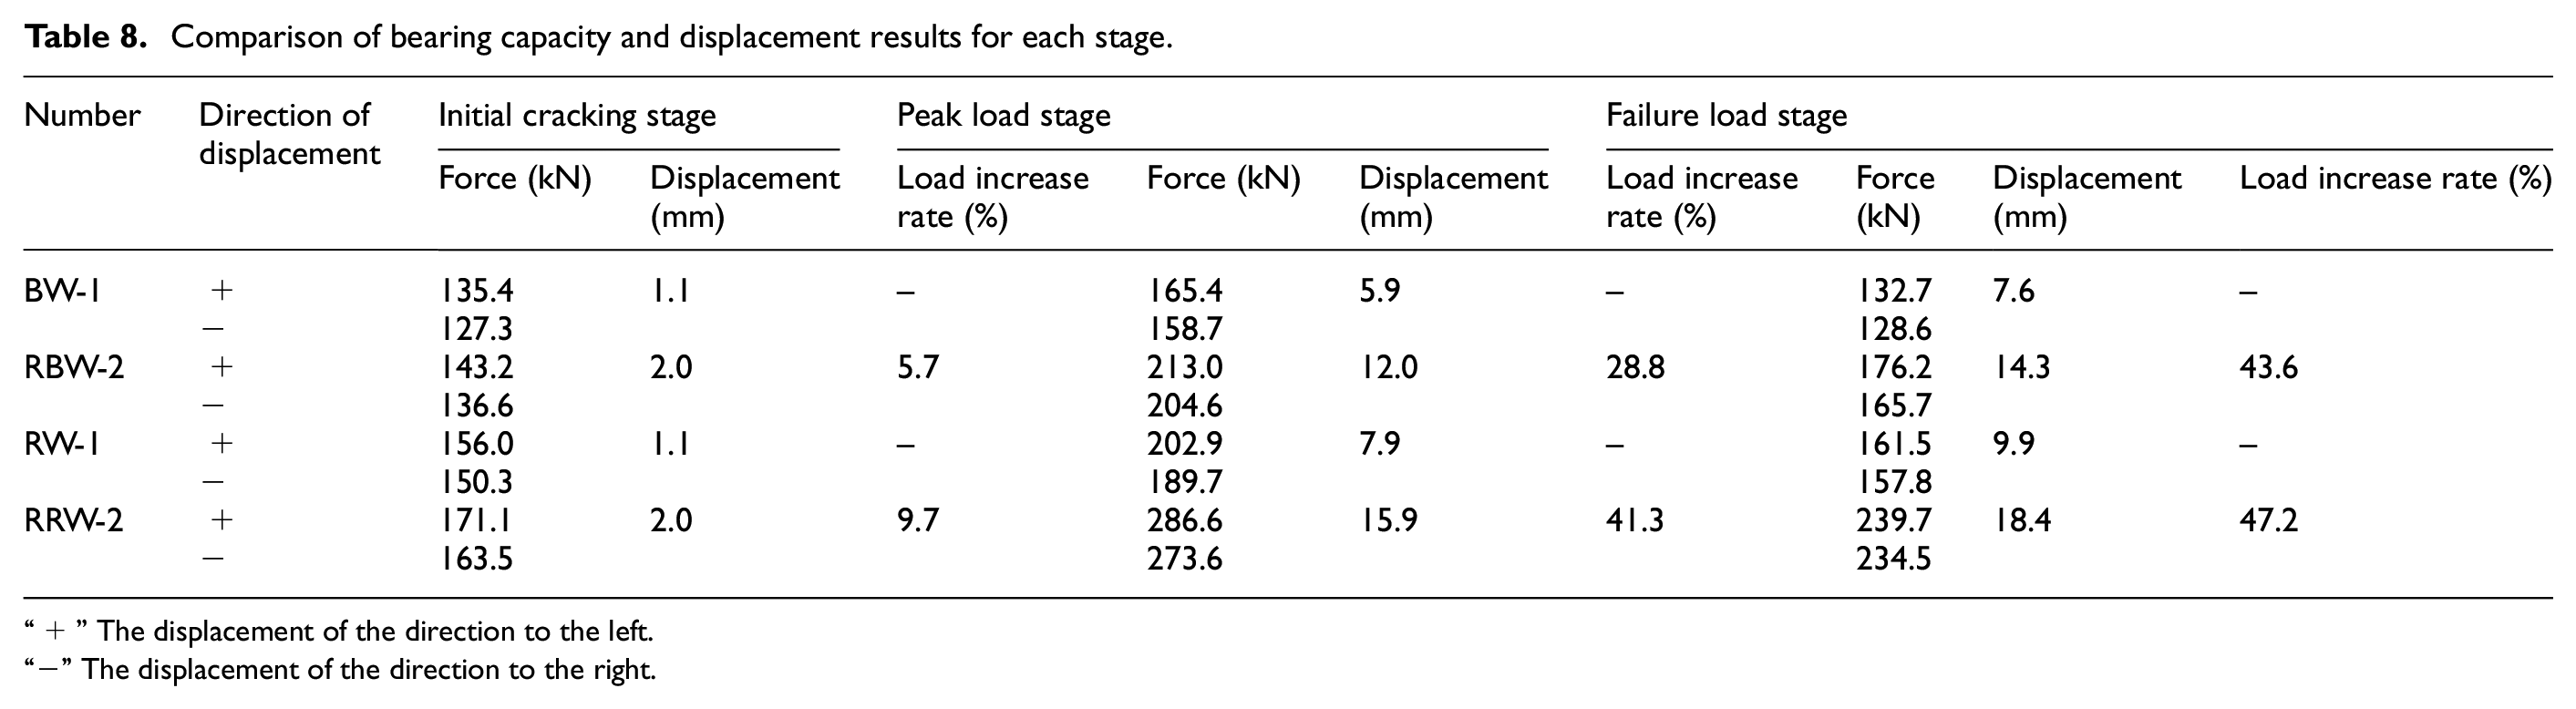
“+” The displacement of the direction to the left.
“−” The displacement of the direction to the right.
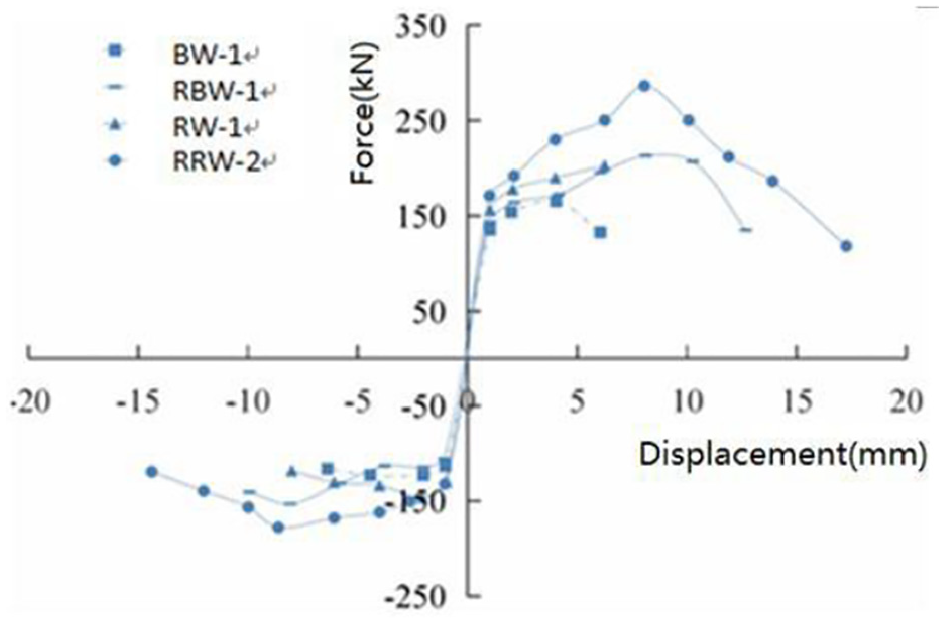
Shear-compression envelope curves.
Ductility analysis
Ductility is an important index that indicates structural plastic deformation capacity and safety reserve, thus reflecting their seismic performance. Based on this definition, ductility can be divided into displacement ductility coefficient, curvature ductility coefficient, and corner ductility coefficient. Greater ductility yields a stronger ability to dissipate seismic energy and withstand inelastic deformation. Displacement ductility coefficient is used here to compare the ductility performance of brick masonry wall specimens before and after reinforcement. The displacement ductility coefficient is the ratio of ultimate displacement to cracking displacement and is expressed as:
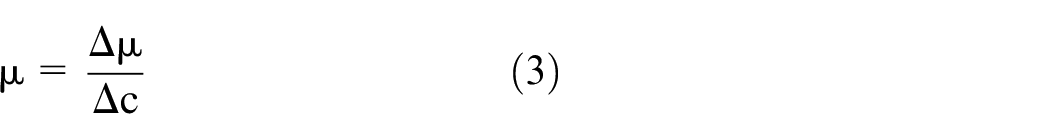
where Δμ is the ultimate displacement of the wall (i.e. the corresponding displacement when the load is reduced to 85% of the ultimate load, and Δc is the cracking displacement of the wall (i.e. the corresponding displacement when the first crack occurs).
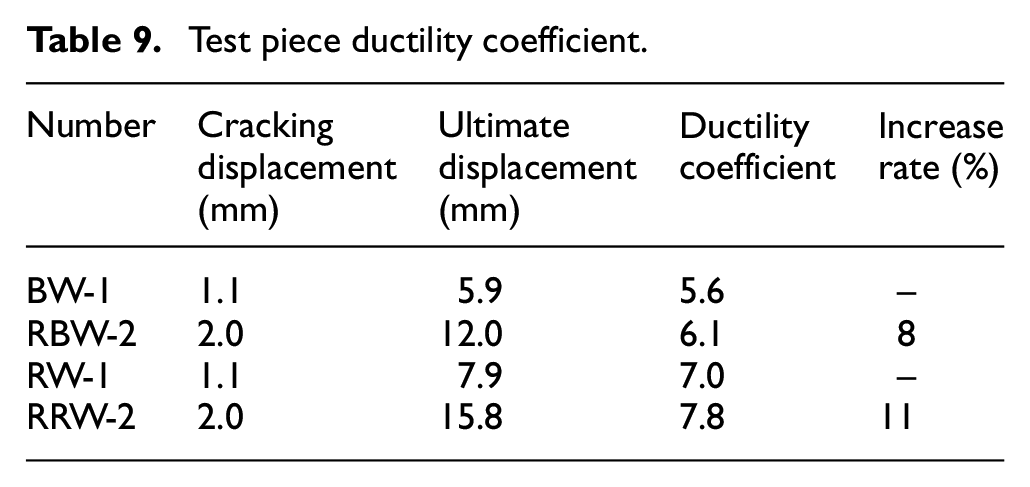
As show in Table 9, compared with the unreinforced walls, the ductility coefficients of RBW-2 and RRW-2 have been improved by 8% and 11%, respectively. The test results show that mortar joint reinforcement can effectively improve the deformation ability of brick masonry walls.
Test piece ductility coefficient.
Stiffness degradation curve
Specification for seismic test of buildings (JGJ 101-1996, 1996) states that stiffness can be expressed by secant stiffness
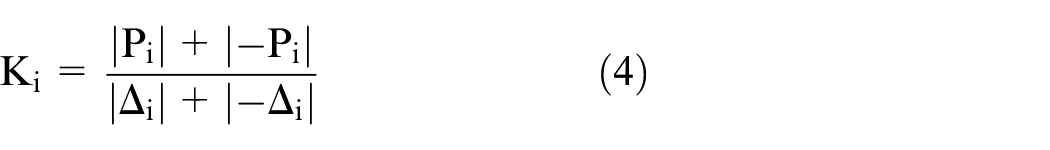
where
Figure 12 shows that stiffness of BW-1, RW-1, RBW-2, and RRW-2 continuously reduced with increasing displacement. Additionally, with the number of the cracks on the wall are increase, with the width and length of the cracks develop, the stiffness ability is reduced, and the residual strain of the test pieces no longer increase. When specimens are fully cracked, stiffness degradation has stabilized, and all specimens basically maintain this rule.
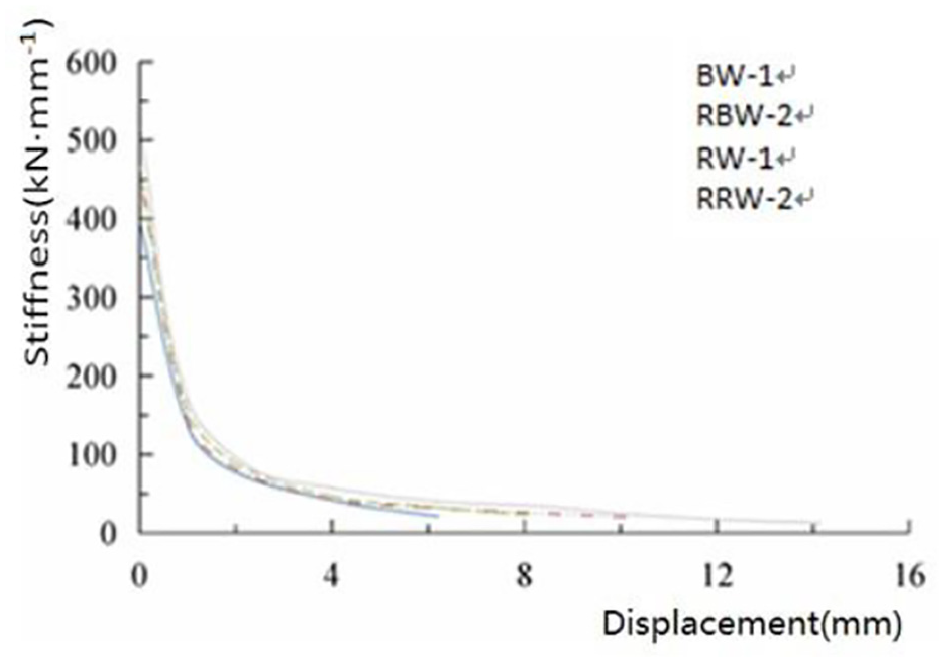
Stiffness–displacement curve.
The initial stiffness of RBW-2 and RRW-2 is greater than that of BW-1 and RW-1. During the loading process, RBW-2 and RRW-2 have higher stiffness than BW-1 and RW-1, indicating that the joint reinforcement significantly increases stiffness of the wall until the specimen is destroyed. In the later loading stages, the stiffness of BW-1 and RW-1 attenuate faster than RBW-2 and RRW-2. In a steady state under the same stiffness value, RBW-2 and RRW-2 have larger displacement deformation abilities than BW-1 and RW-1.
These results indicate that reinforcement delays the stiffness degradation rate of the masonry wall specimens. In later stages of the loading process, the high-strength cement mortar and steel bars added in the joints play an obvious role in significantly improving wall specimen integrity.
Energy dissipation capacity analysis
Energy dissipation capacity is an important indicator reflecting the seismic performance of structures. The area of hysteresis loop is often used to judge energy dissipation capacity of the structures, with a larger hysteresis loop area indicating better energy dissipation. The energy dissipation capacities of all masonry walls are shown in Figure 13.
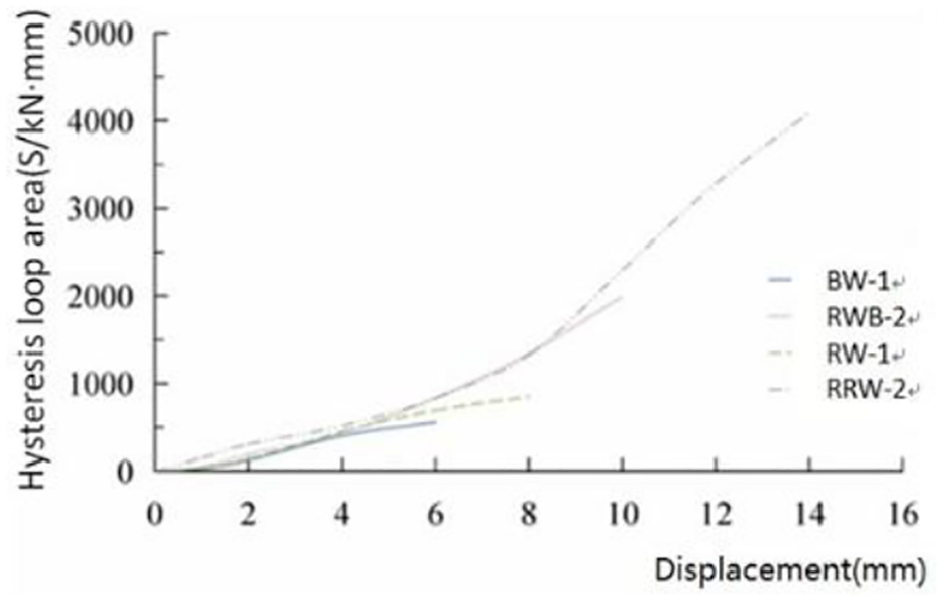
Area of hysteresis loop–displacement curve.
The energy dissipation capacities of RBW-2 and RRW-2 are better than those of BW-1 and RW-1. Additionally, RBW-2 and RRW-2 still maintain a certain energy-dissipating capacity after being damaged and that energy consumption tends to be stable, whereas the capacities of the unreinforced specimens are significantly reduced. The ORB masonry walls have better energy dissipation capacities than the OBB masonry walls, and this is more obvious with reinforcement. We thus know that the reinforcement method can improve masonry wall energy dissipation capacity, and that reinforcement works better for ORB masonry walls.
Analysis of wall sheet shear capacity
Generally, masonry walls are mainly subject to horizontal cyclic loads caused by earthquakes and vertical loads transmitted by superstructures under earthquakes. The shear failure patterns are divided into three forms: shear friction failure, shear-compression failure, and diagonal compression failure. The shear failure patterns of the masonry walls under earthquakes are mainly determined by the axial stress ratio
Calculation of shear capacity of unreinforced masonry walls
Based on this investigation and research on many actual projects in China, it is found that axial stress ratio does not exceed the limit of shear damage. Therefore, equation (7) is used for structural design of the actual project. The axial stress ratio of the two kinds of unreinforcement wall specimens are 0.52 and 0.55, respectively. The shear capacity of the two brick masonry wall types is calculated as follows:

Where, Am is horizontal section area of masonry wall;
Calculation of shear bearing capacity of reinforced masonry walls
The test results indicate that the compressive strengths of the walls are obviously improved after reinforcement. Additionally, every side of each floor of the brick is reinforced by high-strength mortar joints and HRB335 Φ6 steel bars, thus the damage layer is reinforced by the joints. Therefore, the reinforced wall specimens’ shear bearing capacity is calculated and summed up by the shear bearing capacity of the original mortar joint, the shear bearing capacity of high-strength mortar, and the shear bearing capacity of the steel bar. Therefore, the shear bearing capacity of the shear-friction failure in this test can be expressed as:

Where, fv0 is shear strength fv0 = k5
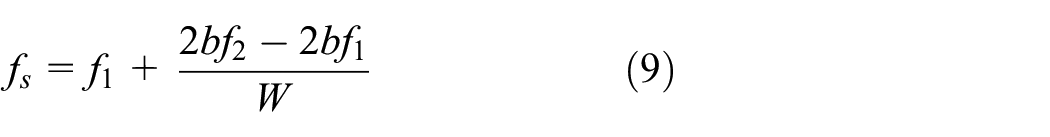
The depth of the joint on one side of the wall is b and the width of the wall is W. This is because the actual mortar strength of the reinforced wall specimens consists of the original mortar f1 and mortar f2, which is added subsequently. The shear capacity of the original mortar V1 can be expressed as:

The shear bearing capacity of mortar with joints V2 can be expressed as:

The mortar compressive strength of actual wall specimens is obtained as:
The shear bearing capacity of a wall strengthened with stiffening joints V is:
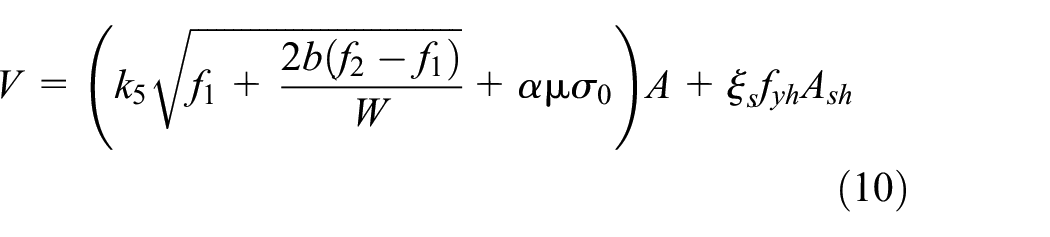
where, fv0 is shear strength fv0 = k5
Based on this formula, each specimen’s shear capacity is compared with corresponding experimental values, which are shown in Table 10.
Comparison of wall specimen shear bearing capacity with test values.
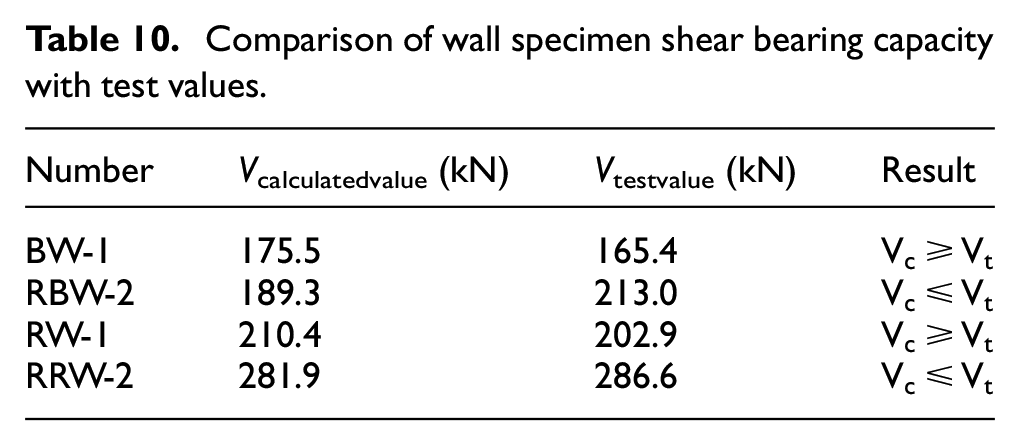
The shear capacities of the reinforced walls thus meet the design requirements. Because the OBBs and ORBs were made in the 1970s, their compressive bearing capacities cannot meet the compressive bearing capacity specified by Chinese standards. The test of masonry shear strength along the joint section demonstrated that when joint strength is high, masonry structure’s weak point becomes the bricks, and the compressive strength of the bricks becomes the main influence on the structure’s seismic capacity.
Conclusions and recommendations
To investigate the effectiveness of reinforcing typical masonry structures with high-strength mortar and HRB335 Φ6 steel bar, the mechanical properties of materials and shear strength of masonry along the joint section were tested. The physical properties of the masonry wall were tested in the pseudo-static test. Based on the experiments, the following conclusions are obtained:
The building materials mechanical properties test shows that ORBs have a 64% higher compressive bearing capacity than OBBs. These are the main reasons why ORB specimens have higher shear strength than the OBB specimens in the joint shear strength and the pseudo-static tests.
The shear capacity of the OBB and ORB masonry were increased with the increasing the depth of the high-strength mortar joints used in the mortar joints. The shear strength of the OBB and ORB masonry specimens reinforced with 25 mm of high-strength mortar has increased 3% and 5%, respectively. For mortar joint depths of 50 mm, the shear capacity of OBB and ORB specimens both increased 30%. The shear capacities of the OBB and ORB specimens reinforced with 50 mm deep joints of high-strength mortar and HRB335 Φ6 steel bar increased 53% and 63%, respectively.
Compared with the unreinforced OBB and ORB walls, the shear strength of the walls reinforced with 50 mm high-strength mortar joints and HRB335 Φ6 steel bars was improved 28.82% and 41.86%, respectively. The hysteresis curve areas of the reinforced walls are larger than those of the unreinforced masonry walls. The ultimate deformation displacement was increased by a respective 88.57% and 79.65% for the reinforced OBB and ORB walls, and the ductility coefficients aalso increased by 8.21% and 11.40%, respectively.
In view of these seismic indicators, this reinforcement method can effectively improve the ductility, ultimate shear capacity, deformation capacity, and energy dissipation capacity of typical masonry structures. At the same time, the reinforcement method can improve typical masonry structure seismic performance. The data obtained from this study can provide data to support seismic strengthening, seismic assessment, and seismic design of typical masonry structures in China.
Footnotes
Declaration of conflicting interests
The author(s) declared no potential conflicts of interest with respect to the research, authorship, and/or publication of this article.
Funding
The author(s) disclosed receipt of the following financial support for the research, authorship, and/or publication of this article: This research was financially supported by Tianjin Science and Technology Major Project [18ZXAQSF00110], China Earthquake Administration Earthquake Science and Technology Spark Program [XH18005], Tianjin Natural Science Foundation [17JCQNJC07000], Tianjin Municipal Science and Technology Bureau (No.19PTZWHZ00080).