



Abstract
The study of reinforced concrete members subjected to combined loads always has been an important research topic in the field of engineering, but the torsional behavior of T-shaped reinforced concrete members subjected to combined loads has yet to be determined. This paper is focused on providing a detailed explanation of the torsional behavior of T-shaped reinforced concrete members subjected to combined compression-bending-shear-torsion. From the perspective of experimental tests and numerical analyses, in this paper, we discuss the effects of combined loads on the torsion bearing capacity, the development of cracks and the failure mode, strains of key points in the concrete and longitudinal reinforcement, and the relation of torsion and angular displacement. We conducted experiments and numerical analyses of four groups of reinforced concrete members by using the main variables of the axial pressure ratio and the bending moment. Also, the experimental and calculated results are compared based on the elastic-plastic damage constitutive model of concrete. Based on the test data and the existing formula, we also extended the formula used to calculate the torsion bearing capacity and provided diagrams of the interaction when combined loads were applied. In addition, the results of this study highlight the turning point from torsion failure to compression-bending-torsion failure. The test results demonstrated that torsion capability increases in the specified range of axial pressure ratio and decreases as bending increases. The test results also indicate the importance of considering the effects of compression-shear-bending on the torsion bearing capacity in the engineering design.
Keywords
Introduction
The curved, cable-stayed bridge is a kind of cable-stayed bridge developed under the influence of complicated geology, topography, and geomorphology. Compared with a straight cable-stayed bridge, the main girder of the curved, cable-stayed bridge is subjected to axial force and shear as well as to torsion and the lateral bending moment because of the influence of radius of curvature and the radial component of the cable force. Concerning the interaction of loads, the correlation of bearing capacity of reinforced concrete (hereafter referred to as RC) members under combined loads always has been an important research topic. In addition, the interaction has yet to be fully considered for the different cross-section RC members subjected to combined loads of compression-bending-shear-torsion (Kamiński and Pawlak, 2011).
Previous scholars (Ersoy and Ferguson, 1968; Hsu, 1968; Syamal et al., 1971; Elfgren, 1972; Lampert and Collins, 1972; Badawy et al., 1977; Zhou and Liu, 2011) conducted many experiments and theoretical studies associated with combined loads, and they provided the corresponding calculation formulas and design methods. As shown in Figure 1, Ersoy and Ferguson (1968) obtained a quarter arc curve and formula of the correlation between shear and torsion by 25 rectangular RC beams without stiffeners. Syamal et al. (1971) conducted experiments on 21 L-shaped RC beams without web reinforcement and 12 beams with web reinforcement under the combined loads of shear and torsion, and, as shown in Figure 1, they pointed out that there is a correlation between shear and torsion. Hsu (1968) found that there was a flexural and torsional correlation for RC beams without web bar and that the correlation model could be simplified as a three-fold line. Based on that, Lampert and Collins (1972) pointed out that the bending moment and torsion in RC beams would affect each other, and they proposed two related equations of bending and torsion of RC rectangular section beams by summarizing previous experiments and theoretical studies. Elfgren (1972) and Badawy et al. (1977) fit the bending-shearing-torsion interaction curves for members with rectangular cross-section based on the number of experiments. In addition, Hsu and Mo (2010) summarized the formulas of bending-shear-torsion interaction in their book entitled “Unified theory of concrete structures.”Chen (2014) conducted research on reinforced concrete members with rectangular cross-sections and obtained the relationship between compression, bending, shear, and torsion. Wang and Huang (2017) used an experimental investigation to study the ultimate capacity model of RC members with rectangular cross-sections under combined axial, bending, shear, and torsion loading. In addition to the literature cited above, a careful examination of the existing literature has shown that previous researchers, for example, Klus (1968), Ewida and McMullen (1981), Rahal and Collins (1995), and Bernardo et al. (2012), made very valuable contributions concerning the behavior of RC members under combined shear, bending, and torsion. However, all of their studies focused on L-shaped and rectangular cross-section members rather than T-shaped members.

Interaction of shear-torsion.
As pointed out by Kamiński and Pawlak (2011), despite numerous studies conducted in the area of members under combined loads, including torsion, many questions remain unanswered, and the behaviors of RC members with cross sections other than rectangular or circular have yet to be explored. The pioneering works on the behavior of T-shaped beams or members were conducted by several researchers (Ersoy and Ferguson, 1967; Farmer and Ferguson, 1967; Victor and Aravindan, 1978; Mirza and Furlong, 1983; Karayannis, 1995; Deifalla and Ghobarah, 2014; Cladera et al., 2015). However, all of them focused on T-shaped beams under pure shear, pure bending, pure torsion, combined shear and bending moment, or combined bending and torsion. Also, the behavior of three inverted, T-shaped beams tested under different values for the ratios of the applied torsion to the applied shear force has been discussed (Deifalla and Ghobarah, 2014).
To summarize, although T-shaped members subjected to combined loads have been studied, the outcomes of all these studies have not fully covered the study of the torsion behavior of T-shaped RC members subjected to combined compression-bending-shear-torsion. As Kamiński and Pawlak (2011) pointed out, a larger number of members should be tested, and the tests should consider the larger number of variables that influence the bearing capacity and deformability of RC members under combined loads. Therefore, test results are essential in verifying analytical models, for example, the finite element model and the finite difference numerical model (Karayannis, 1995; Karayannis and Chalioris, 2000; Hassan et al., 2007; Mozos and Aparicio, 2011; Sadeghian et al., 2010; Rabczuk et al., 2005; Mullapudi and Ayoub, 2013).
In this paper, we describe the experimental and numerical studies of the interaction behavior of T-shaped RC members subjected to the combined loads of compression-bending-shear-torsion. In the experimental study, four groups of members containing twelve members were prepared and tested with different axial pressure ratios or bending moments. The strain analysis and crack observation methods for concrete and reinforcement were used to analyze the torsion bearing capacity and failure mode of RC members subjected to combined loads. By analyzing the data obtained from the experiment, we obtained the formula for calculating the torsion bearing capacity of T-shaped RC members under combined loads.
Research significance
The study provides a certain reference for the calculation formula and method of the ultimate bearing capacity under combined loads, and it also has an important reference meaning for practical bridge engineering applications. In addition, the findings of this study will be of interest to the engineers who are involved in designing structures that will be subjected to combined loads. Also, the findings can serve as reference material for further research on the unified formula of T-shaped RC members under combined loads.
Experimental program
Scale model for the T-member
The strength of the concrete and the dimensions of the tested members were chosen based on a statistical analysis of the geometric dimensions of the members subjected to combined loads (Farmer and Ferguson, 1967; Victor and Aravindan, 1978; Mirza and Furlong, 1983; Karayannis, 1995; Deifalla and Ghobarah, 2014; Cladera et al., 2015; Karayannis and Chalioris, 2000). Longitudinal reinforcements and stirrups were designed according to Building code requirements for structural concrete (ACI 318-08) and Commentary (ACI Committee, International Organization for Standardization, 2008). The dimensions of the concrete and the reinforcement ratio remained unchanged for all members that were tested, and only the axial pressure ratio and the shear and bending moment were changed in the experiment to investigate the interaction relationship of combined loads of compression, bending, shear, and torsion.
Details of the RC member
The entire RC member was composed of three parts, that is, a fixed base, a T-shaped tested RC member, and column cap for loading. Figure 2(a) shows the height of the RC member that was tested, the fixed base, and the column cap. The total height of each RC member was 1000 mm, with an effective height of 900 mm (800 mm + 200/2 mm) from the top of the fixed base to the centerline of the applied loads. The fixed base was set at the height of 400 mm, and the column cap was set at the height of 200 mm to avoid partial failure of the top during loading. The spaces between the stirrups were 60 mm in the tested member and 70 mm in the column cap, respectively, to ensure at least complete spiral cracks would occur within the bottom and central regions. Figure 2(b) shows the tested cross-section dimension and longitudinal reinforcements of the member within the test region. The longitudinal reinforcements were 8 mm spaced at 42 and 32 mm, respectively, in the web and flange along the longitudinal direction. All of the tested members had a total depth of 300 mm, a web thickness of 120 mm, a flange width of 90 mm, and a web width of 210 mm. The concrete cover was 29 mm for the web and the flange. Figure 2(c) shows the dimensions and steel detail of the column cap. All of the reinforcements with diameters of 8 and 6 mm were ribbed steel bars. Table 1 shows the steel bar design parameters of the tested member; the parameters of the fixed base were not considered.

Dimensions and reinforcement details of tested members (unit: mm): (a) front elevation, (b) T-shaped section, and (c) column cap section.
Design parameters of the reinforcements.

Material properties
In the experiment, the twelve members made of C30 concrete, which were supplied by the local-mix plant, were divided into four groups (T1–T4), three for each group, considering the dispersion of concrete. The concrete had the requested 28-day axial compressive and tensional strength as well as the strength in the same day of member testing. The results of the compression testing of the concrete were averaged across the three concrete cubic samples, as shown in Table 2. The properties of the longitudinal reinforcements and the stirrups are summarized in Table 3. Each strength and strain value were the average for three test samples. The yield strains recorded during the experiment were used to decide whether the reinforcements would yield during the process of loading.
Strength of the concrete on different dates.

Properties of the reinforcements.

Test setup and instrumentation
Prior to the testing, a special test setup was designed to provide combined loads of compression, bending, shear, and torsion for members. Figure 3 shows that all of the forces were implemented by hydraulic jacks, with jack-1 exerting compression, jack-2 simultaneously exerting bending and shear, and jack-3 and jack-4 exerting torsion with the force arm length of 0.9 m between them. A ball joint bearing was put on the top of jack-1 to ensure free movement and rotation of the test member. According to the earlier numerical calculation and analysis of the strain on the concrete and the reinforcements, strain gauges were placed to measure the strain between the central region and the bottom of the web and flange of the tested member, as shown in Figure 4. Figure 5 shows the strain gauges that were used to measure the strain in the longitudinal reinforcements and stirrups at different locations. Figure 6 shows the locations of the displacement meters on the tested members. All strain gauges and displacement meters were installed at the same location in all of the members that were tested.

Test setup: (a) image of test setup and (b) site layout of setup.

Locations of the strain gauges on the member that was tested (unit: mm): (a) strain gauges on the web and (b) strain gauge on the flange.

Locations of the strain gauges on the longitudinal reinforcements and stirrups (unit: mm).

Location of the displacement meter on the tested members.
Loading plan
Based on the values in Table 4, Figure 7 shows the loading plan for the members under combined loads. Members under the combined loads of compression, bending, shear, and torsion were tested in load-control mode to obtain the torsion bearing capacity. In the whole process, the influences of other loading paths on bearing capacity were not considered; rather, as shown in Figure 7, only the loading directions of the forces were considered. The torsion was applied in load control mode at the interval of 4.5 kN · m (5 kN × 0.9 m). After the first reinforcement yield, tests were continued until the concrete failed. During the test, the strains on the concrete and reinforcements, the displacements of the tested points, and the development of cracks were observed and recorded at each load step 5 min after loading.
Loading protocol.


Loading plan.
Test results and observed behavior
Torsion bearing capacity
The torsion bearing capacity of the RC members is controlled by reinforcement reaching the yield strain of 2026

Location of strain stage gauge: (a) location of G3 on the reinforcement and (b) location of C5 on the concrete.

Relation of load-strain of key points: (a) group T1, (b) group T2, (c) Group T3, and (d) group T4.
Figure 10 shows the torsion bearing capacity of Groups T1–T4 based on the first reinforcement reaching yielding strain. In Figure 10, the initial strain value is greater than 0 because compression and bending were applied first according to the loading plan. Table 5 gives detailed information about the members that were tested, including the group number, the size of the loading forces including compression, shear and bending, each tested values and average values of torsion of each group including three members, and it also shows the torsion bearing capacity of the members under the combined loads of compression, bending, shear, and torsion.

Curve of load and strain: (a) group T1, (b) group T2, (c) group T3, and (d) group T4.
Results of members.

Development of cracks and failure mode
Figure 11 shows that the surfaces of each member were numbered in order to facilitate the description of the cracks. Because the same load was applied to three members in each group, one member in each group was taken as an example to illustrate the development and failure mode of cracks.

Numbering surfaces.
Member of group T1
Figure 12(a) shows the crack diagram of the T1-1 member, and Figure 12(b) and (c) show pictures of cracks on the site. When a torsion of 13.5 kN · m was applied, the first crack was 200 mm over the bottom of member on surface ③, with the width of 0.08 mm, the length of 120 mm, and the angle of 45° between the direction of the crack and the horizontal direction. When a torsion of 18 kN · m was applied, several cracks appeared on seven sides of the concrete member, and the first crack appeared on surface 1, which was 300 mm away from the bottom of the member and about 45° from the horizontal direction, and it had a width of 0.2 mm and a length of 140 mm. When the torsion reached 36 kN · m, cracks occurred in the flange slab and the web. In this state, the width of the cracks that were formed in the early stage became wider and longer, and the oblique cracks obviously ran through the entire web and flange, and the failure mode of the member was dominated mainly by the torsion effect. Figure 12(b) and (c) show cracks from the tested member on the tested site after the yielding of reinforcements to verify the failure mode.
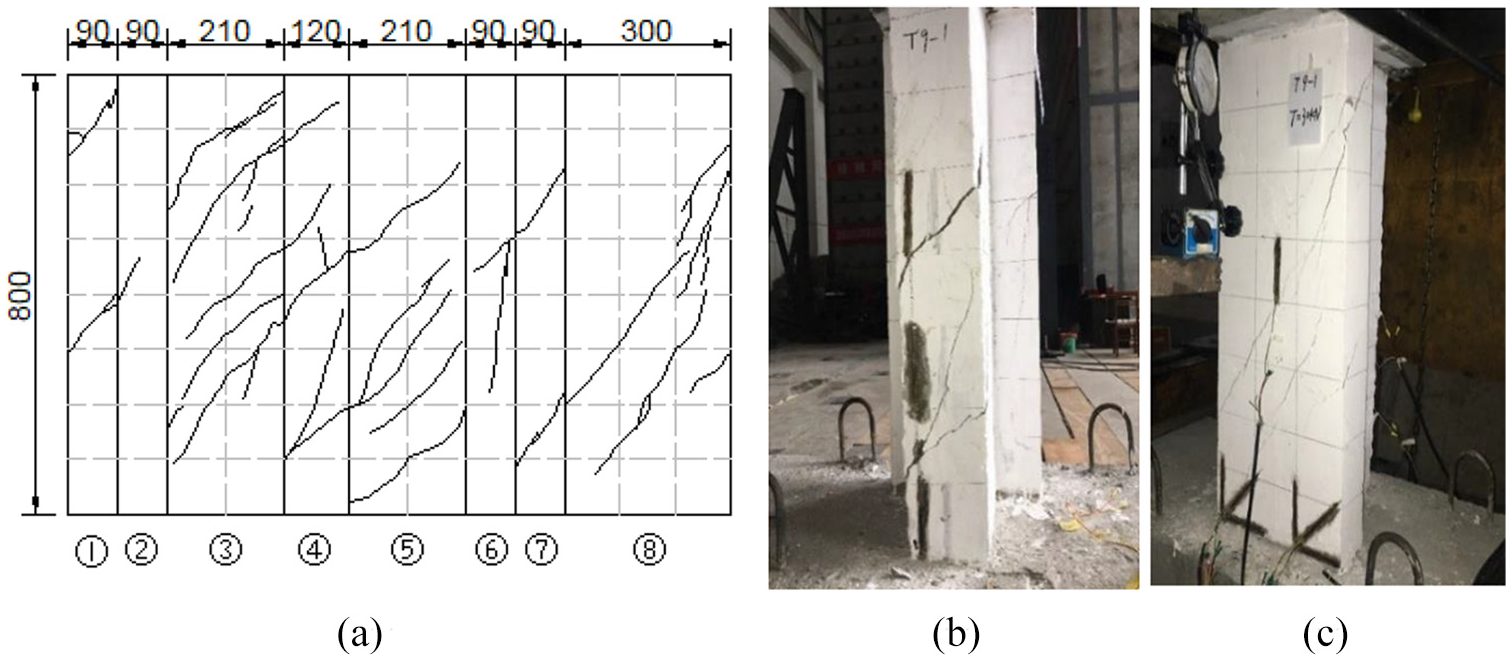
T1-1 Member cracks (unit: mm): (a) diagram of crack T1-1, (b) y axis, and (c) negative y axis.
Member of group T2
The crack diagram of the T2-2 member is shown in Figure 13(a), and the pictures of cracks on site are shown in Figure 13(b) and (c). When a torsion of 13.5 kN·m was applied, the first crack with the angle of approximately 45° from the horizontal direction appeared on surface ③, at a location that was 210 mm away from the top of the member, and the crack had a width of 0.1 mm and a length of 100 mm. When a torsion of 18 kN·m was applied, several cracks appeared on six sides of the concrete member, and the first crack that had formed on surface ③ previously expanded more, that is, to a width of 0.4 mm and a length of 240 mm. Figure 13(a) shows that, when the torsion load reached 54 kN · m, the behavior of member was dominated by the torsion failure mode according to the form of the existing cracks, and there were several diagonal cracks that ran through the flange and the web. Figures 13(b) and (c) show cracks from the tested member on the tested site after yielding of reinforcements to verify the failure mode.

T2-2 Member cracks (unit: mm): (a) diagram of crack T2-2, (b) x axis, and (c) y axis.
Member of group T3
Figure 14(a) shows the crack diagram of the T3-2 member, and Figures 14(b) and (c) show pictures of the cracks on the site. When a torsion of 9 kN·m was applied, the first crack appeared on surface ③ of the member, at a location that was 400 mm from the bottom of the member, with the angle of about 45° from the horizontal direction, and it had a width and length of 0.12 and 30 mm, respectively. When the torsion of 13.5 kN · m was applied, several cracks appeared on seven sides of the concrete member, and the first crack on surface ③ was extended as the torsion increased. When the torsion reached 40.5 kN · m, cracks formed between the flange plate and the web, reaching widths of 6 mm. Figure 14(a) shows that diagonal cracks with an angle of 45° from the horizontal were spread all over the third, fifth, and eighth surfaces. In this state, the width of the cracks that were formed in the early stage became larger, and there were diagonal cracks running through the entire web and flange plate. The concrete at the interface between the web and the flange plate was damaged significantly, and it looked as if it could fall off. The failure mode of the member was dominated mainly by the torsion effect. Figure 14(b) and (c) show cracks in the member at the tested site after the reinforcements yielded, verifying the failure mode.

T3-2 Member cracks (unit: mm): (a) diagram of crack T3-2, (b) x axis, and (c) y axis.
Member of group T4
Figure 15(a) shows the crack diagram of the T4-1 member, and Figure 15(b) and (c) show pictures of the cracks on the site. When a torsion of 9 kN · m was applied, the first crack appeared on surface ③ of the member, and it was located 140 mm from the bottom of the member at an angle of about 45° from the horizontal direction, and it was 0.1 mm wide and 160 mm long. When a torsion of 18 kN·m was applied, several cracks appeared on seven sides of the concrete member. When the torsion reached 36 kN·m, cracks between the flange plate and web formed through, and their maximum width was 4 mm. Some diagonal cracks occurred around 45° between the crack direction and the horizontal direction on surfaces ③, ⑤, and ⑧ of the upper-middle member, and vertical cracks extended to the bottom of the member on the lower right side. In this state, the width of the cracks formed in the early stage became wider and longer, with the cracks obviously running through the entire the web and flange plate. The failure mode of the member was dominated mainly by the torsion effect. Figure 15(b) and (c) show the cracks in the tested member on the tested site after the yielding of reinforcements to verify the failure mode.
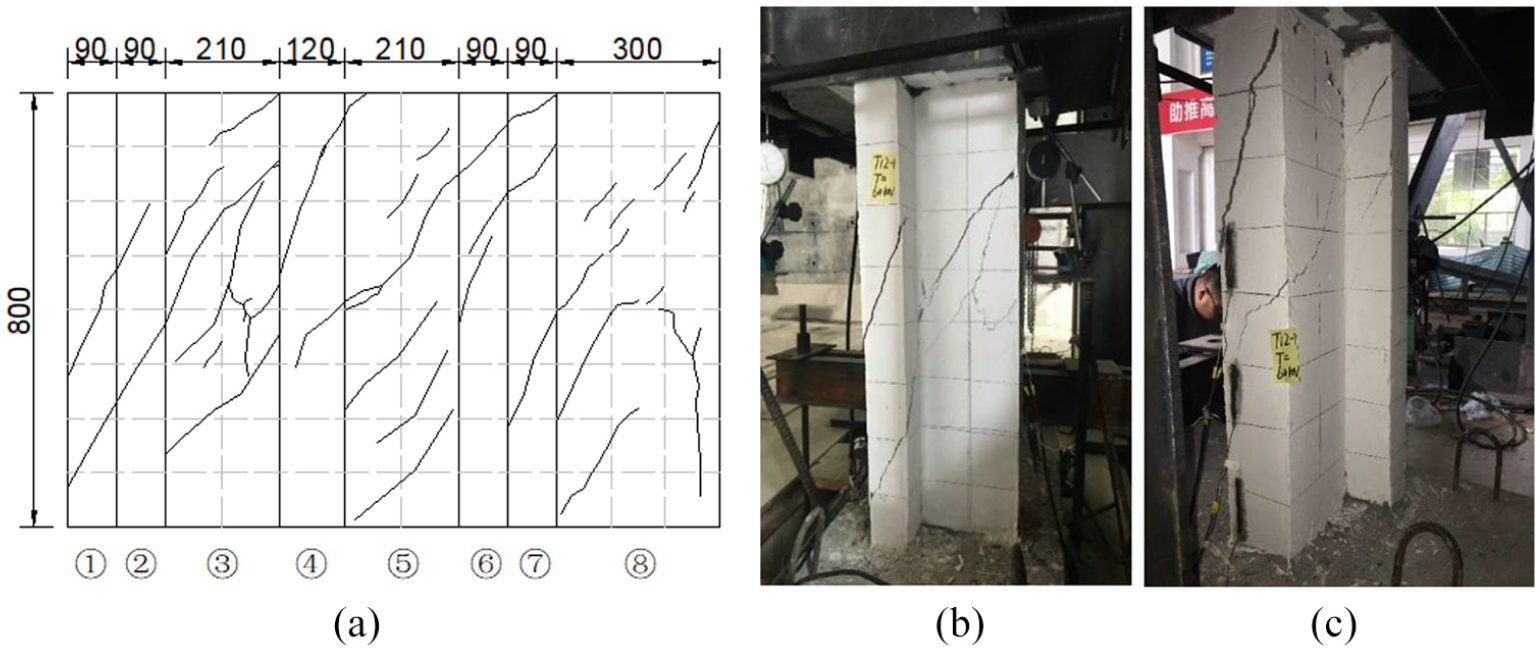
T4-1 Member cracks (unit: mm): (a) diagram of crack T4-1, (b) x axis, and (c) y axis.
In all of the above members that were tested under combined loads of compression-bending-shear-torsion, a torsion crack appeared first on surface ③ of the member. The angle of the first crack basically was 45° between the direction of the crack and the horizontal direction. With different levels of bending and axial compression, cracks appeared at vertical and horizontal angles. Due to the increase in the torsion, the cracks extended in the existing directions. The difference between Groups T1 and T2 was that the location of cracks for Group T2 appeared on the upper-middle part of surface ⑧, and the location of cracks for Group T1 appeared on the lower-middle part of surface ⑧. The difference between Groups T2 and T3 was that the horizontal cracks appeared on surface ⑧. The difference between Groups T3 and T4 was that the horizontal cracks for Group T4 appeared on the lower middle of surface ⑧ as the compression and bending moment increased.
Comparison between experimental and computational results
The finite element model and parameters
Based on the elastic-plastic damage method (Lubliner et al., 1989; Lee and Fenves, 1998; De Souza Neto et al., 2011; Simulia, 2013a; Simulia, 2013b), the concrete damage factor is calculated as shown in Figure 16. According to the plastic damage model theory (Lubliner et al., 1989; Lee and Fenves, 1998; De Souza Neto et al., 2011; Simulia, 2013a; Simulia, 2013b), the material parameters of concrete at the elastic stage are as follows: Young’s modulus Ec = 30,000 MPa, Poisson’s ratio γ = 0.2. The material parameters of concrete on a plastic stage are as follows: dilatancy angle ψ = 25°, flow potential offset, κ = 0.1; Ultimate strength ratio of biaxial compression to uniaxial compression,

Concrete damage factor: (a) damage factor of compression and (b) damage factor of tension.
C3D8R solid element in ABAQUS and T3D2 Truss element were used to simulate concrete and reinforcements, and the joint action of reinforcements and concrete was simulated by embedding constraints. The dimension design of the finite element model only considered the effective height of the member, not the cap of the member used for practical loading, as shown in Figure 17.

Abaqus model of member: (a) concrete model and (b) steel bars model.
Comparison of bearing capability
Table 6 shows that the standard deviation between bearing capacity provided by calculation and that obtained by the experiment was 0.07, and the coefficient of variation between them was 8%. All of these data further verify the reliability of the calculation method and the experimental results.
Comparison of calculated and experimental results.

Relationship between the torsion angle and torsion
Figure 18 shows the comparison of the relationship between the torsion angle and the torsion from Groups T1–T4 under different parameters according to Table 4. The horizontal dashed lines that correspond to the torsion average bearing capacity in Figure 18 are the average values in Table 5. Generally, the calculated values of the torsional bearing capacity of the solid element used in ABAQUS in this paper were basically consistent with the test values. In this paper, then focus was on the torsion bearing capacity when the reinforcements reached the yield strength. Therefore, the calculated values of the load in these figures were up to the value in Table 3 that the reinforcement reaches the yield strain, so there was no reflection of the falling section of the load with the increase of the angle in Figure 18. Figure 18 shows that, for the elastic stage of the member and before the yield of the reinforcement (the initial rising section of the curve), the torsion and displacement of the member are related linearly. In the first half of the curve, due to the lack of cracking, the slopes of the curves are larger under the condition of the joint resistance to combined loads for concrete and reinforcements. After the crack of the concrete in the second half of the curve, the torsion was exerted mainly by the reinforcements for every member. With the increase of the torsion, the angular displacement also increased rapidly, and this caused the slope of the curve to decrease. Comparing Figure 18(a) and (b) indicates that the torsion bearing capacity of Group T1 was greater than that of Group T2, and the angular displacement was greater than that of Group T2 when the bearing capacity was reached. The compression and bending moment of group T2 were greater than they were for group T1. Due to the influence of the bending moment, the longitudinal reinforcement in webs accelerates the increase of the strain of reinforcement, which makes the reinforcement reach the yield strain of reinforcement more quickly, resulting in the reduction of the torsional bearing capacity and the angular displacement of members. The comparison of Figure 18(b) and (c) indicates that the torsion bearing capacity of the members of Group T2 is greater than that of the members of Group T3, and the angular displacement when reaching the bearing capacity was greater than that of the members in Group T3. When Figure 18(c) and (d) are compared, it is apparent that the torsion bearing capacity of the members in Group T3 is a little greater than it is for the members of Group T4, and the angular displacement in Group T3 is very close to that in Group T4 when the bearing capacity is reached. Table 4 shows that the two groups of members are affected significantly by the bending moment when both the compression and bending moment increase, and the tensile strain of the reinforcement on the web obviously increased. Finally, when the reinforcement reaches the yield strain, both the torsion bearing capacity and the angular displacement are reduced.

Relation of torsion-angular displacement: (a) group T1, (b) group T2, (c) group T3, and (d) group T4.
Comparison of cracks
According to the results of the calculation, the location of the damage and its extent are analyzed and compared with the results of the experiment. In the plastic damage model of concrete, it is stipulated that the concrete has no damage when the damage factor is 0. However, when the damage factor is 1, the concrete is damaged completely. The literature, that is, ACI Committee, International Organization for Standardization (2008) points out that concrete will have visible cracks due to the damage cause by tension and compression when the strain is more than double the peak strain in the relationship of stress and strain under the condition of uniaxial tension and compression. Taking T2-2 as an example, Figure 19 shows that the computational result of the development of cracks is consistent with the result of the member that was tested.

Cracks of concrete member: (a) picture of the site and (b) the calculated model.
Analysis of the experimental results
Analysis of torsion strength
The average values of the torsion bearing capability of each of the groups in Table 6 are shown in Figure 20. The values of pure compression,
Comparing T1 with T2 members, when the values of
Compared with the T2 and T3 members, when the values of
Comparing T3 members with T4 members, when the values of

Diagram of average value of torsion bearing capabilities.
Dimensionless number and pure ultimate strength.

Analysis of the failure process and mode
Based on the relation of load-strain of the key points in Section 4.1 and the observation and developmental description of cracks in Section 4.2, the yield strain of the reinforcement should be reached first. As the value of
Interaction relationship of combined loads
Based on the literature (Ersoy and Ferguson, 1968; Syamal et al., 1971; Hsu and Mo, 2010) and the results we observed, some formulas are proposed for use as references as shown in equations (1) through (6).


In the formulas, M, V, and T respectively represent the bending moment, shearing force, and torsion sustained by a member under the combined loadings.
According to Lu (2012), the formula for calculating the bearing capacity of reinforced concrete members under the combined loads of axial force, bending moment, shear force, and torsion can be expressed as shown in equation (7).

Where N, M, V, and T are the designed values of axial force, bending moment, shear force, and torsion of the member, respectively;
On the basis of the formulas presented above (Ersoy and Ferguson, 1968; Syamal et al., 1971; Hsu and Mo, 2010; Lu, 2012), the bearing torsion formula of T-shaped section members under combined loads of compression-bending-shear-torsion was formulated in this paper as follows:

In the formula, M, N, V, and T respectively represent the bending moment, compression, shearing force, and torsion sustained by members under the combined loadings.
According to the data in Table 7 and the data from the added numerical calculation in Table 8, substituting the data into equation (8) for fitting, and the following formula is obtained:

Added calculated numerical data.

The foregoing analysis in Section 6.1 indicated that the strength of the torsion increases as the axial pressure ratio increases when the axial pressure ratio is in the range of 0–0.25. According to equation (9) and the range of the axial pressure ratio, the torsional researching area of interaction is deduced under combined loads, as shown in Figure 21. Further, the forgoing analysis in Section 6.2 also indicated that the strength of the torsion decreases as the bending moment increases, and the

Research area of compression-bending-torsion.

Relationship of interaction: (a) interaction of compression-bending-torsion, (b) interaction of compression-shear-torsion, and (c) interaction of bending-shear-torsion.
In Figure 22(a), curve AB denotes that the reinforced concrete member is only affected by compression, and the torsional bearing capacity increases as the axial pressure ratio increases in the range of 0–0.25; curve BC denotes that, when the axial pressure ratio is 0.25, the torsion bearing capacity decreases with the continuous increase of the bending moment from 0 to 0.59; curve DC denotes that the torsion bearing capacity increases as the axial pressure ratio increases from 0 to 0.25 when the bending moment ratio is 0.59. Curve AD denotes that the torsion bearing capacity decreases with the continuous increase of only the bending moment from 0 to 0.59.
In Figure 22(b), curve AB denotes that the reinforced concrete member is only affected by compression, and the torsional bearing capacity increases with the increase of the axial compression ratio within the range of 0–0.25; curve BC denotes that the torsional bearing capacity decreases with the continuous increase of shear, when the axial pressure ratio is 0.25; and curve AC denotes the relationship between the axial pressure ratio and the shear ratio when the torsion remains unchanged.
In Figure 22(c), curve AB denotes the interaction between shear and torsion; curve BC denotes the interaction between bending and shear; and curve AC denotes the interaction between torsion and the bending moment.
Conclusions
This paper describes an experimental study of the interaction behavior of T-shaped concrete members subjected to the combined loads of compression-bending-shear-torsion, and it compares the results from the experiments with the results of theorical computations. This work resulted in the following conclusions:
The torsion bearing strength relative to pure torsion will increase with the increase of the axial pressure ratio from 0 to 0.25 under the condition of torsion failure.
Based on the analysis of the existing interaction formula for combined loads, a formula for the interaction of T-shaped concrete members subjected to compression-bending-shear-torsion was established. The formula for calculating the torsion bearing strength under the combined loads is obtained by using the test data, which can provide a reference for calculating the bearing strength of torsion under the combined loads of compression-bending-shear-torsion with the same strength of concrete and ratio of reinforcement.
Through analyzing the results of the tests that were conducted, it was concluded that the turning point of
According to the formula that was obtained, when the axial pressure ratio is 0.25, the torsion bearing strength can be increased by 24% compared with strength of the pure bending under the combined loads of compression and torsion.
Footnotes
Declaration of conflicting interests
The author(s) declared no potential conflicts of interest with respect to the research, authorship, and/or publication of this article.
Funding
The author(s) disclosed receipt of the following financial support for the research, authorship, and/or publication of this article: This work was supported by the National Key Research and Development Plan of China under Grant (2016YFC0802202); National Natural Science Foundation of China under Grant (51678489 and 51978577). This work was supported by the National Key Research and Development Plan; National Natural Science Foundation.
