
Abstract
Geopolymer recycled aggregate concrete (GRAC) is a new green construction material, which uses geopolymer as the binder and recycled concrete as aggregates. To compare the flexural performance of GRAC and ordinary recycled aggregate concrete (RAC) beams, static loading tests were conducted on seven GRAC beams and three RAC beams. The effects of the replacement ratio of recycled aggregates (RAs), the replacement patterns, and the reinforcement ratio on the flexural behavior of GRAC beams are evaluated. The test data show that the replacement ratio has no significant effect on the cracking pattern, failure mode, or bending capacity of GRAC beams, but the replacement pattern does have an effect. Under a given replacement ratio, replacing only the larger fraction of natural aggregates (NA) with RA improves the concrete strength and crack resistance of both RAC and GRAC beams, compared to that using same replacement percentage for all fractions. Due to the lower elastic modulus and strength of GRAC prepared in this study, the GRAC beams have lower height of neutral axis and greater deflection than RAC beams at the same load level and possess slightly lower cracking load, bending capacity, and ductility. The bending capacity of GRAC beams can be predicted by the formulas proposed for ordinary reinforced concrete beams in the Chinese code GB50010-2010, ACI 318-11, or BS EN 1992-1-1:2004 codes, but the safety margin is generally lower than that of ordinary reinforced concrete beams.
Introduction
With the rapid construction of infrastructure worldwide, the demand for concrete and its raw materials has been increasing dramatically in recent years. That has led to depletion of the natural sources of aggregate. Meanwhile, a massive amount of waste concrete is being generated through demolition of old buildings and other structures, and its disposal has significant negative impacts on the environment. Breaking up waste concrete to produce recycled aggregate (RA) and then using it in casting new concrete is an effective way to mitigate the shortage of natural aggregate (NA) and alleviate the adverse environmental impact of demolished waste, thus maintaining the sustainability of the construction industry (Akhtar and Sarmah, 2018).
Extensive studies have shown that the performance of recycled aggregate concrete (RAC), in which recycled coarse aggregate partly replaces natural coarse aggregate, is acceptable in many structural applications. Ignjatović et al. (2013) studied the effect of the replacement ratio of RA and the reinforcement ratio on the flexural behavior of RAC beams, and the test results showed that the differences in flexural capacity and ductility of RAC beams with different RA replacement ratios can be considered negligible. Xiao et al. (2012) and Li et al. (2015) conducted thorough reviews on the structural performance of RAC slabs, columns, beam-column joints, and other structural members and concluded that the performance of RAC members is similar to that of NAC members. However, due to the old mortar adhering to recycled aggregate, the crack resistance and stiffness of RAC beams are reported to be inferior to those of natural aggregate concrete (NAC) members. In the study of Arezoumandi et al. (2015), greater deformation, more closely spaced cracks, and lower cracking moment were shown in RAC beams. A group led by Maruyama et al. (2004) found that compared to NAC beams, RAC beams formed wider cracks at smaller crack spacing at similar load levels, but that the crack width can be reduced by 20–30% by including an expansive additive in RAC. Research from Seara-Paz et al. (2018a), (2018b) has shown that the cracking moment of RAC beams decreases as the RA replacement ratio increases and the long-term deformation of RAC beams is greater than that of NAC beams. Therefore, improving the crack resistance and stiffness of RAC beams is necessary for the structural application of RAC in beams.
Portland cement is an ordinary binder in concrete material. However, huge amount of greenhouse gases (CO2) and dust is emitted during cement production, resulting in serious air pollution. Geopolymer is an environmentally friendly inorganic binder with lower CO2 emissions and energy consumption during its production. Also, geopolymer is reported to have the advantages of high early strength (Ariffin et al., 2013; Ryu et al., 2013), excellent bonding performance (Peng et al., 2019), good resistance to high temperature (Zhang et al., 2014), and chemical corrosion (Hardjito et al., 2004; Olivia and Nikraz, 2012; Yuan, 2017). As a result, it has come to be regarded as one potential substitute for the ordinary Portland cement (OPC) in concrete production (Aleem and Arumairaj, 2012).
Aiming to take the advantages of both recycled aggregates (RAs) and geopolymer binder, some researchers have conducted studies on geopolymer recycled aggregate concrete (GRAC). Nuaklong et al. (2016; 2018) investigated the properties of fly ash-based GRAC and found that its compressive strength was 76–93% of that of geopolymer concrete (GC) without RA. Ren’s group, however, has reported contrary results (Ren and Zhang, 2018, 2019). In Ren’s studies, GC produced with RA exhibited higher compressive strength than GC with NA. They attributed that to the stronger bonding between geopolymer binder and RA than with NA. Liu et al. (2016) indicated that there is no interfacial transition zone that could be identified between the old cement paste of RA and the new geopolymer paste in such material.
Limited researches are currently available for the structural performance of GRAC members. Kathirvel and Kaliyaperumal (2016) investigated the flexural behavior of alkali-activated slag concrete beams with different RA replacement ratios. They found an increase in the load carrying capacity, greater deflection at failure, more cracks, and wider cracks developed as the replacement ratio increased. They also showed that the method of ACI 318 standard generated a conservative calculated ultimate strength prediction. The study conducted by Raj and Bhoopesh (2017), however, reported a dwindling trend in the ultimate load and ductility when replacing 40% of the NA with RA in GC beams.
Although the effect of RA replacement ratio on the flexural behavior of GRAC beams has been investigated in previous researches, there is a lack of the experimental data to compare the flexural performance of RAC and GRAC beams. Several studies showed that the elastic modulus of GC was much lower than that of OPC concrete (Nguyen et al., 2016; Nath and Sarker, 2017). Experiments conducted by Jeyasehar et al. (2013) have shown that compared to OPC concrete beams, GC beams had higher cracking load, greater mid-span deflection, greater flexural capacity, and smaller crack width. Dattatreya et al. (2011) and Yost et al. (2013) found that GC beams exhibited lower ductility than OPC concrete beams. When RAs are used in GC or OPC concrete, the flexural performance of GRAC and RAC beams are believed to be different. Due to the lower elastic modulus of GRAC, GRAC beams not only exhibited larger deflection but also may have different crack morphology and other performance, as compared to RAC concrete.
To investigate the difference between the flexural performance of GRAC and RAC beams, seven reinforced GRAC beams and three RAC beams were tested under static loads. The effect of the RA replacement ratio and reinforcement ratio on the cracking load, crack development, failure modes, bearing capacity and ductility of the two kinds of beams were evaluated. In addition, to improve the crack resistance of GRAC and RAC beams, a new replacement pattern was trialed, that is, only large-size NA particles were replaced by RA, while small-size NA particles were retained. It was reported that this replacement pattern can enhance the strength and elastic modulus of RAC (Gu et al., 2015; Li and Xiong, 2017), but no research has evaluated its effect on the crack resistance of recycled concrete beams. From the test results, the cracking moment and ultimate moment were obtained, and then they were compared with the theoretical calculation results. Finally, the influence mechanism of concrete properties and RA replacement pattern on the flexural behavior of GRAC and RAC beams was discussed. The study’s results provide a basis for the engineering application of GRAC beams.
Experimental program
Static load tests were conducted on seven reinforced GC beams and three OPC concrete beams. The test variables included the RA replacement ratio, the replacement pattern, and the reinforcement ratio. Data from the tests were utilized to evaluate the effects of these factors and to compare the flexural behavior of GRAC and RAC beams.
Materials and concrete preparation
Two types of binding materials, ordinary Portland cement (P.O 32.5 R) and metakaolin (MK)-fly ash (FA)-based geopolymer, were used to prepare concrete. The geopolymer was formed through an alkaline solution activating a 1:1 mixture of MK and FA. Potassium silicate solution with SiO2/K2O molar ratio of 1.0 and a mass concentration of 49% was used as the alkaline solution.
Properties of aggregates.
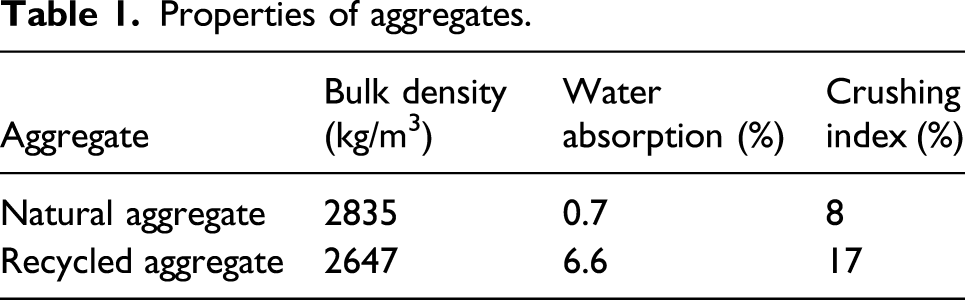
The coarse aggregates (NA and RA) were sieved into three fractions for aggregate gradation: I (4.75–9.5 mm), II (9.5–16 mm), and III (16–20 mm). Figure 1(a) presents the upper and lower limits of the grading curve of coarse aggregates with 20 mm nominal maximum aggregate size, specified by Chinese standard (GB/T 25177-2010, 2010). An intermediate grading curve was adopted for coarse aggregates in this study, and the mass ratio of the three fractions (I: II: III) was 3:4:3. Gradation for coarse aggregates used (5–20 mm).
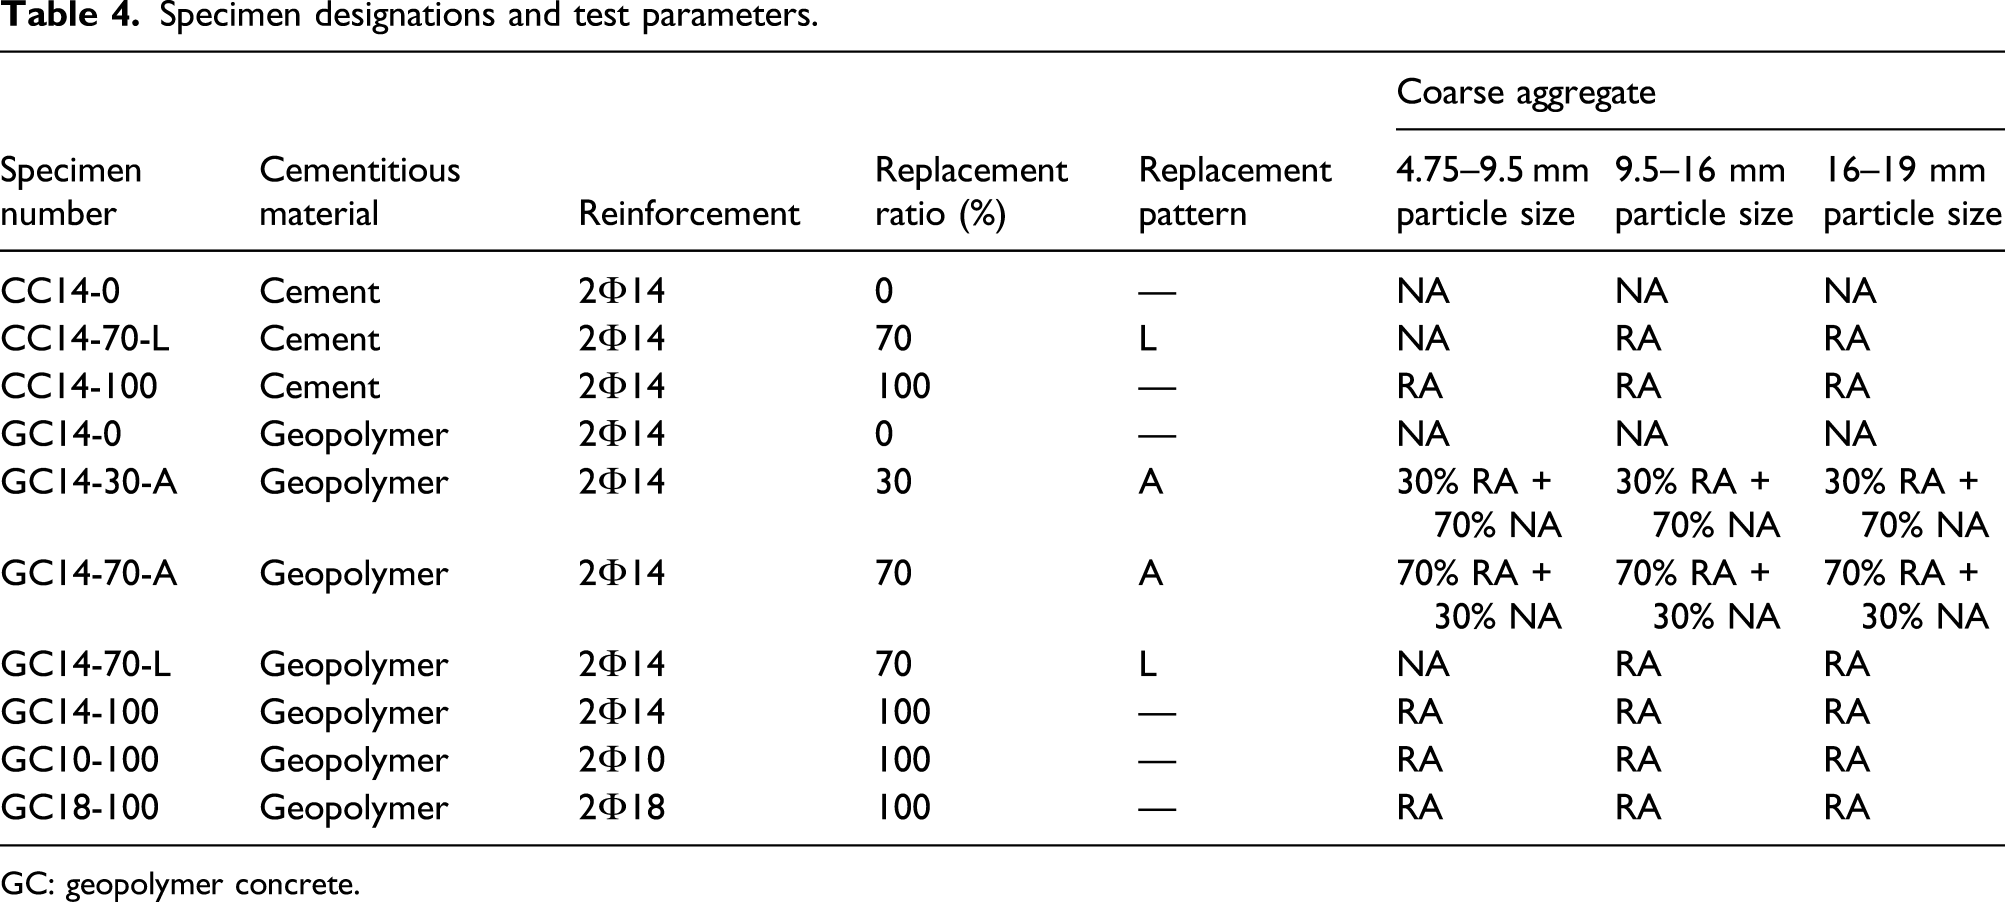
Three replacement ratios (30%, 70%, and 100%) of RA replacing NA were taken in RAC. With a given replacement ratio, the conventional aggregate replacement pattern (an all-size replacement pattern) is to replace the same percentage of all particle sizes with RAs (Leemann and Loser, 2019; Liu et al., 2019; Muduli and Mukharjee, 2019). But the new replacement pattern, termed the large-size replacement pattern, is only to replace the larger NA particles with RA. Both replacement patterns were taken at a replacement ratio of 70%. For the all-size replacement pattern, 70% (by weight) of the total coarse aggregates consisted of the three RA fractions (I, II, and III), and the remaining 30% was the three NA fractions, as shown in Figure 1(a). For the large-size replacement pattern, the NA fractions II (accounting for 40% of the total mass of coarse aggregates) and III (30%) were replaced by the corresponding RA fractions, and the NA fraction I (30%) was not replaced, as shown in Figure 1(b).
Mix proportions of OPC concrete and GC (in kg/m3).

OPC: ordinary Portland cement; GC: geopolymer concrete.
The RA’s greater water absorption would reduce the water available in concrete mixture for hydration or geopolymerization reaction, influencing the properties of the resulting concrete. To minimize this effect, the RAs were pre-saturated before mixing.
To prepare the OPC concrete or RAC, cement and water were first mixed in a mixer for 1 min, before the natural/recycled coarse aggregates and fine aggregates were added in sequence. Then the mixture was stirred for another 5 min. For GC or GRAC, the metakaolin and fly ash were poured into the mixer first. After mixing the MK-FA precursor for 1 min, potassium silicate solution was added and mixed with the MK-FA precursor for 2 min. Then the natural/recycled coarse aggregates and fine aggregates were added and mixed for another 5 min. After that, the concrete mixture was poured into molds to form the concrete specimens.
Specimen preparation
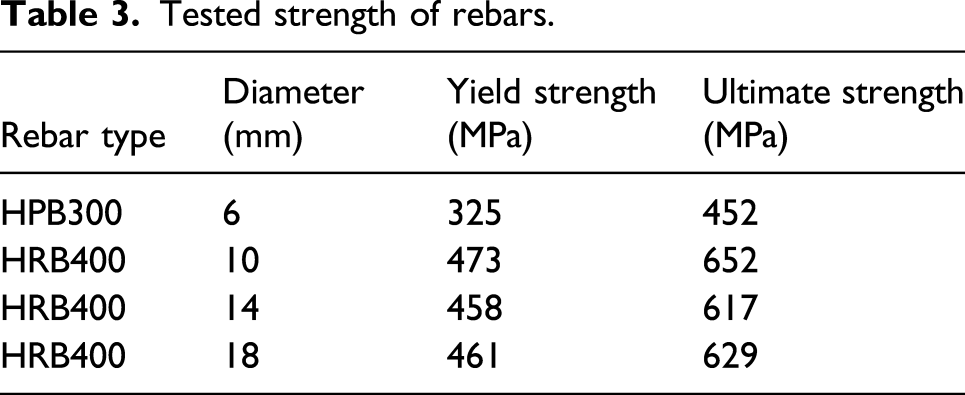
Ten reinforced concrete beams with the same geometry, but with different concrete types, replacement ratios, replacement patterns, and reinforcement ratios, were fabricated for undertaking static loading tests. The beams were 1800 mm long × 100 mm wide × 250 mm deep, simply supported with an effective span of 1600 mm. The bottom tensile longitudinal rebars in the beams consisted of two HRB400 ribbed rebars. The diameter of the two longitudinal reinforcements was 14 mm in eight of the 10 beams, 10 mm in one, and 18 mm in another beam. The corresponding tensile reinforcement ratios were 1.2%, 0.6%, and 2.1%. The top longitudinal reinforcement was two HRB400 rebars with 10 mm in diameter. It was truncated in the pure bending section to simplify the analysis of the test data and to facilitate calculating the bearing capacity. The stirrups in the beams were 6 mm diameter plain HPB300 rebars, with a concrete cover of 15 mm. They were placed at a spacing of 100 mm in the bending-shear section. No stirrup was arranged in the pure bending section. The specimen dimensions and reinforcement details are shown in Figure 2. The tested tensile strengths of rebars are listed in Table 3. Specimen size and reinforcement. Tested strength of rebars.
Specimen designations and test parameters.
GC: geopolymer concrete.
During the beams’ fabrication, three 150 mm cubic specimens and three 150 × 150 × 300 mm prismatic specimens were also cast for testing cubic compressive strength (fcu) and elastic modulus (E) of each type of concrete. After cast, all specimens were cured in the laboratory for at least 28 days before undertaking loading tests.
Test procedure and instrumentation
The specimens’ flexural performance was evaluated through four-point bending tests on simply supported beams. The load was applied through a vertically positioned 300 kN hydraulic jack and a horizontal rigid steel girder with span of 600 mm, as shown in Figure 3. The load was increased monotonically at a rate of 1–1.5 kN/min, monitored using a load cell. For each 5 kN increment, the load was kept constant for 5 min to document the development of cracks. When the applied load approached the estimated cracking load, the load increment at each pace was reduced to 1 kN until the first visible crack appeared in the pure bending section of the beam. After that, the load increment was returned to 5 kN at each pace. The beam was considered to have failed when the concrete in the compression zone was crushed and the beam could not hold the load steadily. Then the test was terminated. Test set-up.
The two sides of each beam were white-brushed in order to clearly document the cracking process. The cracks formed during loading were marked and photographed after each load level was reached. Deflections at the two supports and mid-span were recorded using three electrical displacement transducers, as shown in Figure 4. To monitor possible yielding of the steel reinforcement, two strain gauges were mounted to the two tensile longitudinal rebars at the mid-span. In addition, five strain gauges were attached on the sides of each beam at different height at mid-span to measure concrete strain and investigate the cross-sectional strain distribution. Data from the load cell, the displacement transducers, and the strain gauges were synchronously collected using a fully-computerized data acquisition system. Displacement meter and strain gauge arrangement.
Test results
Compressive strength and elastic modulus of concretes
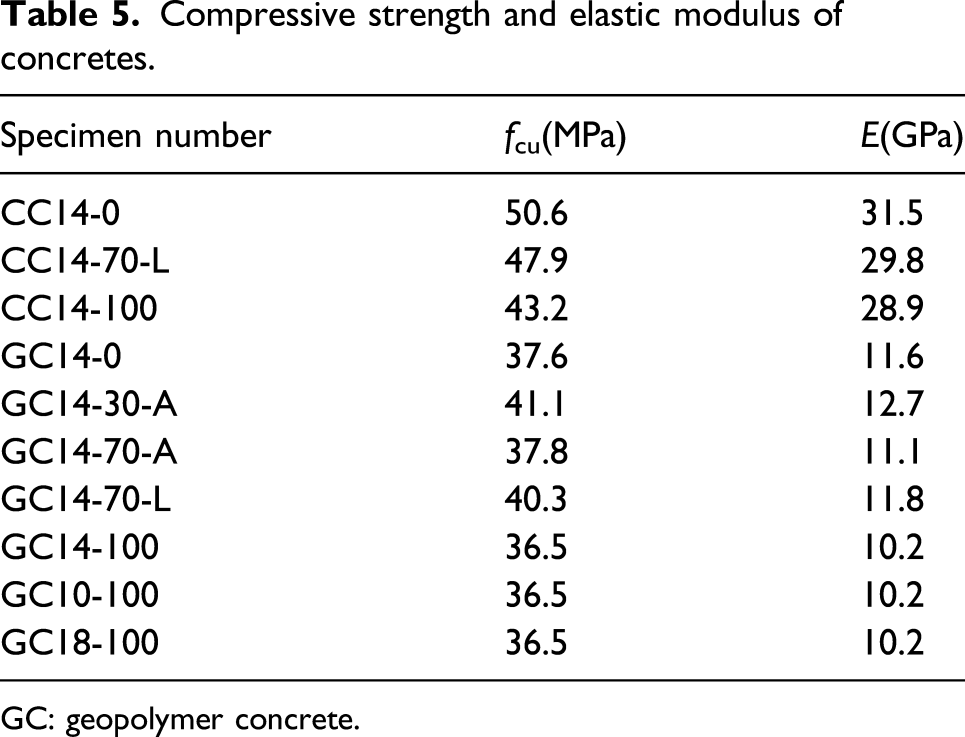
Compressive strength and elastic modulus of concretes.
GC: geopolymer concrete.
The elastic modulus of concrete is highly positively correlated with the compressive strength. Gu et al. (2015) reported that the elastic modulus of OPC concrete is proportional to the square root of its compressive strength. From Table 5, it can be seen that the compressive strength of GRAC, prepared in this study, was about 75–86% of that of RAC, while the elastic modulus of GRAC was only about 35–40% of the latter. This implied that the elastic modulus of GRAC, prepared in this study, was only about half of that of RAC with same strength level. Nguyen et al. (2016) has also reported that the measured elastic modulus values of heat-cured low-calcium fly ash GC are lower than those calculated using current standards for OPC concrete. Duxson et al. (2005) suggests that the lower elastic modulus of GC is mainly due to its very porous microstructure resulting from speciation of the alkali silicate activating solution and from the presence of unreacted particles (such as metakaolin and fly ash).
Cracking patterns and failure modes
All the tested beams failed in typical flexural failure. Vertical cracks first appeared at the beam bottom in the pure bending section. Then the number, width, and length of cracks increased with the applied load. When the rebars reached its yield point, there is a sudden increase in the deflection of the beam. Eventually, all beams failed by the crushing of the concrete in the compression zone.
Details of cracks on the test beams.
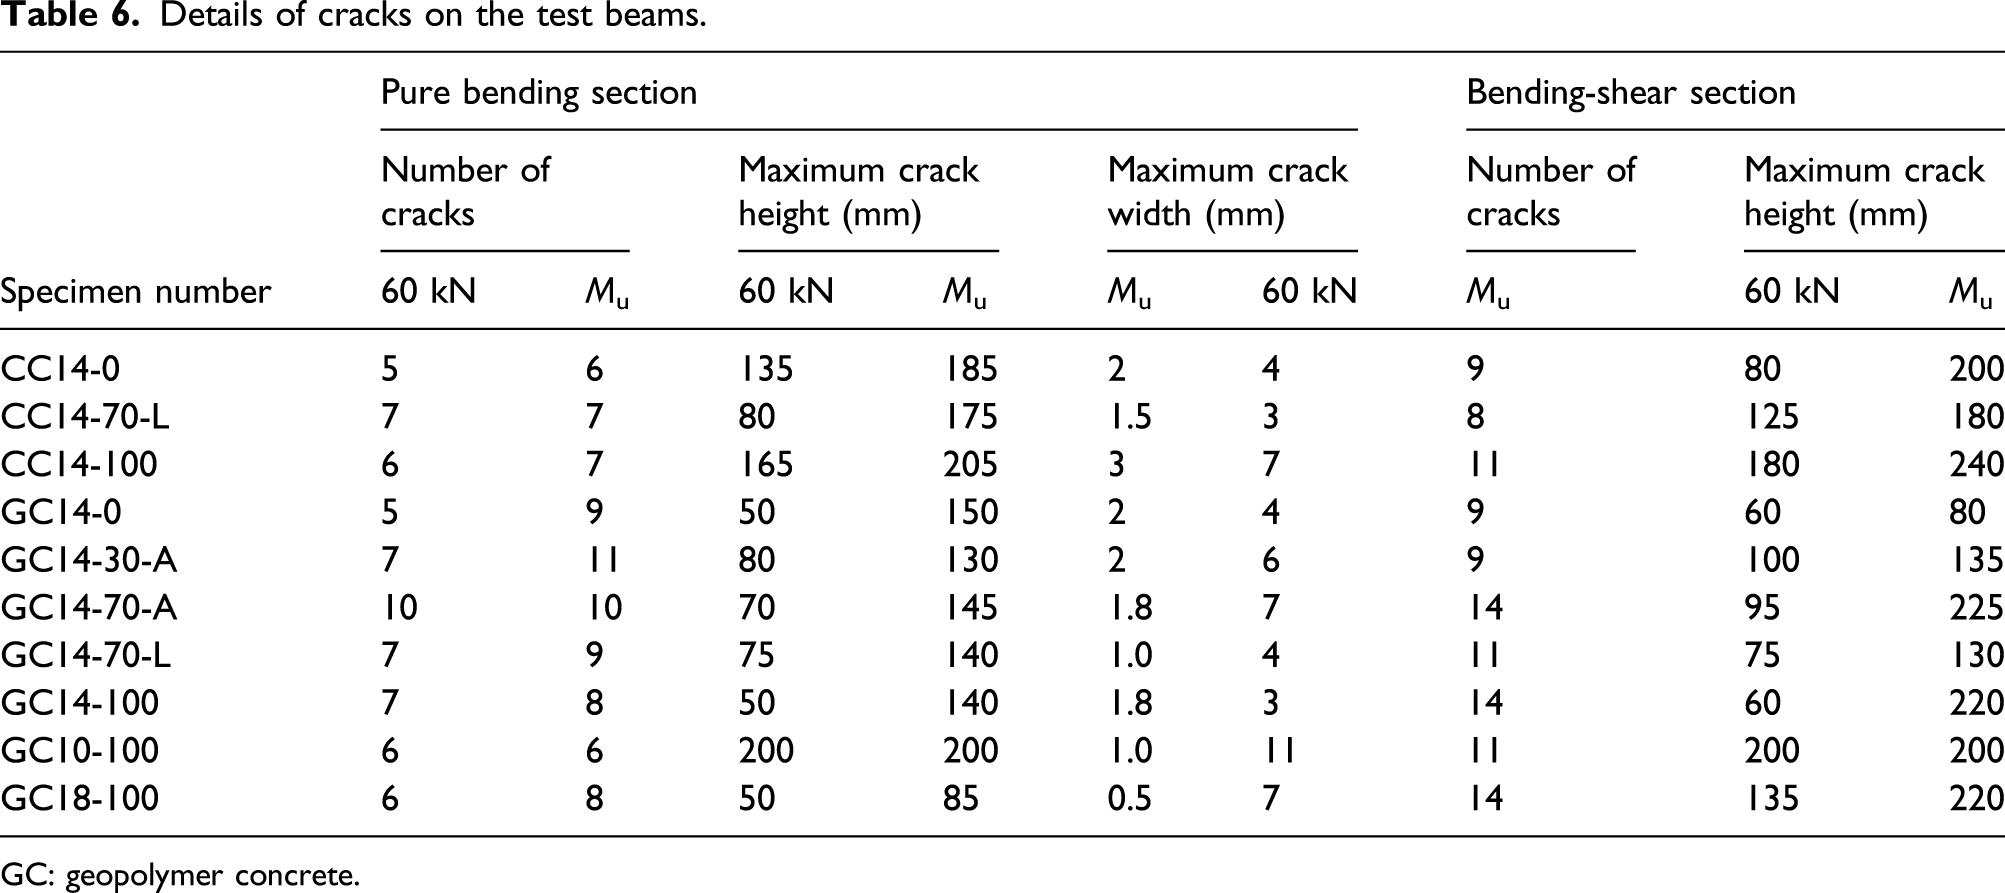
GC: geopolymer concrete.

Crack patterns in typical OPC concrete and GC beams. OPC: ordinary Portland cement; GC: geopolymer concrete.

Crack patterns in geopolymer recycled aggregate concrete beams with different replacement ratios and replacement patterns.
Failure modes of ordinary Portland cement concrete beams.
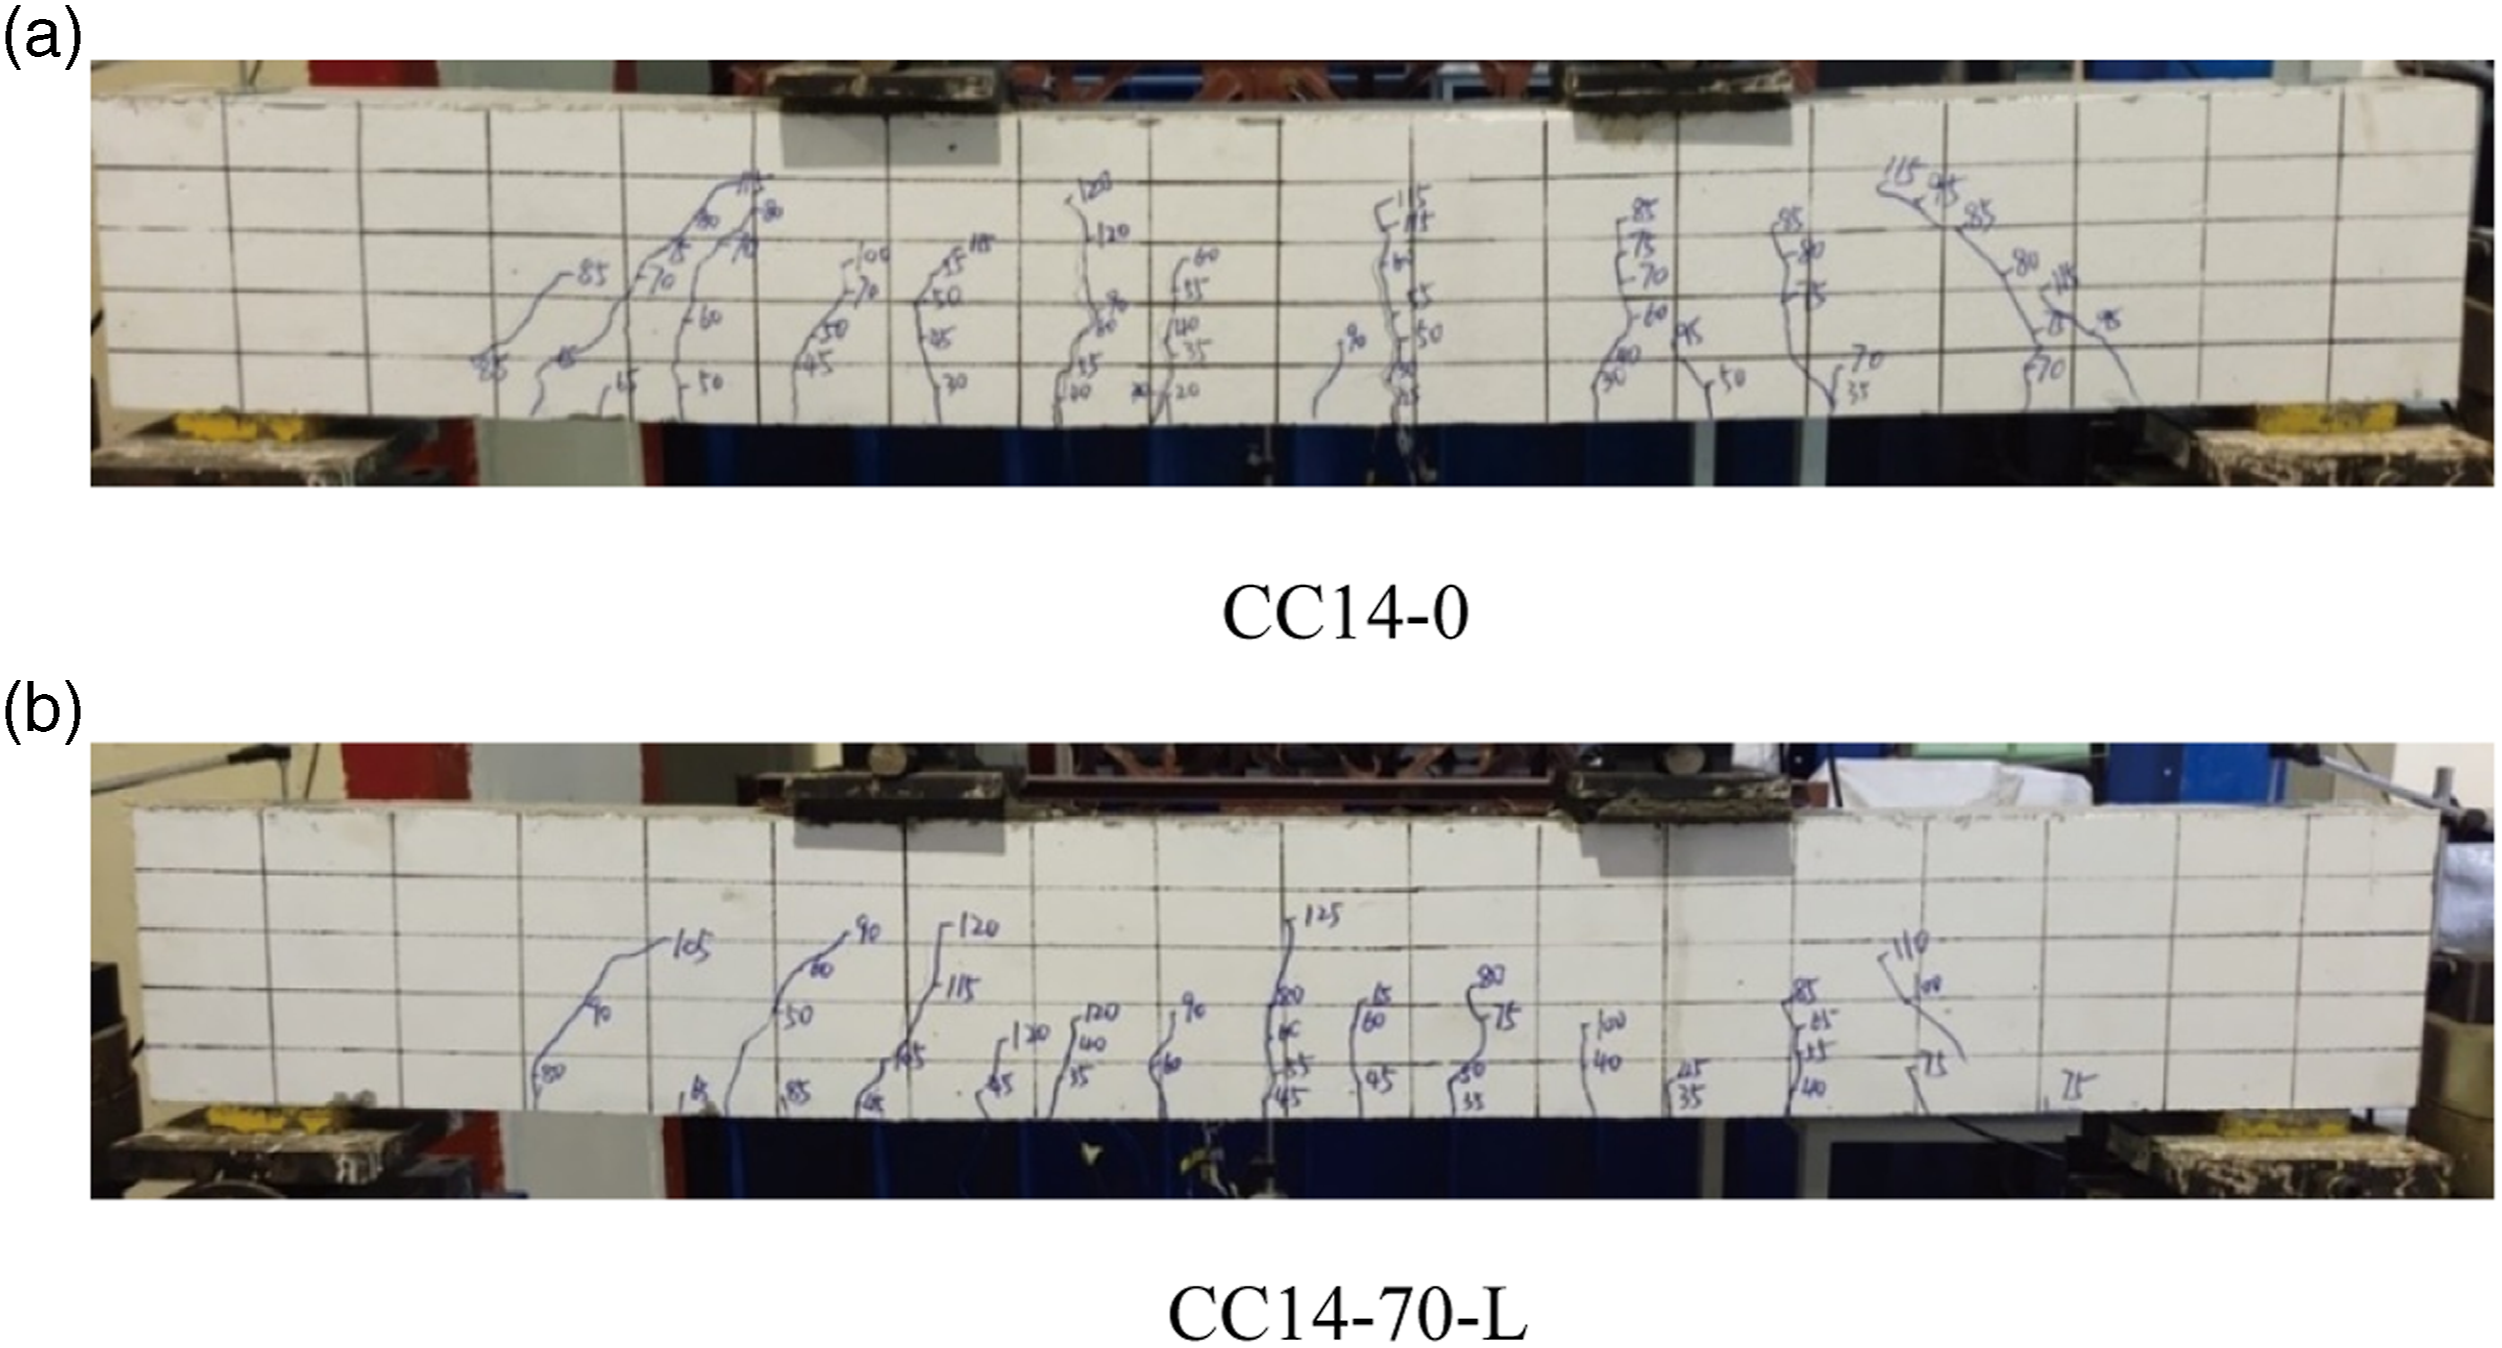
Comparing the crack patterns of the GC and OPC concrete beams under the same load, finer and shorter cracks were seen on the GC beams. Figures 5(a) and (b) show the crack patterns in the pure bending sections of beams CC14-0 and GC14-0 (with 100% NA) respectively at a load level of 60 kN. The maximum crack width in beam GC14-0 was only about 0.1 mm, but that on beam CC14-0 reached about 0.3 mm. In addition, the crack height of beam GC14-0 (about 50 mm) is much smaller than that in beam CC14-0 (about 135 mm). Similar trends were also observed in beams GC14-100 and CC14-100 with a 100% RA replacement ratio, as shown in Figure 5(c) and (d). The height of the cracks from the beam bottom is related to the height of the neutral axis, so it can be inferred that the height of neutral axis in beam GC14-0 was lower than that in beam CC14-0 under same load. This will be further verified by the strain data measured along the beam’s height, as illustrated below.
From Table 6, the OPC concrete beams with 100% RA developed wider and longer cracks at denser spacings than the beam without RA. This trend is in line with others’ studies (Maruyama et al., 2004; Seara-Paz et al. (2018a), (2018b)). However, the replacement ratio of RA had no significant effect on the crack development or the failure mode of the GRAC beams. Apart from beam GC14-70-L, the cracking load of all the GRAC beams was within the range of 14–17 kN. Figure 6(a)–(d) depict the crack patterns at failure of the GRAC beams, with different replacement ratios of RA (0%, 30%, 70%, and 100%). It shows that although the number, maximum width and length of the cracks in the bending-shear segment increases with an increase in the replacement ratio, the number, average spacing, maximum width and maximum length of the cracks in the pure bending section are similar at all of the replacement ratios tested.
Figure 6(e) presents the crack pattern of beam GC14-70-L, which had the same replacement ratio (70%) as beam GC14-70-A in Figure 6(c), but a different replacement pattern. In beam GC14-70-L, with large-size replacement pattern, the first noticeable flexural crack occurred at a load of 21 kN, which was higher than the cracking load of beam GC14-70-A (17 kN) with all-size replacement pattern. Comparing Figure 6(c) and (e), it can be seen that the number and length of cracks in the bending-shear section of beam GC14-70-L are much smaller than that of beam GC14-70-A. From Table 6, the maximum crack width of beam GC14-70-L near failure was also smaller than that of GC14-70-A. Therefore, compared to a GRAC beam using all-size replacement pattern, a beam using large-size replacement shows better crack resistance performance. A similar trend was also seen in the RAC beams. Figure 7 presents beams CC14-0 and CC14-70-L near failure. It can be seen that the average crack length in the pure bending section of beam CC14-70-L (with a replacement ratio of 70%) is shorter than that of beam CC14-0 (without RA), and the number and length of cracks in the bending-shear section in beam CC14-70-L are also smaller.
The reinforcement ratio of longitudinal tensile rebars has a significant influence on the crack patterns and failure modes of the reinforced GC beams. Figure 8 demonstrates the failure modes of GRAC beams GC10-100 and GC18-100. Figure 6(d) presents the failure mode of beam GC14-100. The three beams had same RA replacement ratio (100%) but different reinforcement ratios (0.6%, 1.2%, and 2.1%). From Figure 8(a) and Table 6, it can be clearly seen that the maximum height of the cracks in the pure bending section of beam GC10-100 near failure (65 kN) is about 200 mm, which is much higher than that in beams GC14-100 and GC18-100 at failure (about 140 mm and 85 mm, respectively). In addition, the extent of concrete crushing in the top compression zone and the extent of cracking in the bending-shear section at beam failure increase with an increase in the reinforcement ratio. Beam GC10-100 failed in a typical flexural failure as an ordinary under-reinforced beam, with significant deflection developed prior to the crushing of the concrete in the compression zone. The failure of beam GC18-100 was, however, somewhat similar as a balanced failure. There was no remarkable deformation (ductility) prior to the sudden occurrence of concrete crushing. The strain data from the two tensile longitudinal reinforcements in beam GC18-100 show that the tensile strain in the rebars reached the yield strain (about 2300 με) at about 140 kN, which occurred just prior to the crushing of concrete in the compression zone (at 150 kN) with a little increase in the displacement (3.7 mm). Failure modes of geopolymer concrete specimens with different reinforcement ratios.
Strain analysis
Five strain gauges were fixed at the mid-span on one side of each concrete beam, at different sectional heights (1, 9, 14, 19, and 24 cm from the bottom), to monitor the evolution of the strain during loading. Figures 9(a) and (b) respectively show the sectional strain distributions of OPC beam CC14-0 and GC beam GC14-0 at several typical loading steps. It can be seen that the neutral axis shifted upward as the applied load increased, but the shift distance of the neutral axis in beam CC14-0 was more significant than that in beam GC14-0. Also, the height of neutral axis from the beam soffit in beam CC14-0 was much higher than that in beam GC14-0 at the same load level. This is consistent with the visual observation that the cracks extending from the soffit in the pure bending section in beam CC14-0 were much higher than those in beam GC14-0. The lower height of the neutral axis (i.e., greater compression zone depth) in beam GC14-0 was mainly due to the lower elastic modulus and compressive strength of GC as compared to OPC concrete. That will be further discussed in the following section. From Figure 9(b), it is also clear that the plane section assumption was valid for the GC beam. Strain distribution in OPC concrete and GC beams at different load levels. OPC: ordinary Portland cement; GC: geopolymer concrete.
Figure 10 presents the sectional strain distributions of GRAC beams with different reinforcement ratios (0.6%, 1.2%, and 2.1%) during loading. In beam GC10-100 there was an upward shift of the neutral axis with an increasing load, but the upward shifts in beams GC14–100 and GC18-100 were not remarkable. Comparing the height of the neutral axis in the three beams at the same load level, beam GC10-100 with the lowest reinforcement ratio had the highest neutral axis, while beam GC18-100 had the lowest neutral axis, as well as the lowest (average) tensile strain and the highest compressive strain in the concrete. Therefore, the crushing of concrete at the compression zone of beam GC18-100 was more severe than that of other beams. Strain distributions in geopolymer recycled aggregate concrete beams with different reinforcement ratios.
Cracking load and ultimate load
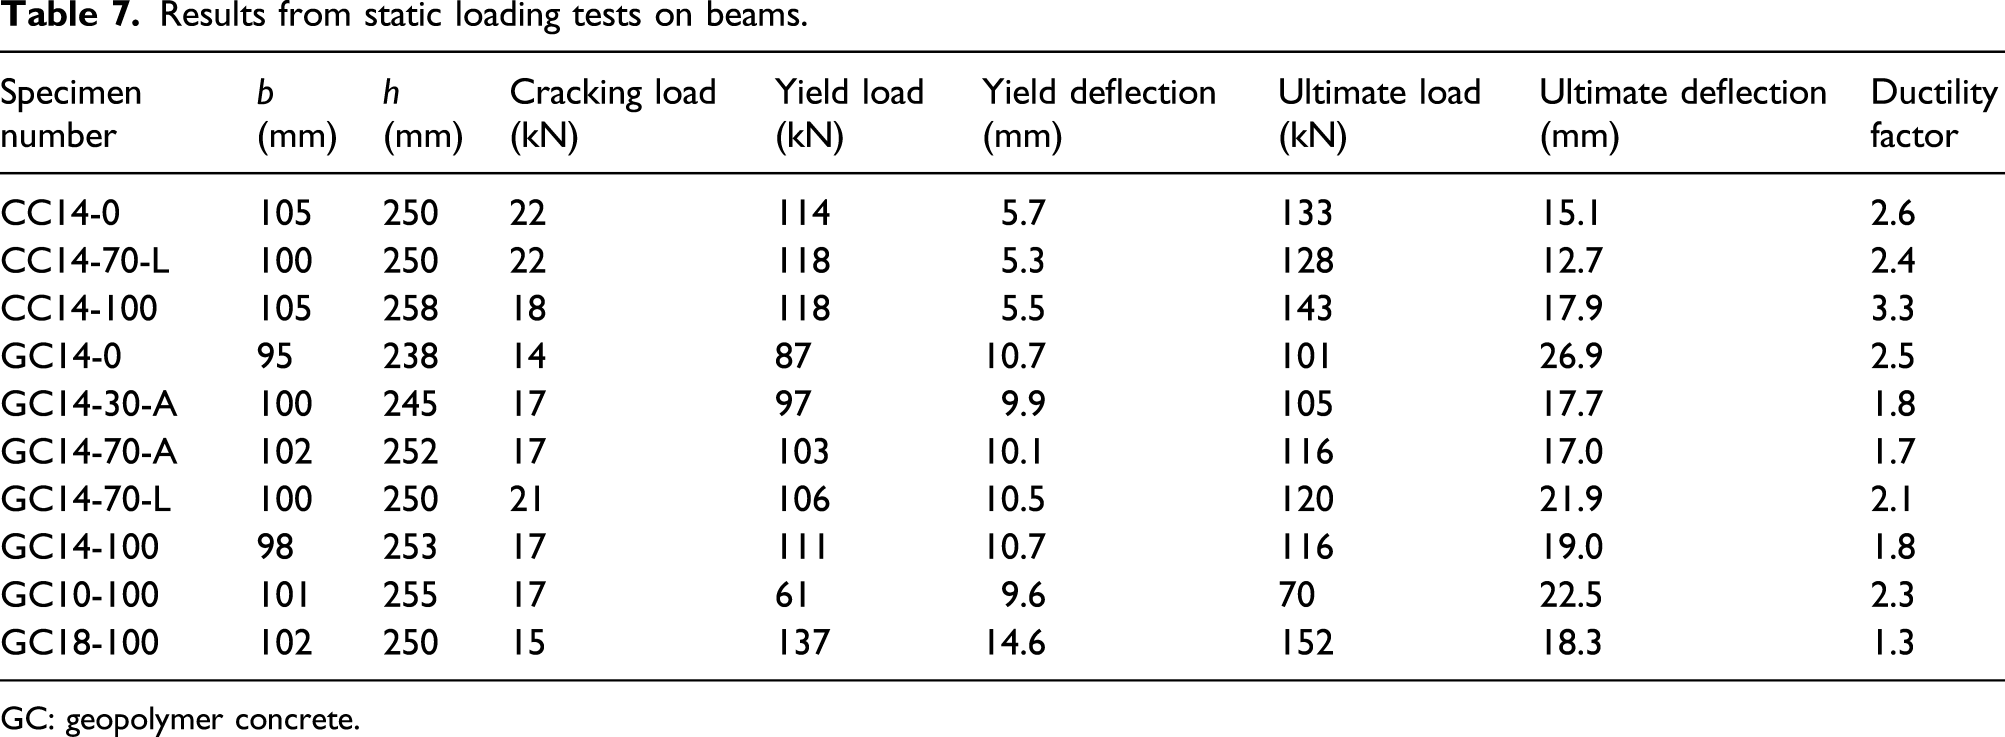
Results from static loading tests on beams.
GC: geopolymer concrete.
From Table 7, RA replacement ratio has no significant effect on the ultimate load of OPC concrete beams (the maximum difference is about 10%), but has effect on the cracking load. The cracking load of beam CC14-100 with 100% replacement ratio was almost 20% lower than that of the beam without RA. Due to the manufacturing error, the width and height of beam GC14-0 were only 95% of the design sizes, resulting in its sectional area 10% lower than other beams. Therefore, the cracking load and ultimate load of beam GC14-0 without RA were lower than that of other beams with higher replacement ratios. Apart from beams GC14-0 and GC14-70-L, there was little difference among the GRAC beams with different replacement ratios in terms of cracking load or ultimate load (flexural capacity).
The cracking load of beam GC14-70-L, in which the larger NA fractions were replaced by RA, was higher than that of other GRAC beams, although the compressive strength of concrete in this beam was not the highest among the GRAC beams. Similarly, OPC-RAC beam CC14-70-L had a lower concrete compressive strength than beam CC14-0, but had the same cracking load with beam CC14-0. Combining the visual observations on crack patterns and the crack data in Table 6, it can be inferred that replacing the larger fractions of NA with RA improves the crack resistance of RAC beams. In addition, substituting RA for the larger NA fractions slightly improved the ultimate load (flexural capacity) of GRAC beams.
From Table 5, the compressive strength of GRAC was lower than that of RAC. Therefore, the cracking load of the GRAC beams, which was highly related to concrete strength, was lower than that of RAC beams. The beam’s flexural capacity mainly depends on the tensile strength and area of reinforcement and the location of the neutral axis. Due to the lower height of the neutral axis in the GRAC beams and the resulting shorter internal lever arm of the tension force provided by the reinforcement, the ultimate loads of GRAC beams were lower than those of RAC beams with the same reinforcement ratio.
Reinforcement ratio has no significant effect on the cracking load of GRAC beams, but has great influence on the bearing capacity. The ultimate load of the GRAC beams increased with the reinforcement ratio, similar as that of OPC concrete beams.
Cracking moment and ultimate moment


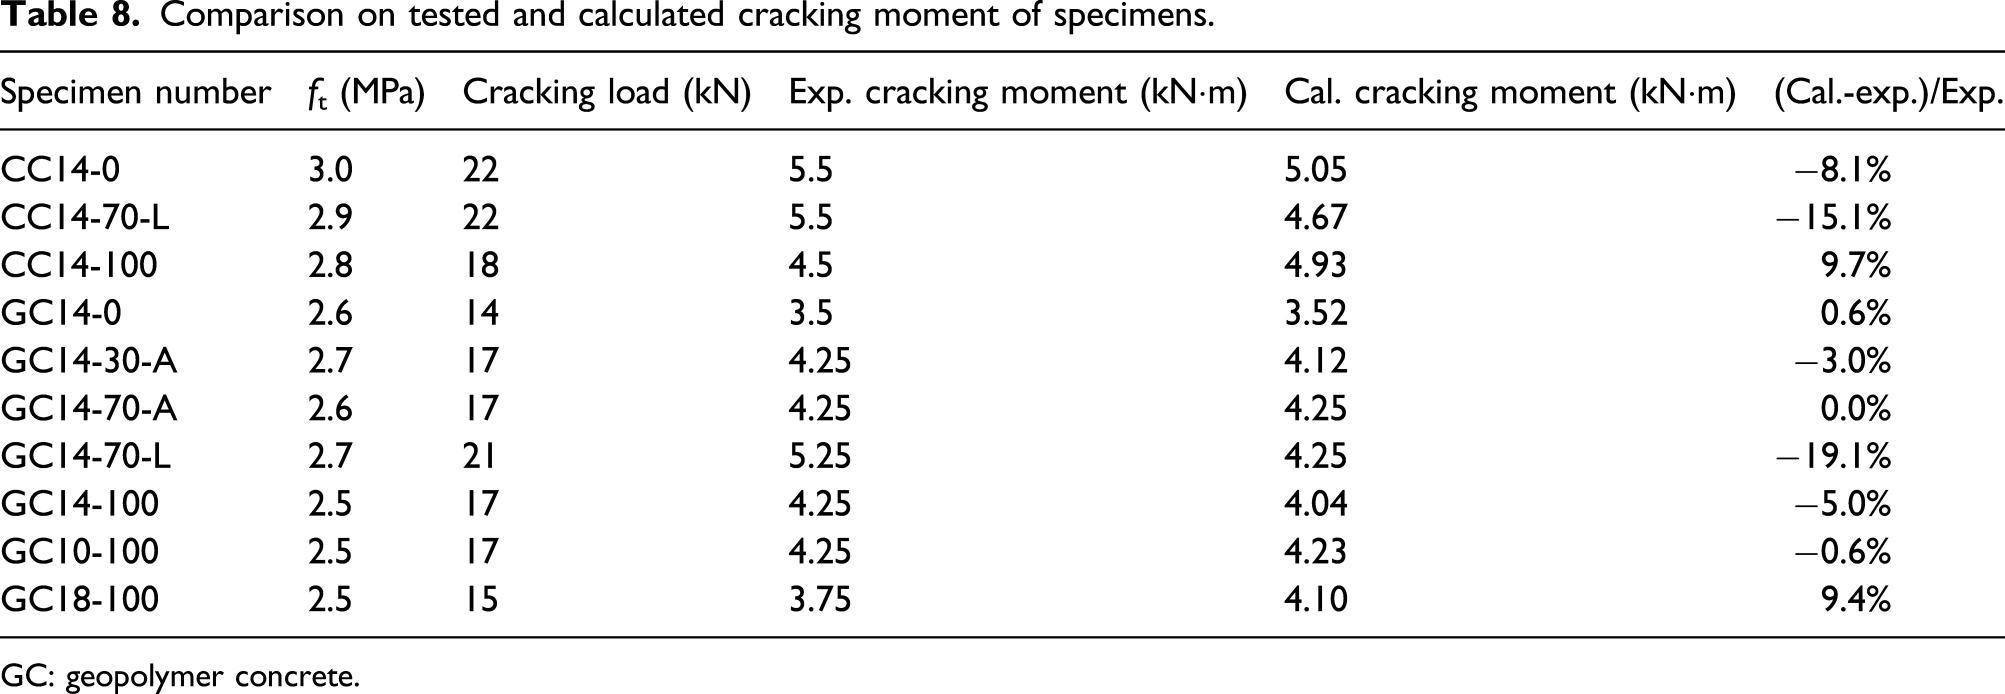
Comparison on tested and calculated cracking moment of specimens.
GC: geopolymer concrete.
From Table 8, the relative error between the calculated and experimental cracking moment of GRAC beams and RAC concrete beams was within ±10%, apart from beams CC14-70-L and GC14-70-L. This implies that the method for determining the cracking moment of OPC concrete beams was basically suitable for that of GRAC beams.
For beams CC14-70-L and GC14-70-L, with the large-size replacement pattern, the experimental cracking moment was 15%∼19% higher than the calculated cracking moment. This further shows that the use of large-size replacement pattern is conducive to improve the crack resistance of EAC beams.
Comparison on the tested and calculated bending moment capacities of beams.
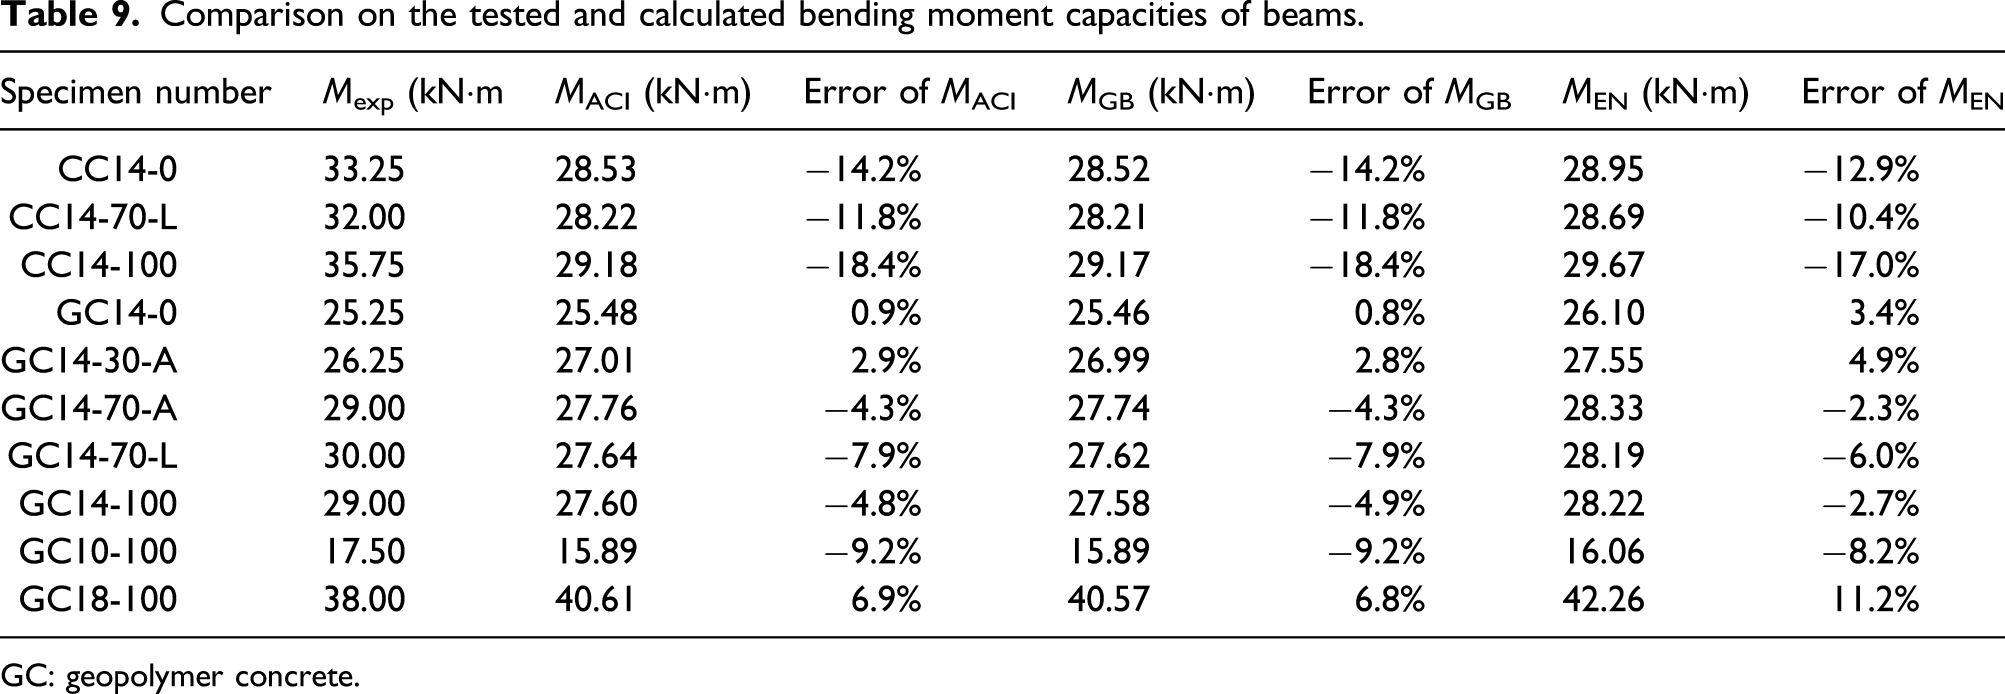
GC: geopolymer concrete.
As Table 9 shows, the methods of ACI 318-11, GB50010-2010, or BS EN 1992-1-1:2004 codes, intended for predicting the flexural capacity of OPC concrete beams, are also applicable to predicting the flexural capacity of GRAC beams. The calculated results using the methods in the three codes agreed well with the experimental values of all the tested beams. Among the three methods, the methods proposed in ACI 318-11 or GB50010-2010 codes give similar results for the flexural capacity of OPC and GRAC beams, which are slightly more conservative than the method proposed in BS EN 1992-1-1 2004, (2004) code.
Comparing the calculation errors in the RAC beams and GRAC beams, the calculated values generally underestimated the flexural capacity of RAC beams, but sometimes slightly overestimated the flexural capacity of GRAC beams. Therefore, when the bending moment capacity formulas proposed by ACI 318-11, GB50010-2010, or BS EN 1992-1-1:2004 codes are used to predict the bending moment capacity of a GRAC beam, the safety margin is slightly less than if it was an RAC beam. To ensure a comparable safety margin, a reduction factor is suggested to applying on the formulas for predicting the bending capacity of GRAC beams. However, the determination of the reduction factor needs more experimental data.
Loading-deflection curves and ductility factor
Mid-span deflection in each beam was monitored at each loading step using electrical displacement transducers. Those data are presented in Figure 11 as the load-deflection curves. On these curves, the turning points, corresponding to the yielding of the longitudinal tensile rebars, were clearly seen. Prior to the yield point, the deflection of the beam increases with the load at a slow rate. But beyond this point, the deflection increases rapidly with a slight increase or even a decrease in the load. Since the force-controlled mechanism was adopted during the loading tests, the data on the descending sections of these curves were not collected completely. Load-deflection curves of tested beams.
Figure 11(a) plots the load-deflection curves of three RAC beams and GRAC beam GC14-100. It can be seen that the three curves of RAC beams with different replacement ratios were very close, implying that the replacement ratio has almost no significant effect on the stiffness, strength, and ductility of RAC beams. Comparing the deflections of beams CC14-100 and GC14-100 under the same load level, the mid-span deflection of beam GC14-100 is clearly greater, due to the lower elastic modulus of GC. In addition, the load-deflection curves of RAC concrete beams had a notable turning after concrete cracked, but beam GC14-100 has no significant degradation in stiffness prior to the yielding of reinforcement. This is because that the cracking of GRAC beam was not severe before it yielded.
Figure 11(b) compares the load-deflection curves of GRAC beams with different replacement ratios. The load-deflection curves of these beams containing RA (GC14-30-A, GC14-70-A, GC14-70-L, and GC14-100) were similar, but the GC beam without RA (GC14-0) exhibited a lower stiffness and yielded at a lower load than the beams containing RA. This was due to the smaller sectional dimensions in beam GC14-0. Beams GC14-70-A and GC14-70-L had the same replacement ratio (70%) of RA but different replacement patterns. The load-deflection curves of the two beams basically coincides at the early stages of loading, but the deflection ductility of the GRAC beam with the large-size replacement pattern (GC14-70-L) was better than that of the beam using all-size replacement (GC14-70-A).
Figure 11(c) illustrates the load-deflection curves of GRAC beams with different reinforcement ratios. The ductility of the beams clearly decreases with increasing reinforcement ratio, as would be expected. Beam GC10-100 had the minimum reinforcement ratio and thus lowest bending capacity among the three beams, but it exhibited the best ductility. Beam GC18-100 has the highest peak load but the lowest ductility. When the applied load approached the ultimate load, sudden crushing of concrete in the compression zone occurred in beam GC18-100, accompanied by a great decrease in the load and a sharp increase in the mid-span deflection. This resulted in a steep descending segment in its load-deflection curve. The peak load and ductility of beam GC14-100 were intermediate between those of beams GC10-100 and GC18-100.
The ductility factor, used to quantify the ductility of beams, is defined as the ratio between the ultimate displacement (or curvature) at 85% of the maximum load on the post-peak portion of the load–displacement curve and the displacement (or curvature) at first yield of the beam (Cohn and Bartlett, 1982; Lopes et al., 2012). The load-deflection curves in Figure 11 (excluding the descending section) were simplified into two broken lines, based on the principle of equal area under the curves before and after the simplification. The displacement and load corresponding to the turning point on the bilinear curve is defined as the yield deflection and yield load respectively. Due to the lack of the descending section in the curves of partial beams, the ultimate load and displacement are respectively represented by the peak load and deflection on the curve. The yield load, yield deflection, ultimate deflection and ductility factor were listed in Table 7.
It should be noted that the yield load in Table 7 was the load corresponding to the turning point on the simplified bilinear load-deflection curve, which was slightly different from the measured load at the yield of tensile reinforcement, but their difference was less than 5%. Due to the incomplete displacement data after the beam reached the peak load, the ductility factor herein was not very accurate, but it was only used to compare the relative ductility of different beams.
It can be seen from Table 7 that the ductility factor of GRAC beams was significantly lower than that of RAC beams. With an increase in the RA replacement ratio, the ductility of GRAC and RAC beams basically decreased, apart from beams CC14-100 and GC14-70-L. For under-reinforced GRAC beams, the ductility decreased with the increasing reinforcement ratio.
Discussion
The development of deflection in a loaded beam highly depends on its stiffness, which is in turn related to the elastic modulus of concrete and reinforcement. Due to the lower elastic modulus of GRAC, GRAC beams experienced greater deflection than its counterpart RAC beams at the same load level. Assuming that the normal service load is about 60% of the bearing capacity, the mid-span deflection of GRAC beams at the service load would be in the 5–8 mm range, as shown in Figure 11, which is within the permissible limit of 1/200 of the span length recommended by GB50010-2010 code (8 mm), but beyond the limit of 1/240 of the span length proposed by ACI 318-11 code (6.7 mm) and the limit of 1/250 of the span length proposed by BS EN 1992-1-1:2004 code (6.4 mm). It is reported that the elastic modulus of GC is greatly affected by the Si/Al ratio in geopolymer composition, which can be adjusted by using different concentrations of the alkali activator solutions (Duxson et al., 2005). Therefore, the formulation of GC in the current study can probably be further optimized in future research to improve the concrete’s elastic modulus.
The elastic modulus of concrete also influences the height of the neutral axis (the compression zone depth) of an RC beam. When the concrete is in elastic state and the steel has not reached its yield point (i e., RC beam is under normal service conditions), the relative compression zone depth Strain and stress distributions across a reinforced rectangular section.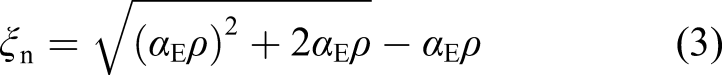
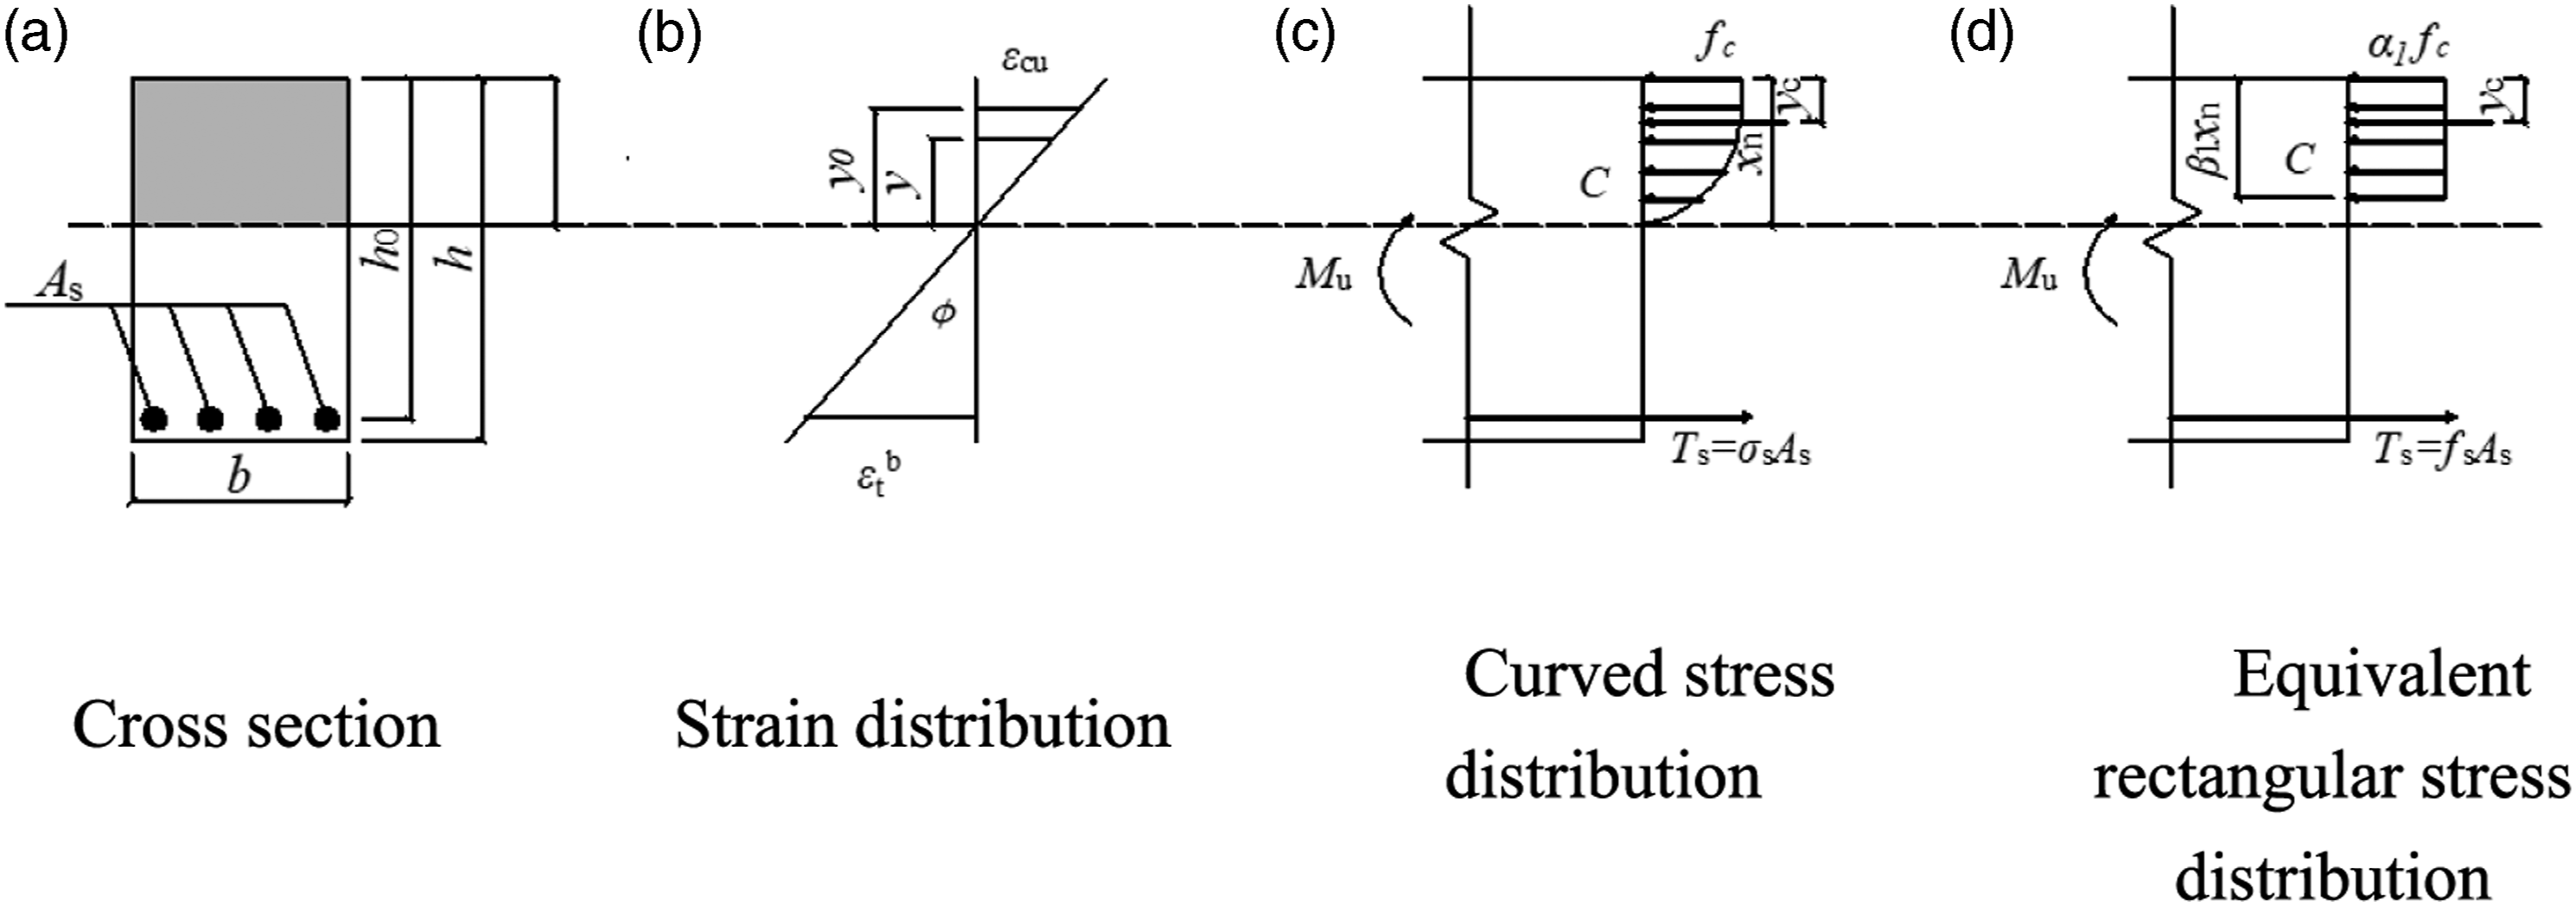
When the reinforcement has reached its yield point and the strain in the outer compression fiber in the concrete reaches its ultimate strain, the relative compression zone depth can be calculated using equation (4), based on the force equilibrium in the section (Gu et al., 2015; Nilson et al., 1997).
Yuan (2017) has reported the compressive strain corresponding to the peak stress (ε0) of metakaolin-fly ashbased GC to be 0.0028. The ultimate compression strain (εcu) measured in this study was 0.0048 (see Figure 10(c)). The ε0 to εcu ratio of GC (ε0/εcu = 0.0028/0.0048) is therefore close to that of OPC concrete (0.002/0.0033) (Gu et al., 2015). So the relative compression zone depth at beam failure is mainly dependent on the strength ratio of the reinforcement and concrete 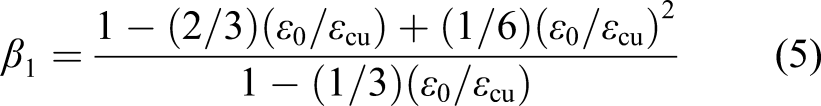
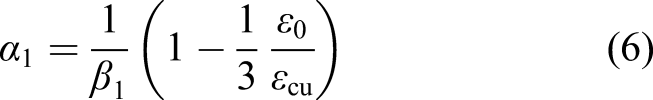
Equation (7) is the formula for calculating the maximum reinforcement ratio of an under-reinforced beam (Gu et al., 2015). Substituting the true strengths of the GC and the steel rebars in beam GC18–100 for fc (fc = 0.67fcu = 24.45 MPa) and fy and substituting 0.0028, 0.0048, and 0.0023 for 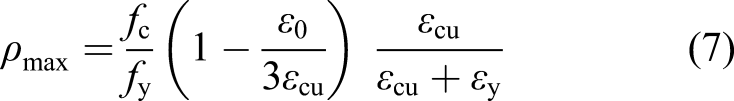
It should be noted that the values of
The replacement pattern of RA has a certain effect on the mechanical properties of GRAC and flexural behavior of GRAC beams. Table 5 shows that with the same RA replacement ratio, the compressive strength, and elastic modulus of GRAC using the large-size replacement pattern are higher than those using all-size replacement pattern. Similar experimental results have been reported previously. Bui et al. (2017) compared the mechanical properties of RAC when substituting RA for the larger NA fraction with those when using conventional combination of RA and NA. They found that the compressive strength, splitting tensile strength, and elastic modulus of RAC using the new replacement pattern were all higher than that when the conventional pattern was used, but Poisson’s ratio was lower. Li and Xiong (2017) has reported that small sizes of RA particles have a higher crush index and greater water absorption than large sizes of RA, and thus RAC using smaller RA particles to replace NA exhibits lower strength and elastic modulus than that when larger sizes of RA are used at the same replacement ratio.
Higher concrete strength leads to a higher cracking load of beams. As shown in Table 7, beam GC14-70-L using the large-size replacement pattern exhibited much higher cracking load than beam GC14-70-A with same replacement ratio but all-size replacement pattern. Table 6 also shows that the amount and length of cracks in GRAC and RAC beams using the large-size replacement pattern were smaller than those beams with all-size replacement pattern. The better crack resistance exhibited by GRAC using the large-size replacement pattern can be attributed to the lower waste mortar content in GRAC and more uniform stress distribution under load. Recycled aggregates with smaller particle sizes usually have a higher content of waste mortar adhering than that of the same mass of RAs in larger sizes (Akhtar and Sarmah, 2018). This leads to the weaker properties of small-sized RAs. In addition, a large-sized RA particle is a combination of the coarse aggregate and adhered waste mortar. Therefore, the size of the coarse aggregate in an RA particle is smaller than that of the RA. When replacing large-sized NA with large-sized RA, the maximum and average sizes of coarse aggregates in RAC decrease. For example, in beam GC14-70-L, the NAs in the 9.5–20 mm size range were completely replaced by RA; thus, the maximum size of coarse aggregates in beam GC14-70-L was less than 20 mm, and the average size also decreased. In beam GC14-70-A, however, only 70% of the large-sized NA was replaced, so the maximum size of coarse aggregates in beam GC14-70-A (20 mm) was larger than that in beam GC14-70-L, and the particle size range was greater too (the minimum aggregate size in beam GC14-70-A was less than 4.75 mm). There was presumably nonuniform deformation and stress concentration in the interface transition zone between the aggregate and the mortar, due to the significant difference in the elastic modulus between coarse aggregate and mortar matrix. This makes the interface transition zone easy to crack (Li et al., 2012). The larger aggregate pieces and a wider aggregate size range in concrete would inhibit the load from distributing uniformly since they lead to more heterogeneity in the concrete matrix (Ghorbani et al., 2019). Therefore, GRAC and RAC beams using the large-size replacement pattern have a more uniform stress distribution, giving them better crack resistance.
Conclusions
Static load tests were conducted on seven GRAC beams and three ordinary RAC beams. The effect of the replacement ratio of recycled aggregate (RA), the replacement pattern, and reinforcement ratio on GRAC beams was evaluated. The measured cracking loads and bending capacities of the beams were compared with the values predicted using the proposed methods in the design codes for ordinary concrete structures. The data generated suggest the following conclusions. GC prepared in this study exhibits lower elastic modulus than ordinary concrete with similar compressive strength, which resulted in lower height of neutral axis, shorter crack length, and greater deflection developed in GC beams than that in ordinary concrete beams under the same load level. The replacement ratio of RA has no significant effect on the cracking pattern, failure mode, or bending capacity of GRAC beams. Under a given replacement ratio, using RAs to replace only the larger fraction of NA has a positive effect on the concrete strength and crack resistance of both RAC and GRAC beams, compared to that using same replacement percentage for all fractions. The prediction formulas for the bending capacity of ordinary reinforced concrete beams in GB50010–2010, ACI 318–11, or BS EN 1992-1–1:2004 codes are applicable for predicting the bending capacity of reinforced GRAC beams, but the safety margin is generally lower than that of ordinary reinforced concrete beams.
It should be noted that the elastic modulus of GC prepared in this study is only 35–40% of that of the reference OPC concrete due to the high alkali content used in the activator solution. In the authors’ recent study, the alkali content in the activator solution was lowered through increasing the modulus and reducing the mass concentration of the solution. The compressive strength of the GC prepared using the optimized formulation was 62.1 MPa, and its elastic modulus reaches 29.7 GPa, which was 83% of that of the OPC concrete with similar strength. The new GC can meet higher engineering requirements than the GC prepared in this study.
Footnotes
Declaration of conflicting interests
The author(s) declared no potential conflicts of interest with respect to the research, authorship, and/or publication of this article.
Funding
The author(s) disclosed receipt of the following financial support for the research, authorship, and/or publication of this article: This research was supported by the Key-Area Research and Development Program of Guangdong Province (No. 2019B111107003) and Guangzhou Science and Technology Planning Project (Grant No. 201804010438). Any opinions, findings, and conclusions or recommendations expressed in this report are those of the authors and do not necessarily reflect the views of the sponsors..