
Abstract
The failure mechanism of the mega–sub isolation system under near-fault ground motions is studied in this article. 90 suites of near-fault ground motions collected from 23 earthquakes are adopted to investigate the ground motion intensity indices applicable for the mega–sub isolation system. Then, the sensitivities of the stochastic responses to the structural parameters are analyzed to determine the representative random structural parameters. Furthermore, considering the uncertainties of ground motion characteristics and structural parameters, the seismic fragility is analyzed by the response surface method in order to obtain the failure mechanism of this system under near-fault ground motions. Results show that different intensity indices have various correlation coefficients with the peak responses of the mega–sub isolation system. The correlations of acceleration-related intensity indices are the worst, whereas the correlations of displacement-related intensity indices show high linearity. The sensitivities of the structural responses are weaker to the sub-structure story stiffness but more sensitive to the sub-structure story mass and the stiffness and damping ratio of the isolation layer. The failure probability of the sub-structure is higher than that of the mega-structure under near-fault ground motion. While in the collapse state, the failure probability of the isolation layer is greater than that of the sub-structure.
Keywords
Introduction
As the urban population increases, more and more high-rise buildings have been built in recent years, which is exemplified by recent constructions of many high-rise buildings in Chicago, Tokyo, and Hong Kong. However, the safety of these buildings still constitute a technical challenge for architects and engineers when subjected to external forces such as wind loads or earthquake excitations. To ensure the safety of the structures under severe external loads, energy dissipation devices are often used to control the building vibration. Unfortunately, the structural characteristics common to most tall and super tall buildings, such as high shear rigidity and dominant bending deformation, tend to prevent the application of conventional damping devices.
Extensive studies have been conducted to improve the performance of the high-rise buildings under severe external loads. An innovative technology for controlling the response of high-rise buildings was first advanced by Feng and Mita (1995). This method takes advantage of the mega–sub structural system which is gaining popularity in design and construction of the high-rise building, typical examples include the Bank of China Building in Hong Kong and the Tokyo Metropolitan Government Building in Japan. A mega–sub structural system consists of two major components: a mega-structure as the main structural frame and several sub-structures for residential and/or commercial usage. In traditional design, the sub-structures are fixedly connected with the mega-structures. Feng and Mita (1995) are the first to propose flexible sub-structures such that the sub-structures can be used as dampers to suppress the vibration of the entire building. The wind response of this new mega–sub structural system named as mega–sub-controlled structure (MSCS) was investigated by Feng and Mita (1995) under the assumption that the wind load was a white noise and the building was modeled as a shear structure. Their results showed that the sub-structures of this structural configuration have a large tuned mass damper (TMD) function. Later, Chai and Feng (1997) improved this analytical model; the mega-structure of a mega–sub building is modeled as a cantilever beam to retain the dominant bending mode characteristics of high-rise buildings and the sub-structure as a shear building to retain its shear mode. The improved analytical model is employed to design passive and hybrid MSCS and to examine the performance of such controlled buildings, in which a non-white noise stochastic process was employed to compute the wind loads. On this basis, a series of studies on MSCS have been conducted. Feng and Chai (1997) developed a procedure for optimally designing dynamic parameters, including the stiffness and damping ratio of the sub-structures, of the MSCS under stochastic wind loads. The corresponding favorable building responses demonstrated that the MSCS was feasible for wind vibration suppression. Zhang et al. (2005) investigated the controlling effectiveness of MSCS with different mass ratio and stiffness ratio subjected to random wind loads. Results show that different controlling mechanisms exist with different stiffness ratios. Only when the stiffness ratio is less than a certain value, the controlling effectiveness can be obtained. While when the stiffness ratio is greater than this value, the controlling effectiveness is unacceptable. The influence of the position and number of the modulated sub-structures of MSCS to the structural responses were analyzed by Limazie et al. (2013). A new structural configuration, in which friction damped braces were incorporated in a sub-structure of the MSCS system, was put forward by Lian et al. (2007) based on the energy dissipation and structural control principles. In that work, the excellent dynamic properties and satisfactory control effectiveness have been presented. Later, a numerical verification of semi-active control using magnetorheological dampers for the MSCS under random wind loads was performed by Qin et al. (2008). The results indicate that the proposed structure employing semi-active control can offer an effective control mechanism. In order to eliminate pounding between the mega-structure and its sub-structures, Zhang et al. (2009) proposed an improved practical MSCS, in which additional columns were introduced at the top-level of some of the sub-structures, and dampers were installed between the mega-structure and its sub-structures.
As is well-known, the seismic isolation is a mature technology for protecting buildings against the effects of extreme earthquakes and has been widely used in the world. The most important idea in seismic isolation is to decouple structural responses from ground motions by including a relatively flexible layer between the foundation and the structure (Skinner et al., 1993). Based on the principle of isolation technology and the previous studies on MSCS, a mega–sub isolation system which is different from the conventional base-isolated structure or inter-story isolated structure was proposed by Li et al. (2016). In their work, the seismic mitigation mechanism of the mega–sub isolation system has been investigated by systematically studying its dynamic characteristics corresponding to various structural parameters, and the influence of the number and locations of isolated sub-structures on the control performance of mega–sub isolation system has also been studied. In order to verify the performance of the new mega–sub isolation system, three different scaled specimens were produced and tested on a shaking table under different load cases by Tan et al. (2017). Theoretical and experimental results show that this system can obviously reduce the structural responses under conventional earthquake excitations. However, the research on this mega–sub isolation system under near-fault earthquakes has not yet been conducted. Strong near-fault ground motions are characterized by a forward directivity effect, generating long-duration horizontal pulses, and high values of the ratio of the peak value of the vertical acceleration to the analogous value of the horizontal acceleration. Near-fault ground motions with velocity pulse exhibit a pulse in the velocity time history that mainly occurs in the strike-normal direction at locations toward which the earthquake rupture has propagated. The damage caused by such ground motions is due to the high displacement and velocity demands, along with the transmission of large amounts of energy in a relatively short time. To date, several studies have examined the effects of near-fault ground motions on the seismic responses of structural systems (Champion and Liel, 2012; Fiore et al., 2018; Mazza and Vulcano, 2012; Mollaioli et al., 2013) and investigated the effectiveness of seismic protection strategies in use (Hatzigeorgiou and Pnevmatikos, 2014; Mazza and Labernarda, 2017; Quaranta et al., 2016; Tzimas et al., 2016). Li et al. (2017) have studied the seismic response of a mega–sub isolation system subjected to near-fault ground motions with velocity pulse, revealing that seismic responses, especially the displacement of the isolation layer, of the mega–sub structure to ground motions with velocity pulse were greater than those to ground motions without velocity pulse. Therefore, it is necessary to investigate the failure modes of this structural system under near-fault ground motions. In previous studies, seismic fragility analysis was often used to analyze the failure mode of the structure. In the seismic fragility analysis, it is necessary to determine the reasonable ground motion intensity indices and to select the representative random structural parameters.
The object of this work is to obtain the failure modes of the mega–sub isolation system under near-fault ground motions by the seismic fragility analysis. An analysis model of the mega–sub isolation system is developed and the equation of motion is introduced in Analysis model of mega-sub isolation system. Then, in Ground motion intensity indices, 90 suites of near-fault ground motions from 23 earthquakes are adopted to investigate the ground motion intensity indices suitable for the mega–sub isolation system. The sensitivities of the stochastic responses of the mega–sub isolation system to the structural parameters are analyzed in Stochastic response sensitivity analysis of mega-sub isolation system in order to determine the representative random structural parameters. Considering the uncertainties of ground motion characteristics and structure parameters, seismic fragility analysis of the mega–sub isolation system based on the response surface method under near-fault ground motions is performed in Seismic fragility analysis, and Conclusions presents the summary and conclusions of the study.
Analysis model of mega–sub isolation system
In a mega–sub isolation system, sub-structures are connected with the mega-structure by isolation devices at the bottom of the sub-structures, which is usually referred to as the isolation layer. Theoretical analysis shows that this system can achieve good performances under seismic excitations. Isolation devices can reduce the earthquake responses of both the sub-structure and mega-structure effectively. In the theoretical analysis process, the mega-structure is simplified as a series of pointed models, in which each sub-structure is simplified as a lumped mass. The isolation layer is simulated using the Kelvin model. Figure 1 shows the simplified analysis model of the mega–sub isolation system. There is no sub-structure installed at the first floor of the mega-structure because the bottom story of sub-structure is supported on the ground, and its movement will not directly influence the structural responses. So the number of the sub-structure is one fewer than that of the mega-structure as shown in Figure 1. Analysis model of mega–sub isolation system.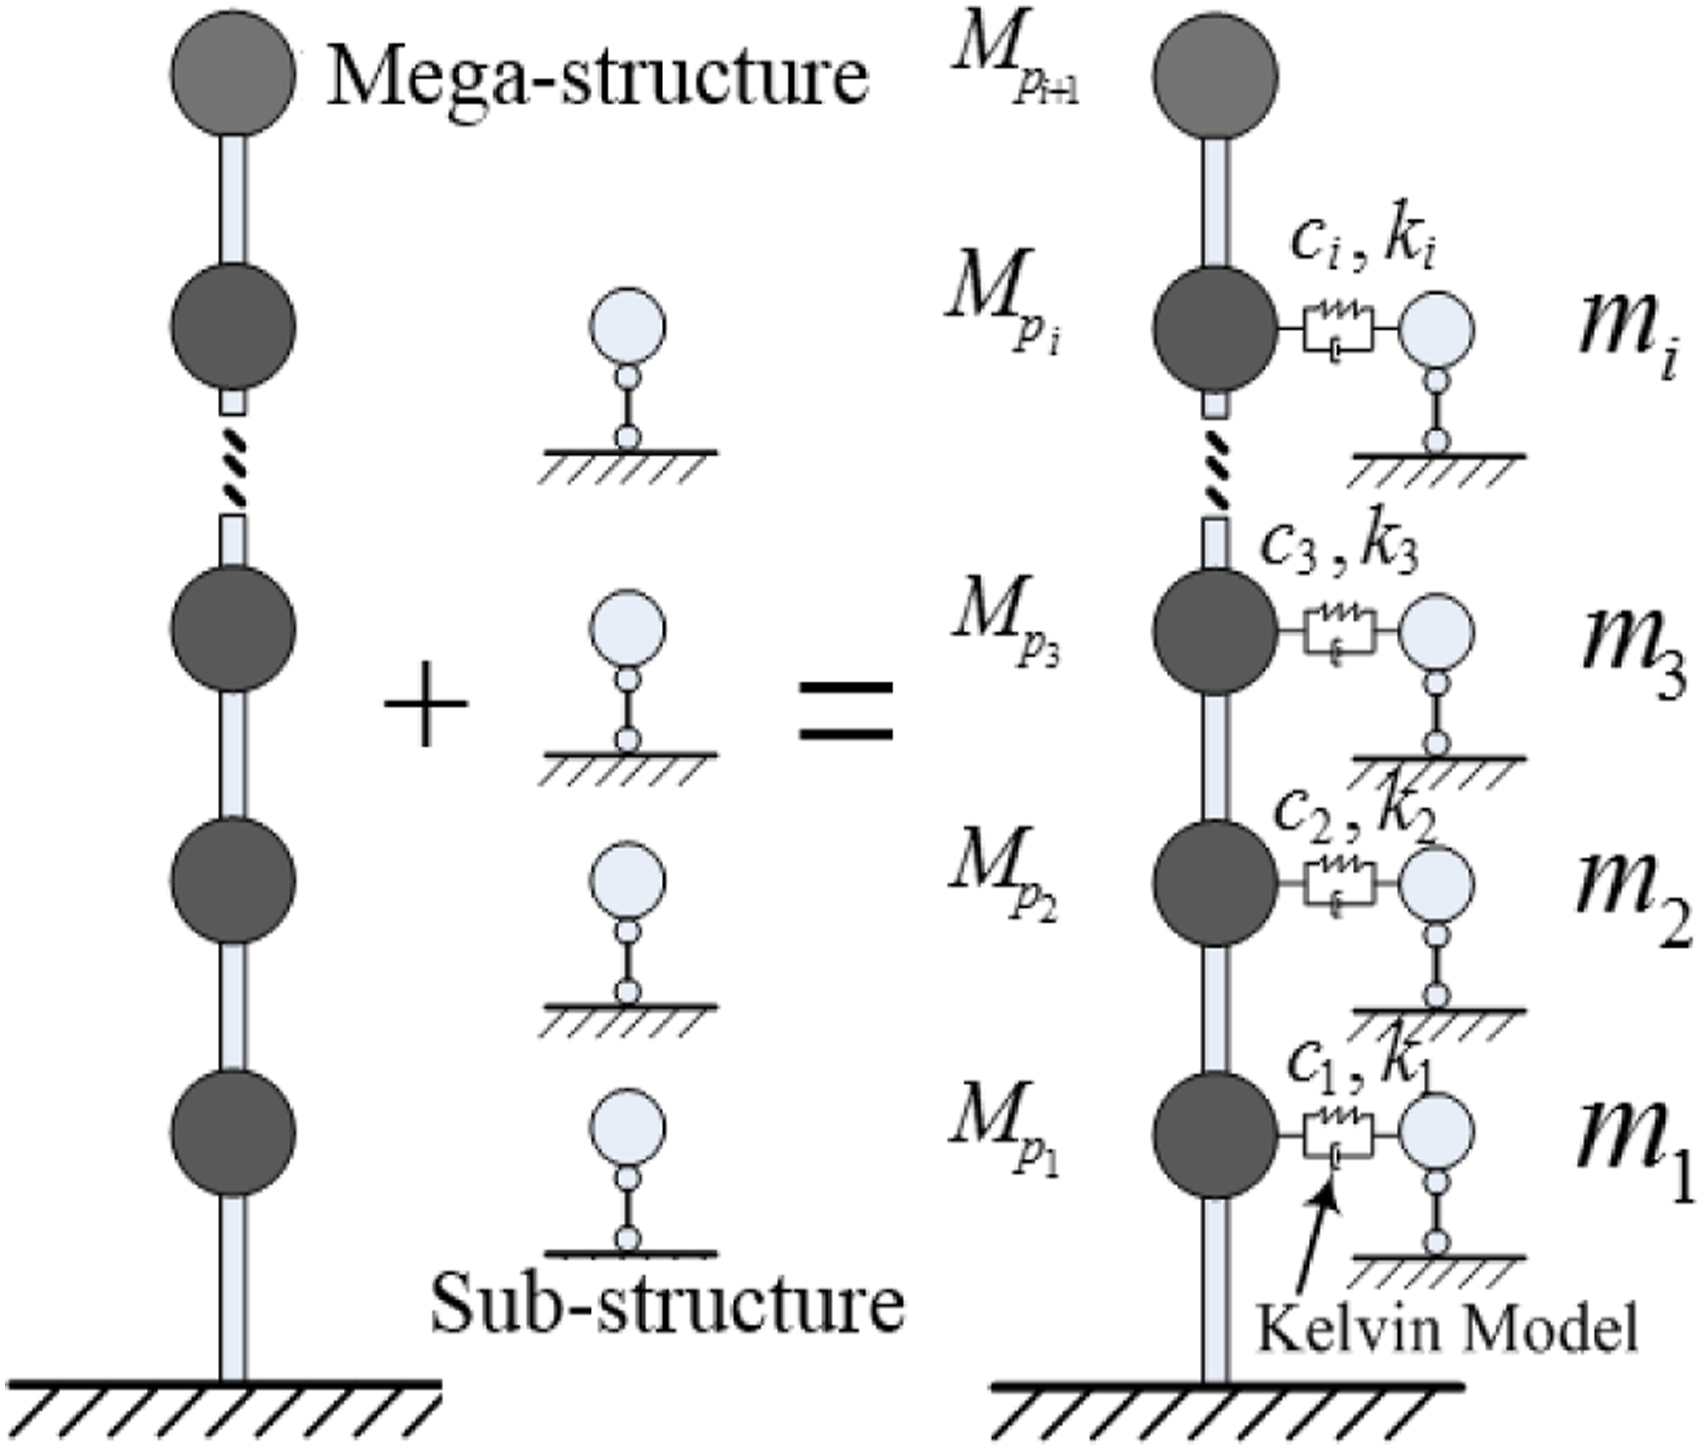
According to the d’Alembert principle, the motion equation of the analysis model of mega–sub isolation system shown in Figure 1 can be established as follows:
For the sub-structure

For the mega-structure
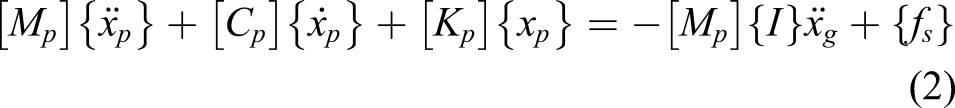
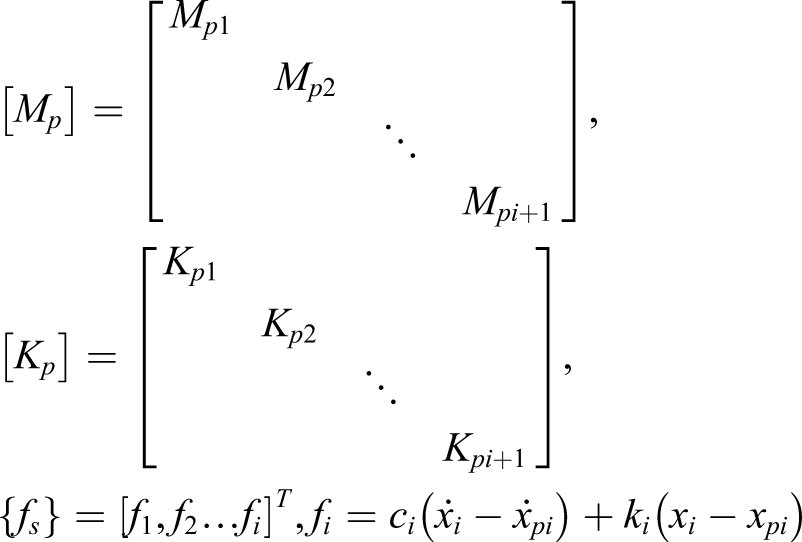
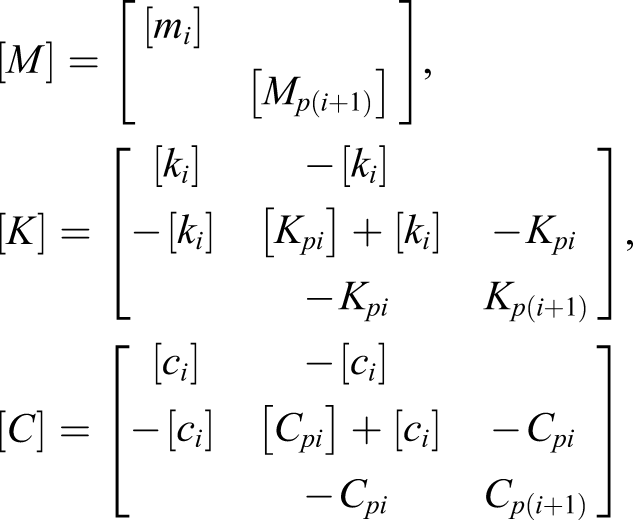
According to the equations (1) and (2), the motion equation of the analysis model shown in Figure 1 is given as

Ground motion intensity indices
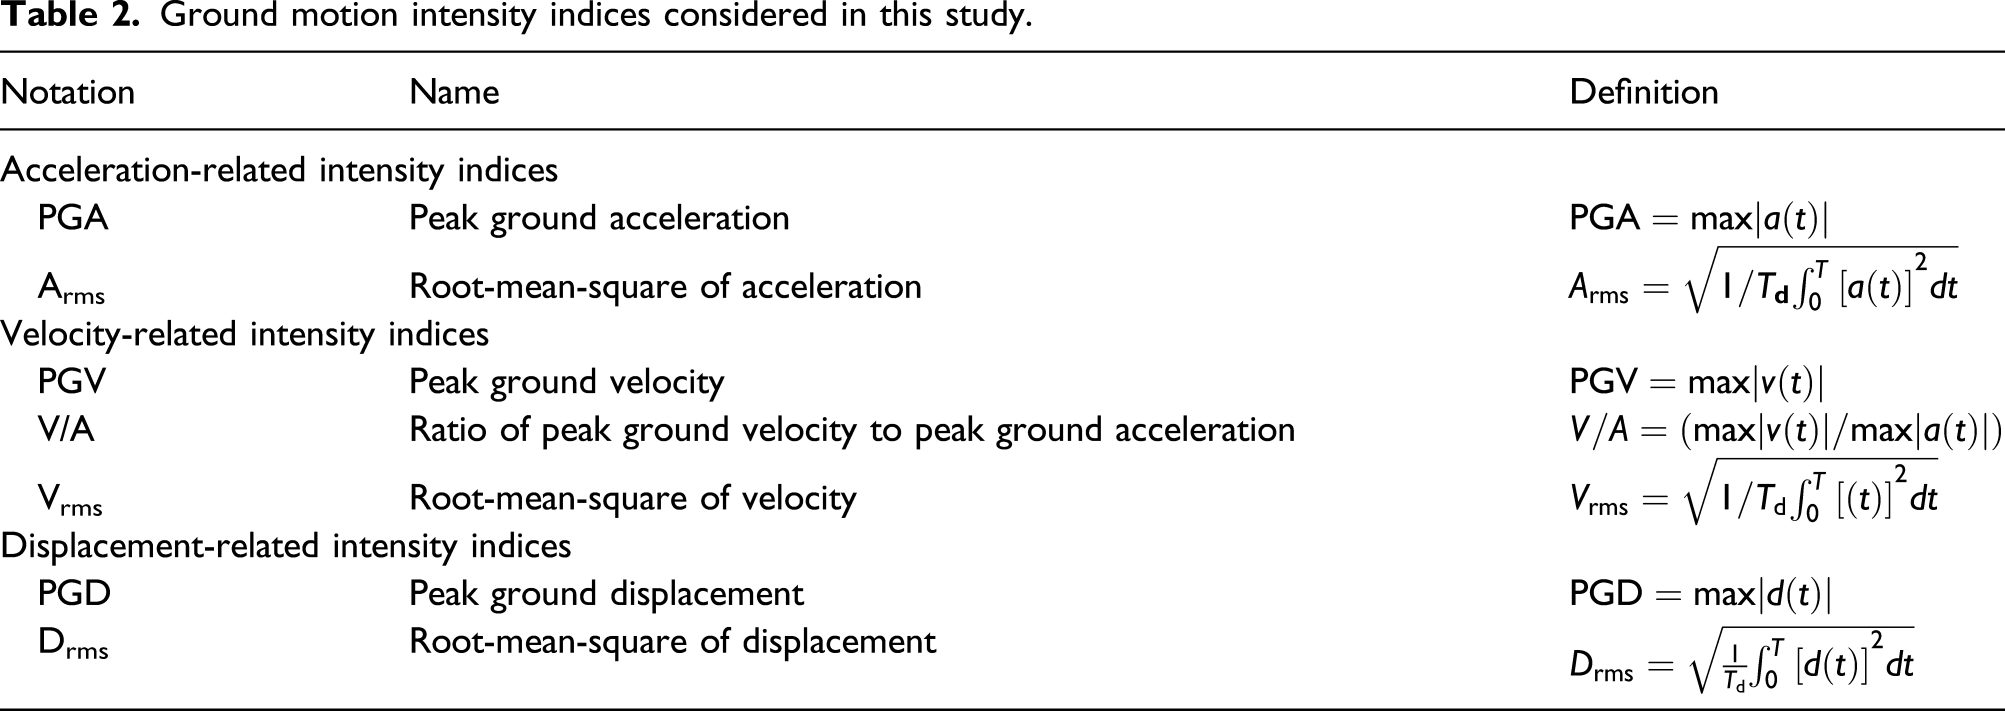
Peak ground acceleration (PGA) is commonly used in the dynamic time history analysis of structures. However, some studies have shown that the use of PGA exclusively as the indicator in the dynamic time history analysis of structures is imperfect (Housner and Jennings, 1977; Neumann, 1952; Riddell, 2007; Takewaki and Tsujimoto, 2011). Neumann (1952) reported that using peak ground velocity (PGV) could better reflect the intensity of ground motion than PGA. Therefore, whether PGA is suitable for the mega–sub isolation system needs to be testified under near-fault ground motions.
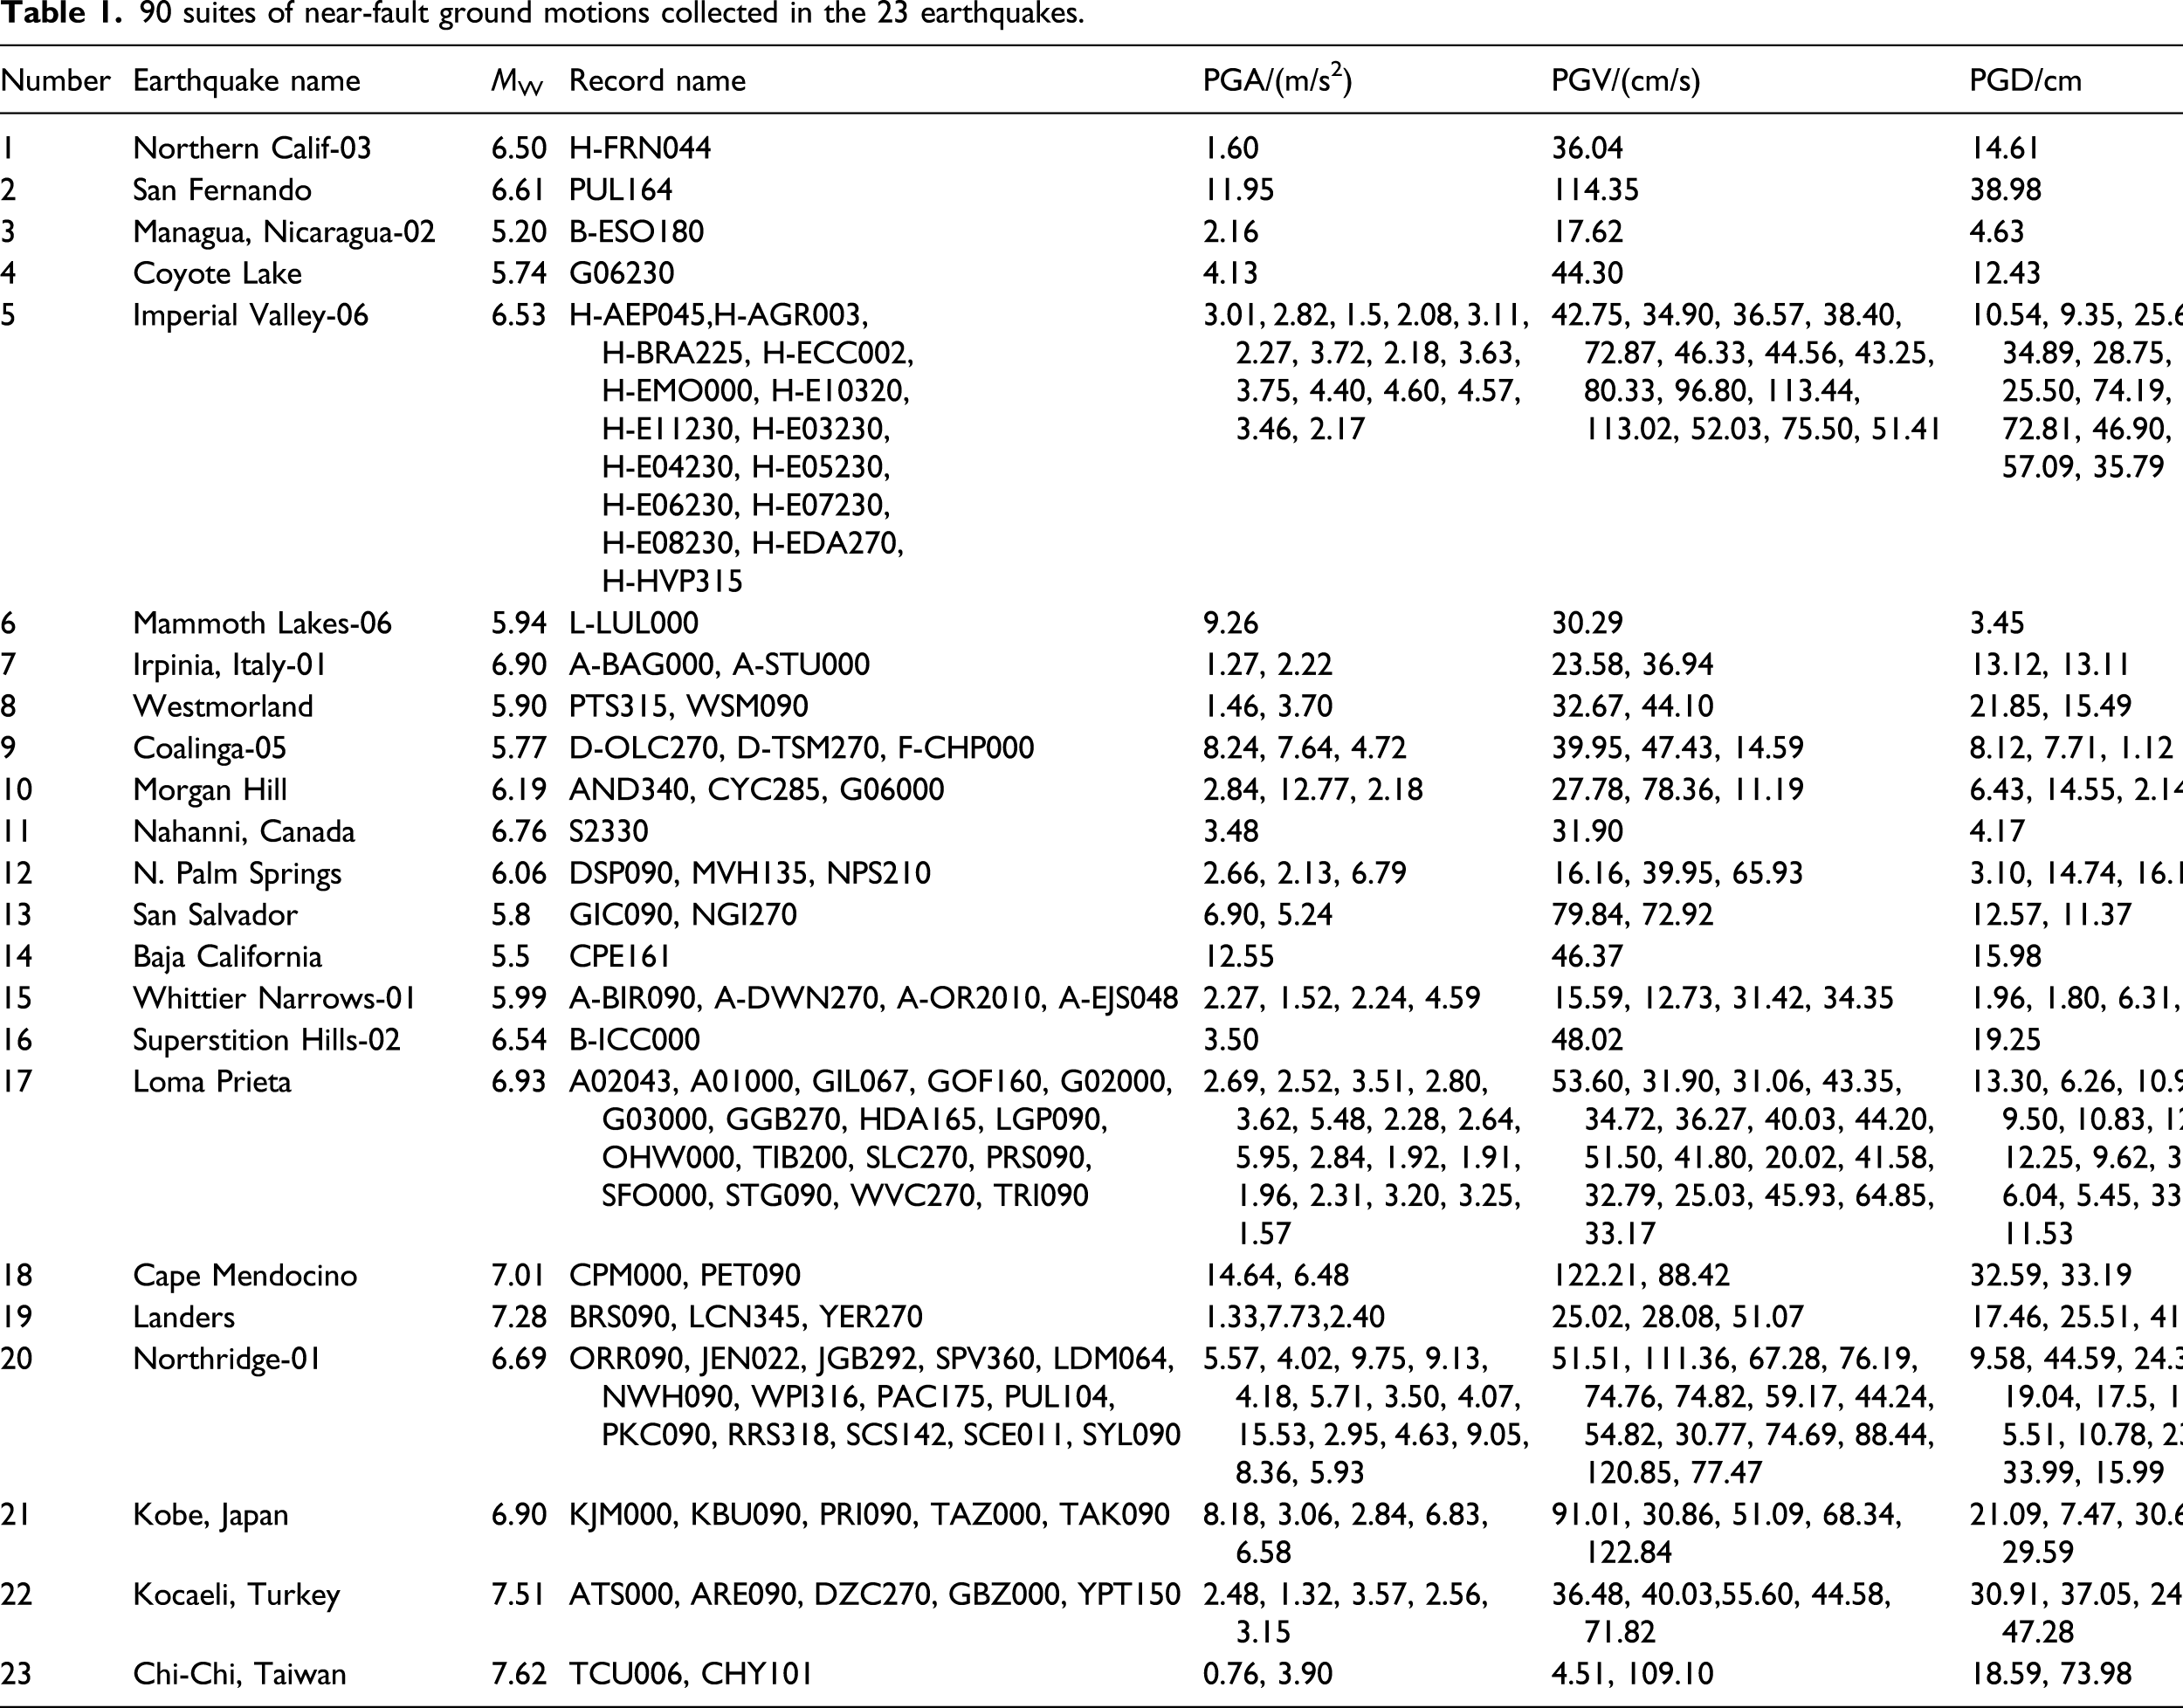
90 suites of near-fault ground motions collected in the 23 earthquakes.
Ground motion intensity indices considered in this study.
A typical engineering project is selected as a numerical example (Lan et al., 2002), which is composed of five mega-stories, and the sub-structures are attached to the mega-structure from the second floor to the fifth floor. The mass and shear stiffness of each mega-structure are 9 × 10⁵ kg and 9 × 10⁷ N·m−1, respectively, and the mass of the top mega-structure is 4.5 × 10⁵ kg. The mass of each sub-structure is determined by the mass ratio, which is taken as 1.5. The mass ratio is defined as the ratio of the sub-structure’s mass to the mega-structure’s mass. The near-fault ground motions with velocity pulse are used as the input ground motion; the correlation between the ground motion intensity indices and the peak seismic responses of the mega–sub isolation system under near-fault ground motions are further discussed.
The correlations between the peak displacement response of mega-structure and the seven ground motion intensity indices are shown in Figure 2. Figure 2 demonstrates that the correlation coefficients of PGA, Arms, PGV, V/A, Vrms, PGD, and Drms and the peak displacement responses of mega-structure are 0.3258, 0.4649, 0.8502, 0.3527, 0.8283, 0.5887, and 0.4848, respectively. The order of descending correlations is PGV >Vrms >PGD > Drms >Arms >V/A >PGA. Thus, the correlation between the PGV and the peak displacement response of mega-structure is the best, whereas the correlation between the PGA and the peak displacement response of mega-structure is the worst. The correlations between the displacement responses of mega-structure and the seven ground motion intensity indices.
The relativity between the peak acceleration response of the top sub-structure and the seven ground motion intensity indices are shown in Figure 3. It can be observed from Figure 3 that the correlation coefficients of PGA, Arms, PGV, V/A, Vrms, PGD, and Drms and the peak acceleration responses of the top sub-structure are 0.2386, 0.3199, 0.8581, 0.5304, 0.8813, 0.8873, and 0.7873, respectively. The order of descending correlations is PGD >Vrms > PGV > Drms >V/A >Arms >PGA. This indicates that the correlation between the PGD and the peak acceleration response of the top sub-structure is the best, whereas the correlation between the PGA and the peak acceleration response of the top sub-structure is the worst. The correlations between the acceleration responses of the top sub-structure and the seven ground motion intensity indices.
Figure 4 shows the correlations between the peak displacement responses of the isolation layer and the seven ground motion intensity indices. From this figure, it also can be seen that the correlation coefficients of PGA, Arms, PGV, V/A, Vrms, PGD, and Drms and the peak displacement responses of the isolation layer are 0.0673, 0.1475, 0.7527, 0.6260, 0.8329, 0.9515, and 0.8797, respectively. The order of descending correlations is PGD >Drms > Vrms > PGV >V/A >Arms >PGA, which exhibits that the correlation between the PGD and the peak displacement responses of the isolation layer is the best, while the correlation between the PGA and the peak displacement responses of the isolation layer is the worst. The correlations between the displacement responses of isolation layer and the seven ground motion intensity indices.
As noted in Figures 2–4, different intensity indices have various correlation coefficients with the peak responses of mega–sub isolation system. The correlations of acceleration-related intensity indices are the worst, and the correlations of displacement-related intensity indices show high linearity. In contrast to PGA and PGV, displacement-related intensity indices are more reasonable to be used for selecting and adjusting earthquake inputs for time history analysis of mega–sub isolation system subjected to near-fault ground motions.
Stochastic response sensitivity analysis of mega–sub isolation system
In the seismic fragility analysis, selecting multiple random structural parameters will make the calculation too expensive and affect the computational efficiency. Therefore, it is necessary to reasonably choose representative random structural parameters. The structural responses sensitivity to random parameters will be discussed in this section referring to the method presented by Lin and Yi (2001) in order to determine the representative random structural parameters for the analysis of seismic fragility in the next section.
Definition of sensitivity
Without loss of generality, the structural random parameters are assumed to consist of random variables, which are shown as follows
Each of these random variables can be expressed as

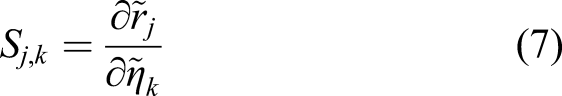
For easy analysis, S
j, k
is normalized in the following form
Stochastic response sensitivity analysis
Basic information of the five random parameters.

The sensitivities of variance of mega-structure story drifts to the five random parameters are shown in Figure 5. From this figure, the following observations can be noticed. (1) The sensitivity to the sub-structure story stiffness varies almost linearly from the bottom to the top, and all sensitivity values are negative, indicating that the mega-structure story drifts will be reduced constantly with the increase in story stiffness of sub-structure. The inhibition is stronger in the bottom story. (2) Both the sensitivities to the mega-structure story stiffness and damping ratio of the isolation layer are similar to that of the sub-structure story stiffness. (3) The sensitivity to the stiffness of the isolation layer is negative for the top story but positive for other four stories. This finding indicates that increasing the stiffness of the isolation layer will lead to story drift reduction in the top but also to increase in the other stories. (4) The sensitivity to the sub-structure story mass is almost the same as that of the stiffness of the isolation layer. (5) The magnitude of the sensitivity values demonstrates that the sensitivity of the variance of mega-structure story drifts is weaker to the sub-structure story stiffness but stronger to the mega-structure story stiffness, the sub-structure story mass, and the stiffness and damping ratio of the isolation layer. The sensitivity of variance of mega-structure story drifts to the five random parameters.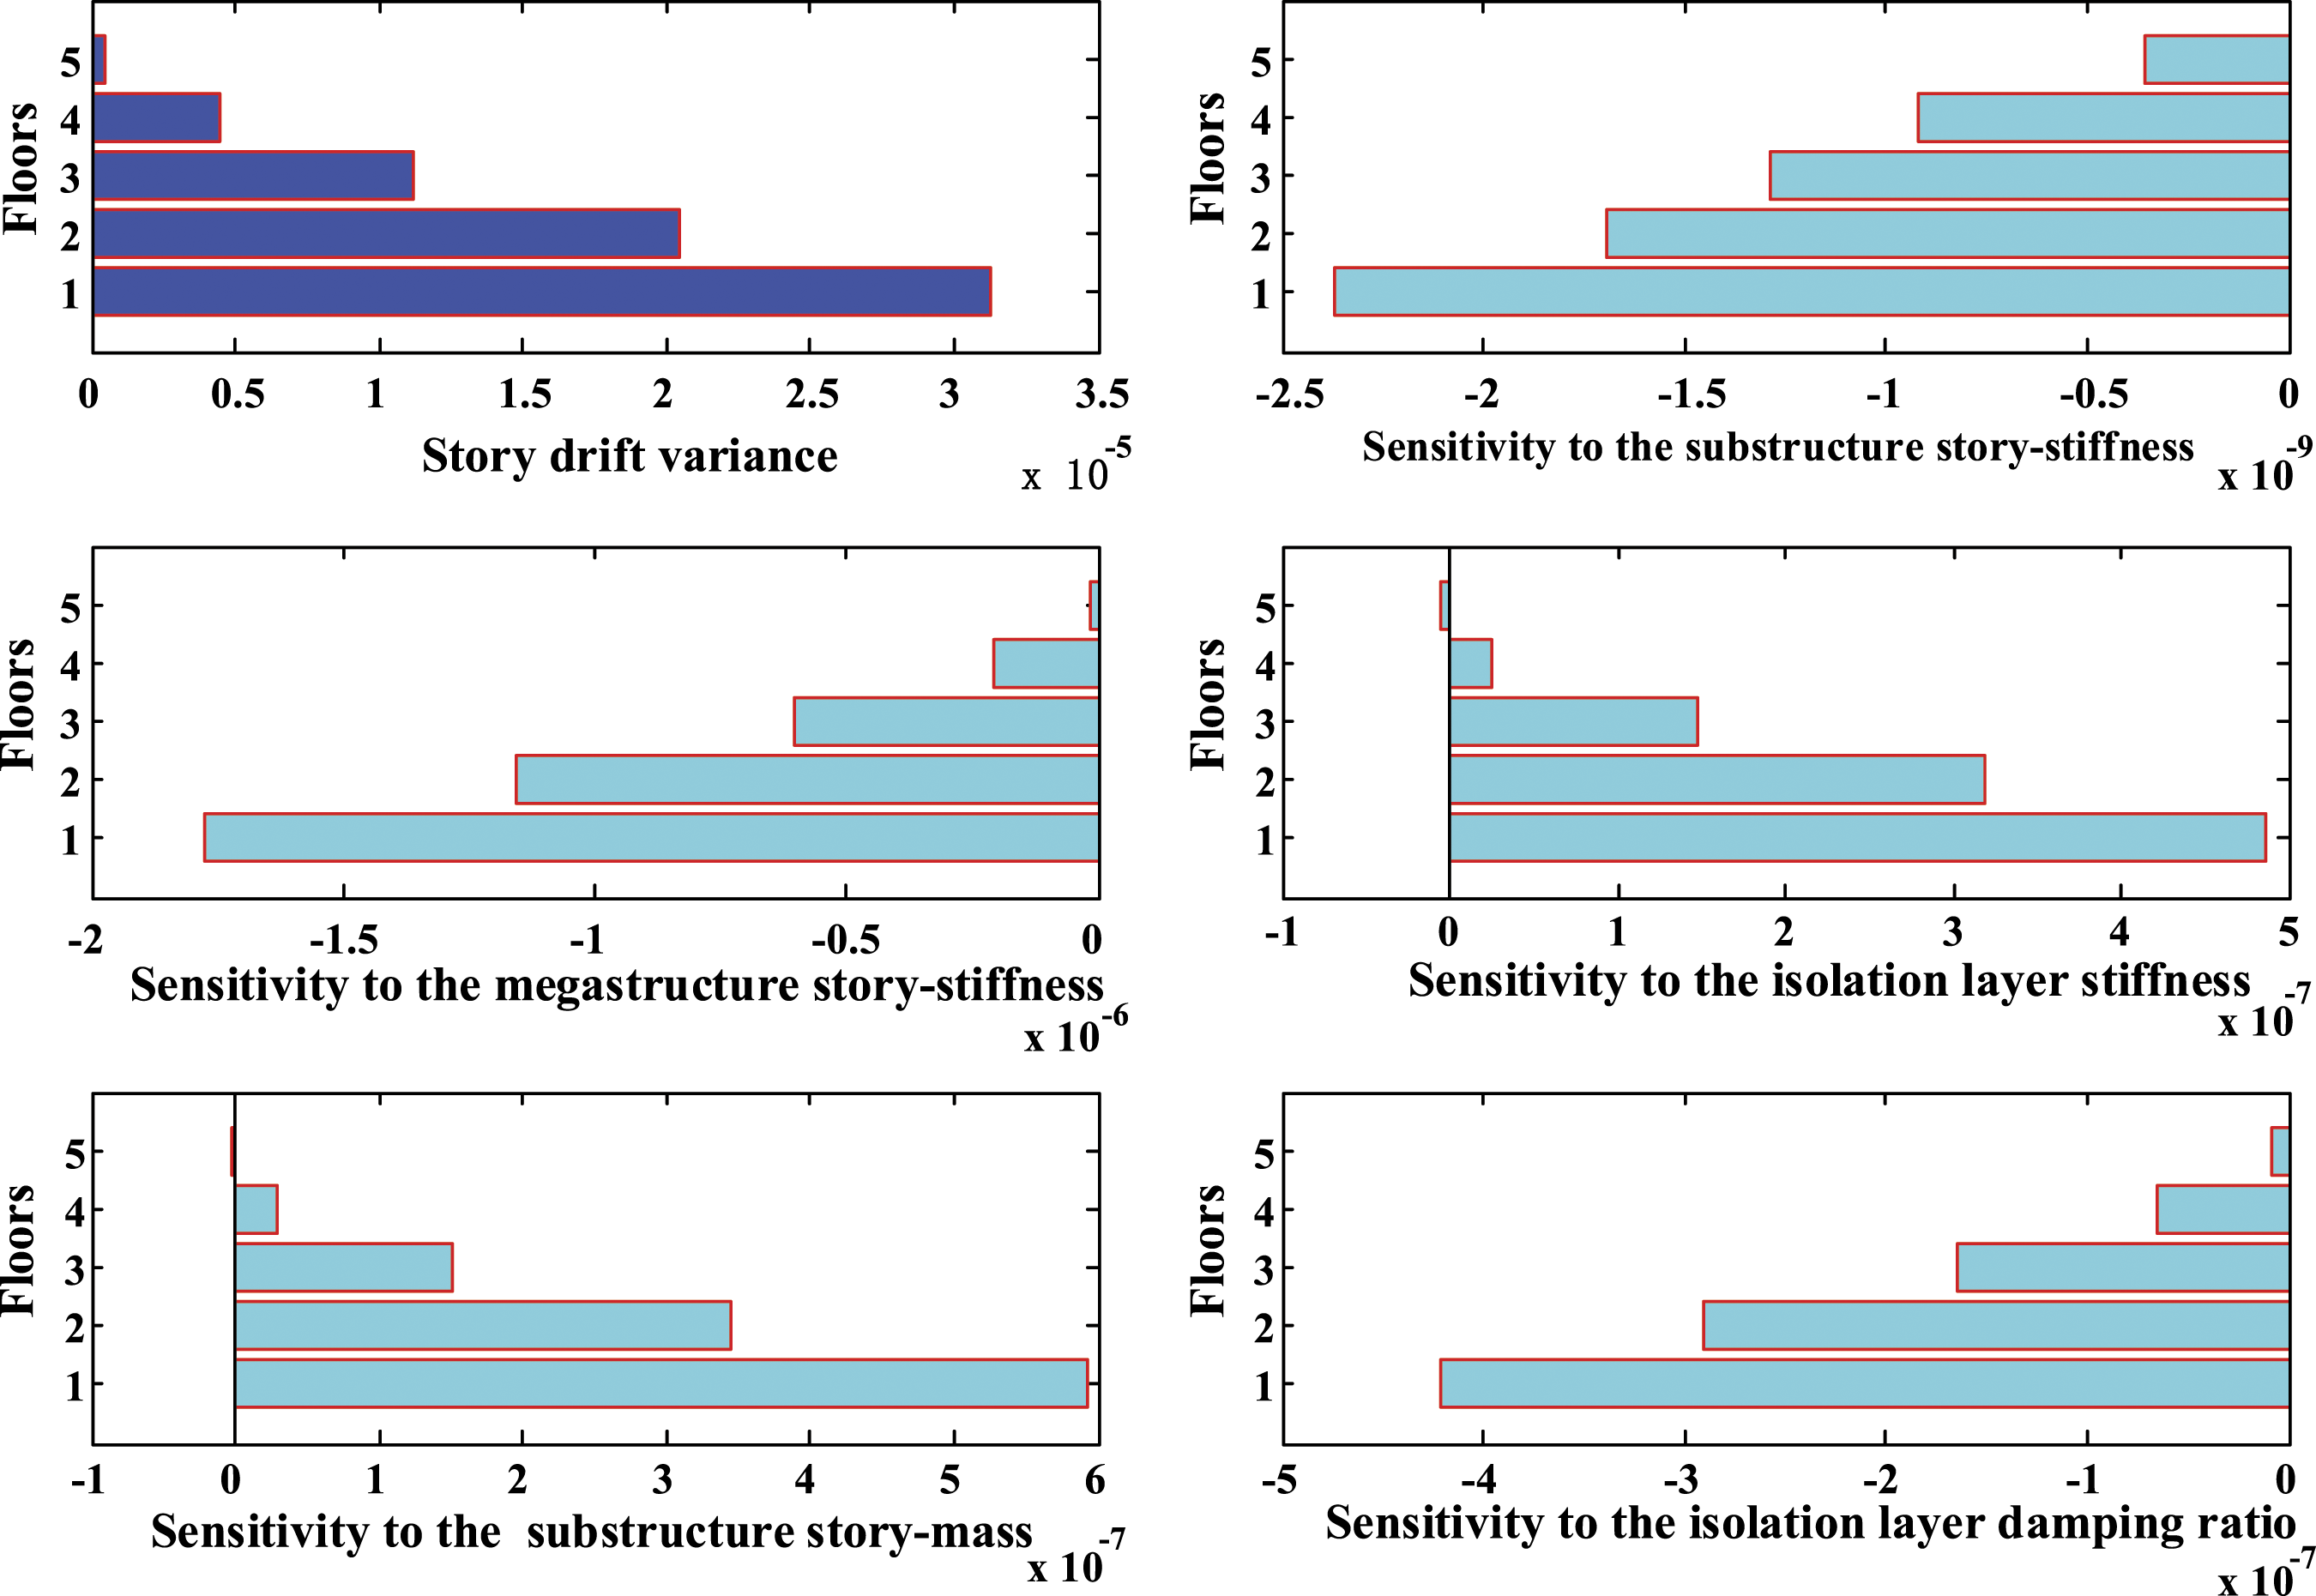
The sensitivities of the variance of top sub-structure absolute accelerations to the five random parameters are shown in Figure 6. From this figure, one can observe that (1) the sensitivity to sub-structure story stiffness is negative for the bottom story but positive for other three stories. This shows that increasing sub-structure story stiffness will cause absolute acceleration reduction in the bottom but also increases in the other stories. (2) All sensitivity values for mega-structure story stiffness are negative, indicating that the top sub-structure absolute accelerations will be reduced constantly as the mega-structure story stiffness increases. The inhibition is stronger in the top story. (3) Both the sensitivities to the sub-structure story mass and damping ratio of the isolation layer present similar situation as that of the mega-structure story stiffness. (4) All sensitivity values for the stiffness of the isolation layer are positive, and sensitivity values increase from the bottom to top story. (5) The magnitude of the sensitivity values shows that the sensitivity of the variance of the top sub-structure absolute accelerations is weaker to the sub-structure story stiffness but stronger to sub-structure story mass and the stiffness and damping ratio of the isolation layer. The sensitivity of variance of top sub-structure absolute accelerations to the five random parameters.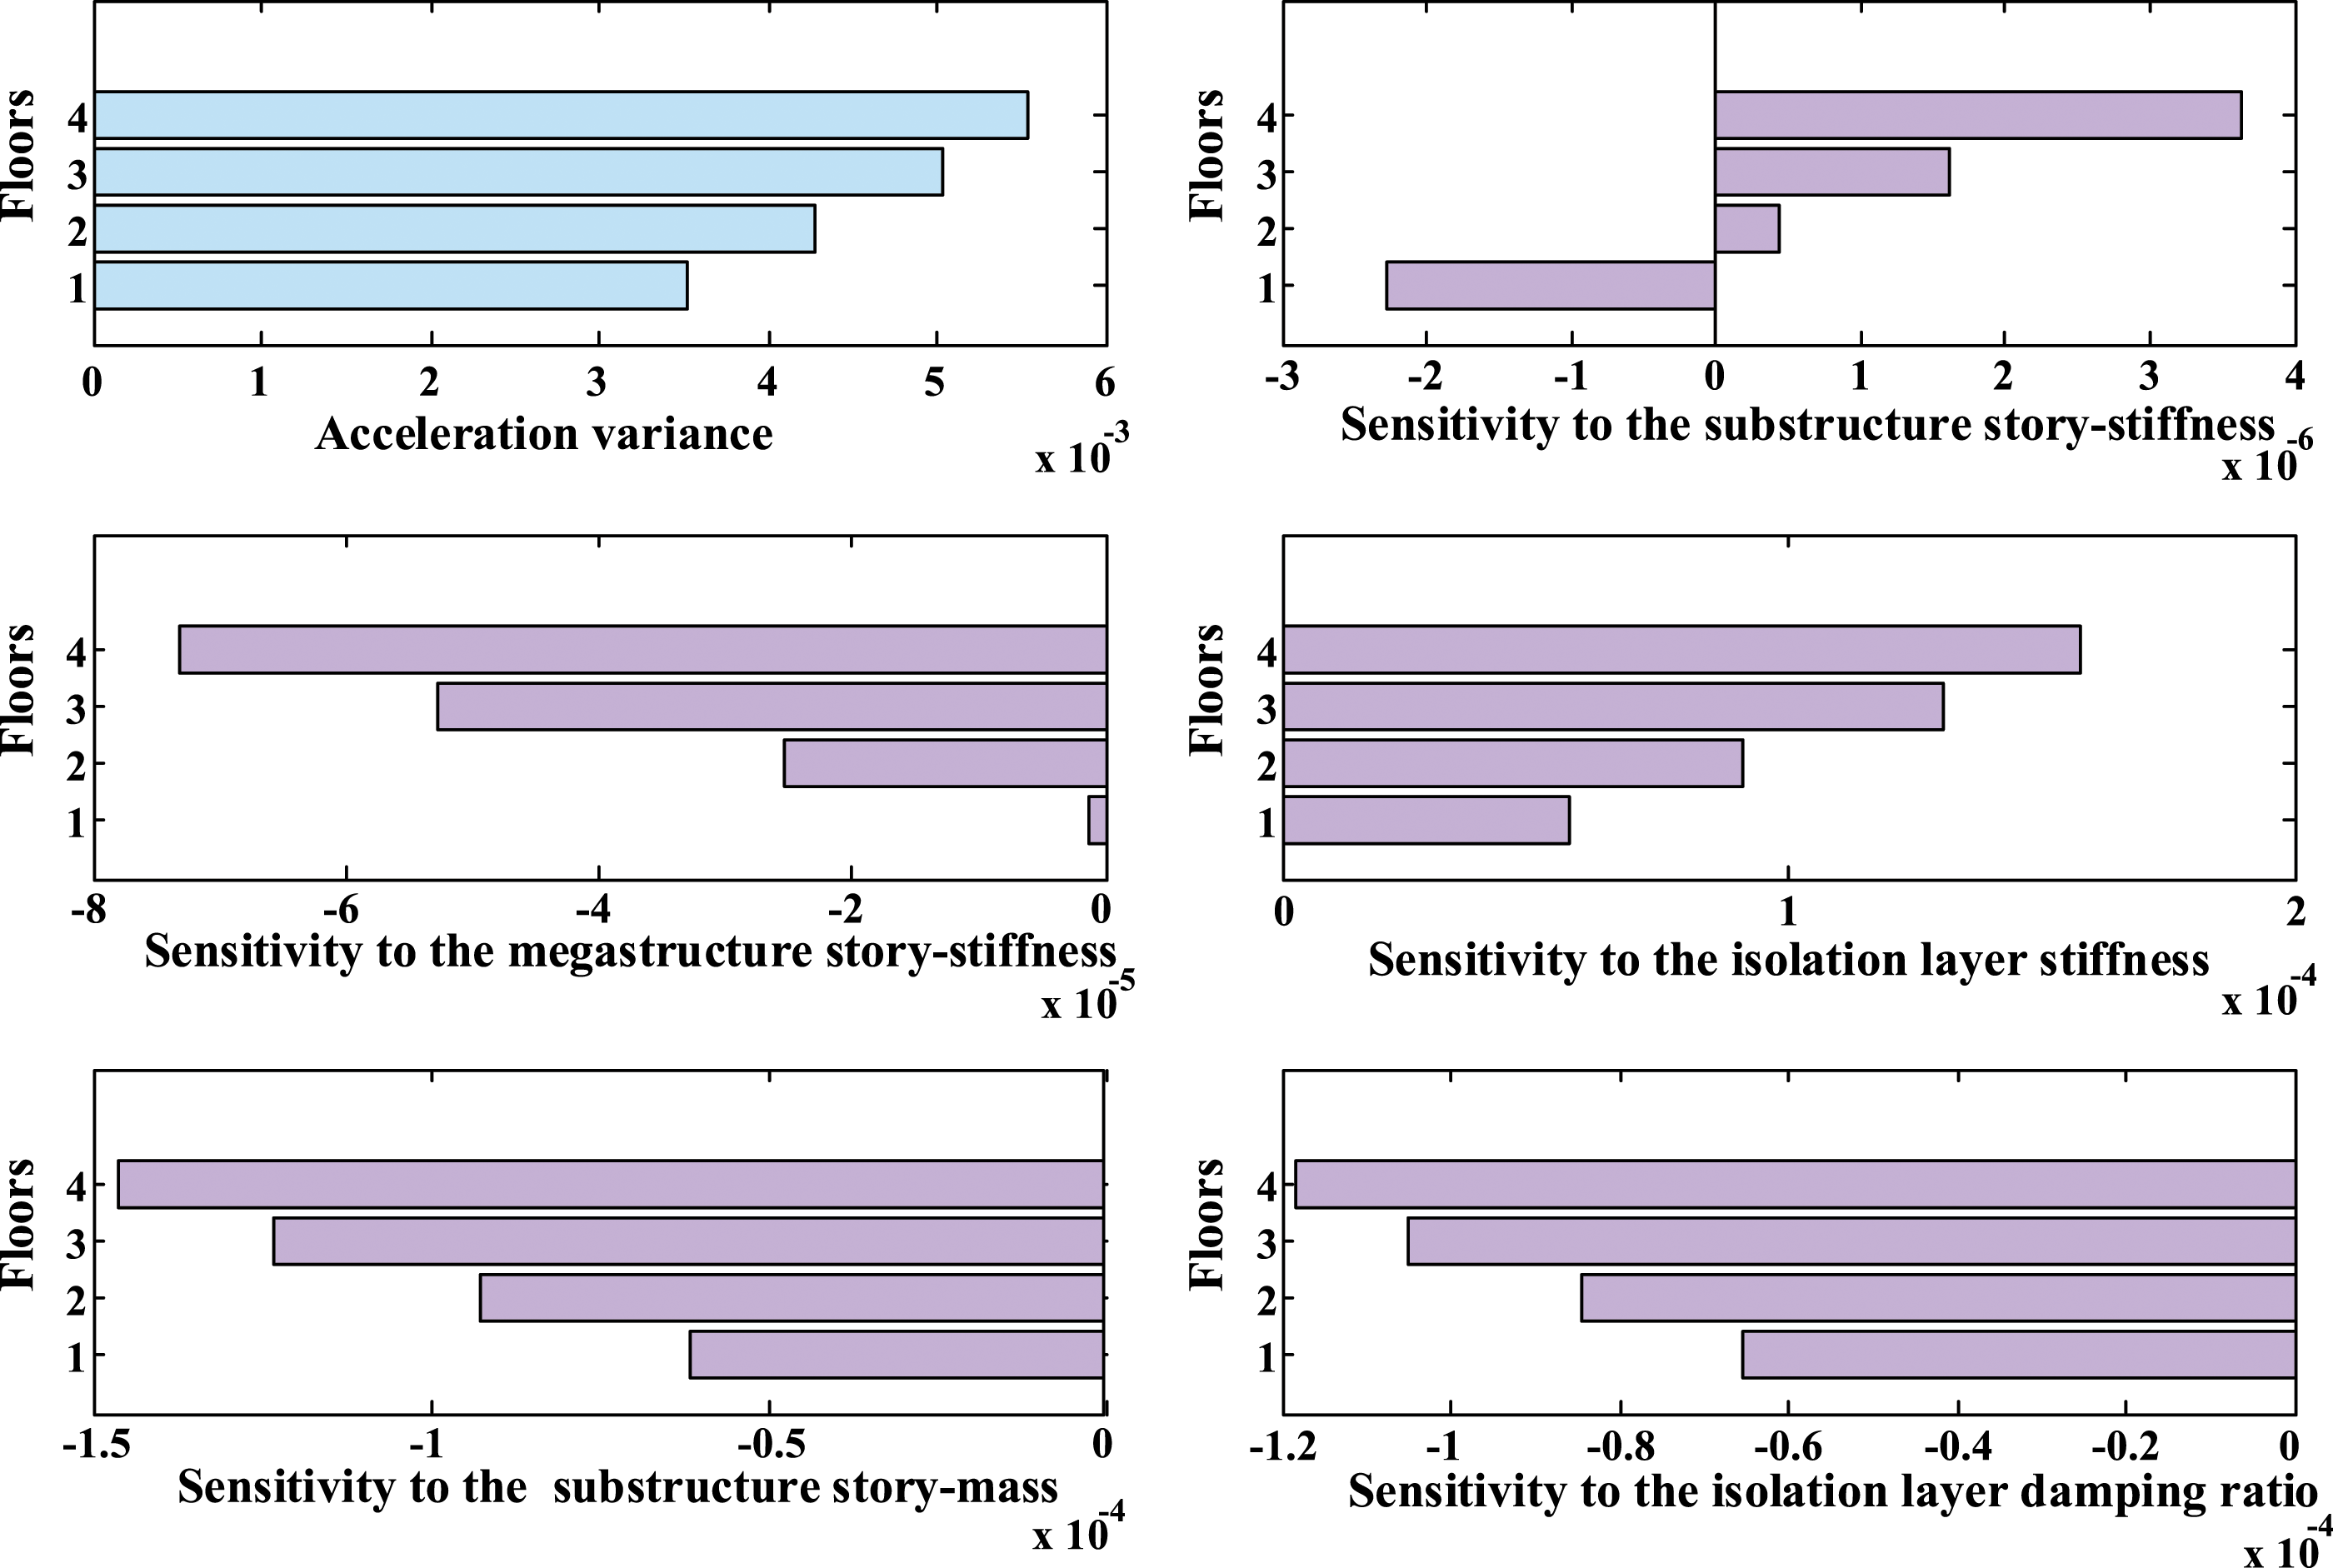
The sensitivities of variance of isolation layer drifts to the five random parameters are shown in Figure 7. The following observations are noted from this figure. (1) The sensitivity values to sub-structure story stiffness are all negative. This indicates that increasing the sub-structure story stiffness will reduce isolation layer drifts. The magnitude of the sensitivity value is not significantly affected by the connected mega-structure floor. The sensitivity to the stiffness of the isolation layer is almost the same as that of the sub-structure story stiffness. (2) All the sensitivity values to the mega-structure story stiffness are negative, indicating that the isolation layer story drifts will be reduced constantly with the increase in story stiffness of the mega-structure. The inhibition is stronger in the top story. The sensitivity to the damping ratio of the isolation layer presents the same situation as that of the mega-structure story stiffness. (3) All sensitivity values for the sub-structure story mass are positive, and sensitivity values increase from the bottom to top story. (4) The magnitude of the sensitivity values demonstrate that the sensitivity of the variance of isolation layer story drifts is weaker for the sub-structure story stiffness but stronger to the sub-structure story mass and the stiffness and damping ratio of isolation layers. The sensitivity of variance of isolation layer drifts to the five random parameters.
As shown in Figures 5–7, the sensitivities of variance of the responses of mega–sub isolation system are different to the five random parameters. Overall, the responses of mega–sub isolation system show high sensitivity to the sub-structure story mass, and the stiffness and damping ratio of the isolation layers.
Seismic fragility analysis
Structural model
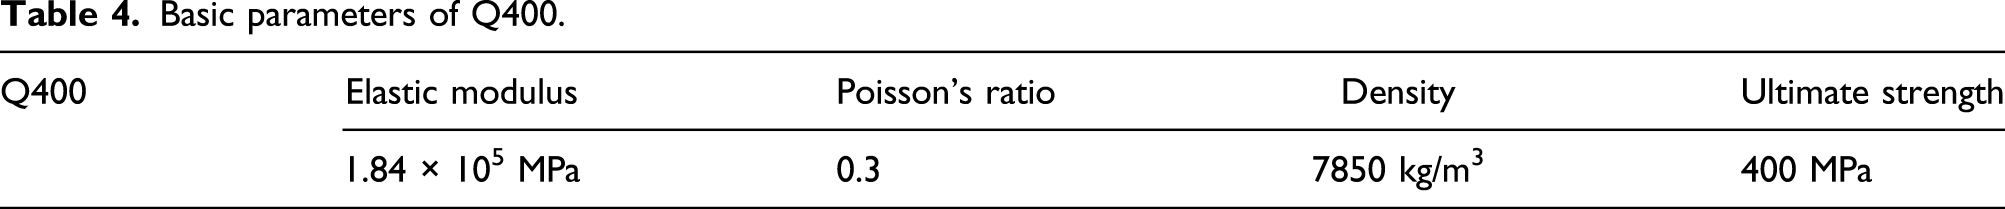
The structural model is designed according to Code for seismic design of buildings (GB50011-2010, 2010) and Code for design of steel structures (GB50017-2017, 2017), as shown in Figure 8. The main design parameters are as follows: Class II of the construction site, the second group of the design earthquake group, and the seismic fortification intensity of 8°. The model is composed of six mega-stories and five-story sub-structures that are attached to mega-structure from the second floor to the sixth floor. The beam/column sections of the mega-structure are box-shaped sections of 500 mm*1000 mm and 1000 mm*1000 mm, respectively, and the beam/column sections of the sub-structure are box-shaped sections of 600 mm*600 mm and 450 mm*450 mm, respectively. Q400 steel is used as the material of the structural model, and the basic parameters of Q400 are listed in Table 4. The kinematic hardening model is adopted as the constitutive model for Q400. 3D model of the mega–sub isolation system. Basic parameters of Q400.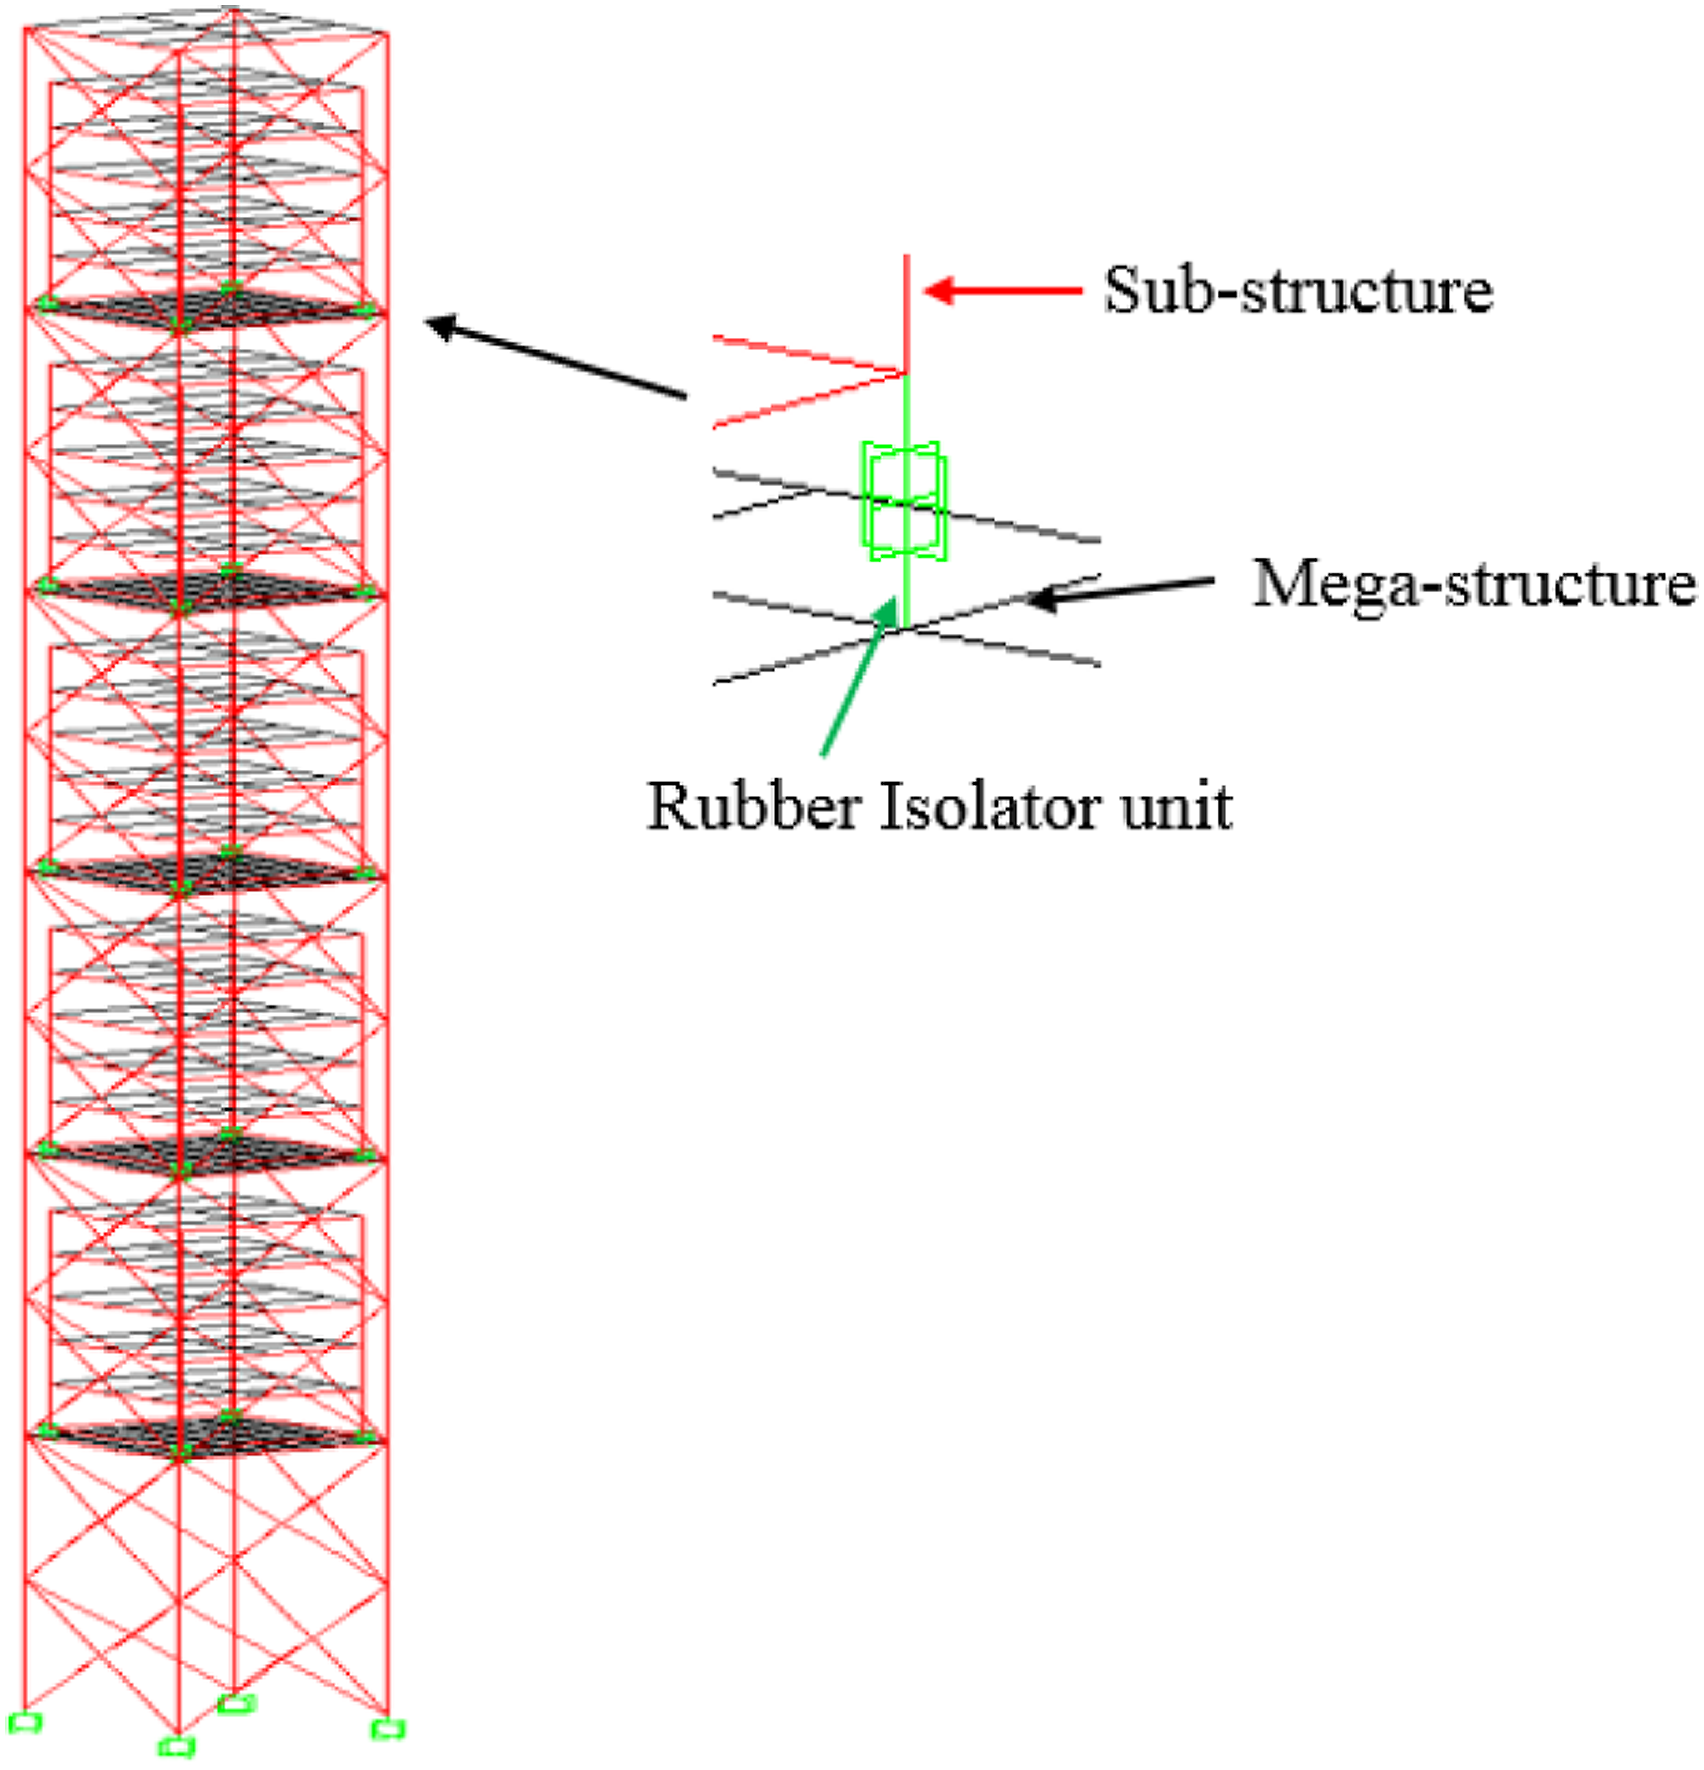
Random variable statistics.

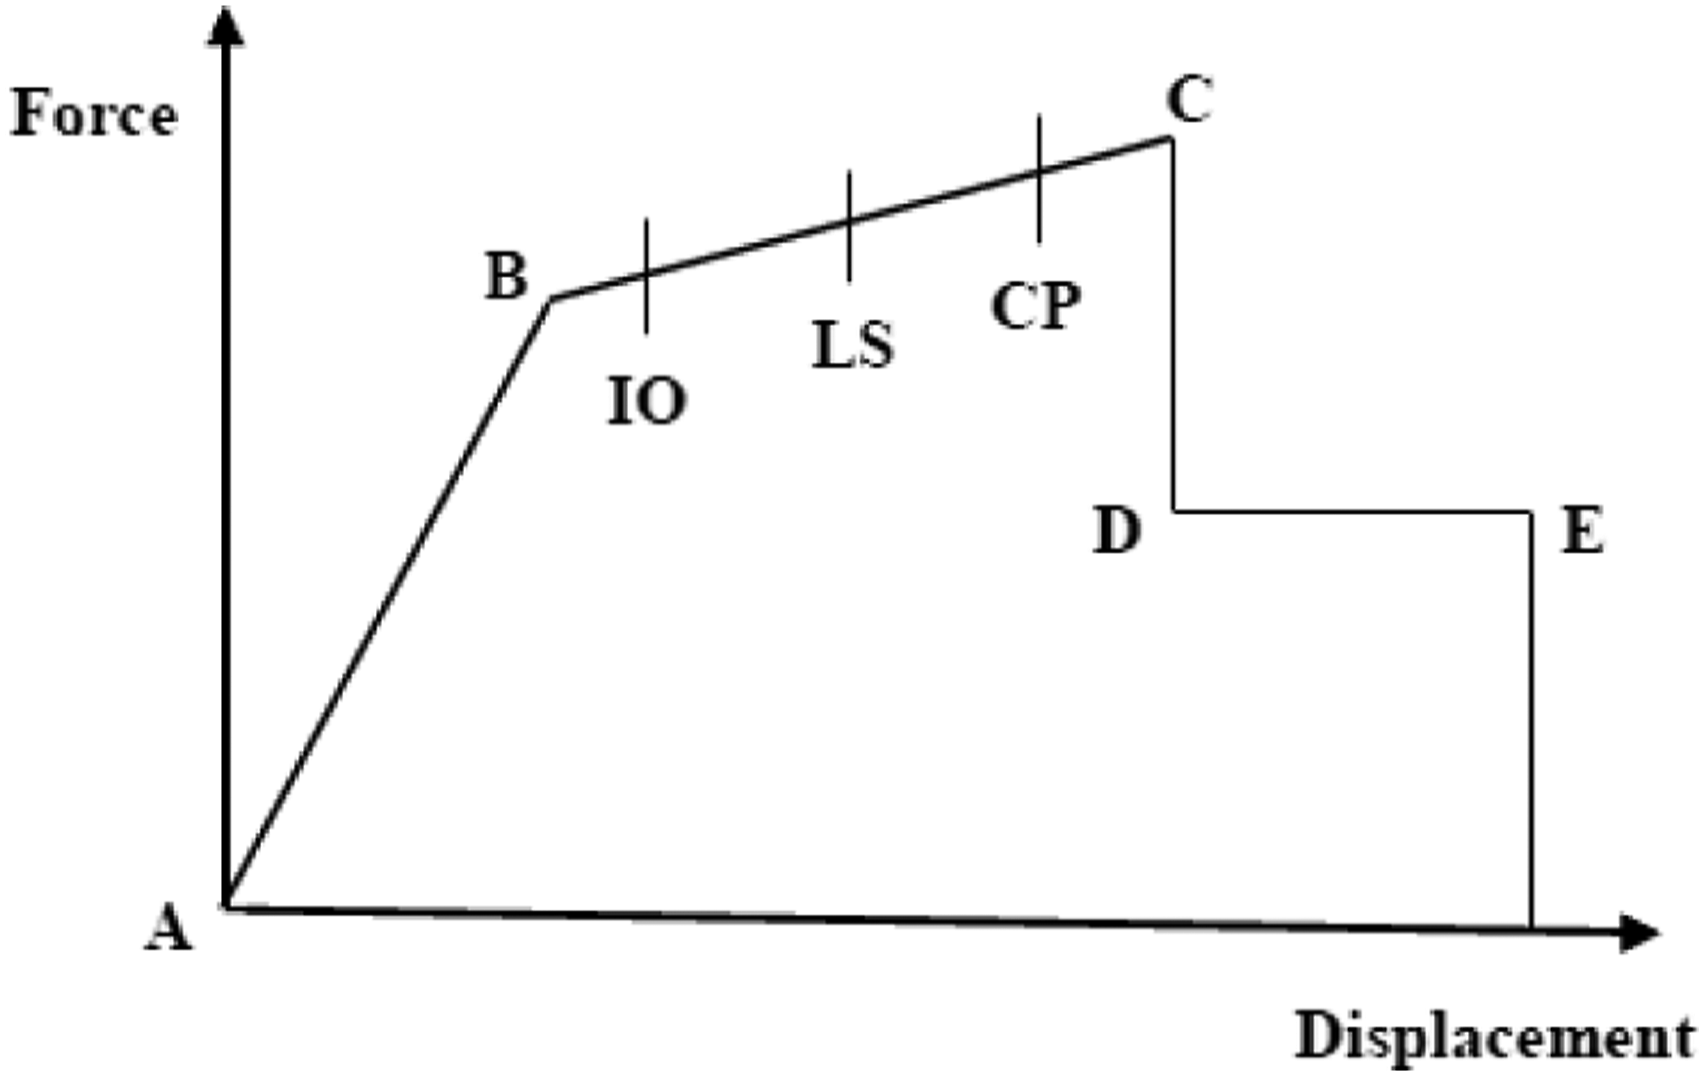
Load–displacement deformation features of nonlinear hinges.
Division of performance level
Definition of performance levels and quantitative indices of mega–sub isolation system.
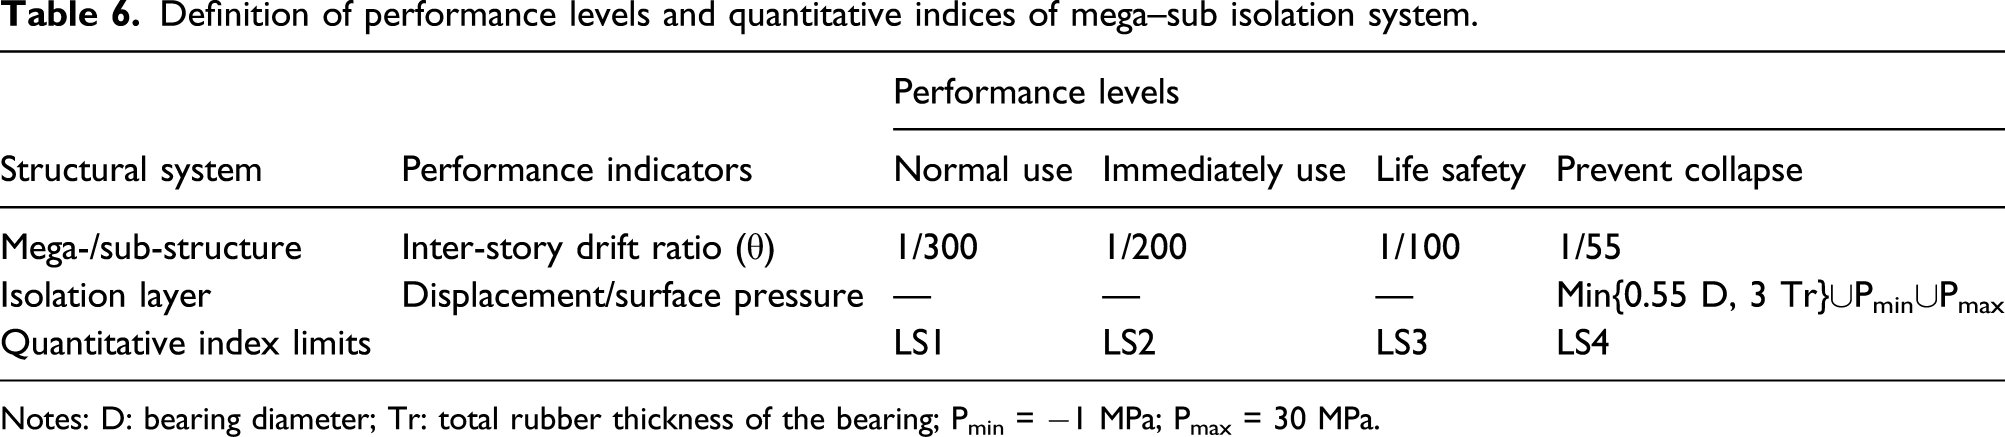
Notes: D: bearing diameter; Tr: total rubber thickness of the bearing; Pmin = −1 MPa; Pmax = 30 MPa.
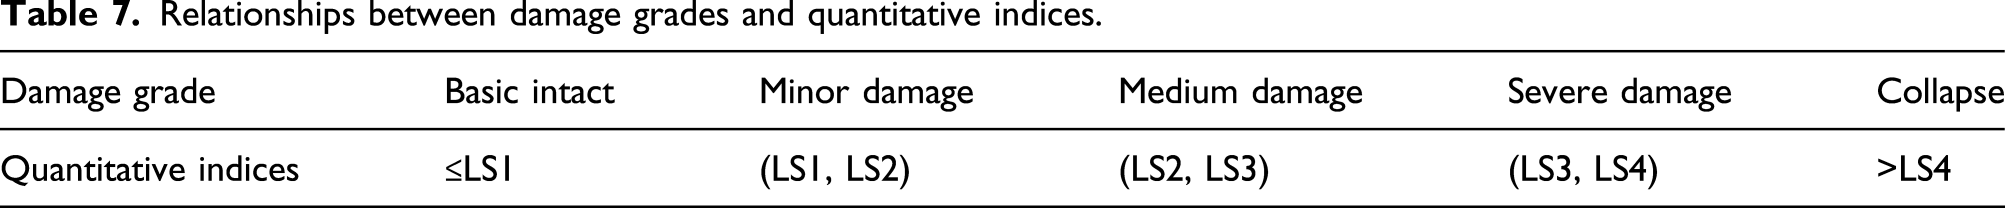
Relationships between damage grades and quantitative indices.
Establishment of response surface model
The quadratic polynomial is chosen as the response surface model because of the nonlinear characteristics of the structural responses in seismic analysis. And the function of the structural response can be expressed as follows
After n times of dynamic time history analysis, the nonhomogeneous linear equations to estimate γ0, γ
i
, γ
ii
, and γ
ij
are obtained. The approximate function of the structural response can be obtained by the least-squares regression analysis to the estimated parameters. The mean and mean square of the structural response are assumed to obey normal distribution, namely

Then, the response surface model of the structure can be given by
A set of effective test sampling points is designed by the central composite design method. Each factor is assumed to vary between −1 and +1. The determined test points have a total of 2 k + 2k + 1, including 2 k quadrant points, 2k axis points, and 1 center point.
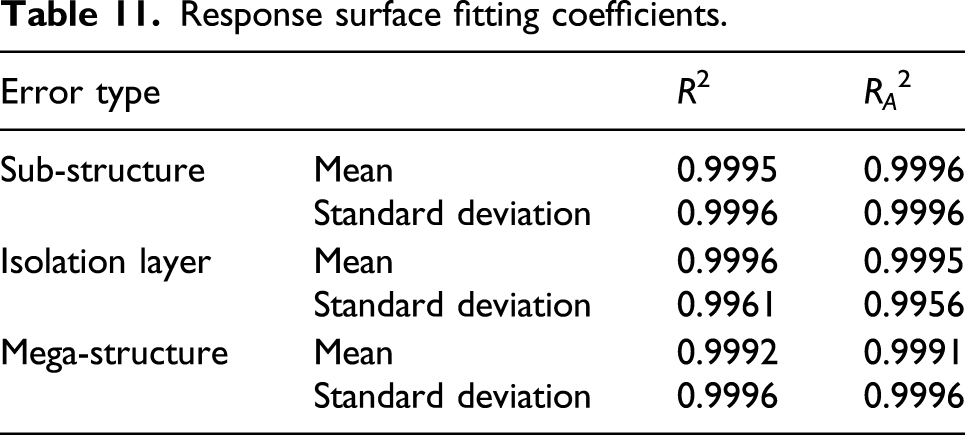
The multiple fitting coefficient R2 and the modified multiple fitting coefficient R
A
2 are used to test the adaptiveness of the regression model, which are defined as follows (Papila and Haftka, 2000)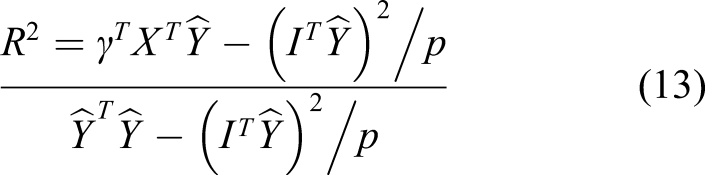

Response surface model analysis

Input variables and standardization for RSM.

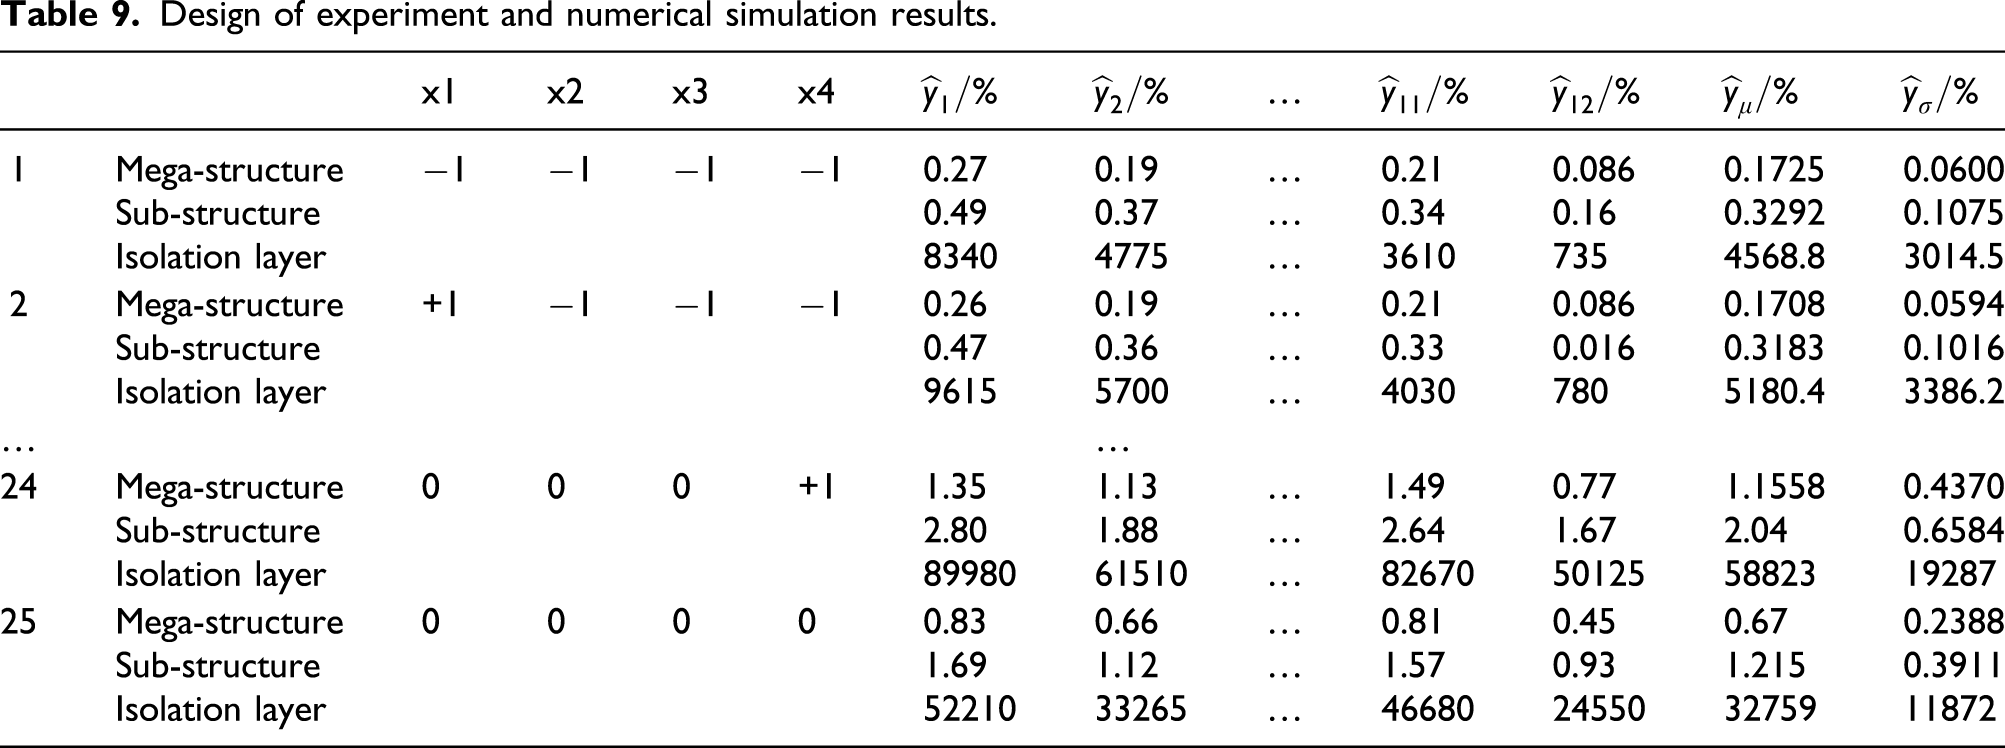
Design of experiment and numerical simulation results.
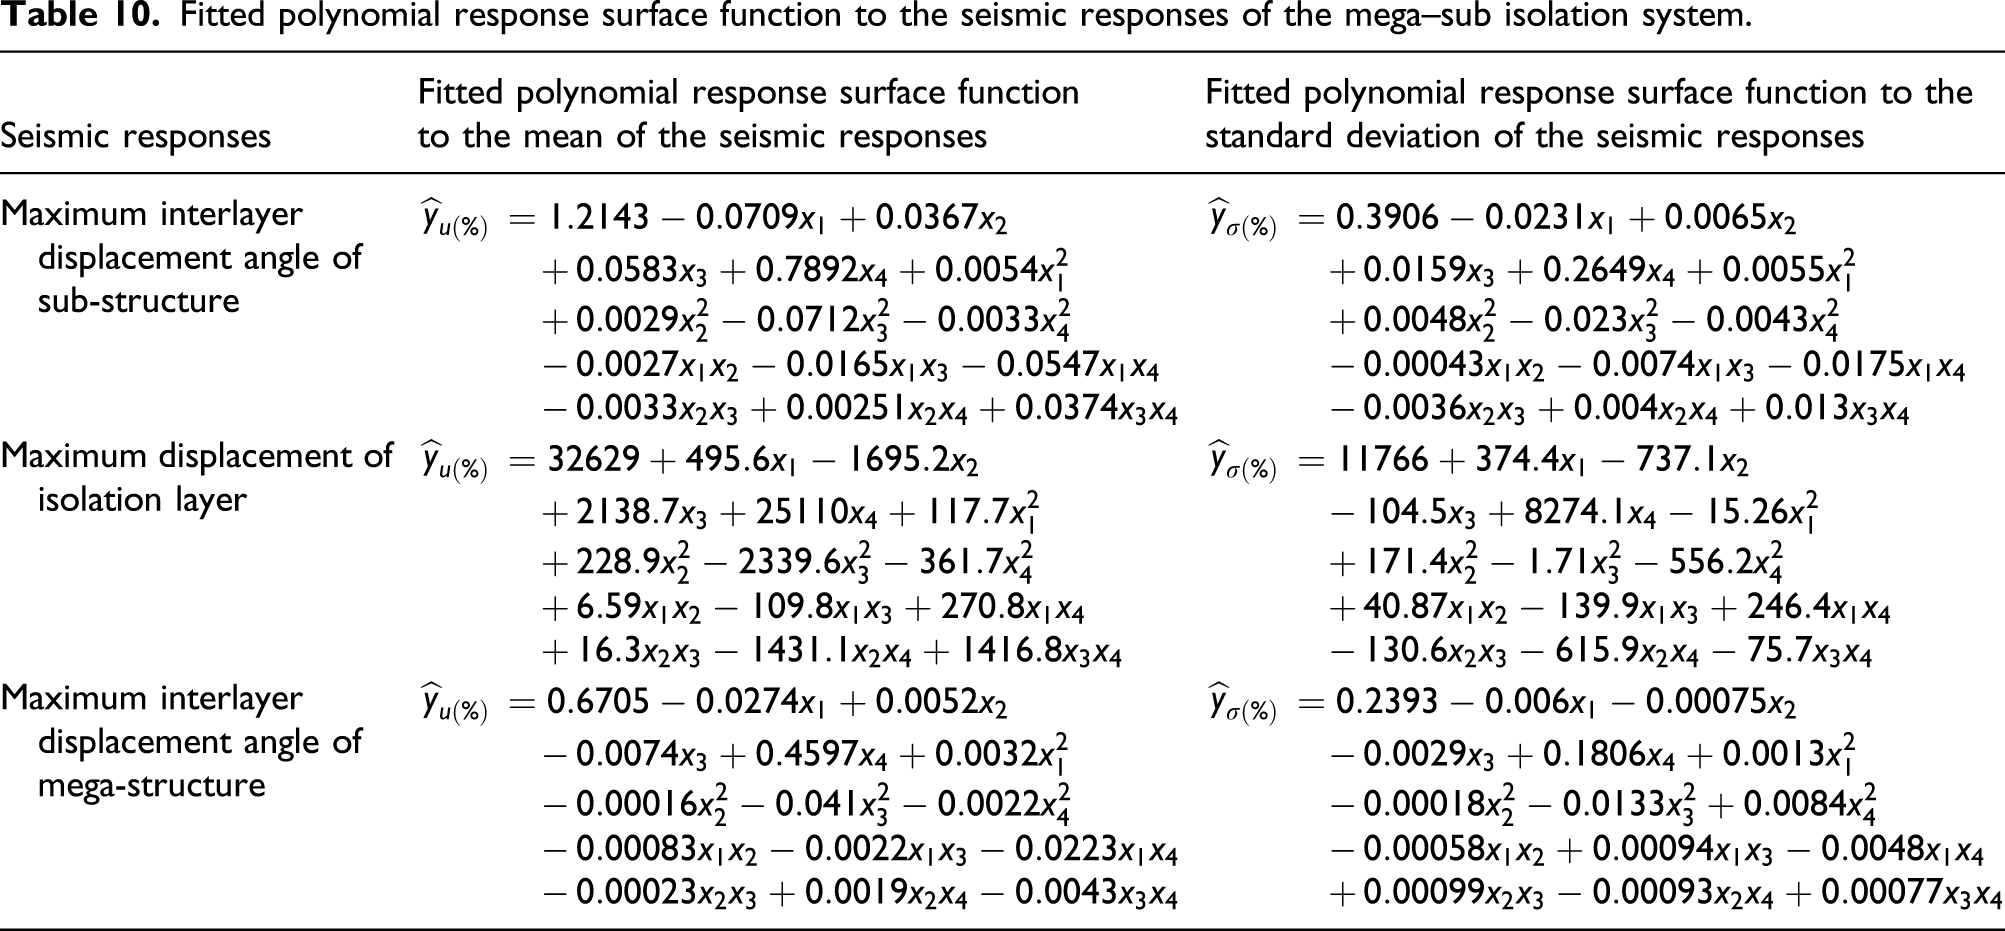
Fitted polynomial response surface function to the seismic responses of the mega–sub isolation system.
Response surface fitting coefficients.
Seismic fragility analysis
The mega-structure, sub-structure, and the isolation layer are assumed as in series, and the destruction of any one of these three parts will cause the overall destruction of the structure. Hence, the overall destruction of the mega–sub isolation system can be expressed as follows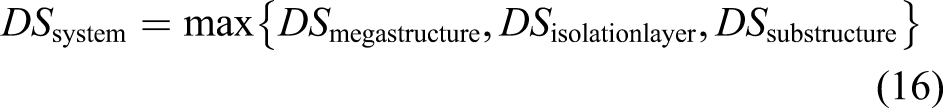
Combined with the response surface model, the probability of the structural response y exceeding the limit value LS
i
under different IM can be obtained by 10,000 Monte Carlo simulations, which is shown as follows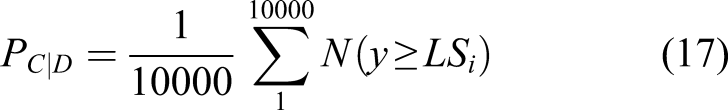
The fragility curves of the mega-structure, sub-structure, and isolation layer in the mega–sub isolation system are shown in Figure 10, where the Y-axis represents the exceedance probability. The fragility curves of the mega-structure and sub-structure gradually become flat when the damage state changes from slight damage to collapse, and as the damage level increases, the exceedance probability of the mega-structure tends to zero. This means that the exceedance probabilities of both the mega-structure and sub-structure decrease with the damage state changing from slight damage to collapse under the same intensity of ground motion. For instance, in Figure 10(a), when PGD is taken as 0.2, the exceedance probability of the mega-structure is about 50%; while in Figure 10(b), when PGD is taken as 0.2, the exceedance probability of the mega-structure is about 10%. This indicates that under the same intensity of ground motion, the probability of the mega-structure reaching the slight damage is larger than that reaching the moderate damage. Fragility curves for mega–sub isolation system: (a) slight damage, (b) moderate damage, (c) extensive damage, and (d) collapse damage.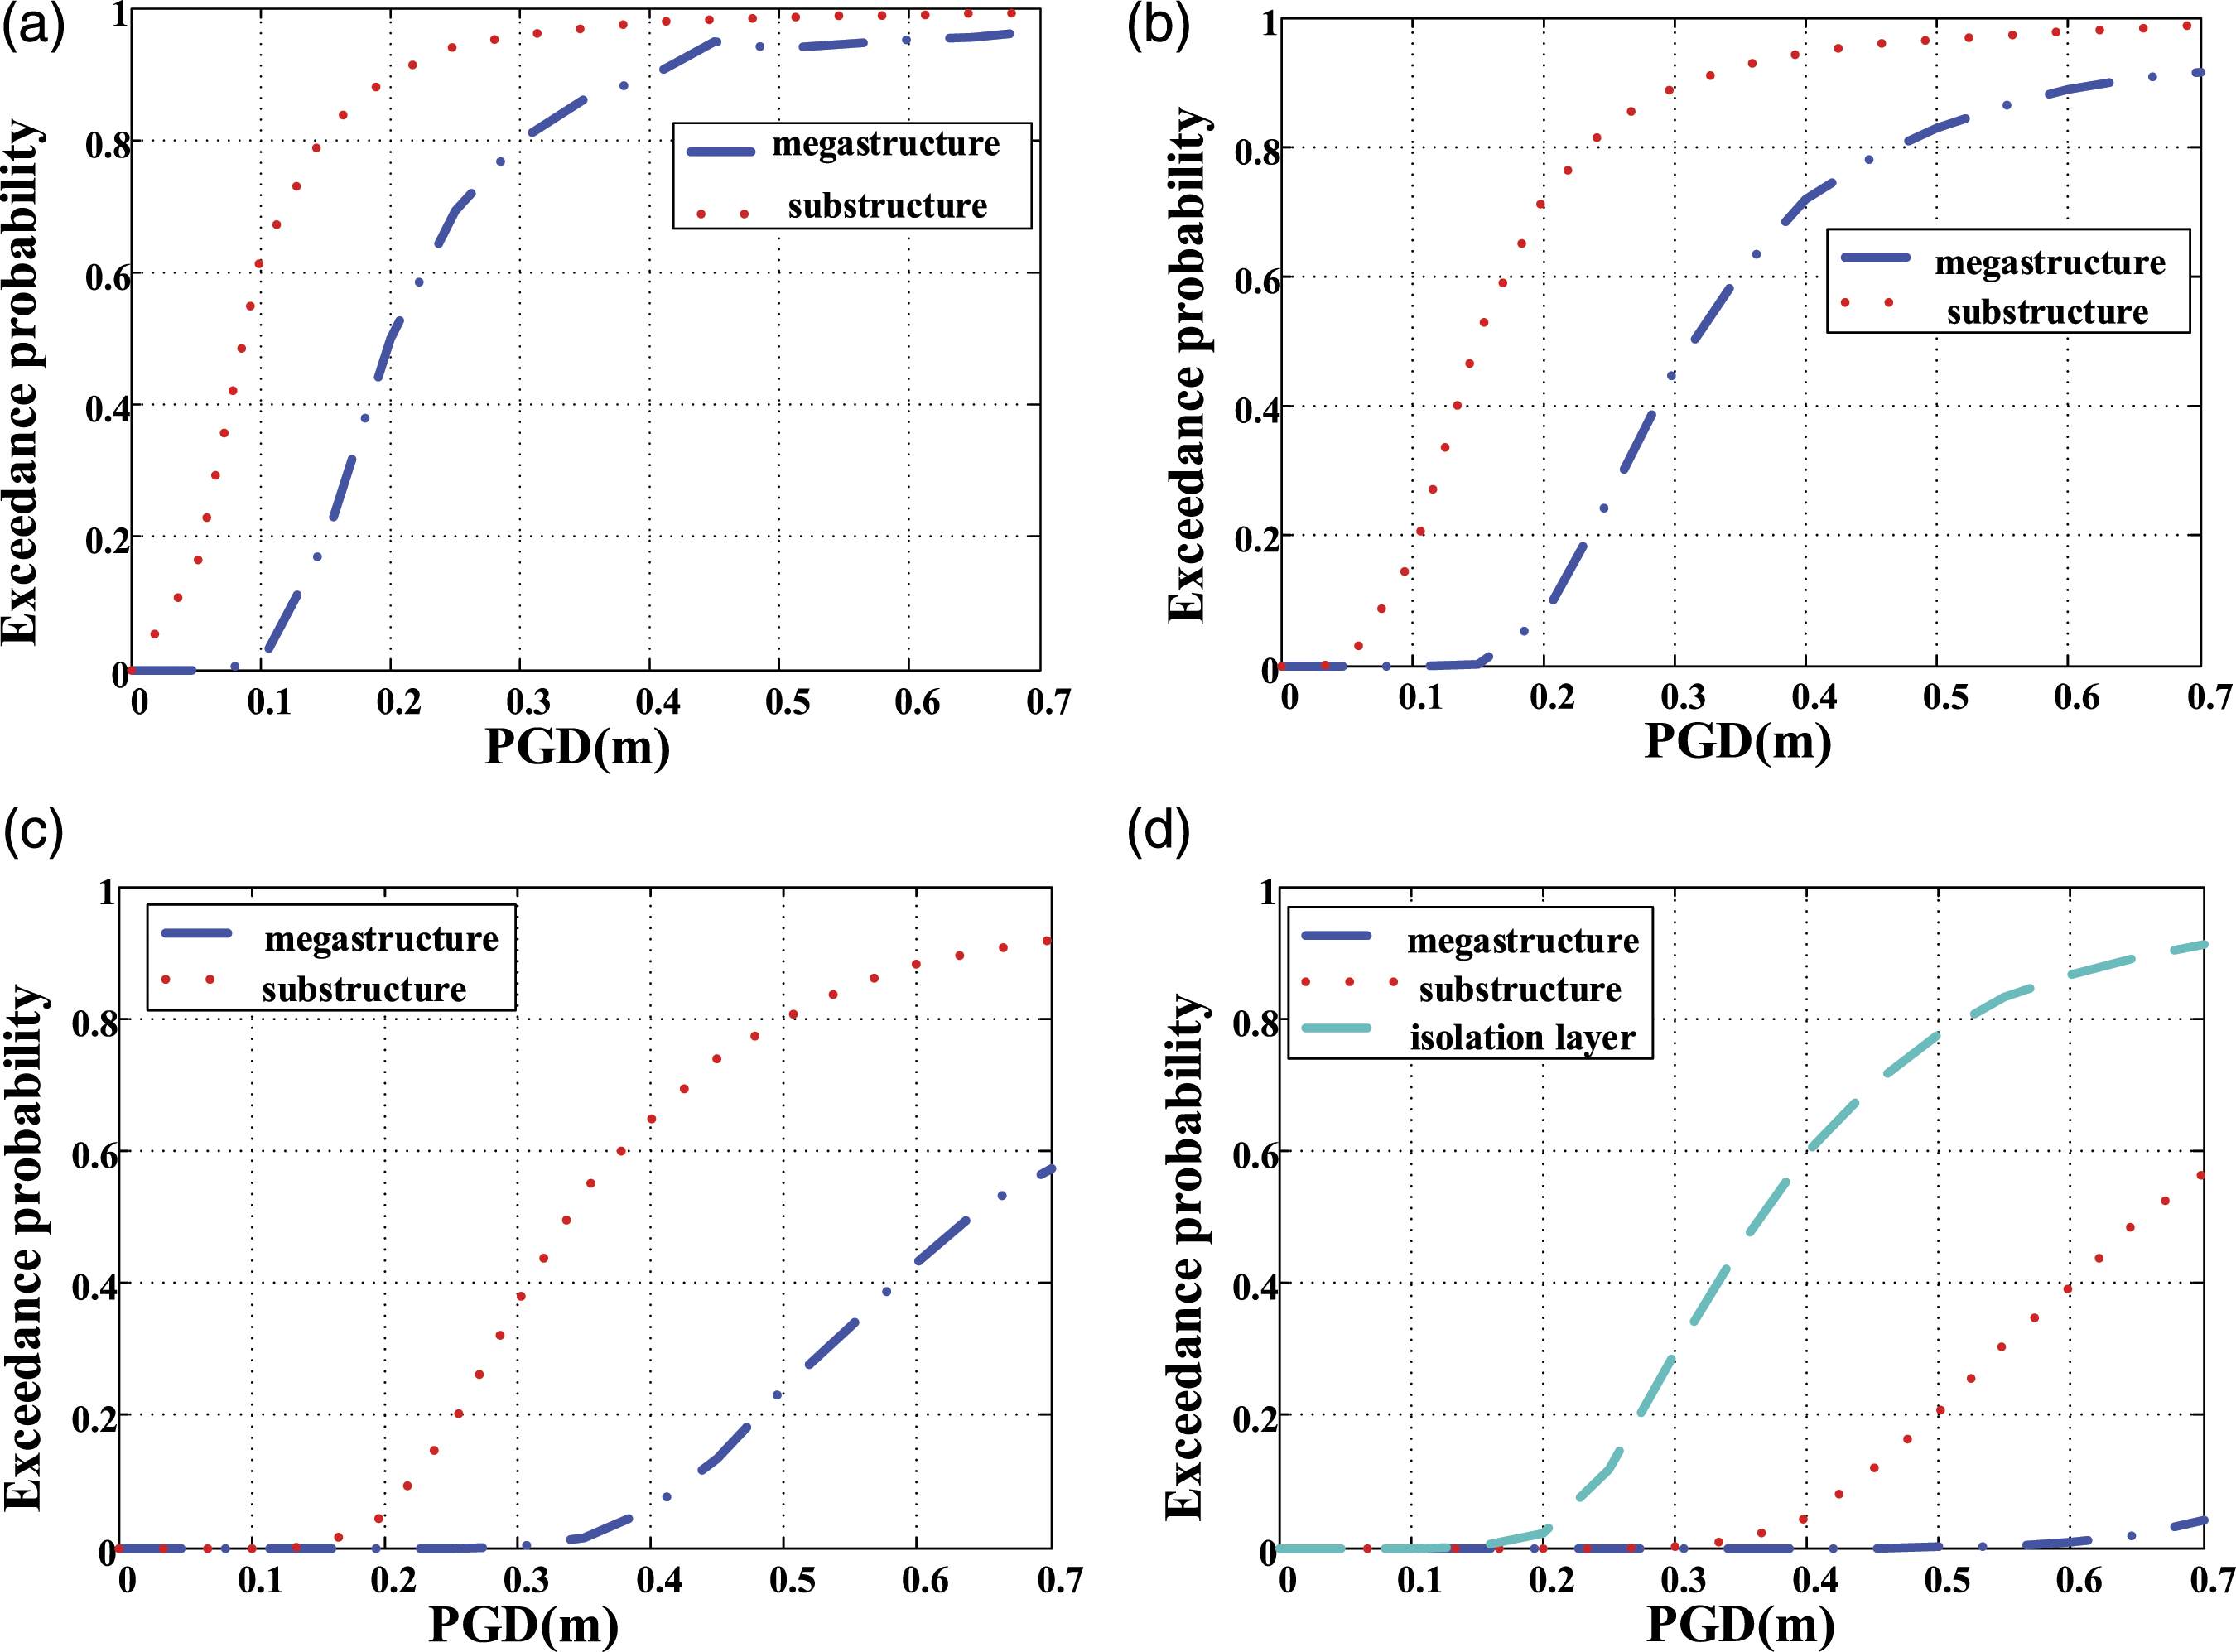
The exceedance probability of the sub-structure is higher than that of the mega-structure under the four levels of damage state. Figure 10(d) shows that the exceedance probability of the isolation layer is greater than that of the sub-structure in the collapse damage state. Therefore, in the slight damage state, moderate damage state, and extensive damage state, the failure of the structural system is governed by the failure of the sub-structure; while in the collapse damage state, the failure of the structural system is controlled by the failure of the isolation layer.
Conclusions
This article studies the failure modes of the mega–sub isolation system under near-fault ground motions employing the seismic fragility analysis. 90 suites of near-fault ground motions collected from 23 earthquakes were adopted to investigate the ground motion intensity indices applicable for the mega–sub isolation system. The physical parameters suitable for the mega–sub isolation system were obtained by analyzing the sensitivities of the variances of mega-structure story drifts, sub-structure absolute accelerations, and isolation layer drifts to random parameters. Considering the uncertainties of ground motions characteristics and structural parameters, the seismic fragility of the mega–sub isolation system was analyzed based on the response surface method under near-fault ground motion. The following conclusions can be obtained: In contrast to the peak ground acceleration and peak ground velocity, displacement-related intensity indices show high correlation to the peak responses of mega–sub isolation system. Therefore, the displacement-related intensity indices, especially the peak displacement, are more reasonable to be used for selecting and adjusting ground motion inputs for time history analysis of mega–sub isolation system subjected to near-fault ground motions. The sensitivities of the responses of mega–sub isolation system to the physical parameters are different. The responses of mega–sub isolation system are more sensitive to sub-structure story mass, stiffness, and damping ratio of the isolation layer and less sensitive to sub-structure story stiffness. Therefore, the mass ratio (which is related to the sub-structure story mass) and the post-yield stiffness of the isolation layer (which is related to the stiffness and damping ratio of the isolation layers) are selected as the structural random parameters in the seismic fragility analysis. The failure probability of the sub-structure is greater than that of the mega-structure under near-fault ground motion. In the collapse damage state, the failure probability of the isolation layer is greater than that of the sub-structure. Therefore, in the slight damage state, moderate damage state, and extensive damage state, the failure of the structural system is governed by the failure of the sub-structure. In the collapse damage state, the failure of the structural system is controlled by the failure of the isolation layer.
This study would be a further contribution to the analysis of mega–sub isolation system under near-fault ground motions, and the results of the fragility analysis can provide a reference for future design of mega–sub isolation system under near-fault ground motions.
Footnotes
Acknowledgements
Declaration of conflicting interests
The author(s) declared no potential conflicts of interest with respect to the research, authorship, and/or publication of this article.
Funding
The author(s) disclosed receipt of the following financial support for the research, authorship, and/or publication of this article: This work was primarily supported by the National Key Research and Development Program of China (Grant No. 2019YFC1511003, 2019YFE0112500) and the National Natural Science Foundation of China (Grant No. 51978185, 51608491).