
Abstract
This article proposes a new type of basalt fiber–reinforced polymer (BFRP) bar–reinforced seawater sea sand glass aggregate concrete (SSGC) beam with broad application prospects in ocean engineering. Crushed tempered glasses were utilized as coarse aggregates in the concrete mixture to realize the efficient and harmless recycling of waste glass. First, the bond behaviors between the BFRP bars and SSGC with different glass aggregate replacement ratios were investigated. Then, four-point bending tests were conducted to investigate the flexural performance of the SSGC beams completely reinforced with BFRP bars. Based on this, the tested flexural strengths were compared with the calculated strengths to evaluate whether the existing specifications were still applicable to the design of the BFRP bar–reinforced SSGC beams. Test results showed that although the compressive strength of the SSGC gradually decreased with increased glass aggregate content, the bond performance between BFRP bars and SSGC did not follow the same degradation pattern. There were no obvious differences in the form of the bond–slip curves between BFRP bars and different types of SSGC. With increasing glass aggregate content, the ultimate bearing capacity and energy consumption of BFRP bar–reinforced SSGC beams decreased. All calculated ultimate flexural capacities were higher than the experimental values, which shows that the application of existing specifications to BFRP bar–reinforced SSGC beams needs to be studied further.
Keywords
Introduction
Due to properties such as transparency, corrosion resistance, and chemical stability, glass products have been widely used in the beverage, housing and construction, and automotive industries to bring convenience to everyday life. However, due to the fragile properties of glass products, a huge amount of glass waste is generated every year around the world. For example, it is reported that more than 10 million tons of nonindustrial waste glass is produced annually in China (Mofcom, 2018), and one million tons of waste glass are collected annually in Australia for future sorting and recycling process (Arulrajah et al., 2017). In theory, waste glasses can be 100% reused as raw materials to produce new glass products, such as glass fibers and beverage bottles. However, for various reasons, such as nonstandard waste classification and the challenge of the segregation of waste glasses from mixed waste, profit from glass recycling is limited. In developed countries and areas with well-defined waste classification systems, the collection rate of waste glasses is more than 85% (Zhang, 2019). However, in countries and regions that have not established good waste separation and collection systems, waste glasses are not often recycled. For example, according to statistics in 2017, more than 50% of China’s waste glass was disposed of in the landfill, which has led to serious land occupation and secondary environmental pollution problems (Mofcom, 2018).
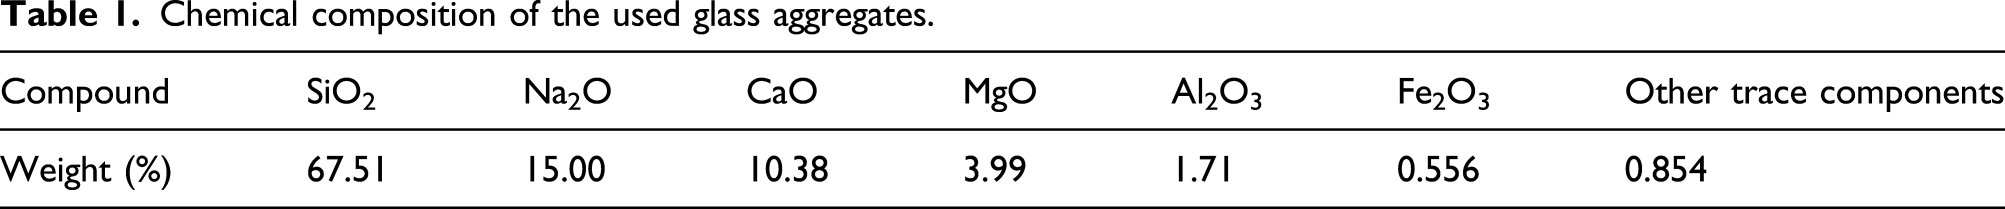
Referring to the preparation technology of recycled aggregate concrete (Huang et al., 2018; Xiao et al., 2019; Younis et al., 2020; Zhang et al., 2019b), crushed waste glasses are able to be used as aggregates (fine aggregates in most cases) to prepare concrete (Adaway and Wang, 2015; Lu et al., 2019; Kou and Poon, 2009; Shi-Cong and Chi-Sun, 2013; Yang et al., 2019; Zeng et al., 2020b). Tamanna et al. (2020) investigated the suitability of using recycled fine glass (3 mm) in concrete. The concrete was produced by replacing natural river sand with 20%, 40%, and 60% recycled glass sand. The test results showed a significant improvement in the strength of the concrete, and the fine glass sand can be a good substitute for natural sand, and, therefore, effectively used in industrial applications. At present, many scholars have published review studies and established a systematic body of knowledge on this topic (Guo et al., 2020; Kazmi et al., 2020; Liu et al., 2019). In general, crushed glass wastes are more favorable for use in the form of fine aggregates with a particle size of less than 3 mm. This is because crushed glass wastes contain approximately 70% amorphous silica, and it is prone to cause unexpected concrete volume expansion due to the alkali–silica reaction (ASR) when they are used as coarse aggregates with large particles. However, some scholars have pointed out that by incorporating a suitable pozzolanic material such as fly ash, ground blast furnace slag, or metakaolin in the concrete mix at appropriate ratios, the possibility of the ASR can be significantly reduced (Kou and Poon, 2009; Shi-Cong and Chi-Sun, 2013). In addition, when low-alkali cement is used as the adhesive, the probability of ASR is also low. These studies lay the foundation for filling waste glass into concrete in the form of coarse aggregates. Currently, glass wastes are mainly limited for use in road pavement or as an additive to different soils for subgrade improvement in civil engineering, while practical applications of using recycled glass in structural concrete are limited (Mohammadinia et al., 2019).
Meanwhile, in recent years, in economically developed coastal areas where infrastructure construction is in great demand, natural fine aggregates, that is, river sand, which is an important part of concrete, have become increasingly scarce. People have no choice but to frequently dig sea sands for use. However, there are excessive chloride ions in sea sands, and it may cause accelerated corrosion of internal steel bars. Therefore, sea sand must be strictly desalted prior to use. Although the maximum allowable chloride ion content is clearly stated in the specifications, the illegal use of sea sand still occurs occasionally, which poses a great hidden danger to structure durability. Over the past decade, based on the common understanding of the excellent resistance of fiber-reinforced polymer (FRP) materials to chloride ions, including the newly developed polyurethane-based FRP composites (Al-Jelawy, 2013; Al-Jelawy and Mackie, 2020, 2021), research on the combined application of FRP and sea sand concrete has become increasingly interesting. When FRP composites are used as reinforcements, not only can natural sea sand be used directly, but even in some special circumstances (e.g., the remote island environment), seawater can be used as the mixing agent to prepare concrete (Younis et al., 2020). At present, research scholars have proposed various forms of FRP sea sand concrete composite members, such as seawater sea sand concrete (SWSSC)-filled FRP tube columns (Chen et al., 2017; Li et al., 2016, 2018a, 2018b, 2020; Zeng et al., 2020a), the FRP bar–reinforced SWSSC beams (Jiang et al., 2019), slabs (Gao et al., 2020), walls (Zhang et al., 2019a), and so on. In addition, the durability of FRP bars and profiles in the SWSSC environment have also been tested and evaluated (Dong et al., 2018a, 2018b; Guo et al., 2018; Wang et al., 2017a, 2017b, 2018). Recently, FRP reinforced seawater-mixed concrete has been successfully used in real applications, such as the marine dock, residential home, bulkhead cap, and culvert (Nanni, 2020). Besides, it is known that the development of basalt FRP (BFRP) is relatively late, and research on the combined application of BFRPs and SWSSC has significantly increased (Hua et al., 2020).
It should be pointed out that the amount of waste glass is huge in economically developed coastal areas with scarce river sand resources (Ling et al., 2013; Shi-Cong and Chi-Sun, 2013). Moreover, the land resources in these areas are precious, and the cost of landfill disposal is high. For this reason, while using sea sand to replace river sand, waste glass can also be crushed and be used as coarse aggregates to prepare a new type of seawater sea sand glass aggregate concrete (SSGC). To the best of the authors’ knowledge, there are very few studies on the use of seawater sea sand recycled glass aggregate concrete (RGAC) as structural components. Zeng et al. (2020b) had experimentally tested the axial compressive behavior of FRP-confined recycled glass aggregate concrete. The cement was an ordinary Portland cement, the sand was natural river sand, and the mixing water was free water. Both fine glass aggregates and coarse glass aggregates were used in the study. The test results showed that the compressive performance of FRP-confined RGAC was comparable to that of FRP-confined ordinary concrete. In addition, it was emphasized that with the participation of the FRP confinement, the detrimental volume expansion associated with the ASR can be favorably transformed, namely, the prestress of the FRP can provide additional confinement.
In light of the background and literature review presented above, this study experimentally investigated the bond and flexural behavior of an SSGC beam completely reinforced with BFRP bars. It is important to note that to reduce the possibility of the potential ASR, the low basicity sulfate cement and fly ash with a weight ratio of 0.7:0.3 were adopted as the cement adhesive in the SSGC mixture. It is the hope that while alleviating the shortage of river sand resources by using the sea sand and improving the structural durability by using the nonmetal BFRP bars as reinforcements, the waste glass can also be treated innocuously and used as glass coarse aggregates. The experimental program involves 18 direct pull-out bond specimens and four beam specimens. Test variables are concrete types (varying the content of glass aggregates) and tensile reinforcement ratios. The bond performance (e.g., bond stress–slip curves, ultimate bond stress, etc.) and flexural responses (e.g., failure modes, load–displacement curves, and crack distributions) are reported and analyzed. Finally, based on the tested and calculated data, the applicability of existing specifications for the design of BFRP bar–reinforced SSGC beams was analyzed and evaluated. This study lays the foundation for future applications of BFRP bar–reinforced SSGC members in ocean engineering.
Materials
Coarse glass aggregates
As shown in Figure 1, the prepared coarse glass aggregates were discarded tempered glasses and collected from a decoration construction site in Nanjing, Jiangsu, China. The coarse glass aggregates were prepared by artificial crushing. According to the Chinese specification JTG E42-2005 (E42-2005, 2005), the tested particle size distribution was 2.36–9.50 mm, and the detailed screening test results are shown in Figure 2(b). It was found that the particle size distribution meets the requirement for use as concrete aggregates but mainly takes the shape of a thin slice. Coarse glass aggregates and particle size distribution: (a) prepared glass aggregates and (b) screening test results. Raw materials for concrete preparation: (a) low basicity sulfate cement; (b) fly ash; (c) sea sand; and (d) gravel.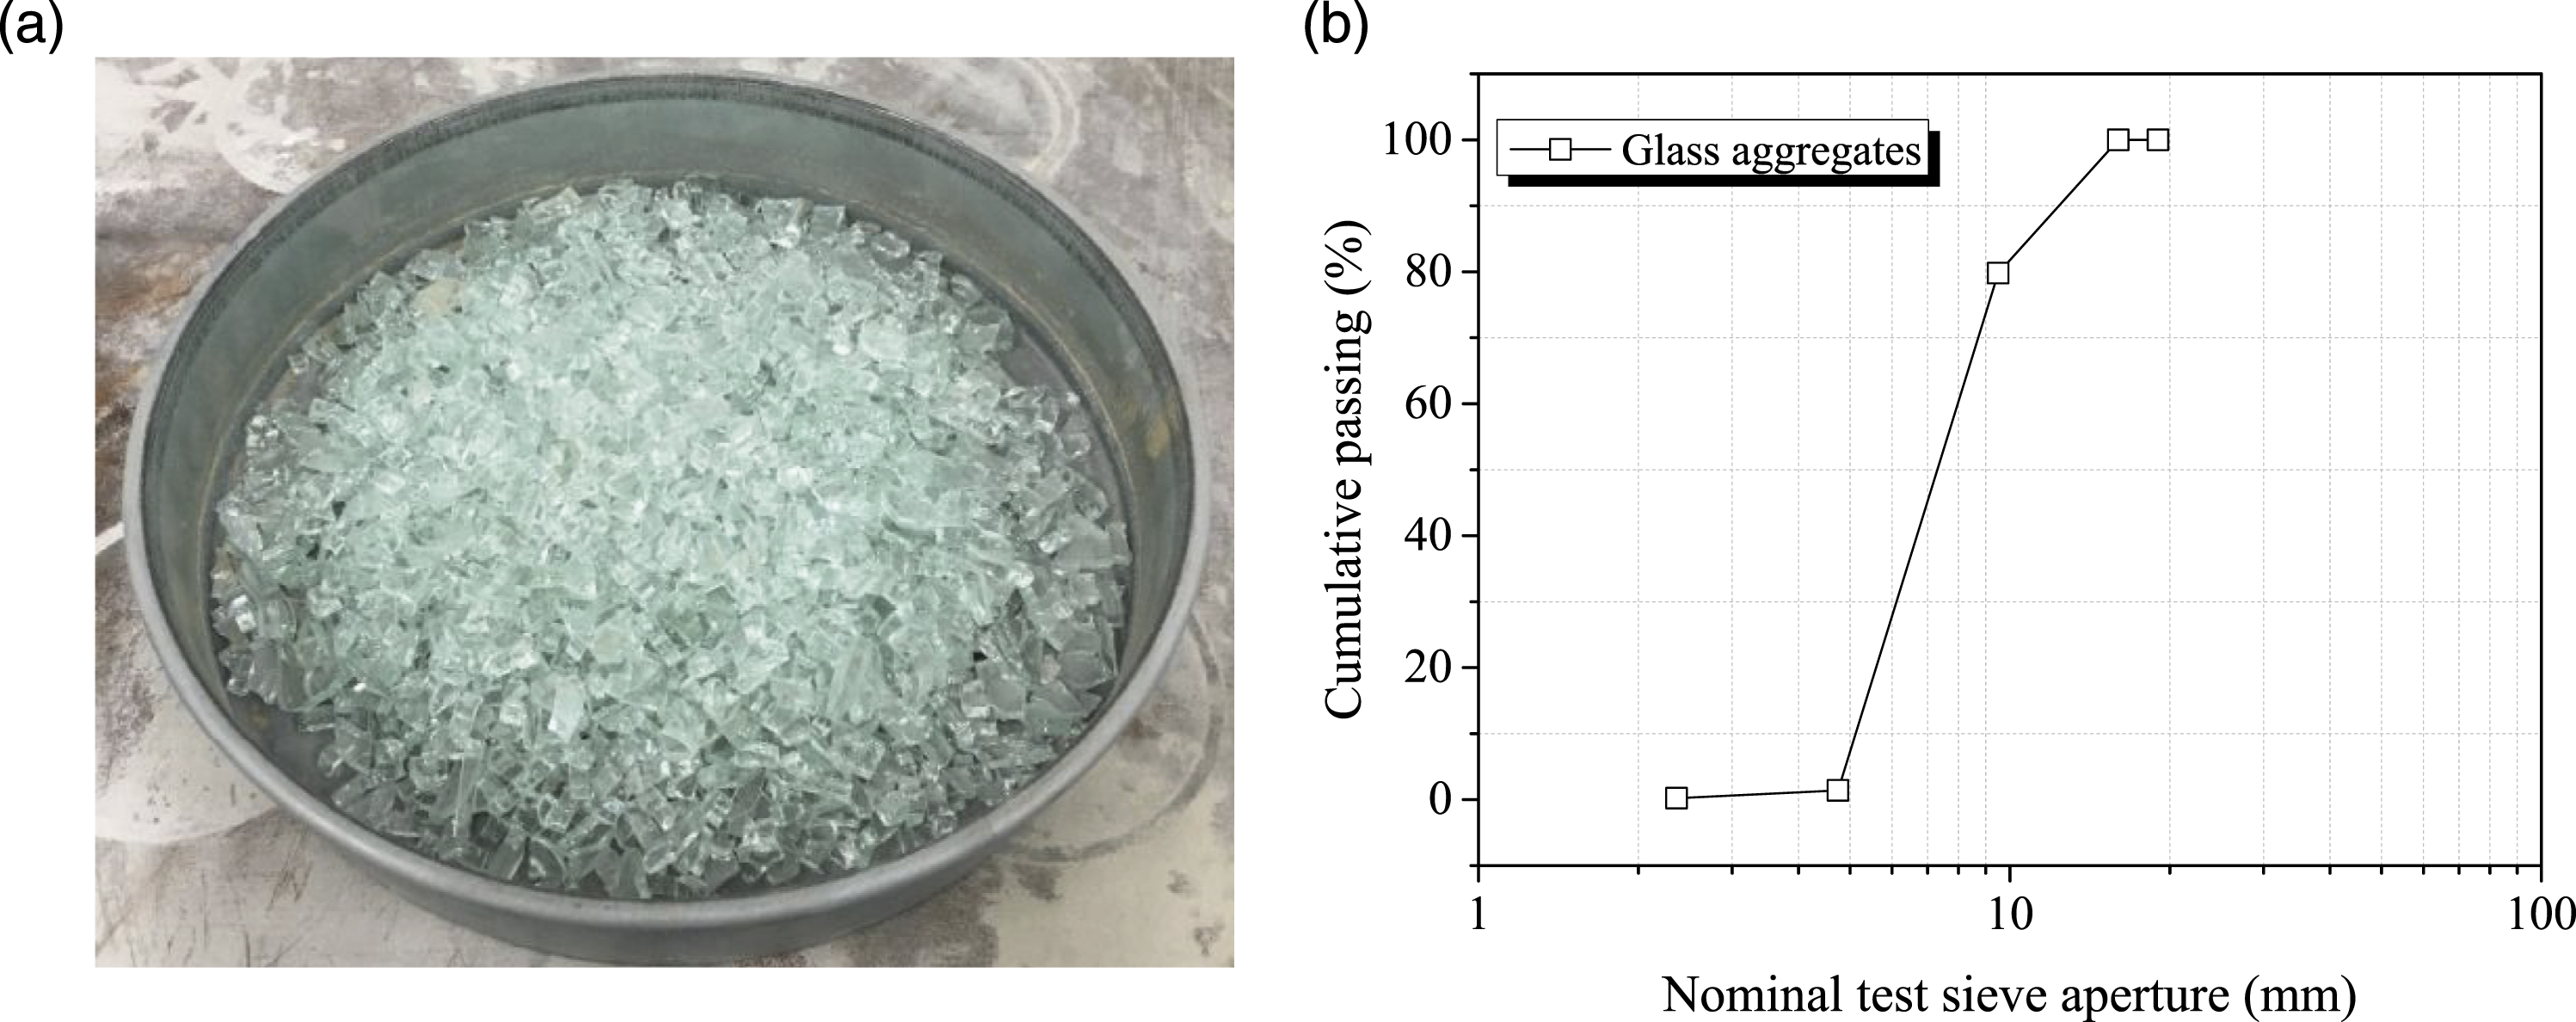


Chemical composition of the used glass aggregates.
Raw materials for concrete preparation
Performance report provided by the manufacturer for the L.SAC 42.5 cement.

BFRP bars
As shown in Figure 3, two types of straight basalt fiber–reinforced polymer (BFRP) bars with nominal diameters of 10 mm and 13 mm and one type of bent BFRP stirrup with a nominal diameter of 8 mm were adopted in this study. The resin matrix was vinyl ester polymer, and the fiber volume fraction was 65%. According to ASTM D7205/D7205M (D7205M-06, 2011), the tested ultimate tensile strengths of the 13 mm and 10 mm straight BFRP bars were 1142 MPa and 1141 MPa, respectively. The corresponding elastic moduli were 48.6 GPa and 47.6 GPa, respectively. The rib depth of the 13 mm and 10 mm BFRP bars were 0.20 mm and 0.18 mm, respectively. The adopted BFRP stirrups were produced in the same batch and were bent before the resin cured. Adopted basalt fiber–reinforced polymer bars.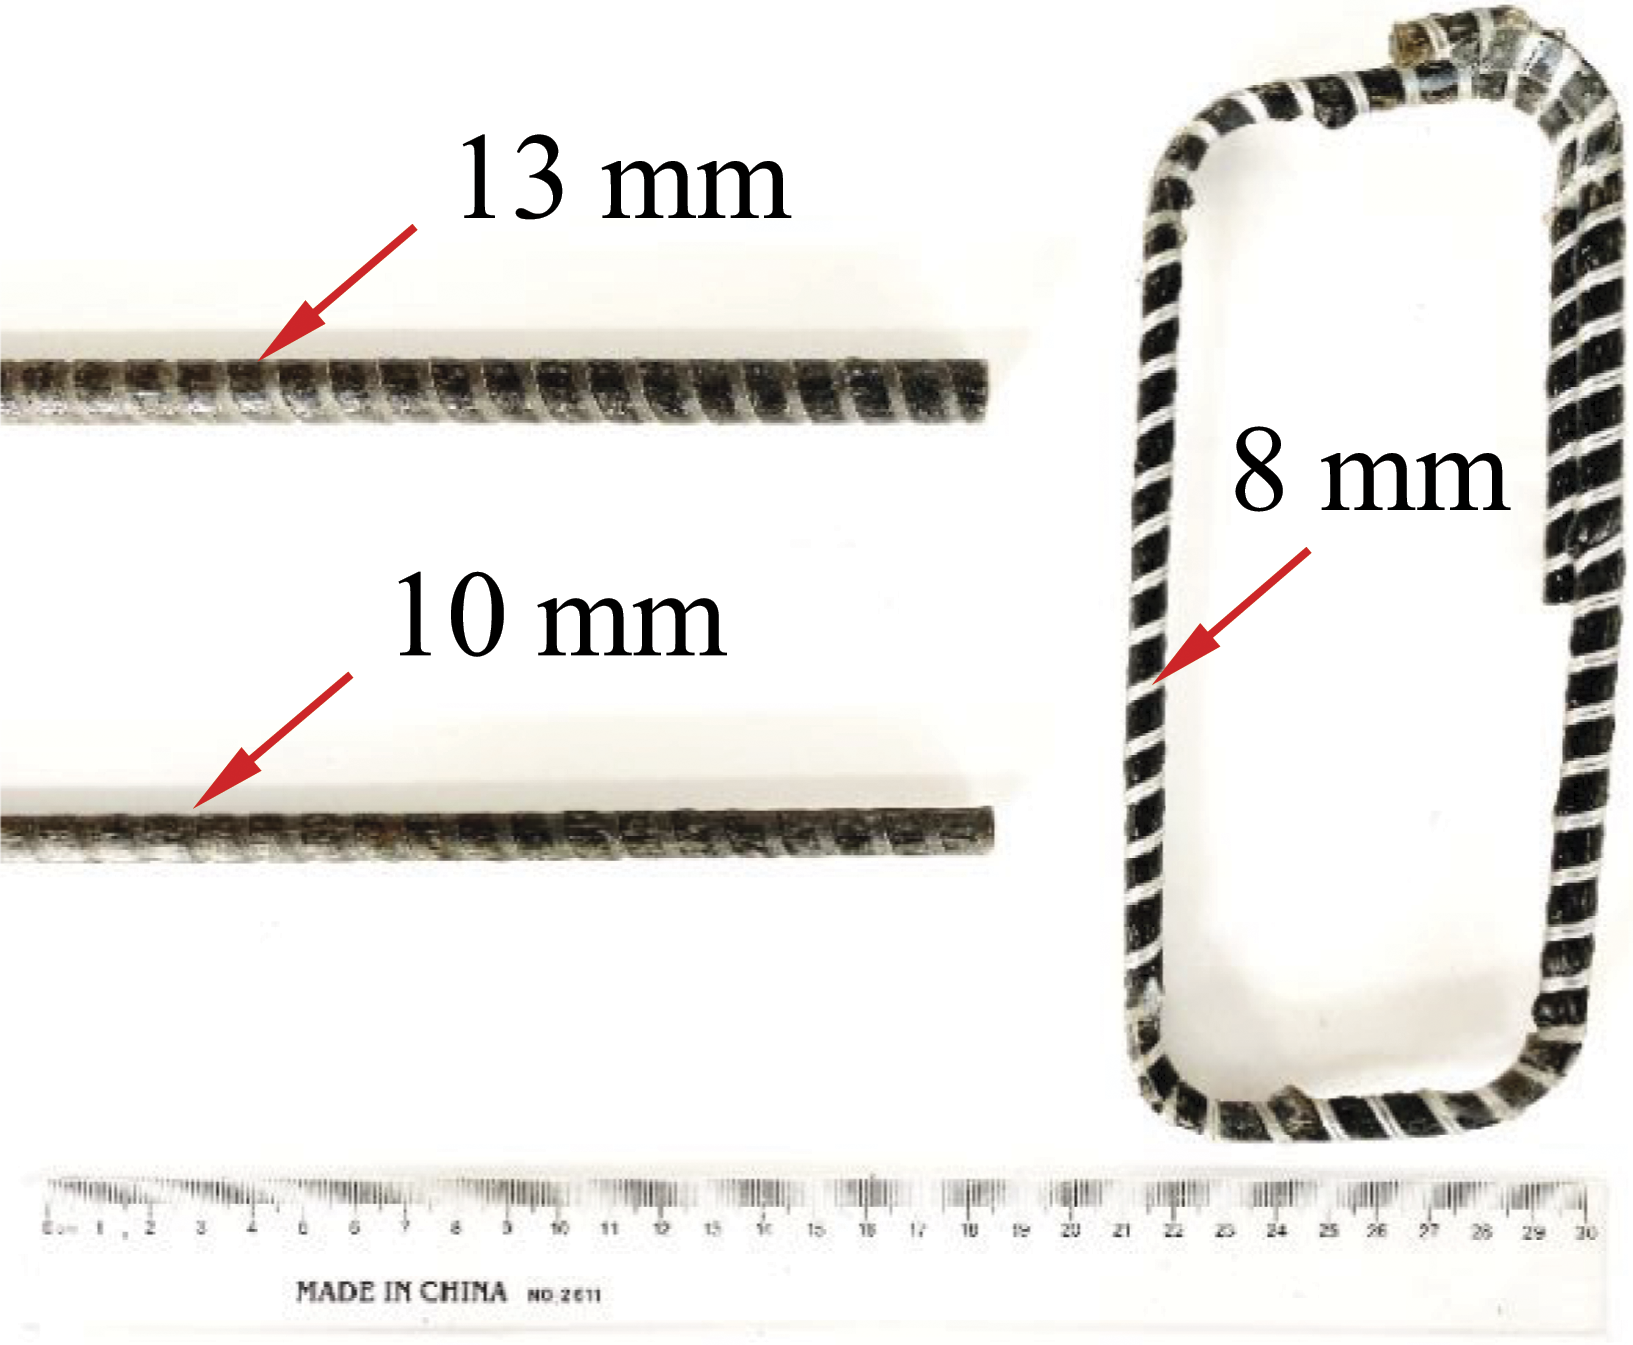
Test program
Bond test specimens and the bond testing program
Mix proportions of the concrete and the tested uniaxial compression strength.
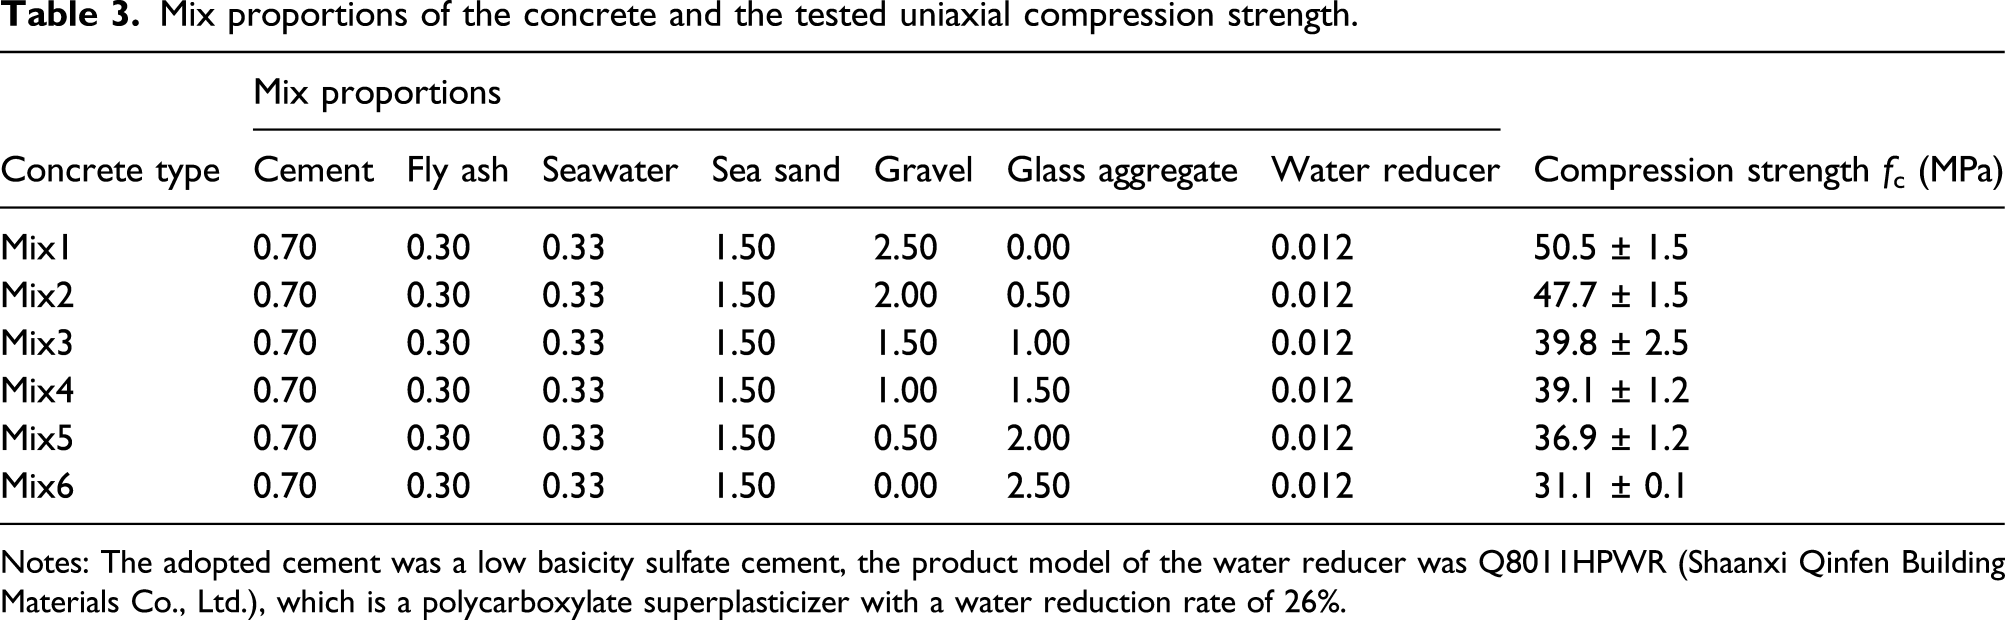
Notes: The adopted cement was a low basicity sulfate cement, the product model of the water reducer was Q8011HPWR (Shaanxi Qinfen Building Materials Co., Ltd.), which is a polycarboxylate superplasticizer with a water reduction rate of 26%.
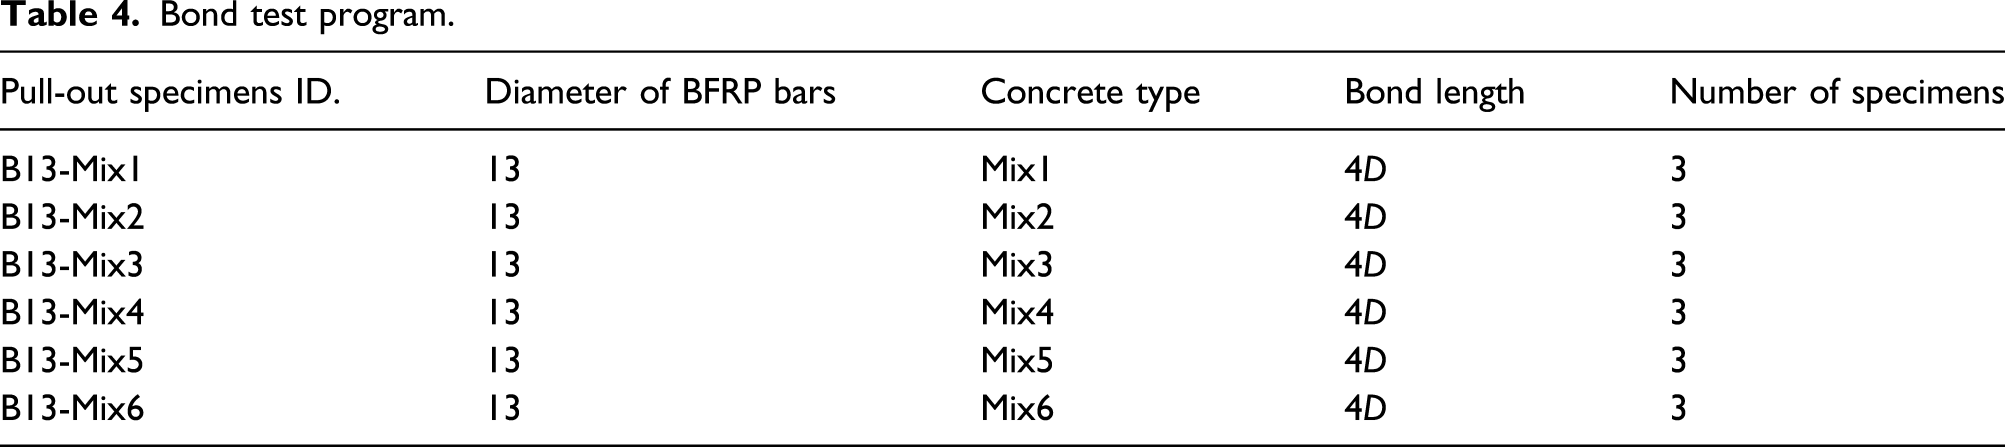
Bond test program.
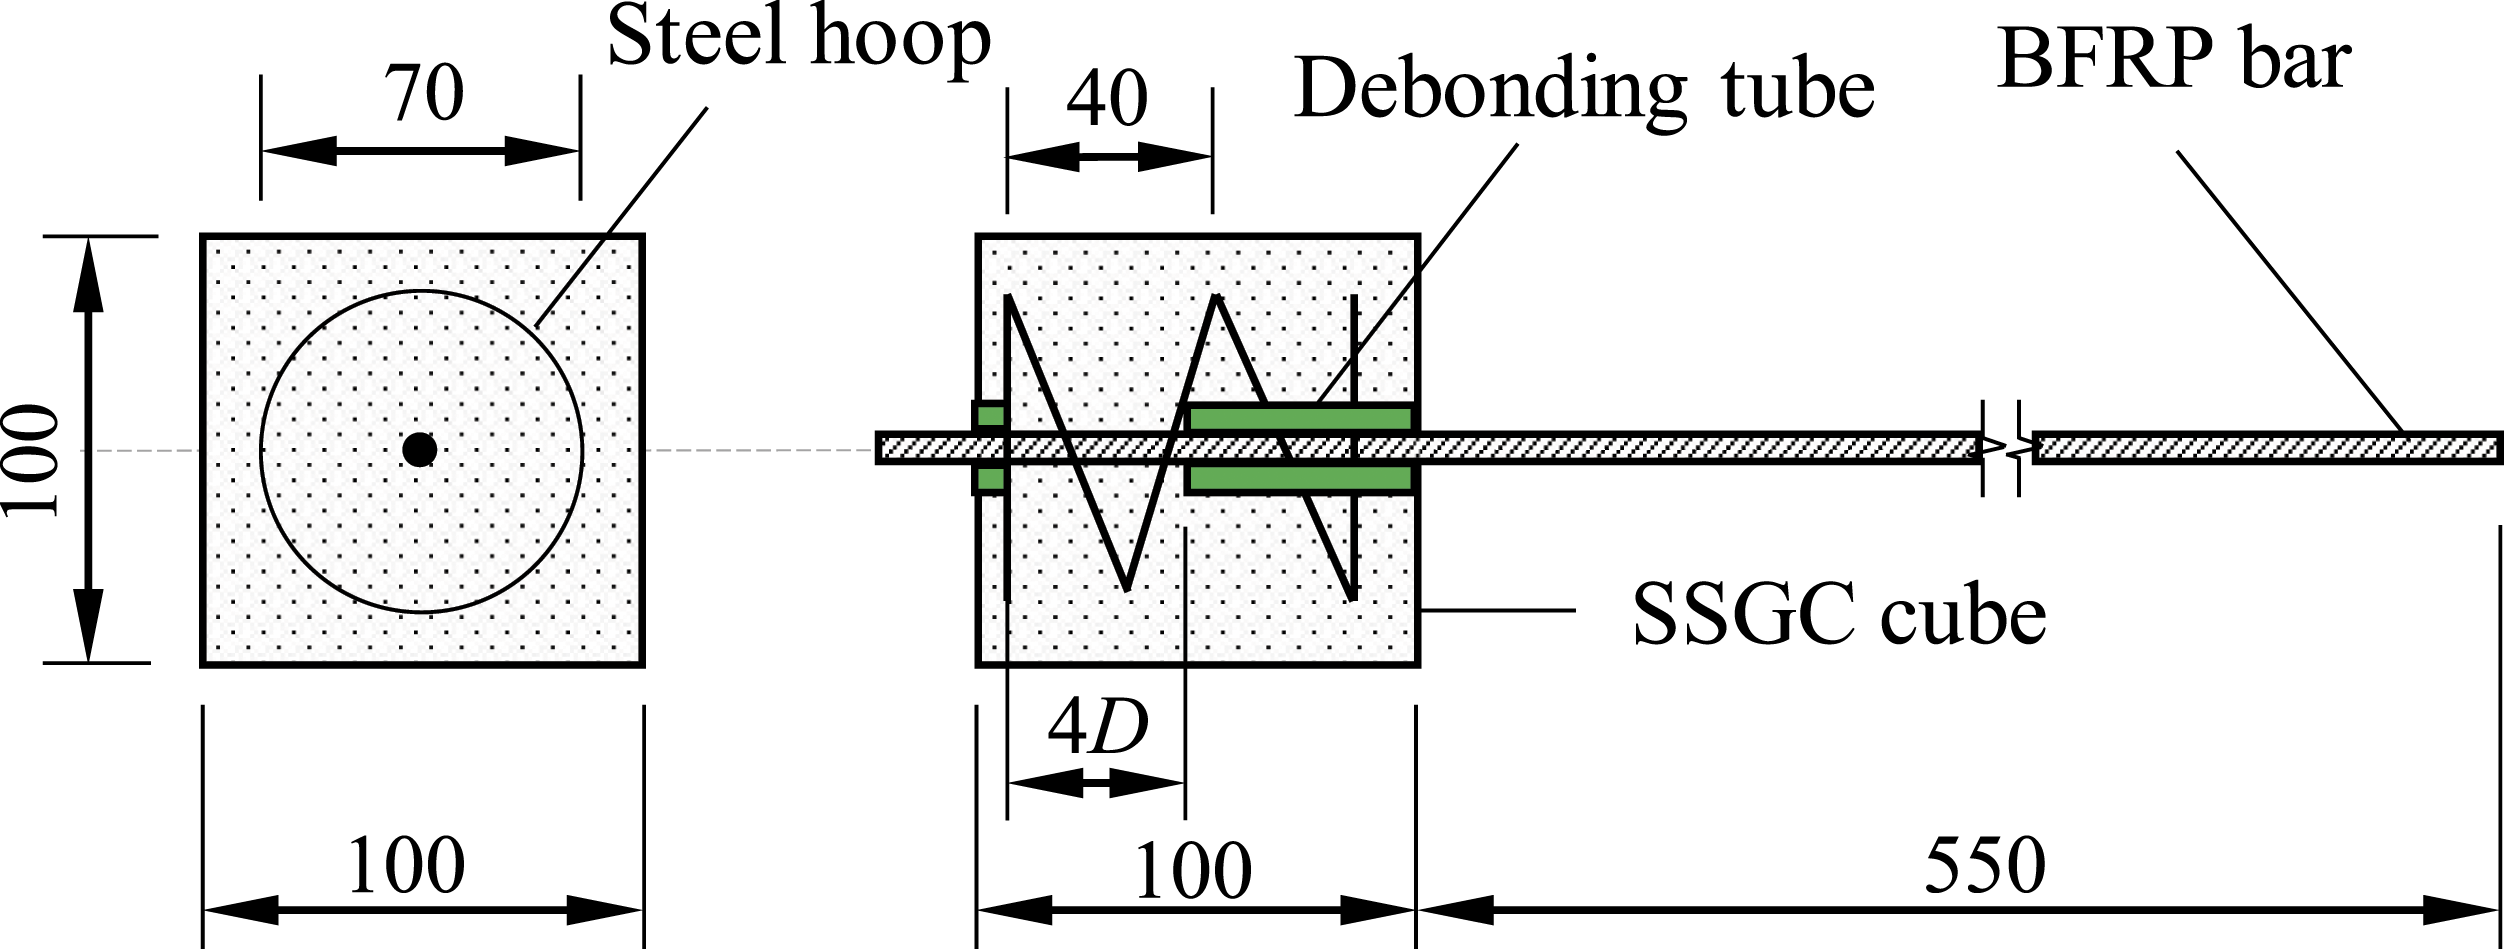
Dimensions of the pull-out specimens (Unit: mm).

Test setup of bond performance: (a) schematic diagram and (b) photograph during testing.
Beam specimens and the flexural test program
Beam specimens.

Notes: In the specimen’s number, “B10” and “B13” refer to the type of tensile BFRP bars, and “Mix2” and “Mix5” refer to the type of concrete.
Figure 6 shows the flexural test setup and layout of the instrumentation. The four beams were all tested with four-point bending over a simply supported clear span of 2100 mm and a 750 mm shear span. The load was applied in a displacement-control mode at a rate of 1.0 mm/min. Five LVDTs were set to measure the displacement at the mid-span, the two loading points, and the two end supports (to offset the end displacement). Strain gauges were attached to the tensile BFRP bars at the mid-span. All measurements, including load, displacement, and strain, were recorded by a TDS530 data acquisition system. Furthermore, as shown in Figure 6(b), to monitor the overall deformation fields of the beam synchronously, a three-dimensional (3D) digital image correlation (DIC) method was adopted. On the other side of the beam, the crack widths at the height of the tensile BFRP bars in the pure bending area were recorded by a digital crack width viewer. Test setup and instrumentation: (a) schematic diagram (unit: mm) and (b) photograph during testing.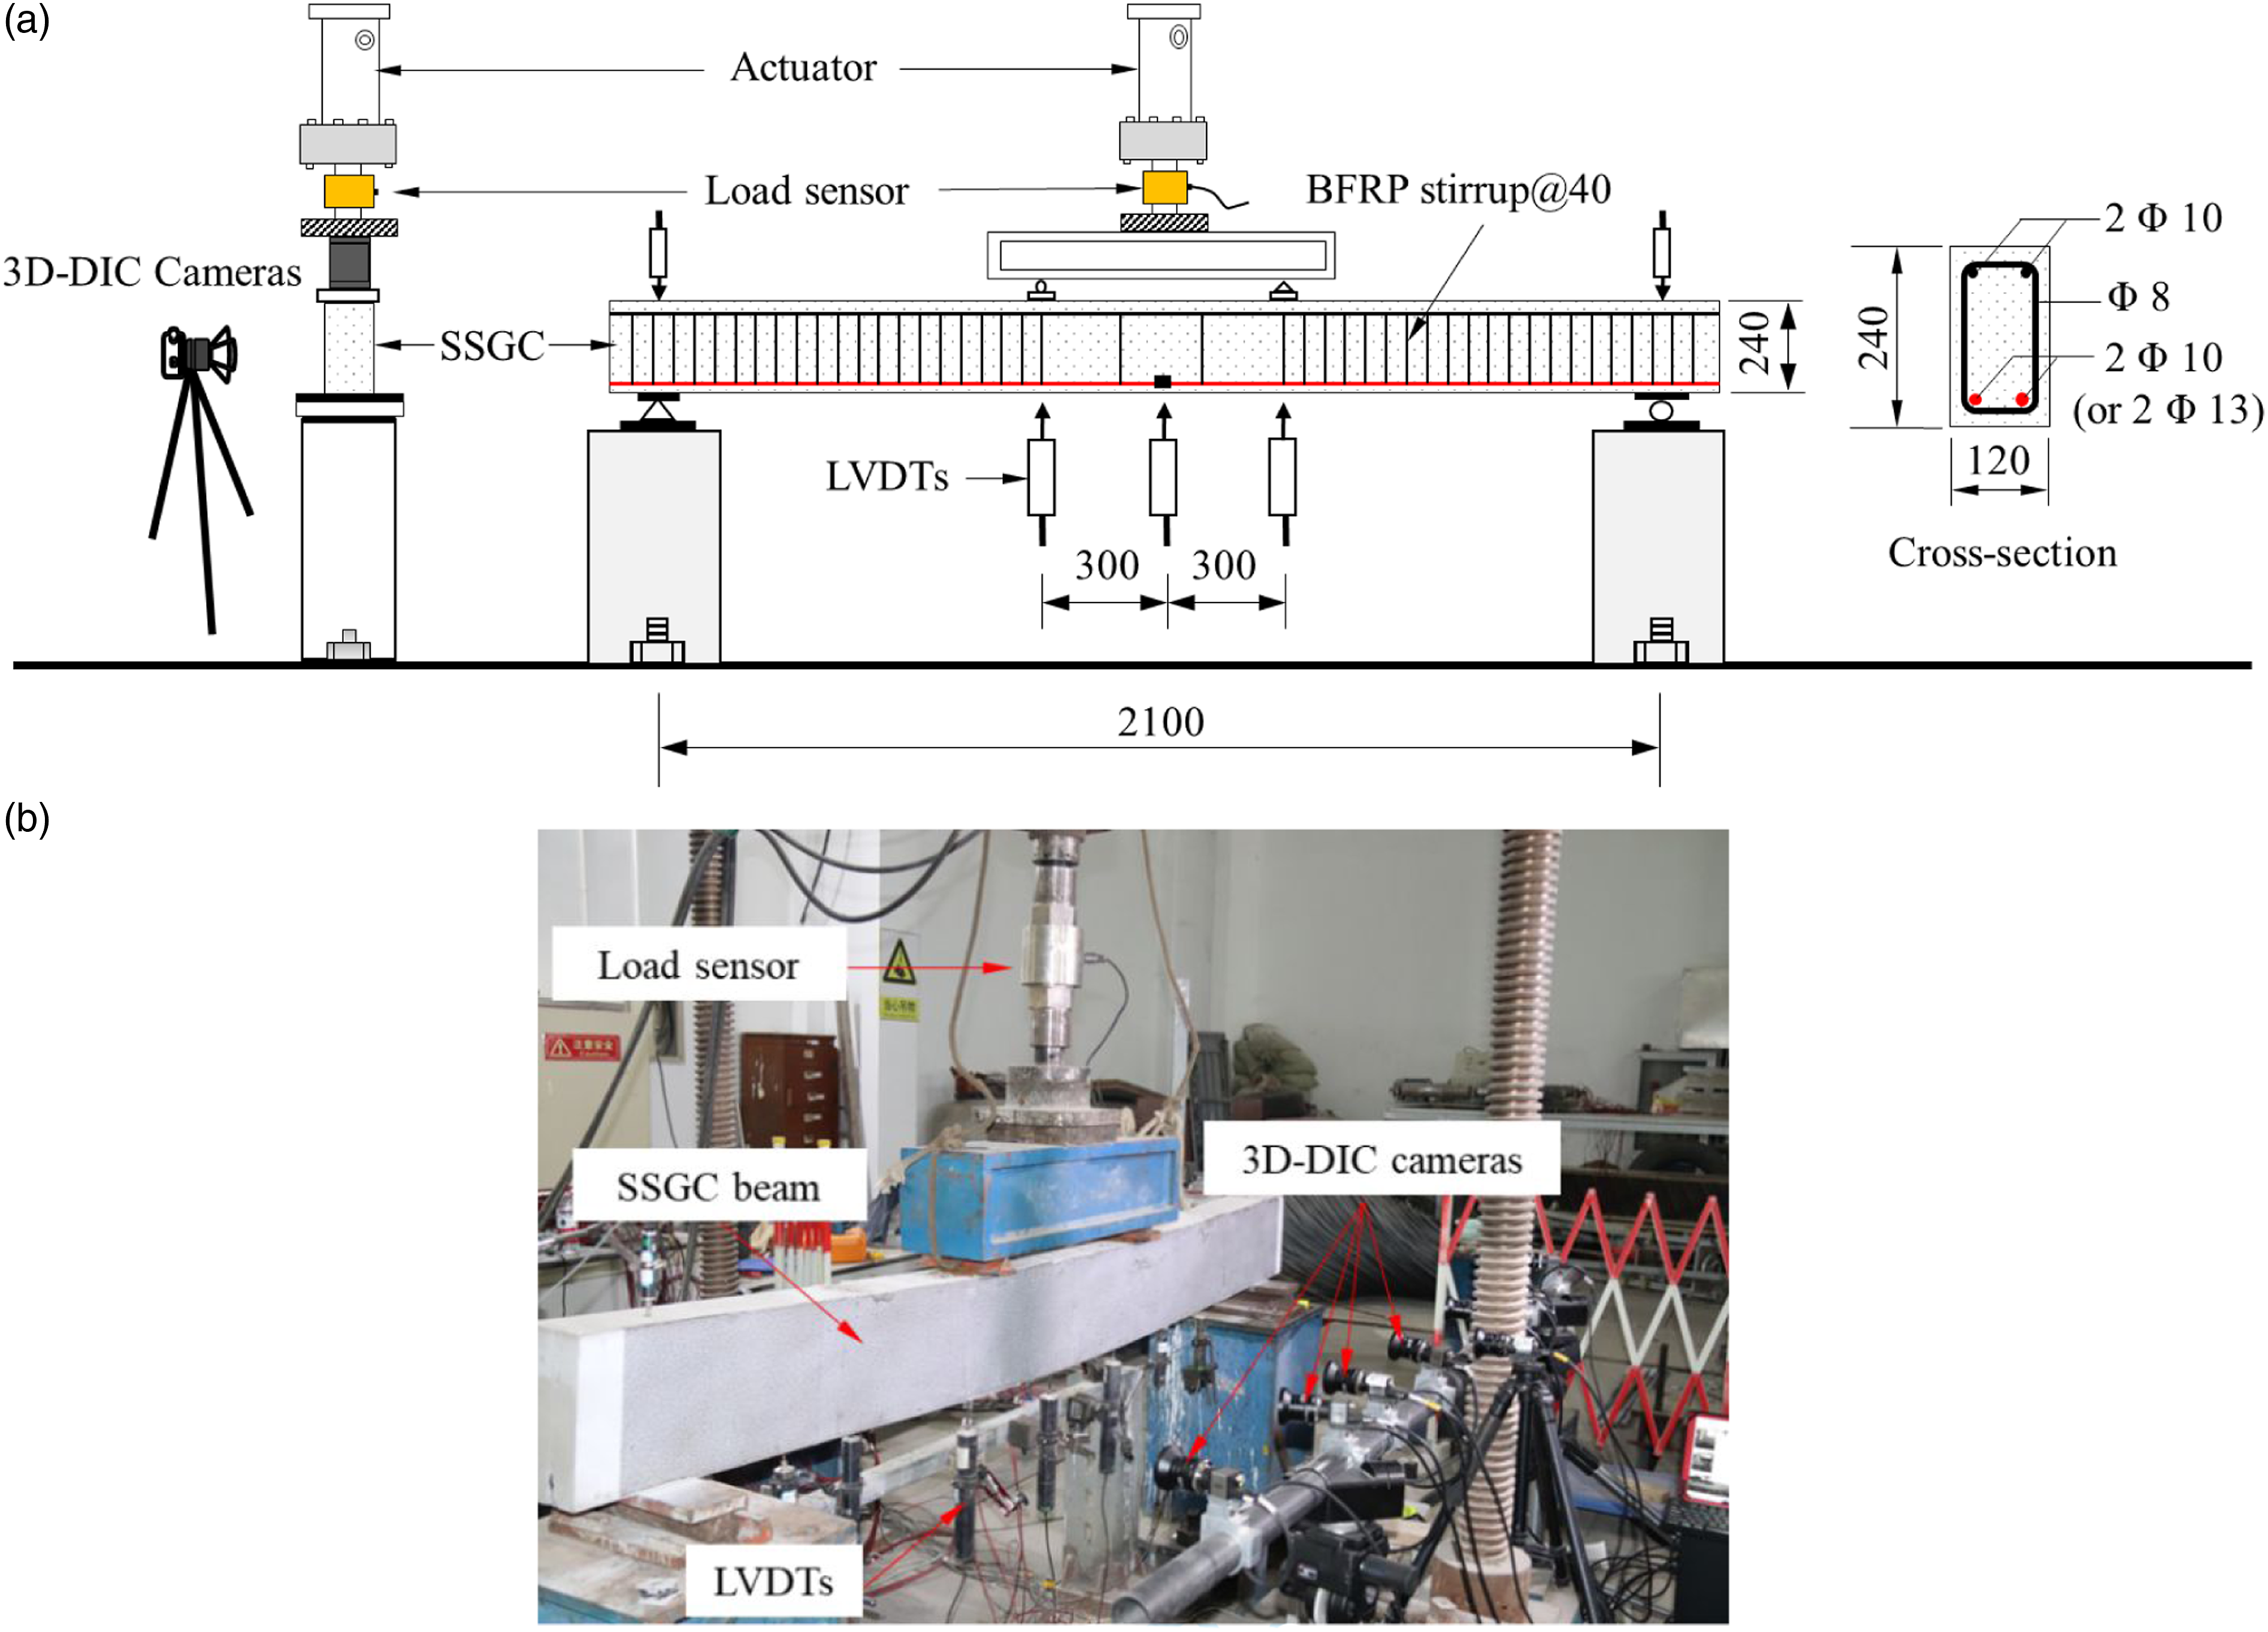
Test results and analysis
Bond test results
Bond failure modes
As shown in Figure 7, due to the restraint effects of the spiral steel stirrups embedded in the concrete block, most of the bond test specimens failed due to the pull-out of the BFRP bars, and there was no visible damage on the surface of the concrete block. Only three out of 18 specimens suffered splitting failure. To visually observe the interfacial damage between the BFRP bar and concrete, a portion of the representative specimens were split into two halves with a cutting machine, and the interfaces between the BFRP bar and the six types of concrete are presented in Figure 7. As seen, the damage was primarily concentrated on the interface of the BFRP bars manifested by the peeling off of the surface ribs of the BFRP bars and the crushing of the mortar in surface ribs. Additionally, it can be seen that adding glass coarse aggregates to the concrete had no obvious effect on the interfacial failure mode, and the damage always occurred on the surface of the BFRP bar. The above phenomena and failure behaviors were consistent with the pulling out failure mode observed by Achillides and Pilakoutas, (2004), where the damage occurred at the resin rich surface of the FRP bar. Interface between basalt fiber–reinforced polymer bars and concrete after the pull-out test.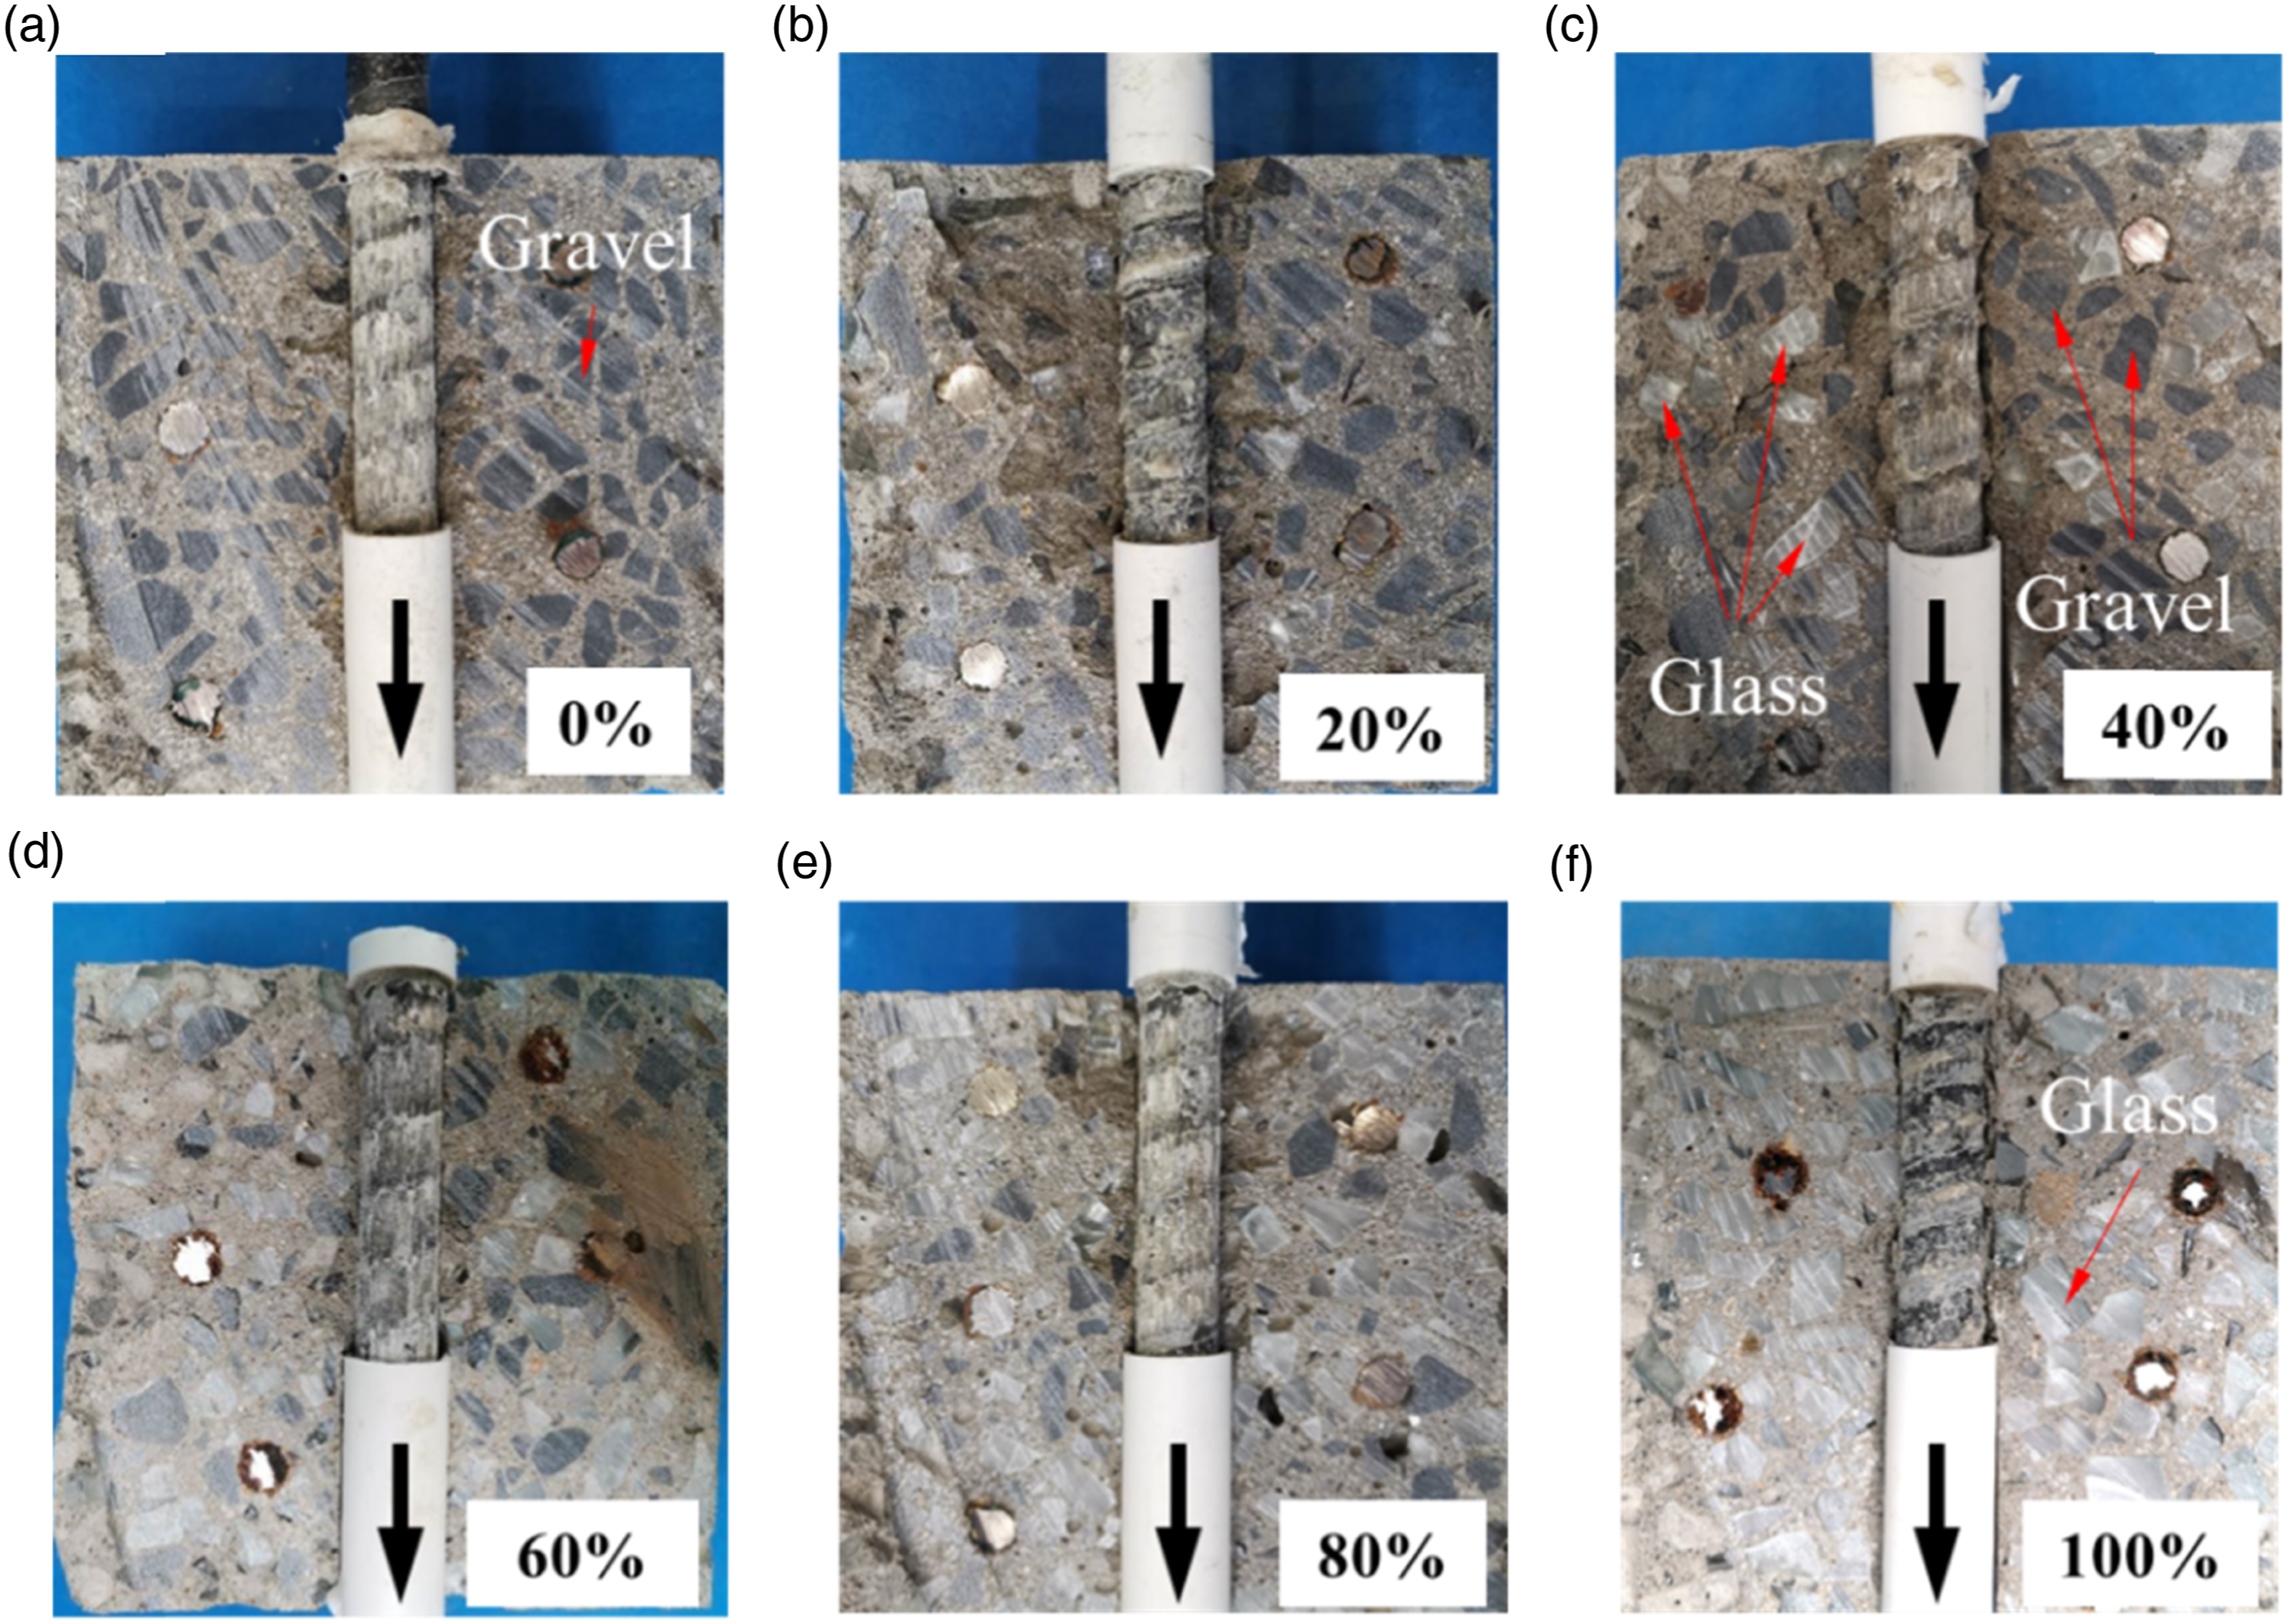
Bond stress–slip curves
It is known that bond stress is defined as the shear force per unit surface area of rebar. As the bond length adopted in this study is short, four times the diameter of the BFRP bar, the bond stress is assumed to be evenly distributed along the bond area. Thus, the bond stress τ (MPa) can be calculated by the following equation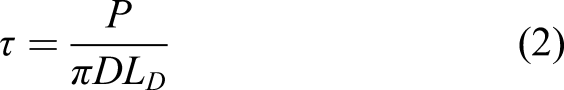
The obtained bond stress-free end slippage curves are shown in Figure 8. It can be seen that the bond–slip curves of the 13 mm BFRP bars with six types of concrete are nearly the same in shape, and they all presented a parabolic ascending section plus an approximately oblique straight descending section. Moreover, since the surface ribs of the BFRP bars were peeled off layer by layer, the bond stress tended to slowly rise again when the free end slip value reached about the same length as the rib spacing. As shown in Figures 8(c) and (f), some specimens in the B13-Mix3 and B13-Mix5 groups experienced concrete splitting failure. It can be seen from the curves that although the bond stress suddenly dropped at the moment of concrete splitting, the bond–slip curves also rise in a parabolic form before splitting. According to the overall shapes of bond–slip curves presented in Figure 8, containing the glass aggregates seemed to have little effect on the bond performance between BFRP bars and concrete. The following is a detailed analysis based on characteristic indexes. Tested bond stress–slip curves.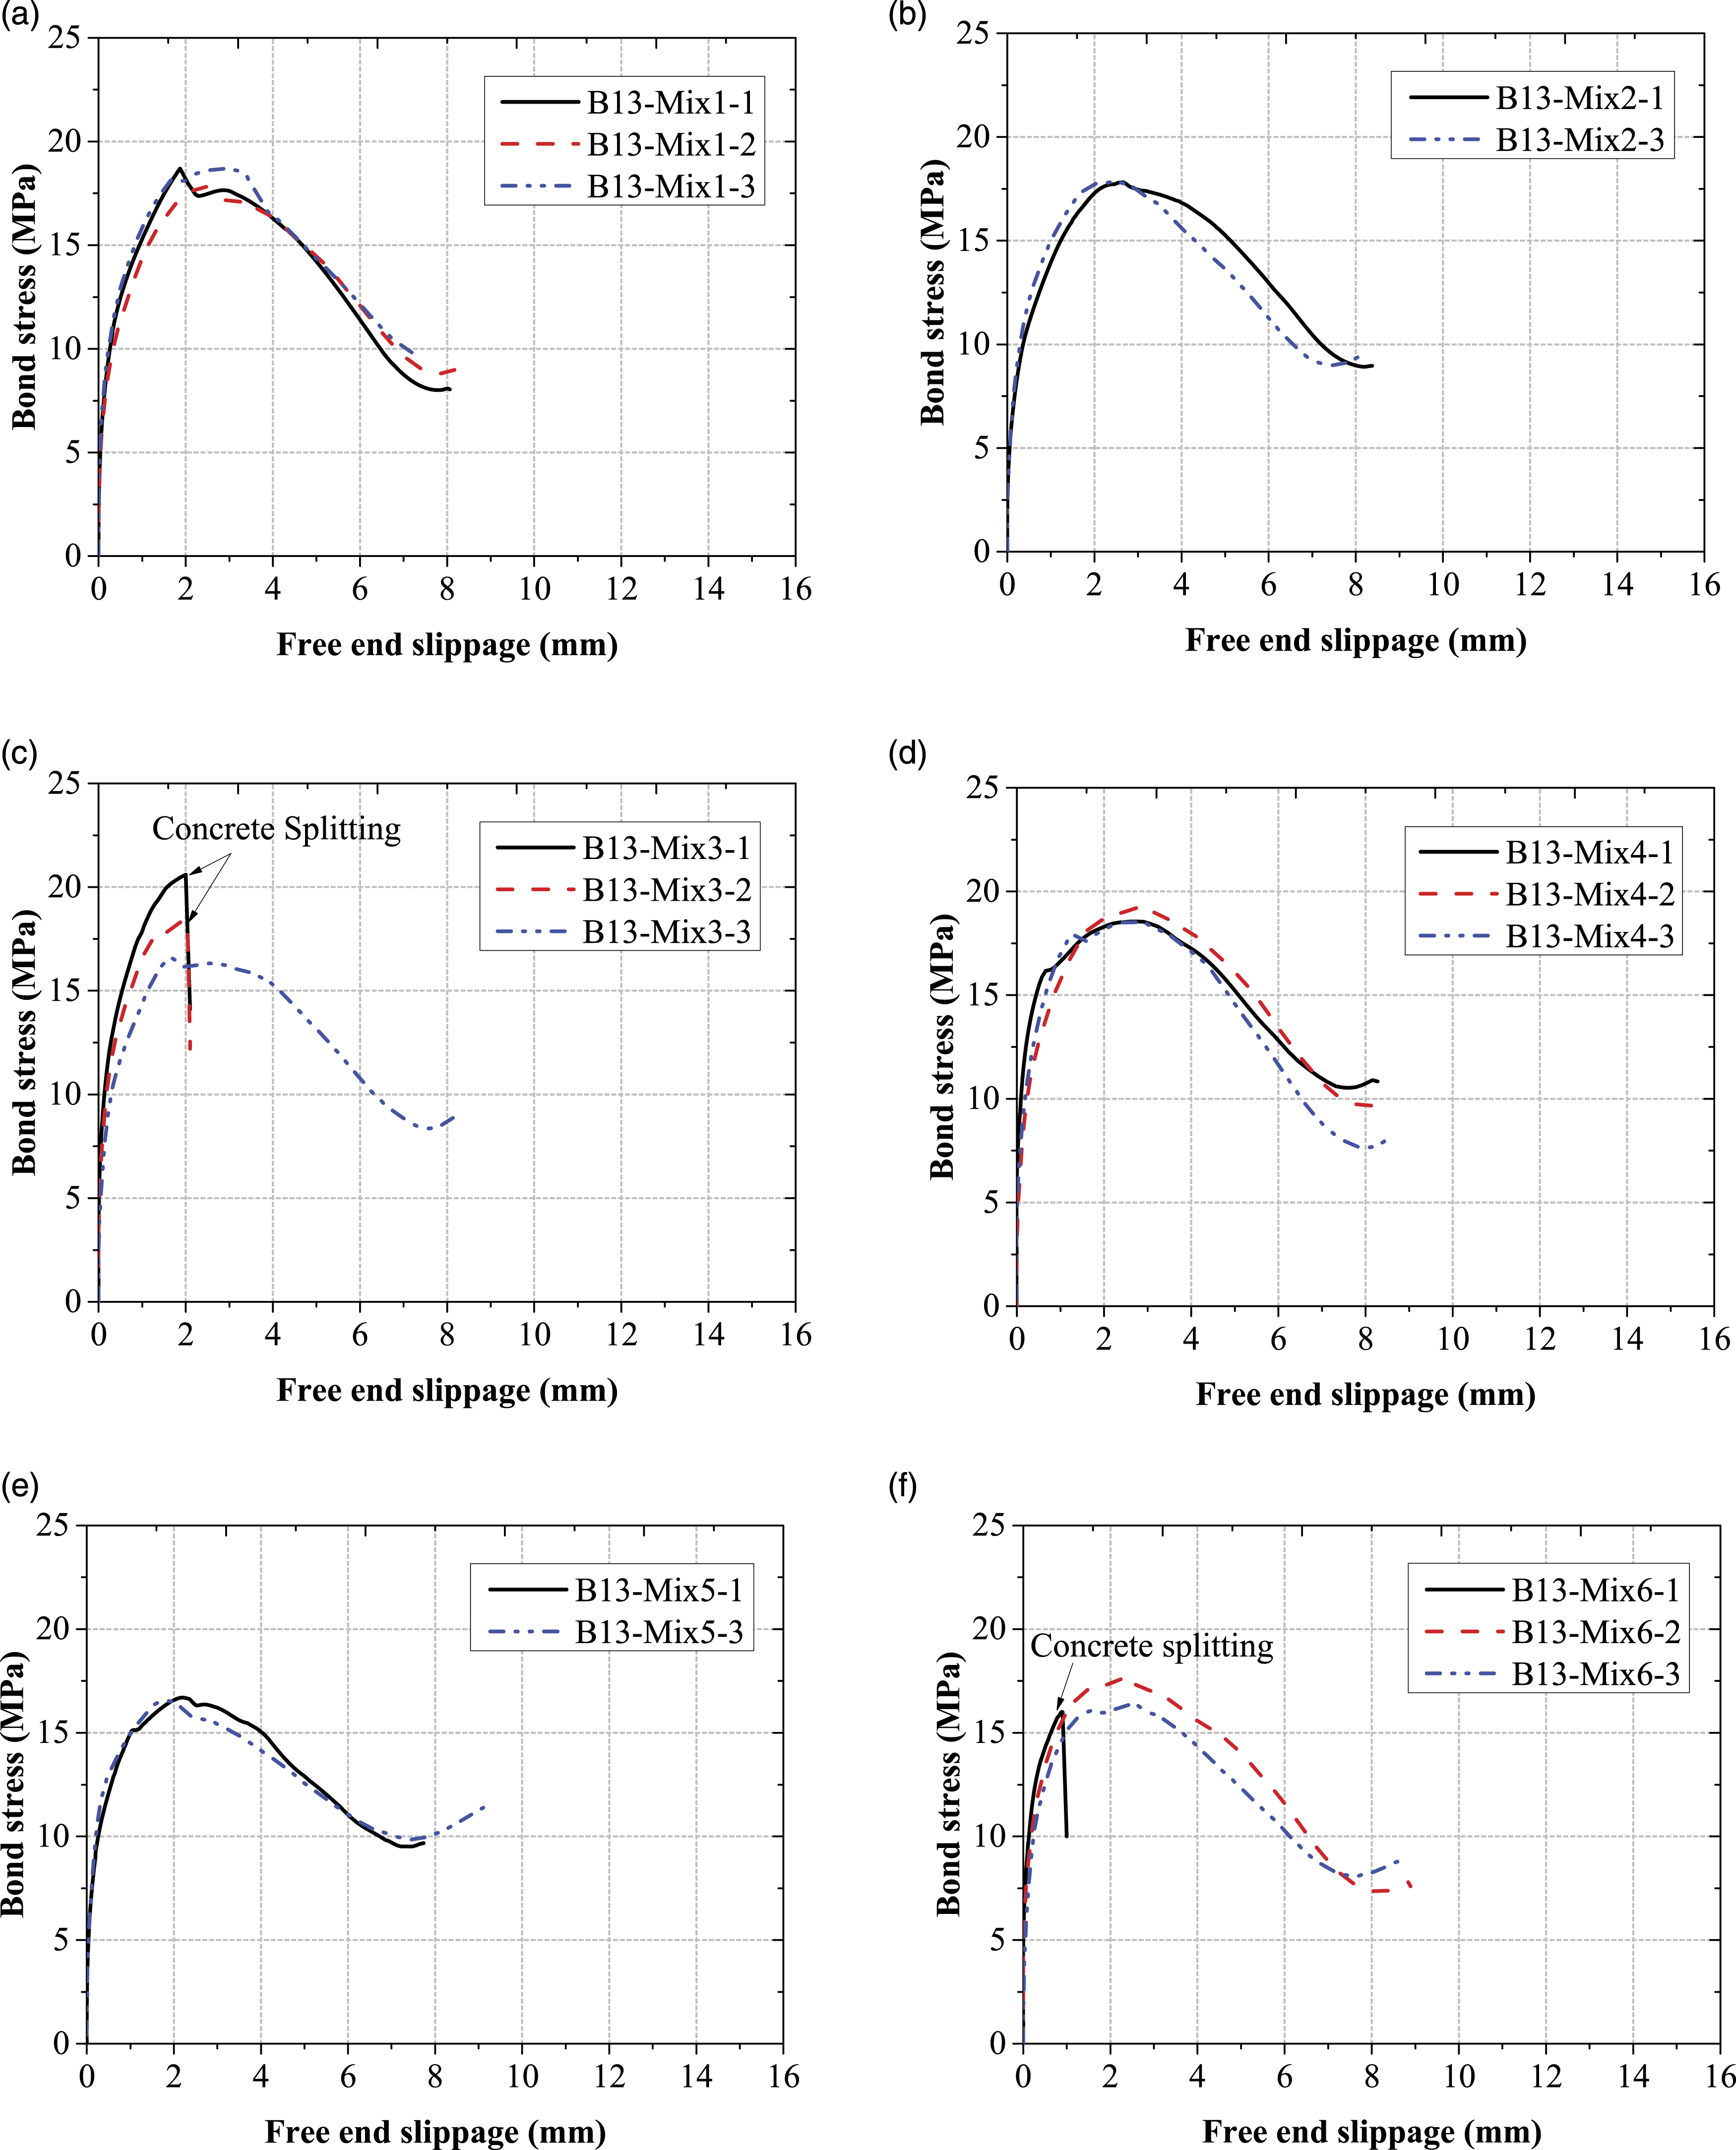
Ultimate bond stresses and corresponding slippages
Bond test results.
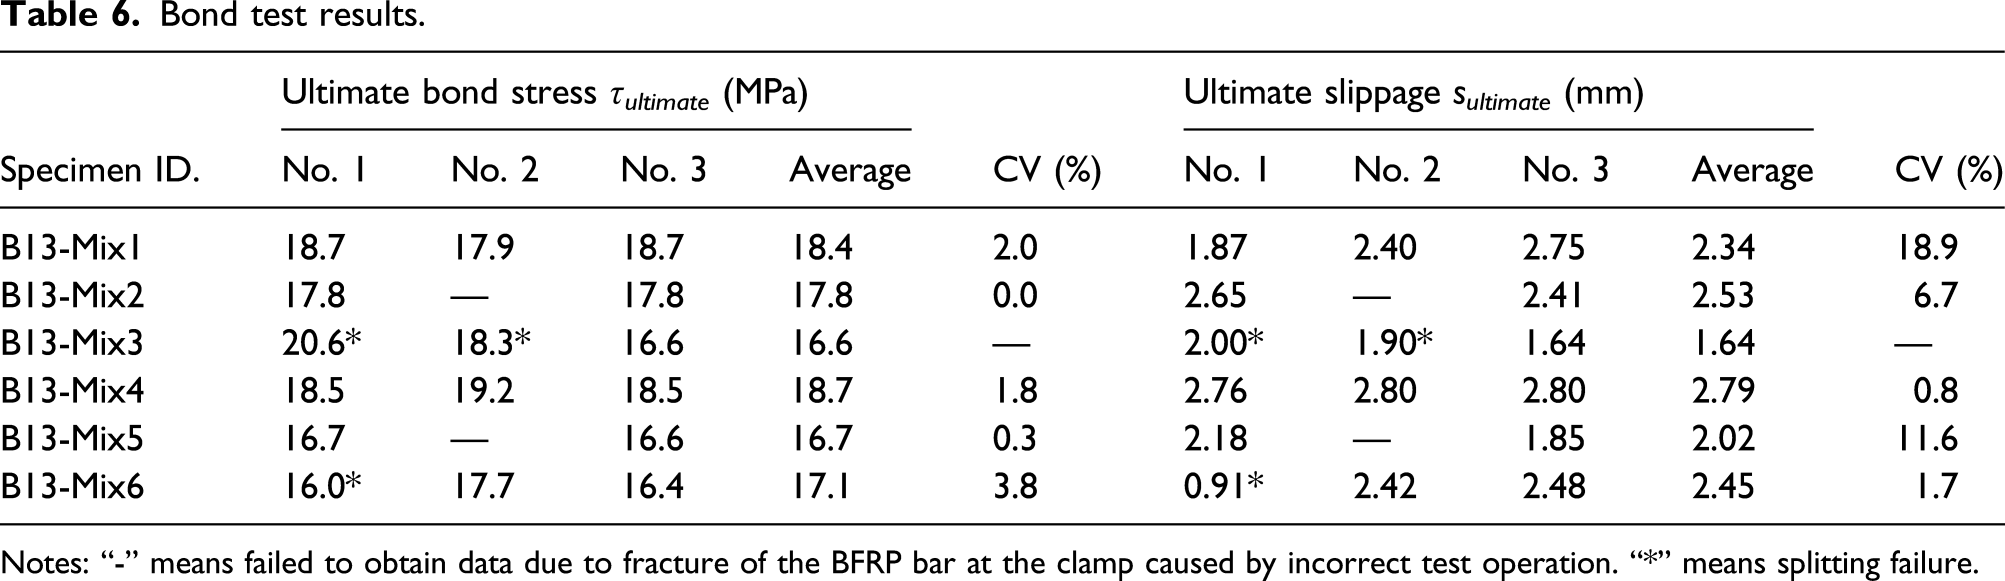
Notes: “-” means failed to obtain data due to fracture of the BFRP bar at the clamp caused by incorrect test operation. “*” means splitting failure.
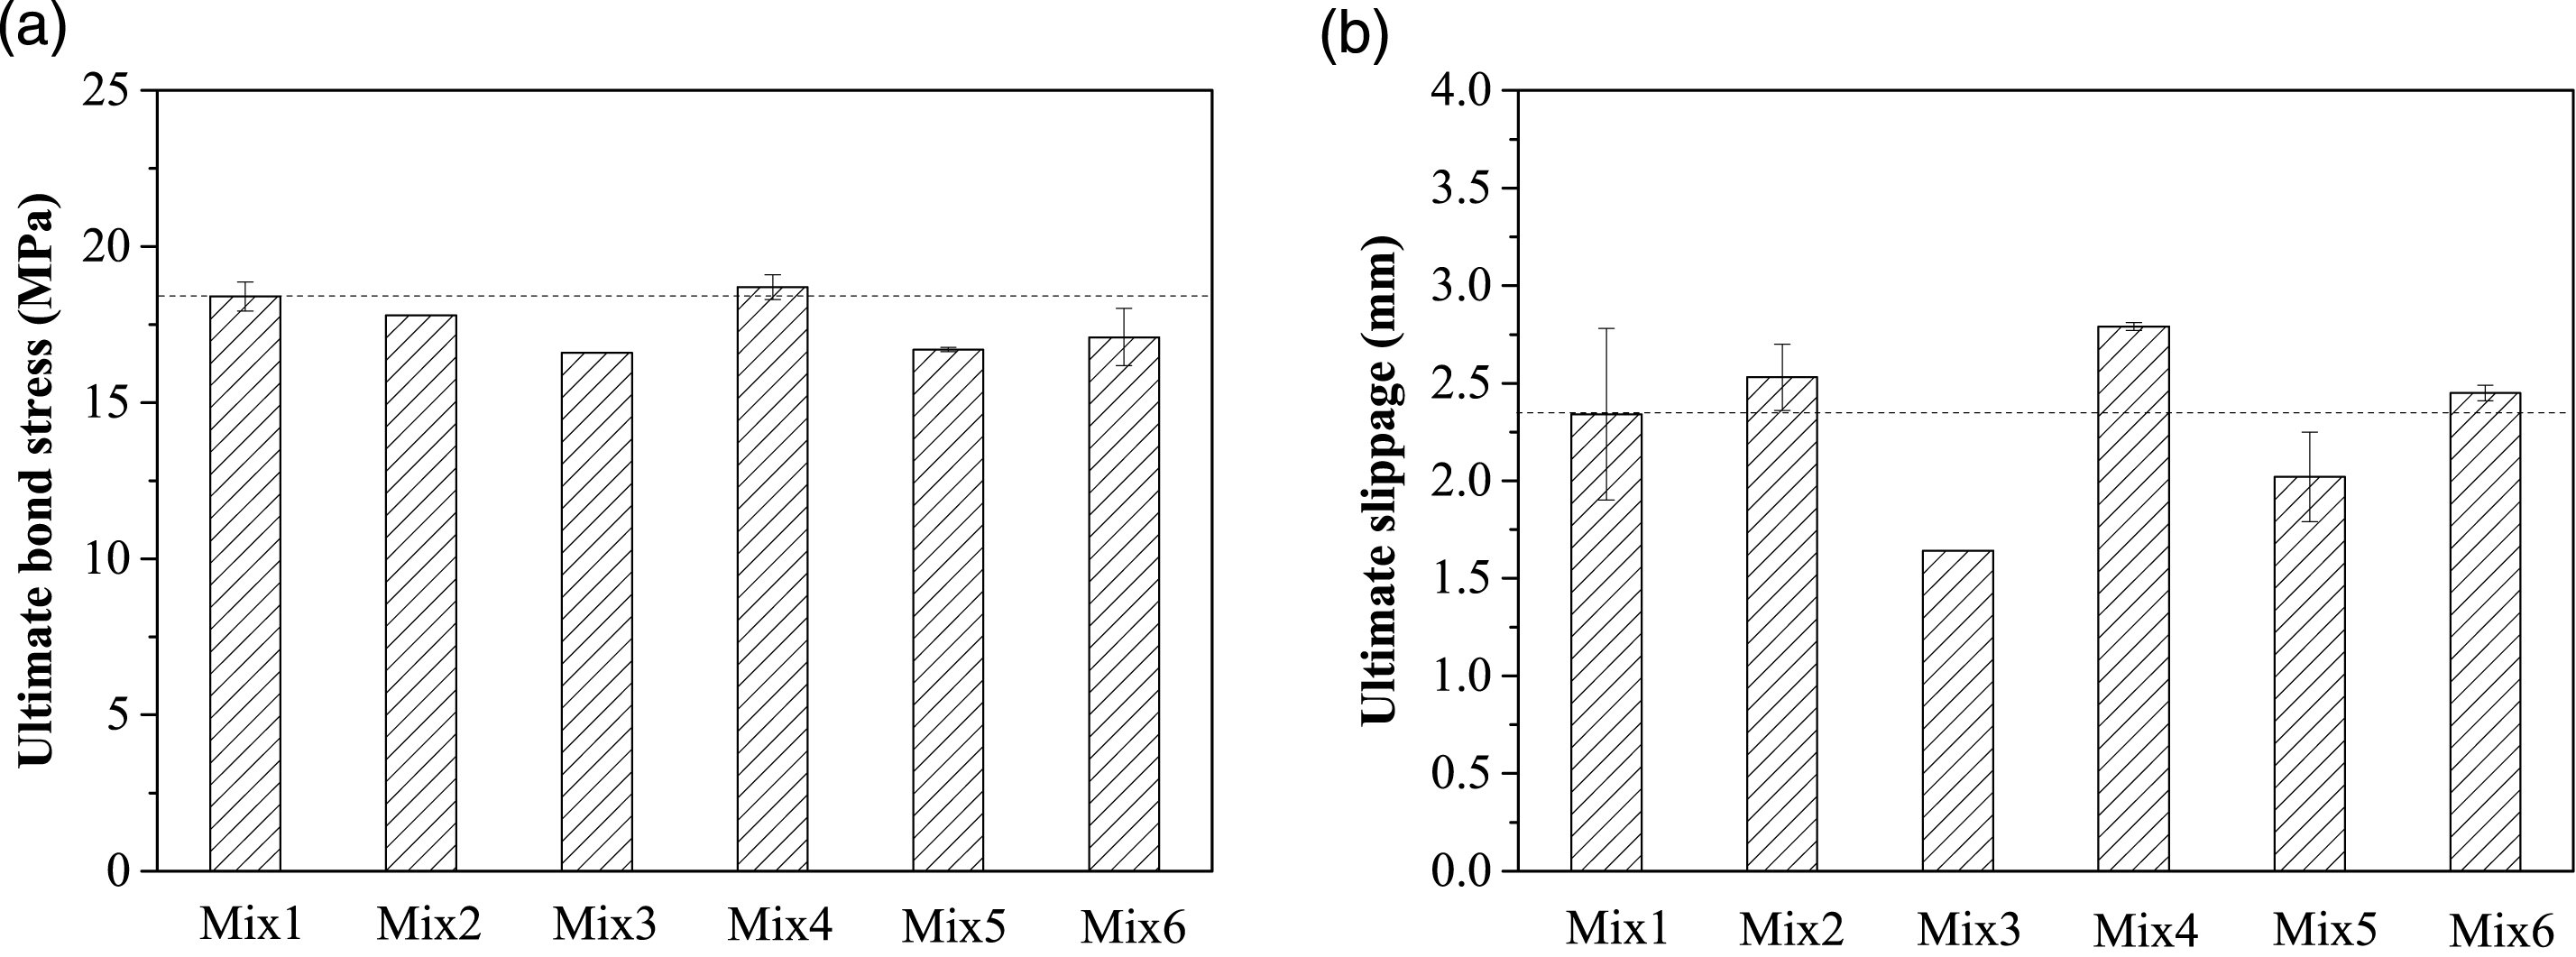
Tested ultimate bond stress and corresponding ultimate slippage: (a) ultimate bond stress and (b) ultimate slippage.
Flexural test results
Failure modes
As shown in Figure 10, the four beams all failed due to concrete crushing in the compression zone, and the bottom tensile BFRP bars did not reach the ultimate tensile strength. As shown in Figures 10(a) and (c), for beams reinforced with 10 mm BFRP bars (reinforcement ratio of 0.63%), nearly the entire compression zone in the pure bending section was crushed. For beams reinforced with 13 mm BFRP bars (reinforcement ratio of 1.08%) as shown in Figures 10(b) and (d), the crushed tarea was relatively concentrated, only about half of the compression zone in the pure bending section was crushed. Additionally, it can be seen that under the same reinforcement ratio, there were no obvious differences in the failure mode between beams with the Mix2 and Mix5 concretes. Beam failure modes: (a) B10-Mix2; (b) B13-Mix2; (c) B10-Mix5; and (d) B13-Mix5.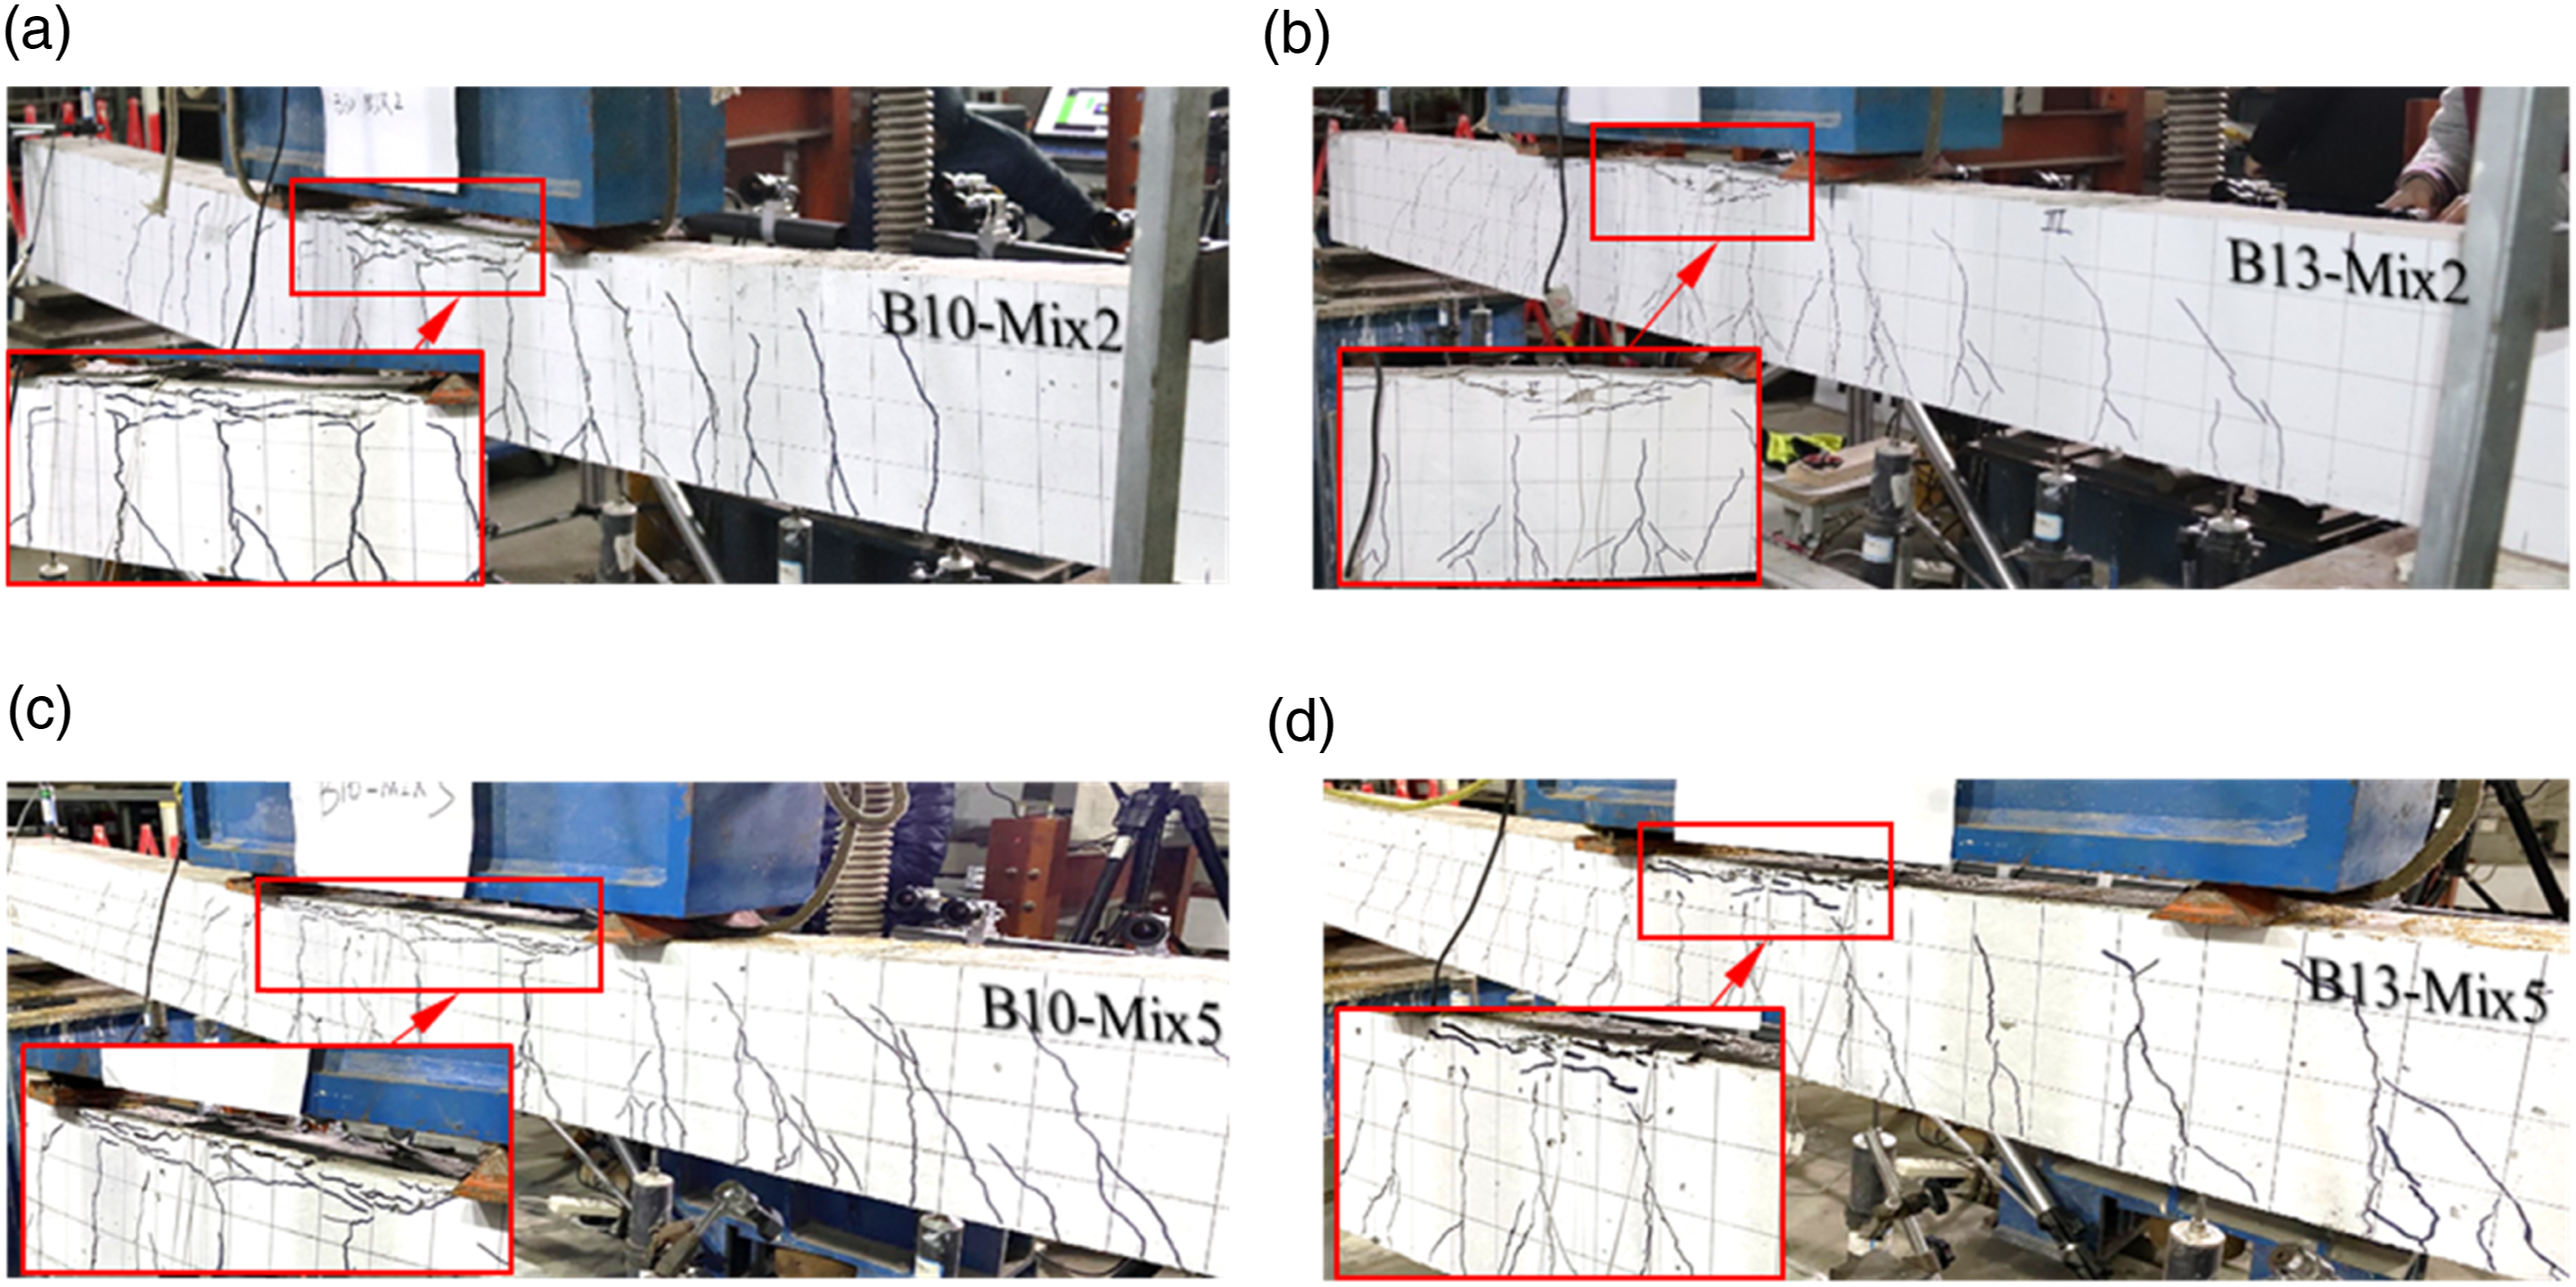
Load versus mid-span displacement curves
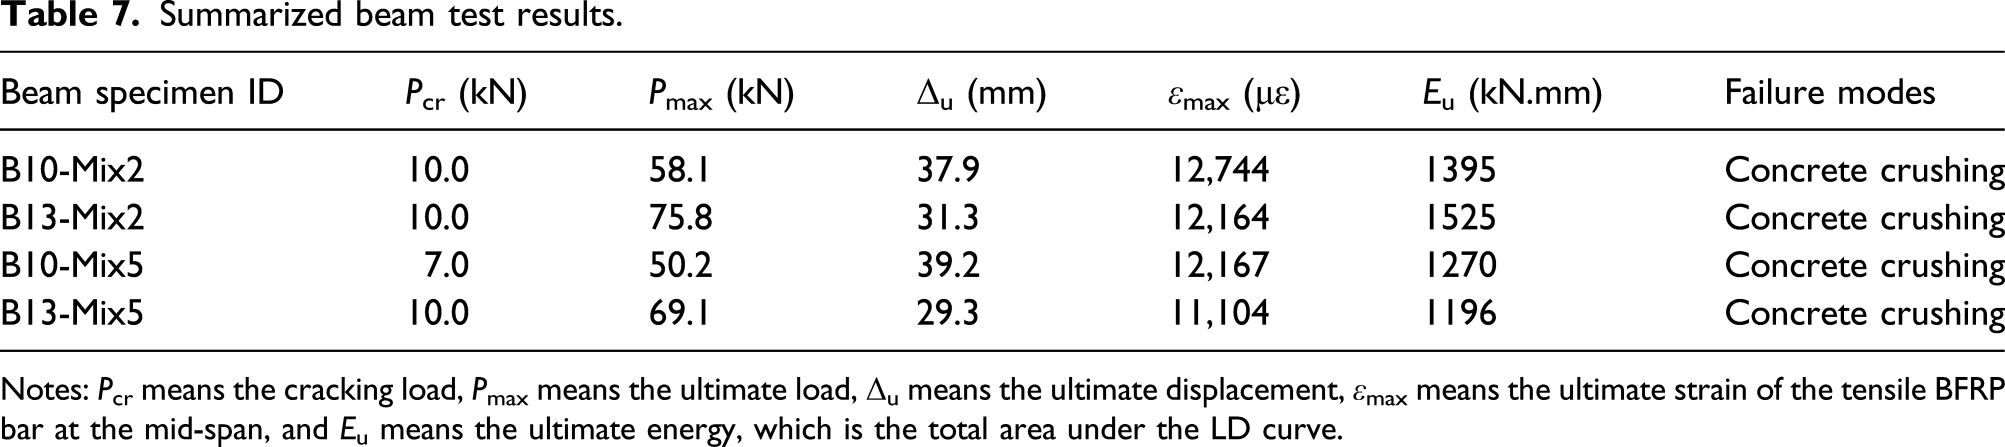
Figure 11 shows the obtained load versus mid-span displacement (LD) curves of the four beams. Since all beams were reinforced with linear elastic BFRP bars, the LD curves were all typically bilinear. The inflection points of the curves were caused by beam cracking. The values of the cracking load, ultimate load, ultimate displacement, ultimate strain of tensile bars, and the total energy consumption of each beam are listed in Table 7. It can be seen that the cracking loads of the B13-Mix2, B13-Mix5, and B10-Mix2 beams were all approximately 10 kN, while for the B10-Mix5 beam, due to the lowest reinforcement ratio and lowest concrete strength, its cracking load was approximately 7.0 kN. Since the compressive strength of the Mix2 concrete was 47.7 MPa, which was higher than the 36.9 MPa of Mix5 concrete, at the same tensile reinforcement ratios, the ultimate bearing capacities of the beams prepared with the Mix2 concrete were higher than those of the beams with Mix5 concrete. For example, the ultimate loads of beam B10-Mix2 and beam B10-Mix5 were 58.1 kN and 50.2 kN, and the ultimate loads of beam B13-Mix2 and beam B13-Mix5 were 75.8 kN and 69.1 kN. When the concrete types were the same, the ultimate displacement of beams with low reinforcement ratio was greater than that of beams with a high reinforcement ratio, and the ultimate strain of BFRP bars in beams with low reinforcement ratio was also higher than that in beams with high reinforcement ratio. With respect to energy consumption, under the same reinforcement ratios, the energy consumption of the beams with Mix2 concrete was greater than that of the beams with Mix5 concrete. For example, the Eu values of the B10-Mix2 and B10-Mix5 beam were 1395 kN.mm and 1270 kN.mm, and the Eu values of the B13-Mix2 and B13-Mix5 beam were 1525 kN.mm and 1196 kN.mm. Tested load versus mid-span displacement curves. Summarized beam test results. Notes: Pcr means the cracking load, Pmax means the ultimate load, Δu means the ultimate displacement, εmax means the ultimate strain of the tensile BFRP bar at the mid-span, and Eu means the ultimate energy, which is the total area under the LD curve.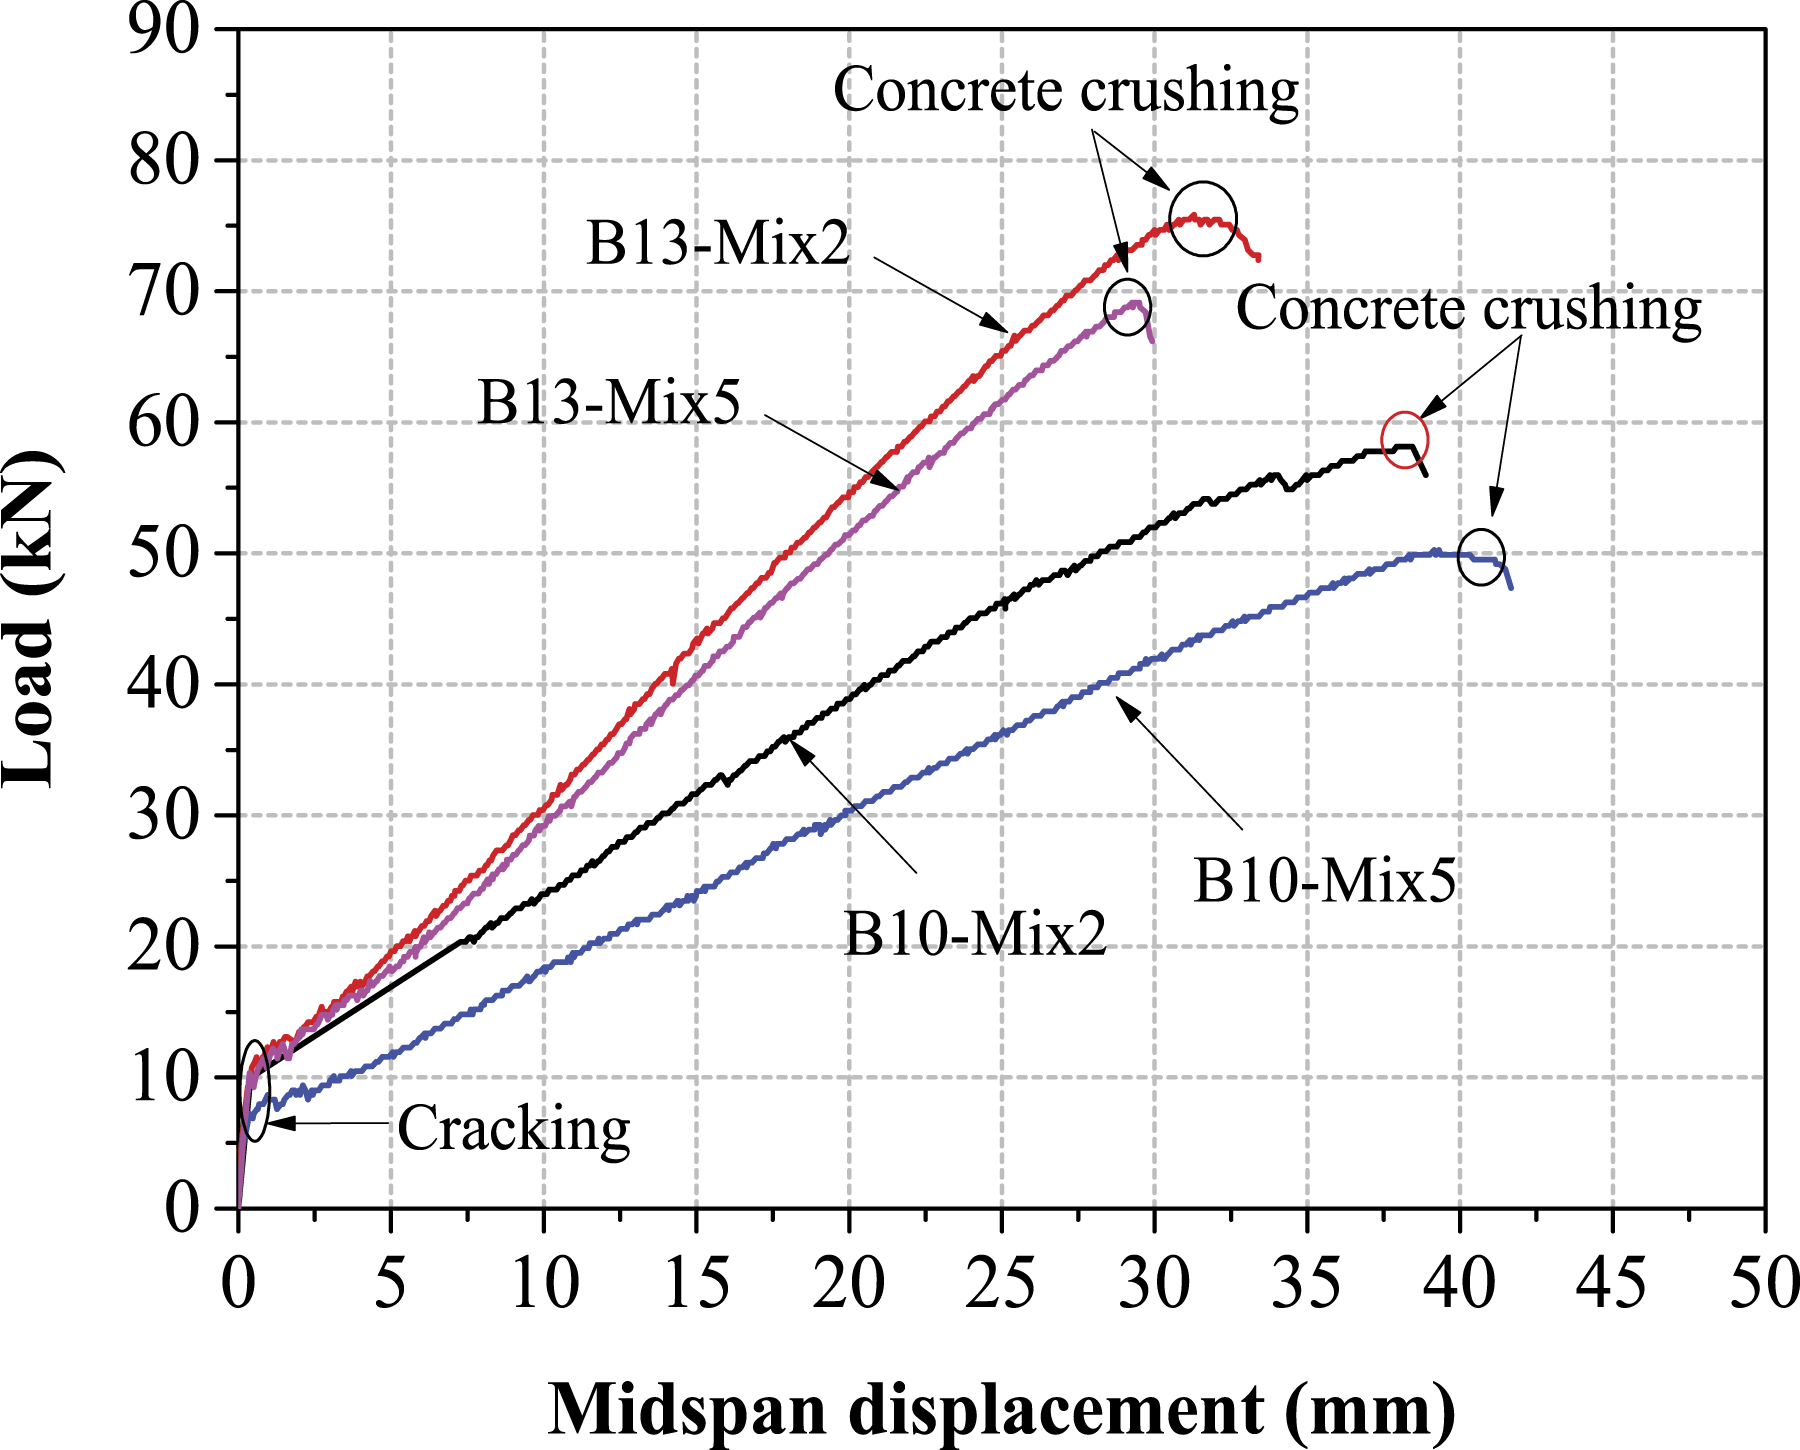
Crack distributions and widths
Figure 12 shows the crack distributions at the failure stage of the four beams. As described in the failure modes, all concrete in the compression zones of the four beams were crushed. Comparing the crack distributions of the beam B10-Mix2 and the beam B13-Mix5, it can be seen that the cracks of the latter developed more densely. This is due to the combined effect of higher tensile stress generated in concrete caused by the higher reinforcement ratio and the lower tensile capacity of the Mix5 concrete itself. Figure 13 shows the relationship between the maximum crack width and the load in the pure bending section. It can be seen that under the same reinforcement ratio, the crack widths of the beams prepared with Mix2 concrete were smaller than those of the beams with Mix5 concrete. Under the same concrete type, the crack widths of 13 mm BFRP bar–reinforced concrete beams were significantly smaller than those of 10 mm BFRP bar–reinforced concrete beams. Crack distributions at the failure stage. Load versus maximum crack width curves.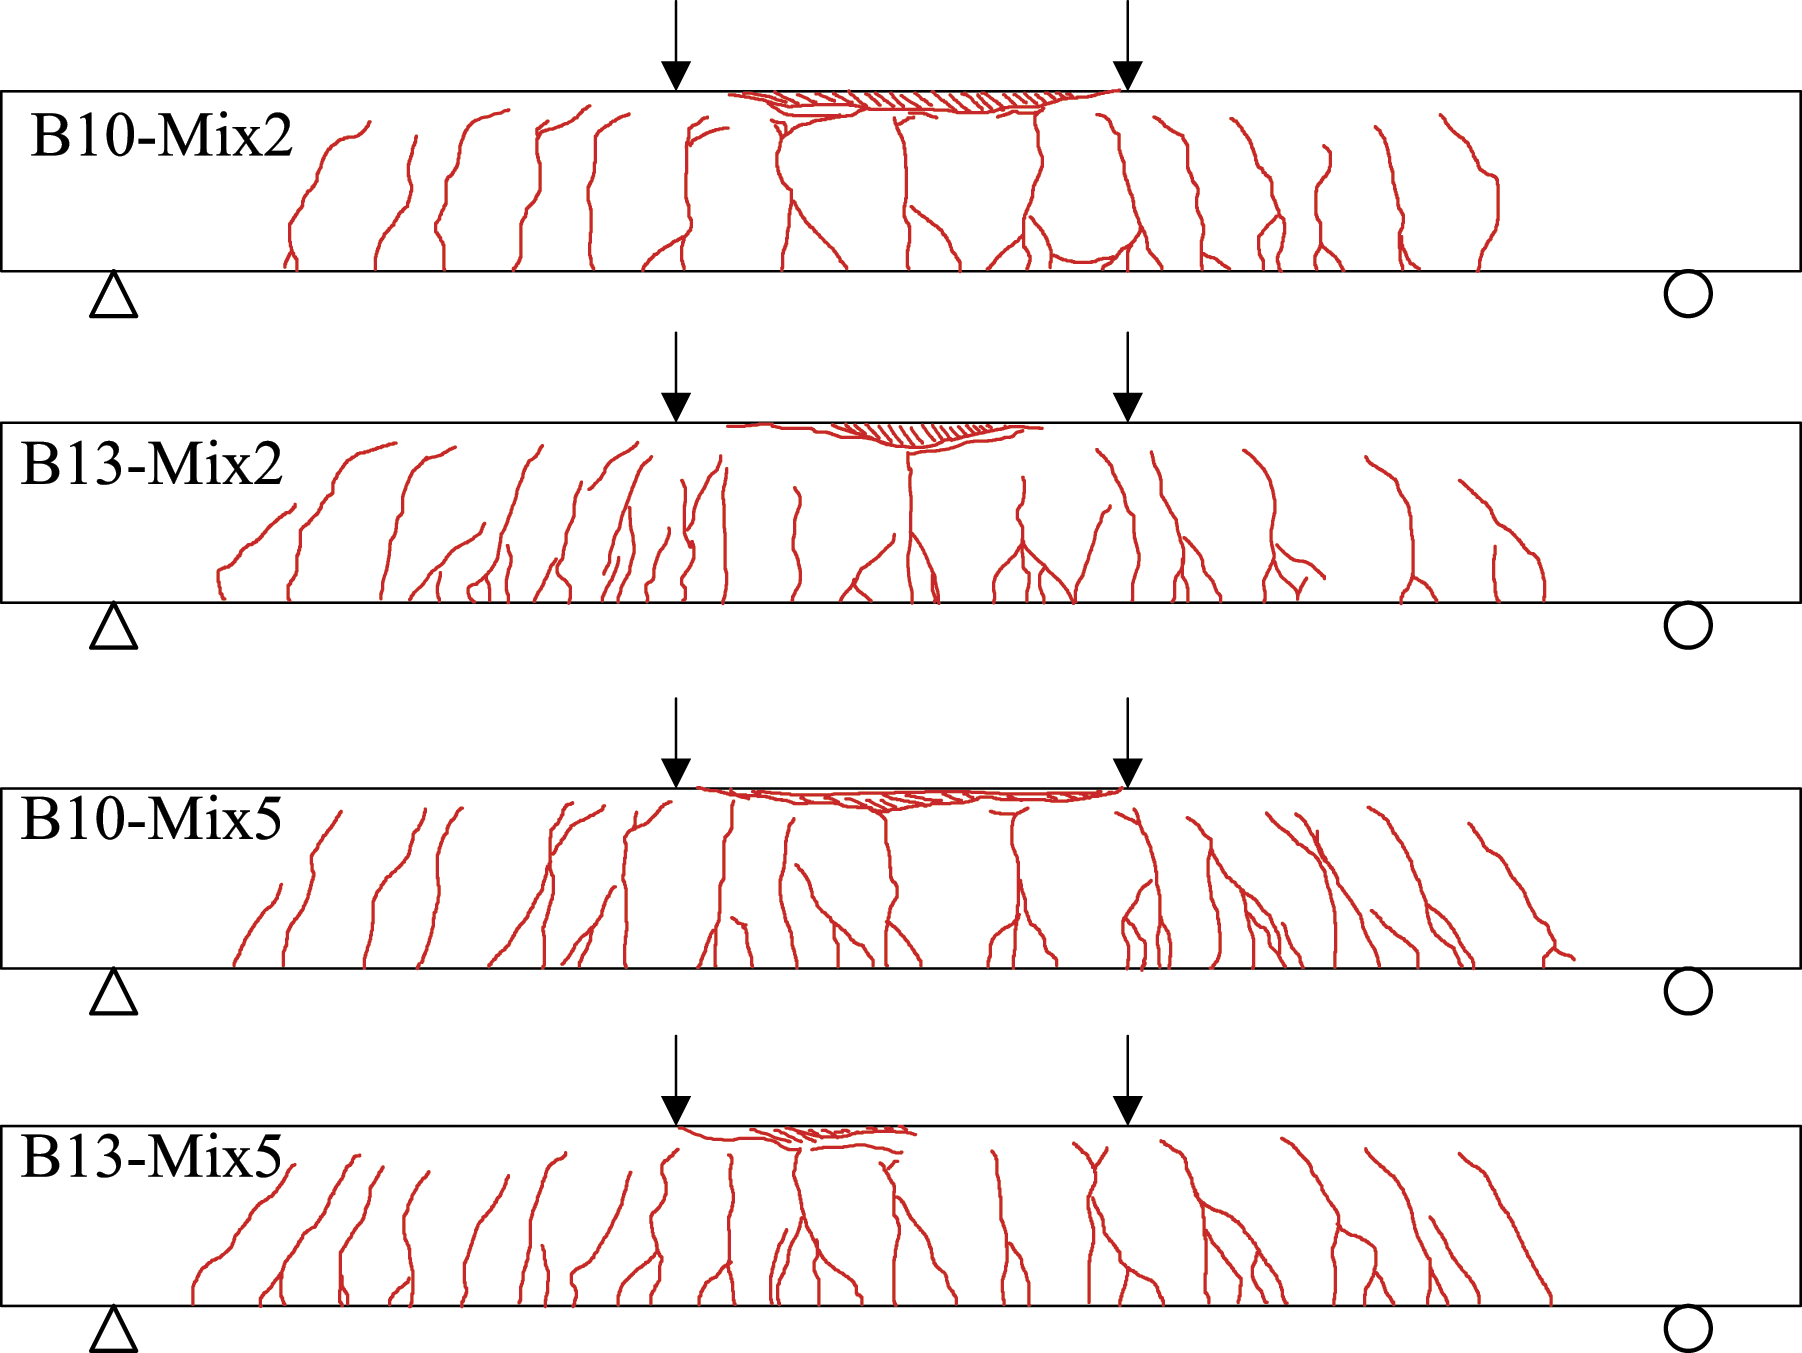

Strain contours obtained by the 3D-DIC method
Figure 14 shows the strain development along the length of the beams under different load levels obtained through the 3D-DIC method. The process of crack formation and development of the beams during the loading process was recorded. It can be seen that in the initial stage of loading, the cracks mainly appeared near the pure bending section. As the load increased, the cracks in the pure bending section continued to widen and extend upward; meanwhile, new oblique cracks appeared in the shear span on both sides. The strain contours under ultimate loads matched well with the crack distributions depicted in Figure 12. Comparing Figures 14(a) and (c), it can be seen that the cracks of the B10-Mix5 beam prepared with low strength Mix5 concrete developed earlier than those of the B10-Mix2 beam prepared with high strength Mix2 concrete. The same phenomenon can also be observed in Figures 14(b) and (d). The B13-Mix5 beam had more branch cracks than the B13-Mix2 beam, and the cracks were denser. Strain contours under different loading levels: (a) B10-Mix2; (b) B13-Mix2; (c) B10-Mix5; and (d) B13-Mix5.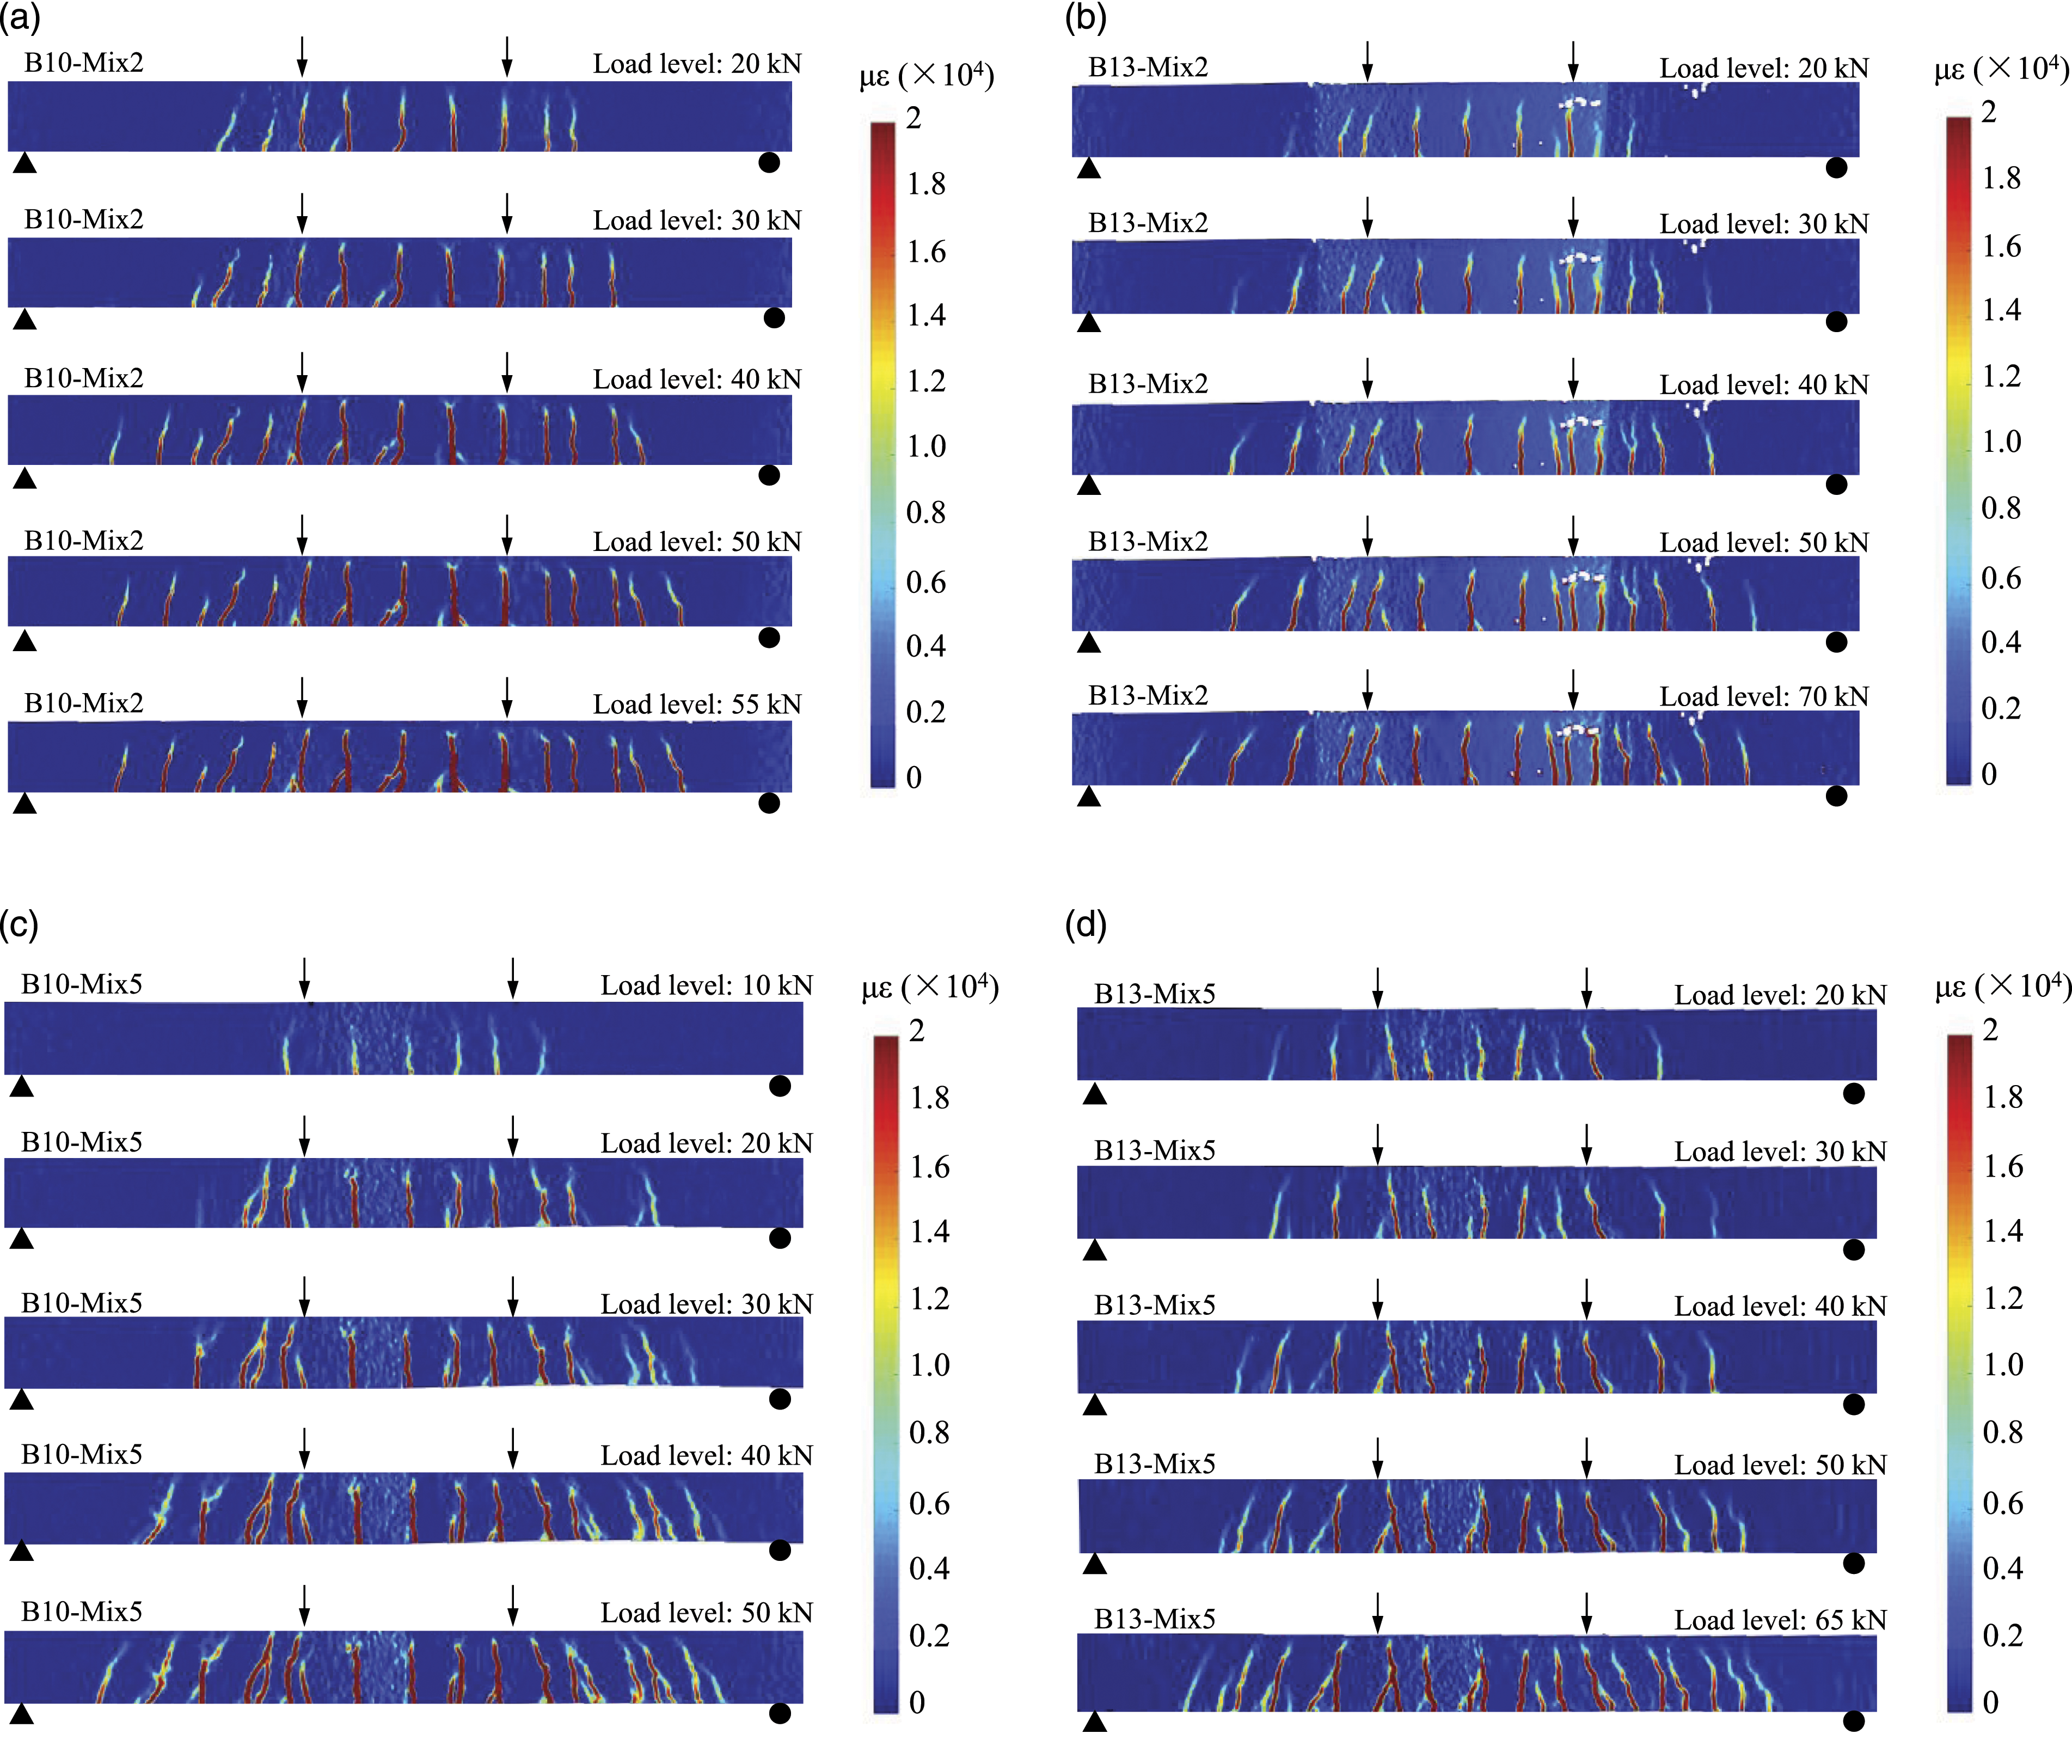
Comparison with calculated results
At present, there are many specifications to guide the design of FRP bar–reinforced ordinary gravel aggregate concrete members around the world. However, when SSGC is used, whether the existing specifications are still applicable remains to be further confirmed. For this reason, the calculated flexural strengths following the GB50608-2010 code from China (MOHURD, 2010) and the ACI440.1R-15 code from the United States (ACI440.1R-15, 2015) were compared with experimental values to evaluate the applicability of the specifications. It should be noted that in the calculation process, all material performance values are actual values that do not include reduction factors. 1. GB50608-2010
The formulations of the ultimate flexural capacity of FRP bar–reinforced concrete members given in GB50608-2010 are as follows
In the above formulas, the effective stress in FRP bars (f
fe
) is calculated according to the relationship between the actual reinforcement ratio (ρ
f
) and the balanced reinforcement ratio (ρ
fb
). In this study, the value of ρ
f
was higher than 1.5 ρ
fb
, and, therefore, the f
fe
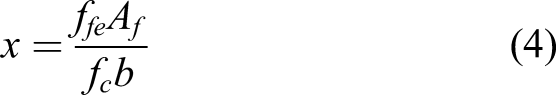
was calculated with the following formula 2. ACI440.1R-15
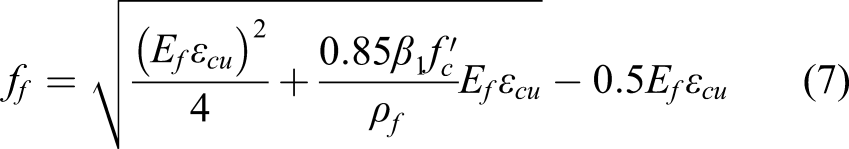
According to ACI 440.1R-15, when the failure mode is concrete crushing, the ultimate flexural strength of the FRP bar–reinforced concrete beam at a section can be calculated with the following equations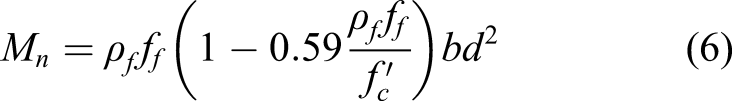
A comparison of the experimental and calculated flexural capacities is shown in Figure 15. It can be seen that the calculated values following the GB50608-2010 were greater than the actual measured values, which were unconservative. After analysis, it was found that this was caused by an excessively high effective stress value (f
fe
) of FRP bars estimated by equation (5) above. For example, the measured ultimate strain and the calculated corresponding ultimate stress of the tensile BFRP bar of the B10-Mix2 beam were 12,744 με and 607 MPa, respectively, while the calculated f
fe
according to the above formula (5) was 913 MPa, which is much larger than the actual value. As to the ACI 440.1R-15 specification, the prediction accuracy was actually relatively high, and the error was within the acceptable range for engineering. It should be emphasized that due to the small number of test specimens in this study, there is a possibility of misjudgment due to data discreteness. Therefore, the applicability of the existing specifications to FRP bar–reinforced SSGC beams still needs to be further explored with more data. Comparison between experimental and calculated flexural capacities.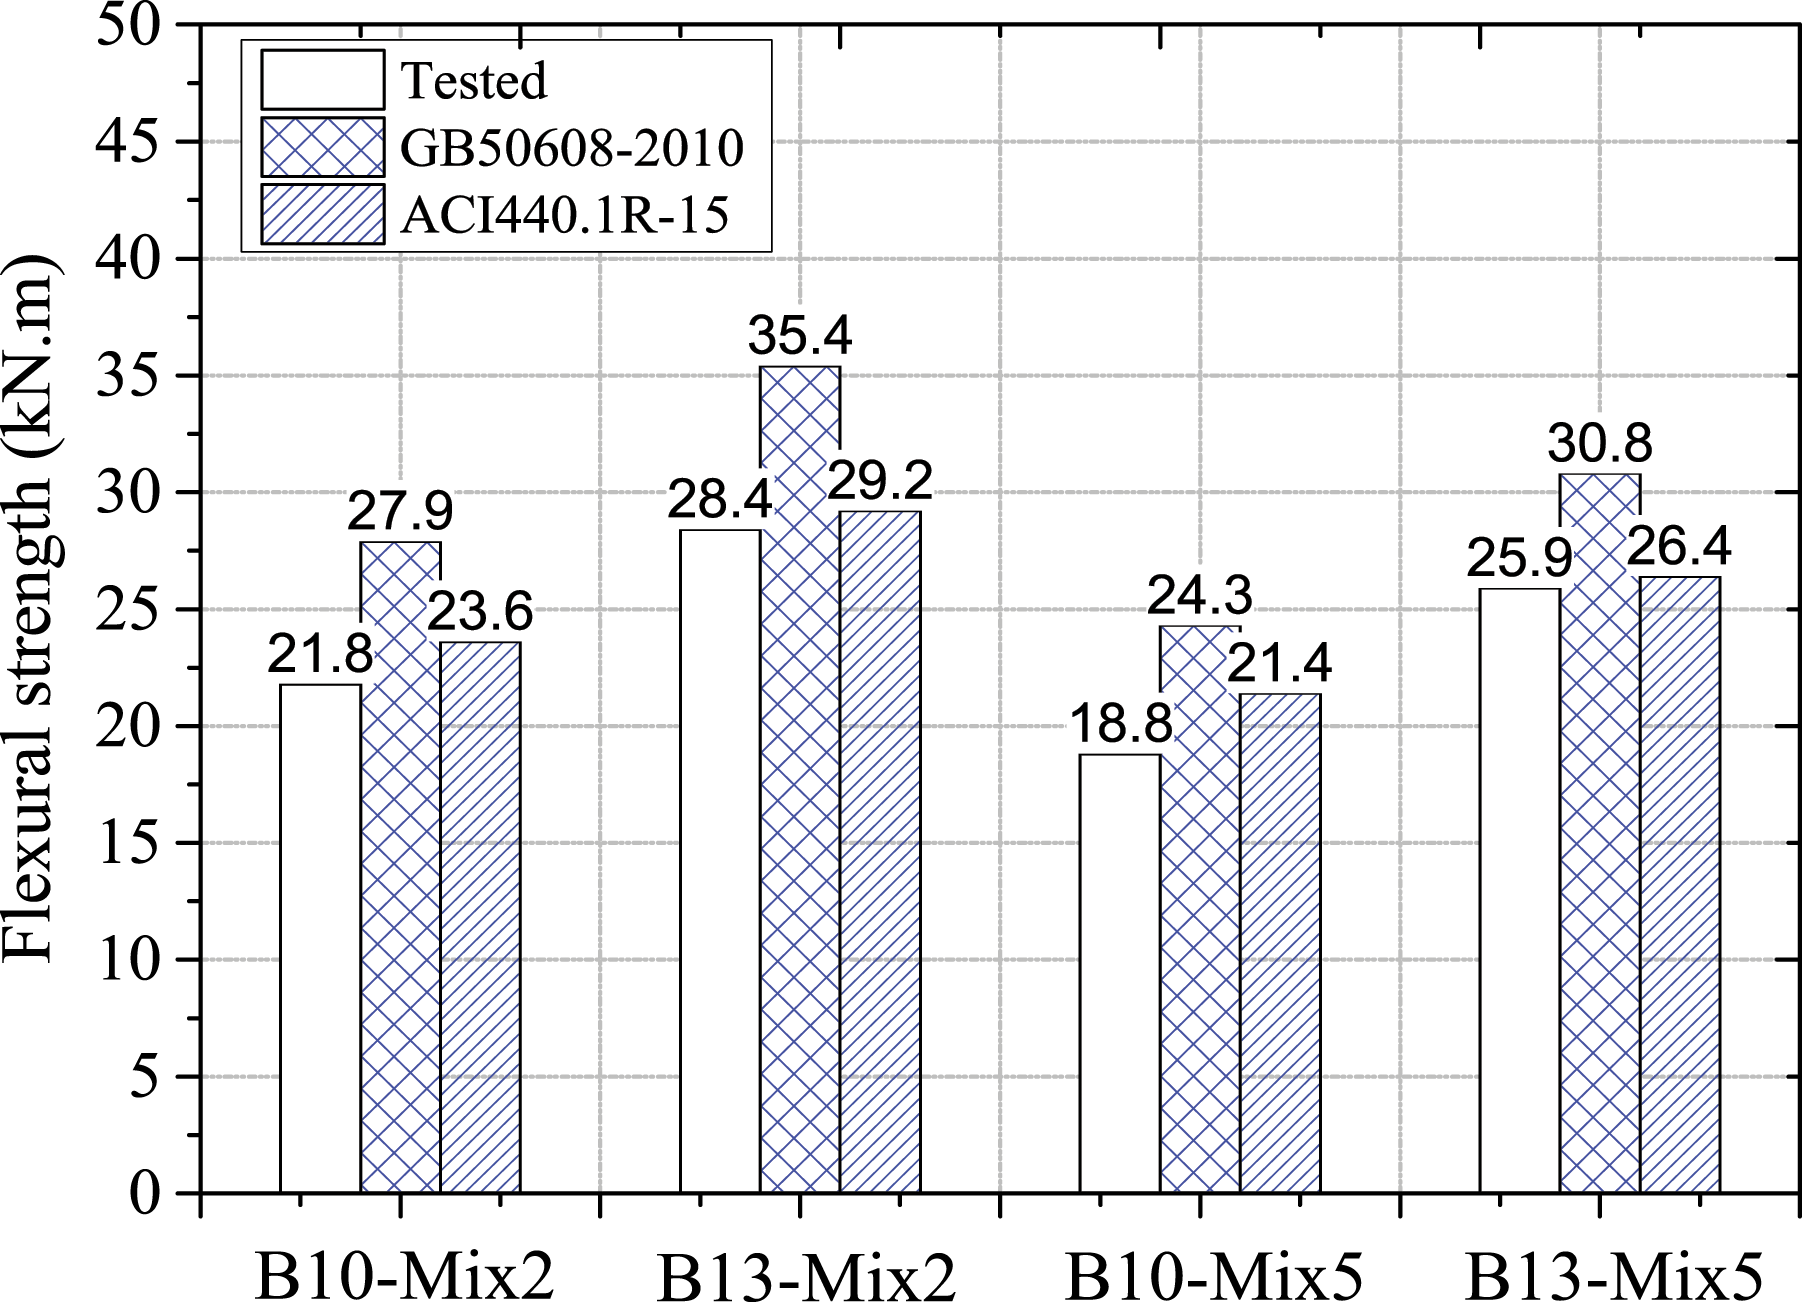
Since this study is the first attempt to study the combination of BFRP bars and SSGC, the authors believe that more in-depth research studies are still needed in the following aspects in the future. (1) The microscopic evaluation of the potential ASR of the SSGC with low basicity sulfate cement; (2) testing on the durability of the SSGC covered BFRP bar itself and the bond durability between BFRP bars and SSGC; and (3) proposing modified calculation equations for the anchorage length, crack width, bending stiffness, and load capacity based on more experimental data.
Conclusions
In this study, a new type of seawater SSGC was prepared with low-alkali cement. The bonding performance of the BFRP bars and SSGC and the flexural performance of the BFRP bar–reinforced SSGC beams were experimentally tested. Additionally, the calculated flexural strengths following existing specifications were compared with the experimental results. The following main conclusions were drawn: 1. As the replacement ratio of glass aggregate increased, the compressive strength of SSGC gradually decreased. Compared with the ordinary gravel aggregate concrete, the compressive strength of the SSGC prepared with 100% glass coarse aggregate was reduced by 38% but was still greater than 30 MPa. 2. The bond performance between BFRP bars and SSGC did not gradually decrease with increasing glass aggregate content, and the bond failure modes and bond–slip curves were similar to that of ordinary gravel aggregate concrete. 3. The mechanical characteristics of SSGC beams reinforced with BFRP bars were similar to those of typical FRP bar–reinforced concrete beams. The ultimate bearing capacities of SSGC beams with Mix5 concrete were lower than those of beams with Mix2 concrete under the same reinforcement ratio. 4. The existing ACI440.1R-15 and GB50608-2010 specifications both overestimated the ultimate bearing capacity of BFRP bar–reinforced SSGC beams.
It should be noted that before actual applications in marine engineering, further microscopic level studies on the potential ASR of the SSGC itself and durability tests on the long-term performance of FRP bar–reinforced SSGC members must still be studied. Additionally, the design method for FRP bar–reinforced SSGC members will be improved based on additional test data in follow-up tests.
Footnotes
Acknowledgements
Thanks to the Jiangsu Green Materials Valley New Material T&D Co., Ltd. (GMV) for providing the BFRP products, and also thanks to the Dengdian group cement Co., Ltd., Henan province, China, for providing the low basicity sulfate cement.
Declaration of conflicting interests
The author(s) declared no potential conflicts of interest with respect to the research, authorship, and/or publication of this article.
Funding
The author(s) disclosed receipt of the following financial support for the research, authorship, and/or publication of this article: The authors would like to acknowledge financial support from the Natural Science Foundation of Jiangsu Province (BK20190369 and BK20191146), the National Natural Science Foundation of China (Grant No: 51908118, 51838004, and 52078127), the “Zhishan” Scholars Programs of Southeast University, the Australian Research Council (ARC) through an ARC Discovery Grant (DP160100739), and the Key Special Project of “Technology Boosts Economy 2020” of National Key Research and Development Program (SQ2020YFF0426587).