



Abstract
A new type of composite structure, the composite box girder with corrugated steel webs (CSWs) and trusses, is proposed recently. In order to investigate the structural behavior under positive and negative bending moments, flexural tests of the continuous girder were carried out, and the failure modes, deformation patterns, strain distribution, and development of the concrete cracks were investigated. Finite element analysis was conducted to investigate the effect of the range of concrete in the steel tube and the thickness of CSWs on the flexural behavior. The experimental and numerical results show that the test beam has a good ductility and integrity under flexural load. The contribution of CSWs to the flexural bearing capacity is very small and can be neglected. Besides, the plane section assumption is still valid when only top concrete slab and bottom steel tubes are concerned. The concrete filled in bottom steel tubes increases the stiffness and the bearing capacity of the girder. Equations to calculate the flexural bearing capacity under positive and negative bending moments were put forward and then verified with experimental results.
Introduction
The composite box girder bridge with corrugated steel webs (CSWs) has a lot of advantages such as light weight, low construction cost, good durability, and efficient prestress of concrete flange (Chen et al., 2006). Since the Cognac Bridge was built in 1986 in France, composite box girder bridges with CSWs have been widely used around the world. However, the bottom concrete slab is relatively difficult to construct and prone to premature cracking (Nie et al., 2012). In 1987, the Maupre Bridge constructed in France replaced the bottom concrete slab with a single concrete-filled steel tube for the first time (Combault, 1988), but the resistance to overturning and torsion is weakened due to the adoption of an inverted triangular cross-section. Meanwhile, the construction is rather difficult as the operating space for welding CSWs and steel tube is limited.
Recently, a new type of composite structure, composite box girder with CSWs and trusses, is proposed by Chen et al. (2018). It consists of a top concrete slab, two CSWs and two concrete-filled steel tubes (CFSTs) connected by trusses. Compared with traditional PC girders, the CSWs can be welded directly on the steel tubes, reducing the weight of the main beams, improving the resistance to concrete cracking and the integrity of structure, and effectively improving the prestressing efficiency. Besides, the tensile capacity of bottom CFSTs is also higher than that of a concrete slab. Compared with a single-CFST cross-section like the one adopted in the Maupre Bridge, the cross-sectional stability of a double CFST cross-section is improved, which is good for bridge construction and later maintenance.
Many researchers have studied the mechanical performance of composite box girder with CSWs, such as the flexural behavior (Chan et al., 2002; Chen et al., 2015, 2016), the shear behavior (Hassanein and Kharoob, 2013, 2014; He et al., 2012; Xiang et al., 2020), the torsional behavior (Chen et al., 2011; Mo et al., 2000; Nie and Liang, 2007; Xiao et al., 2017), and so on. Based on experimental research and finite element (FE) analysis, Elgaaly et al. (1996, 1997) and Elgaaly and Seshadri (1997, 1998) have showed that the shear and the bending moment are mainly carried by the CSWs and the flanges, respectively. Metwally and Loov (2003) suggested that the contribution of CSWs to the flexural bearing capacity can be neglected. The FE method was adopted to analyze the flexure resistance, shear resistance, torsion resistance and shear-lag effect of concrete box girder, concrete composite box girder with plane steel webs, and concrete composite box girder with CSWs by Zhou et al. (2005). Chen and Gao (2008) analyzed the influence of filled concrete inside upper and bottom steel tubes on deformation, stress, failure modes, and ultimate capacity. Although the composite box girder bridge with CSWs has gained lots of researchers' attention, the mechanical efficiency of bottom flange and flexural behavior of such structure are still worth to be improved in the future research.
Chen et al. (2020) has investigated the flexural behavior of simply supported composite box girders with CSWs and trusses, but the flexural behavior of continuous girders was not studied. The mechanical performance of continuous girders, such as the deformation pattern, the cross-sectional stress distribution, the failure mode, and the cracking mechanism, is different with that of simply supported girders because negative bending moment will be generated. Therefore, it is necessary to investigate the flexural behavior of continuous composite box girders with CSWs and trusses.
In this research, based on the design of the right sub-bridge of the Maluanshan Park Viaduct in Shenzhen, Guangdong Province, China (Chen et al., 2018), a scaled model was tested to investigate the flexural behavior of continuous composite box girders with CSWs and trusses. Finite element analysis was conducted to investigate the effect of the range of concrete in the steel tube and the thickness of CSWs. According to the test and numerical analysis results, equations to calculate the flexural bearing capacity were proposed.
Experimental study
Details of test beam
The test beam was a two-span one-box structure with a standard span length of 9 m. Its calculated span length is 8.872 m. The depths of the girder and the diaphragms are 0.56 m and 0.6 m, respectively. The longitudinal dimensions of each standard span are shown in Figure 1(a). Figure 1(b) shows the typical cross-sectional dimensions. The width of the top concrete slab is 2.08 m, with a cantilever part of 0.56 m wide at each side. The thickness of the top concrete slab is 0.1 m. The bottom steel tubes were concrete-filled hot-rolled seamless steel tubes with a diameter and a thickness of 146 mm and 6 mm, respectively. The K-braces were made of two angle steels welded together, and the bottom trusses were made of double channel steels. Figure 1(c) shows a schematic diagram of the CSWs with a thickness of 4 mm. The length, height, and angle of the corrugation are 320 mm, 44 mm, and 31°, respectively. Figure 1(d) shows the arrangement of pre-stressed tendons, which were installed at the top concrete slab near the middle diaphragm to withstand negative bending moments. There are total 12 tendons installed in this girder, and the diameter of each tendon is 15.2 mm. The elastic modulus of the tendons is 1.95 × 10⁵ MPa. When the concrete strength after casting reached 75% of the design value, the tendons were symmetrically tensioned. The tensile strength f
pk
of the tendons is 1860 MPa, and the controlling prestressing stress is 0.72 f
pk
, which is equal to 1302 MPa. The scale between the specimen and the prototype bridge is 1:5. Design of test specimen (unit: mm): (a) elevation view of standard span of test beam; (b) typical cross-section of test beam; (c) standard cross-section of corrugated steel web; and (d) plan of pre-stressed tendons.
Material properties.

Loading devices and measuring instrumentation
The loads applied to the test beam were determined by the rule that the resultant stress and strain of the test beam and the prototype bridge should be the same. Concrete blocks with a height of 0.45 m were first placed on the top surface of the concrete slab to simulate the dead load. Two 200-ton hydraulic jacks were used to apply the live loads. Two transfer beams were used to apply the concentrated loads. The loading position is shown in Figure 2(a). Figure 2(b) shows the overview of the loading devices. Loading of test beam: (a) schematic diagram (unit: mm) and (b) loading site.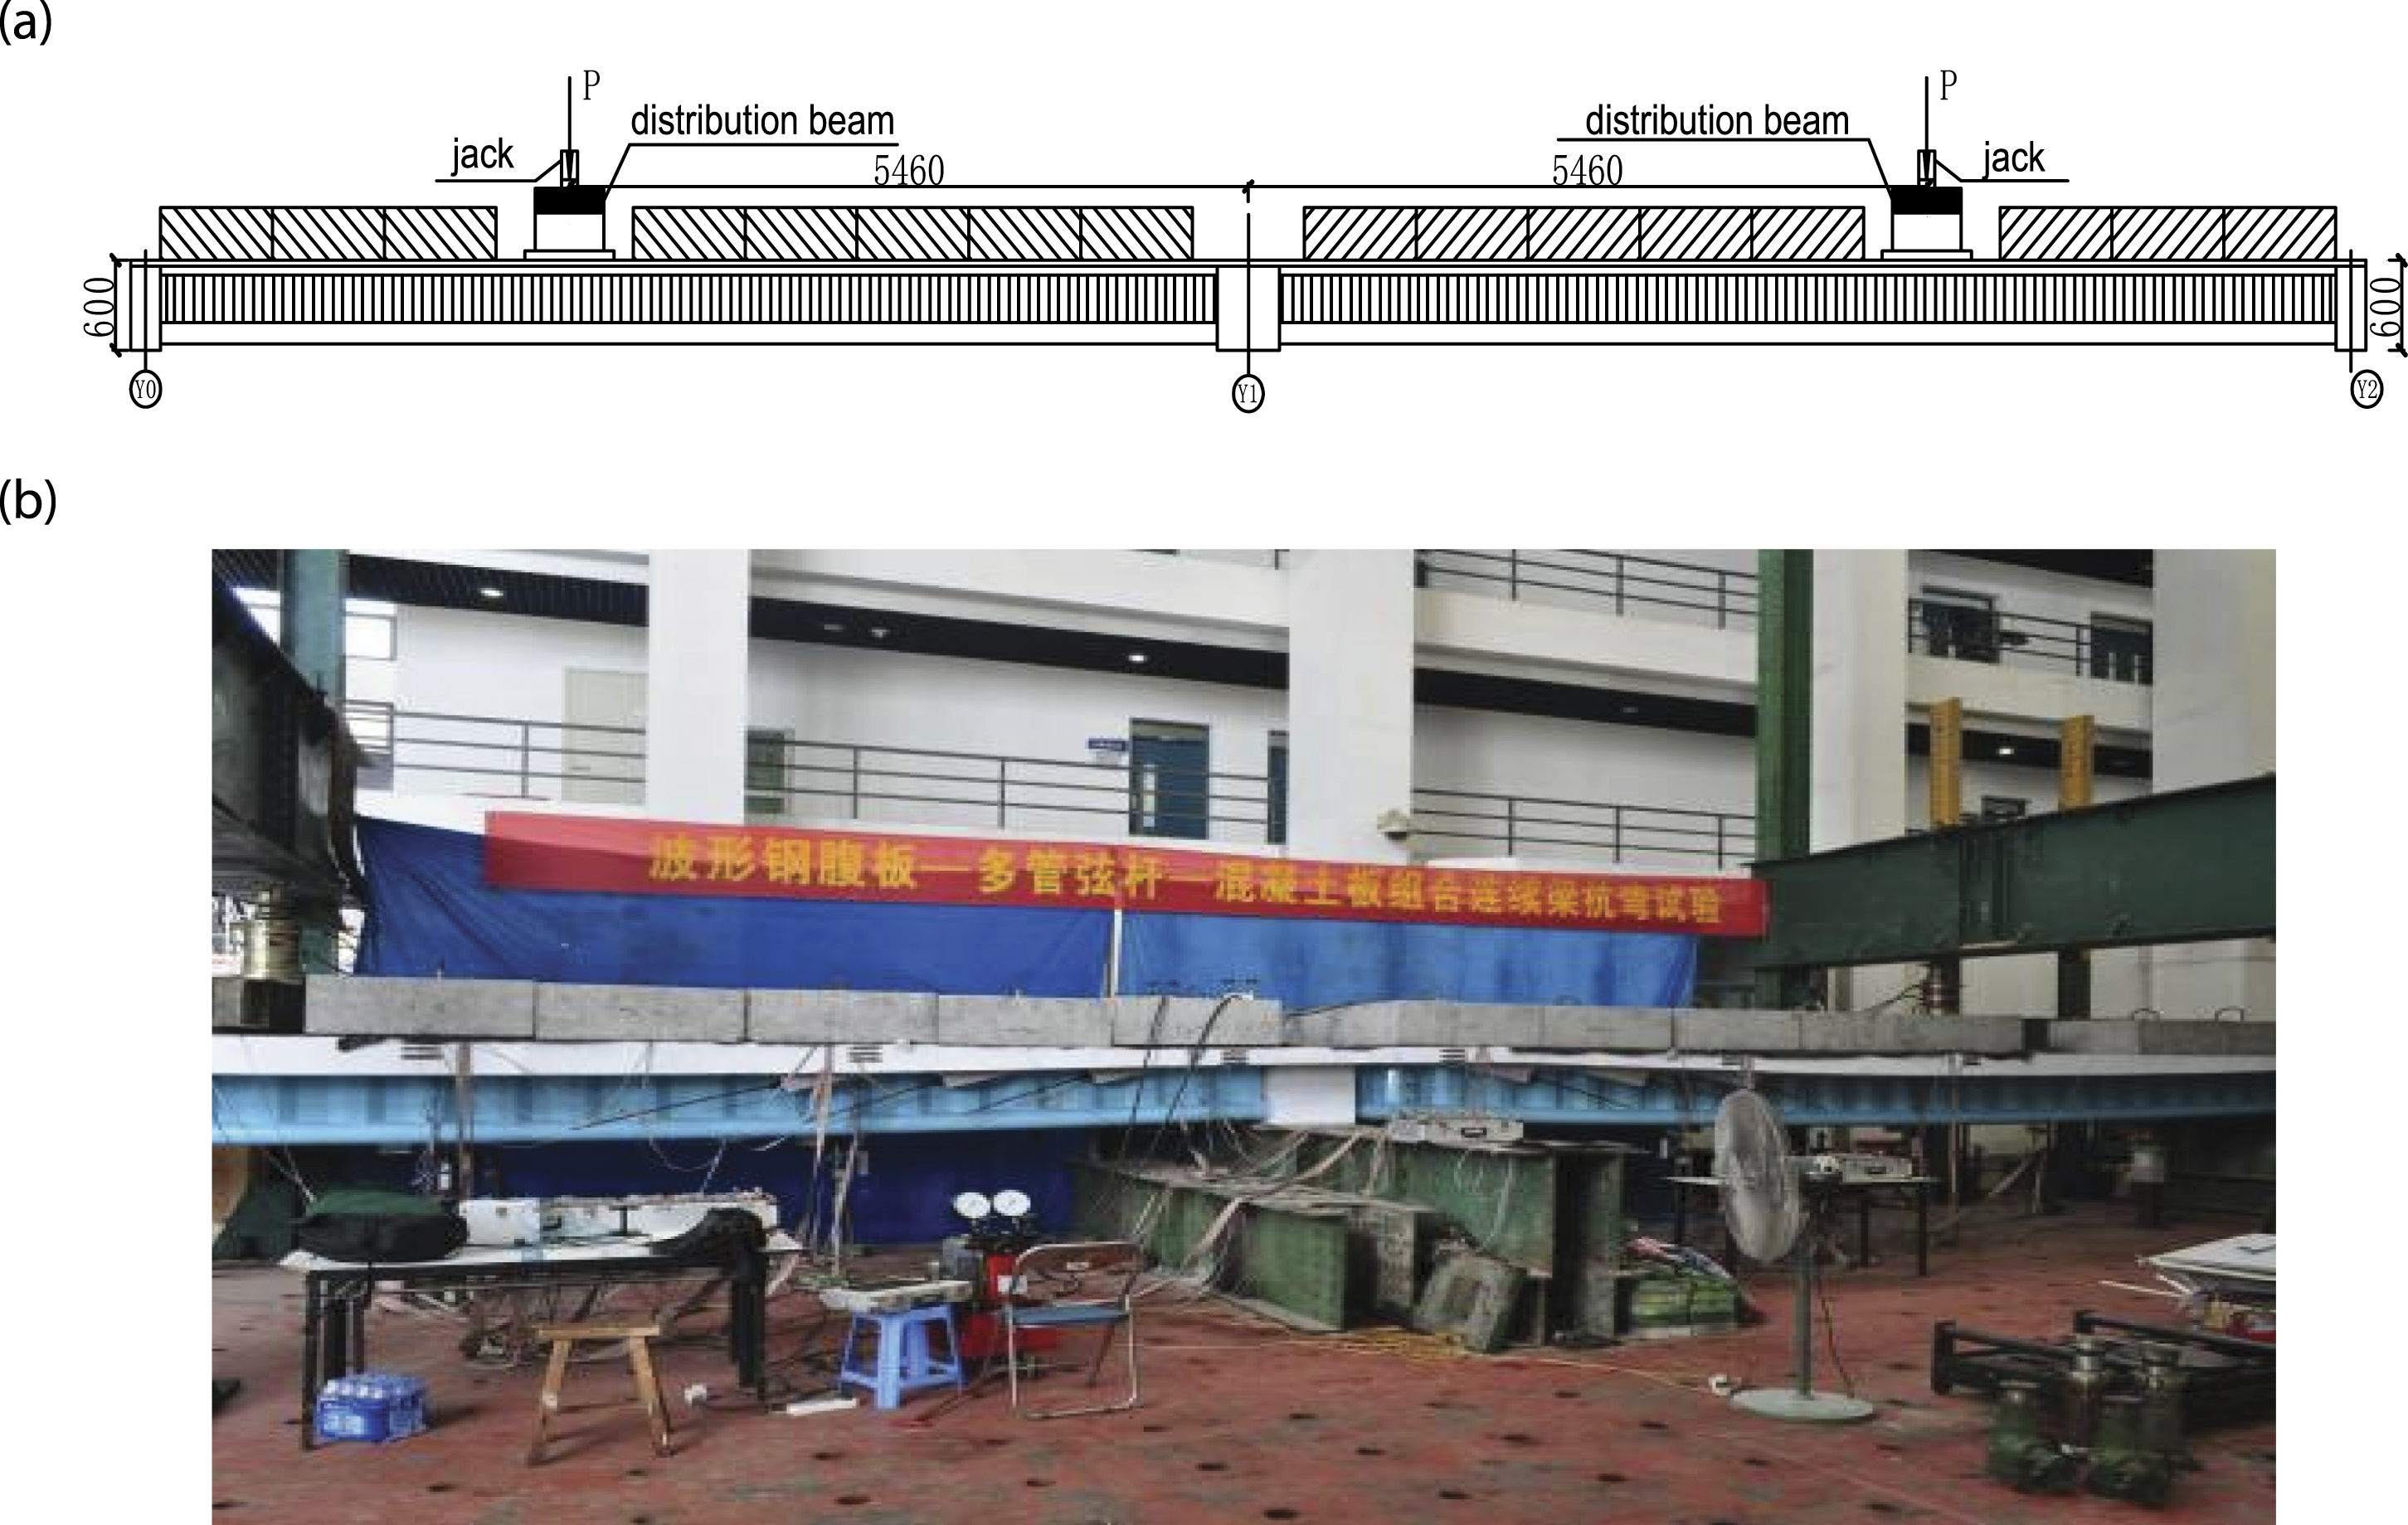
Figure 3(a) shows the side view, and Figure 3(b) shows the arrangement at a typical cross-section of the measuring instrumentation. 12 linear variable differential transformers (LVDTs) were installed at the bottom edge of two bottom steel tubes to measure the deflection of the specimen (A1, A2…A12). 12 inclinometers were fixed on the corresponding positions of LVDTs to measure the rotation angle (A1', A2'…A12'). 19 longitudinal strain gauges were symmetrically arranged at each measuring section on the surface of the top concrete slab. Moreover, strain gauges were also equipped in the reinforcements in the top concrete slab. A total number of 36 strain rosettes were arranged at the upper, middle, and lower parts of the CSWs. Moreover, three longitudinal strain were arranged at each measuring section of each bottom steel tube, where were located on the top, bottom, and lateral edges, respectively. Measuring instrumentation (unit: mm): (a) side view and (b) typical cross-section.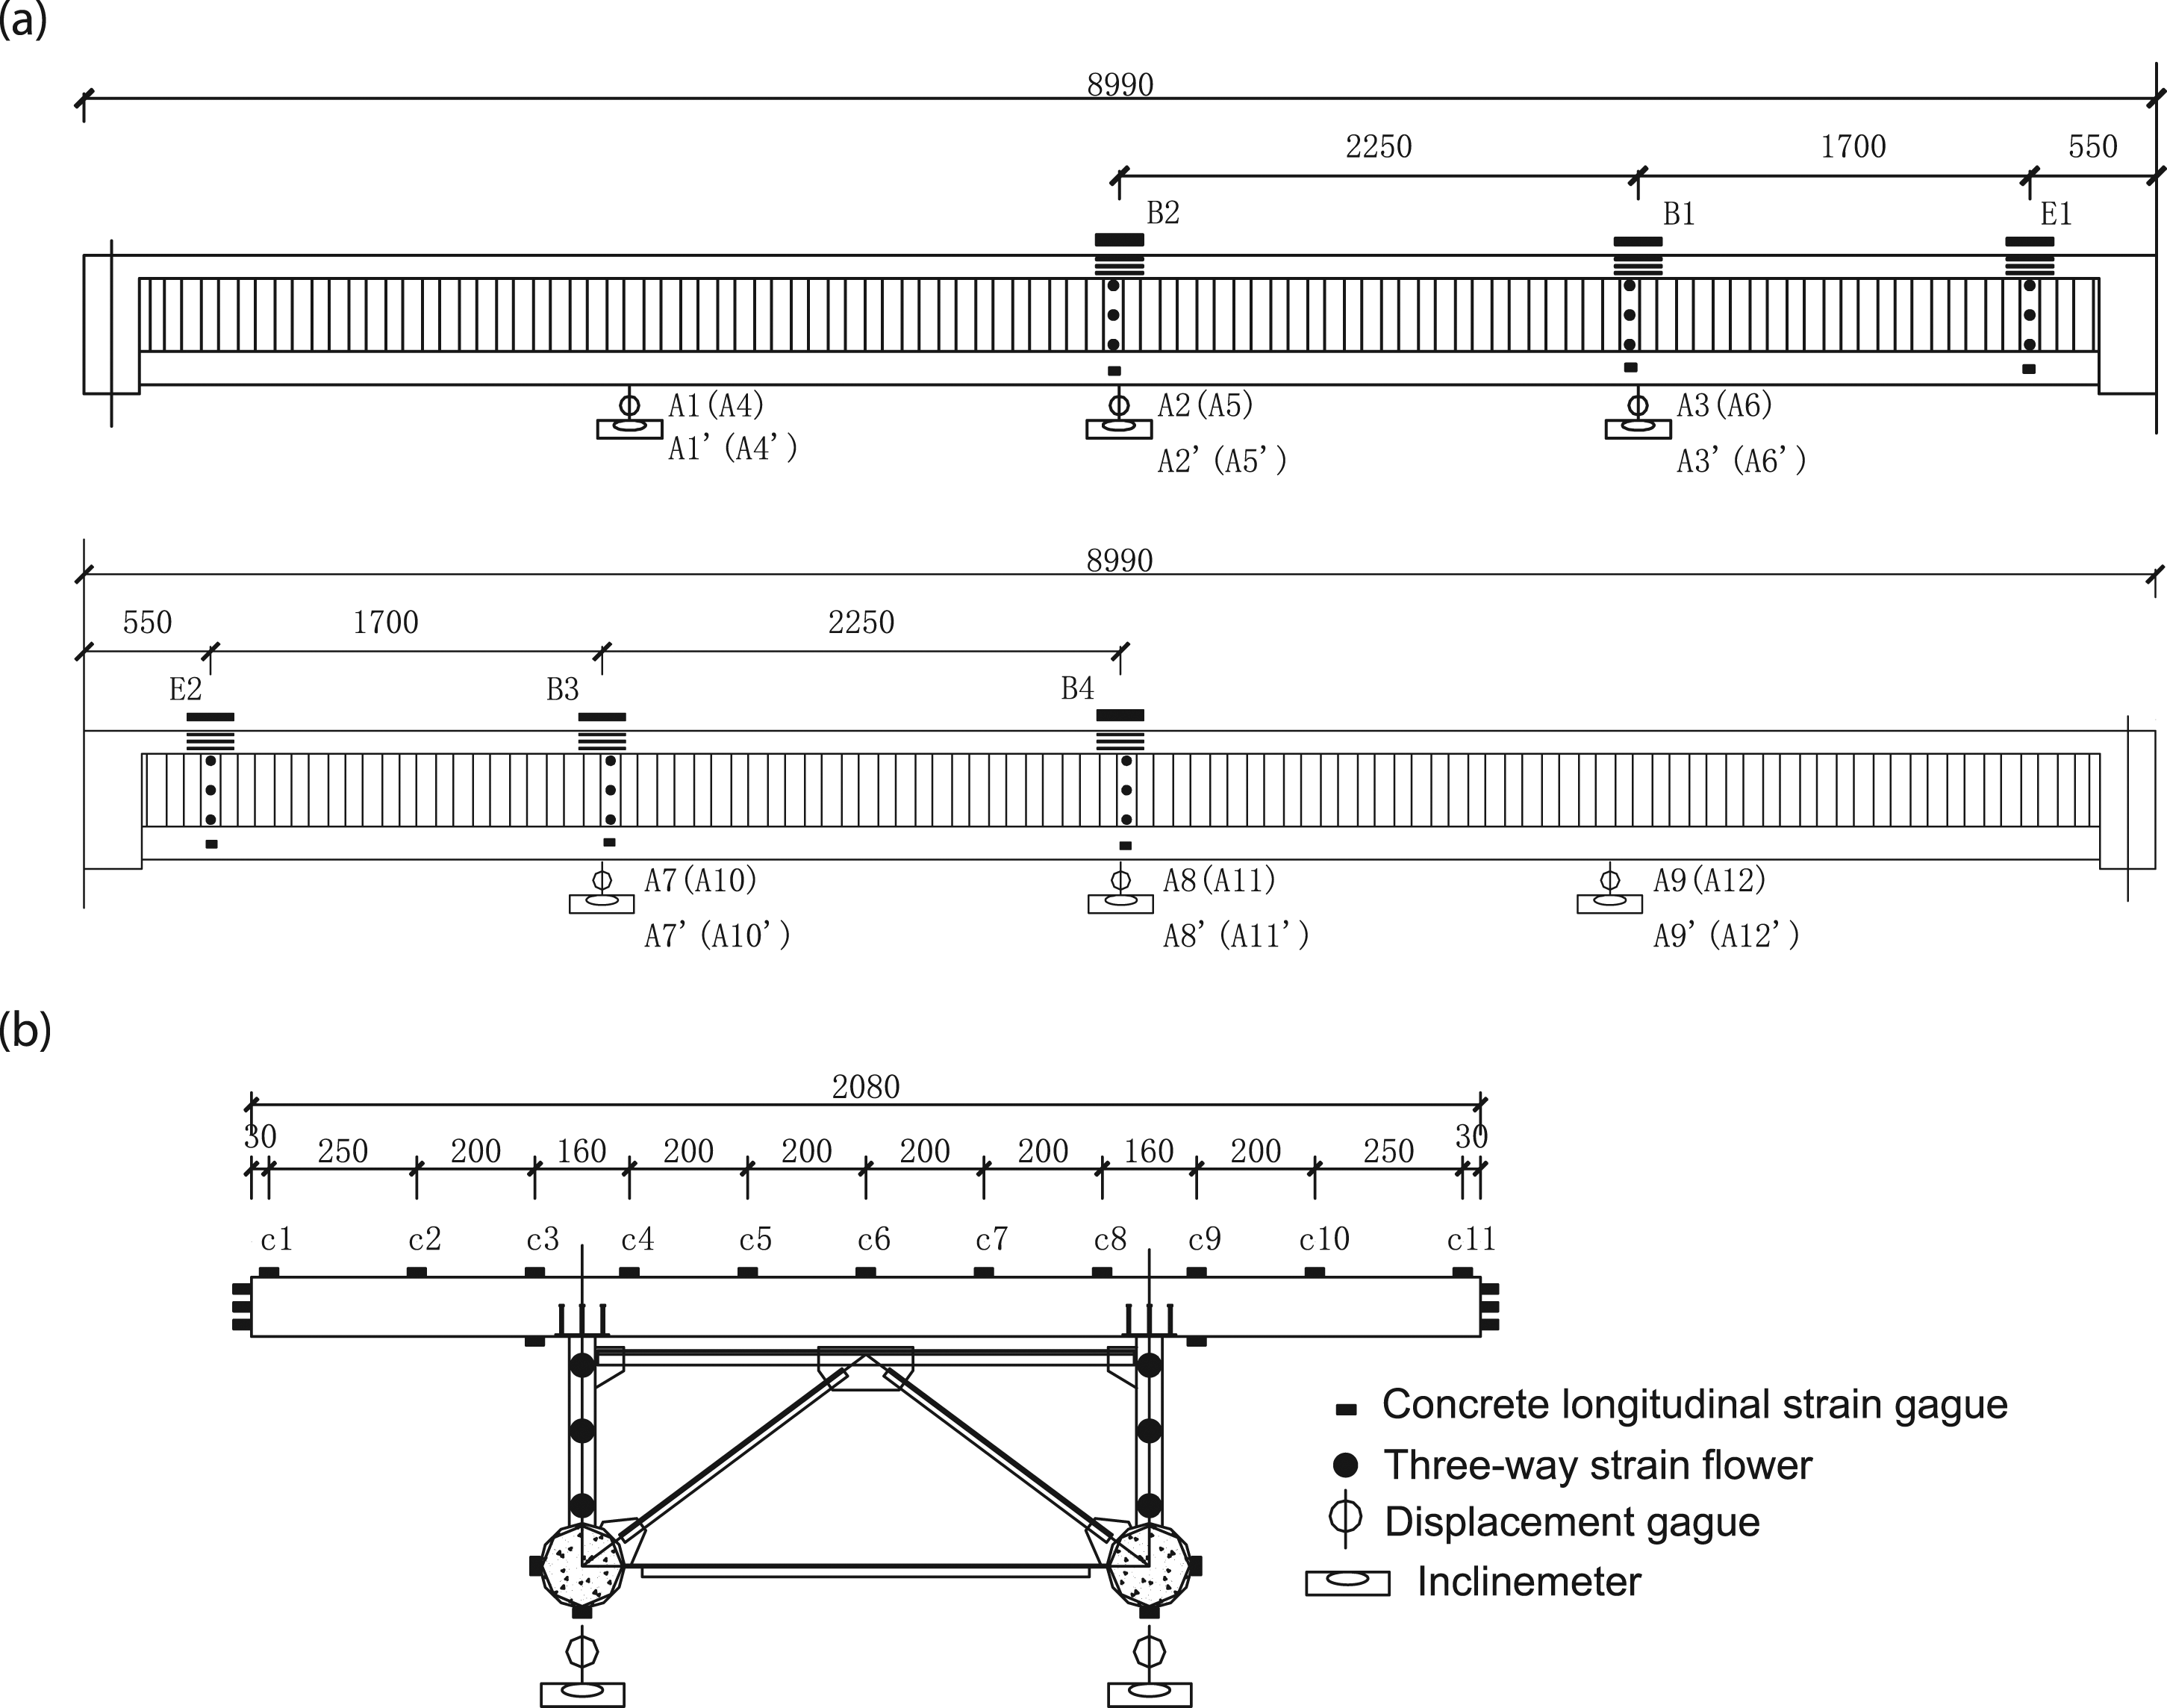
Test procedures
Before the flexural test, 10% of predicted ultimate bearing capacity was applied for preloading. The preloading force was held for 3 min and then unloaded. The concentrated load was applied under a force control process. In the elastic stage, the load was increased by 10 kN and held for 2 min at each step. In the elastoplastic stage, the added load reduced to 5 kN at each step. During the elastoplastic stage, the readings were taken after the reading of LVDTs was stable. When the test beam was about to fail, the load was slowly and continuously applied until the failure happened.
Test results and analysis
Test process and failure mode
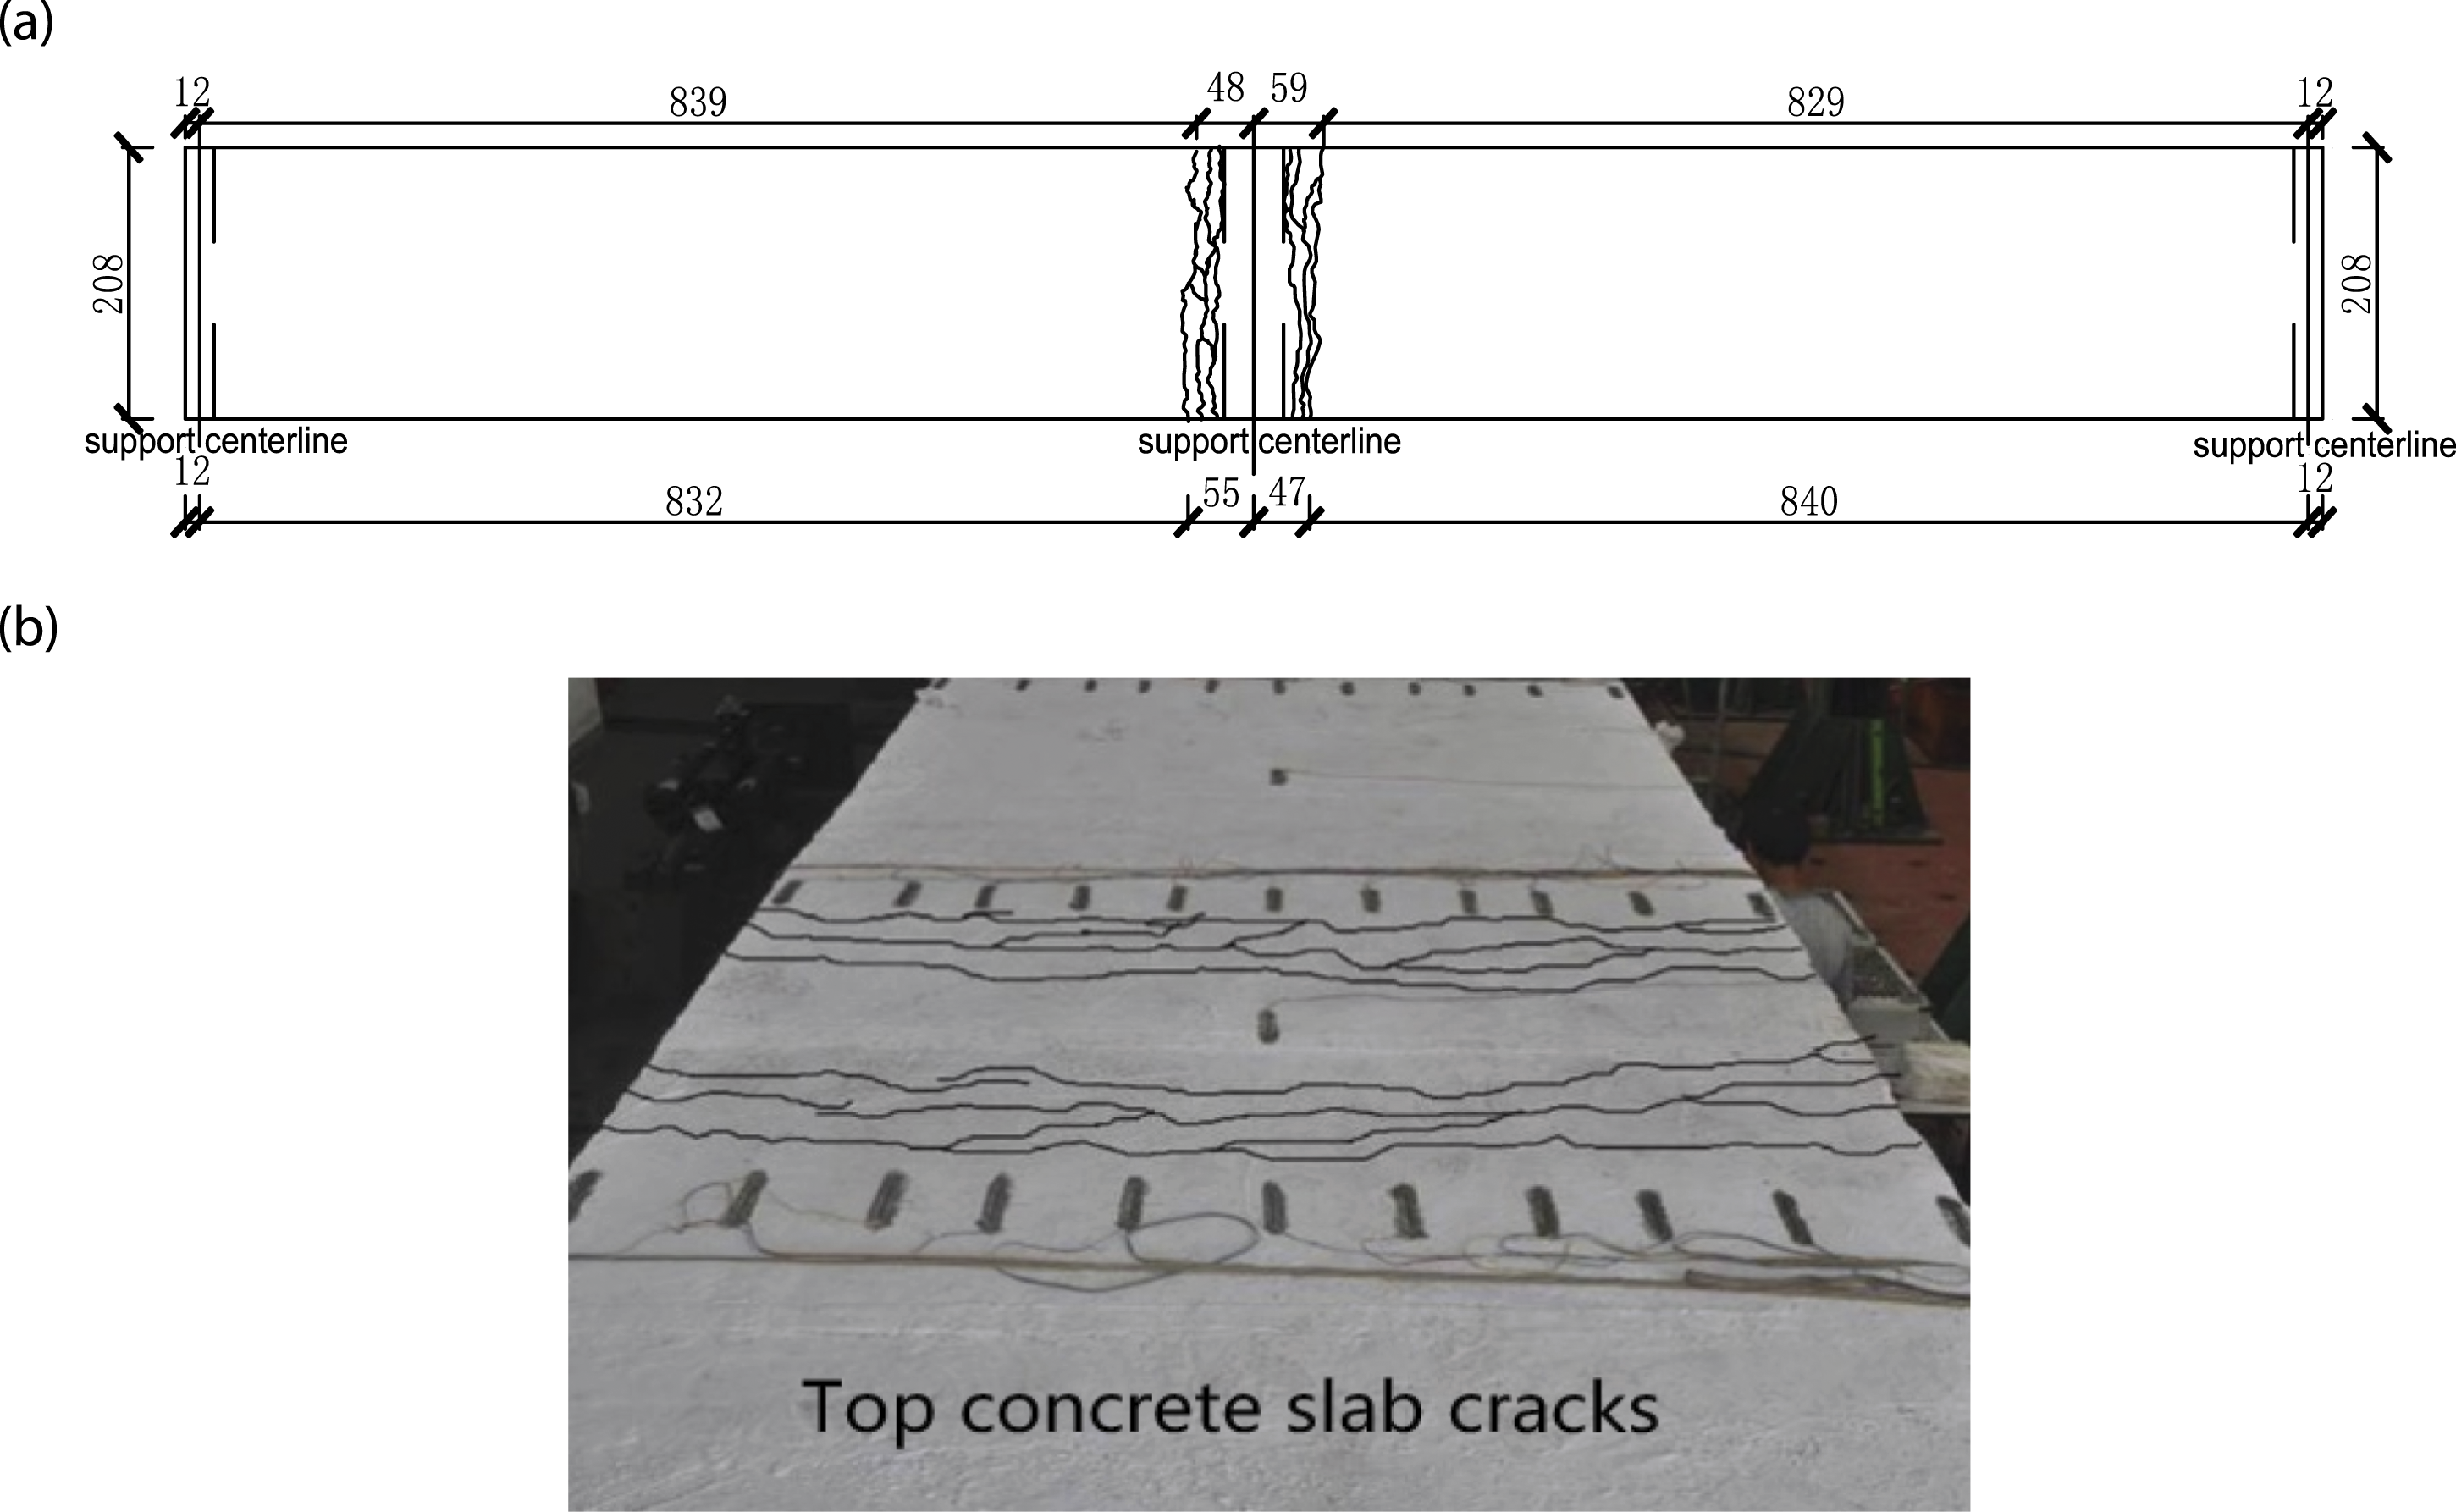
The dead load was first applied using the concrete blocks, and then the concentrated load was applied. At a load of 270 kN, the first transverse crack in the negative bending moment area appeared at the connection location between the top concrete slab and the middle diaphragm; the test beam entered the elastoplastic stage. Then, several transverse cracks appeared, with a longitudinal interval of 5 cm–10 cm. At a load of 570 kN, the bottom steel tubes in the positive bending moment area yielded. When the load reached 610 kN, the first crack in the positive bending moment area was detected at the loading position at the bottom surface of the top concrete slab. At a load of 670 kN, the bottom steel tubes under negative bending moment also yielded, and the transverse crack in the negative bending moment area developed from the top to the bottom of the concrete slab. The crack distribution at the bottom of the concrete slab in the positive bending moment area is shown in Figure 4. Finally, at a load of 1010 kN, the deflection at the mid-span section of the test beam is about 1/68 of the span length and the test specimen was regarded to be failed. The cracks developed to 1/3 height of the concrete slab thickness. The crack distributions at the top of the concrete slab are shown in Figure 5. When the test beam failed, six transverse cracks throughout the whole section were observed in negative bending moment area. The ultimate concentrated load was then determined as 1010 kN. Crack distribution at the bottom of the top concrete slab in positive bending moment area: (a) crack schematic (unit: mm) and (b) photo of cracks. Crack distribution at the top of the top concrete slab in negative bending moment area: (a) crack schematic (unit: mm) and (b) photo of cracks.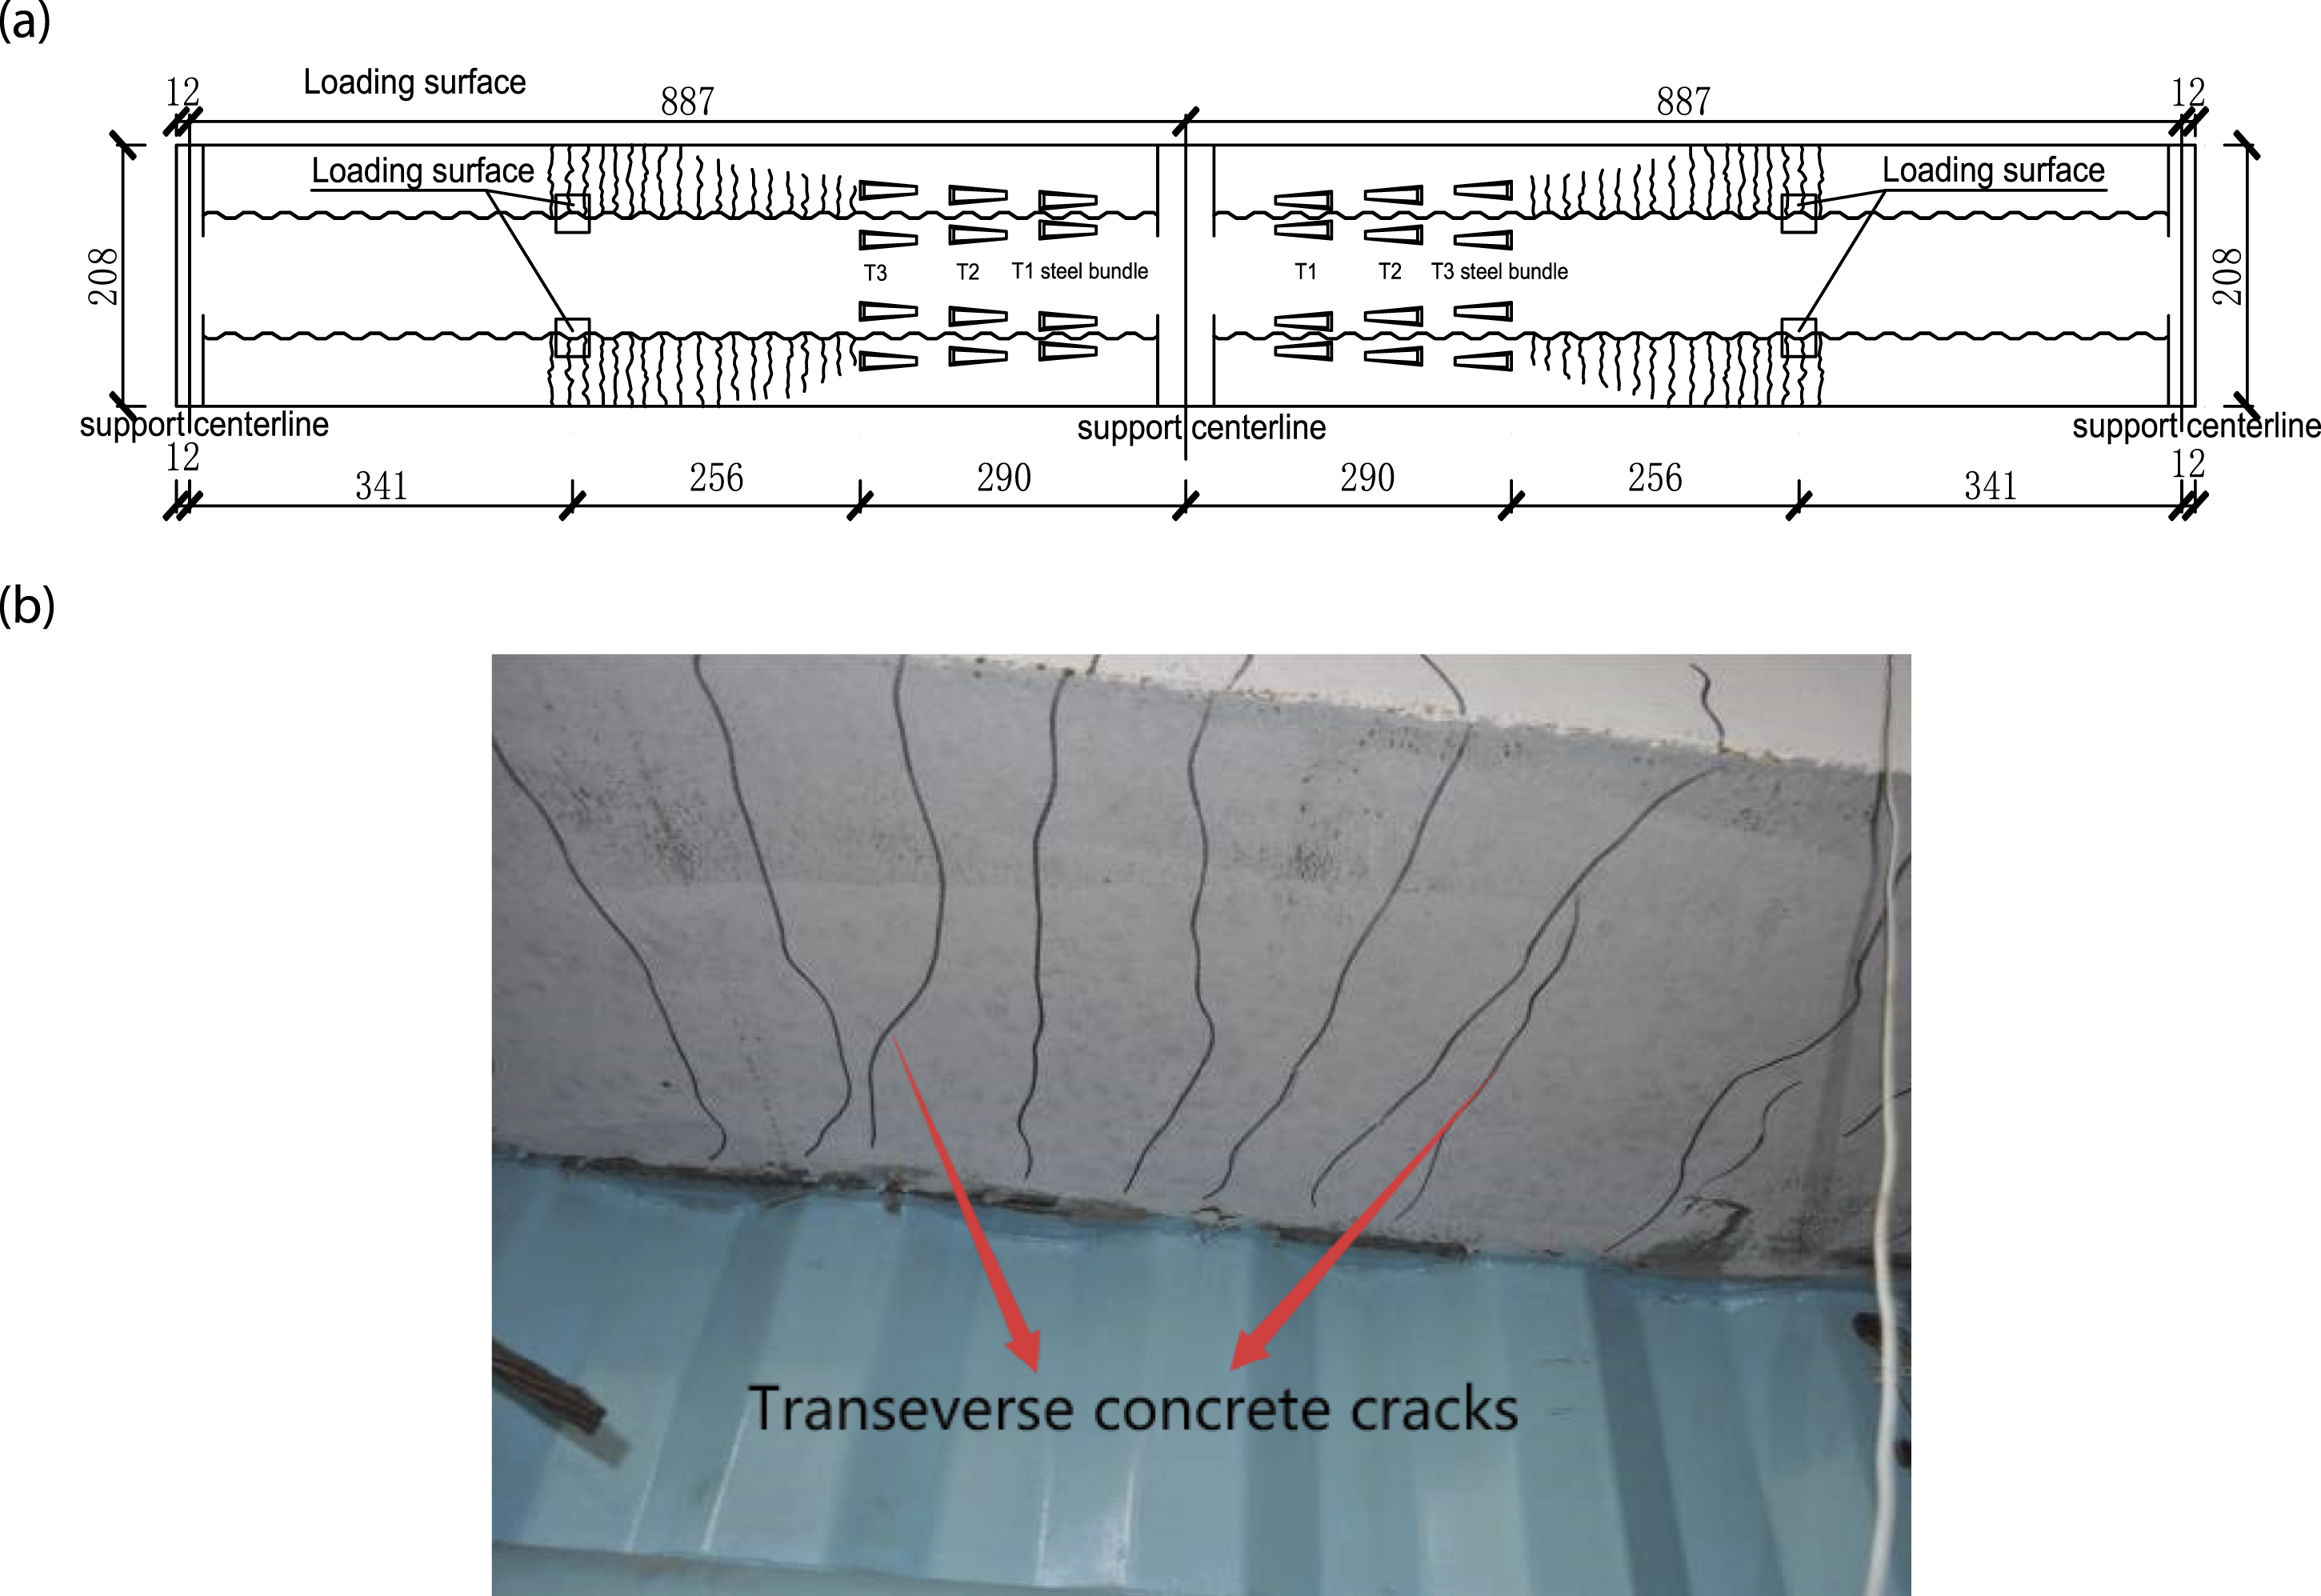
Analysis of load–deflection curves
Figure 6 shows the load–deflection curves at locations x = L/4 and x = L/2 of the specimen (where x is the coordinate along the longitudinal direction and L is the span of the test beam). When loaded to 1010 kN, the maximum deflection reached 12.95 cm at the location x = L/2 of the test beam, which is 1/68.5 of the calculated span. Specially, the deflection corresponding to plastic stage is 9.18 cm and comprises 70.9% of the maximum deflection. Load–deflection curves at locations x = L/4 and x = L/2 of the test beam.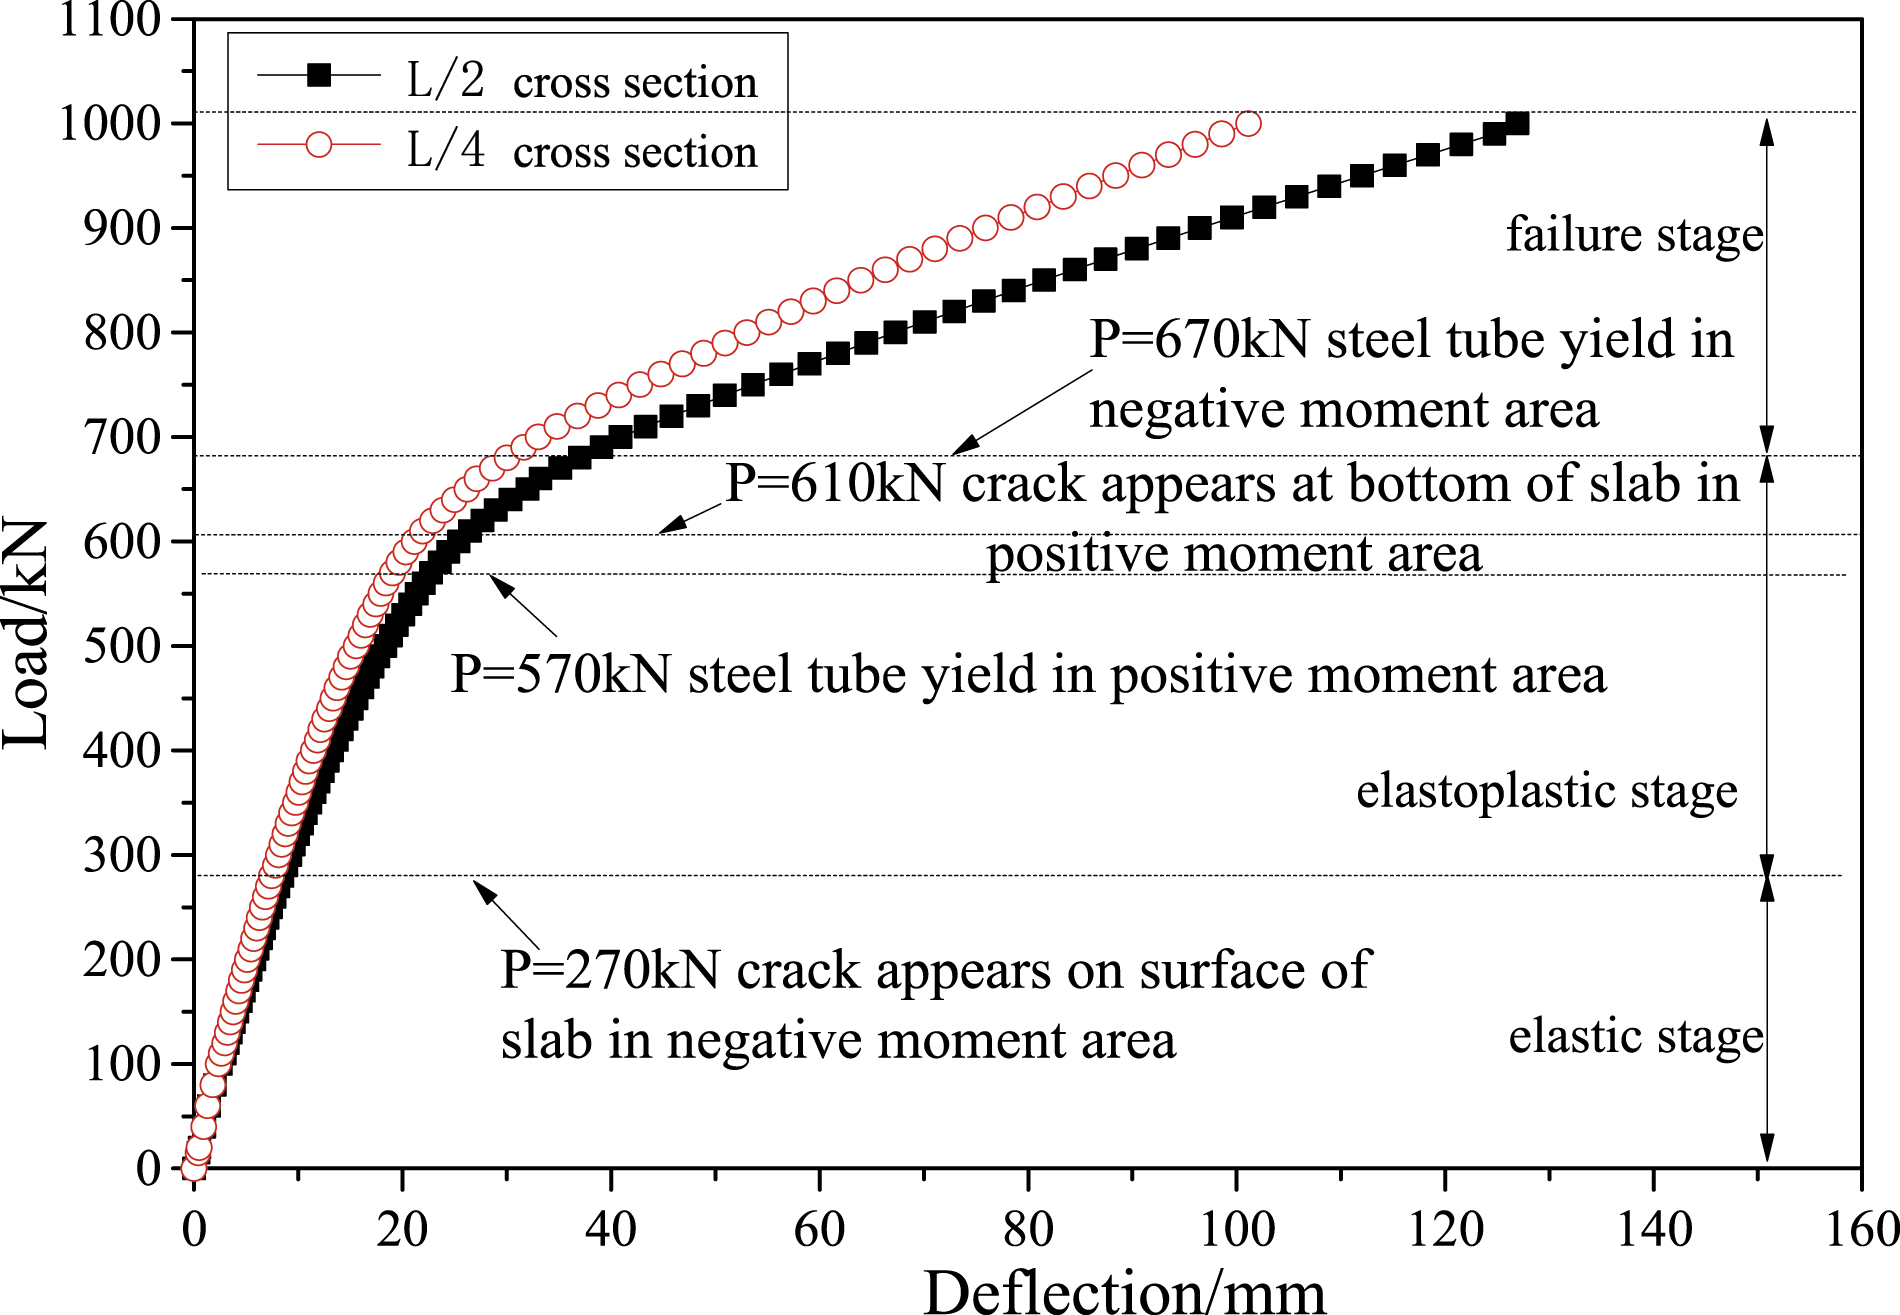
Based on the deflection and the strain at the mid-span, the deformation of the test beam can be divided into three stages.
The load within 0–270 kN is defined as the elastic stage. At this stage, the deflection increased almost linearly with the flexural load. All components were in good condition. Furthermore, the readings of hydraulic jacks, strain gauges and LVDTs were stable.
When loaded to 270 kN, the test beam reached the elastoplastic stage. The first crack in the negative bending moment area occurred at the top of the top concrete slab; thus, the load–deflection curves became nonlinear. When loaded to 570 kN, the steel tubes yielded in positive bending moment area, resulting in a decrease of stiffness. When the load increased to 610 kN, a crack was detected at the bottom of the top concrete slab in positive bending moment area.
The load of 670 kN is defined as the beginning point of the plastic stage because at this point steel tubes in the negative bending moment area yielded. At this stage, the deflections at locations x = L/4 and x = L/2 of the test beam grew rapidly. With the yielding area of the steel tubes extending from the bottom edge to the top edge at the mid-span, the cross-sectional neutral axis kept moving upward. Finally, at a load of 1010 kN, the mid-span section deflection is about 1/68 of the span length and the specimen failed.
Analysis of load–strain curves
Longitudinal strain of bottom steel tubes
Figure 7(a) shows the load–strain curve of the bottom edge of the bottom steel tube in positive bending moment area. When the load increased to 570 kN, the steel tube yielded with the tensile strain of 1717 με. When loaded to 610 kN, the stiffness of the structure decreased due to the development of the cracks, leading to the reduction of the slope of the curve. Load–strain curves of the bottom edge of the bottom steel tubes in (a) positive bending moment area and (b) negative bending moment area.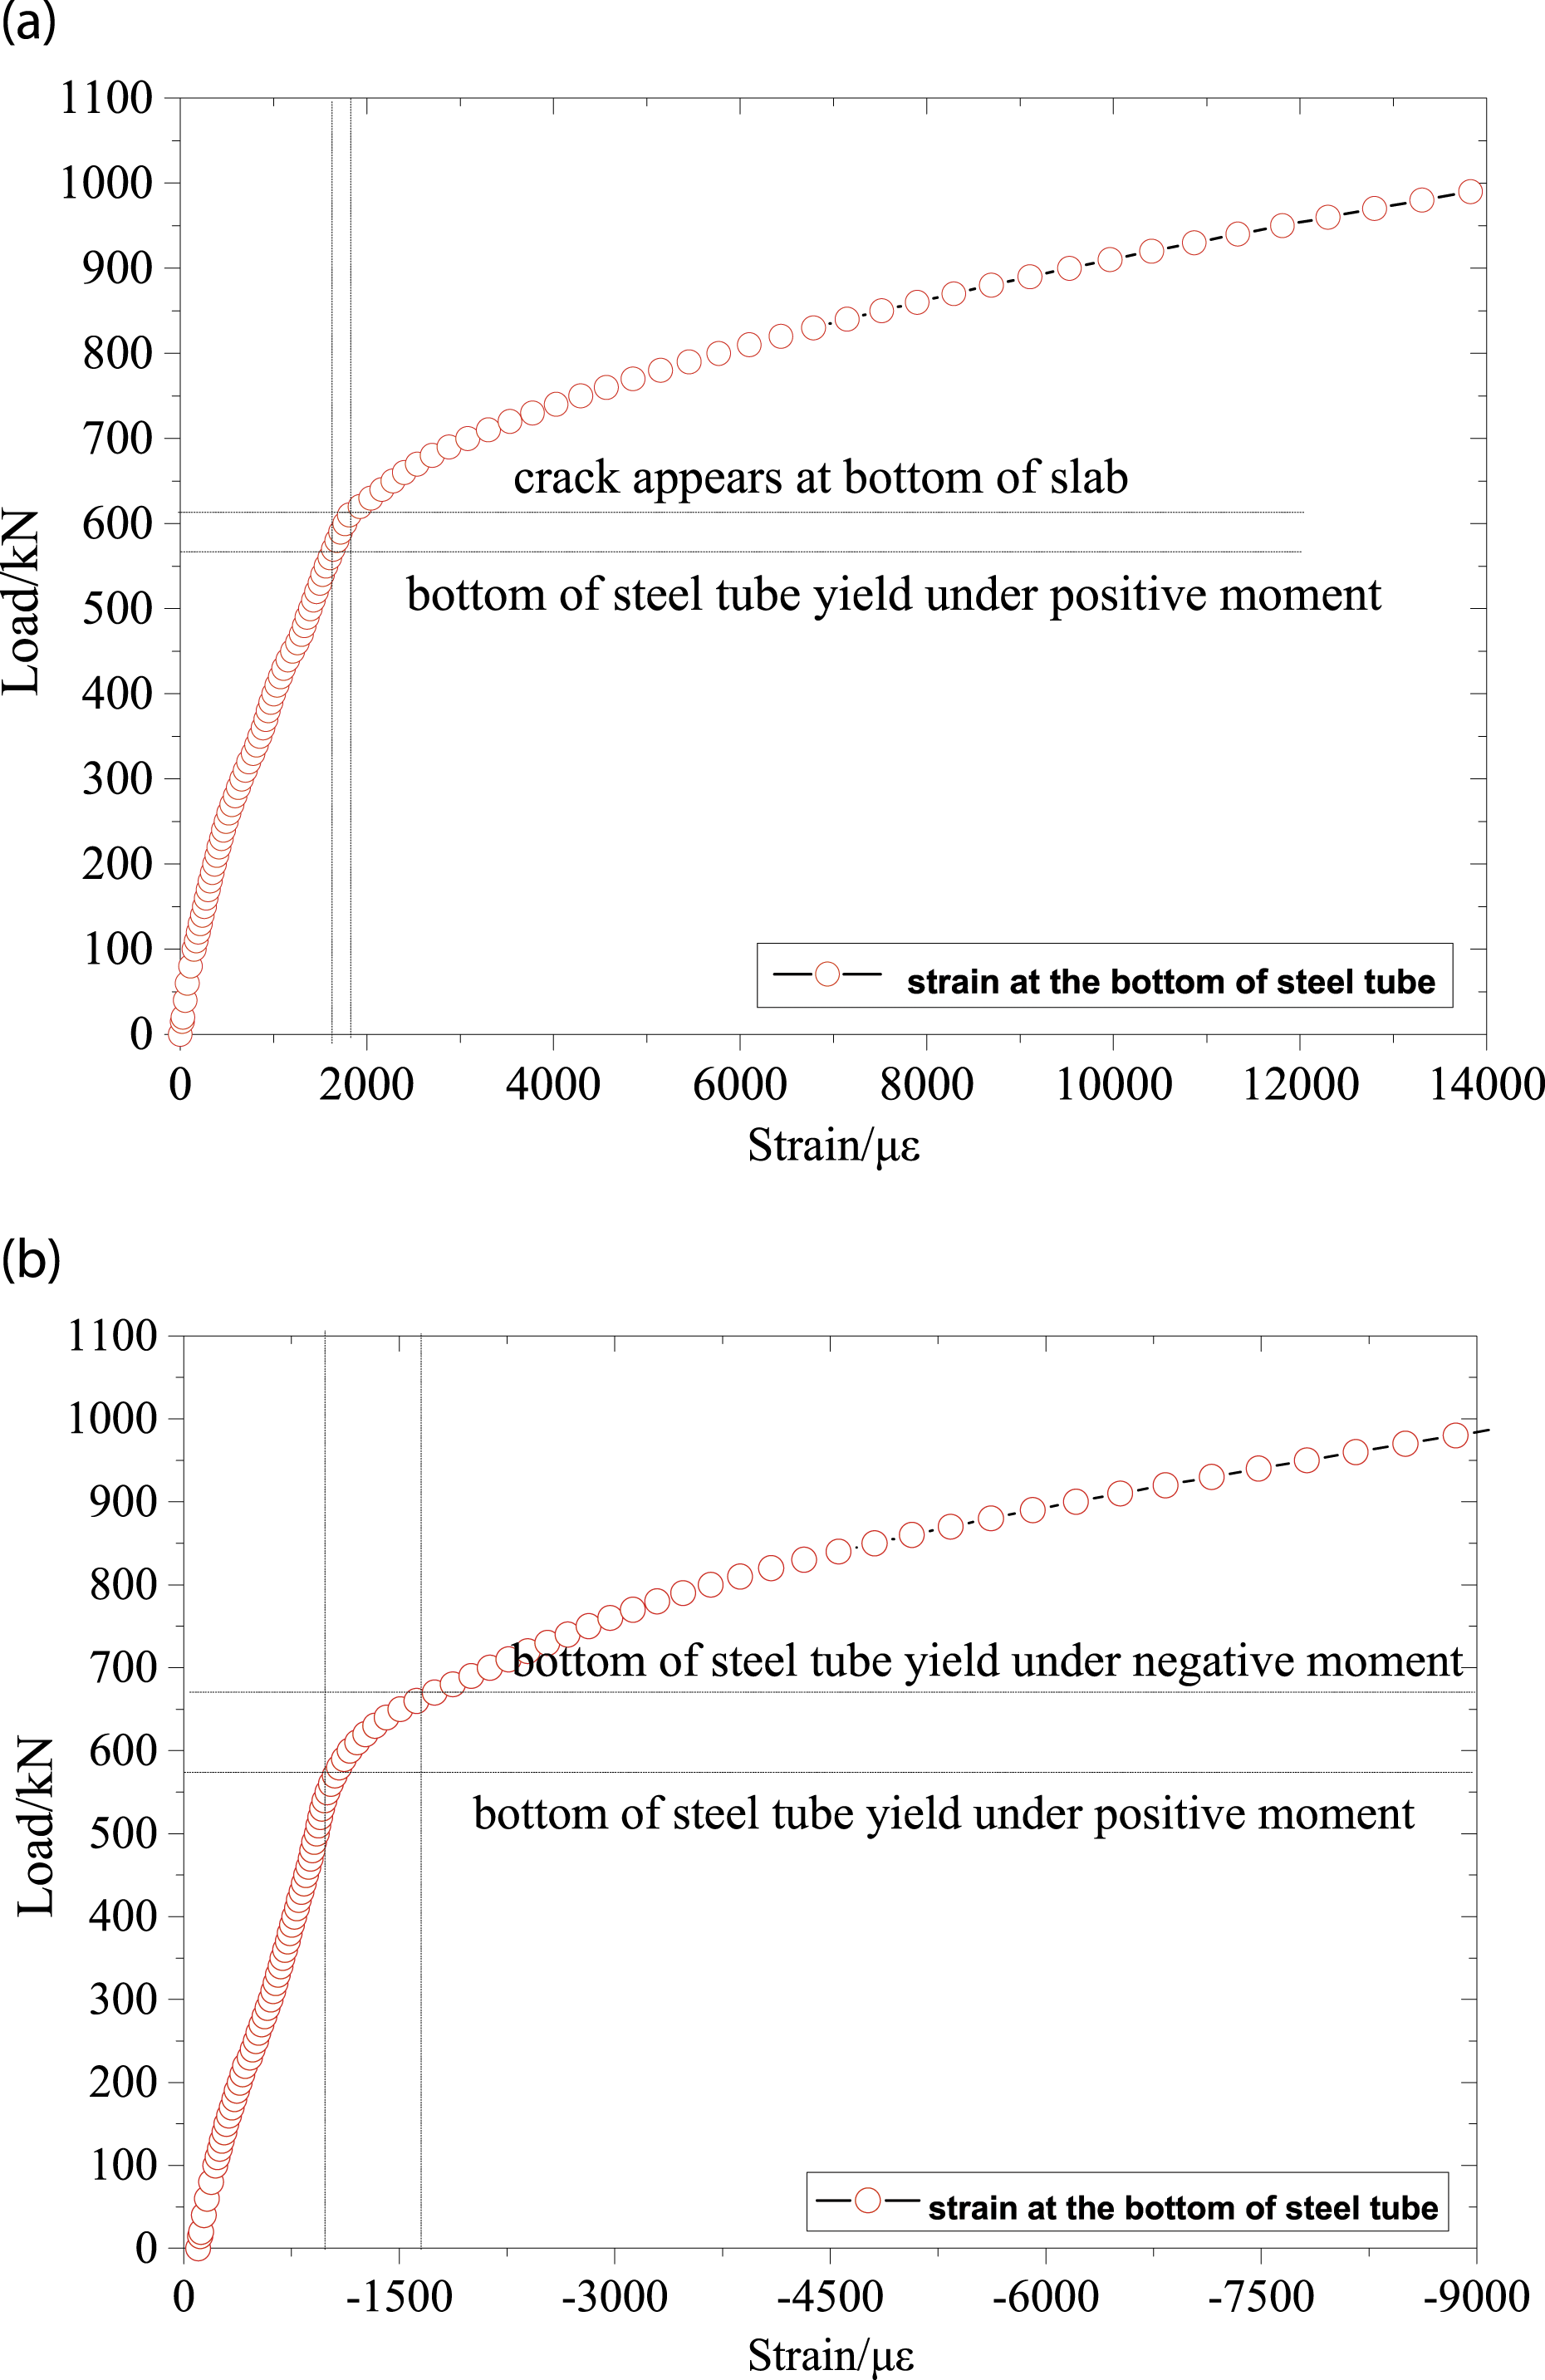
Figure 7(b) shows the load–strain curve of the bottom edge of the bottom steel tube in negative bending moment area. When loaded to 670 kN, the compressive strain at the interface between the top concrete slab and the middle diaphragm was 1772 με, which was larger than the yield strain 1705 με. Since then, the compressive strain kept increasing until the failure of the test beam, and the maximum compressive strain of 8089 με.
Longitudinal strain of the top concrete slab
Figure 8(a) and (b) show the load–strain curves of the top and the bottom of the top concrete slab in positive bending moment area, respectively. At the elastic stage, the compressive strain at top surface and the tensile strain at the bottom surface of the top concrete slab increased linearly. When loaded to 610 kN, a crack occurred at the bottom of the top concrete slab and then the strain increased nonlinearly. Subsequently, several transverse cracks with a longitudinal interval of 5 cm–10 cm were observed from the mid-span to the anchorage location of pre-stressed tendon T3, the range of which was up to 2.56 m. Load–strain curves of the top concrete slab: (a) top surface in positive bending moment area; (b) bottom surface in positive bending moment area; and (c) top surface in negative bending moment area.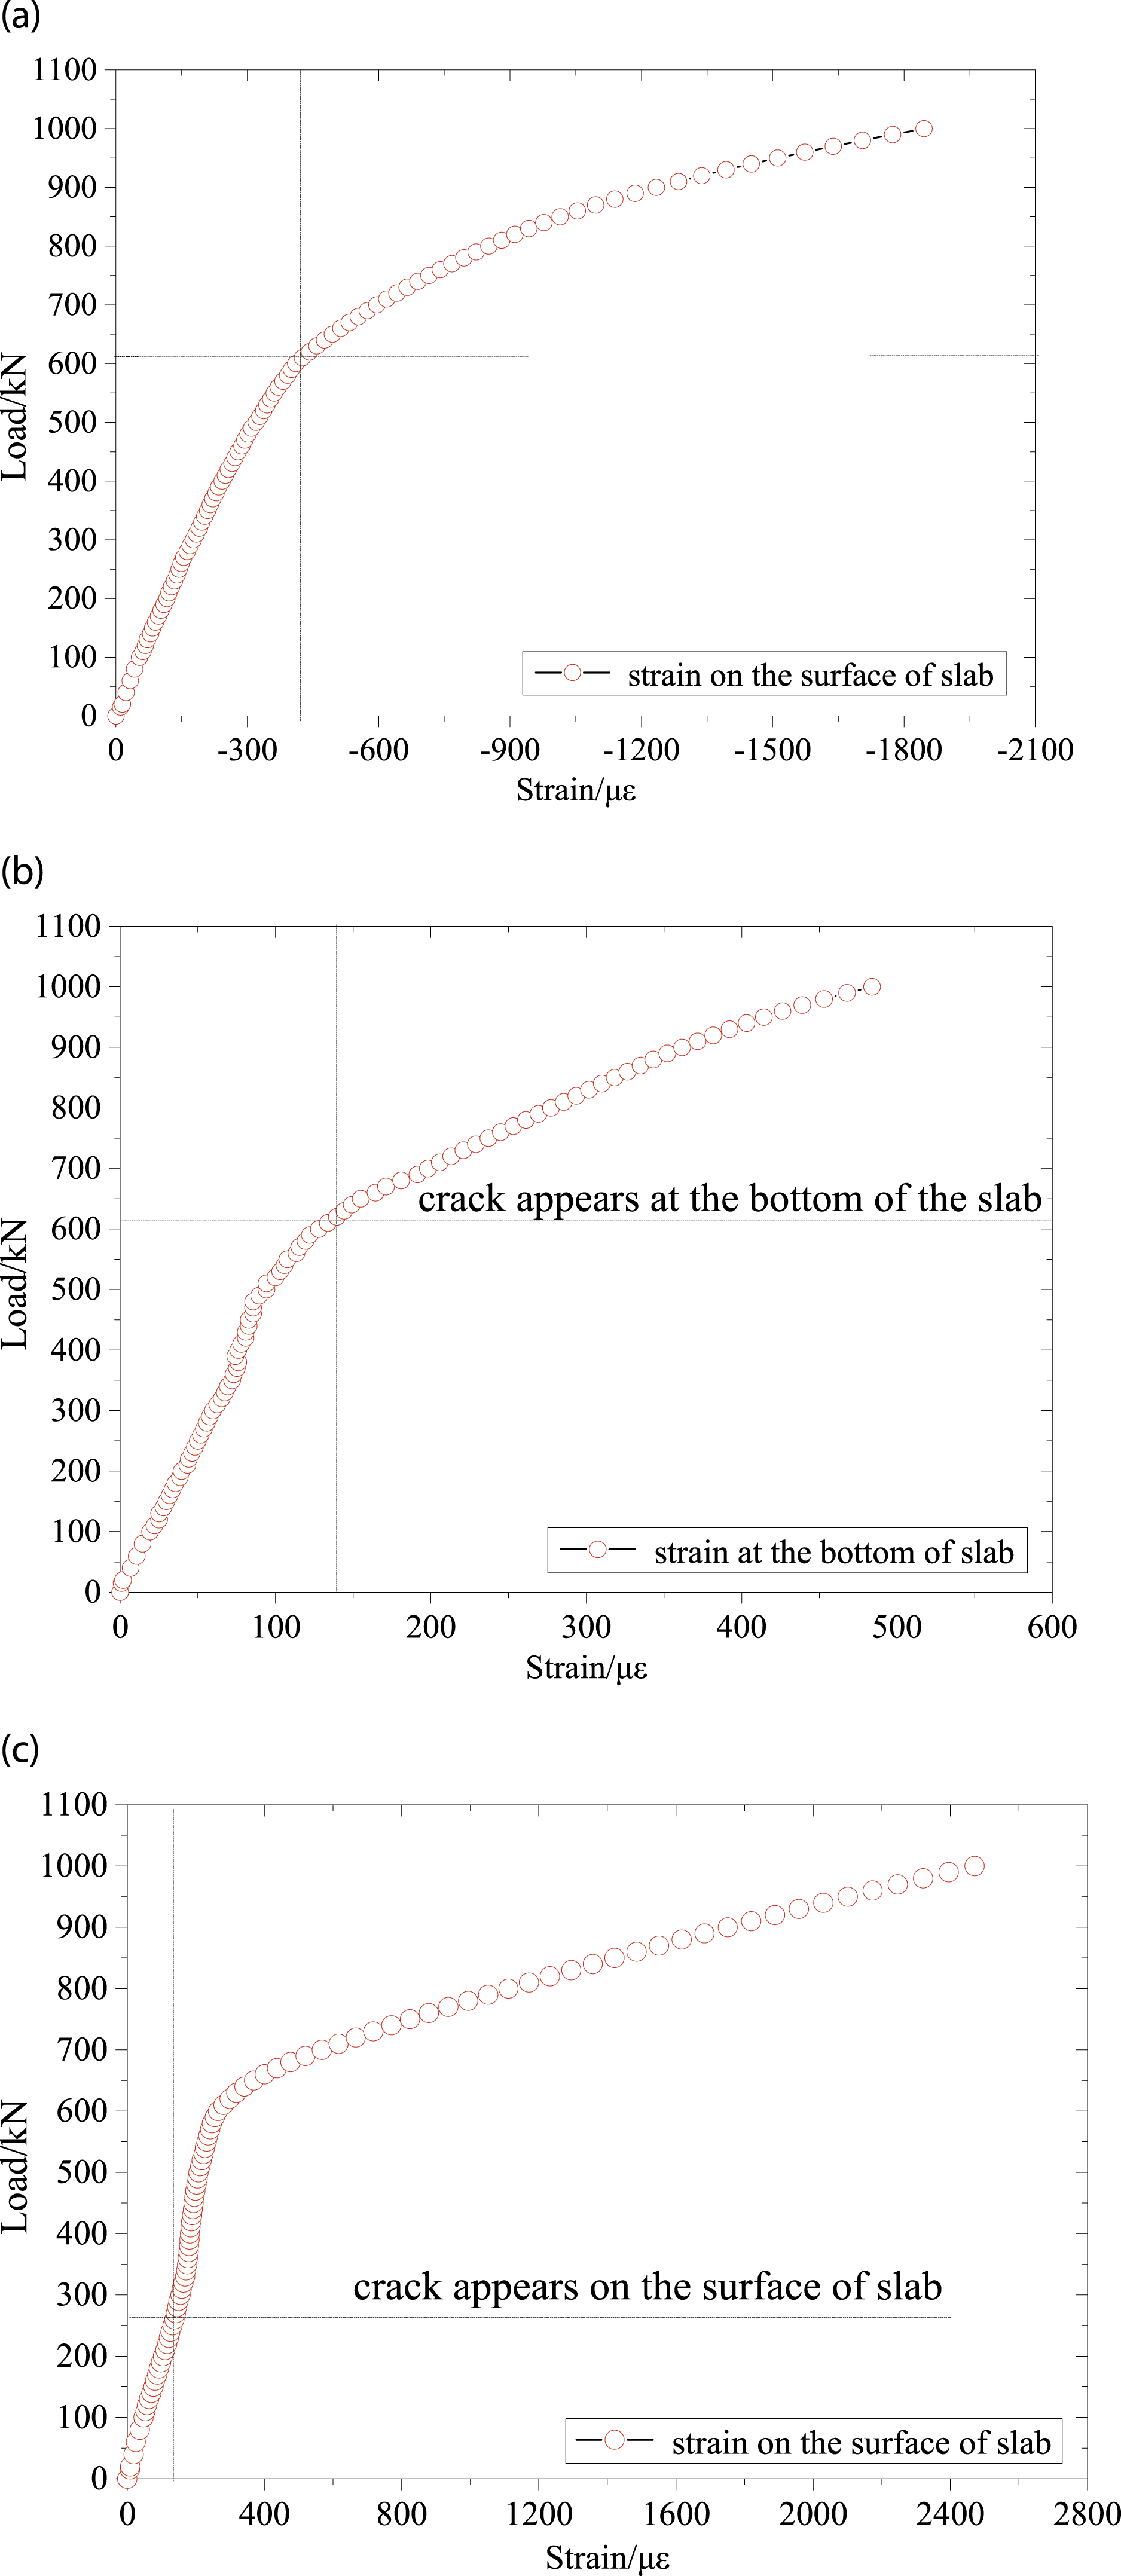
Figure 8(c) shows the load–strain curve of the top surface of the top concrete slab in negative bending moment area. Before the cracks appeared, the tensile strain of the top concrete slab increased linearly.
Longitudinal strain of the reinforcement
Figure 9 shows load–strain curve of the steel reinforcement in the negative bending moment area. At the initial stage of loading, the test beam was in an elastic state. After the load reached 270 kN, the concrete near the first crack in the negative bending moment area was unable to carry the tensile stress. As the area under tension developed from the top surface to the bottom surface, the stiffness of the top concrete slab decreased. Therefore, the cross-sectional stress redistributed, which accelerated the increase of the tensile stress of the reinforcement. When loaded to 670 kN, the tensile strain of the reinforcement increased with a larger rate until yielded due to the yielding of bottom steel tubes at the connecting location between the top concrete slab and the middle diaphragm. Load–strain curve of the reinforcement in negative bending moment area.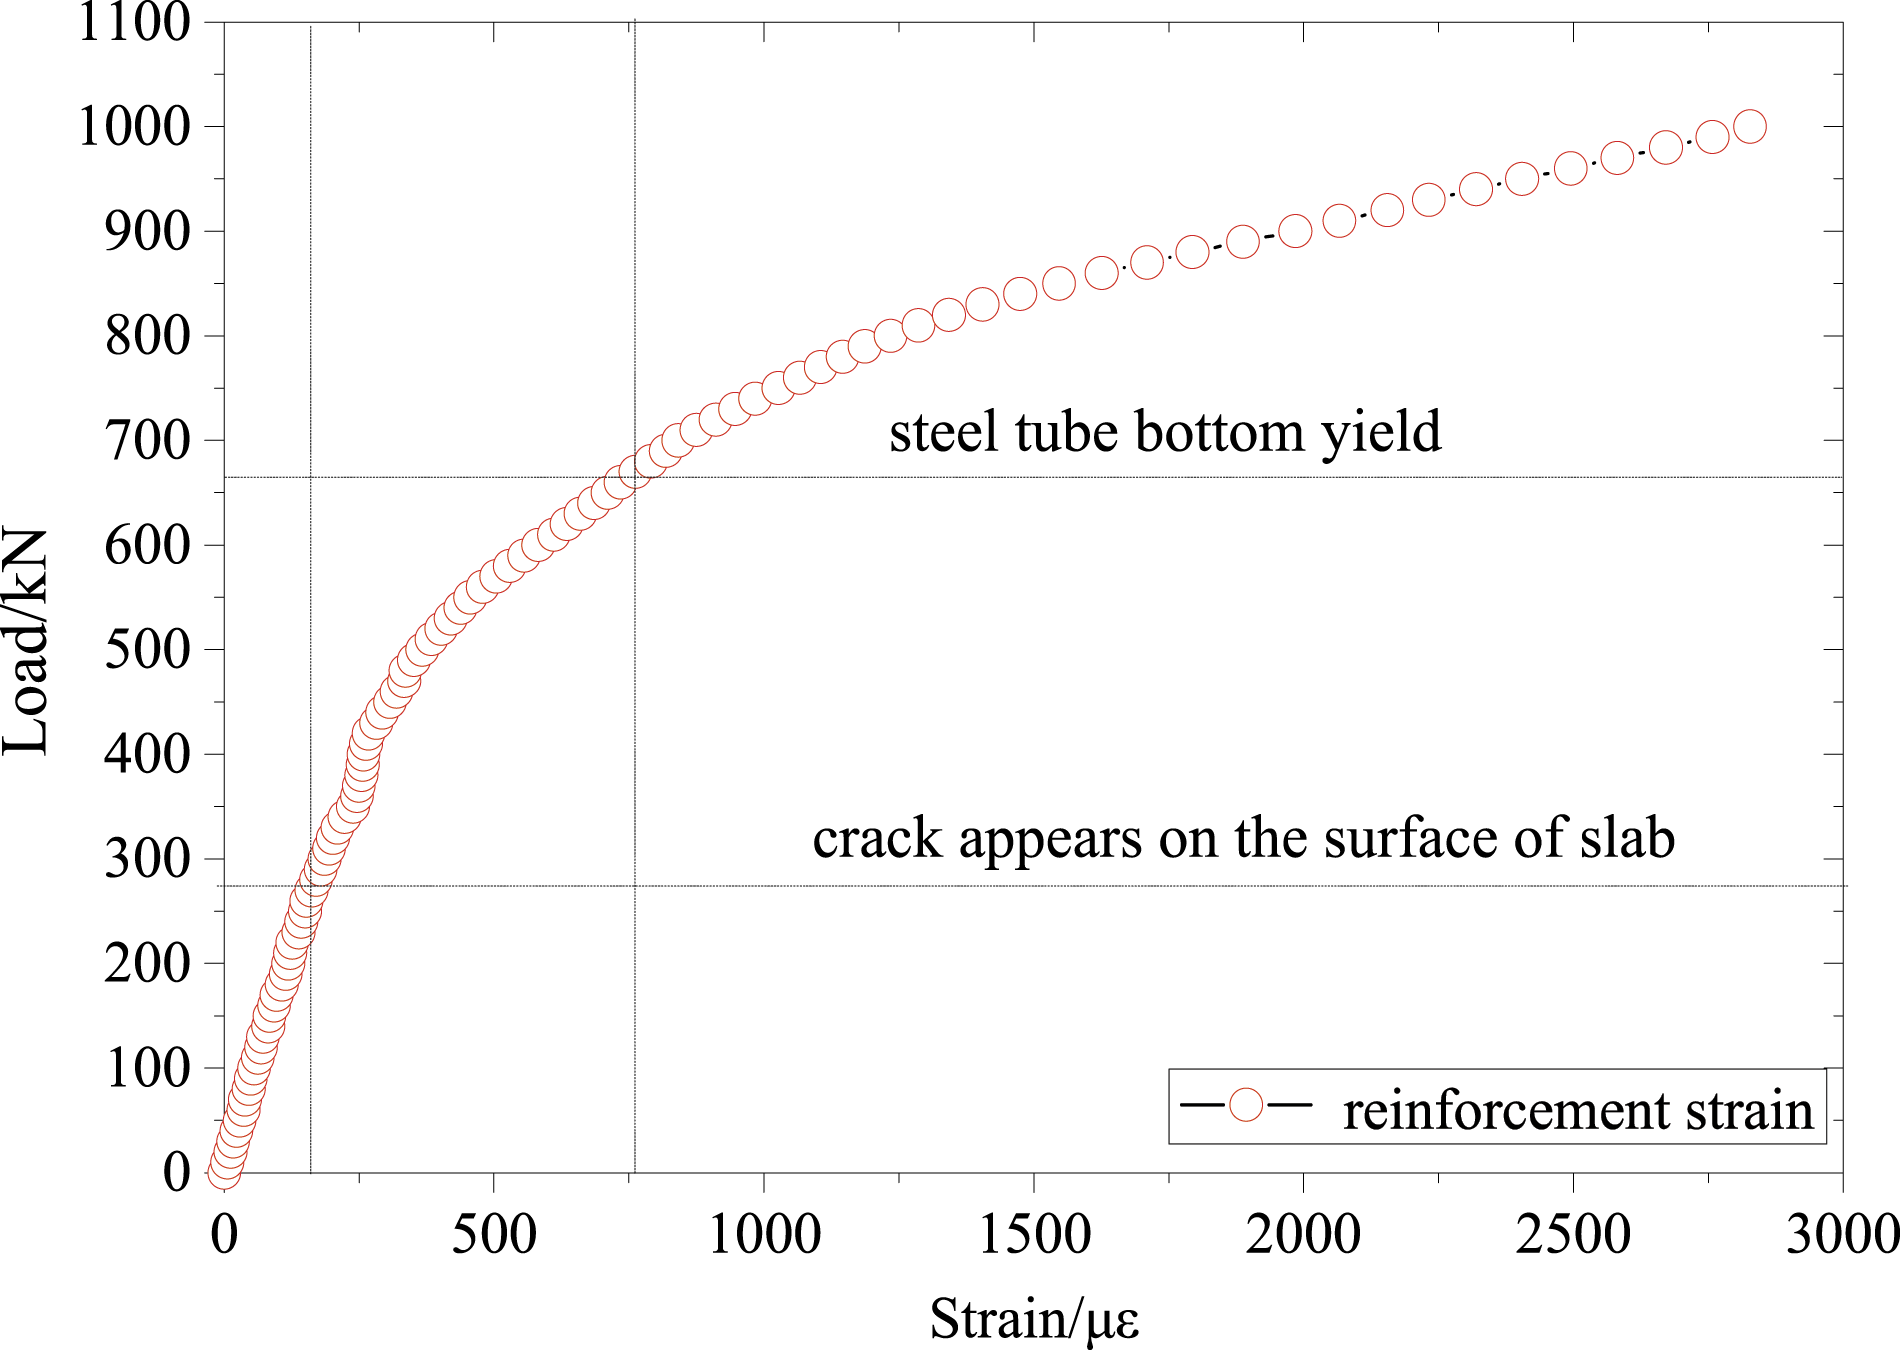
Longitudinal strain of CSWs
Figure 10(a) and (b) show the longitudinal strain distribution along the height of CSWs at the mid-span and the middle diaphragm. The longitudinal strains of CSWs are small compared to those of the top concrete slab and bottom steel tubes, indicating that the contribution of CSWs on the flexural resistance is small. If the CSWs are taken into consideration, the plane section assumption is not valid at the elastic stage. However, the strains of the top concrete slab and bottom steel tubes can be connected by straight lines, which satisfies the assumption of plane section. These observations indicate that the flexural load was mainly sustained by the bottom steel tubes and the top concrete slab. Longitudinal strains of corrugated steel webs at (a) the mid-span and (b) the middle diaphragm.
Shear strains of CSWs
The shear strain ε of CSWs is determined by the measured strains of the strain rosettes arranged on the webs based on the following equation
Figure 11(a) and (b) show the load–shear strain curves of the CSWs in the positive and negative bending moment areas, respectively. At the initial stage of loading, the shear strain basically increased linearly. When the load reached 610 kN, the shear strain went into the a nonlinear stage in the positive bending moment area as a crack appeared on the bottom of the top concrete slab at the mid-span. When loaded to 670 kN, the bottom steel tubes yielded and the shear strain increased nonlinearly in the negative bending moment area. Load–shear strain curves of corrugated steel webs in (a) positive bending moment area and (b) negative bending moment area.
Numerical analysis
Finite element model
In order to further investigate the flexural behavior of this composite girder, FE simulations are carried out using ABAQUS. The FE model is shown in Figure 12. In this model, C3D8R solid elements are used to model concrete. The steel tubes, the bottom trusses, K-braces, and the CSWs are simulated by S4R shell elements, and truss elements are used for the steel bars. The slip between CSWs and concrete slabs is not considered. The “TIE” constraint in ABAQUS is used to model the contact between concrete slab and the CSWs. Finite element model of composite beam.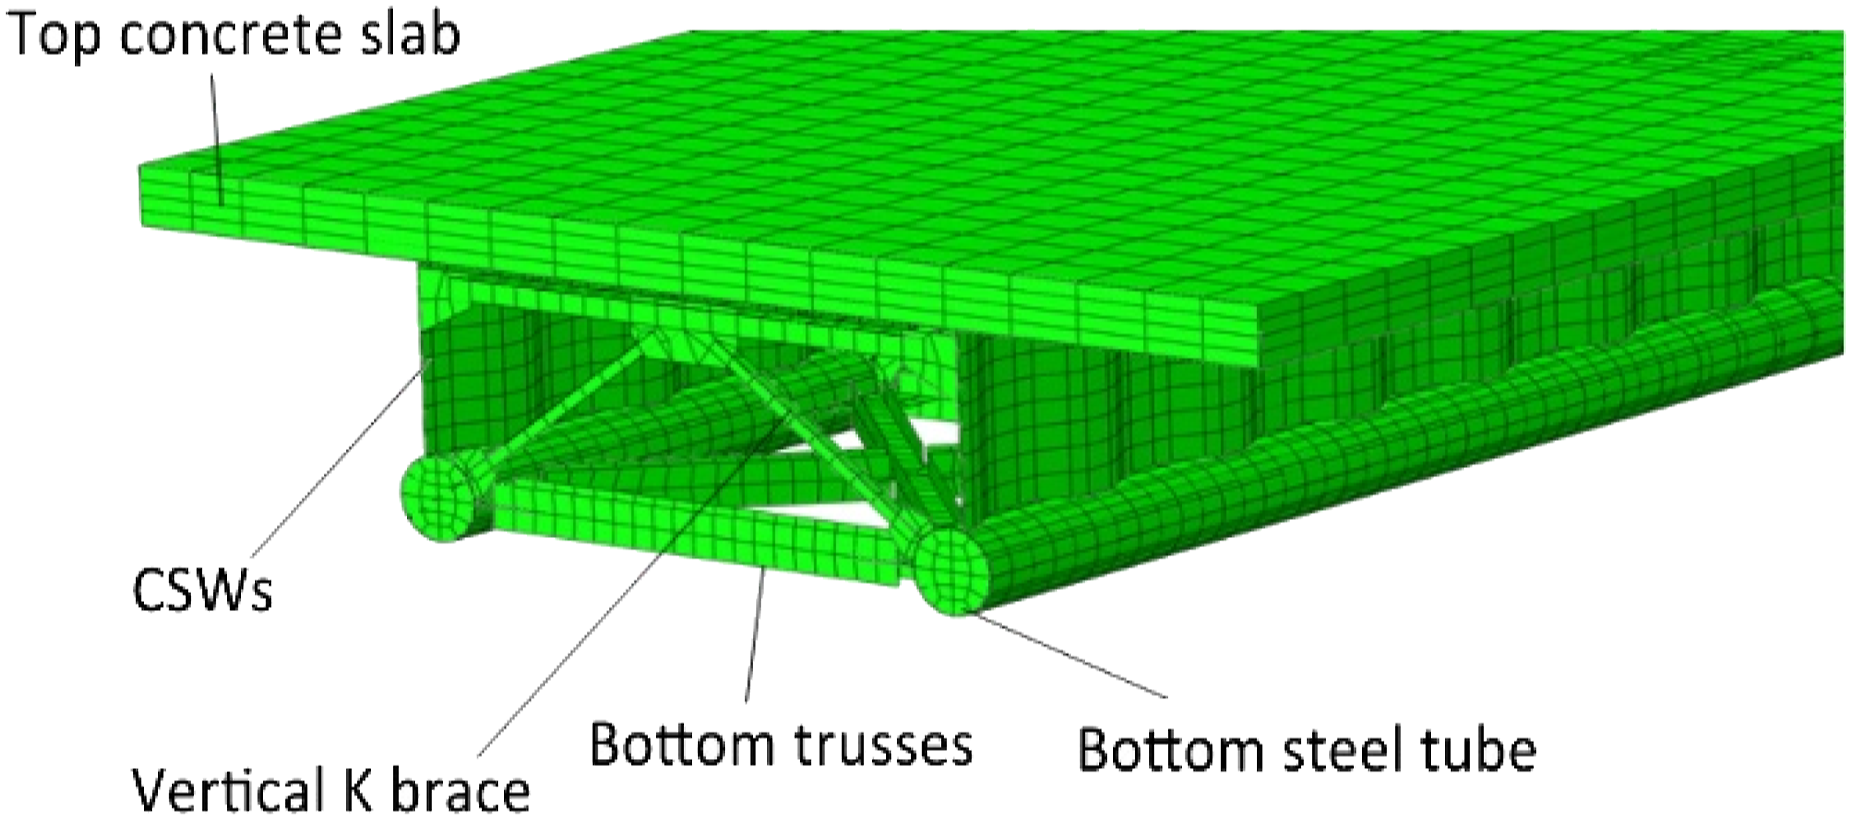
The constitutive equation of concrete used in the FE model can be written as (Chen et al., 2020)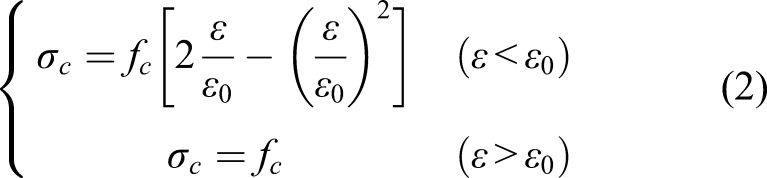
The mechanical performance of the concrete filled in the steel tubes is simulated by the following stress–strain relationship (GB 50936-2014, 2014)
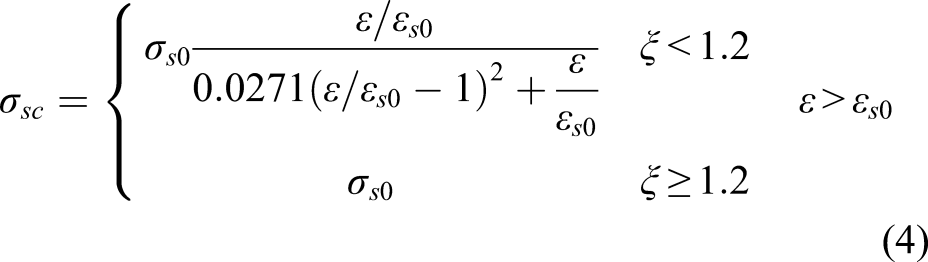



The stress–strain relationship of steel can be written as
Model verification
The comparison of the experimental and numerical load–deflection curves at mid-span is shown in Figure 13. The experimental results agree well with the numerical results at each stage. In the elastic stage, the load is within 30% of the capacity, the deflection increased linearly with the load, and the experimental and numerical curves are in good agreement. In the elastoplastic stage, the load is 30%–60% of the capacity. The deviation of the experimental and numerical curves increased slightly, but the trend of two curves is still similar. In the plastic stage, the steel tube yielded in positive and negative bending moment areas and the deflection increased with a larger rate. The deviation of two curves decreased. The slope of the numerical curve is slightly smaller than that of the experimental curve. In general, both the load bearing capacity and deflection can be predicted by FE model. Therefore, it is reliable to conduct parametric analysis using the FE model developed in this research. Comparison of load–deflection curves at mid-span.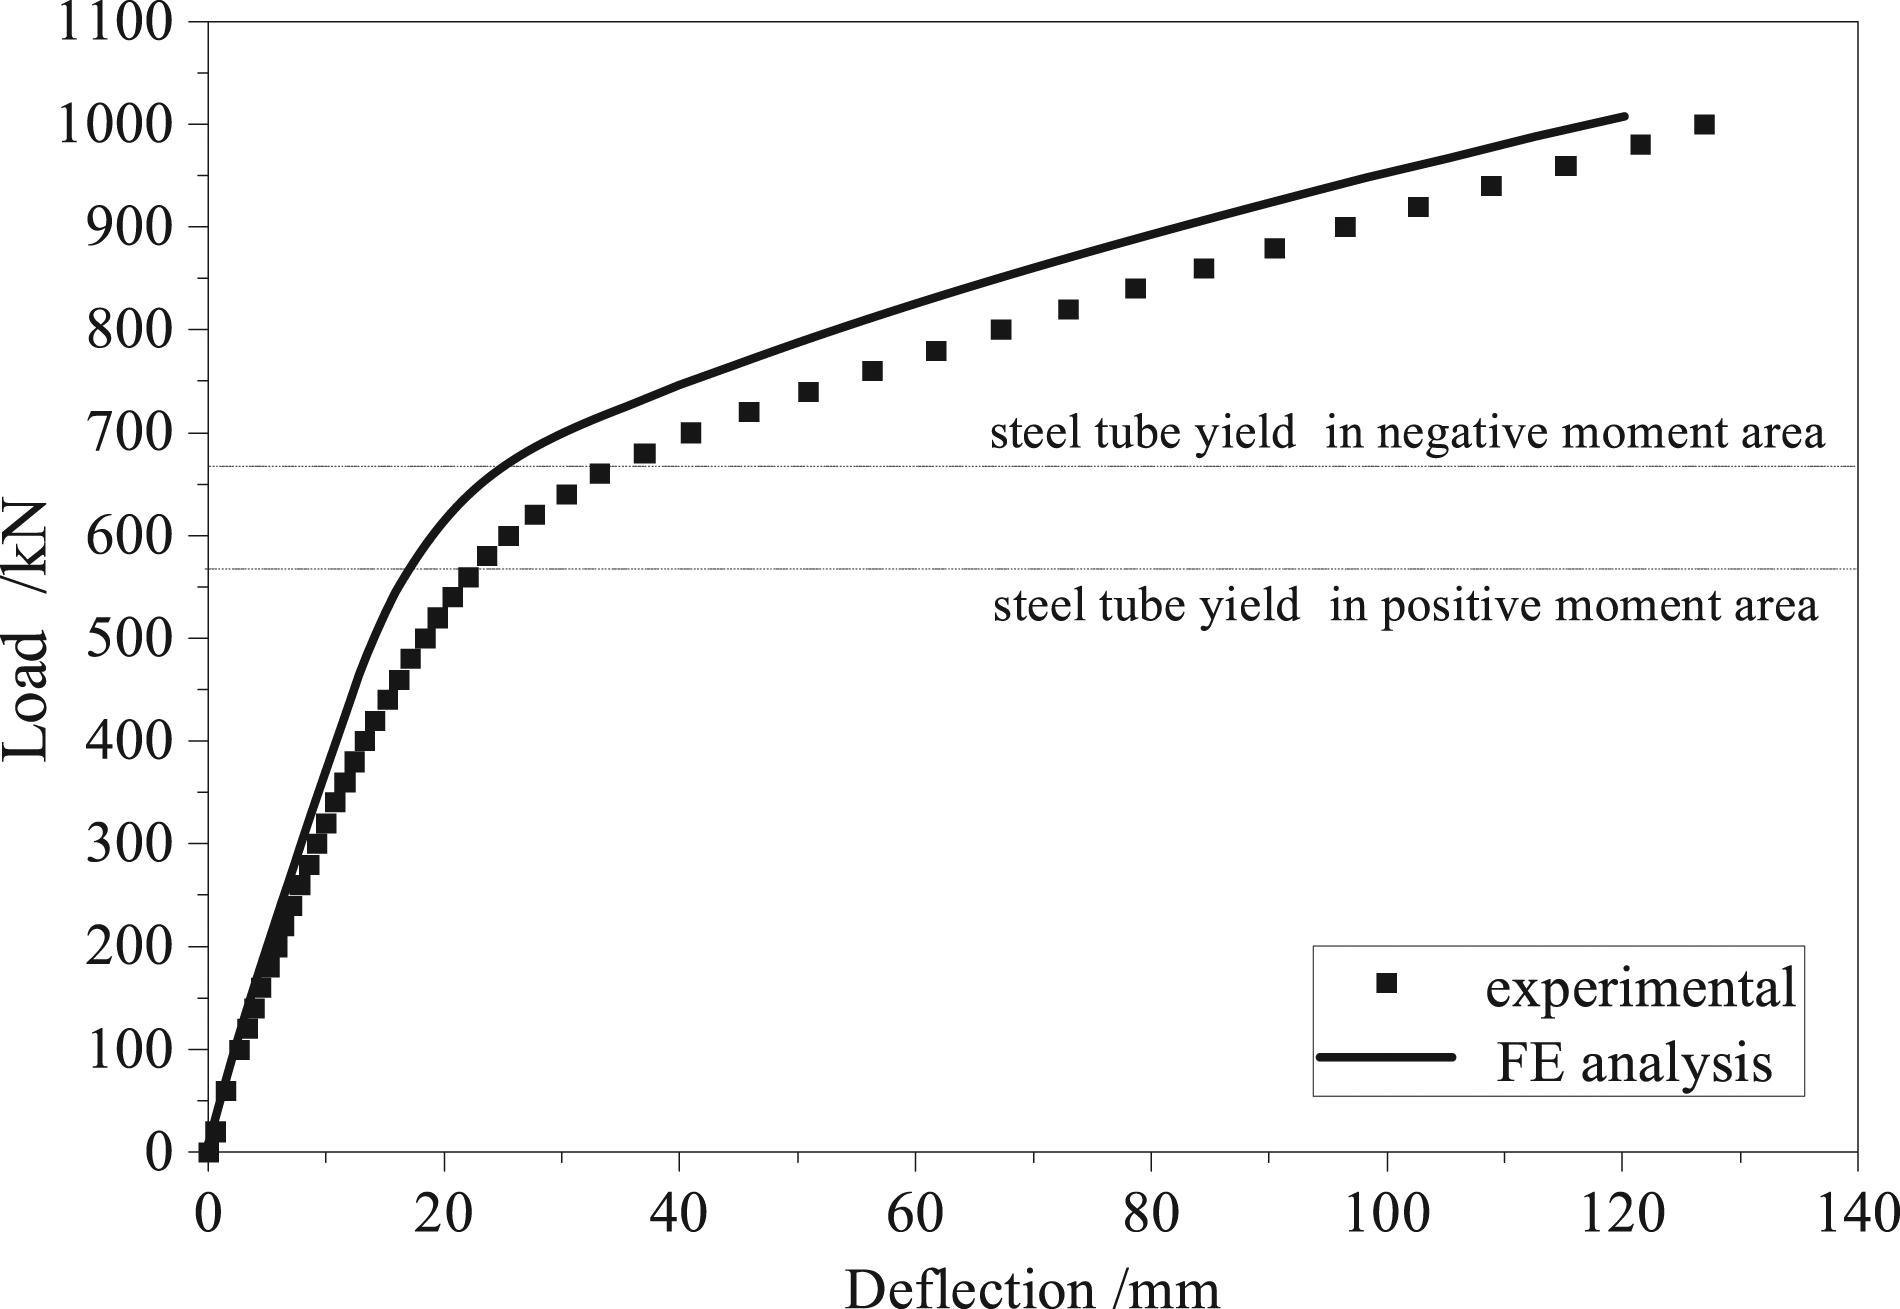
Parametric analysis
In order to further analyze the effect of important parameters on the flexural behavior of this kind of composite girder, extended parametric analysis is conducted, and the results are shown in Figures 14 and 15. The geometries of FE models are the same as the real structure. The height of the real girder and the web are 2.8 m and 1.58 m, respectively, and the thickness of CSW is 20 mm. The effects of the range of concrete in the steel tubes and the CSW thickness are investigated. Load–deflection relationship of three specimens with different range of concrete filled in the steel tube. Influence of corrugated steel webs thickness on the load–deflection curves.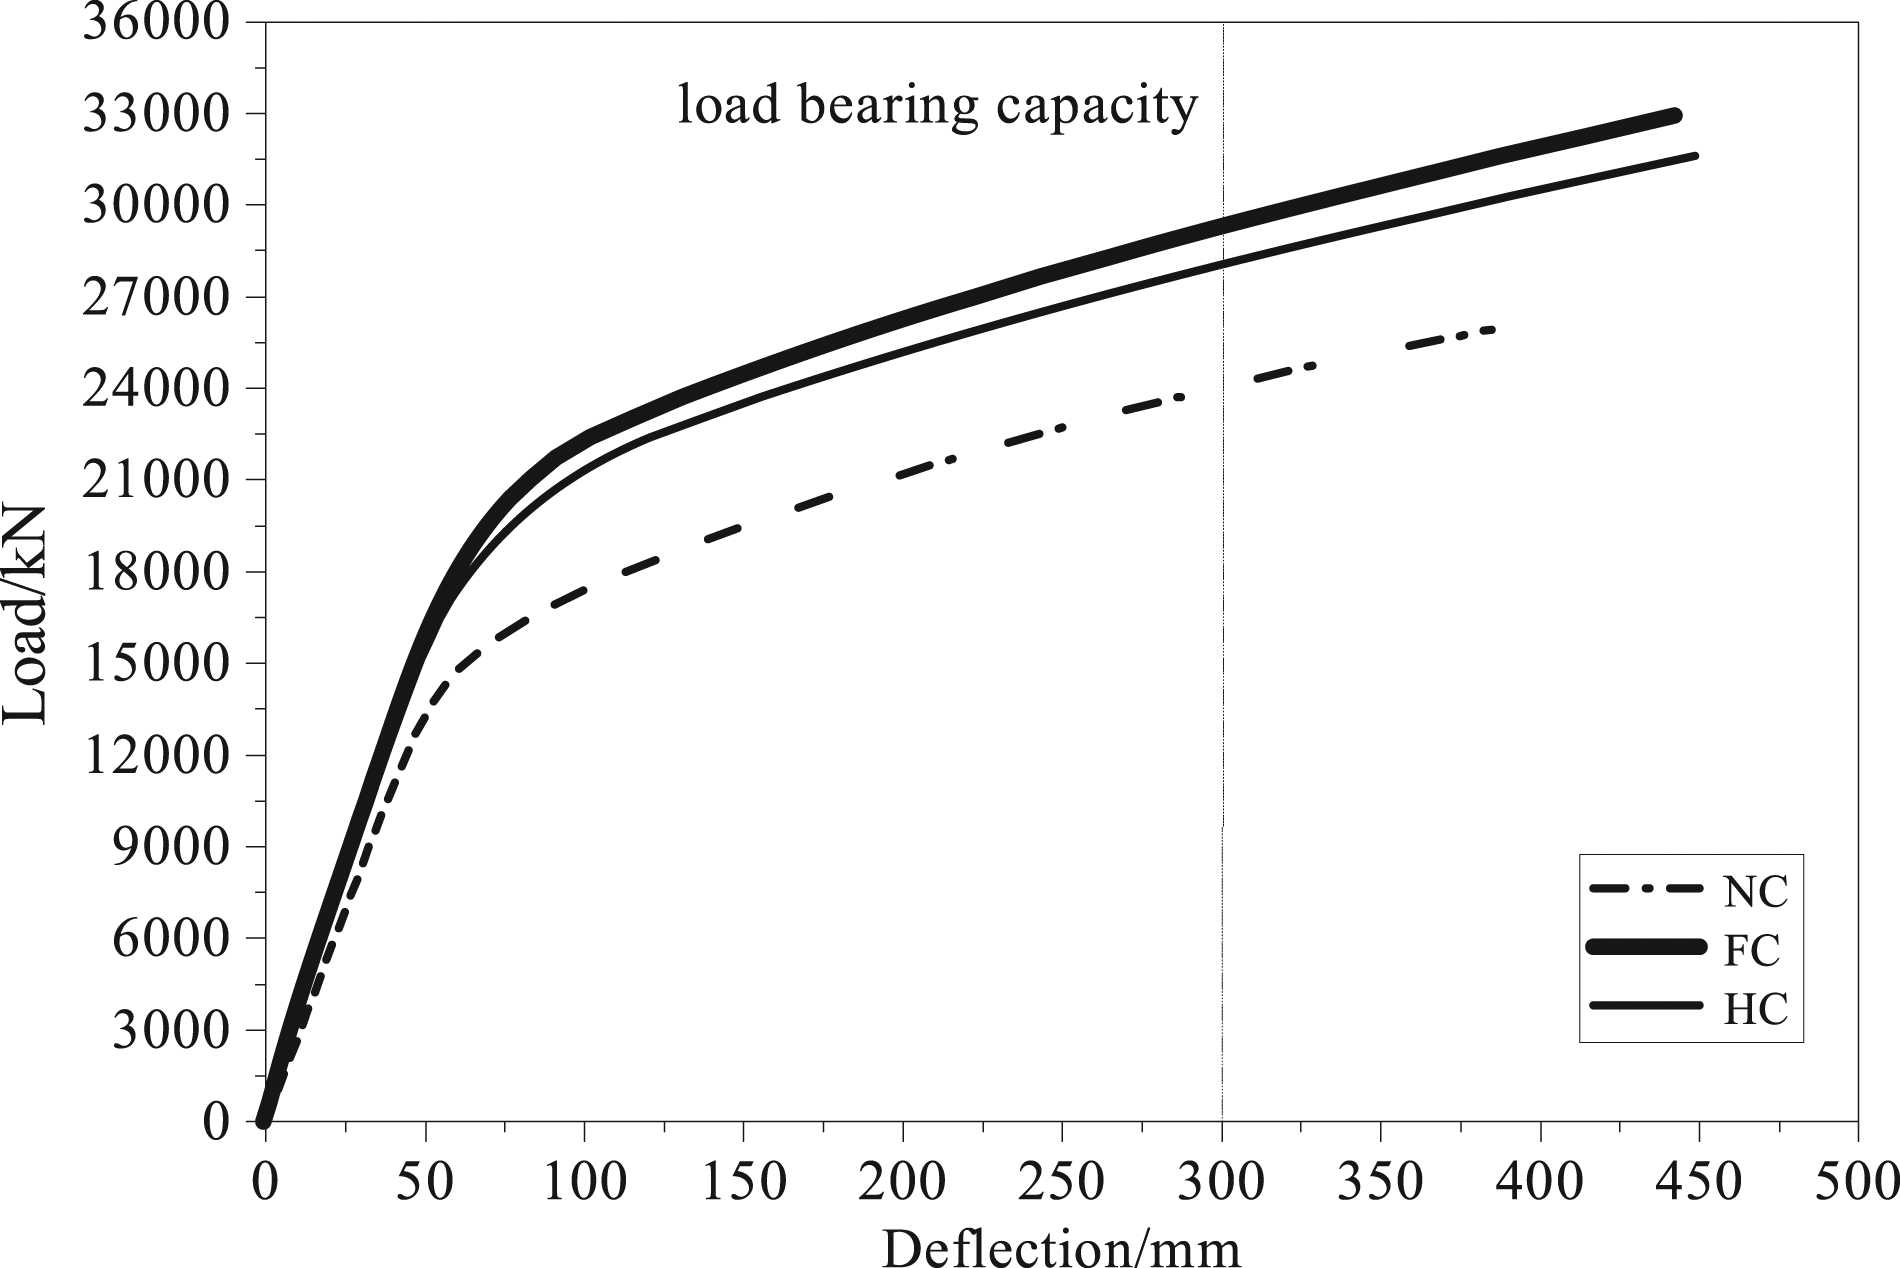

When the composite beam is loaded, the concrete in the steel tube is under tension in the positive bending moment area and under compression in the negative bending moment area. Since concrete is easy to be cracked when subjected to tension, the concrete in the steel tube should be able to increase the flexural load bearing capacity under negative bending moment but should have little effect on the positive bending moment resistance. In order to study the effect of the concrete filled in the steel tubes on the flexural behavior, the range of concrete in the steel tube is investigated in this part. Three models are developed with different ranges of the concrete filled in the steel tube, which are no concrete filled (NC), concrete filled only in negative bending moment area (HC), and concrete fully filled in the steel tube (FC). The negative bending moment region is a 12.5 m-long segment located at the middle of the span.
Figure 14 shows the load–deflection relationship of three specimens with different ranges of concrete filled in the steel tube, and the load bearing capacity is defined as the corresponding load when the deflection reaches 1/150 of the calculated span. In the elastic stage, the flexural stiffness of NC specimen is the smallest and the FC specimen is the largest, which could be concluded from the slopes of the curves. With the loading continuous, the NC specimen enters the elastoplastic stage first, then the HC specimen, and finally FC specimen. The ratio of three specimen’s load bearing capacity is NC: HC: FC = 1:1.17:1.22. Therefore, the concrete filled in the steel tubes increases the stiffness and the load bearing capacity of composite beams. According to the numerical results, the FC type is recommended for composite box girder with CSWs and trusses.
Figure 15 illustrates the influence of the CSWs thickness on the load–deflection curves, and the CSWs thicknesses of four specimens are 15 mm, 20 mm, 25 mm, and 30 mm, respectively. In the elastic stage, all curves almost overlap with each other. When it enters the elastoplastic stage, the deviation of four curves begin to increase. When the thickness increases from 15 mm to 20 mm, the load bearing capacity increases 2%. Then with the CSWs thickness continue increasing, the load bearing capacity increases very slightly, and the growth rate also reduces gradually. The ratio of load bearing capacity of four specimen is 0.95:0.96:0.98:1, which shows that the contribution of CSWs on flexural capacity is small.
Calculation method of flexural bearing capacity
Based on the experimental results, the following assumptions are made for the theoretical calculation of the flexural capacity. The contribution of CSWs on flexural capacity can be ignored; The contribution of diaphragm beam on flexural capacity is ignored; The plane section assumption is still valid after loading; The stress–strain relationship of concrete on the top slab can be described by equation (2); The stress–strain relationship of concrete in the steel tube under negative bending moment can be described by equations (3) and (4); The constitutive equation of bottom trusses and steel tubes can be expressed by equation (8); The concrete tensile strength is neglected.
Flexural bearing capacity in positive bending moment area
The bottom steel tubes and trusses yield at the ultimate state. Therefore, the axial force of the steel tubes and bottom trusses can be calculated by equations (9) and (10), respectively (Chen et al., 2020)

The resultant force of concrete can be calculated by equation (11)

When the neutral axis is within CSWs, equation (11) can be written as
When the neutral axis is within the concrete slabs, equation (11) can be written as
When the neutral axis position lies at the very position of the bottom of concrete slabs, the resultant force of concrete (Ncriticl) can be obtained
The flexural bearing capacity of the mid-span only includes the contribution of the top concrete slab, CFSTs, and bottom trusses. When the continuous girder failures at the mid-span, the bottom steel tubes yield under tension. The neutral axis is located in the top concrete slab or CSWs.
When Stress and internal force distribution of mid-span cross-section in positive bending moment area (a) neutral axis is located in the top concrete slab and (b) neutral axis is located in corrugated steel webs.
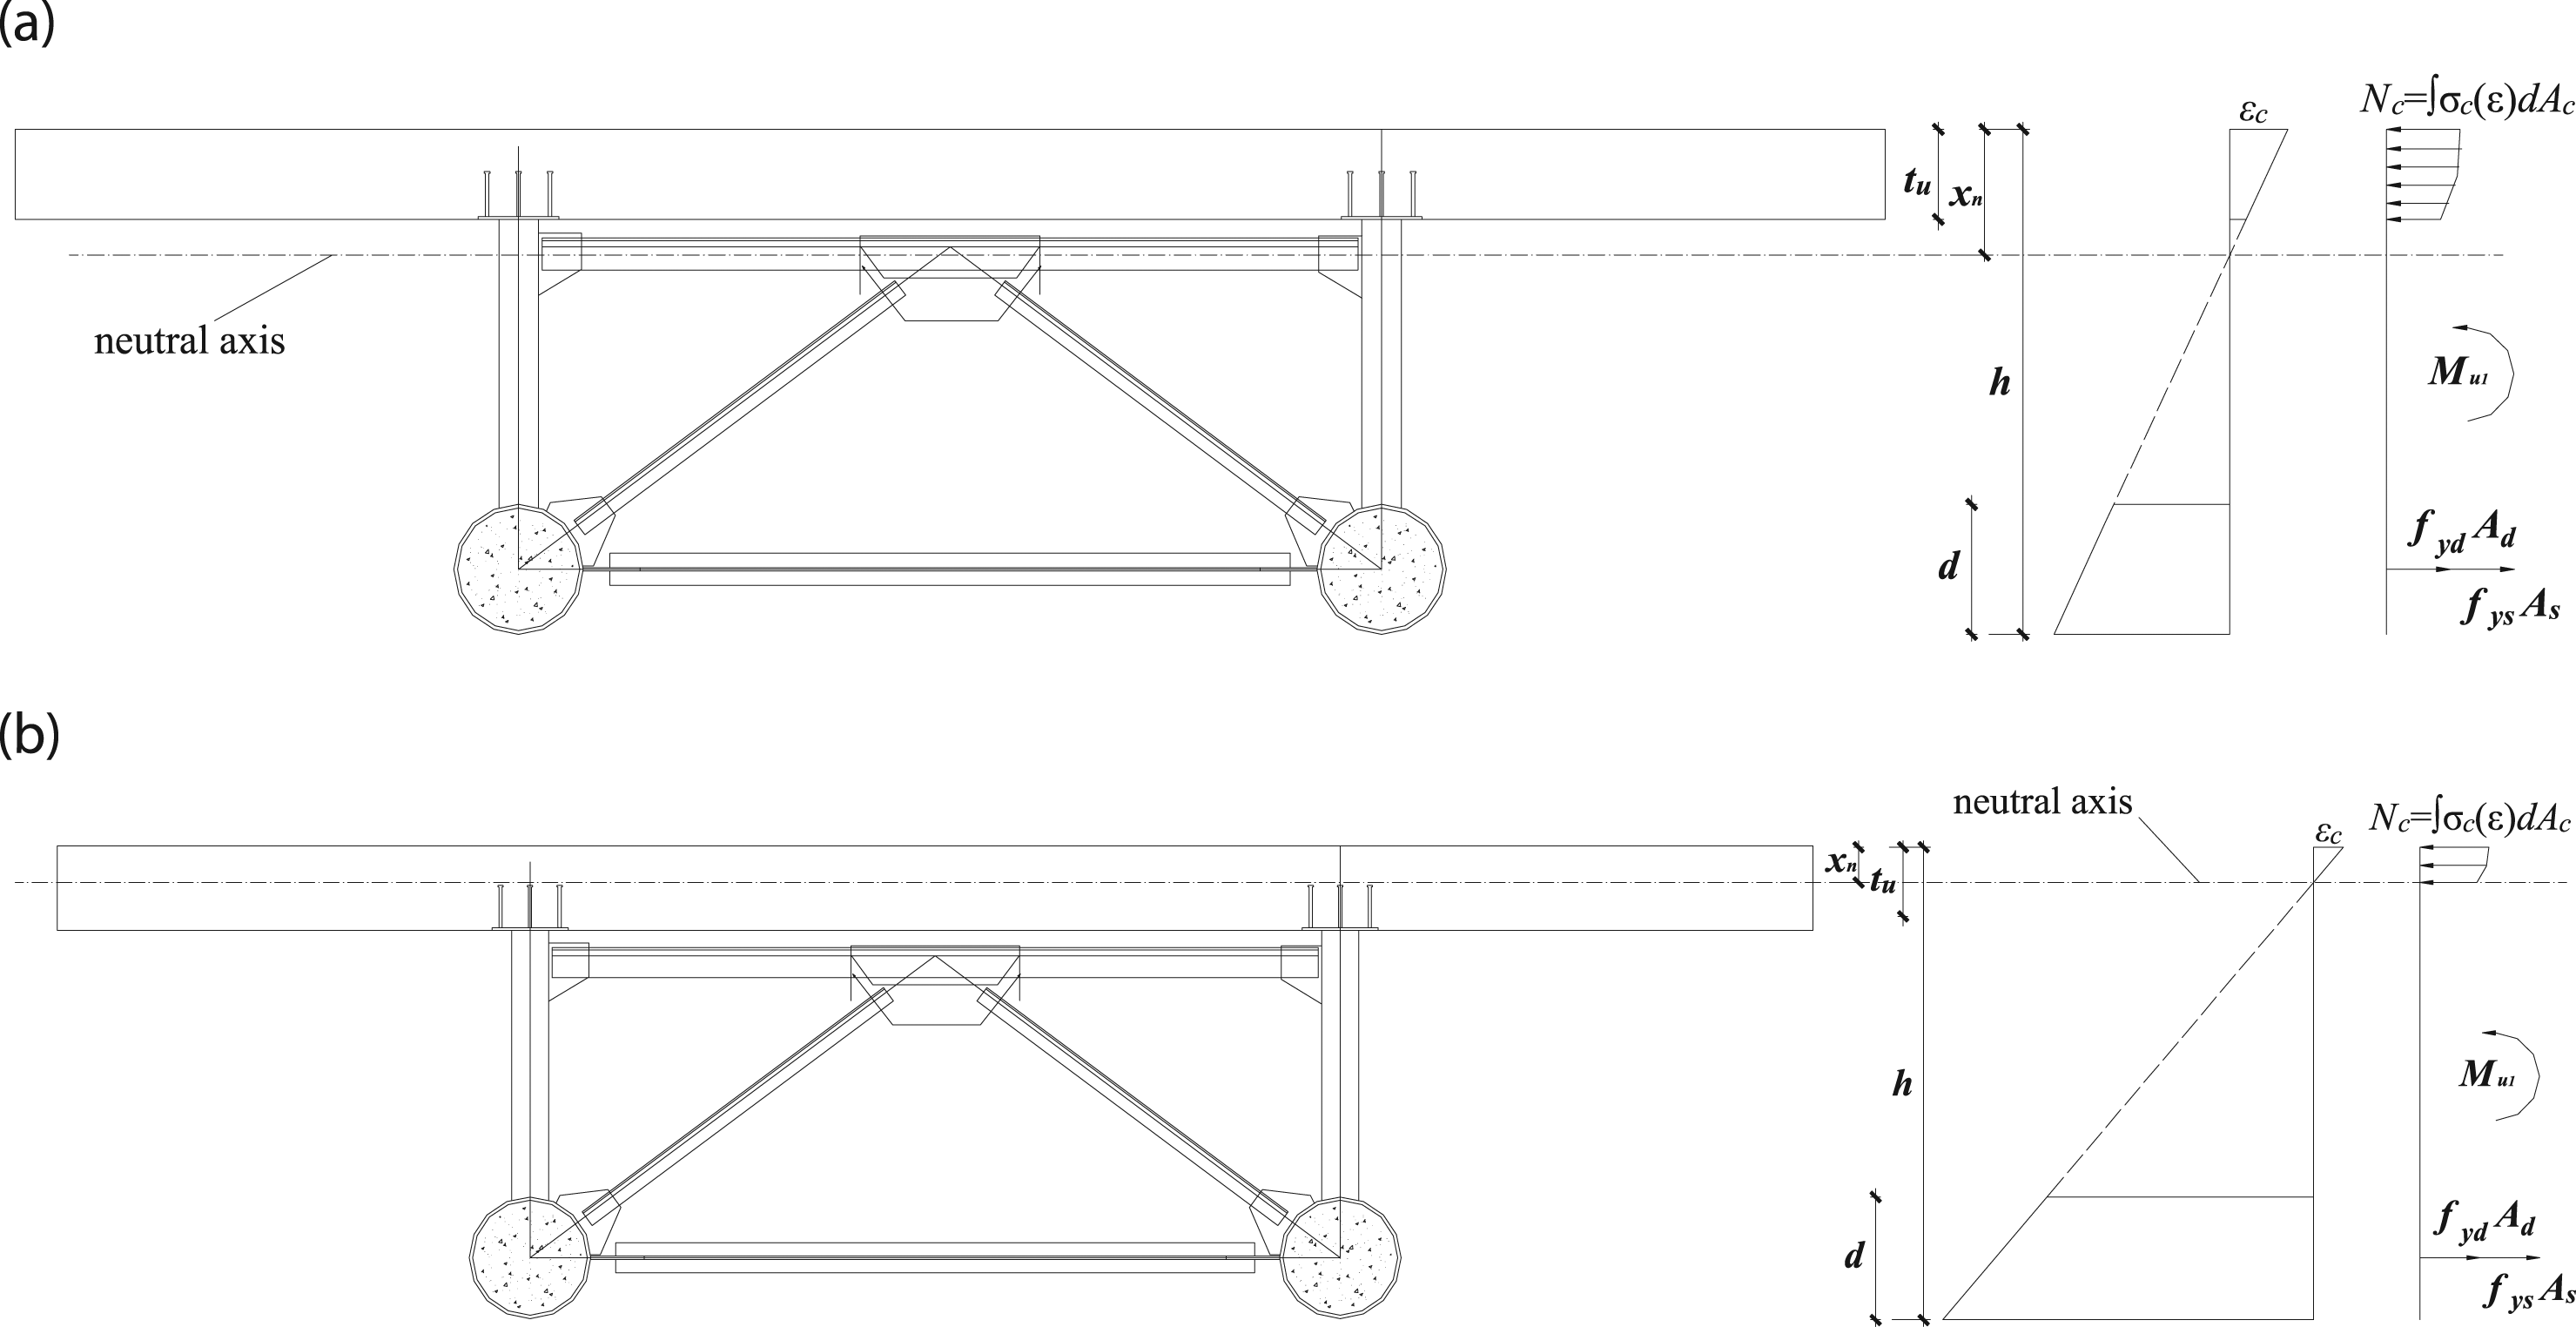
According to the test results, the maximum compressive strain of concrete is 0.001848. Substituting this value into equation (16), x
n
can be obtained. Then the bending moment at the ultimate state (Mu1) can be obtained by substituting x
n
into equation (17). The flexural bearing capacity Mu1 is calculated with the following equation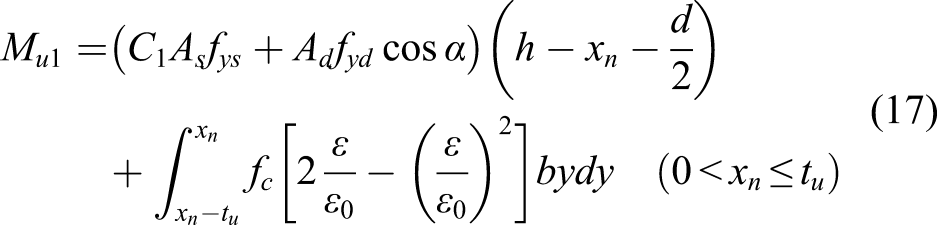
Flexural bearing capacity in negative bending moment area
The equation of the flexural bearing capacity in negative bending moment area is developed considering the effects of pre-stressed tendons, CFSTs, and diagonal truss members. When the continuous girder fails at the middle diaphragm, the bottom steel tubes yield under compression and the diagonal truss member also yield.
When the bottom steel tubes and the diagonal truss members yield, the axial force of the diagonal truss member could still be calculated by equation (10). According to Chinese code JCJ01-1989 (1989), the ultimate load of steel tubes filled with concrete under compression consists of two components: the steel and the confined concrete. Therefore, the axial force of steel tubes filled with concrete in this test can be calculated with the following equation
When the neutral axis position lies at the very position of the upper side of the steel tube, the axial force of steel tubes filled with concrete (Nscriticl) can be written as
When Stress and internal force distribution of mid-span cross-section in negative bending moment area (a) neutral axis is located in the corrugated steel webs and (b) neutral axis is located in steel tube.

According to the test results, the maximum compressive strain of concrete in the steel tube is 0.00496. Substituting this value into equation (20), x
n
can be obtained. Then the bending moment at the ultimate state (Mu2) can be obtained by substituting x
n
into equation (21). The flexural bearing capacity Mu2 can be calculated with the following equation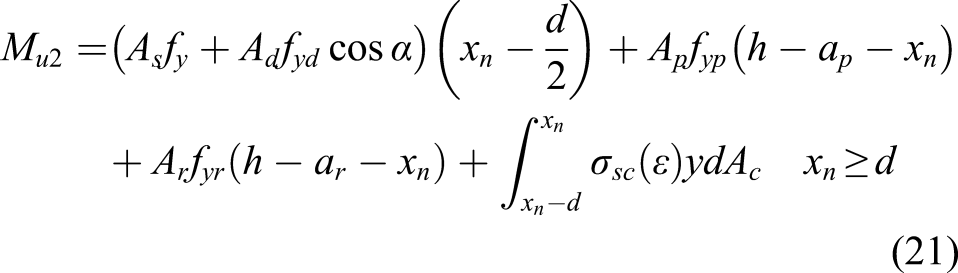
Comparison with test results
The theoretical value of the flexural bearing capacity of the test beam can be obtained by equations (19) and (21), which is 982.03 kN·m for the positive bending moment area Mu1 and 2381.54 kN m for the negative bending moment area Mu2. The theoretical ultimate concentrated load is 946.19 kN, and the load bearing capacity is 1010 kN in this experiment. The relative deviation between experimental and theoretical values is 6%. Therefore, the theoretical results are in good agreement with the experimental results. The theoretical value is lower than the experimental results due to the ignorance of the contribution of reinforcement, diaphragms, and CSWs to the positive and negative bending moment resistance.
In general, the bottom trusses and the concrete confining effect should be taken into consideration in the flexural behavior analysis of the composite girder. The flexural capacity of the composite girder with CSWs and trusses can be predicted well by the proposed equations in this section.
Conclusions
Based on the experimental research on a scaled model of the Maluanshan Park Viaduct, the specimen shows good ductility and integrity under flexural load. When the test beam failed, bottom steel tubes yielded at the mid-span. Besides, the top concrete slab was cracked at the bottom surface of the mid-span and the top surface of the middle support. Compared with those in the bottom steel tubes and the top concrete slab, the longitudinal strain of corrugated steel web is small. Hence, the contribution of corrugated steel web to the flexural load resistance can be neglected. At the elastic stage, the plane section assumption is valid when only the top concrete slab and bottom steel tubes are concerned. The bottom steel tubes fully infilled with concrete are recommended for this kind of composite structure, which brings higher flexural stiffness and load bearing capacity compared with HC and NC specimens. Simplified equations of ultimate bending moments under positive and negative bending moments were developed, which is able to predict the result of the test and provide reference for practical application of composite box girder with CSWs and trusses.
Footnotes
Declaration of conflicting interests
The author(s) declared no potential conflicts of interest with respect to the research, authorship, and/or publication of this article.
Funding
The author(s) disclosed receipt of the following financial support for the research, authorship, and/or publication of this article: This research is supported by the National Natural Science Foundation of China (Project No.51578323, No.51878391), Postdoctoral Science Foundation of China (Project No.2018M633156), Guangdong Provincial Department of Science and Technology (Project No. 2012-02-025), and Science and Technology Innovation Committee of Shenzhen (Project No. JCYJ2014090216222).
