
Abstract
Under cyclic loading conditions, the ductility of frame beam-column joints, which can be evaluated by the displacement ductility coefficient (μ), is strongly affected by the axial load ratio (n). Due to the high toughness of engineering cementitious composites (ECCs), the normal concrete can be replaced giving better joint ductility. However, the limit values of n for reinforced ECC (R-ECC) joints have not been clarified. Therefore, T- and cross-shaped reinforced concrete (RC) and R-ECC joint finite element models were established and analyzed under n values. The results indicated that the seismic performance of the joints, including μ, equivalent damping coefficient (ξ eq ), and secant stiffness (K i ) were strongly dependent on n. μ and ξ eq became inversely proportional to n when n was over 0.5. The RC and R-ECC joint ductile failure could occur when n was in the range of 0.3–0.7 and 0.3–0.9, respectively. The joint brittle failure occurred in RC and R-ECC joints when n was over 0.7 and 0.9, separately. Under the same n and load history, the maximum value of μ of R-ECC joints increased by 33.7% and 27.9% for T- and cross-shaped joints separately compared to that of RC joints. It is suggested that the n values for RC and R-ECC joints should not exceed 0.7 and 0.9, respectively.
Keywords
Introduction
For reinforced concrete (RC) frame structures, the infill wall failure (Crisafulli, 1997), staircase failure (Jiang et al., 2012), and beam-column joint failure (Cotsovos, 2013) normally occur under seismic loading conditions, of which the infill wall and staircase failures will not have too much impact on the integral frame structures. As the beam-column joints are of crucial importance in the inelastic response of the frame structures to transfer the inertia load from frame structures to foundations, the collapse of RC frame structures is mostly induced by beam-column joint failure. Therefore, RC joints are the most important components to maintain the anti-collapse ability of the structures under earthquakes. The beam-column joints can be divided into four types based on locations, including middle joints (cross-shaped), middle edge joints (T-shaped), top joints (T-shaped), and corner joints (Γ-shaped). For middle joints, shear failures induced by high yield stress of beam reinforcement easily occur in joint areas, which is brittle. For middle edge joints, the concrete-reinforcement bond at the beam end is normally insufficient, and shear-bond failures are generally captured which are still brittle (Xiang et al., 2017). However, for top joints and corner joints, column end bending failure and core area bending failure normally occur, respectively, which are all ductile failure modes and do less harm to the whole frame structures (Metelli et al., 2015). Liel et al. (2010) pointed out that non-ductile RC frame structures have a mean annual frequency of collapse ranging from 0.47% to 1.35% at California, which was approximately 40 times higher than that of ductile RC frame structures (0.01%–0.06%). Compared to the brittle failure, of which no obvious deformations occur before failure and poor energy dissipation capacities are normally captured, ductile failure can maintain a certain bearing capacity during the whole failure process with better energy absorption, and obvious deformations prior to failure. Therefore, the cross-shaped middle joints and T-shaped middle edge joint design with brittle failure should be carefully considered.
You et al. (1996) proposed a ductile design control criterion for RC joints, which was related to the maximum shear force, minimum hoop reinforcement ratio (ρ v ) and axial load ratio (n). In addition, it has been pointed out by Wang et al. (1995) and Xiao and Zhu (1998) that n should be the main influence factor for RC joint failure. Ductility coefficients, including curvature ductility coefficient μ φ and displacement ductility coefficient μ, are the key indexes to evaluate the ductility of frame structures and joints (Cai et al., 2005). The ductility of a RC cross-section can be expressed via μ φ , and μ reflects the ductility of the whole RC structure. μ is used to evaluate the ductility of the RC joints in the current research, where the joint ductile failure normally occurs when μ is above 3.0 (Wang et al., 1995). Researches (Fan and Song, 2014; Fu et al., 2000, 2006) on the influence of n to the seismic performance of RC beam-column joints have been previously addressed, and the results indicated that increasing the n values within the range of 0–0.4 could help improve the energy dissipation capacity under cyclic loadings. It has been generally given in GB50010-2010 (2010) that the limit values of RC column n values were 0.65, 0.75, 0.85, and 0.9, respectively, under the first to fourth anti-seismic grades. When n succeed the limit values, the RC frames brittle failure would occur. Also, it is generally suggested in CEN (2004) that limit values of n for RC frames were 0.55, 0.65, and 0.75 based on three structural ductility classes (DC), including high DC (DCH), medium DC (DCM) and low DC (DCL). However, the limit values of axial load ratio n for different types of RC joints have not been clearly discussed and compared before.
The structure ductility is positively correlated to the deformation and energy dissipation abilities under external loads. Increasing the material toughness can improve the joint ductility, and cement-based materials with better toughness can be used to replace NC (ultimate tensile strain ε = 0.01%; compressive strength σ c = 20–60 MPa) for joint design. Ju et al. (2014) used reactive powder concrete (RPC) with ε = 1% and σ c = 170–230 MPa to replace the NC for beam-column joint tests and analysis under different n (0.3–0.7). The results indicated that the RPC joint n values should not exceed 0.6. As the high σ c compressive strength of RPC is 4–7 times that of concrete, RPC is still a relatively brittle material. Even though its toughness is better, the RPC post-peak brittleness limited its application. In recent years, engineering cementitious composites (ECCs) have been developed to address the brittleness short-comings of NC (Li, 2012) due to its advantages in toughness, energy absorption capacities, multiple mirco-cracking and strain hardening. The compressive strength of ECC (σ c = 30–60 MPa) is the same as or slightly higher than that of NC, and its ultimate tensile strain (ε = 3–5%) is 300–500 times that of NC (Li et al., 2019). Existing researchers (Liang et al., 2016a; Said and Razak, 2016; Yuan et al., 2013) indicated that under cyclic loadings, μ of R-ECC joints were 39% higher than that of RC joints in average. However, those existing empirical and numerical analysis on R-ECC joints under seismic loads were all under low axial load ratios (n ≤ 0.6), of which the maximum value of n did not even succeed the limit value for RC joints under first anti-seismic grade (n = 0.65). R-ECC joints should be able to afford more axial loads rather than RC joints under the same structure design. Also, the utilization efficiency of the ductile material ECC is still low even when n is equal to 0.65 for RC joints under first anti-seismic grade. Nevertheless, according to the test results, the energy dissipation capacity of R-ECC joints is proportional to the axial load ratio n within the range of 0–0.6, and increasing n will improve the R-ECC joint seismic energy dissipation capacity within that range. There is a lack of discussions on the R-ECC joint seismic performances, including the ductility, energy dissipation and stiffness degradation, under a wider range of n. Therefore, advanced R-ECC joint seismic researches related to different joint types and a wider n range, that is, n ≥ 0.6, need to be discussed, helping give design directions of improving the material utilization and insuring joint ductile failure. Also, it can help evaluate the failure modes of the designed R-ECC joints under different anti-seismic grades.
Influencing factors of the RC/R-ECC joint failure
Generally, the failure modes of the joints under seismic loadings include the beam or column end bending failure, joint area bending failure, joint area shear failure, and splitting bond failure (joint area and beam/column end). The joint area bending failure can be divided into the large eccentric failure and small eccentric failure. Besides the joint area shear failure, splitting bond failure, and small eccentric failure of the joint area bending failure, the other failure modes listed above were all ductile failure modes (Stein et al., 2016).
Influencing factor comparison.
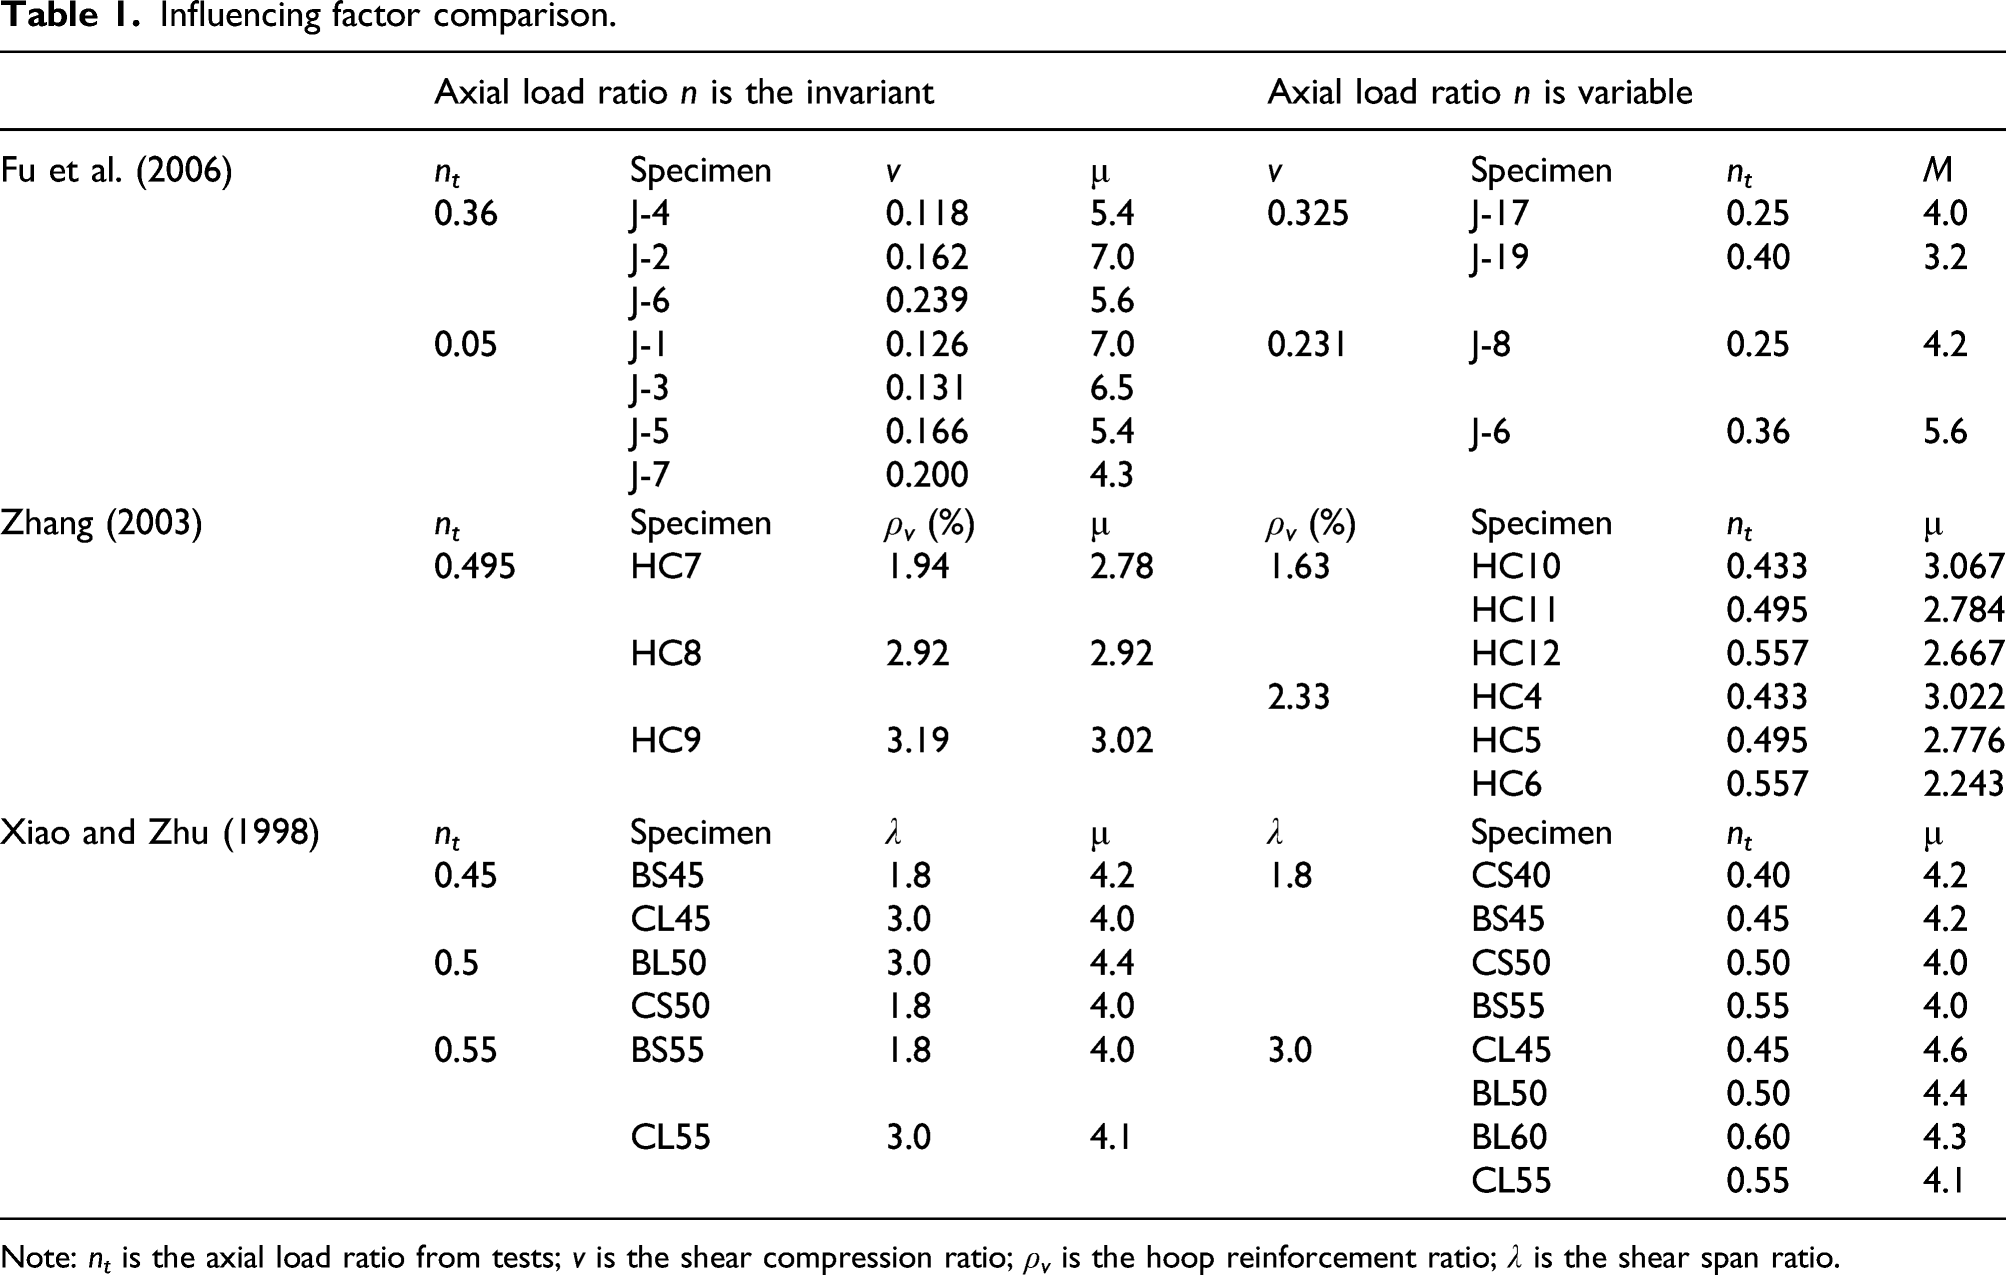
Note: n t is the axial load ratio from tests; v is the shear compression ratio; ρ v is the hoop reinforcement ratio; λ is the shear span ratio.
Fu et al. (2006) studied the influence of n and v on the mechanical behavior and failure modes of cross-shaped joints. According to the test results, it can be found that under the same n value (0.36), as v increased from 0.118 to 0.239 (increased by 102%), μ increased from 5.4 (μJ-6) to 5.6 (μJ-4) only (increased by 3.5%); under the same v value (0.231) as n decreased from 0.36 to 0.25 (decreased by 44%), μ increased from 4.2 (μJ-8) to 5.6 (μJ-6) (increased by 25%). n has greater effects on the joint displacement ductility coefficient μ than v. Zhang (2003) studied the effects of n and ρ v on the seismic performance of RC joints. The results indicated that under the same n value (0.495), as ρ v increased from 1.94% to 3.19% (increased by 64.4%), μ increased from 2.78 (μHC7) to 3.02 (μHC9) only (increased by 8.6%); under the same ρ v value (2.33%), as n decreased from 0.557 to 0.433 (decreased by 28.6%), μ increased from 2.243 (μHC6) to 3.022 (μHC4) (increased by 34.7%). n has greater effects on μ of joints than ρ v . Xiao and Zhu (1998) studied the effects of n and λ on the seismic performance of RC joints. The results showed that under the same n value (0.55), as λ increased from 1.8 to 3.0 (increased by 66.7%), μ increased from 4.0 (μBS55) to 4.1 (μCL55) only (increased by 2.4%); under the same λ value (3.0), as n decreased from 0.6 to 0.45 (decreased by 44.4%), μ increased from 4.1 (μCL55) to 4.6 (μCL45) (increased by 12.2%). n has greater effects on μ of joints than λ.
It can be also generally discovered that when the n, v, ρ v , and λ all changed by 30%, the corresponding μ were changed by 18.2%, 2.1%, 4.0%, and 2.6% separately in average based on linear relationship assumptions. Therefore, n affected μ the most among the influencing factors.
Seismic behavior of RC and R-ECC beam-column joints under different axial load ratios.
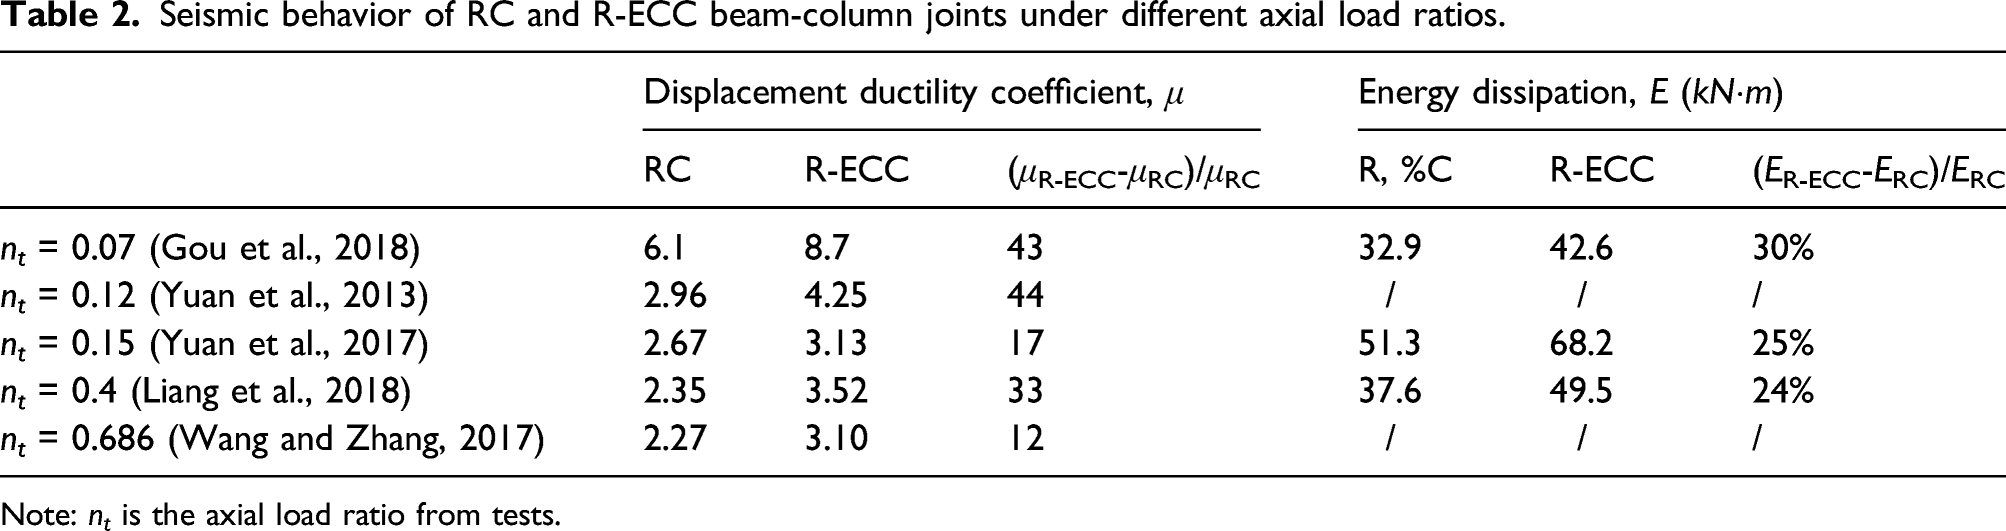
Note: n t is the axial load ratio from tests.
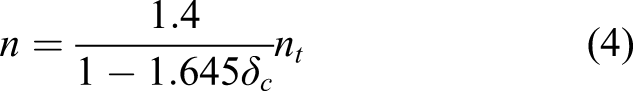
The results indicated that due to the high toughness of ECC material, the displacement ductility coefficient μ and energy dissipation ability (E) of R-ECC joints were 29.8% and 26.3% higher than that of RC joints in average, respectively. However, since the joint shapes and section features including the cross-section and reinforcement distributions of specimens in the existing empirical researches were different, the limit value of n for R-ECC joints cannot be obtained. The discussion of the limit value of n for R-ECC joints should be based on a certain joint shaped and the same section features. For the structural design, as the n values decrease, the cross-section of the frame column tends to be increased for the same column heights, which may make the shear span ratio λ small. When λ is smaller than 2.5, the column is short column, of which the brittle shear failure mostly occurs (Moretti and Tassios, 2006), which is not expected. Therefore, n should be suggested higher than a certain value which need to be carefully discussed. The equation for calculating the axial load N for all types of beam-column joints is as follows (GB50010-2010, 2010)

f c is generally in the range of 20–60 MPa; even for ultra-high strength concrete, it is just close to 100 MPa. Combined with equations (1) and (2), it can be obtained that the lower limit value of n is 0.3. In order to ensure the ductility of joints, the axial load ratio n should not be higher than 0.9 (GB50011-2010, 2010). Therefore, the research range of axial load ratio n in the current study is 0.3–0.9.
RC and R-ECC beam-column joints numerical modeling
Existing test modeling
The FE model reliability needed to be done based on the existing empirical researches (Yuan et al., 2013; Liang et al., 2016a). The test specimens of S2, S5 (T-shaped, n = 0.3, n t = 0.163) and RCJ1, FRCJ1 (cross-shaped, n = 0.35, n t = 0.190) joints were selected for modeling validation via comparing the failure modes, hysteretic and skeleton curves.
NC and ECC modeling
The concrete damage plastic (CDP) model was chosen for NC modeling. The CDP model in ABAQUS was used for modeling the concrete and ECC due to its advantages for modeling concrete plasticity, yield function, and flow rule (ABAQUS 2019). The definition of NC uniaxial compressive and tensile constitutive relationships was the same as Li et al. (2020). The dilation angle ψ in the CDP model is an important parameter affecting the restraint effect of concrete. It is suggested that ψ is generally in the range of 25°–35° (Syed and Gupta, 2015), and 30° was adopted in the current study. The eccentricity ε can be taken as the default value of 0.1 in ABAQUS (2019). The ratio between initial equibiaxial compressive yield stress and initial uniaxial compressive yield stress f b0 /f c0 and the ratio of the second stress invariants K were taken as the default value of 1.16 and 0.667 (Systems, 2019). The viscosity parameter ν was 0.0005 as suggested, which ensures the convergence of the model on the basis of accurate calculation.
Engineering cementitious composite shows strain hardening under direct tension with losing its bearing capacity quickly after reaching the peak stress, and its softening branch was not that obvious. Therefore, for tensile definition, ECC was defined by stress–strain relationship. The tension constitutive relationship of ECC proposed by Meng et al. (2017) is chosen as expressed in equation (3)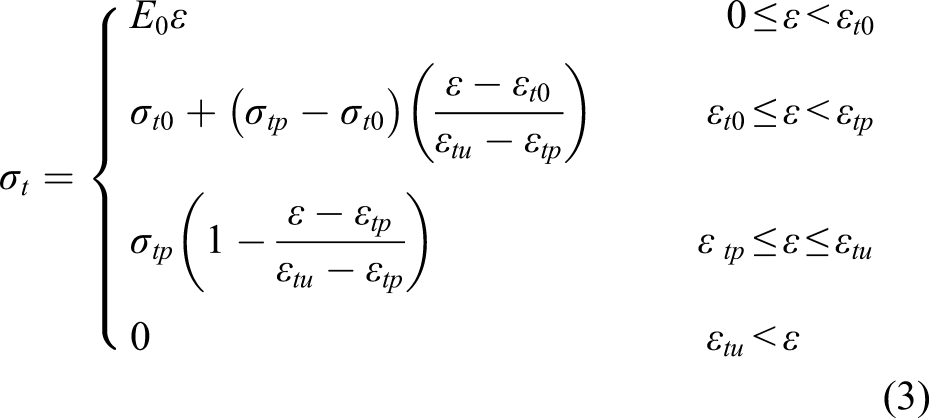
For compression, the ECC compressive softening branch is obvious after reaching the peak stress and different stress–strain curves should be used under different element characteristic lengths h to ensure that the compressive fracture energy Gc was a constant. The compressive constitutive relationships of ECC proposed by Feenstra et al. (1998) and the damage evolution law proposed by Amrane and Sidoroff (2011) were adopted.
The stiffness recovery factors (w t for tension and w c for compression) were provided in the CDP model to describe the stiffness recovery and crack opening–closing phenomenon of cement-based materials under cyclic loading. The experimental results (Reinhardt, 1984; Rahman et al., 2007) show that w for concrete tensile cracking after compressive crushing state, if the compression micro-cracks have been formed before the tension, the recovery of the tensile stiffness of the concrete was very small or not, and w t was set as the default 0. But as the concrete compressive crushing occurs after tensile cracking, the compression stiffness w c should be re-evaluated. A new algorithm on w c proposed by Li and Zhang (2021) was chosen for NC and ECC, which was equal to the θ-th power (θ ≥ 1) of the ratio of the concrete residual fracture energy g FR and the fracture energy g f both in per unit volume. The C3D8R elements was adopted for concrete modeling with the 50 mm element size which was the same as Li and Zhang (2021).
Modeling of steel reinforcements
The bond-slip between cement-based materials and reinforcements in the joint models under cyclic loading may have influences to the simulation results. The introduction of interface element may increase numerical computation efforts. Therefore, a simplification method proposed by Clough (1966) and improved by QU (2012) was employed as the reinforcement constitutive relationship with interface effect consideration by weakening the unloading stiffness of reinforcements to replace the stiffness degradation caused by bond-slip effect between reinforcements and concrete (Li and Zhang 2021).
Verification
Figure 1 gives the comparison of failure modes of specimens from experiment and FE. Damage comparison between the finite element and test results.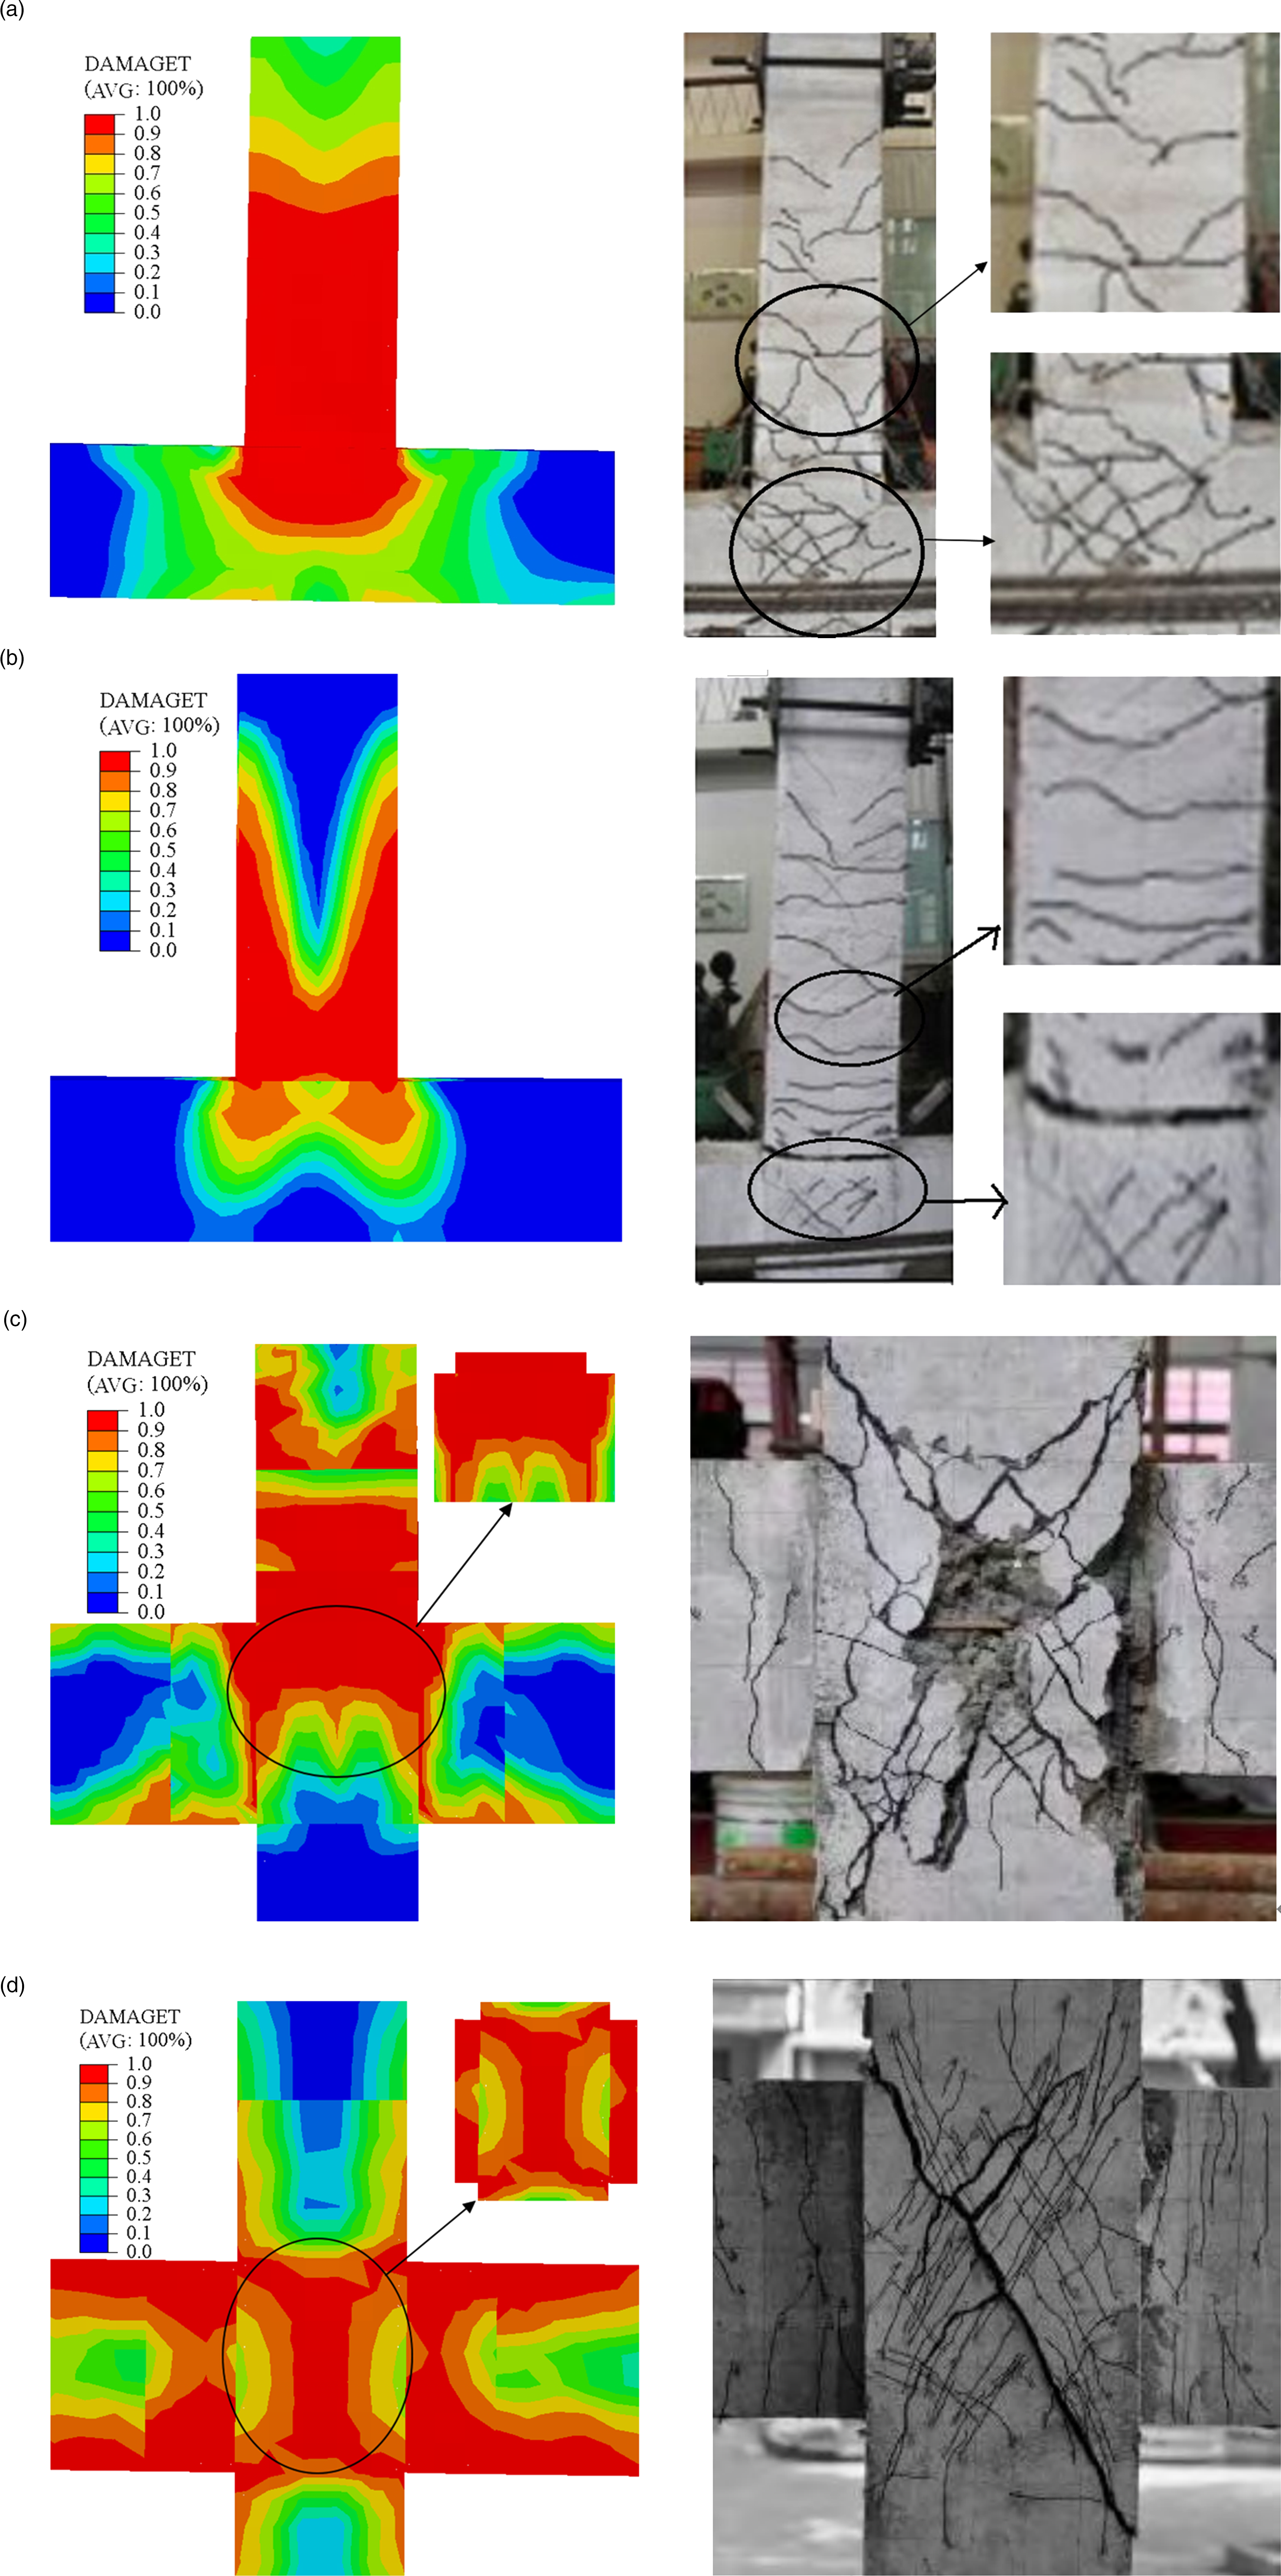
According to Figure 1a, there were many irregular large cracks in the beam end and core area of S2 both for test specimen and FE model with bending-shear failure modes. According to Figure 1b, there were a large number of transverse cracks at the beam end and core zone of S5 both for test specimen and FE model with bending-shear failure modes. By comparing the test and FE damage contours, the FE results were consistent with the test results well.
According to Figure 1c, the concrete cover in the core area of the joints both for test specimen and FE results for RCJ1 were totally damaged. According to Figure 1d, it can be seen that the “X” shaped damage was mainly concentrated in the end of beam and the joint core areas. The failure modes were all joint area shear failure.
The comparison of the specimen hysteretic and skeleton curves from test and FE are given in Figure 2. And the data of the peak load (P
max
), yield displacement (δ
y
), and displacement ductility coefficient μ between test and FE can be observed in Table 3. Hysteretic and skeleton curve comparison between tests and finite element models. Peak loads (P
max
), yield displacements (δ
y
), and displacement ductility coefficient (μ) comparison (test vs FE). Note: P
max
is the peak load; δ
y
is the yield displacement; μ is the displacement ductility coefficient. aw
c
=0.5.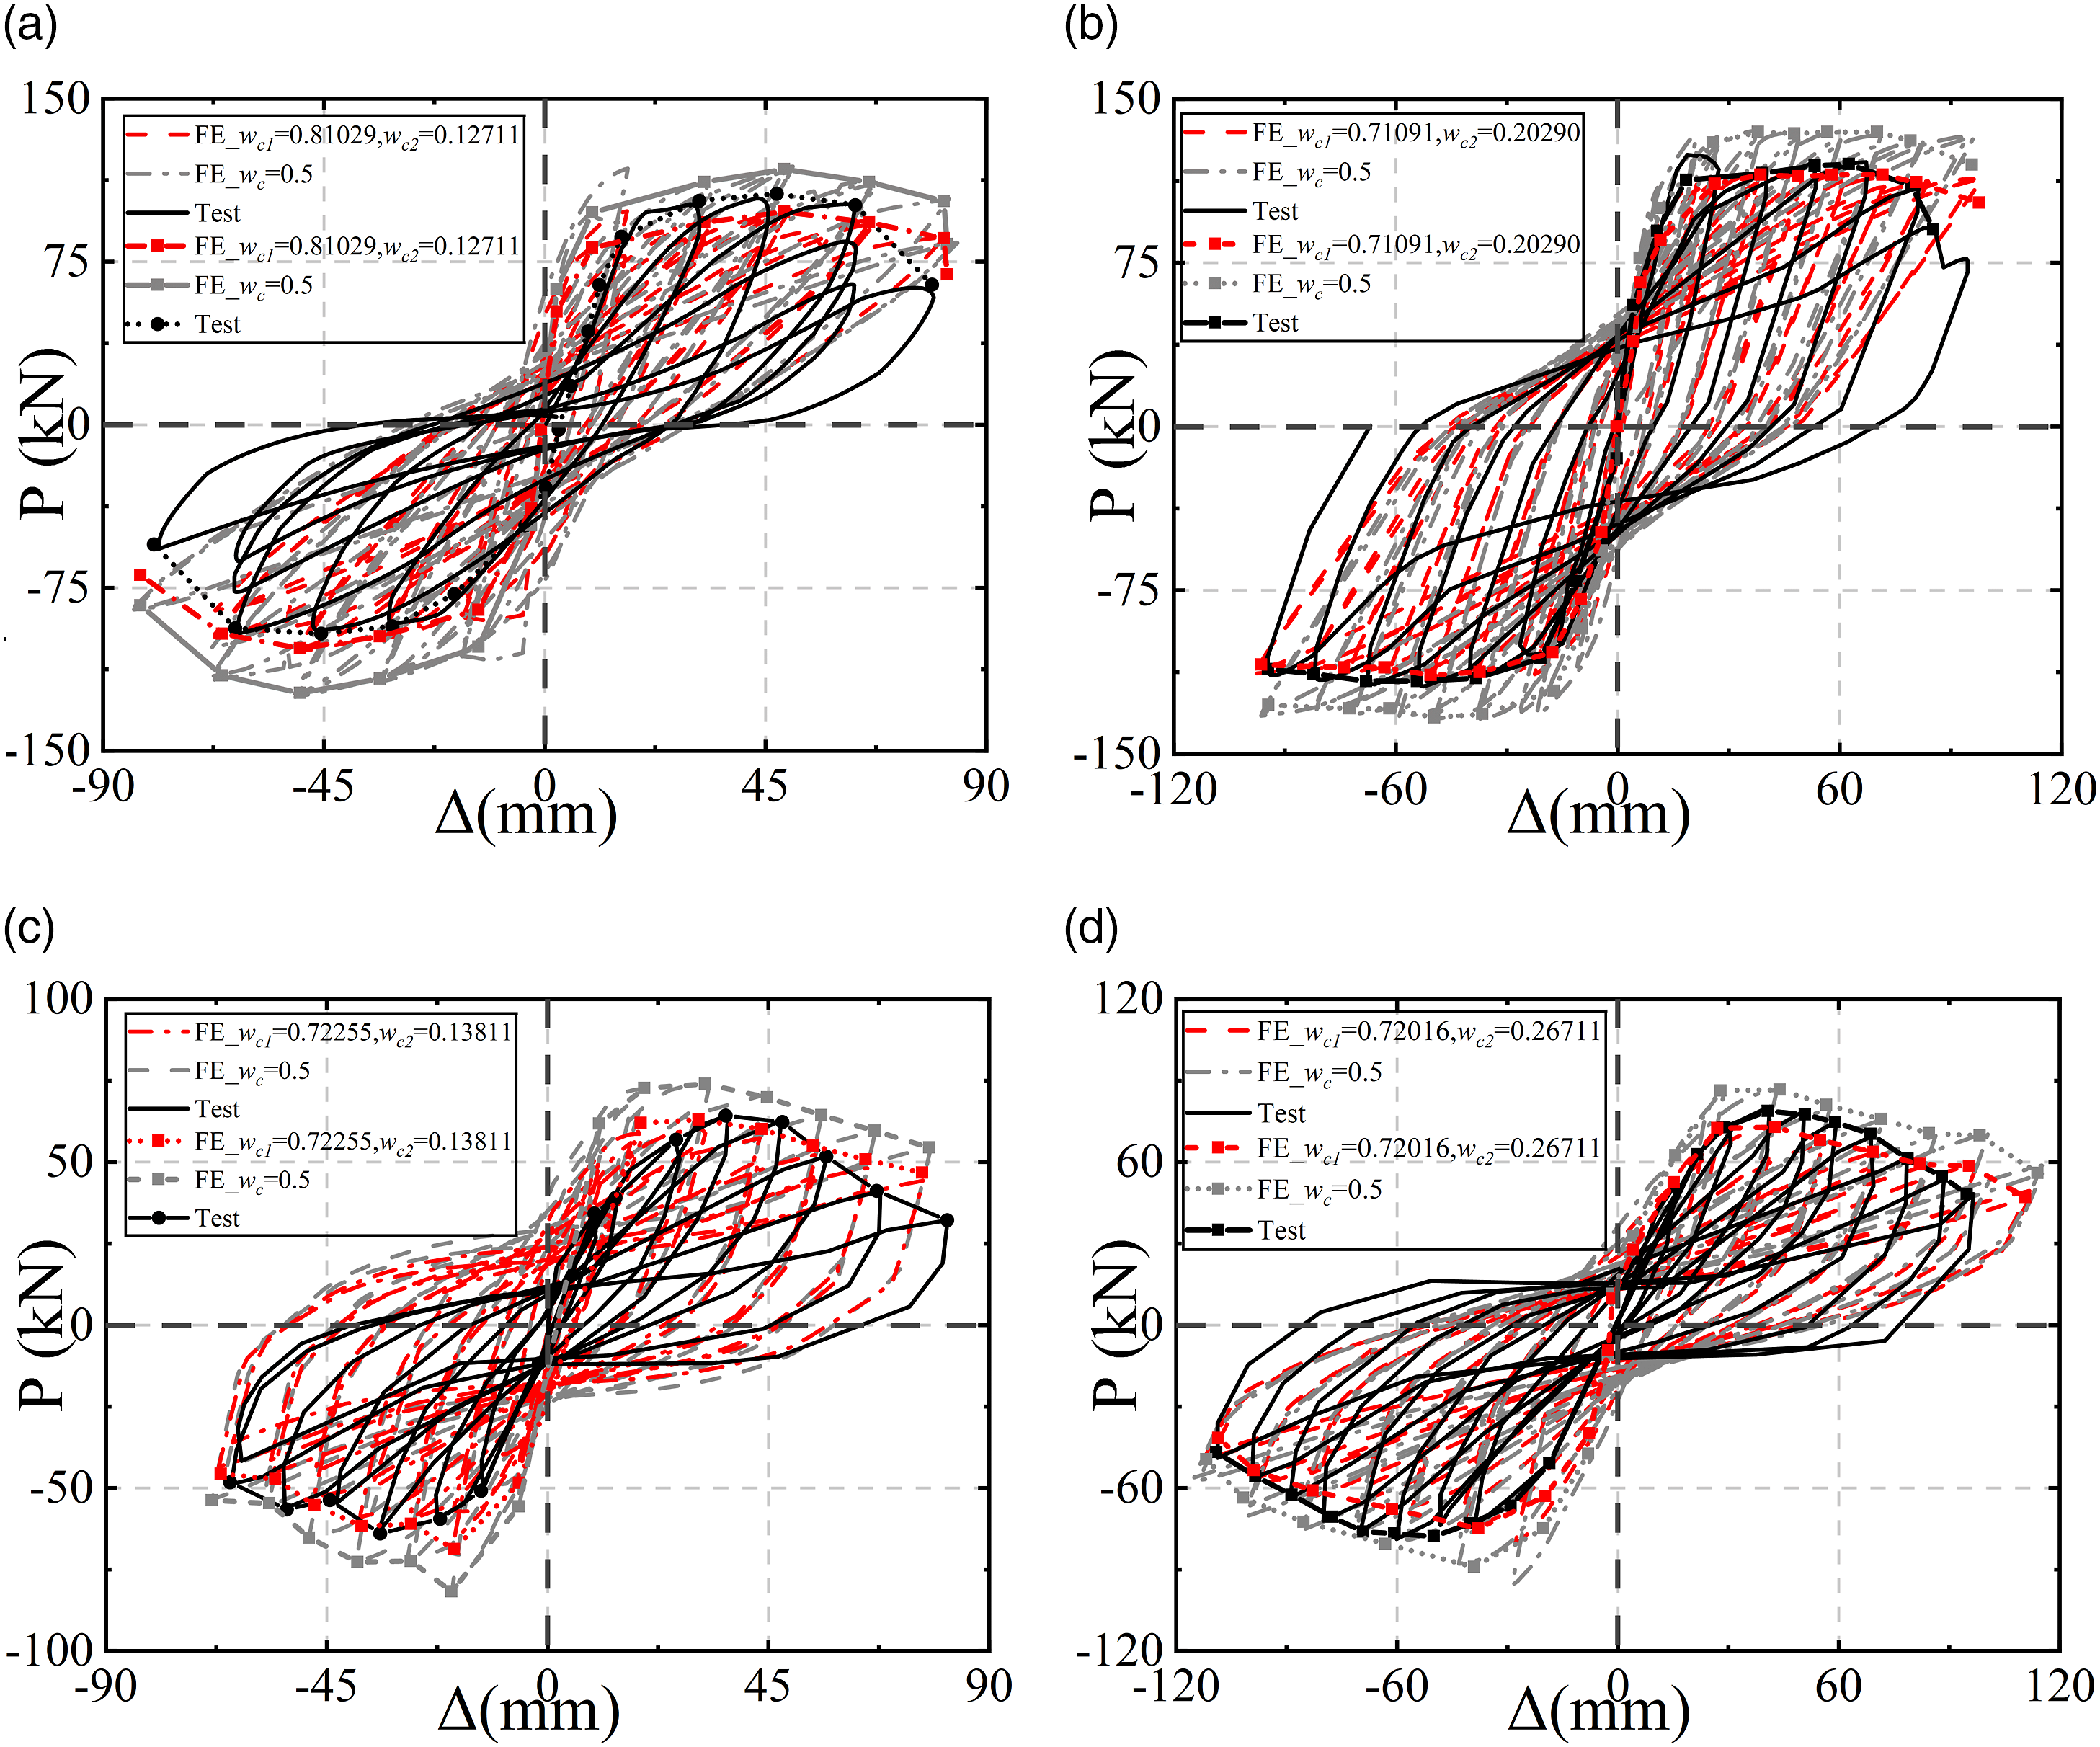
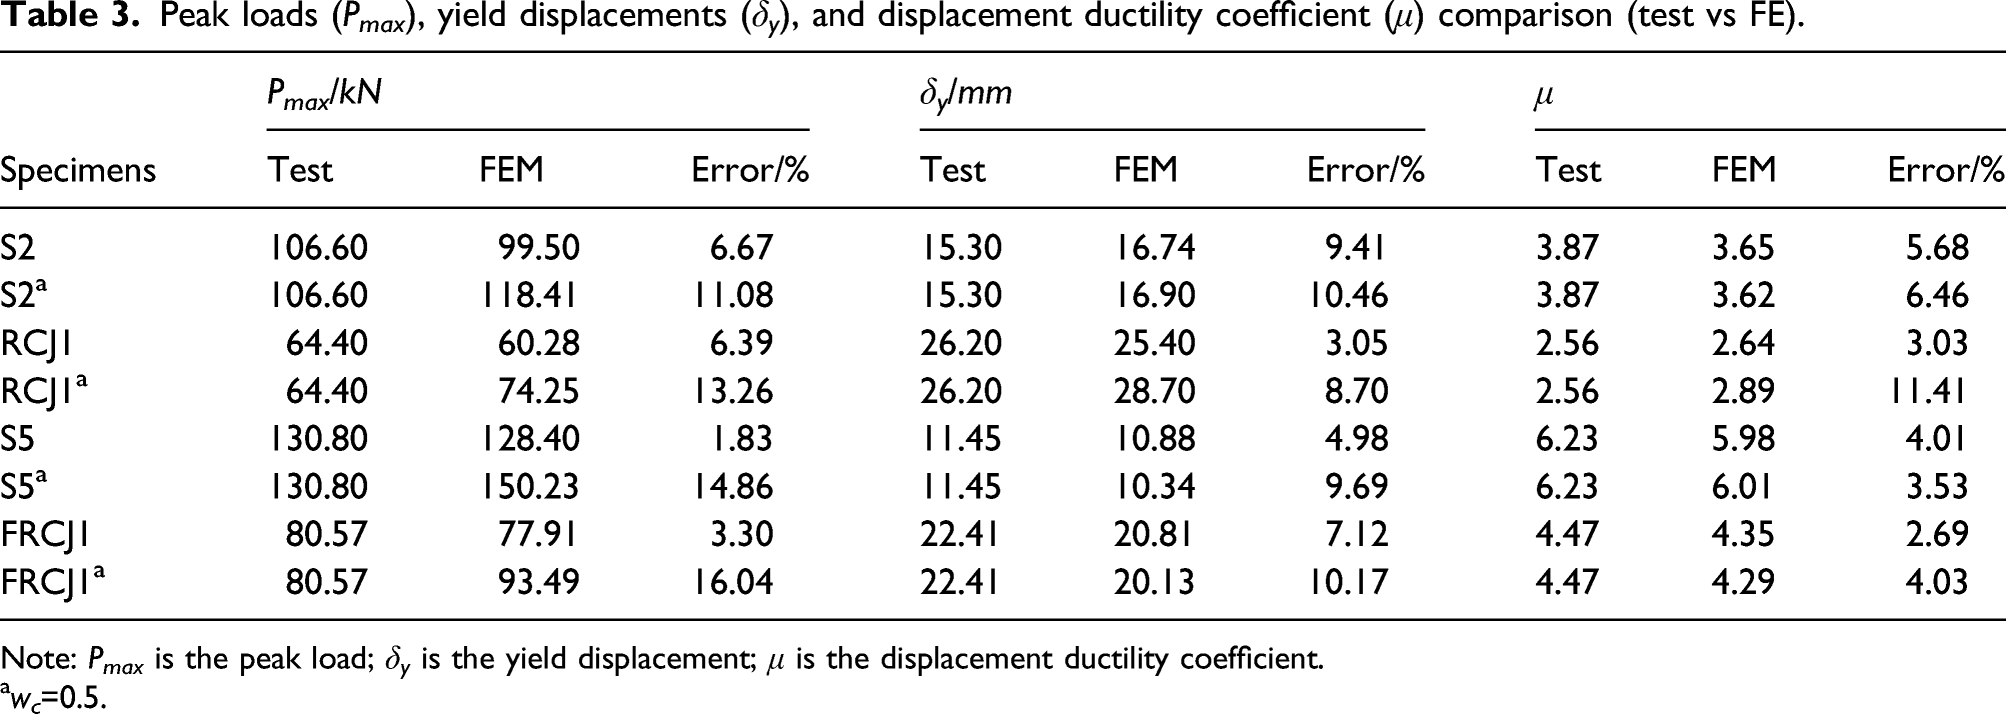
As listed in Table 3, it could be found that the proper description of w c had a great influence on peak load P max and seriously affected the evaluation of the seismic performance of joints. When the w c = 0.5 (default), the peak load P max was over-estimated (the maximum error compared with test results was 16.04%, and the average error was 13.81%). However, with proper definition in Figure 2 of the compression stiffness recovery factor w c with the consideration of concrete closing after crack opening (Li and Zhang, 2021), FE results were closer to the test results (the maximum error of the test was only 6.67%, the average error was 4.55% which is lower than 5%).
Seismic performance of typical RC and R-ECC beam-column joints
Typical beam-column joint design
Joint design
During the past 50 years, more than 85% seismic regions in China have experienced earthquake with magnitudes (Ms) over 5, and the fortification intensity has reached seven or above (Li, 2011). The buildings in those regions should be designed under the second anti-seismic grade (GB50010-2010, 2010), which was chosen as the loading condition in the current research. Also, the section features of the analyzed common T-shaped and cross-shaped beam-column joints, including the cross-section area and reinforcements, were designed based on the limit values according to GB50010-2010 (2010). The geometry and reinforcement details are given in Figure 3. The T-shaped RC and R-ECC joints were numbered as R/ETJ1, R/ETJ2, R/ETJ3, and R/ETJ4. The cross-shaped RC and R-ECC joints were numbered as R/ESJ1, R/ESJ2, R/ESJ3, and R/ESJ4. The specimen geometries and reinforcements (units: mm).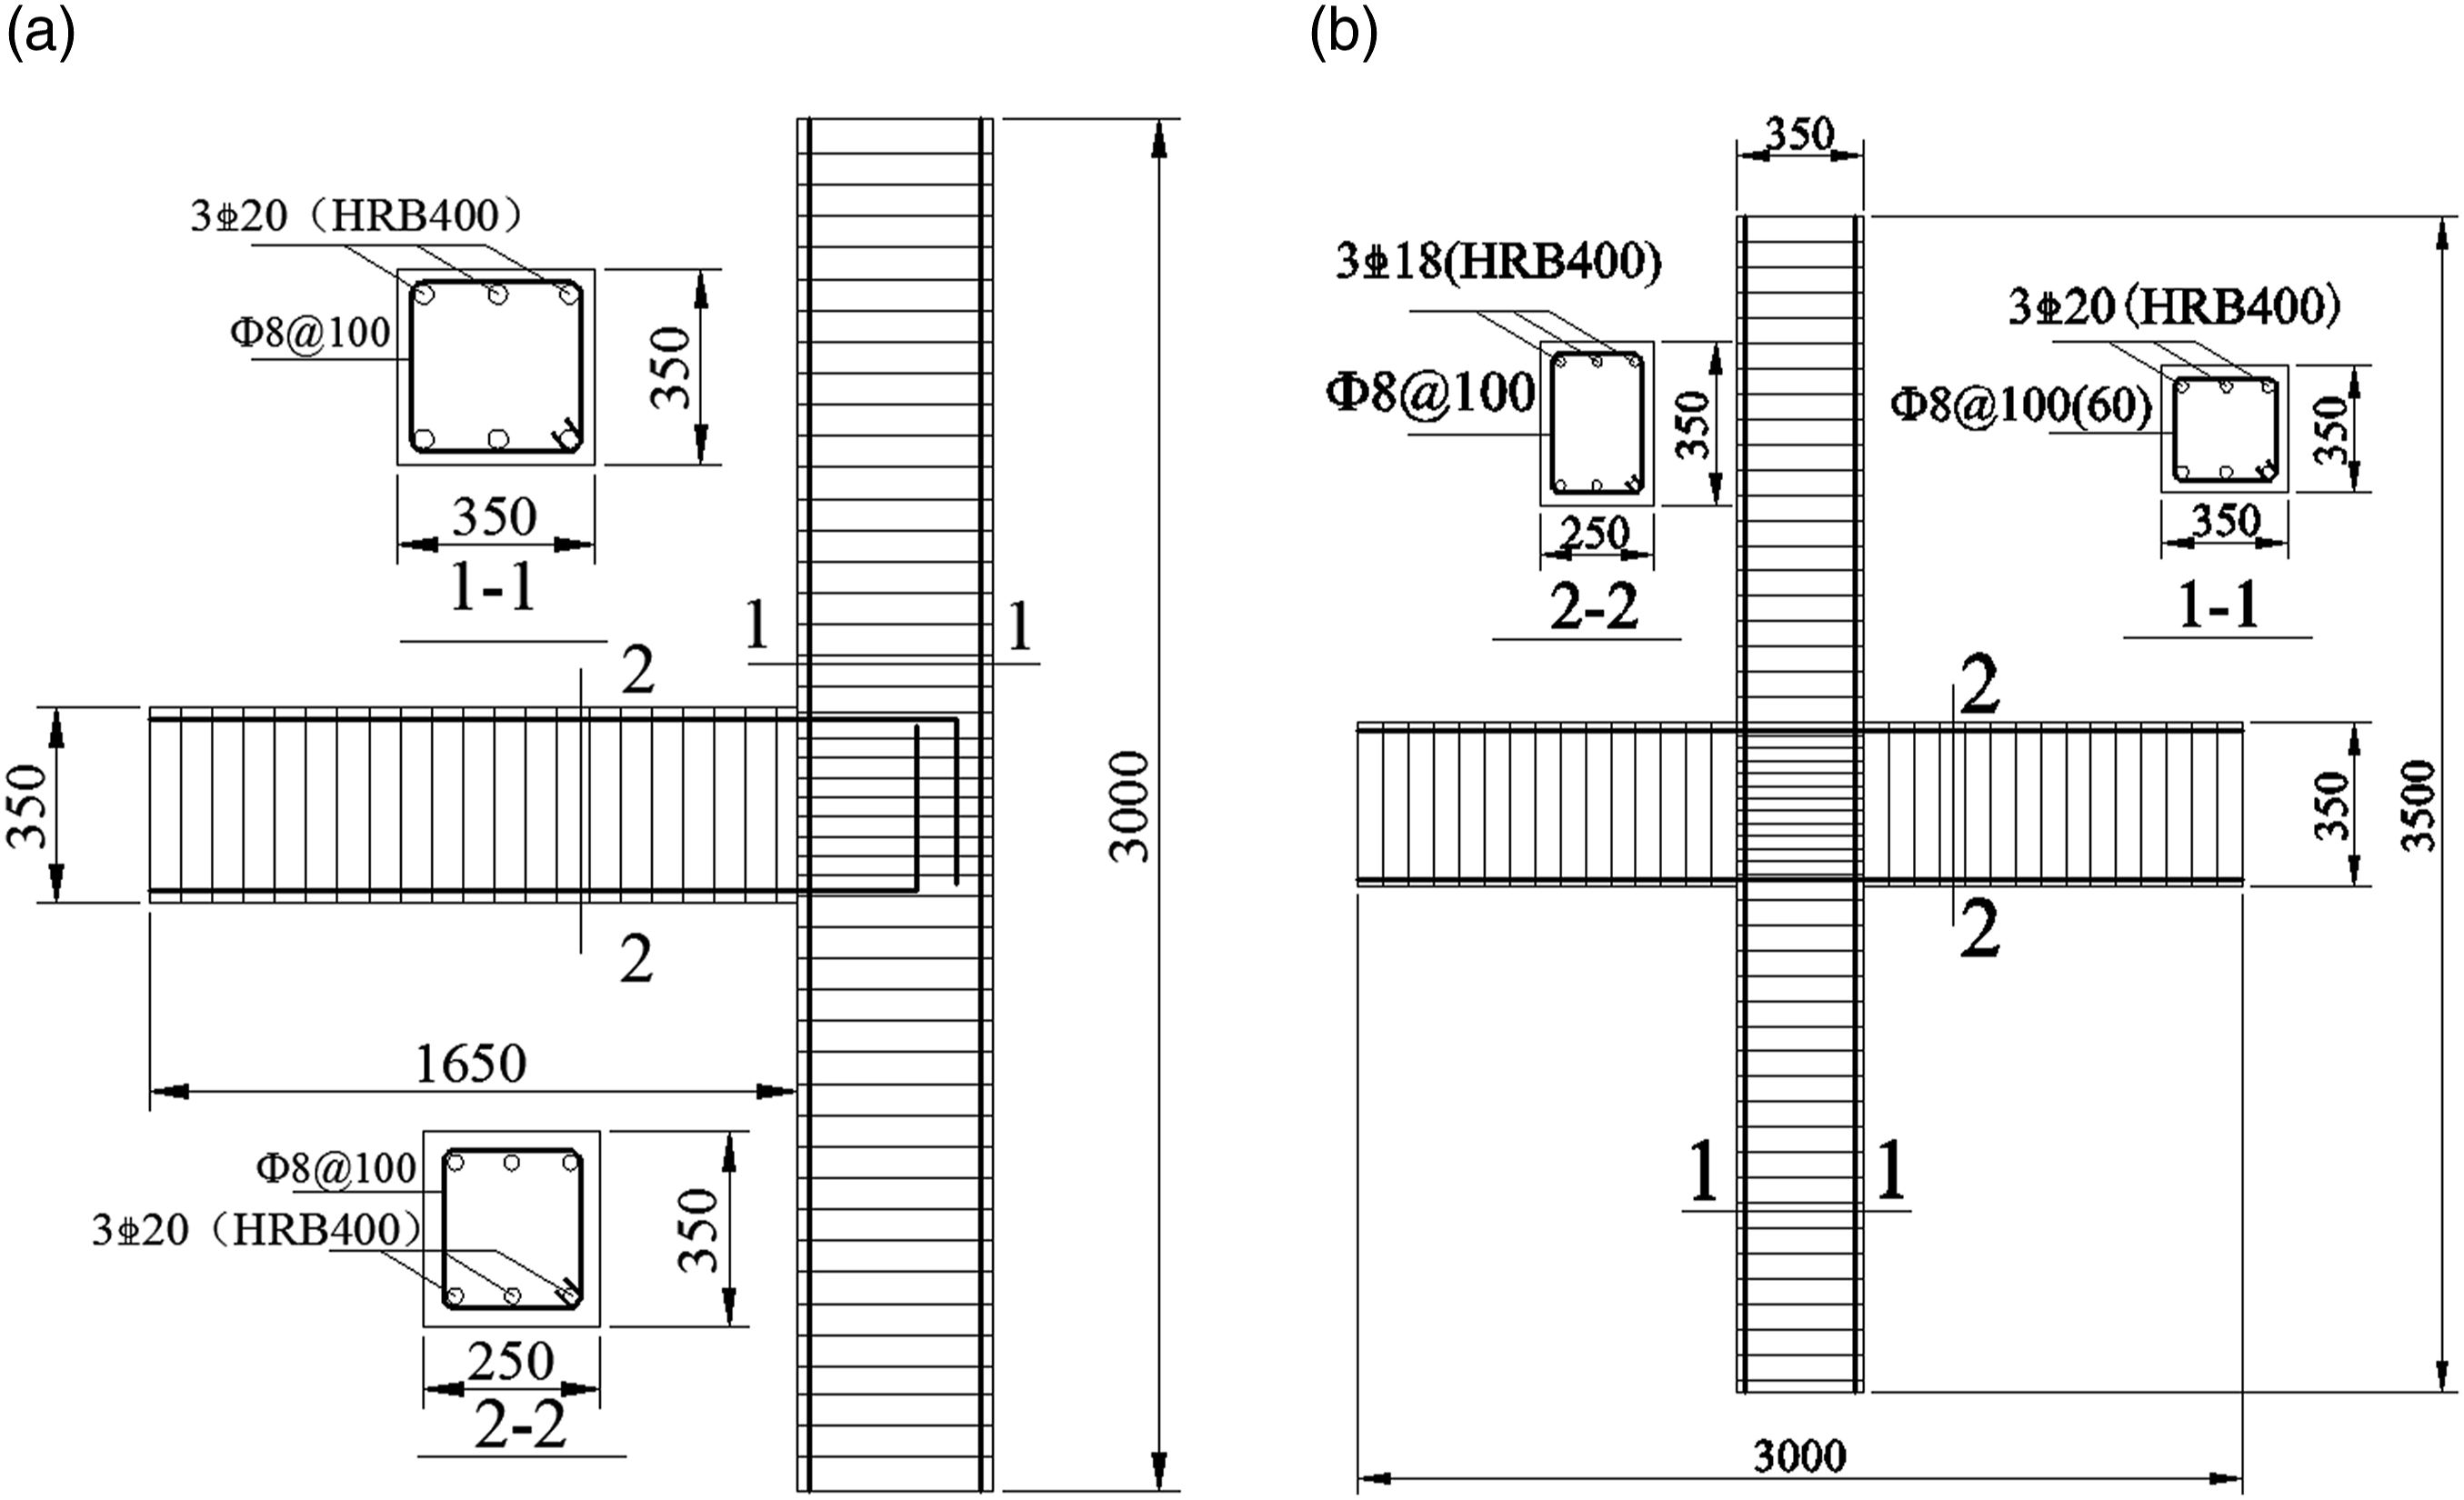
Design parameters of the joints.

Boundary and loading conditions
The boundary conditions for T- and cross-shaped joints are shown in Figure 4a and b. The constant axial load P was applied to control the n, and the transverse cyclic loading C was applied with load-displacement control was applied according to JGJT101-2015 (2015). The load control was firstly used with load amplitude increased by 10 kN each cycle, and for each stage the load was cycled once. As the joint yield load was reached, it was turned to displacement control with the displacement amplitude increased by 10 mm, and for each level the displacement was repeated twice. As the reaction force reached the residual load-carrying capacity (85% of the peak value), the horizontal loading was gradually removed. Boundary conditions and cyclic loading history.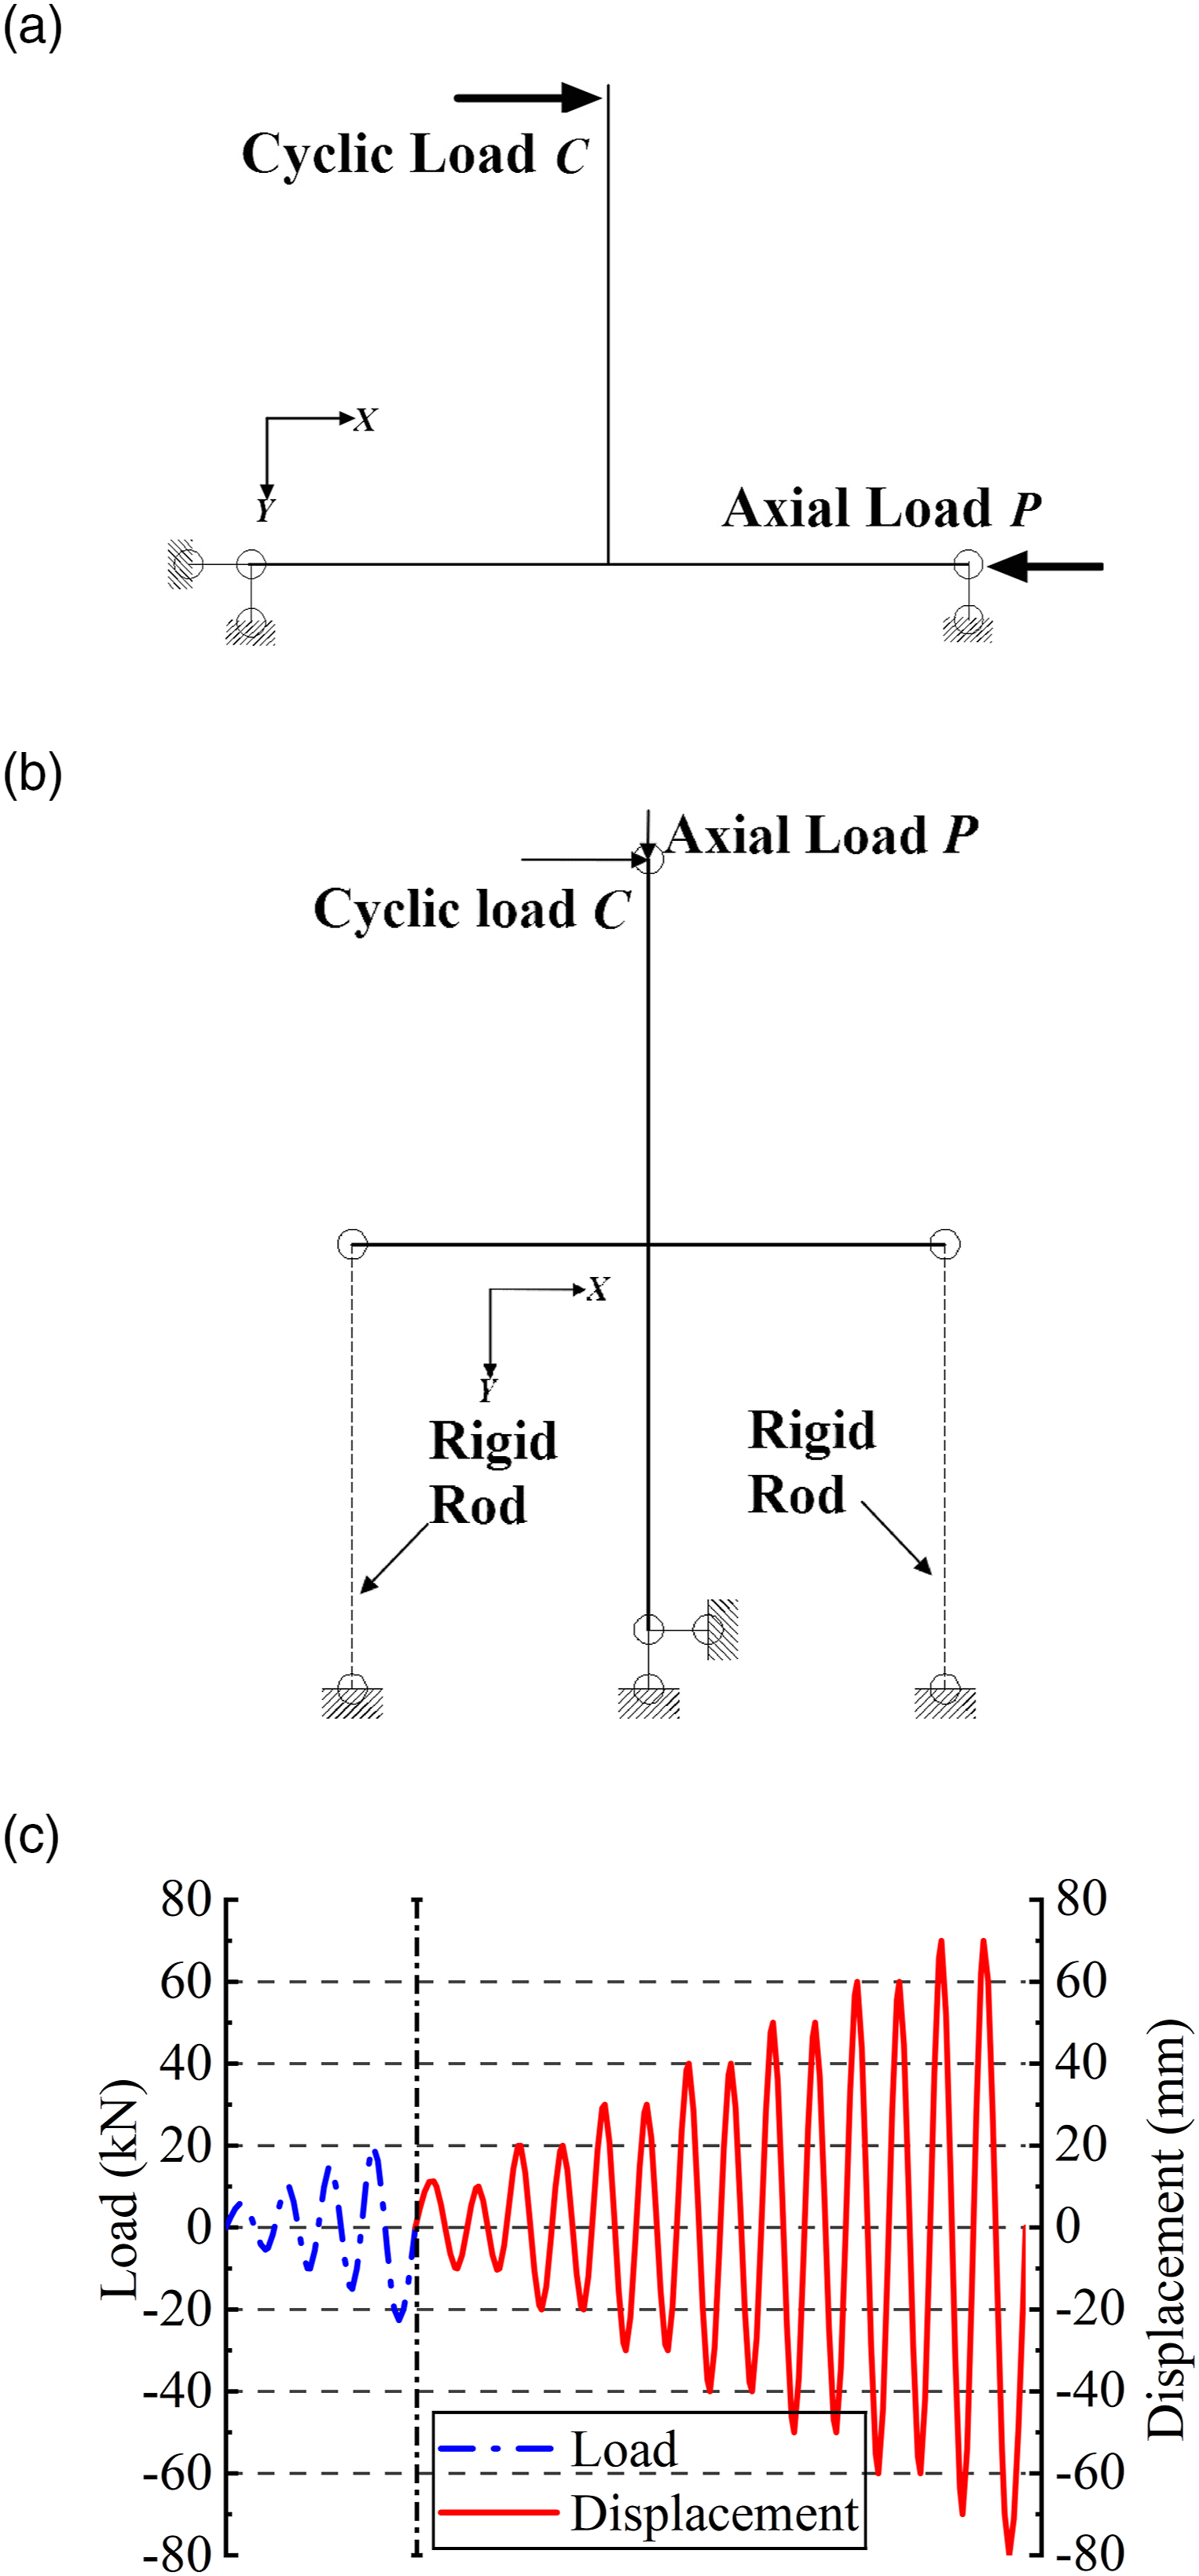
There are two joint cyclic loading schemes including beam end and column end loading. For the cross-shaped and T-shaped joints, the column end loading and the beam end loading should be separately adopted without considering the P-Δ effect when the joint core area is mainly concerned about (Yang et al., 2018).
FE modeling results
For the FE models of T- and cross-shaped RC/R-ECC joints, the tensile damage contours were used to analyze the failure modes of RC/R-ECC joints as shown in Figure 6. The “DAMAGET” variable d
t
in Figure 5 were the tensile damage variable of d
t
, which is a non-decreasing quantity associated with tensile failure of the material d
t
= 0 and d
t
= 1 represents the case of undamaged cement-based materials and completely damaged cement-based materials, respectively (Li et al., 2020). As shown in Figure 5, when d
t
≥ 0.9, the residual stress of the cement-based material was less than 10% of the peak stress. Tensile damage contours of RC/R-ECC T- and cross-shaped joints under n = 0.7.
When the d
t
≥ 0.9, the failure modes can be evaluated by the tensile damage distribution in the joints. According to Figure 6a, when n = 0.7, the damage areas with d
t
over 0.9 were 7.6%, 22.7%, 20.4%, and 40.7% for ETJ3, RTJ3, ESJ3, and RSJ3 specimens, respectively. For ETJ3 and RTJ3 shown in Figure 6a and b, it was obvious that most of the damage occurred at the beam end of the joints, and the failure modes were all ductile beam end bending failure. For ESJ3, most of the damage occurred at the column end, and the failure mode was ductile column end bending failure. For RSJ3, the damage occurred at the beam and column end, and the failure modes were ductile beam end bending failure and brittle column end small eccentric failure. Therefore, the replacement of cement-based materials with better toughness can improve the ductility of beam-column joints under cyclic loading. Tensile damage d
t
and constitutive curve of cement-based materials.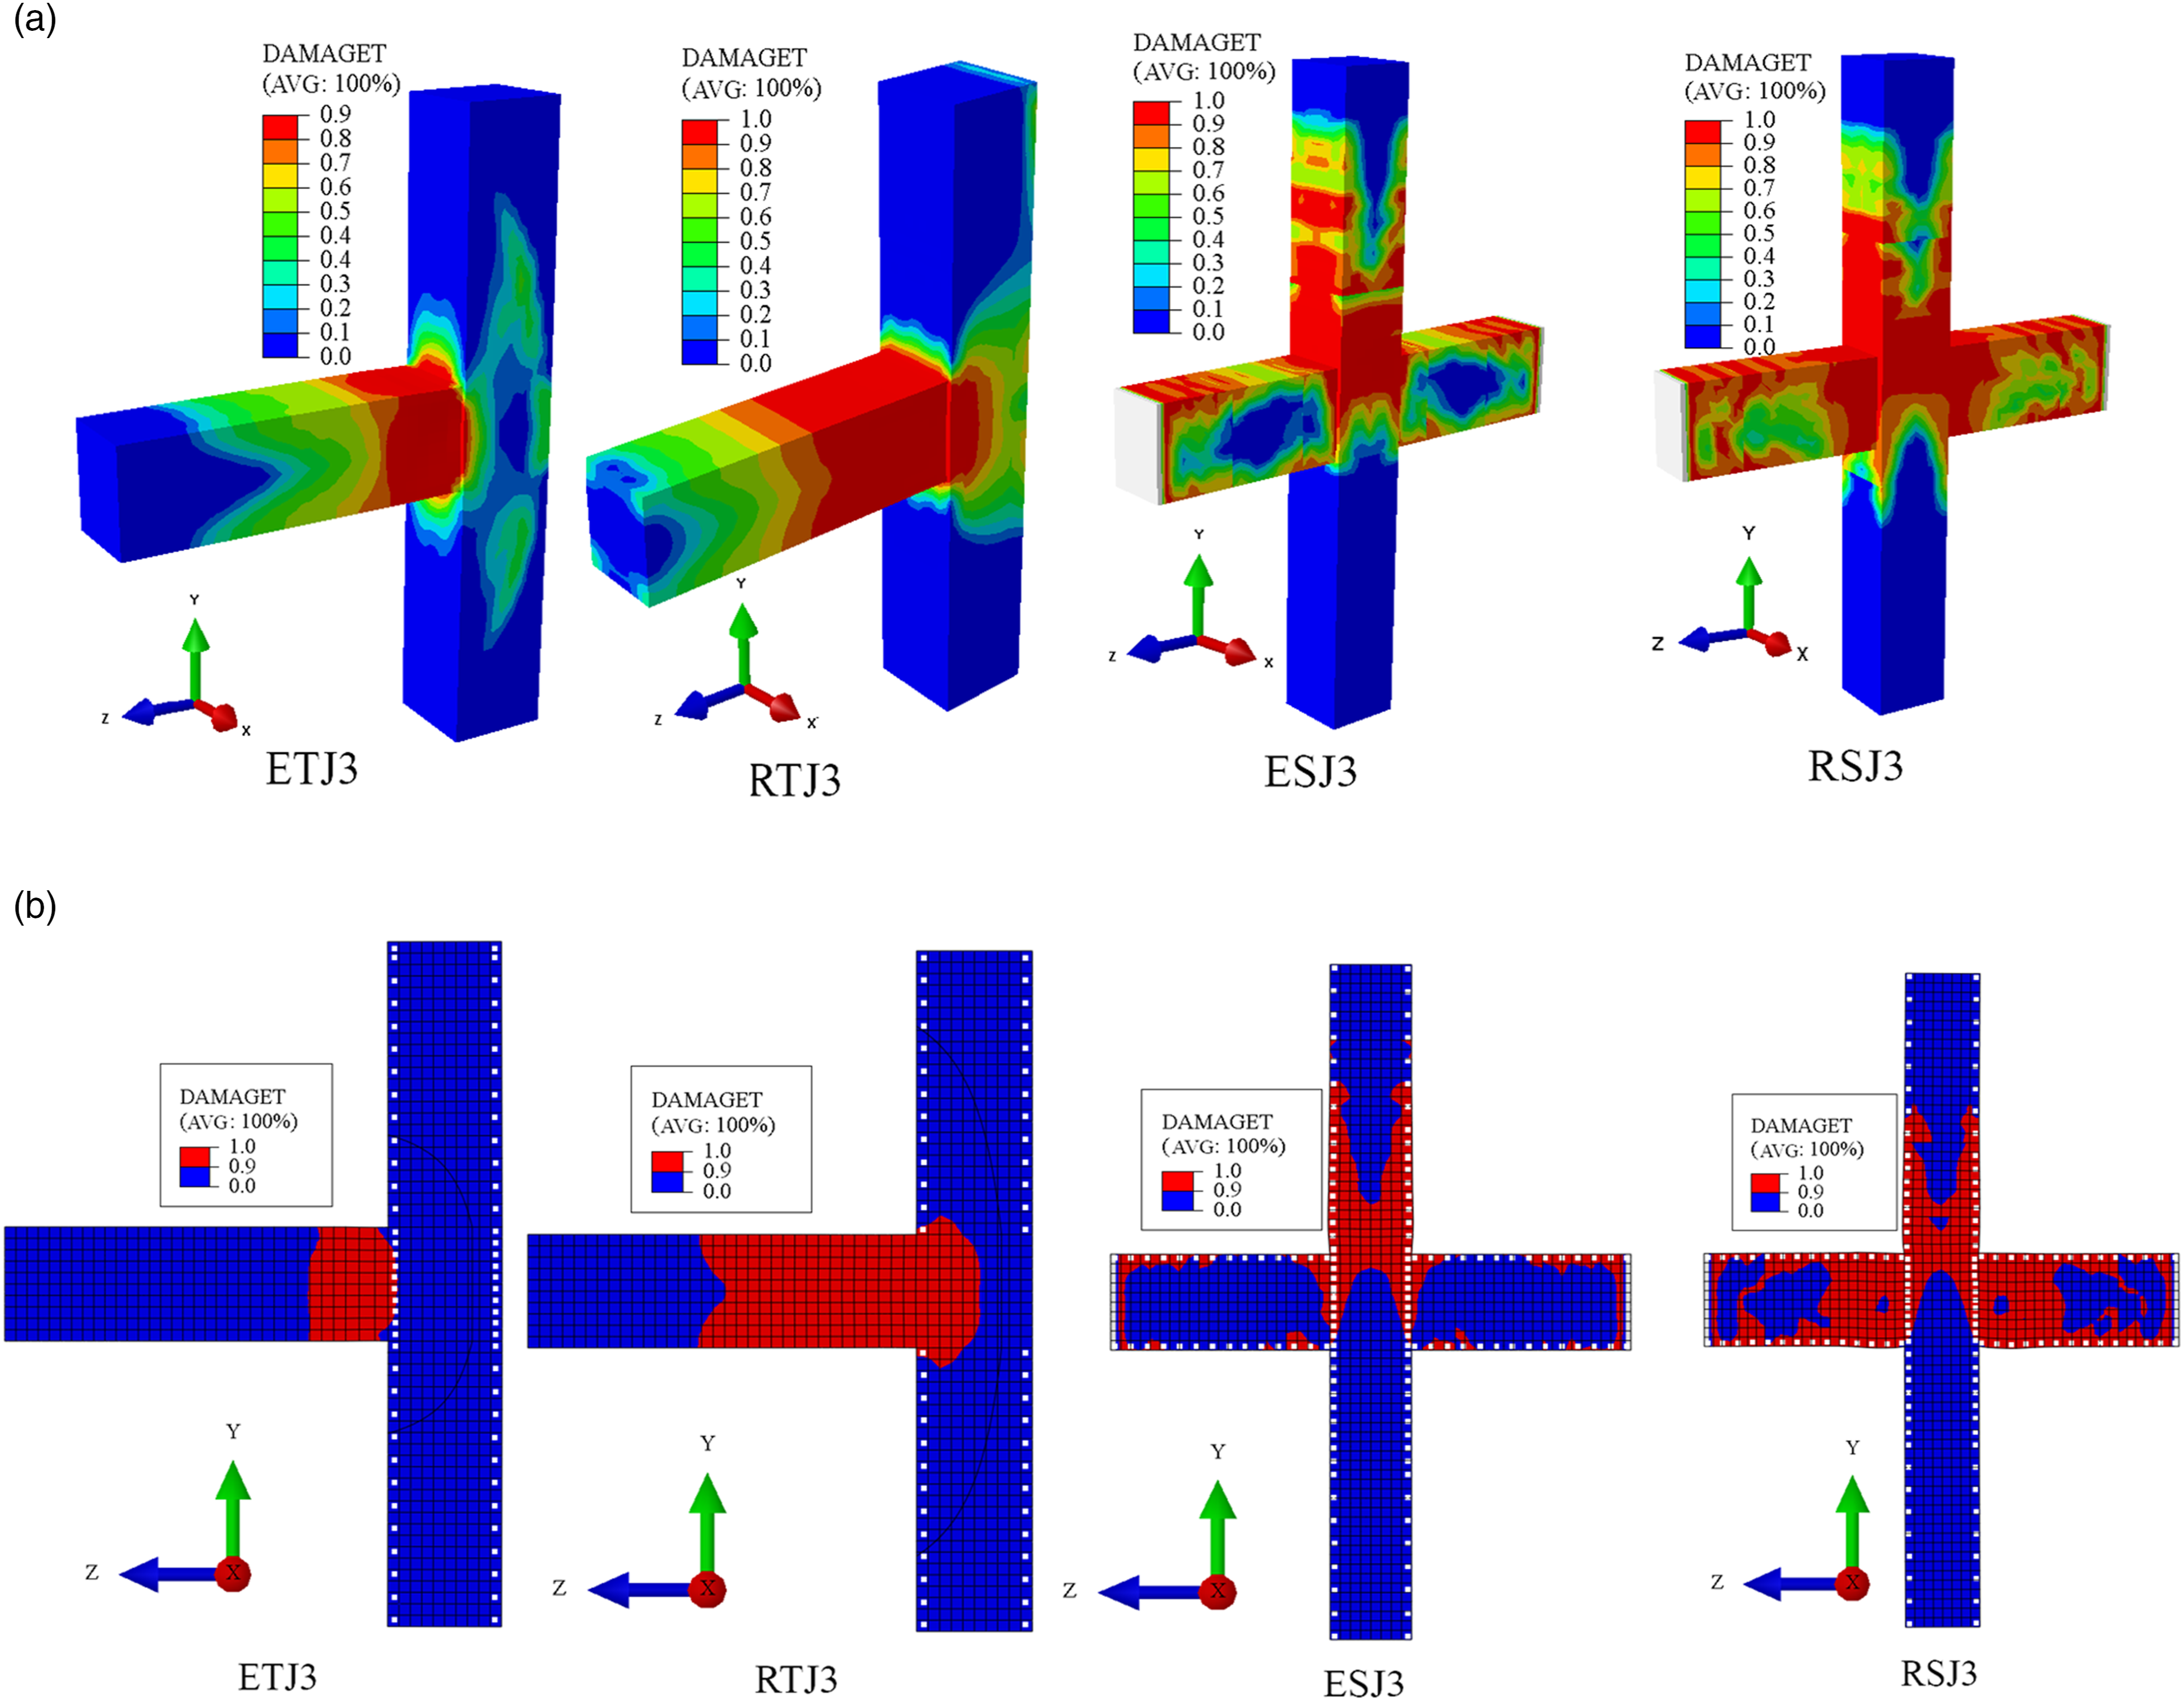
Hysteretic behavior and skeleton curves
Figure 7 shows the load (P)-lateral displacement (δ
l
) hysteretic curve and skeleton curve. Hysteretic and skeleton curves.
As shown in Figure 7, at the initial stage of cyclic loading, the joint was in the elastic stage, the residual deformation was very small after unloading, and the hysteretic curves were basically in linear states. When the joints reached the plastic stage, the internal damage tended to accumulate, and the hysteretic curve area began to increase. Under the low axial load ratio (n < 0.5), the hysteresis loops area was plump, which stated a greater energy dissipation capacity compared with the cases under the high axial load ratio (n > 0.5).
Influence of axial load ratio n
The effect of axial load ratio n on the peak load P
u
and limit displacement δ
l
of joints can be seen in Figure 8. Influence of axial load ratio n on peak load P
u
and displacement δ
l
.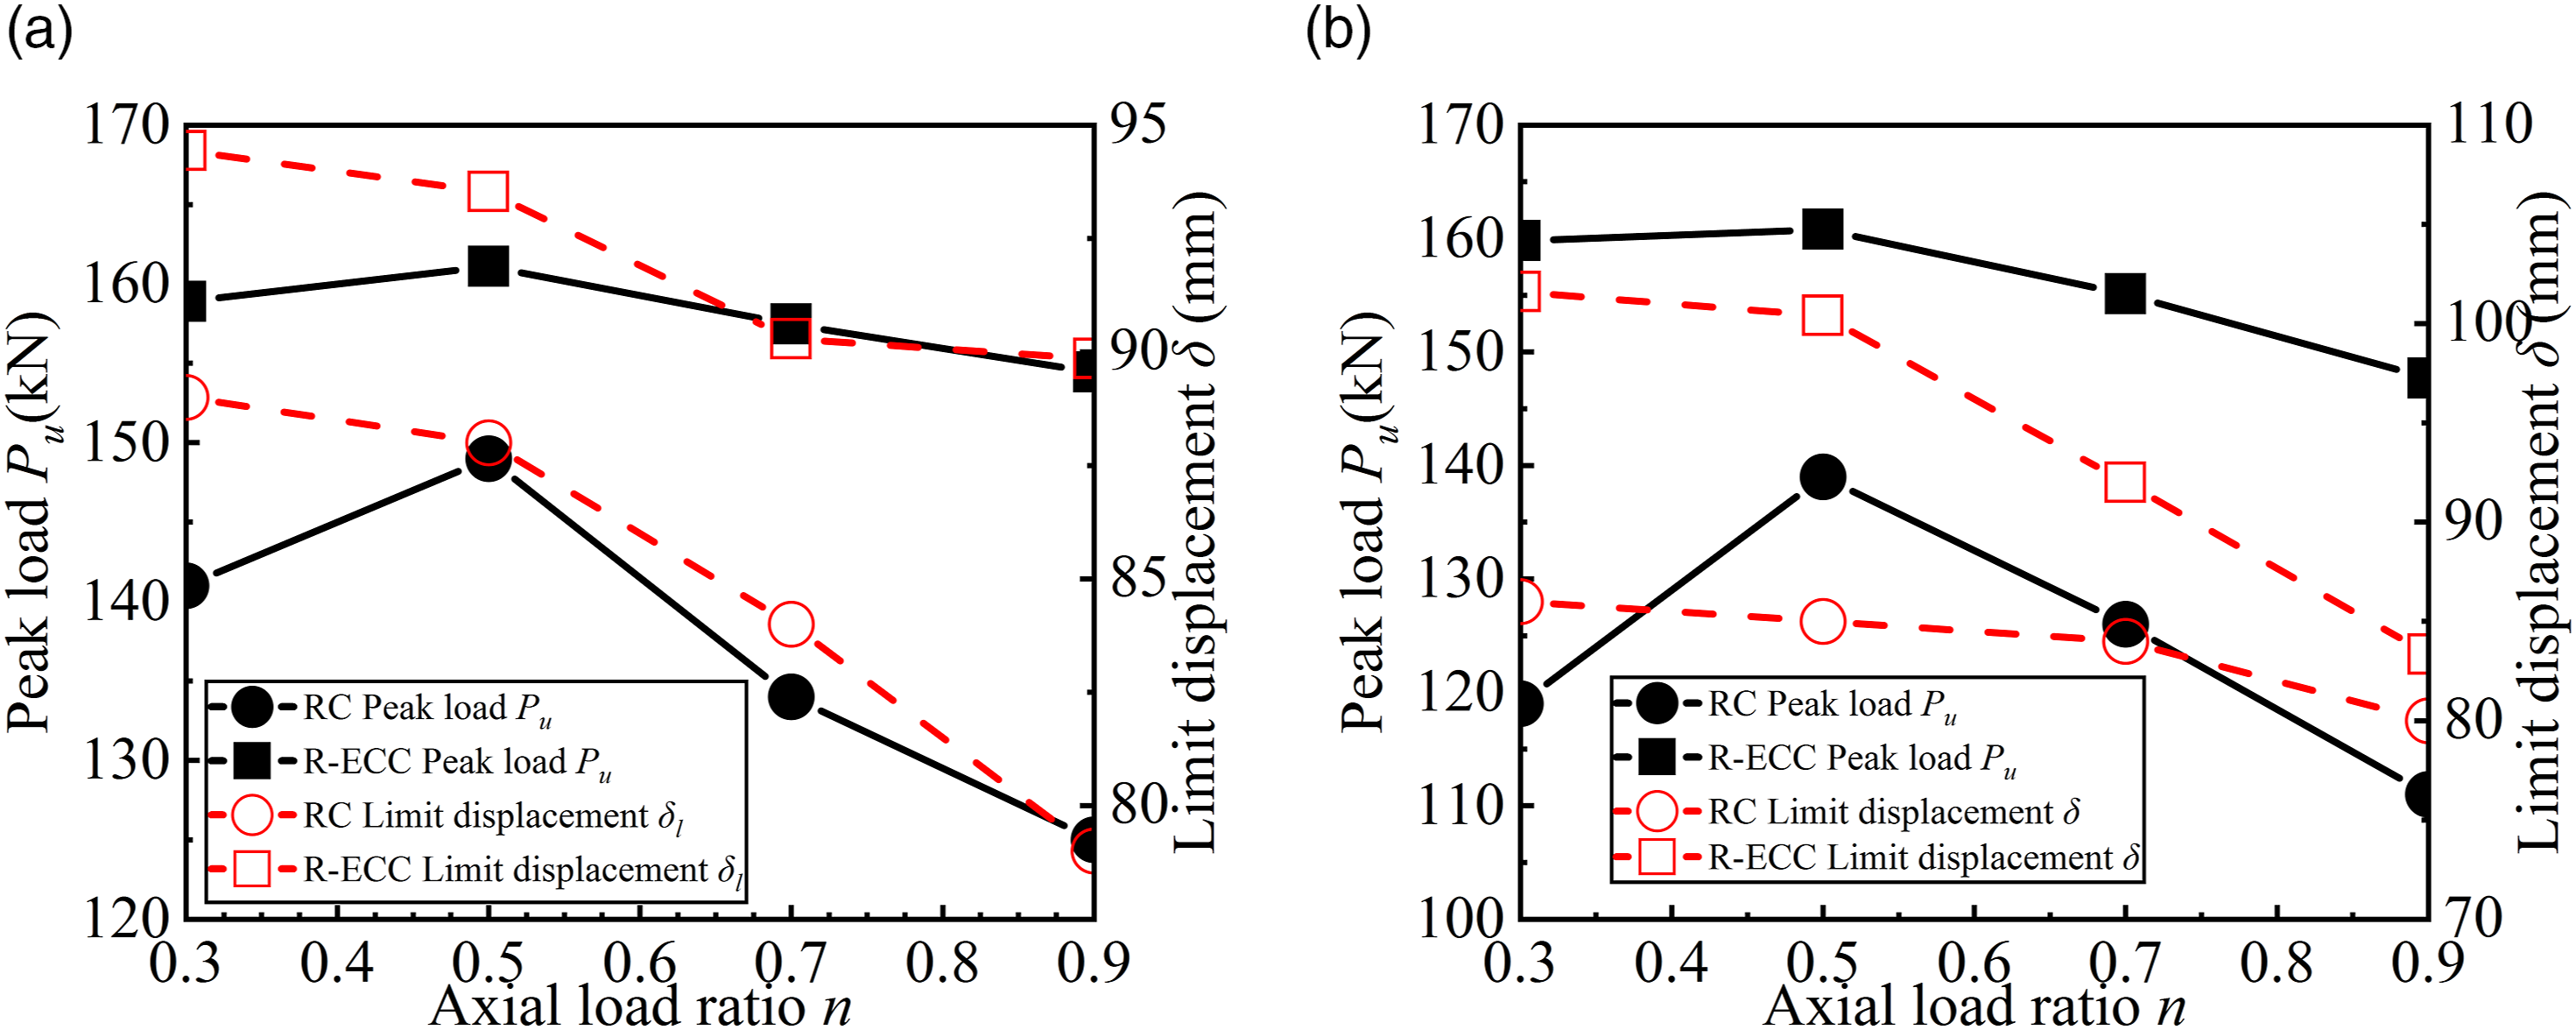
According to Figure 8a, it could be discovered that when n = 0.3–0.5, the peak load (P u ) of T-shaped RC joints increased from 141.2 kN to 149.0 kN, with a growth rate of 5.52%; for the T-shaped R-ECC joints, it increased from 158.8 kN to 161.1 kN, with a growth rate of 1.45%. When the n =0.5–0.9, P u decreased with the increase of axial load ratio n. P u of T-shaped RC joints decreased from 149.0 kN to 125.2 kN, with a rate of −12.97%; for the T-shaped R-ECC joints, it decreased from 161.1 kN to 154.4 kN, with a rate of −4.16%. The P u of T-shaped R-ECC joints were 1.08–1.23 times that of RC joints. For T-shaped RC and R-ECC joints, the limit displacement (δ) decreases with the increase of axial load ratio n. δ of RC joints decreased from 90 mm to 79 mm, with a rate of −12.2%; the R-ECC joints decreased from 94.4 mm to 89.8 mm, with a rate of −4.87%. δ of T-shaped R-ECC joints were 1.05–1.14 times that of RC joints.
According to Figure 8b, it could be discovered that when n = 0.3–0.5, the P u of cross-shaped RC joints increased from 119.0 kN to 139.0 kN, with a growth rate of 16.8%; for the cross-shaped R-ECC joints, it increased from 159.8 kN to 160.8 kN, with a growth rate of 0.62%. When n is in the range of 0.5–0.9, the P u decreases with the increase of axial load ratio n. P u of cross-shaped RC joints decreased from 139.0 kN to 111.2 kN, with a rate of −20.0%; for the cross-shaped R-ECC joints, it decreased from 160.8 kN to 147.7 kN, with a rate of −8.15%. P u of cross-shaped R-ECC joints were 1.16–1.34 times that of RC joints. For cross-shaped RC and R-ECC joints, δ decreases with the increase of axial load ratio n. δ of RC joints decreased from 86.2 mm to 80.1 mm, and the rate was −7.07%; the R-ECC joints decreased from 101.5 mm to 83.4 mm, with a rate of −17.88%. The δ of T-shaped R-ECC joints were 1.04–1.18 times that of RC joints. The variation relationship of axial load ratio n on the joints of two different cement-based materials was roughly the same, but the peak load P u and limit displacement δ of R-ECC joints were obviously better than those of RC joints.
Analysis and discussion
Ductility
The displacement ductility coefficient μ is an important parameter for evaluating the ductility performance of beam-column joints as expressed in equation (5) (Bayrak and Sheikh, 1998)
The results of displacement ductility coefficient μ of RC and R-ECC joint are listed in Figure 9. Relation curve of displacement ductility coefficient μ and axial load ratio n.
It can be seen that μ of T-shaped RC joints were in the range of 2.75–4.14, and for R-ECC the range was 2.91–4.92, which were 1.06–1.34 times that of RC joint. μ of cross-shaped RC joints were 2.64–4.08, and for R-ECC joints were 3.11–4.72, which were 1.16–1.28 times that of RC. These indicated that the toughness of ECC was better than that of NC.
Both for RC and R-ECC joints, when the axial load ratio n was 0.5, μ reached the maximum value. That is because when n was small (n ≤ 0.3), the bond degradation rate between cement-based materials and reinforcements was larger compared with the cases of n = 0.5, which increased the shear deformation of joints to a certain extent, resulting in a slight decrease in ductility. When the axial load ratio is large (n ≥ 0.7), the displacement of the cyclic loading direction of the column was limited so that the joint core bore a larger shear force compared with the cases of n = 0.5, which lead to brittle failure and reduce the ductility of the joint. Therefore, when n is around 0.5, the ductility of the joints was good. Neither higher or lower axial load ratio n values was suggested.
The variation relationship between μ and n of R-ECC joints was the same as that of RC joints, but under the same axial load ratio n, μ of R-ECC joints was higher. That is due to the shear strength of ECC was better than that of NC, and as the strain hardening improvement of ECC and fiber restraint, there were multiple cracks in the joints, which improves the ductility behavior.
Energy dissipation
The equivalent damping coefficient (ξ
eq
) is an important parameter to evaluate the energy dissipation capacity of beam-column joints. The equivalent damping coefficient ξ
eq
was calculated according to equation (6) (Wijesundara et al., 2011) Calculation diagram of equivalent damping coefficient ξ
eq
.
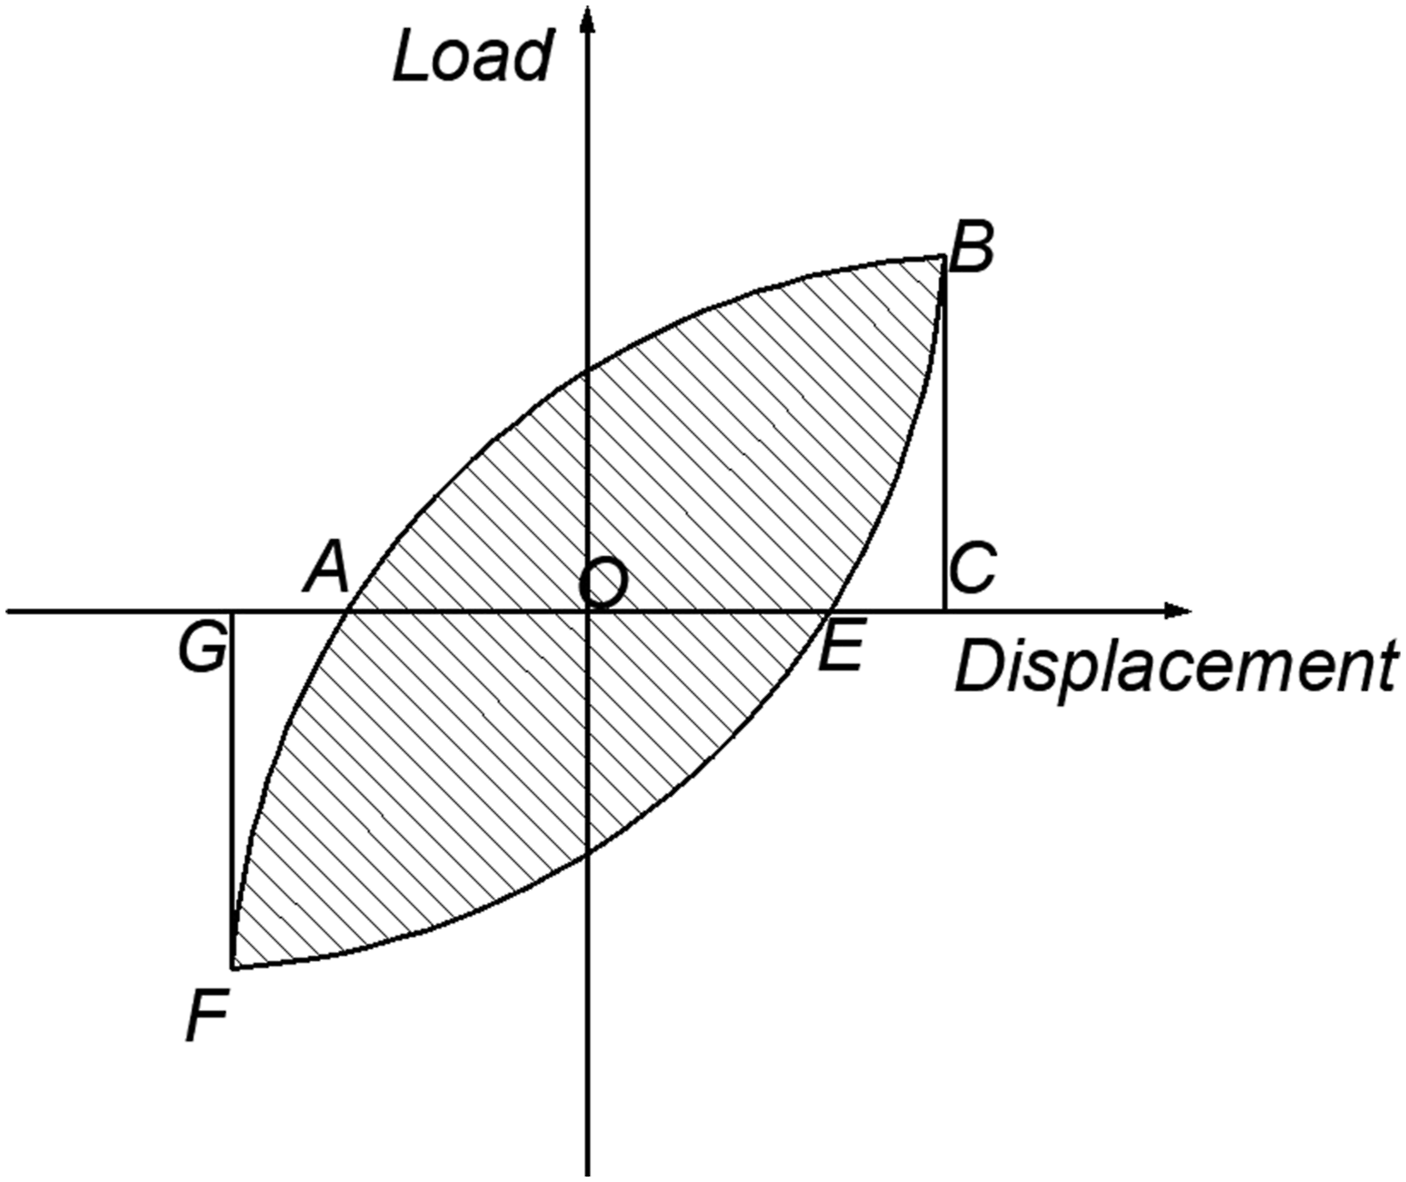
Figure 11 shows the equivalent damping coefficient ξ
eq
of each specimen. It can be seen that the equivalent damping coefficient ξ
eq
of all the specimens was positive correlation to the lateral displacement δ
l
, and was negative correlation with the axial load ratio n. Relationships between equivalent damping coefficient ξ
eq
and lateral displacement δ
l
for different joints.
According to Figure 11a, ξ eq of T-shaped RC joints were 0.208–0.428 at n = 0.3, but only 0.128–0.222 at n = 0.9. ξ eq of T-shaped R-ECC joints were 0.358–0.484 at n = 0.3, but only 0.201–0.286 at n = 0.9. ξ eq of the limit displacement point of ETJ1∼4 (0.484, 0.438, 0.351, 0.286) was 13.1%, 3.8%, 1.9%, and 28.8% higher than that of RTJ1∼4 (0.428, 0.422, 0.344, 0.222).
According to Figure 11b, ξ eq of cross-shaped RC joints were 0.128–0.317 at n = 0.3, but only 0.120–0.239 at n = 0.9. ξ eq of cross-shaped R-ECC joints were 0.248–0.385 at n = 0.3, but only 0.126–0.269 at n = 0.9. ξ eq of the limit displacement point of ESJ1∼4 (0.385, 0.353, 0.298, 0.249) was 17.7%, 17.3%, 11.2%, and 4.2% higher than that of RSJ1∼4 (0.327, 0.301, 0.268, 0.239). Therefore, the use of ECC can effectively improve the energy dissipation capacity of the specimen.
Under the same axial load ratio n, the energy dissipation capacity of R-ECC joints was higher than that of RC joints. This is attributed to superior ductile behavior of ECC and the abundant inelastic deformation of steel reinforcement along with ECC.
Stiffness degradation
The plastic deformations and cracks of specimens can be expressed by stiffness degradation. By introducing damage factor (d
c
, d
t
) into the model, the stiffness degradation of the model was proper simulated. The secant stiffness K
i
of skeleton curve was used to evaluate the stiffness degradation of the joints according to equation (7)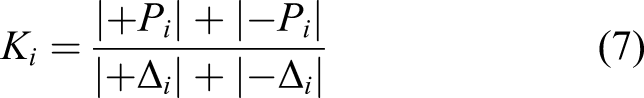
Figure 12 shows the relationships between secant stiffness K
i
and lateral displacement δ
l
of each specimen. Stiffness degradation and lateral displacement δ
l
relationships.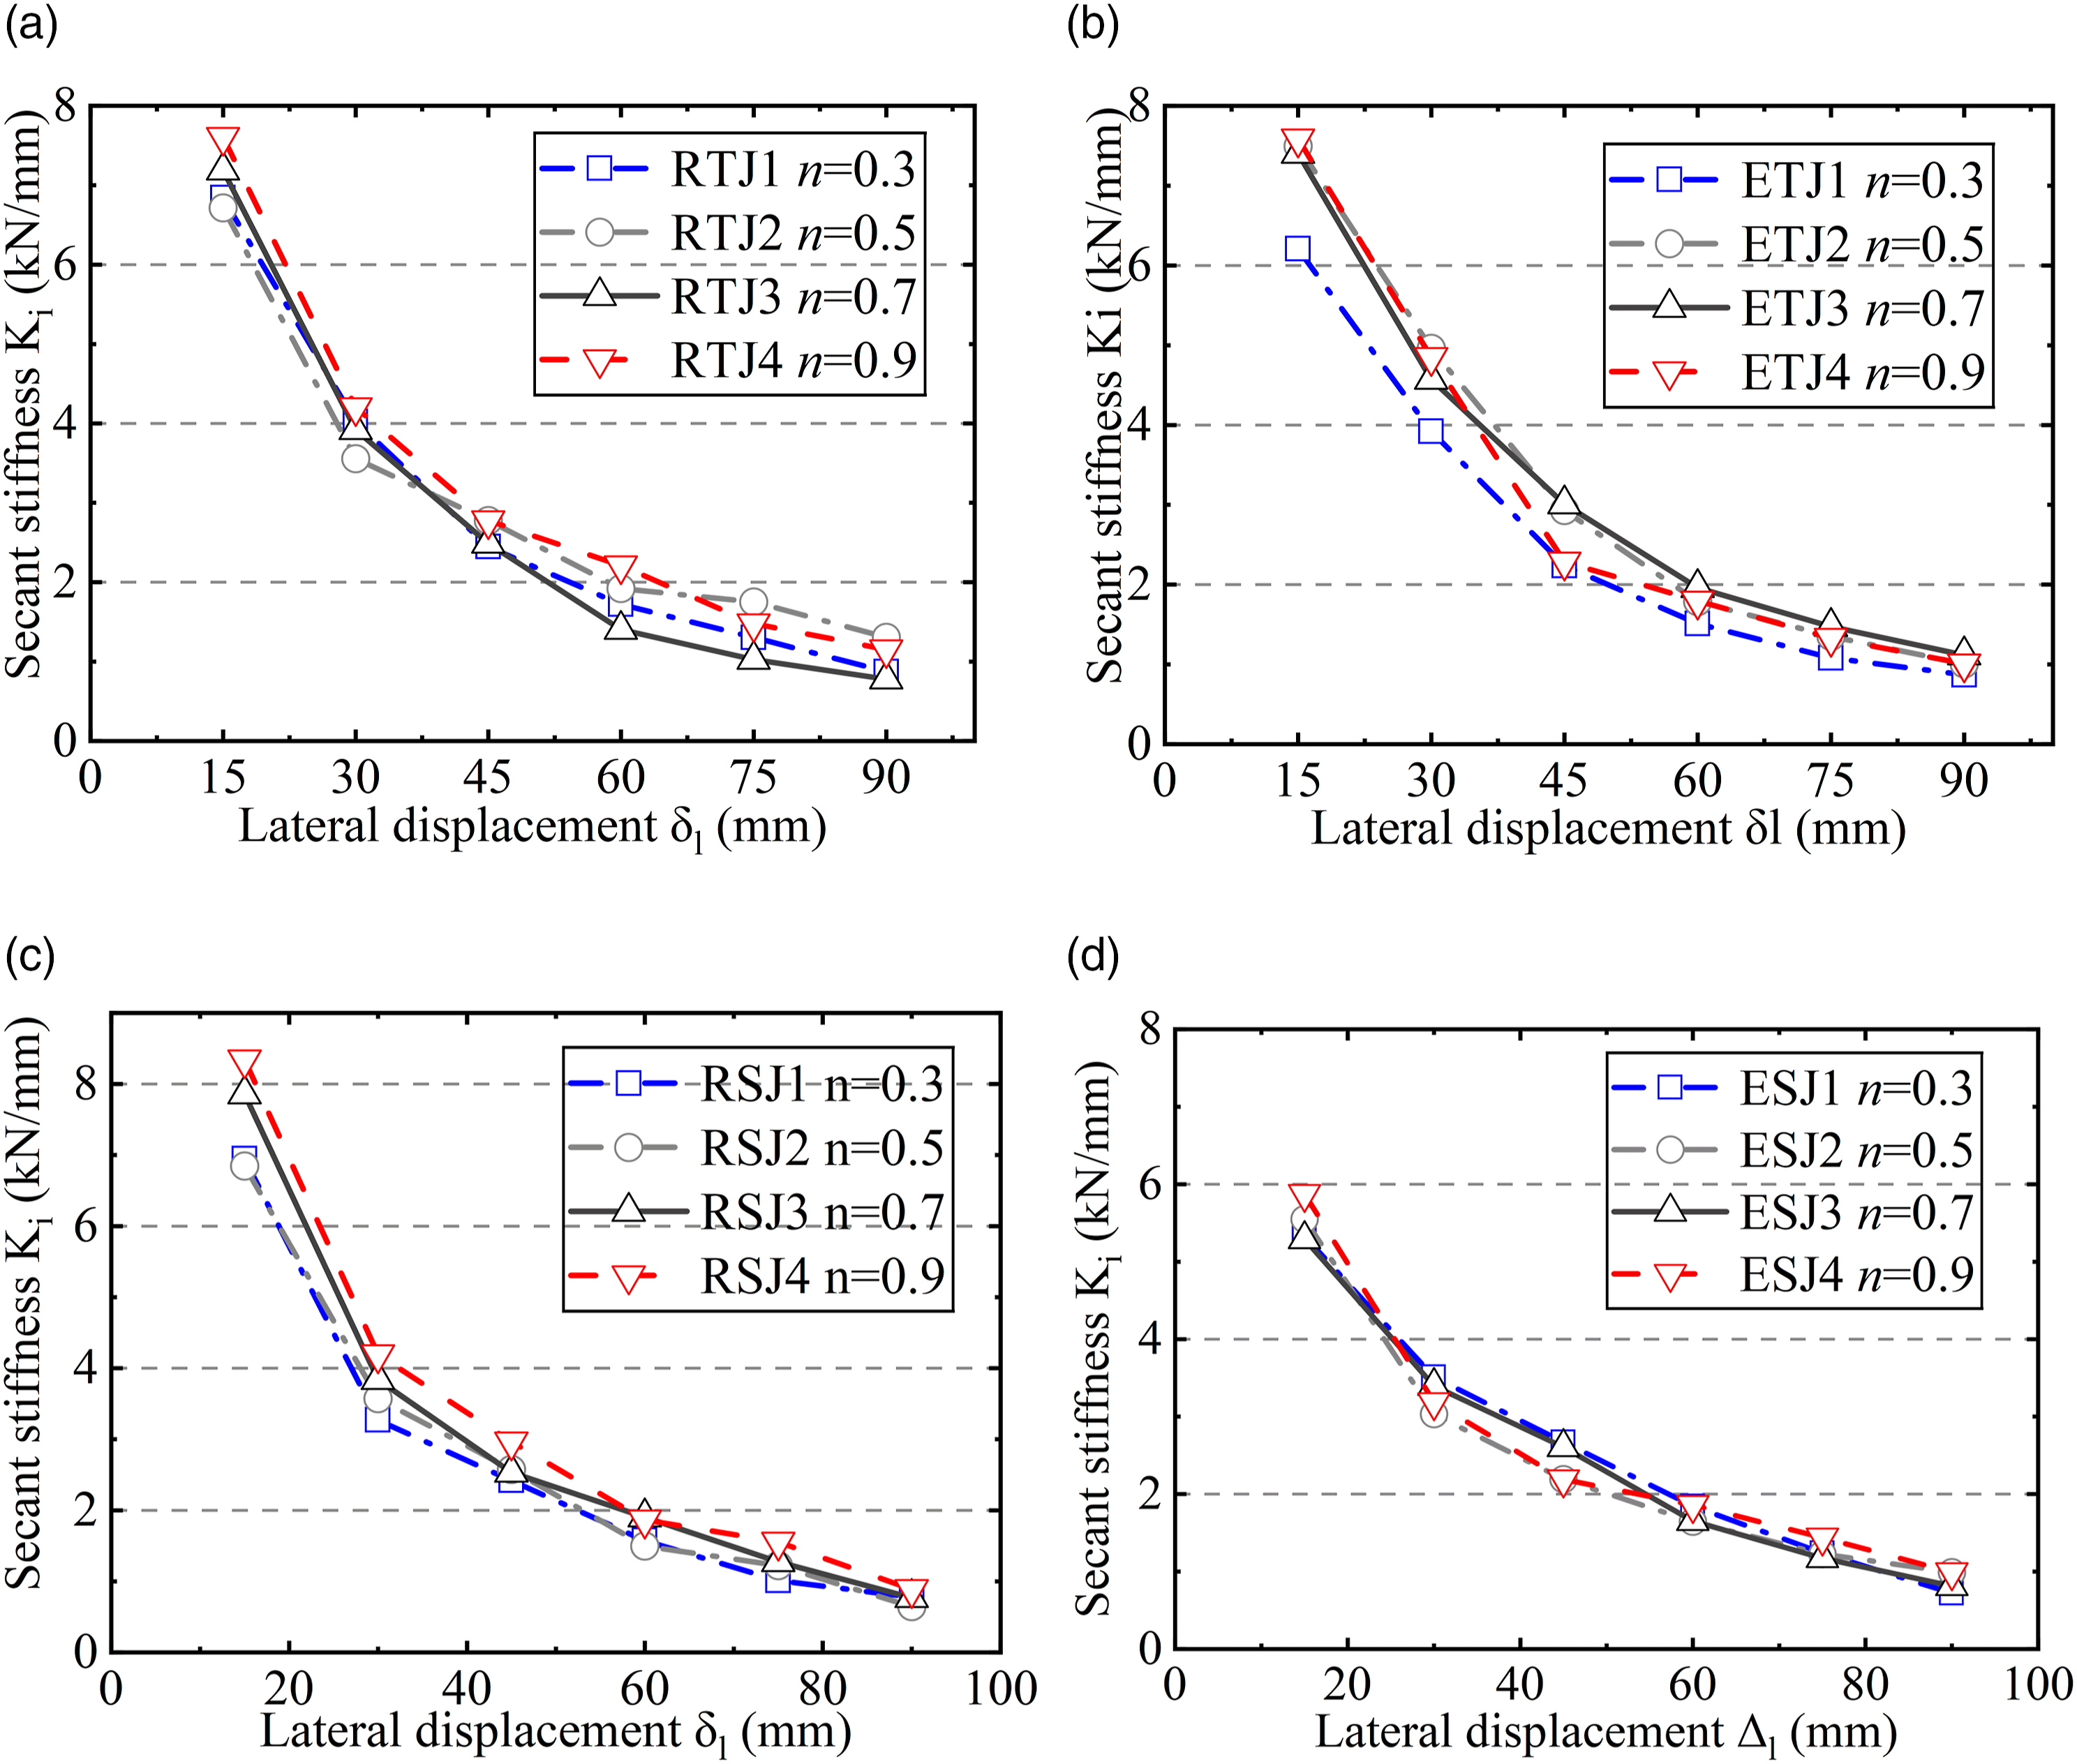
From Figure 12a and b, it can be seen that the initial stiffness K 1 of T-shaped RC joints was higher than that of R-ECC joints. The initial stiffness K 1 of RC joints were 6.71–7.61, and that of R-ECC joints were 6.21–7.58. The initial stiffness K 1 of T-shaped RC joints were 1.01–1.08 times that of R-ECC joints. The average stiffness degradation rate K Δ was introduced to compare the overall stiffness degradation of different cement-based material joints. The average stiffness degradation rate K Δ could be calculated from the average rate of secant stiffness in each cyclic loading stage under n=0.3–0.9, which can reflect the overall stiffness degradation of the joints in that axial load ratio range. K Δ of T-shaped RC joints was 33.7%, and R-ECC joint was 29.8%. Therefore, the stiffness degradation of T-shaped RC joints was more serious than that of R-ECC joints.
From Figure 12c and d, it can be seen that the initial stiffness K 1 of cross-shaped RC joints was higher than that of R-ECC joints. The initial stiffness K 1 of RC joints were 6.85–8.34, and that of R-ECC joints were 5.29–5.87. The initial stiffness K 1 of T-shaped RC joints were 1.29–1.42 times that of R-ECC joints. The average stiffness degradation rate of cross-shaped RC joints was 43.2%, and R-ECC joints was 30.8%. Therefore, the stiffness degradation of cross-shaped RC joints was more serious than that of R-ECC joints too.
According to above analysis, at the same axial load ratio n, the initial stiffness of RC joints was higher than that of R-ECC, as NC contains coarse aggregates, the elastic modulus of NC should be higher than that of R-ECC joint, even with the same compressive strength f c . Therefore, the initial stiffness of RC joints was higher. Meanwhile, the stiffness degradations of RC joints were more serious than that of R-ECC joints. This was also attributed to the absent of coarse aggregates in ECC as well as the application of PVA fibers. These all contributed to the tension hardening behavior and excellent bridging ability between the matrix and fibers inducing crack control abilities. The multiple cracking and tensile strain hardening behavior of ECC could alleviate the damage level and consequently prevent an abrupt loss in stiffness (Liang et al., 2016a).
Conclusions
The influence factors of failure modes for beam-column joints under cyclic loading conditions were analyzed and discussed. Based on this, the numerical simulation of RC/R-ECC beam-column joints were carried out, and the influence of axial load ratio n (0.3–0.9) on the seismic performance of the joints was discussed. The conclusions can be drawn as follows: Brittle shear failure occurs when the axial load ratio n of T and cross-shaped RC joints is over 0.7. The peak load P
u
of T-shaped R-ECC joints were 1.08–1.23 times that of RC joints as the n was in the range of 0.3–0.9, and the limit displacement δ
l
of T-shaped R-ECC joints were 1.05–1.14 times that of RC joints. The peak load P
u
and the limit displacement δ
l
of cross-shaped R-ECC joints were 1.16–1.33 times and 1.04–1.18 times that of RC joints (n=0.3–0.9), respectively. It can be discovered that the load bearing and deformation capacities of R-ECC joints were much better than RC joints under the same structure design and loading conditions. The displacement ductility coefficient μ is the key index to evaluate the ductility of beam-column joints, and the axial load ratio n is the main controlling factor. μ of T-shaped and cross-shaped RC and R-ECC joints was directly proportional to the axial load ratio n in the range of 0.3–0.5, and was inversely proportional to the axial load ratio n in the range of 0.5–0.9. μ of T-shaped R-ECC joints was 1.06–1.34 times that of RC, and for cross-shaped R-ECC joints the ratio was 1.06–1.28. The ductility of R-ECC joints was better than RC joints under the same structure design and loading conditions. Increasing the axial load ratio n has great effects on the energy dissipation capacity of RC and R-ECC joints. The equivalent damping coefficient ξ
eq
of T- and cross-shaped R-ECC joints were 1.08–1.29 and 1.09–1.13 times that of RC joints (n = 0.3–0.9), indicating that replacing NC with ECC could improve the joint energy dissipation capacity. The stiffness degradation of RC joints was smaller than that of R-ECC joints under cyclic loadings. The average stiffness degradation rate K
Δ
of T-shaped RC joints was 33.7%, and for R-ECC joint it was 29.8%; for cross-shaped RC joints, K
Δ
was 43.2%, and for R-ECC joints it was 30.8%. Therefore, using ECC as the joint cement-based material can effectively restrain the stiffness loss of the joints. When the axial load ratio n was over 0.7 and 0.9 for RC and R-ECC separately, the joints were prone to brittle failure due to the strong constraints in the joint core areas. Therefore, it was suggested that the axial load ratio n of RC joints should be less than 0.7 under the second anti-seismic grade, which was a little bit lower than the suggested value 0.75 in GB50011-2010 (2010). For R-ECC joints, the suggested value for axial load ratio n should be less than 0.9 under the second anti-seismic grade. Without affecting the seismic performance of the structure the axial load ratio n of RC/R-ECC joints should be controlled at about 0.5 as far as possible, where the ductility, energy dissipation capacity, stiffness degradation, and bearing capacity of the joints performs better than those under the axial load ratio n is 0.3, 0.7, and 0.9.
Footnotes
Acknowledgements
The authors gratefully acknowledge the funding supports of the National Natural Science Foundation of China (Grant No. 51968035), Yunnan Provincial Education Department Science Research Fund (Grant No.2019J0043), and Yunnan Province Key Research and Development Plan (Grant No. 202003AC100001).
Declaration of conflicting interests
The author(s) declared no potential conflicts of interest with respect to the research, authorship, and/or publication of this article.
Funding
The author(s) disclosed receipt of the following financial support for the research, authorship, and/or publication of this article: This study was supported by the National Natural Science Foundation of China (Grant No. 51968035), Yunnan Provincial Education Department Science Research Fund (Grand No. 2019J0043), and Yunnan Province Key Research and Development Plan (Grant No. 202003AC100001).
Availability of data and material
The data used to support the findings of this study are available from the corresponding author upon request.