
Abstract
In this study, a series of experiments were conducted to investigate the effects of the hook-shaped steel fiber (SF) and nanosilica (NS) on the flexural properties of the rubber concrete (RC), and the modification mechanisms of the NS on the flexural properties of steel fiber-and-nanosilica reinforced rubber concrete (SFNS-RC) were also revealed by using the X-ray diffraction (XRD) and scanning electron microscope. Based on the RC specimen with a rubber content of 5%, the experimental variables included the SF volume fractions (0%, 0.5%, 1.0%, and 1.5%) and NS replacement ratios (0%, 1%, and 2%). The results indicated that the NS could improve the microstructure of the RC, the peaks of Ca(OH)2, C3S, and C2S steadily reduced as the NS replacement ratio increased, respectively, and the microstructure of SFNS-RC became more compact and uniform because the NS could produce pozzolanic activity to fill the pores of the matrix and strengthen the bond behavior between the SF and matrix. In addition, the RC specimens containing the SF and NS displayed the excellent flexural behaviors, including the ductility and energy dissipation characteristics. Finally, the empirical formulae for predicting the first-peak flexural strength and peak flexural strength of SFNS-RC were proposed through the analysis of experimental data, respectively.
Keywords
Highlights
• The effects of the SF and NS on the flexural properties of RC were investigated. • Combined effect of the SF and NS on flexural behavior of SFNS-RC was studied. • The modification mechanisms of the NS on the flexural properties of SFNS-RC were revealed. • The empirical formulae for first-peak flexural strength and peak flexural strength of SFNS-RC were proposed, respectively.
Introduction
A survey report showed that large quantities of scrap vehicle tires were generated every year, and approximately one-third of them were disposed to be burned, landfilled, stockpiled, and illegally dumped, which caused a serious threat to environment (Siddika et al., 2019). In recent years, it has been widely received for applying the recycling waste rubber derived from scrap vehicle tires into concrete to produce rubber concrete (RC), which could improve the certain properties of the concrete, such as the ductility, toughness, impact resistance, fatigue strength, energy absorption, and energy consumption (Ismail et al., 2017a).
A brief review of the current studies about RC showed that the rubber could obviously reduce the brittleness of concrete, and enhance toughness and energy absorption of the concrete (Abdelaleem et al., 2018; Ozbay et al., 2011; Zheng et al., 2008). Meanwhile, the rubber particles with high elasticity could also increase the impact resistance and energy dissipation capacity of concrete (Abdelaleem et al., 2018; Ismail et al., 2016a). In addition, the rubber aggregate could significantly contribute to the development of semi-lightweight and lightweight concrete due to the lower density compared to a conventional aggregate. Currently, the usage of waste tire rubber in civil engineering was mostly taken as an additive to Portland cement concrete, the modifiers to asphalt paving mixtures, the lightweight fillers, the crash barriers, the bumpers, and artificial reefs by using whole tires (Aslani, 2016). Therefore, the development of RC in civil engineering provided an effective method for recycling waste tire rubber.
It was found out that the compressive strength, elastic modulus, splitting tensile strength, and flexural strength of RC decreased as the rubber content increased. Antil et al. (2012) found that the compressive strengths of the concrete with a rubber volume fraction of 5%, 10%, 15%, and 20% were 11.1%, 23.5%, 31.9%, and 37.4% less than that of the concrete without rubber, respectively. Al-Tayeb et al. (2012) reported a decrease of 20%, 16.7%, and 22% in the compressive strength, splitting tensile strength, flexural strength, and elastic modulus of RC, respectively, when 20% of the fine aggregate was replaced by rubber particles. The reasons for strength loss could be summarized: (1) the hardness of the rubber particles was less than the surrounding cement paste. (2) Abundant cracks could be observed around the rubber particles. (3) A large number of rubber particles moved toward the top surface of concrete during the molding process (Ganjian et al., 2009; Sofi, 2017).
Adding steel fibers (SFs) to offset the negative effects caused by the incorporation of rubber particles has been tried. It was observed that the SFs could play a key role in many aspects to enhance the behaviors of RC. First, the SF could significantly resist to the cracking behavior, improve the tensile strength, and enhance the durability of RC (Nguyen et al., 2010; Turatsinze et al., 2006). Second, the SF could greatly increase the impact resistance of RC and compensate for the reduction caused by the rubber in splitting tensile strength and flexural strength (Ismail et al., 2017b). Third, the SF could work well with crushed rubber, which made RC exhibit wonderful compression toughness and energy dissipation capacity (Noaman et al., 2016). Fourthly, the hybrid reinforcement of SFs and polypropylene fibers could make the peak load and flexural toughness of RC more remarkable. (Park et al., 2014). Moreover, the SF also enabled RC to develop sufficient flexural strength, which could enhance the strain capacity and post-peak energy absorption behavior (Abaza et al., 2016; Alsaif et al., 2018).
Although the splitting tensile strength and flexural strength of RC could be enhanced by the incorporation of SFs, the poor bond behavior between the hardened cement matrix and rubber particles would reduce the overall mechanical properties of RC. Some scholars had proposed that the micro interface between rubber particles and cement hydrates could been improved by replacing the part of cement with the pozzolanic materials, such as metakaolin, fly ash, and silica fume, which could overcome the inherent microscopic defects of RC (Ozbay et al., 2011; Onuaguluchi, 2015; Gupta et al., 2016; Ismail et al., 2016b). Mohammed et al. (2016) found that the nanosilica (NS) could refine the size of the pores and densify the interfacial transition zone between the cement matrix and the aggregate, which would increase the compressive strength of RC. Similar phenomena were also reported by other scholars (Gao et al., 2020; Mohammed et al., 2018). However, almost no study had been conducted on the combined effect of the SF and NS on the properties of RC. In this study, the effects of the SF volume fraction and NS replacement ratio on the flexural properties of RC were investigated. The combined effects of SF and NS on the flexural behavior of RC were systematically analyzed, which provided a basis for the application of RC with the SF and NS.
Experimental program
Materials
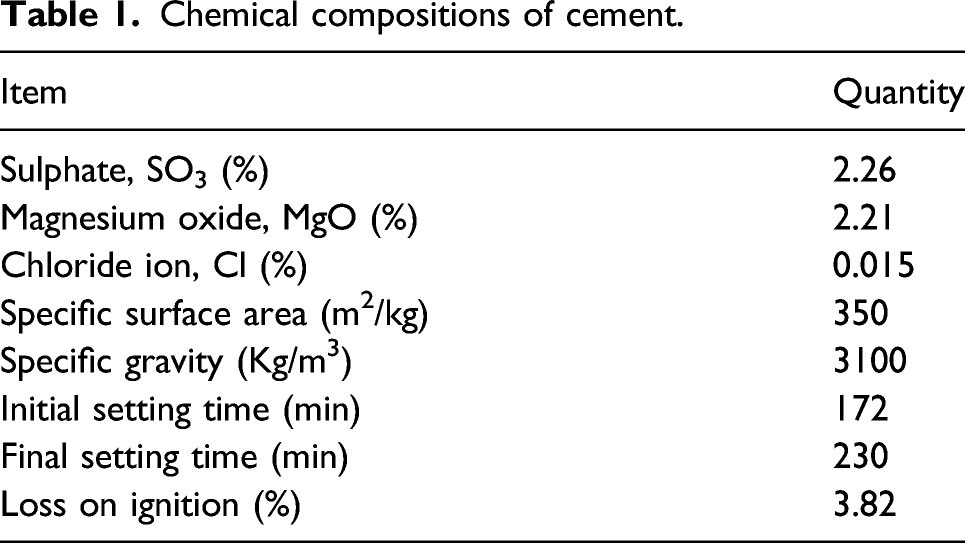
Chemical compositions of cement.
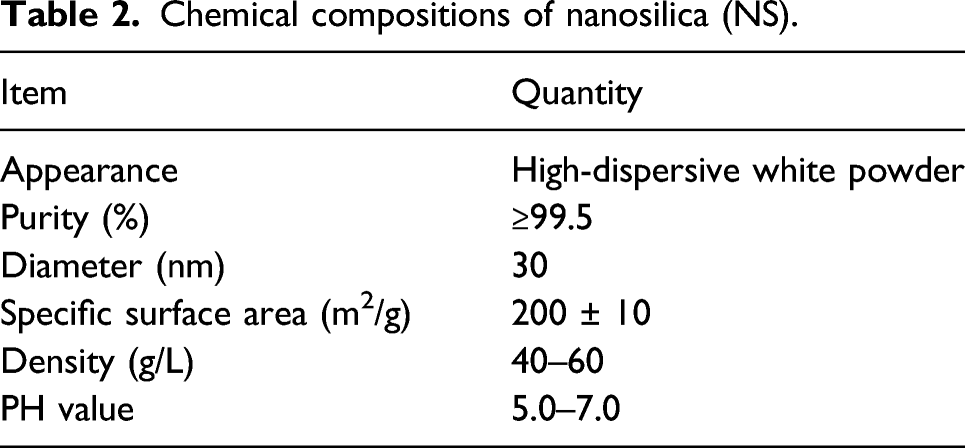
Chemical compositions of nanosilica (NS).

X-ray diffraction pattern of nanosilica.
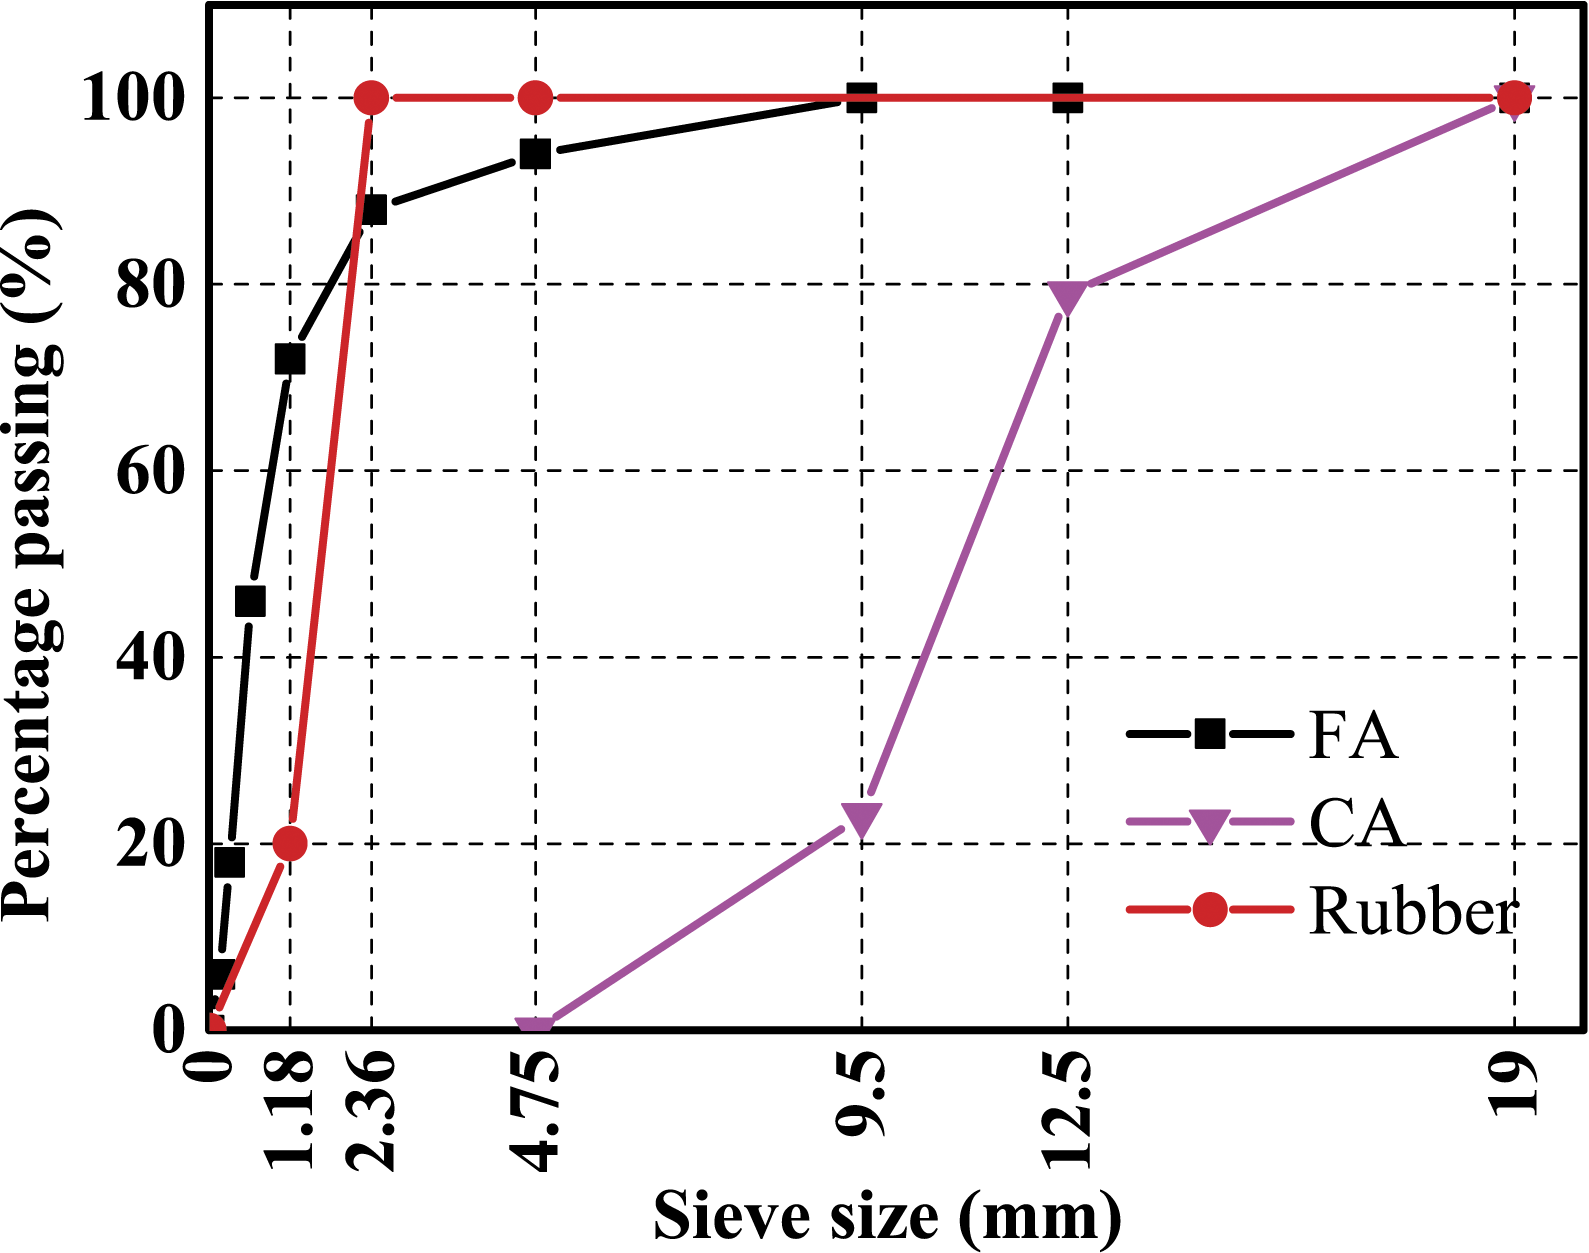
Size grading for fine aggregate, coarse aggregate, and rubber aggregate.
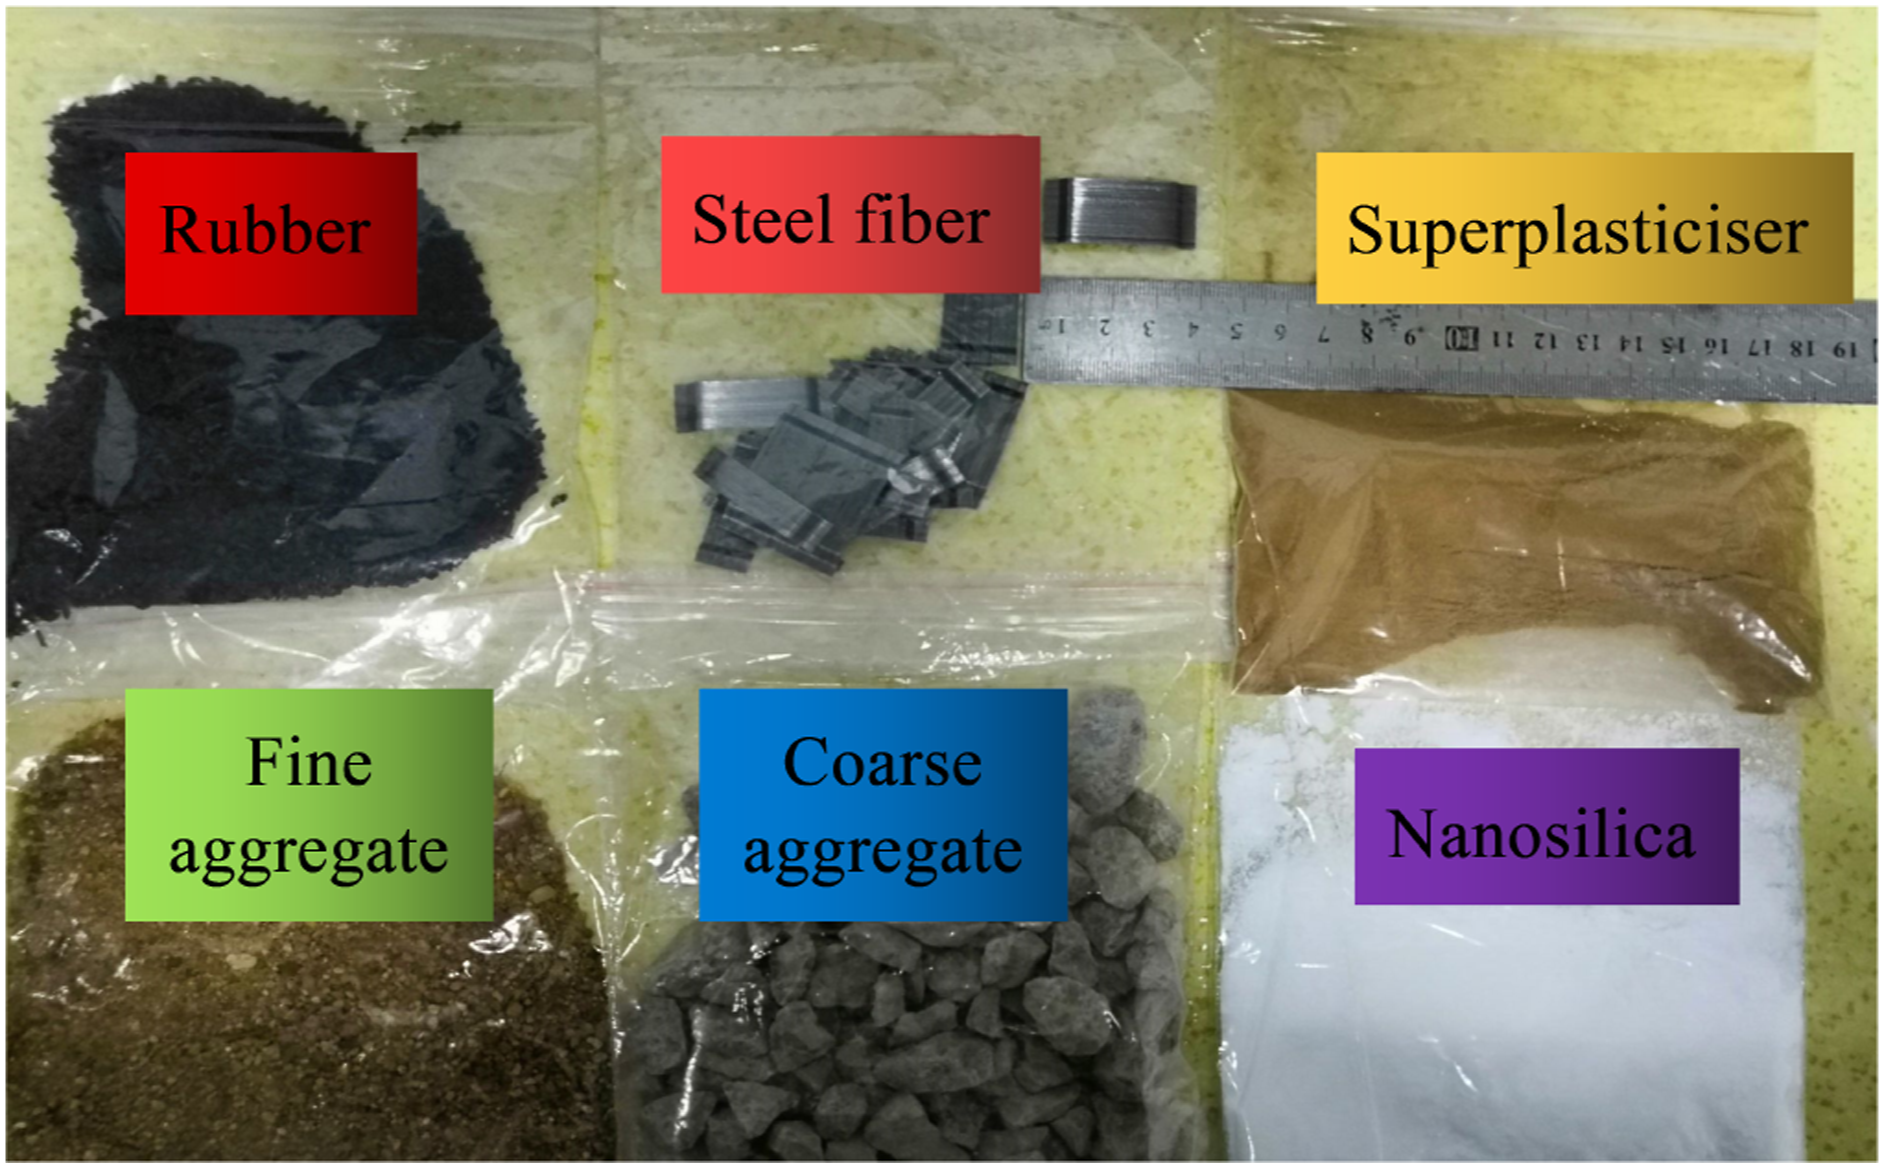
Materials.
Concrete mixture proportions
Mixture proportions of steel fiber-and-nanosilica reinforced rubber concrete (SFNS-RC) (unit: kg/m3).
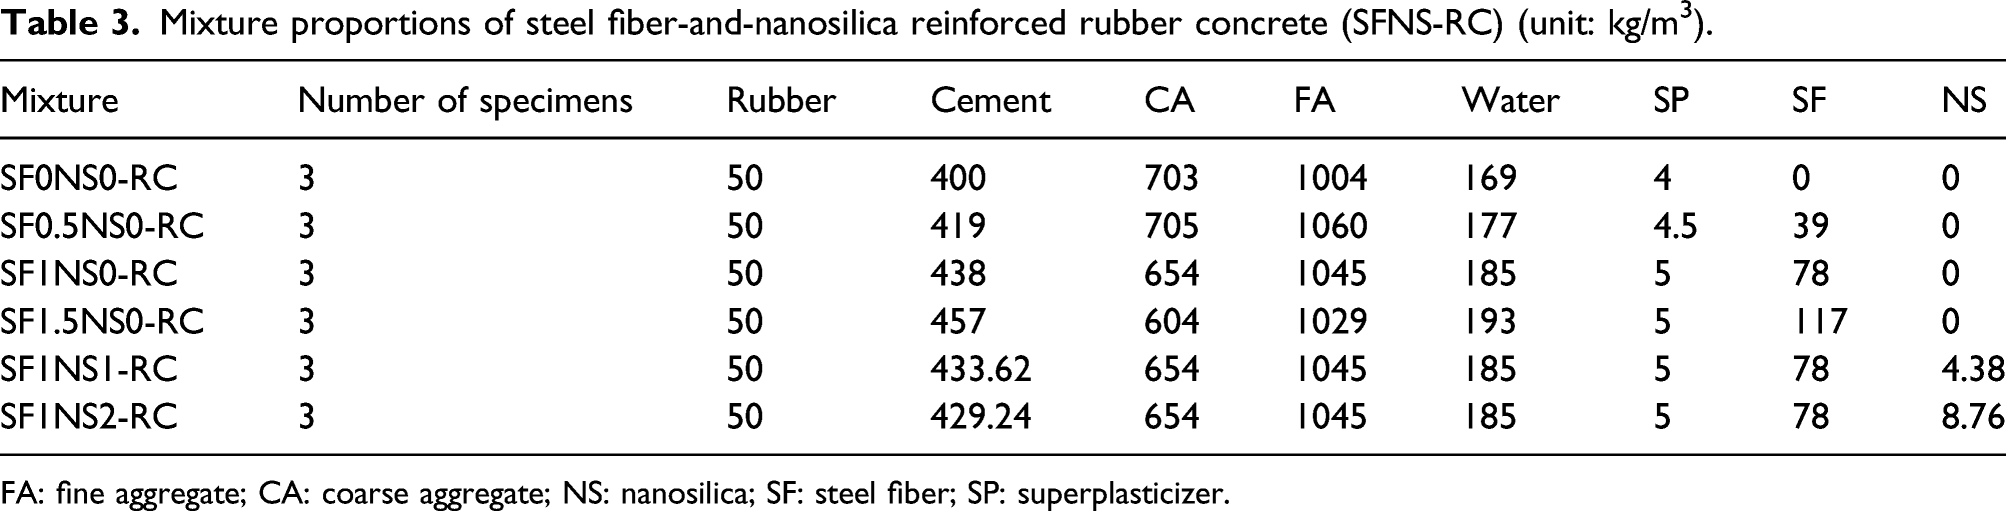
FA: fine aggregate; CA: coarse aggregate; NS: nanosilica; SF: steel fiber; SP: superplasticizer.
The SFNS-RC mixtures were mixed through a shaft mixer. First, all aggregates and SFs were put together and mixed for 2 min. Then, the rubbers and cement were added and mixed for another 2 min. Finally, the water and SP were added to the mixture and mixed for another 2 min. Particularly, for the mixture proportion including NS, the NS was added to water in advance and stirred uniformly. All specimens were cured at the curing room with a temperature of 25°C ± 2°C and relative humidity of 95% RH for 28 days.
Test program
Flexural test
The prismatic specimens with a dimension of 100 mm × 100 mm × 400 mm were tested under flexure by using a 500 kN capacity servo controlled material testing system to obtain the flexural load-deflection curves of SFNS-RC, as shown in Figure 4. A total of 18 prismatic specimens were prepared in this study, in which three prismatic specimens for each group were employed to obtain an average value. In accordance with ASTM C1609/C1690M-19a (2019), all prismatic specimens were loaded with the displacement control at a rate of 0.1 mm/min. Two linear variable differential transformers (LVDTs) were attached at the mid-span on both sides of the specimen with the aid of a steel frame. According to the ASTM C1609/C1690M-19a (2019), the whole testing process terminated when the deflection reached L/150 mm. Specimen and test setup.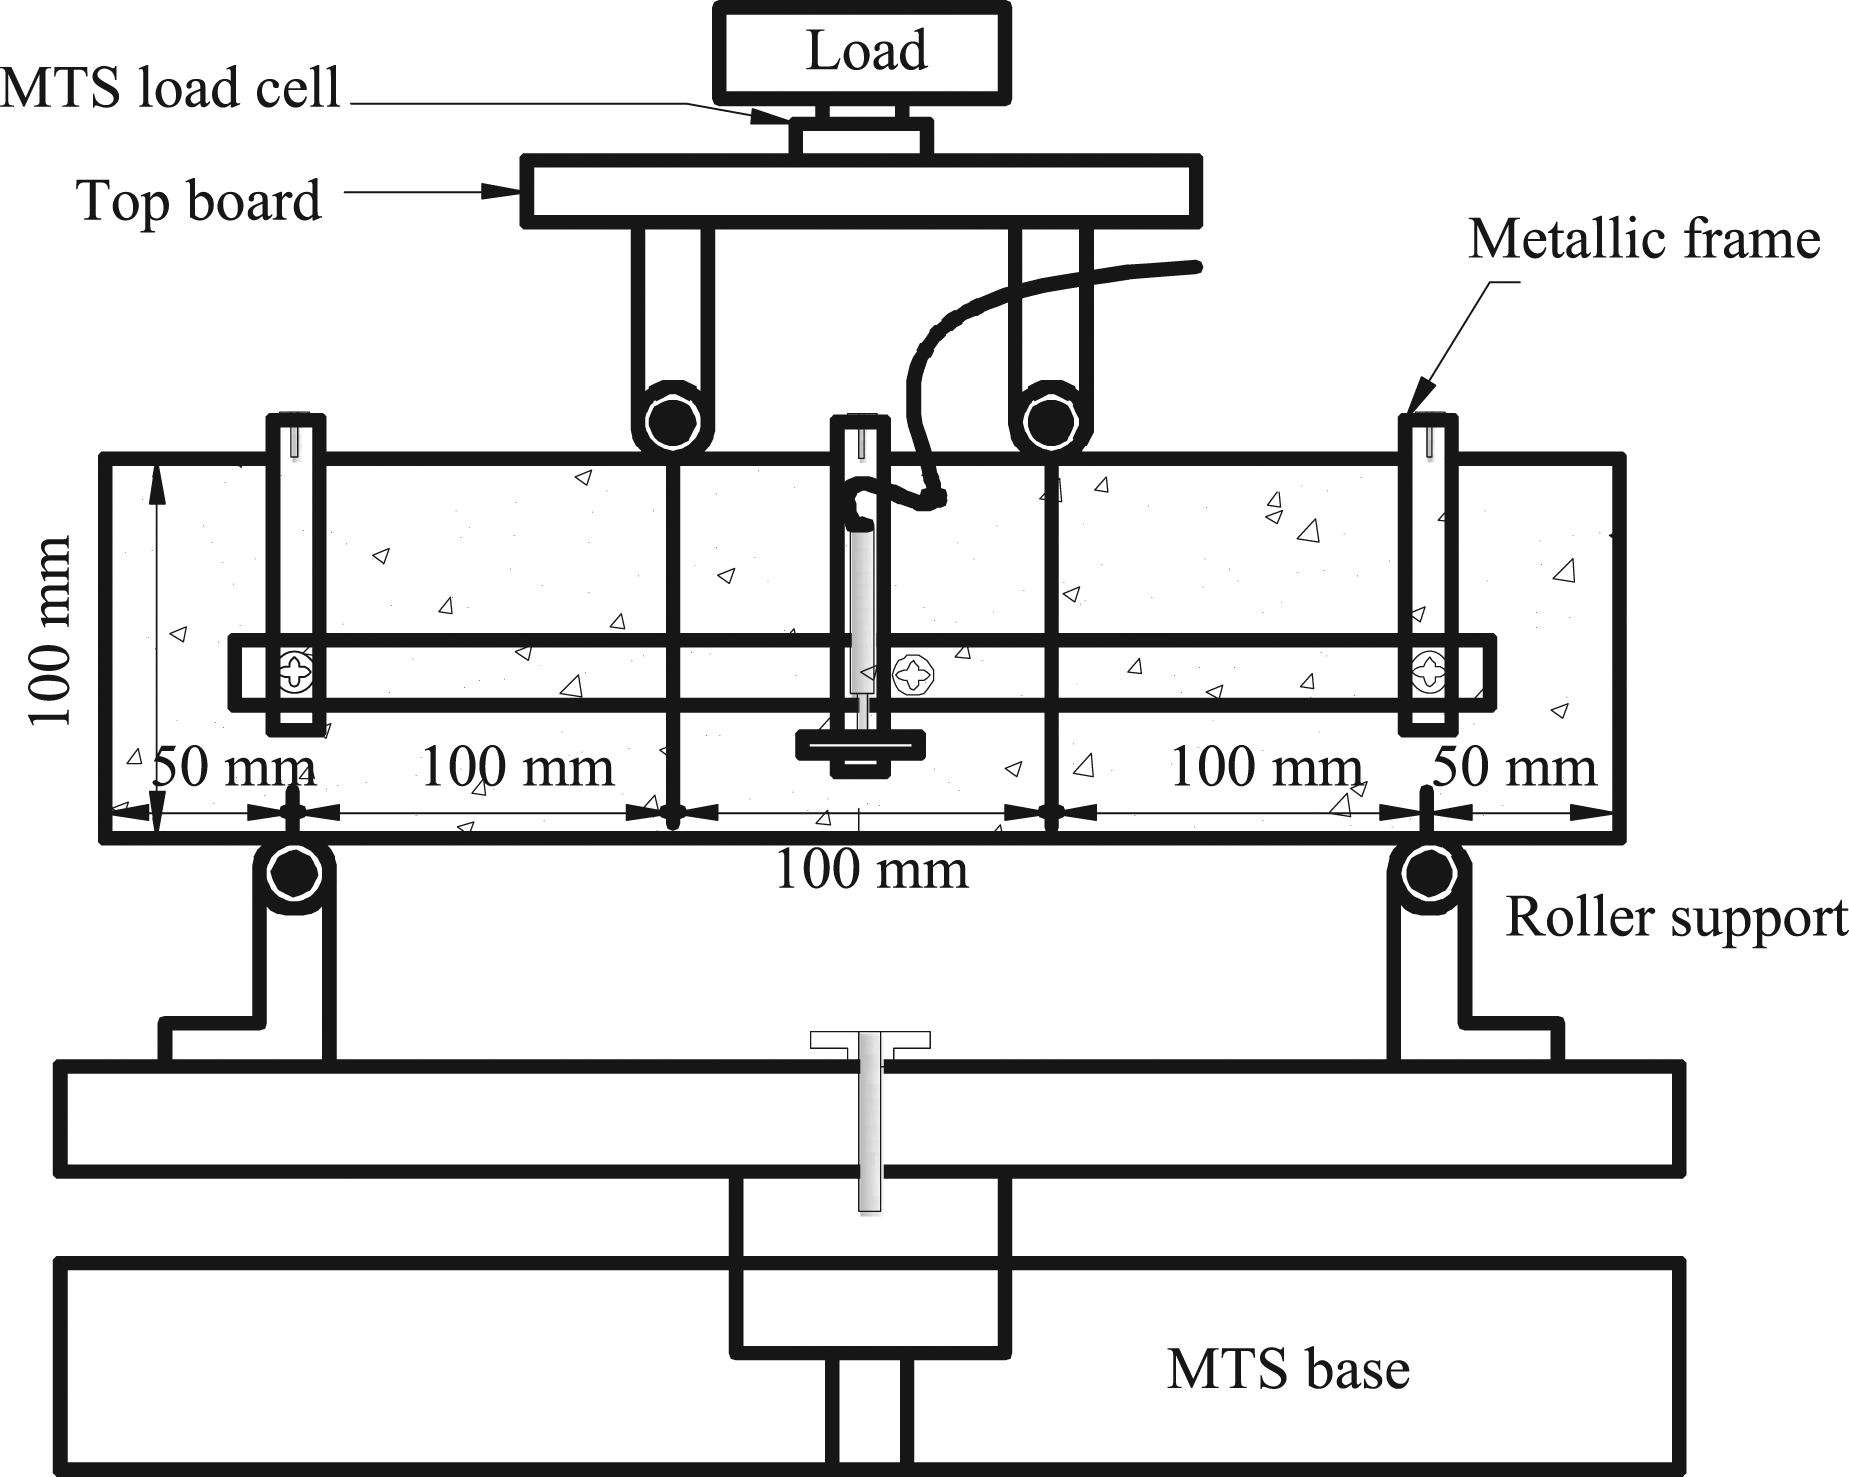
Microstructure test
In the microstructure test, the fragments of SFNS-RC obtained from the specimens in the flexural test were coated with gold for the scanning electron microscope (SEM) to reveal the evolution of flexural characteristics from the microstructure characteristics. The ZEISS EVO HD15 SEM was used for morphological investigations of the SFNS-RC matrix.
To investigate the formed phase composition of the SFNS-RC matrices, the X-ray diffraction (XRD) test was conducted for the three types of the SFNS-RC mixtures with different NS replacement ratios, and the powder samples obtained from the fragments of the SFNS-RC specimens were tested to evaluate exactly the phase composition of the matrix paste where the chemical reactions of cementitious materials occurred. The XRD measurements were performed in the scanning range of 2θ deg. From 5° to 80°, which had a step size of 0.1°/sec and a scanning speed of 0.007°/sec.
Results and discussion
Flexural failure mode
Effects of steel fiber on the flexural failure mode
Figure 5(a) shows the effects of the SF volume fraction on the flexural failure modes of SFNS-RC. For the specimen without SF and NS (SF0NS0-RC), the catastrophic brittle failure took place with one crack after concrete cracking. For the specimens with SFs, in the initial loading stage, the concrete and SFs resist the load by their integrated action. With the increase of the load, the concrete could not bear the load due to the cracks, and the SF began to debond along with pulling out. Therefore, significant ductile failure characteristics could be observed, and the width and depth of the main crack gradually decreased as the SF volume fraction increased, which indicated that the SF could improve the anti-cracking performance of SFNS-RC under the bending load. Furthermore, abundant tiny vertical cracks around the main crack could also be found, and the distance of cracks decreased as the SF volume fraction increased. Until the end of the test, all specimens with SFs remained intact. For all specimen, the failure occurred in the moment constant zone near the middle of the specimens, where no SFs breakage failure were observed. Similar phenomena could be found in related literature (Park et al., 2014). Flexural failure modes of steel fiber-and-nanosilica reinforced rubber concrete with different (a) steel fiber volume fractions and (b) nanosilica replacement ratios.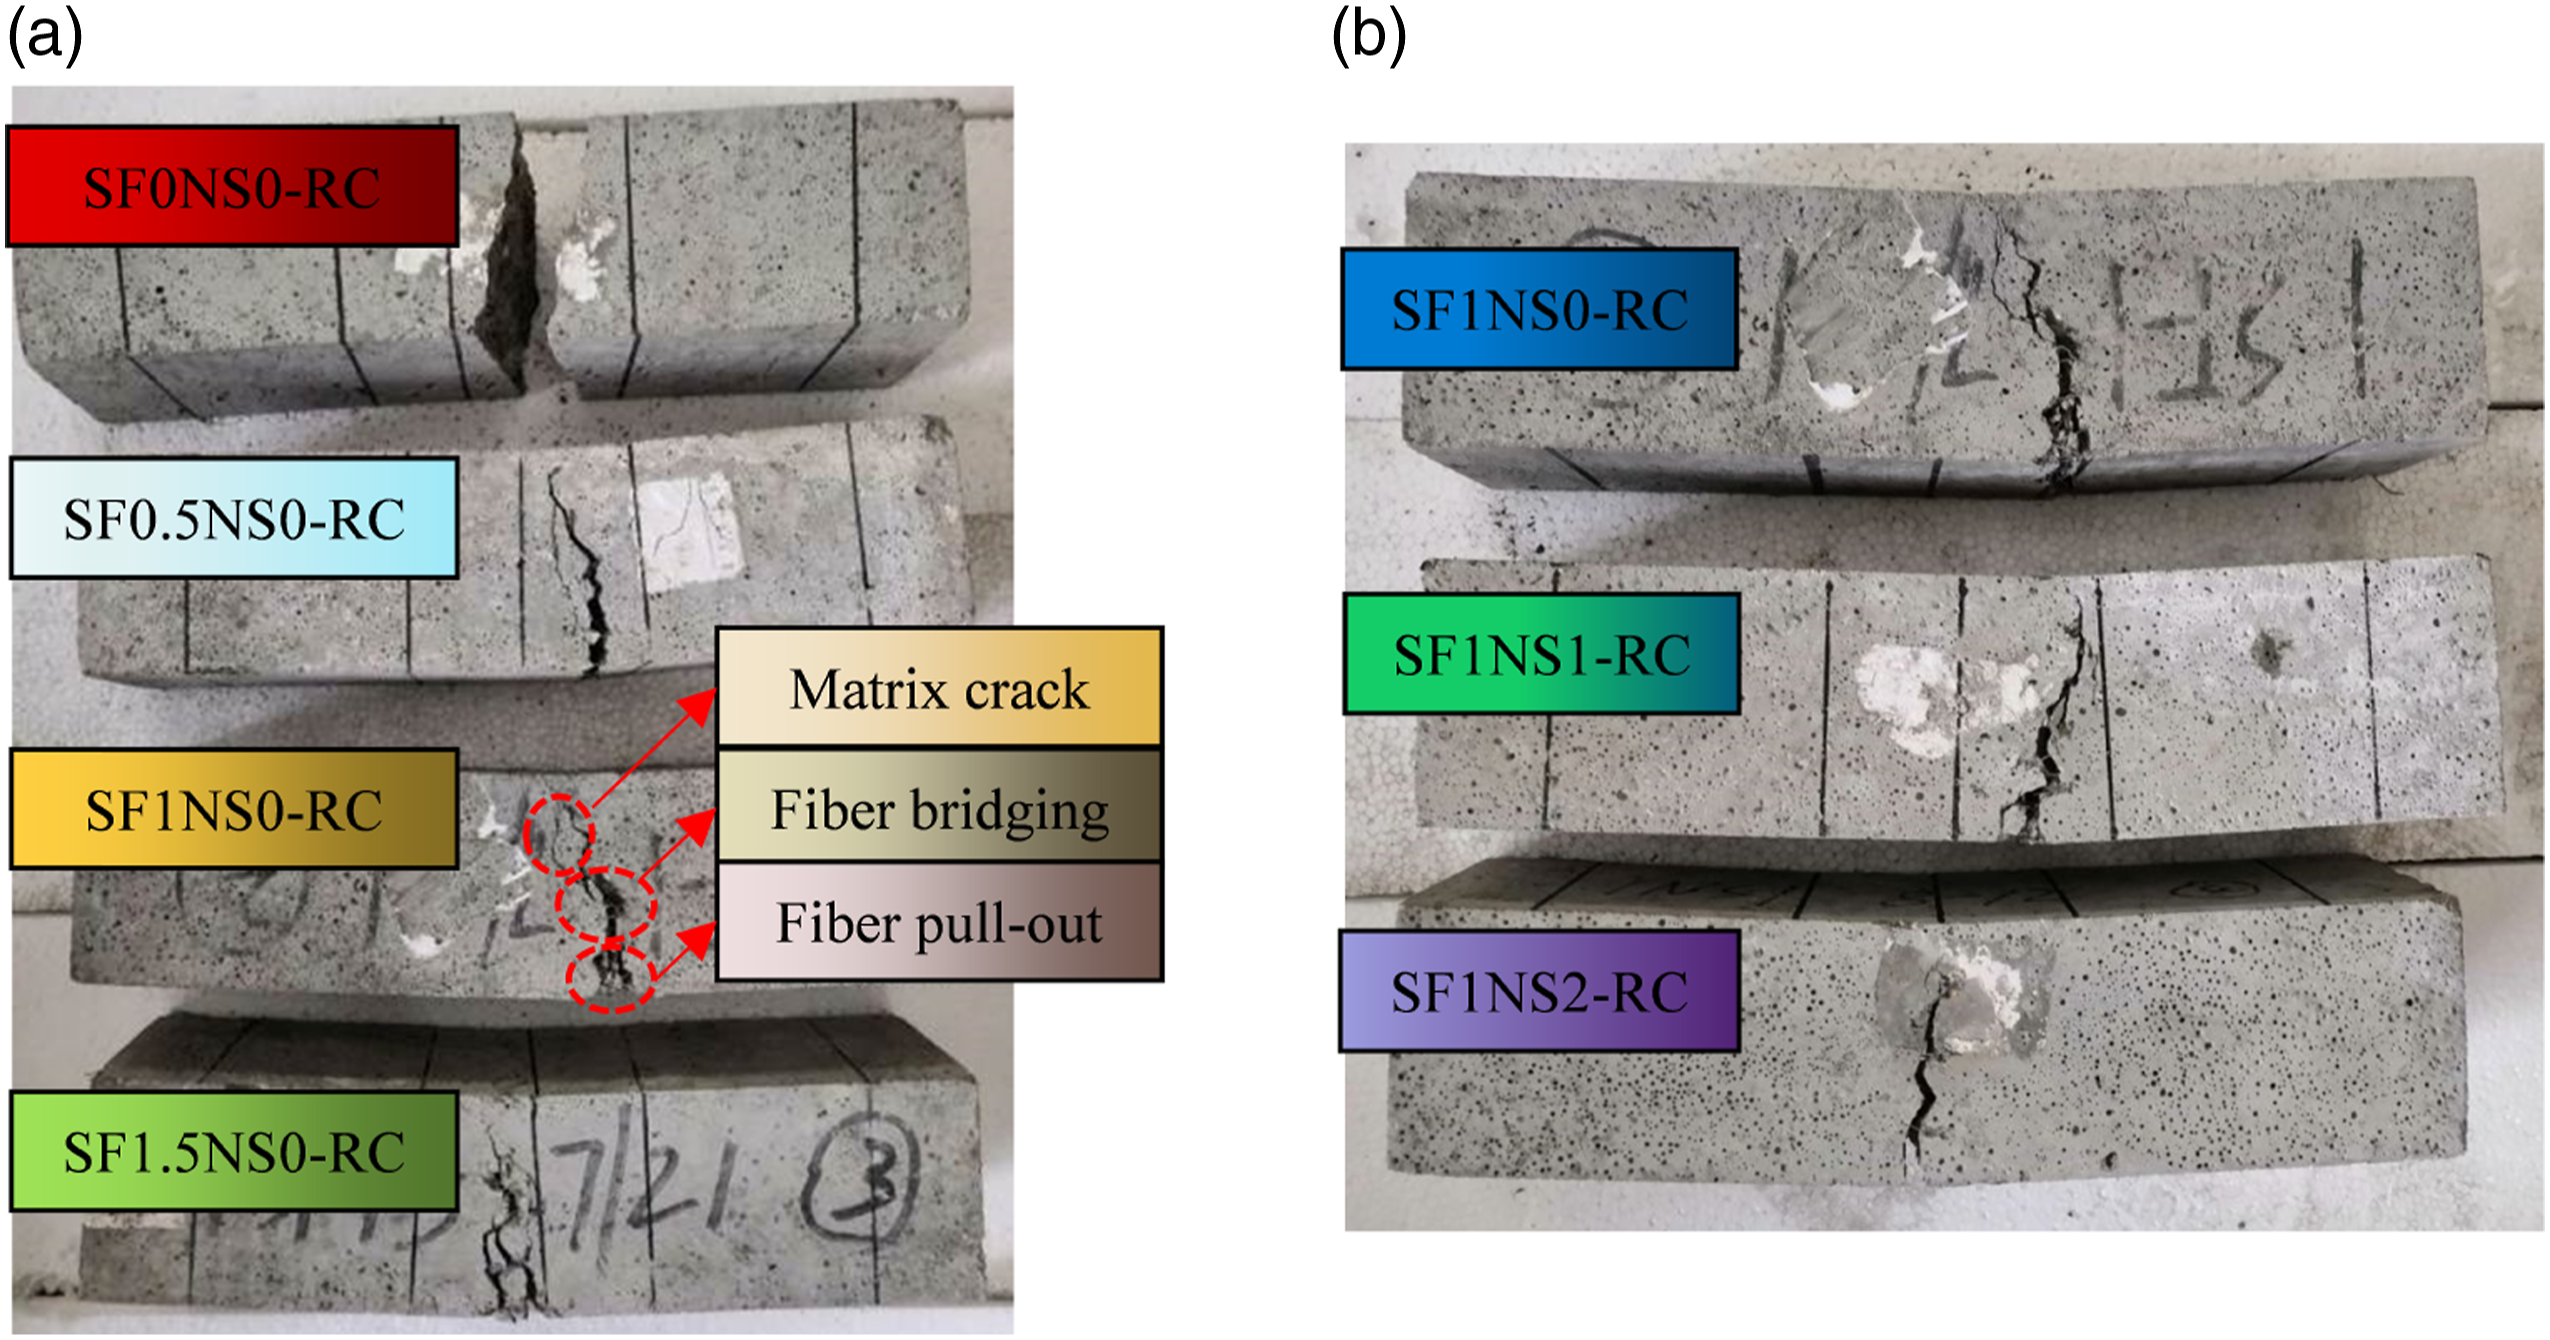
Effects of nanosilica on the flexural failure mode
Figure 5(b) shows the effects of the NS replacement ratio on the flexural failure modes of SFNS-RC specimens with SF volume fraction of 1%. The width of the main crack and the degree of spalling of the cement mortar gradually decreased as the NS replacement ratio increased. Particularly, the small matrix cracks were not observed on the specimen surface when the NS replacement ratio was 2%. The main reason might be that more C-S-H gel was produced, and Ca(OH)2 was consumed by NS, which could densify the microstructure of concrete and improve the bond behavior between the SFs and the matrix during the SFs pulling out process, as shown in Figures 16 and 17. This indicated that positive synergy between the SF and NS could enhance the cracking resistance of SFNS-RC.
Load-deflection curves
Effects of steel fiber on the load-deflection curve
Figure 6(a) shows the effects of the SF volume fraction on the load-deflection curve of SFNS-RC. For the specimen without SF and NS (SF0NS0-RC), the load dropped suddenly with increasing deflection after the peak load was reached, which indicated that the SF0NS0-RC specimen exhibited significant brittleness. For the specimens with SFs, the ductility and excellent energy dissipation characteristics could be obviously observed, and the load-deflection curve could be roughly divided into three stages. In the elastic stage (OA), the load increased linearly as the deflection increased. Due to the small deformation in this stage, the SFs in the concrete could not make a significant contribution to bend resistance. In the elastic-plastic stage (AB), the load increased nonlinearly with increasing deflection until the first-peak load was reached at the deformation of approximately 0.04, and the first-peak load increased as the SF volume fraction increased. In the softening stage (BC), for the specimens with a SF volume fraction of less than 1%, the load decreased with increasing deflection until a certain load value was reached. However, for the specimens with a SF volume fraction of 1.5%, the load showed a process of slowly increasing (BD) and then decreasing (DE) when the curve passed the first-peak load, the similar result could be found in previous research (Fu et al., 2019). The main reason was that the curve had a process of deflection-hardening due to the reinforcement of the SFs (Zhang et al., 2017). Thus, it was concluded that the majority of the bend strength was contributed by the SFs in the SFNS-RC. Load-deflection curve of steel fiber-and-nanosilica reinforced rubber concrete with different (a) steel fibers volume fractions and (b) nanosilica replacement ratios.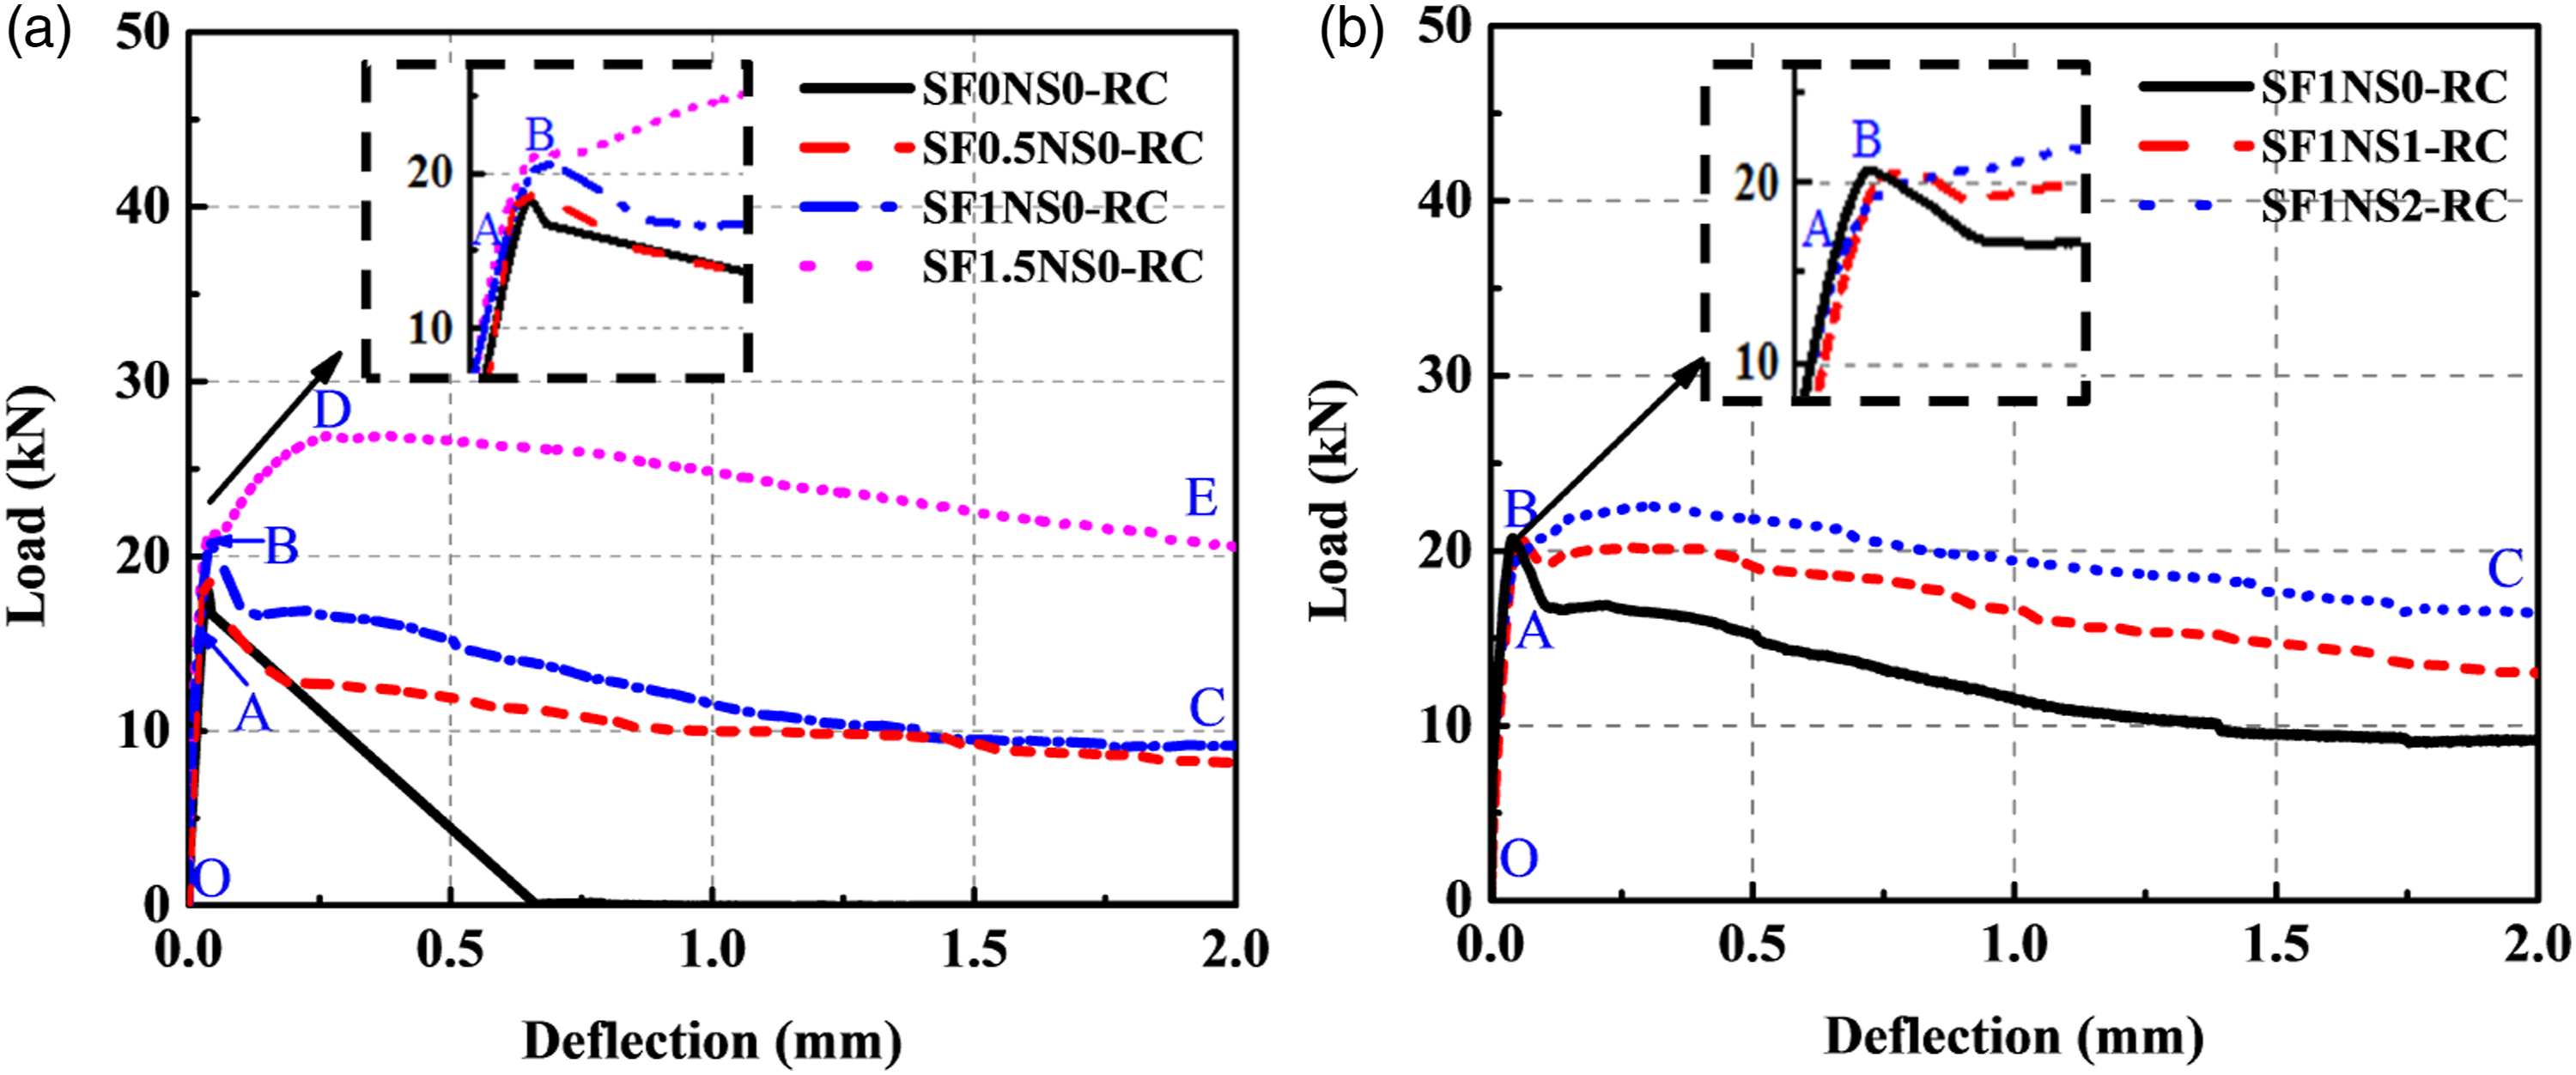
Effects of nanosilica on the load-deflection curve
Figure 6(b) shows the effects of the NS replacement ratio on the load-deflection curves of SFNS-RC specimens with a SF volume fraction of 1%. The load-deflection curves of SFNS-RC consisted of three characteristic stages, including the linear growth portion (OA), nonlinear growth portion (AB) and descending portion (BC). The ascending and descending branches of the curves were similar for all specimens. Moreover, all load-deflection curves displayed a double peak response and straining-softening behaviors nearly parallel. Particularly, for the specimens with NS replacement ratio of 2%, the second peak load on the curves was greater than the first-peak load. The main reason could be that the ITZ between the cement matrix and SFs was strengthened and densified due to the increasing pozzolanic reaction by NS (Mukharjee et al., 2014), as shown in Figures 16 and 17, which further demonstrated that the NS improved the bond behavior between the SFs and the matrix.
Indexes of the flexural behavior
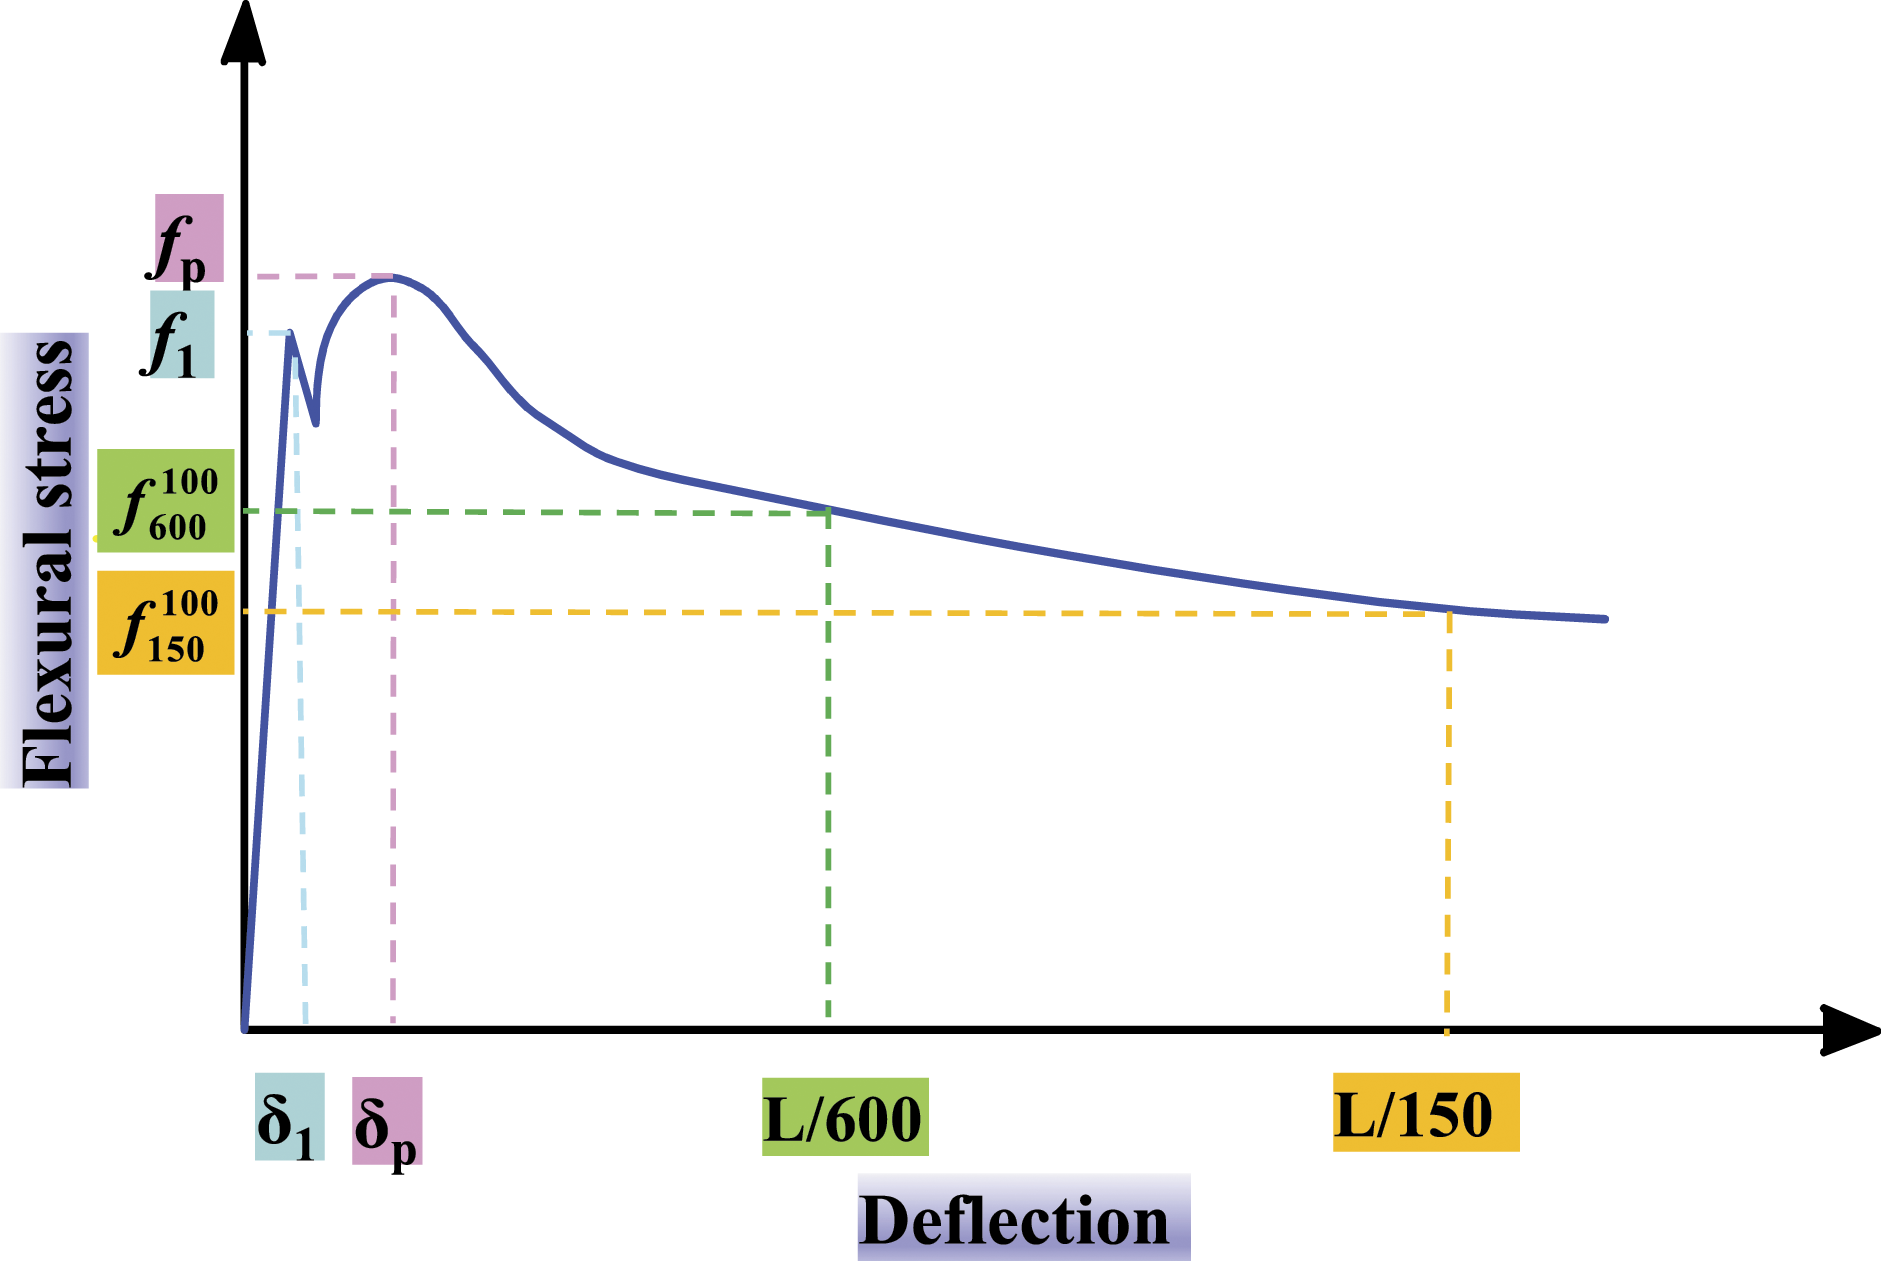
The flexural behavior of SFNS-RC could generally be classified as either deflection-softening or deflection-hardening (Kim et al., 2008). According to the ASTM C1609/C1690M-19a (2019) and CECS 13-2009 (2009), as illustrated in Figure 7, several indexes on the load-deflection (flexural stress-deflection) curve were used in this study to describe the flexural behaviors as follows. Definition of the indexes used in this study.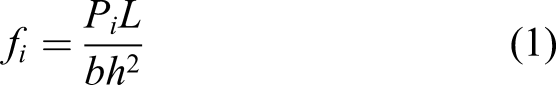

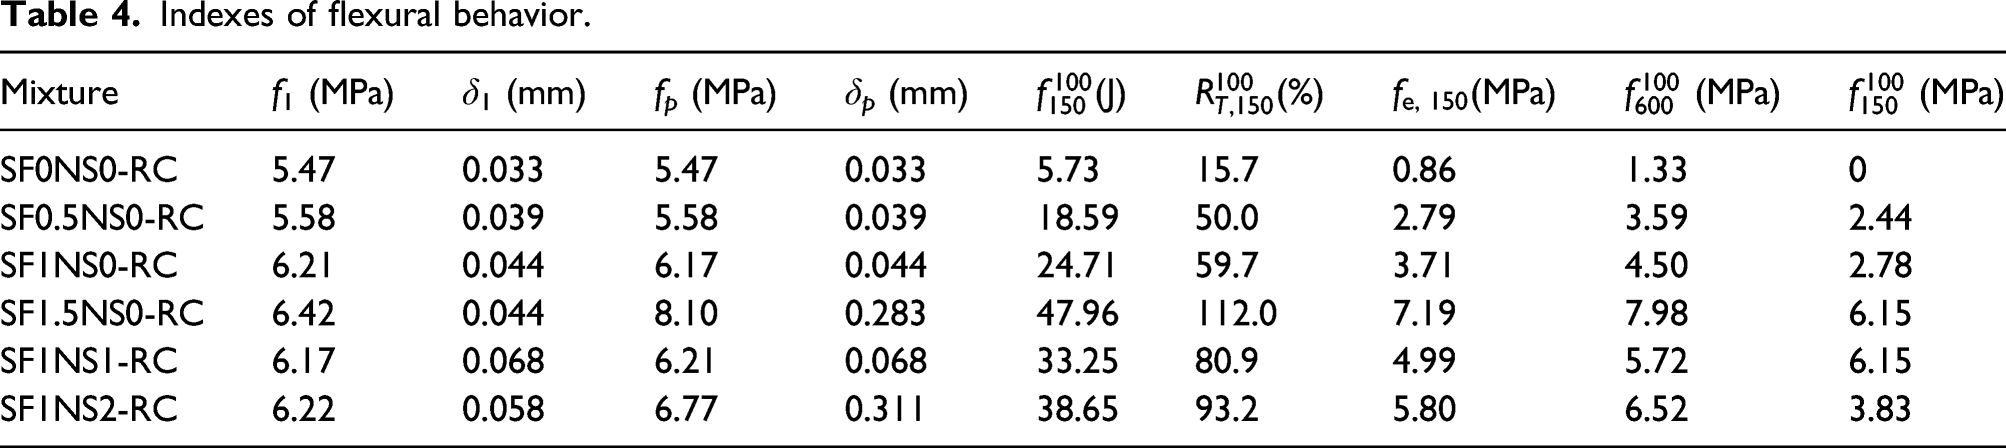
Indexes of flexural behavior.
First-peak flexural strength
Effects of steel fiber on the first-peak flexural strength
In this study, the first-peak flexural strength of SFNS-RC specimens increased from 5.47 MPa to 6.42 MPa with increasing SF volume fraction from 0% to 1.5%, as shown in Table 4. The main reason might be that the SF inhibited the production of the micro cracks. Fu et al. (2019) found that the first-peak flexural strength was influenced by both rubber and SF. In order to analyze the effect of the SF on the first-peak flexural strength, abundant test data were collected from this paper and previous researchers (Abaza et al., 2016; Fu et al., 2019; Gao et al., 2018; Soulioti et al., 2009), as plotted in Figure 8(a). It could be observed that the first-peak flexural strength had a linear growth tendency as the SF volume fraction increased, and the relationship between first-peak flexural strength and SF volume fraction could be described as follows (Gao et al., 2018). Relationship between the first-peak flexural strength of steel fiber-and-nanosilica reinforced rubber concrete and (a) steel fibers volume fraction and (b) nanosilica replacement ratio.
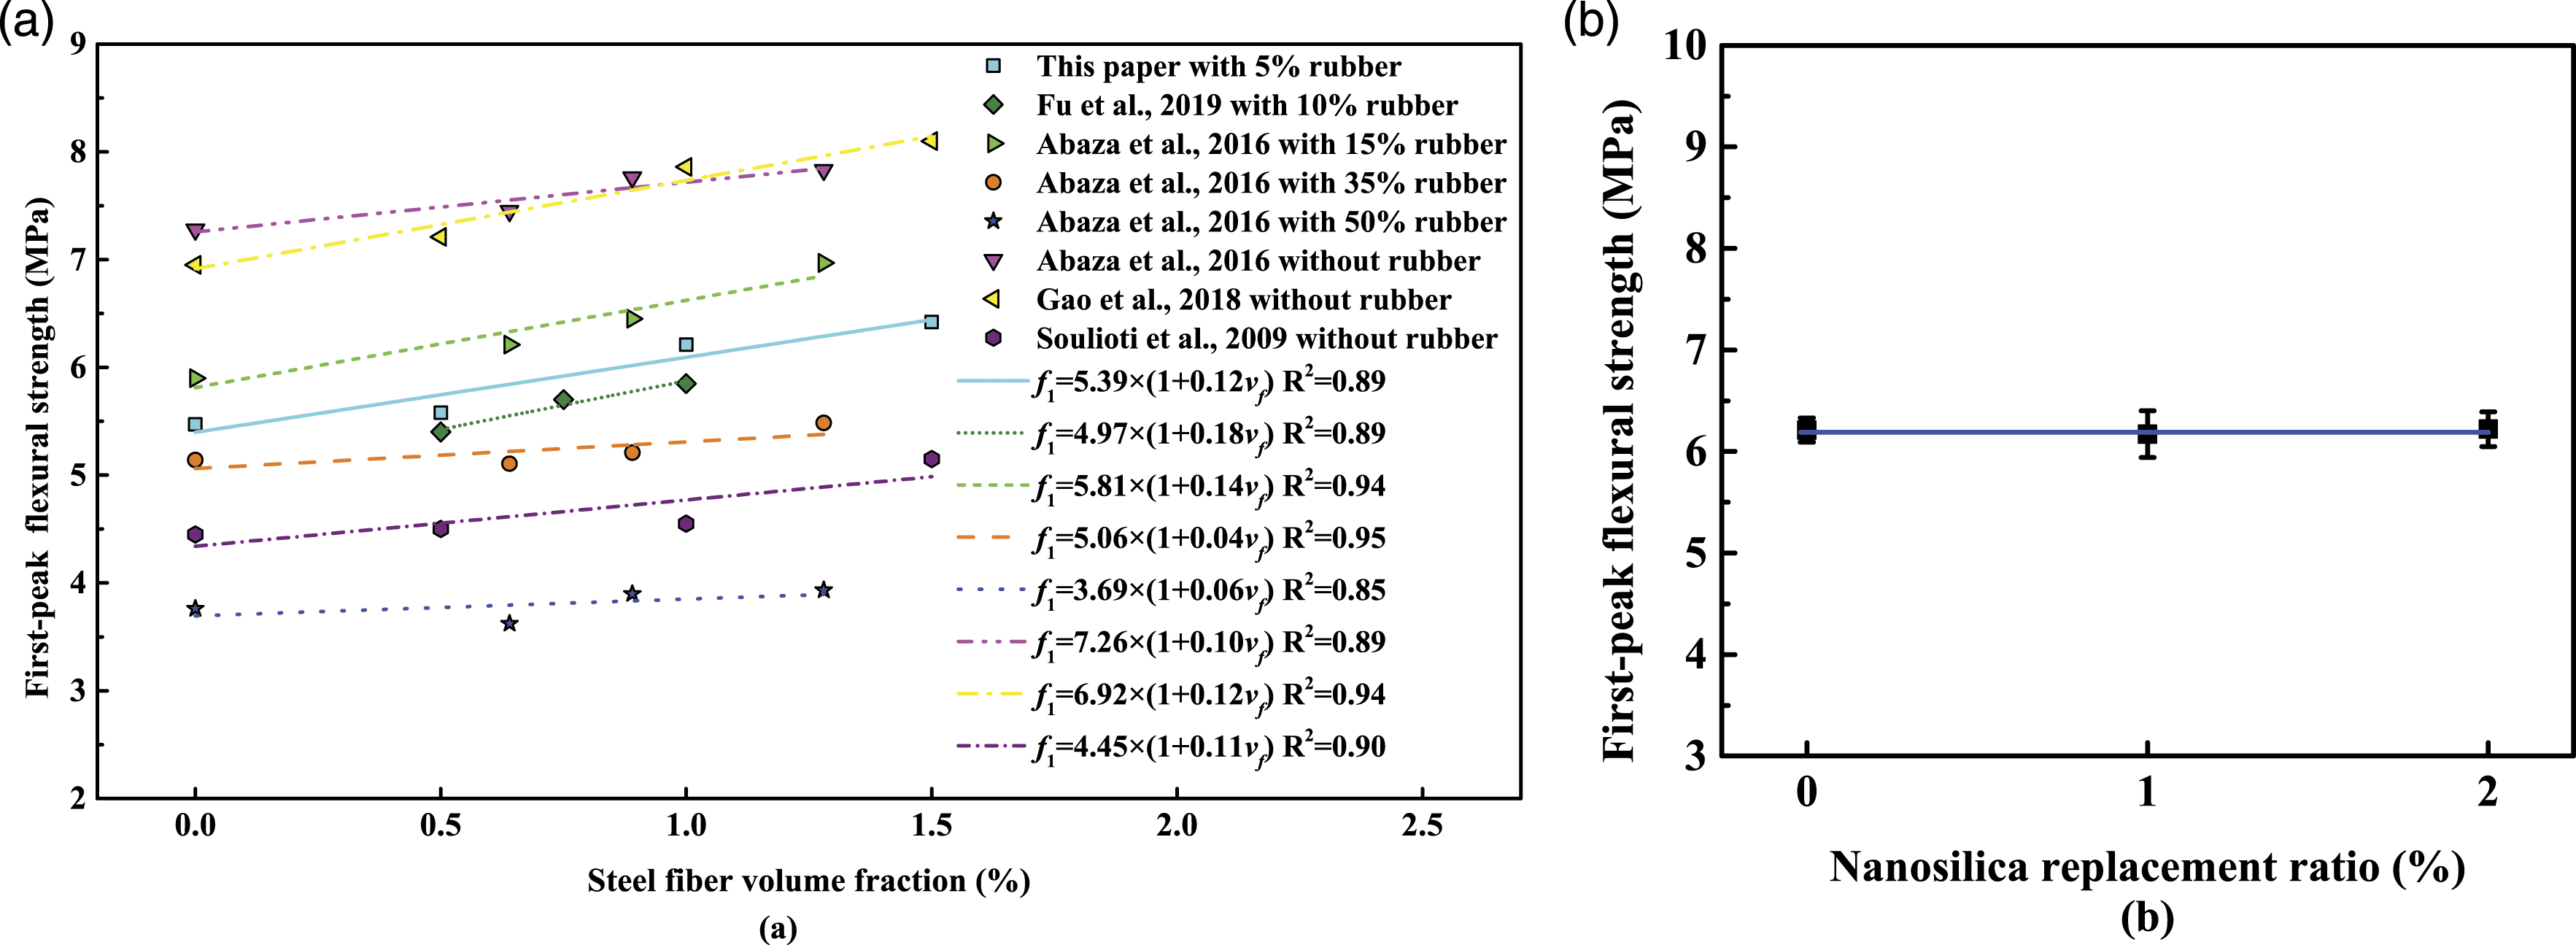
Where f1 is the first-peak flexural strength of the specimen with SFs; f0 is the first-peak flexural strength of the specimen without SFs; α is the characteristic coefficient; and v f is the SF volume fraction. α could be determined through fitting analysis, as shown in Figure 8(a). For the specimens with a rubber content of less than 15%, the value of α varied from 0.10 to 0.18, and the average value was 0.11. However, for the specimens with a rubber content of more than 15%, the value of α varied from 0.04 to 0.06, and the average value was 0.05. This indicated that the influence of SF volume fraction on the first-peak flexural strength gradually decreased as the rubber content increased. The main reason might be the poor bonding performance and weak ITZ between SF and concrete due to the nonpolarity and hydrophobicity of rubber particles (Fu et al., 2019).
Effects of nanosilica on the first-peak flexural strength
Figure 8(b) shows the relationship between the first-peak flexural strength and the NS replacement ratio in this study, this series of specimens had a SF volume fraction of 1%. It could be clearly found that the value of the first-peak flexural strength remained approximately 6.20 MPa, which meant that the NS had no influence on the first-peak flexural strength regardless of SFs content. Thus, the influence of the NS on the overall the first-peak flexural strength should have been minor compared to that of the SF volume fraction.
Figure 9 presents the comparison of the first-peak flexural strength calculated by equation (4) and one obtained by the test. The average value and variation coefficient of the ratio of experimental results to predicted results were 1.03 and 0.099, respectively. It indicates that the predicted results are in good agreement with the experimental ones. Comparison of the first-peak flexural strength between test and calculated.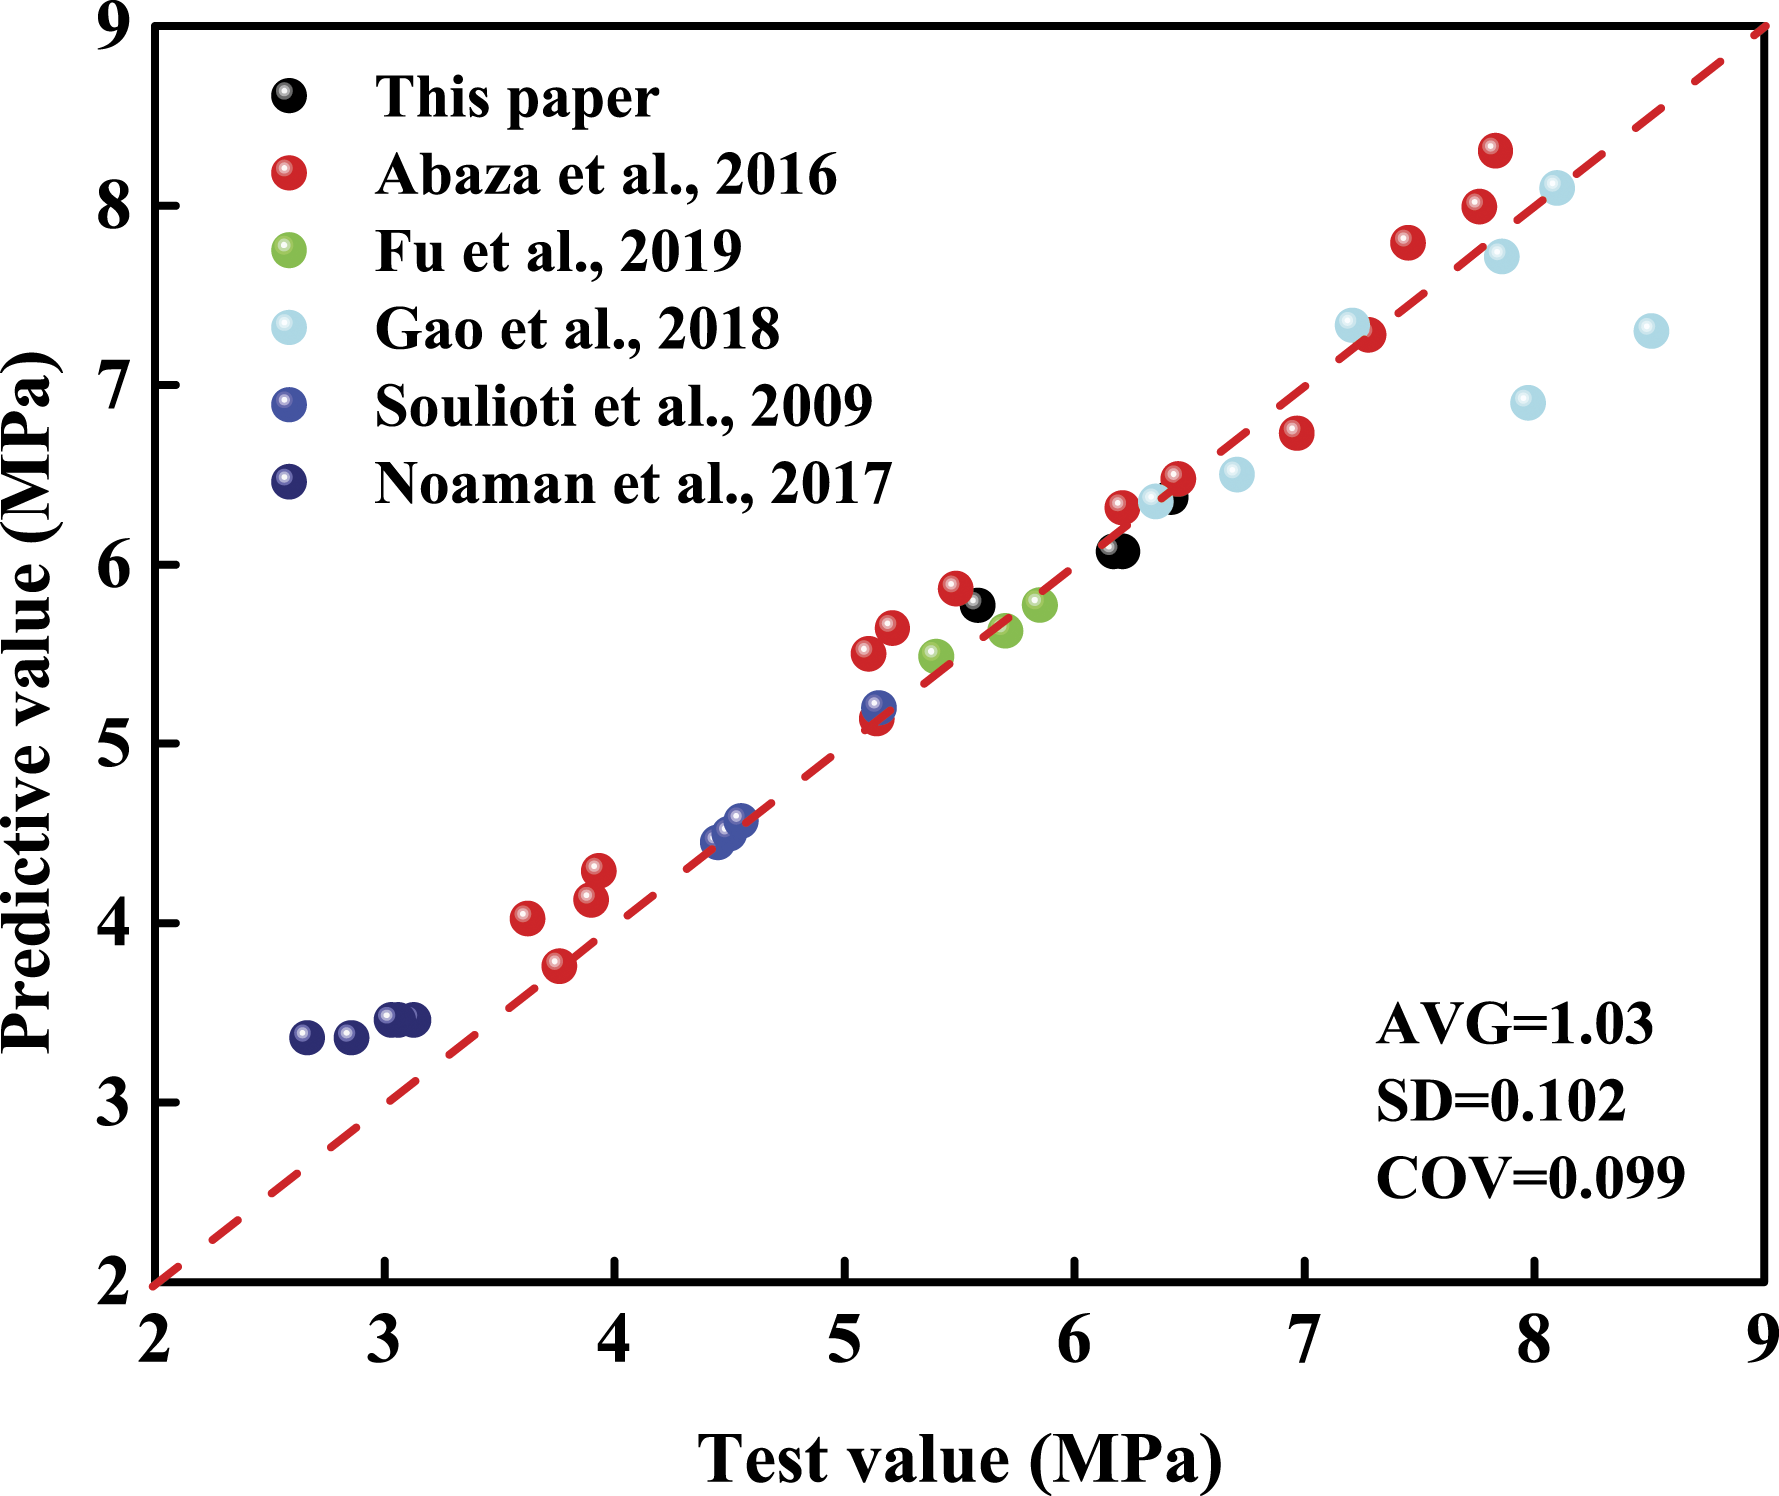
Peak flexural strength
Effects of steel fiber on the peak flexural strength
From the experimental results in Table 4, it could be observed that the peak flexural strengths of the specimens with a SF volume fraction of 0.5%, 1.0%, and 1.5% were 2.0%, 12.8%, and 48.1% more than that of the specimen without SFs, respectively. The reason for the increase in peak flexural strength might be owing to that the SFs continuously carried the load after matrix cracking (Li et al., 2018), as analyzed above. Noticeably, for the specimens with a SF volume fraction of 1.5%, the peak flexural strength has a prominent increase. The main reason was that the SF1.5NS0-RC curve had a process of deflection-hardening due to the reinforcement of the SFs.
To analyze the effect of SF on the peak flexural strength, abundant test data were collected from this paper and previous researchers (Duzgun et al., 2005; Fu et al., 2019; Gao et al., 2018; Guler et al., 2019; Ismail et al., 2017a; Li et al., 2017; Soulioti et al., 2009; Thomas et al., 2007; Yazc et al., 2007), which related to the hook-shaped steel fiber reinforced concrete, hook-shaped steel fiber reinforced self-compacting concrete, hook-shaped steel fiber reinforced lightweight concrete and hook-shaped steel fiber reinforced rubber concrete. Figure 10(a) presents the relationship of the normalized peak flexural strength and fiber reinforcing index Relationship between normalized peak flexural strength and (a) fiber reinforcing index and (b) nanosilica replacement ratio.

Effects of nanosilica on the peak flexural strength
From the experimental results in Table 4, it could be observed that the peak flexural strengths of the specimens with a NS replacement ratio of 1% and 2% were 0.6% and 9.7% more than that of the SF1NS0-RC specimen, respectively. The main reason could be that the ITZ between the cement matrix and SFs was strengthened and densified due to the increasing pozzolanic reaction by NS (Mukharjee et al., 2014), as shown in Figures 16 and 17.
Based on the test data from this paper and previous researchers (Adamu et al., 2017; Amin et al., 2015; Gao et al., 2018; Givi et al., 2011; Li et al., 2015; Mohamed et al., 2016; Mohammed et al., 2018; Mukharjee et al., 2014; Zhang et al., 2014), which related to the steel fiber-and-nanosilica reinforced concrete, nanosilica reinforced high strength concrete and nanosilica modified rubber concrete, the relationship of the normalized peak flexural strength and the NS replacement ratio was summarized in the Figure 10(b). It could be seen that the normalized flexural strength increased linearly as the NS replacement ratio increased. Therefore, the flexural strength of SFNS-RC could be calculated as follows.
Where v
n
is the NS replacement ratio; η is a characteristic coefficient, which could be determined through fitting analysis of experimental results, and was 0.037. Therefore, the flexural strength could be calculated as follows.
Figure 11 presents the comparison between the peak flexural strength calculated by equation (7) and one obtained by the test. The average value and variation coefficient of the ratio of experimental results to predicted results by equation (7) were 1.02 and 0.097, respectively. The predicted results were within 85%–115% of the experimental results, which indicated that equation (7) had an excellent accuracy to predict the flexural strength of SFNS-RC. Comparison of the peak flexural strength between test and calculated.
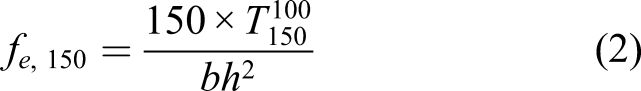
Equivalent and residual flexural strength
Figure 12(a) presents the effects of the SF volume fraction on the equivalent and residual flexural strength of SFNS-RC. The equivalent flexural strength Equivalent and residual flexural strength of steel fiber-and-nanosilica reinforced rubber concrete with different (a) SF volume fractions and (b) nanosilica replacement ratios. Relationship between equivalent and residual flexural strength.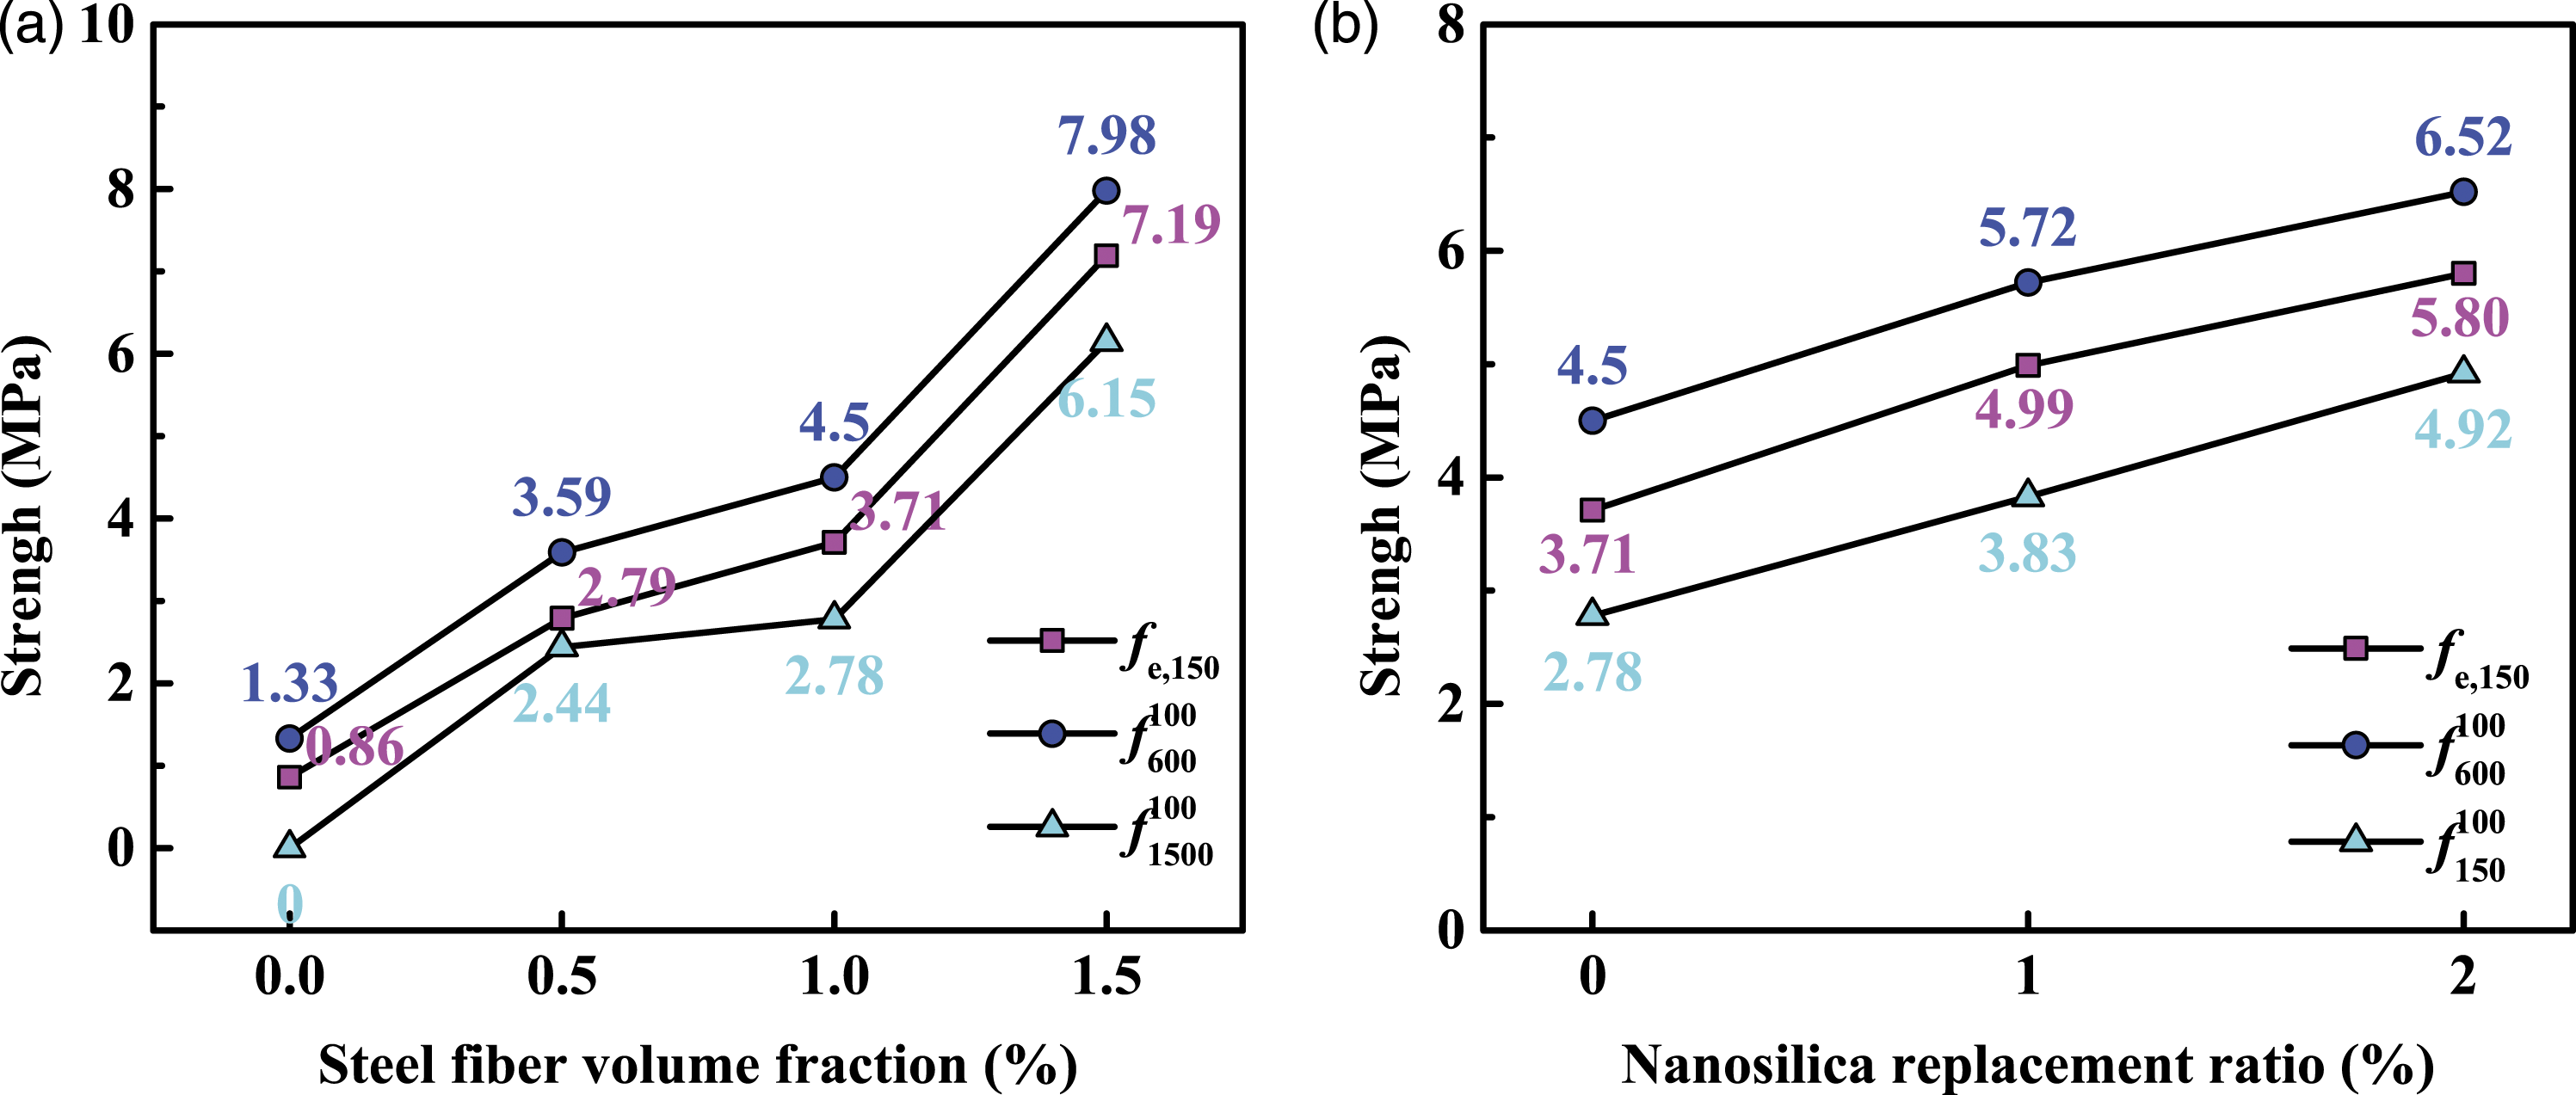

Flexural toughness
Figure 14(a) shows the effects of the SF volume fraction on the flexural toughness and equivalent flexural strength ratio of SFNS-RC. With increasing SF volume fraction from 0% to 0.5%, 1.0%, and 1.5%, the Flexural toughness of steel fiber-and-nanosilica reinforced rubber concrete with different (a) SF volume fractions and (b) NS replacement ratios.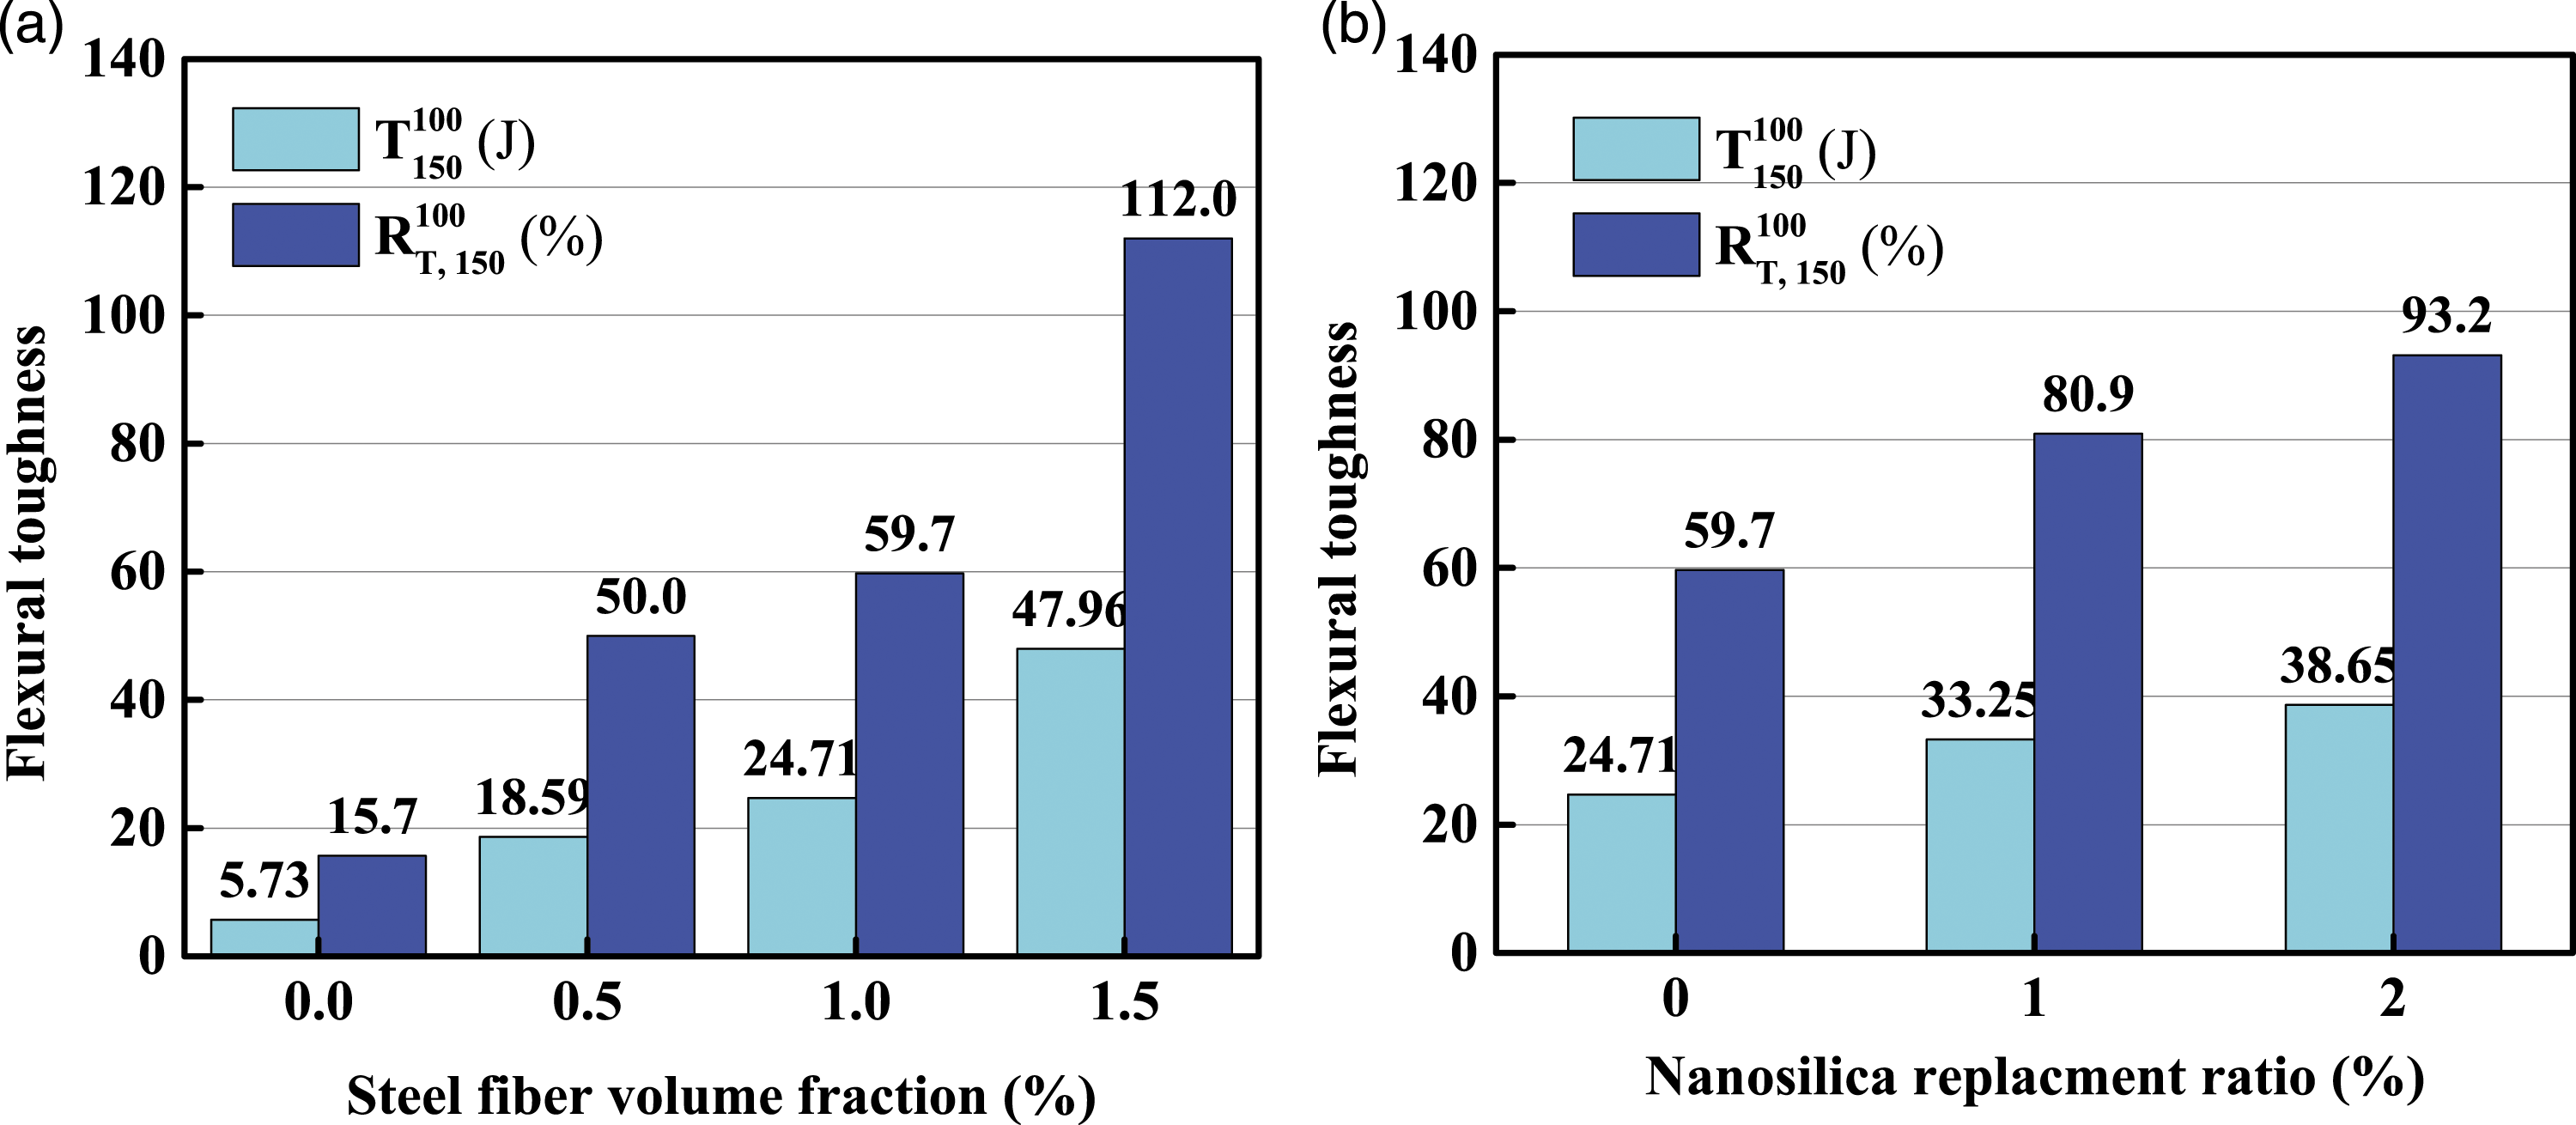
Figure 14(b) shows the effects of the NS replacement ratio on the flexural toughness and equivalent flexural strength ratio of SFNS-RC, this series of specimens had a SF volume fraction of 1%. With increasing NS replacement ratio from 0% to 1% and 2%, the
Microscopic properties
Surface characteristics
Figure 15 exhibits the surface characteristics of SF1NS1-RC specimen. It could be found that abundant rubber particles rose to the top of the concrete, which could form a weak area on the upper surface because of their uneven distribution, as shown in Figure 15(a). Similar phenomenon could be found by other scholars (Li et al., 2014; Fakhri et al., 2016). In addition, plentiful stomata were observed on the side and bottom surface of the concrete due to the nonpolarity and hydrophobicity of rubber particles, as shown in Figure 15(b) and (c). Surface of SF1NS1-RC specimen: (a) upper surface; (b) side surface; and (c) bottom surface.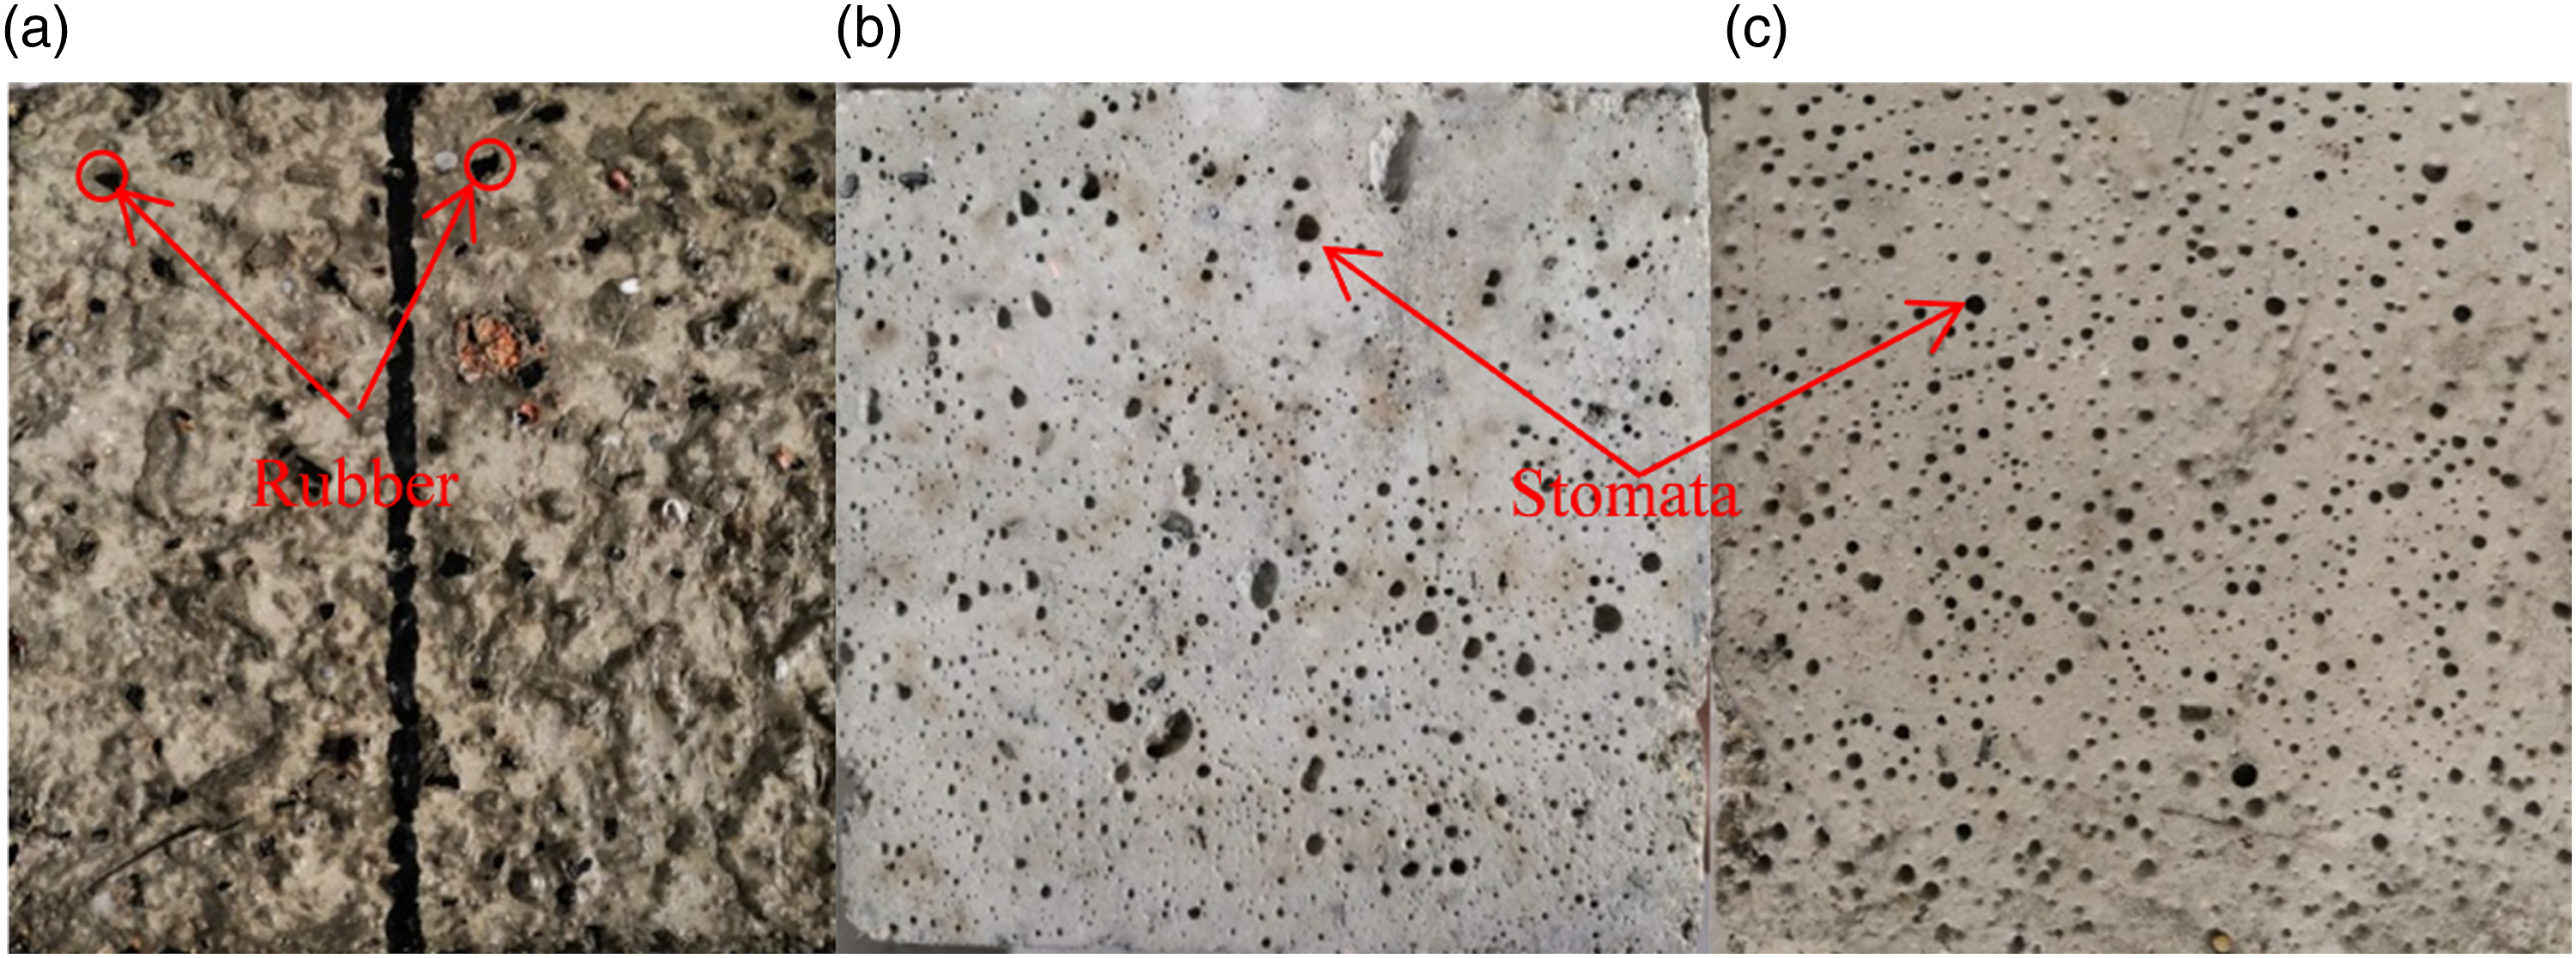
SEM analysis
Figure 16 presents the microstructures of the matrix at the interfacial transition zone (ITZ) captured by SEM. The porous paste structures at ITZ for the specimen without NS were shown in Figure 16(a), where the crystalline calcium hydroxide Ca(OH)2, amorphous calcium-silicate-hydrate (C-S-H) gel and stomata with different sizes could be clearly recognized. For the specimen with a NS replacement ratio of 1%, a more uniform and dense microstructure could be obtained due to the conversion of Ca(OH)2 to C-S-H under the action of NS, as shown in Figure 16(b). Microstructure morphologies at the interfacial transition zone: (a) SF1NS0-RC (b) SF1NS1-RC.
XRD analysis
Figure 17 illustrates the XRD patterns of SFNS-RC with different NS replacement ratios. The main peaks observed were calcium hydroxide (Ca(OH)2, 2θ deg. 18.1, 28.7, 47.1, and 50.1), alite (C2S, 2θ deg. 32.1, 34.4, and 41.2), belite (C3S, 2θ deg. 29.3, 32.5, and 34.4), quartz (2θ deg. 20.8, 26.6, 36.5, 39.4, 42.4, 45.7, and 54.8) and ettringite (2θ deg. 8.9) (Hakamy et al., 2013; Kontoleontos et al., 2012). As shown in Figure 17, the Ca(OH)2, C2S, and C3S peaks steadily reduced as the NS replacement ratio increased. For instance, with increasing NS replacement ratio from 0% to 1% and 2%, a peak of Ca(OH)2 (2θ deg. 18.1) decreased steadily from 597 to 388 and 252, respectively. A peak of C2S (2θ deg. 41.2) reduced gradually from 330 to 255 and 208, respectively. A peak of C3S (2θ deg. 29.3) diminished equably from 405 to 328 and 282, respectively. This was attributed to the NS could produce pozzolanic activity and accelerate cement hydration (Zhang et al., 2017). In addition, the CaO·SiO2·H2O (C-S-H) gel was the hydration product of SiO2, which was obtained by the following reaction (Khaloo et al., 2016). X-ray diffraction pattern of the steel fiber-and-nanosilica reinforced rubber concrete with different NS replacement ratios.

On the one hand, more C-S-H gel was produced during the hydration reaction, which improved the density of the matrix; on the other hand, more Ca(OH)2 were refined and consumed by NS. These newly generated products could be crystallized into fine particles to fill the pores of SFNS-RC, making the microstructure of composites dense and uniform (Quercia et al., 2014).
Conclusions
In this study, a series of experiments were conducted to investigate the effects of the SF volume fraction and NS replacement ratio on the flexural properties of the RC. The following conclusions could be drawn: The peaks of Ca(OH)2, C3S, and C2S in SFNS-RC steadily reduced as the NS replacement ratio increased, respectively, and the microstructure of SFNS-RC became more compact and uniform because the NS filled the pores of the matrix and strengthened the bond behavior between the SF and matrix. The SF and NS could significantly improve flexural behaviors of SFNS-RC, including the peak flexural strength, equivalent flexural strength, residual flexural strength and flexural toughness of SFNS-RC. However, the SF had a slight influence on the first-peak flexural strength and the NS had almost no effect on it. The SFNS-RC specimens containing SFs and NS could resist preferably generation and development of macro and micro cracks, and exhibit obvious ductility and excellent energy dissipation characteristics. Finally, the empirical formulae for predicting the first-peak flexural strength and peak flexural strength of SFNS-RC were proposed through the analysis of experimental data, respectively.
Footnotes
Declaration of conflicting interests
The author(s) declared no potential conflicts of interest with respect to the research, authorship, and/or publication of this article.
Funding
The author(s) disclosed receipt of the following financial support for the research, authorship, and/or publication of this article: The authors would like to thank the financial support of the National Natural Science Foundation of China (NO. 52008377, U1704254, and 51808508).