
Abstract
Long-span cable-supported bridge is one of crucial transportation infrastructures. Structural health monitoring (SHM) system that is used to assess structural service conditions and detect early damage has drawn a growing attention in engineering structural society. It provides a real-time monitoring of various structural changes under operational and extreme conditions. Yangluo Bridge over Yangtze River in Wuhan city of China is a 1280 m central span suspension bridge with an orthotropic steel box girder. Taking the SHM system of Yangluo Yangtze River Bridge as an example, this paper presents an implementation of SHM system on the bridge in terms of sensor layout, data acquisition strategy, data transmission, data processing, and abnormal alarm framework. With such an SHM system, the typical monitoring results are demonstrated such as operational environments, loadings, structural deformation, strains, dynamic properties, and structural responses. The SHM system of Yangluo Yangtze River Bridge is continuously gathering data and monitoring structural behavior. It is anticipated that it will provide either scientific or technological supports to the service comfort and safety of the bridge.
Introduction
Since the 1980s, long-span bridges and other infrastructure have been built all over the world (Hu et al., 2014; Huang et al., 2020; Qin and Gao, 2017; Zheng and Wang, 2018). The bridges, which play the role of the crucial transportation links, are always under operational conditions exposed to climate variation, corrosive environment, service loading, and extreme events throughout their service life. These factors may lead to bridge deterioration and damage to bridge integrity and functionality or even the catastrophic collapse which will cause enormous loss of lives and finances (Xu et al., 2016). For example, the I-35W Mississippi River Bridge catastrophically failed without warning on 1 August 2007, resulting in the death of 13 motorists (Zhu et al., 2010). The Grand Sung-Soo Bridge in Seoul, South Korea, collapsed suddenly on 21 October 1994, causing the loss of 32 lives. A box-girder bridge collapsed under overload in China on 24 August 2012, which caused three deaths, five injuries and traffic disruption (Shi et al., 2018). The highway bridge, which was being constructed over the Tuojiang River in Fenghuang, central-south China’s Hunan Province, suddenly collapsed on 13 August 2007, which caused at least 36 people to die and dozens to injure. The collapse of the Yihe Bridge in Luanchuan County in Henan Province of China left 37 people dead, and 29 others missing.
An optimal maintenance of civil engineering structures requires to identify damage at an early stage, since small and frequent repairs are much less costly than major repairs or total rebuilding after collapse. The schemes emerging early for damage assessment of structures are the scheduled maintenance through visual inspections or measurement with the help of portable instruments. These methods, however, share the following common demerits: (1) The vicinity of the damage must be known and accessible. (2) These schemes are time-consuming and expensive. (3) They are subjective, depending on the knowledge and experience of the inspectors. For the large and complex bridges, it is obvious that the abovementioned methods are unfeasible and impractical due to their shortcomings. To the end of damage detection for bridges, especially for the large and complex bridges (e.g., cable-supported bridges), an effective monitoring system that allows for automated system identification and damage detection, and possesses the long-term durability is of great importance.
Structural damage is normally defined as changes in the material and/or geometric properties of a structural system, including changes in the boundary conditions and system connectivity, which adversely affect the system’s performance. Due to the health and safety concern, the bridge collapse necessitates the continuous monitoring system for the bridges in order to identify damage at an early stage. In order to avoid the harm caused by bridge damage, many scholars have done a lot of research in the field of damage identification. For example, Lin et al. (2017) used the virtual distortion method to detect the damage of cable structures in bridge engineering. Kumar et al. (2021) proposed a bridge indirect damage identification method based on dynamic tire pressure monitoring. A wavelet-based method called the Wavelet Energy Accumulation Method is developed by Han et al. (2005), Ren and Sun (2008), and Machorro-Lopez et al. (2021) to detect damage in early stages. This method is verified by a detailed finite element model of a cable-stayed bridge. Based on the extracted influence lines, Zheng et al. (2021) proposed a two-step procedure for general short-span girder bridge stiffness estimation, which can be used for rapid capture of bridge status. These studies provide theoretical methods for the practical engineering application of bridge health monitoring and damage identification.
Nowadays, structural health monitoring (SHM) has received considerable attention in the technical literature. In general, SHM process involves the observation of a system over time using periodically sampled dynamic response measurements from an array of sensors, the extraction of damage-sensitive features from these measurements, and the statistical analysis of these features to determine the current state of system health. For long-term SHM, the output of this process is periodically updated information regarding the ability of the structure to perform its intended function in term of the inevitable aging and degradation. After extreme events, such as earthquakes or blast loading, SHM is used for rapid condition screening and aims to provide, in near real-time, reliable information regarding the integrity of the structure (Ko and Ni, 2005).
Structural health monitoring refers to a technology that allows for recording the structural behaviors over a sufficiently long duration to assess performance, identify anomalies, and detect damage, thus increasing the integrity, reliability, and safety of the structures. There is consensus in the SHM literature on the hierarchical decomposition of the SHM process in four levels: detection (Level 1), location (Level 2), and assessment (level 3) of the damage, prediction of the remaining service life of the damaged structure (Level 4). Naturally, the elements of an effective SHM system include the structure to be monitored, sensor arrangement, data acquisition system, data transfer and storage mechanism, data management, as well as data interpretation and diagnosis that are composed of system identification, structural model update, structural condition assessment, and prediction of remaining service life.
Structural health monitoring system has been increasingly implemented on different kind of bridges for health monitoring all over the world: Tsing Ma Bridge (Zhang et al., 2011), Kap Shui Mun Bridge and Ting Kau Bridge (Wong, 2007), Runyang Bridge (Fei et al., 2009), Yonghe Bridge (Li et al., 2010), etc. in China, Great Belt East Bridge (Soman et al., 2018), Oresund Bridge (Peeters et al., 2009), Henrique Bridge (Magalhães et al., 2012), etc. in Europe, Akashi Kaikyo Bridge (Fujino et al., 2000), etc. in Japan, I-39 Northbound Wisconsin River Bridge (Liu et al., 2009), Commodore Barry Bridge (Livingston and Jin, 2005), the multi-girder steel composite bridge (Cardini and DeWolf, 2009), etc. in United States. Comprehensive literature surveys on the state-of-the-art in SHM can be found in references Zhang et al. (2020, 2021), Wang et al. (2021), Shokravi et al. (2020), Sakiyama et al. (2021), Rizzo and Enshaeian (2021), and Bado and Casas (2021)).
Yangluo Yangtze River Bridge in Wuhan city of China is a 1280 m long-span suspension bridge with an orthotropic steel box girder. Suspension bridges are flexible structures with small stiffness. When the live load is applied, the geometric shape of the structure will change, resulting in large deflection. It is also easy to produce vibration under dynamic loads such as wind load and vehicle impact load. To ensure the safety and durability of such a large and complex structure under both operational and extreme conditions, the SHM system is installed on Yangluo Yangtze River Bridge. This paper presented an implementation of such a SHM system in terms of sensor layout, data acquisition strategy, data transmission, data processing, and abnormal alarm framework. The typical monitoring results are provised such as operational environments, loadings, structural deformation, strains, dynamic properties, and structural responses.
Bridge description
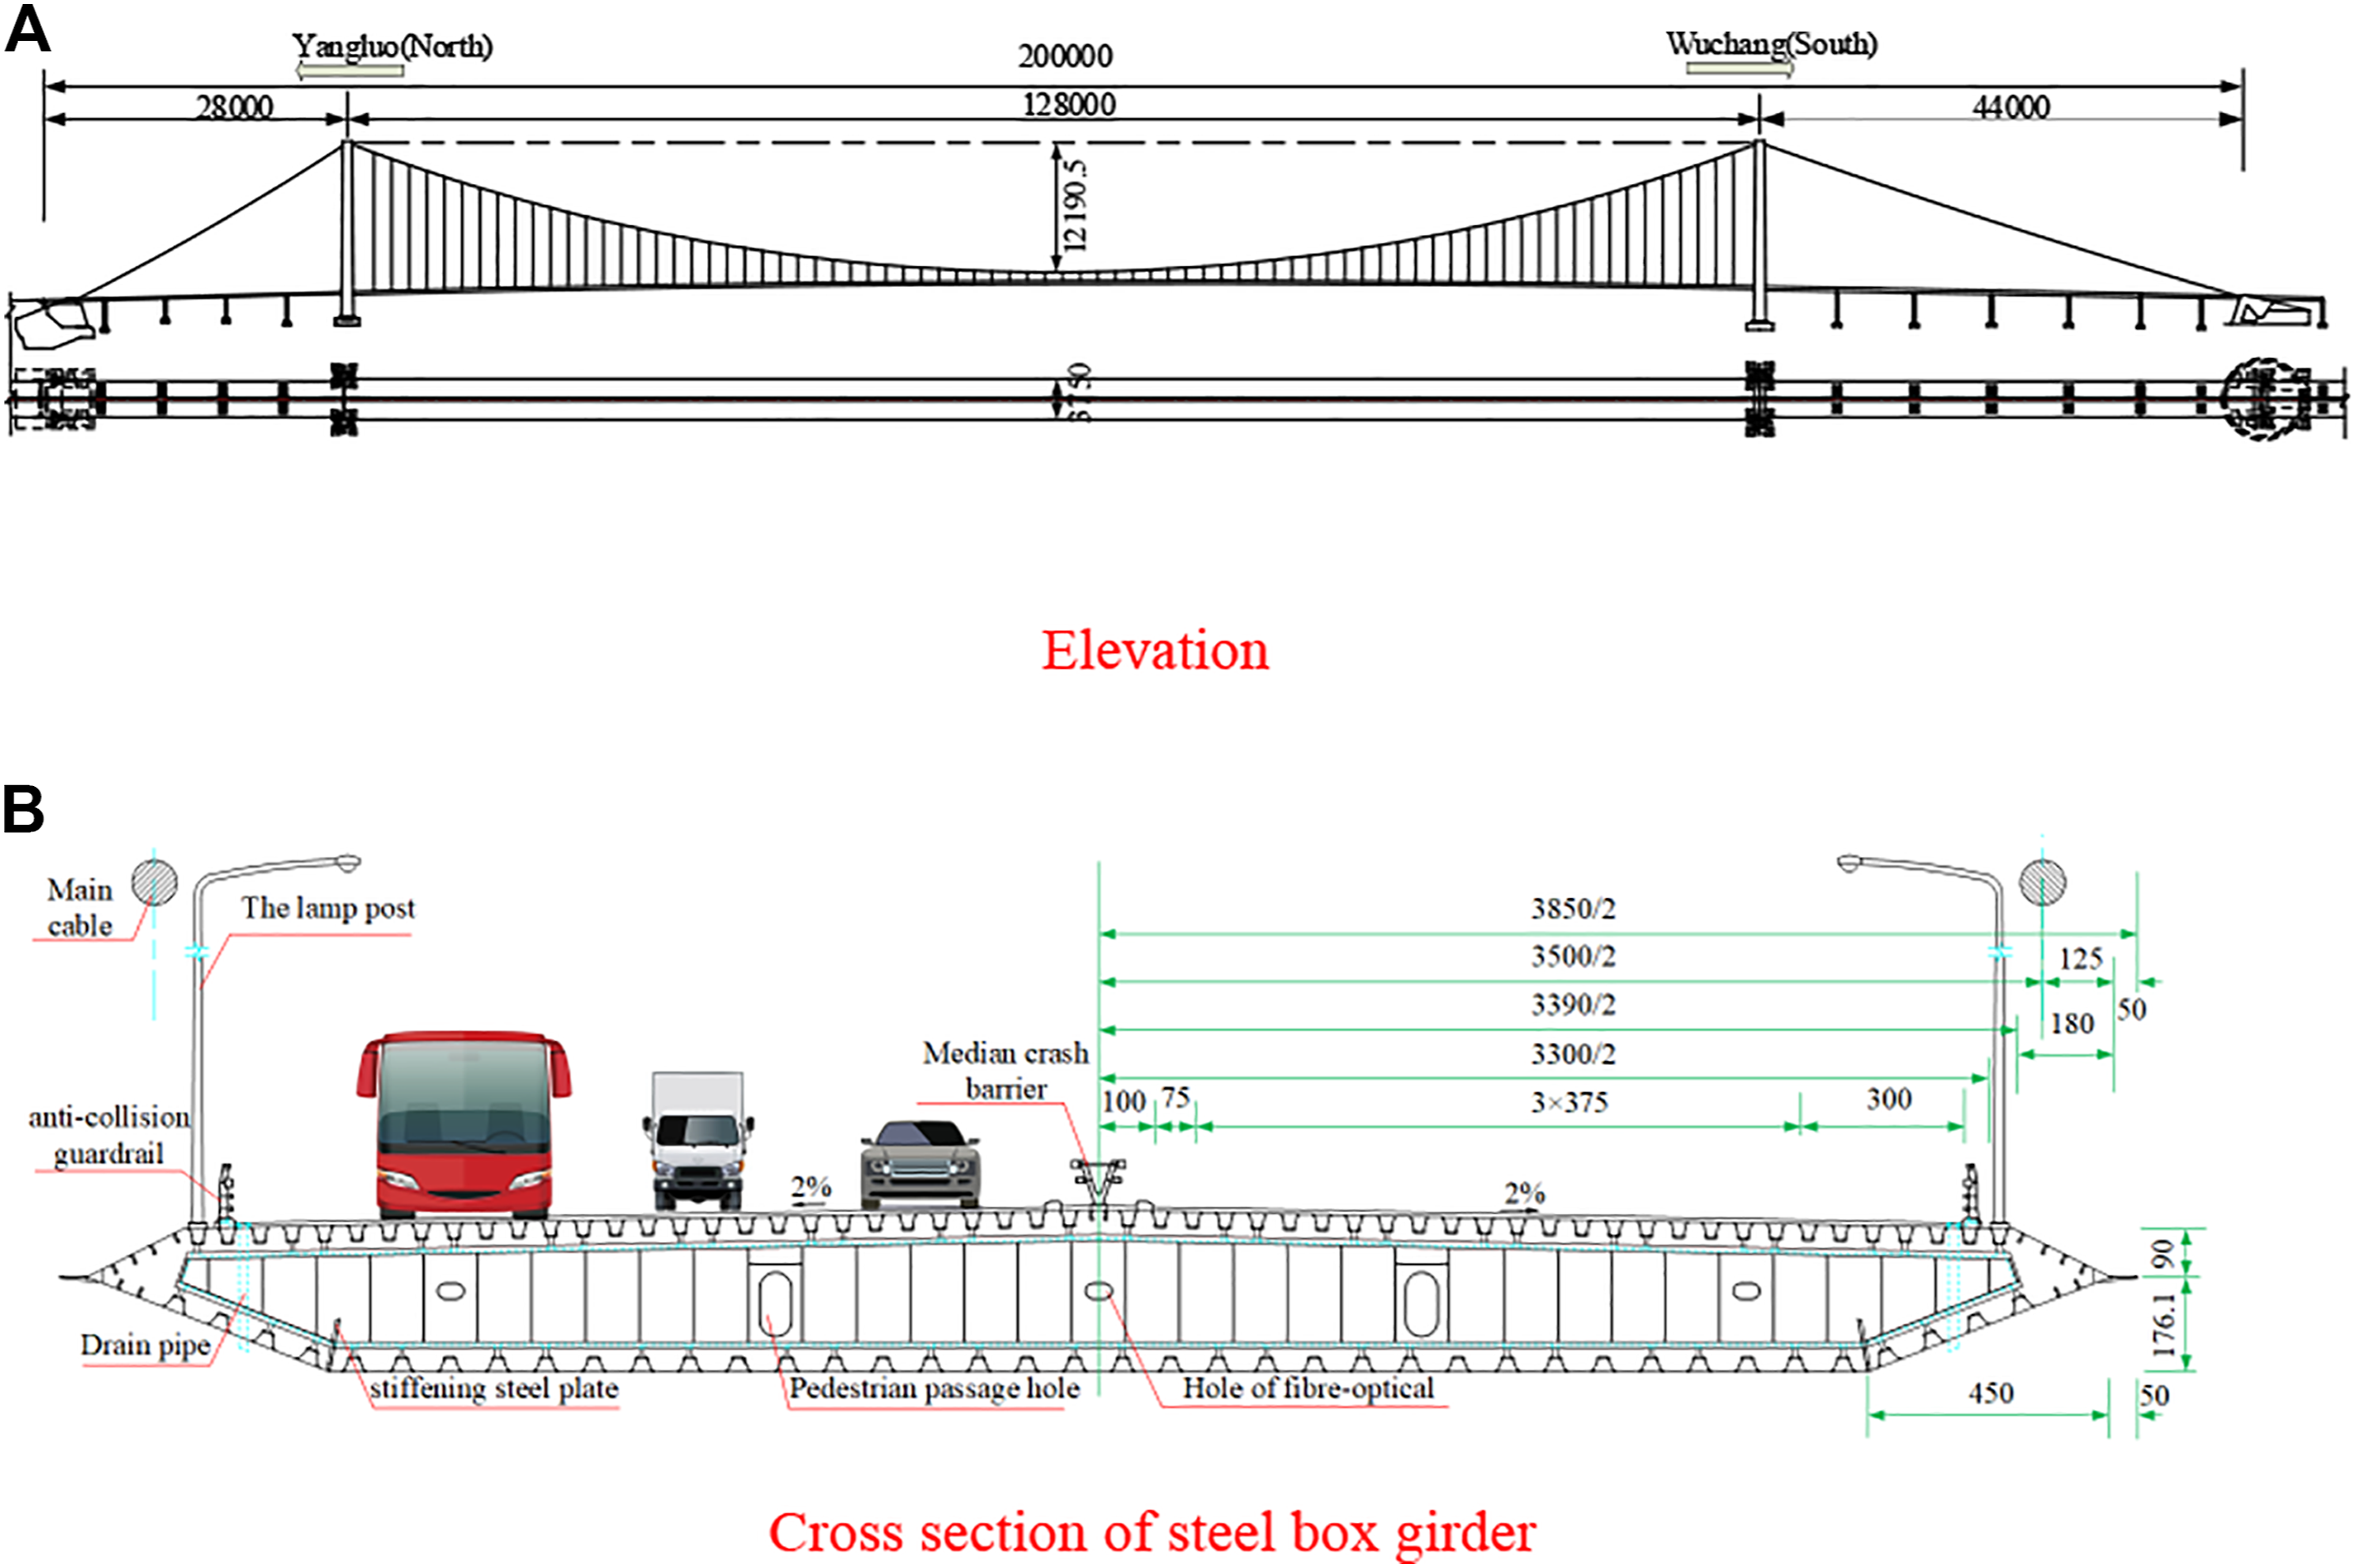
Yangluo Yangtze River Bridge, located in Wuhan City, Hubei Province of China, is a 1280 m long-span suspension bridge with an orthotropic steel box girder as shown Figure 1. The bridge is an important part of Wuhan Ring Road and the main national traffic lines of Beijing to Zhuhai and Shanghai to Chengdu. The elevation and geometric dimensions of the steel box girder section are shown in Figure 2. The ratio of rise to span of main cable is 1/10.5. The two main cables lie in a vertical plane with the center-to-center distance of 35 m. The main cable and the steel box girder are vertically connected by suspenders at an interval of 16 m. The north and south towers are 166.215 m and 169.215 m high, respectively. Yangluo Yangtze River Bridge. Steel box girder section of Yangluo Yangtze River Bridge (unit: cm). (a) Elevation. (b) Cross-section of steel box girder.
Because of the complex geographical environments, the meteorologic survey reveals that there is abundant rainfall, wind, humidity, strong ultraviolet radiation, higher temperature, thunderstorms, etc. in the bridge site. Even worse, the bridge has to bear heavy vehicles loading since a large number of vehicles crossing the Yangtze River. Considering the adverse operational environments and overloaded vehicles that have a considerable impact on the service safety of Yangluo Yangtze River Bridge, a SHM system is of great importance to ensure the health and safety of long-term service of the bridge. Such a SHM system not only has a practical value but also has an important scientific value for the design, service inspection, maintenance, assessment, and retrofitting of long-span suspension bridge.
Implementation of structural health monitoring System
Monitoring contents and system composition
Yangluo Yangtze River Bridge maintains the features of high tower, 1280 m long-span level, and high structural slenderness, which means that the geometric nonlinear characteristic of the bridge will be noticeable. The use of orthotropic steel box girder deck will give rise to the issue of local fatigue to the bridge. Additionally, due to the foundation development in the bridge site, special attention should be paid to the safety of the cable anchorages. The effect of unique natural environments in Yangtze River basin of China on the structural behavior is also an issue to be addressed. Considering the above factors, the main monitoring aspects of Yangluo Yangtze River Bridge are as follows: • In-service environments including wind, air temperature and relative humidity, structural temperature, traffic vehicle, etc. • Geometric deformations including the line (deformation) of main girder, the drift of towers and bearing displacements, etc. • Mechanical properties including strain (stress), cable and suspender force, fatigue, etc. • Vibration monitoring including acceleration responses and seismic responses, etc. • Displacement monitoring of the western tunnel anchorage including settlement, tilt angle, etc.
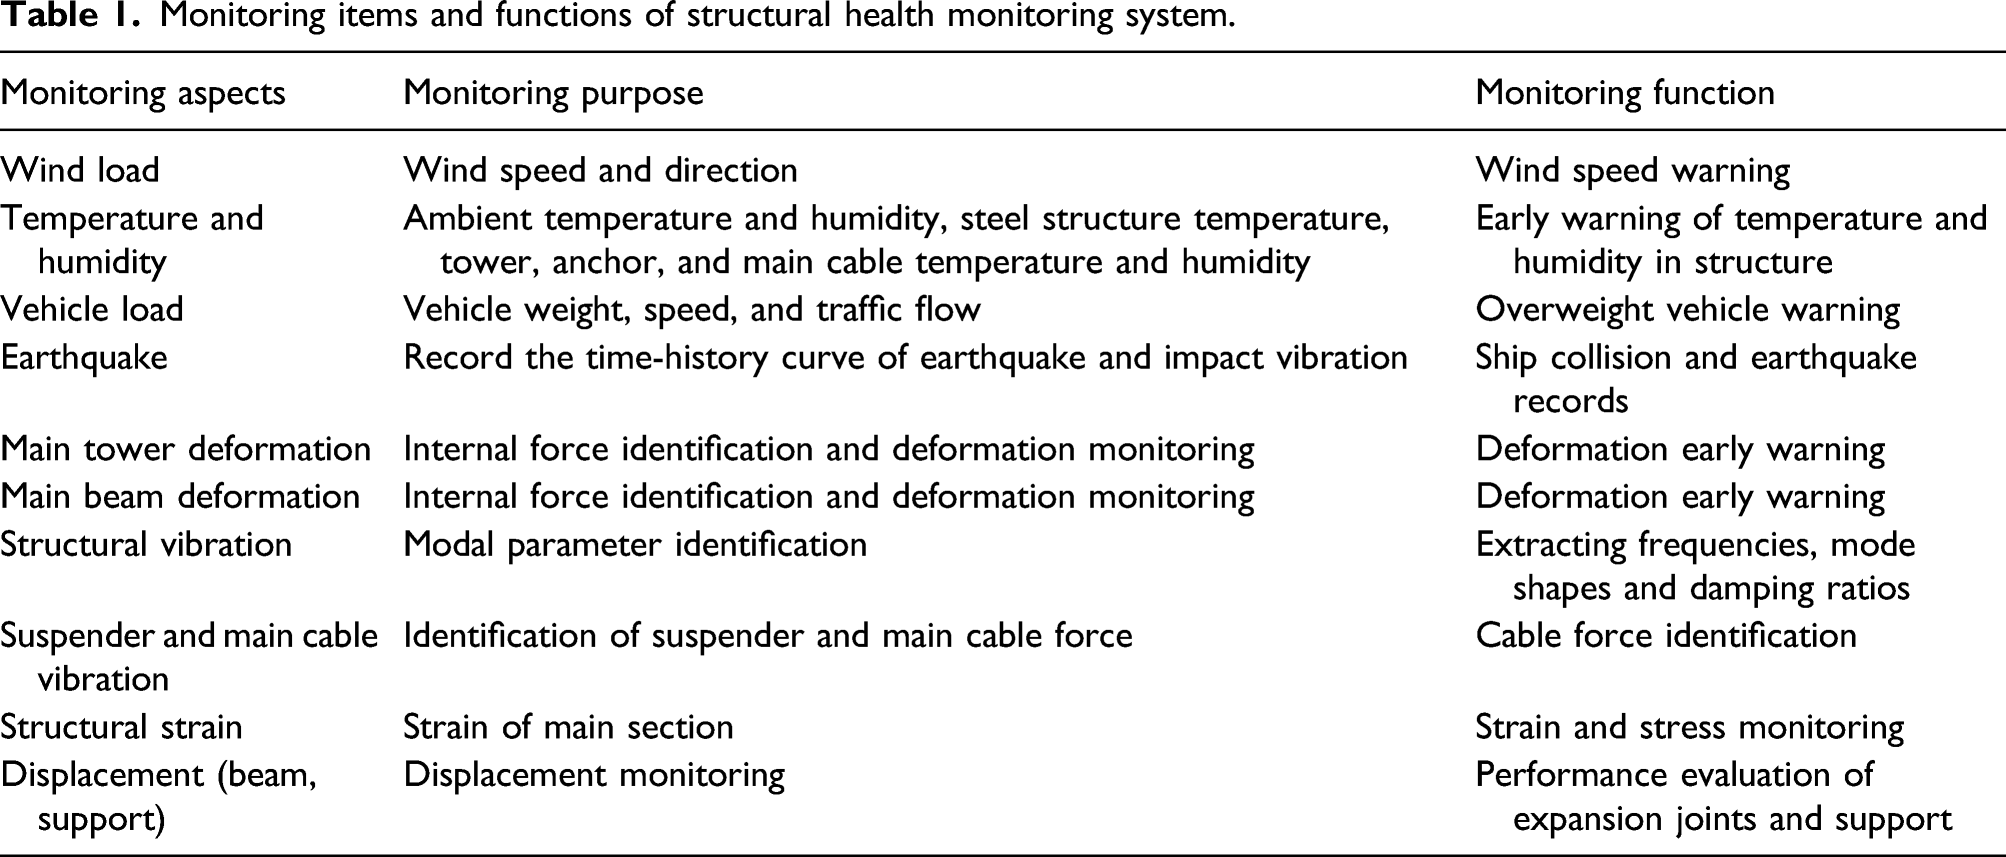
Monitoring items and functions of structural health monitoring system.
The SHM system of Yangluo Yangtze River Bridge consists of seven subsystems: sensor system, data acquisition and transmission system, data process and control system, early warning and alarm system, safety assessment system, monitoring and evaluation software system, and electronic inspection system. The framework of the SHM system is shown in Figure 3. Framework of structural health monitoring system.
Structural health monitoring system implementation
Based on the preliminary results of finite element analysis, a total of 434 sensors of different types are installed on Yangluo Yangtze River Bridge during construction. The sensor layout is as shown in Figure 4. Sensor layout in the structural health monitoring system.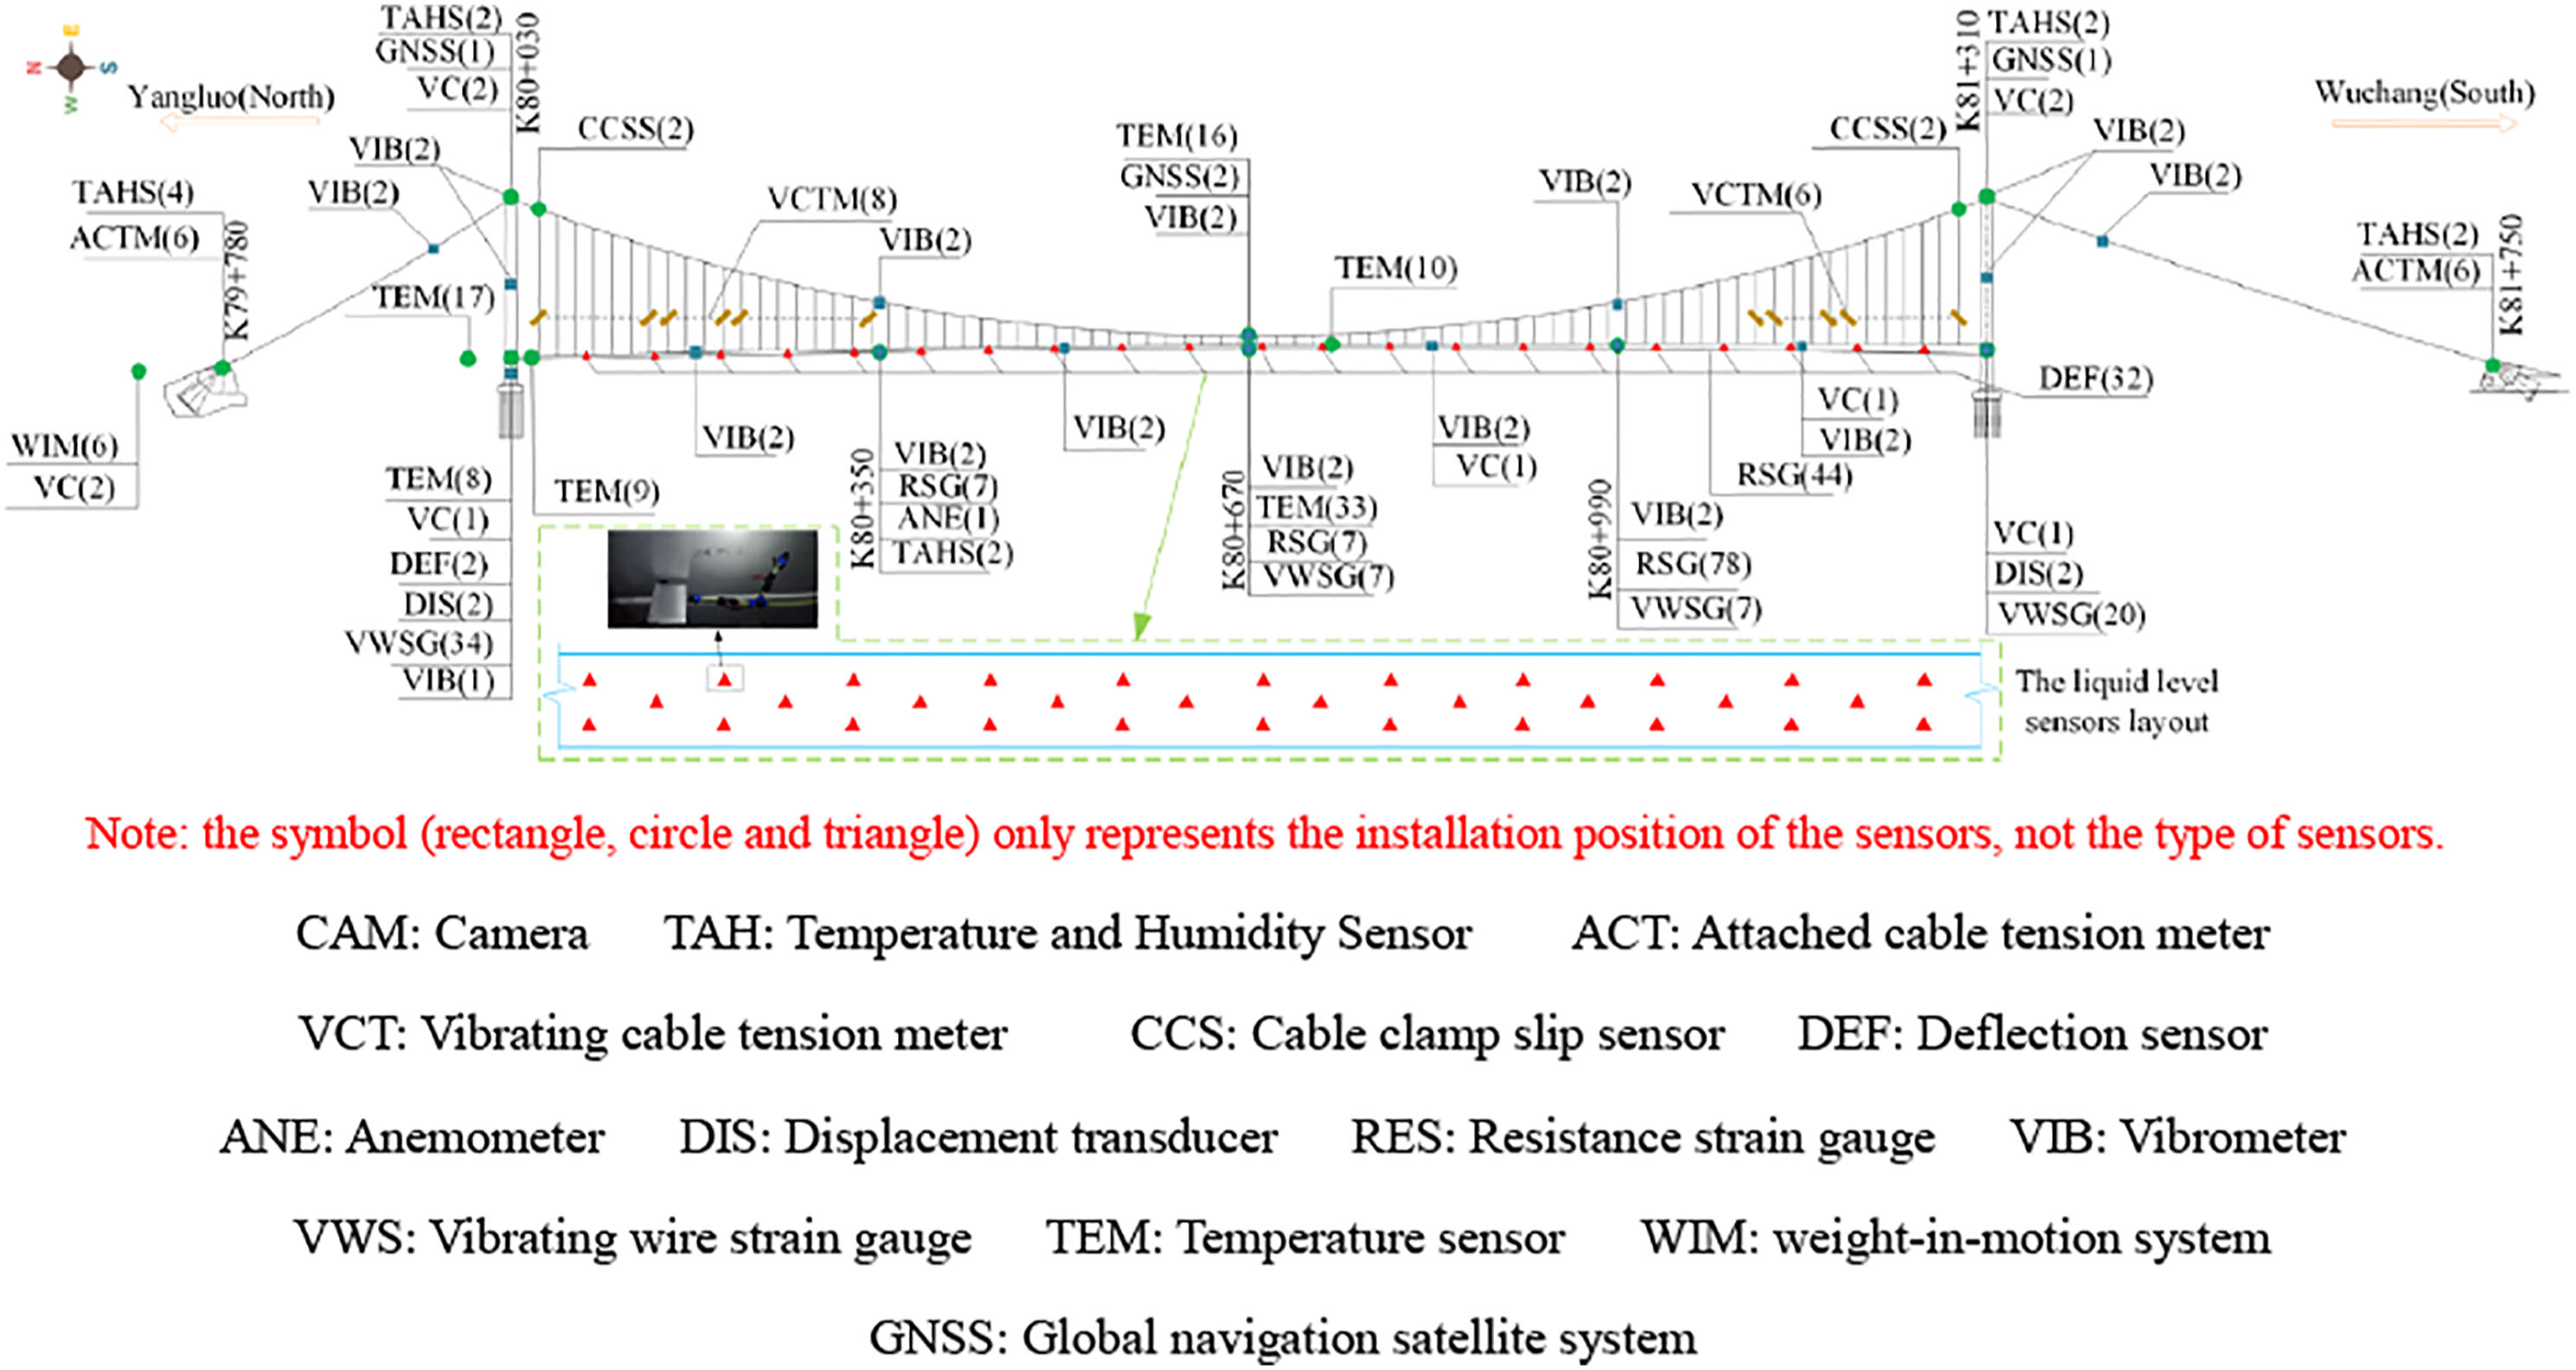
The implementation of SHM system on Yangluo Yangtze River Bridge is outlined as follows.
Operational environment monitoring
The wind speed and direction are monitored by one high precision 3D ultrasonic anemometer that is installed at the 1/4 main span. In such a way, the wind speed and direction in the bridge site can be effectively monitored and the wind characteristics on the bridge can be continuously obtained accordingly.
To monitor the changes in both air temperature and relative humidity at the anchors and bridge site, 14 sensors were distributed on the bridge in total that eight air temperature and relative humidity sensors are installed at both north and south anchorages. Six sensors are also, respectively, arranged in north tower, south tower, and the cross-sections of 1/4 main span.
According to the relevant literature research, long-span suspension bridges are very sensitive to temperature changes (Jang and Smyth, 2020; Kromanis and Kripakaran, 2014; Subramaniam et al., 2010; Tome et al., 2018; Xia et al., 2017). The structural temperature monitoring is realized by a total of 93 digital temperature sensors that are installed at the cross-sections of steel box girder of span center, the cross-sections of 1/4 and 3/4 main span as well as the cross-sections of tower columns. It is aimed at obtaining the temperature field and temperature gradient of main structural components like steel box girder and towers.
The vehicle loading is one of the most important loadings on the bridge. It is the main load input to assess the bridge service conditions. To monitor the traffic vehicles, a bridge weight-in-motion (WIM) system is implemented. It consists of a total of six lanes of piezoelectric sensors that are installed at the bridge deck. Such a bridge WIM system continuously monitors the vehicle number, speed, axle, and weight.
Geometric deformation monitoring
The long-span suspension bridge is a flexible structure with low natural frequency, which is sensitive to the effects of wind and temperature. The geometric deformations of this bridge will change obviously under the influence of different factors. Therefore, the geometric deformation is an important monitoring issue of suspension bridge, which directly reflects the service comfortable capacity, service performance and safety of the bridge. So, the long-term monitoring and analysis of the main beam deformation can provide a certain basis for structural damage and safety assessment. The geometric deformations of the bridge that are to be monitored include deflection of main girder, the drift of towers and bearing displacements. They represent the geometric deformations of main structural components.
The geometric deformation of main girder is one of the key issues to indicate the bridge service state. In the SHM system of Yangluo Yangtze River Bridge, 34 liquid level sensors (deflection sensor) are installed to different locations along the main girder as shown in Figure 4 to monitor the defection of main girder. The tower drift intuitively indicates the bridge structural deformation under loading as girder defection does. So GNSS (Global Navigation Satellite System) is also implemented to monitor the spatial displacements of main girder and towers. The GNSS measuring points are located at upstream and downstream of main girder midspan and the top of two towers as shown in Figure 4.
Mechanical property monitoring
The mechanical properties of bridge components represented by the force and stress reflect the strength to resist the various loadings. In current SHM system of Yangluo Yangtze River Bridge, a total of 136 resistance strain gauges (RES) and 68 vibrating wire strain gauges are implemented to monitor the structural stresses of different components. They are installed at the 1/4, 1/2, and 3/4 cross-sections of main span girder and the cross-sections of tower columns, respectively. Consequently, the structural strains or stresses of different components can be continuously obtained, which provides the most important information for bridge condition assessment. In addition, the obtained changes in strain or stress amplitudes can serve as the base to assess the fatigue life of structural components or joints.
Yangluo Yangtze River Bridge is a suspension bridge supported by the main cable. The main cable and suspenders are the most important load-bearing structural components for such a bridge. Therefore, the variation in cable force significantly influences the bridge service state. To monitor the cable and suspender forces, a total of 26 cable tension meters which include 12 vibrating cable tension meters for main cable and 14 attached cable tension meters for suspenders, are installed for this bridge.
The orthotropic steel box girder has the advantages of light weight (thin plate, less steel consumption) and large bearing capacity, which has been widely used in many long-span bridges. However, due to the effect of vertical load, the use of orthotropic steel box girder deck will give rise to the issue of local fatigue to the bridge. It is well known that the cumulative fatigue damage and failure is one of the main forms of structural failure. Therefore, monitoring the local fatigue becomes even important. To do that, a total of 20 fatigue life gauges (RES) are installed for local fatigue monitoring of orthotropic deck.
Vibration monitoring
The structural vibration monitoring is dedicated to measure the vibration responses under operational or extreme conditions of the bridge. The structural dynamic characteristics can be identified by these operational measurements. Another purpose of vibration monitoring is to record the structural dynamic responses after extreme events, such as earthquakes, strong winds, or unexpected impact loading. The structural dynamic characteristics are monitored by using a total of 29 three-axis accelerometers that are installed at 1/8, 1/4, 3/8, 1/2, 5/8, 3/4, and 7/8 main span girder, cables at 1/4, 1/2, and 3/4 main span, and the top of both towers. The detailed accelerometer layout is as shown in Figure 4.
Data acquisition
Data acquisition strategy.

Data transmission framework
The SHM system of Yangluo Yangtze River Bridge adopts the distributed data acquisition module and optical fiber transmission network for data transmission. Data measured from the sensors are transmitted to computer service station. Then computer transmits the data to the monitoring center for data analysis and processing. The data transmission framework implemented in the SHM system of Yangluo Yangtze River Bridge is as shown in Figure 5. Data transmission framework.
Structural health monitoring Demonstration
Wind monitoring
The design basic wind speed of the deck of Yangluo Yangtze River Bridge is 29.7 m/s, and flutter wind speed is 33.4 m/s. The north direction wind is set to be 0° as the bridge wind direction. In such a case, the longitudinal direction of the bridge is located in the south of 180°. From January to June 2021, the typical wind-rose diagrams including the wind speed and wind attack angle distribution are illustrated in Figure 6. Wind-rose diagrams of wind speed and direction from January to June.
As can be seen from the figure, between January and April, the main wind direction is from north-northwest, followed by the north-northeast direction, while the main wind direction is from south-southeast, followed by the west-northwest direction in May and June 2021. Six-month continuous monitoring data on the winds of Yangluo Yangtze River Bridge reveal that the average wind speed is about 3.1 m/s, and the maximum wind speed is about 16.3 m/s.
Temperature monitoring
It is well known that the deck alignment (deck deformation) and structural internal forces of the steel box girder under operational conditions are associated with structural temperature (Subramaniam et al., 2010). Because of the higher thermal expansion coefficient of steel material, the steel orthotropic deck of Yangluo Yangtze River Bridge is very sensitive to the temperature. In order to obtain the temperature distribution and temperature gradient of the structure, the temperature sensors as shown in Figure 7 are arranged in the deck cross-section at middle span. The typical temperature variations in the steel box girder at the span center in 72 h from May 01–03, 2021 are as shown in Figure 8. Temperature sensor measuring point in the steel box girder at the span center Temperature variation in the steel box girder at the span center

It can be observed that the maximum temperature difference at the top of bridge orthotropic deck is higher than that at the bottom of the bridge deck in a day. The deck roof is vertically divided into asphalt concrete layer, orthotropic steel plate, and U-shaped rib. According to the physical properties of the material, the heat absorption coefficient of asphalt concrete is larger, which leads to the surface temperature of the bridge rising faster and higher (47.3°C) under the solar radiation. The maximum temperature of the roof can reach 36.9°C, which is 10.4°C lower than that of asphalt concrete layer through heat conduction. The temperature of the U-shaped rib under the roof only rises to 32.8°C for the reason that the air heat conduction and the cross-sectional area of the connection is small. The temperature curve also shows that the higher the temperature is, the more obvious the difference of temperature distribution inside the box girder is. In this case, the gradient temperature distribution in the box girder cannot be ignored. When the temperature is lower than 25°C (generally at night and after 6:00 p.m.), the temperature difference inside the steel box girder is small, and the temperature difference becomes stable.
Vehicle monitoring
The bridge WIM system implemented in the SHM system of Yangluo Yangtze River bridge is TDXWIN-AL. The system consists of four parts: high-speed vehicle dynamic weighing detection system, vehicle real-time video monitoring and management system, data and video transmission system, and customer management data management system. The traffic information of a certain section of the bridge, including vehicle type, vehicle speed, total weight, number of axles, wheelbase, etc., can be monitored in real-time through this system. In addition, the video monitoring system can record the vehicles passing through and retain the vehicle video information. Efficient and accurate measurement of traffic information is not only conducive to capturing overloaded vehicles, but also of great significance for the management and maintenance of the bridge.
The lane layout of main girder is shown in Figure 9(a). In terms of 1-month data in the May of 2021 from WIM acquisition system, there are a total of 161,518 vehicles. The spatial distribution of vehicles by number of axles in different lanes is summarized in Figure 9(b). It can be seen that the vehicles with two axles are dominant for Yangluo Yangtze River Bridge, with a total of 142,797 vehicles (88.41%). Two axle vehicles are most distributed in Lane 1 and Lane 6, and evenly distributed in other lanes. The number of six-axle vehicles this month has also reached 10,798 (6.69%). The vehicles with 3 axles or above are mainly passing through the Lane 1, Lane 2, Lane 5, and Lane 6. Statistical diagram of vehicle information. (a) Line layout of main girder. (b) Spatial distribution of vehicles by number of axles. (c) Spatial distribution of vehicle weight. (d) Spatial distribution of vehicle speed, and (e) Number of vehicles in each lane for different months.
The category of vehicles in different lanes by their gross weight is as shown in Figure 9(c). The maximum weight of vehicles crossing the bridge can be more than 550 kN. In terms of vehicle weight distribution, the vehicle weight of lane 1, lane 6, lane 3, and lane 4 is relatively concentrated, mainly cars and minivans with a load of less than 55 kN. The vehicle weight of lane 2 and lane 5 is scattered, while the large trucks with a load of 100 kN–550 kN are the main ones.
Figure 9(d) shows the spatial distribution of vehicle speeds in different lanes. The velocity distribution of Lane 1 and Lane 6 is about 30 km/h to 80 km/h. The velocity distribution of Lane 2 and Lane 5 is about 50 km/h to 100 km/h. The velocity distribution of Lane 3 and Lane 4 is about 60 km/h to 110 km/h.
By analyzing the traffic monitoring data from June to October 2021, it is found that the number of vehicles in different lanes varies from month to month, as shown in Figure 9(e). In general, however, the number of vehicles per month conforms to the same law, namely the number of vehicles in Lane 1 and Lane 6 is the most, while is the least in Lane 3 and Lane 4.
Dynamic response monitoring
In order to monitor the structural dynamic responses with extreme events, such as earthquakes or impact loading, six three-directional accelerometers are installed at north tower (ACEL N1, ACEL N2, and ACEL N3) and south tower (ACEL S1, ACEL S2, and ACEL S3) as shown in Figure 10(a). The typical structural time-history responses from such accelerometers (ACEL N1(S1)) are as shown in Figure 10(b). It is found that such structural responses are quite small without extreme events. Dynamic response monitoring. (a) Sensor layout. (b) Typical acceleration response of tower.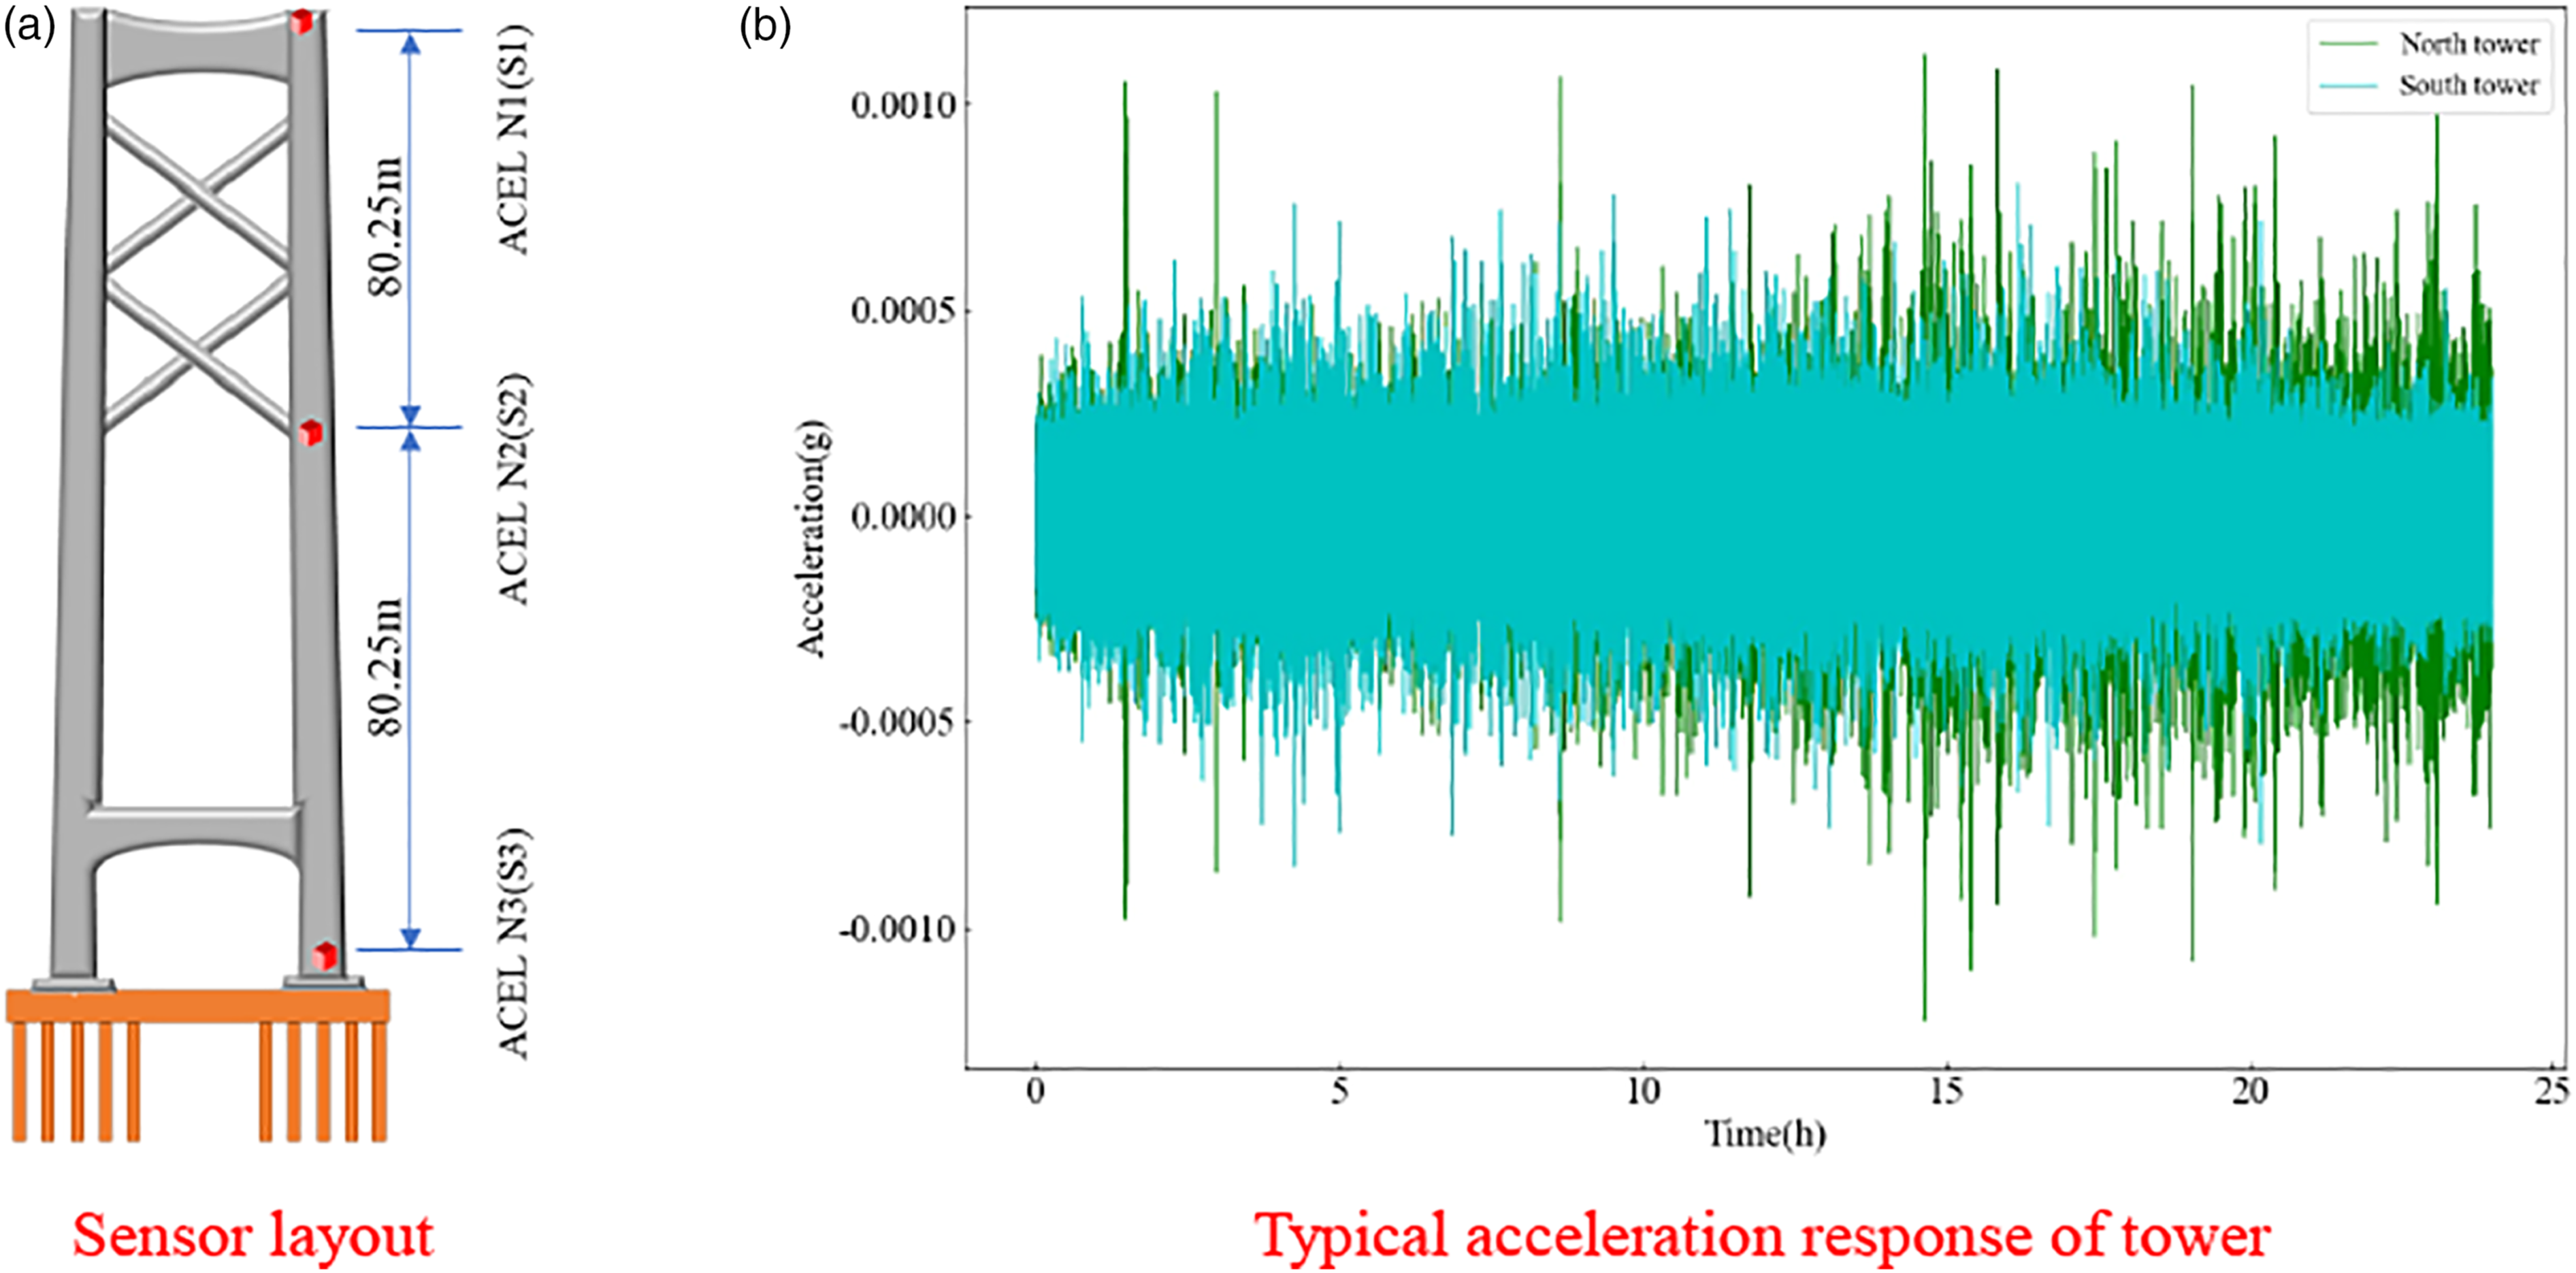
Structural deformation monitoring
Relevant studies show that the change of ambient temperature has a significant impact on the deformation of suspension bridge (Zhou et al., 2020). Regarding the deformation of main girder, both deformation and temperature data in 5 months from February 2021 to June 2021 are used as an example to demonstrate the correlation between deflection of main girder and temperature.
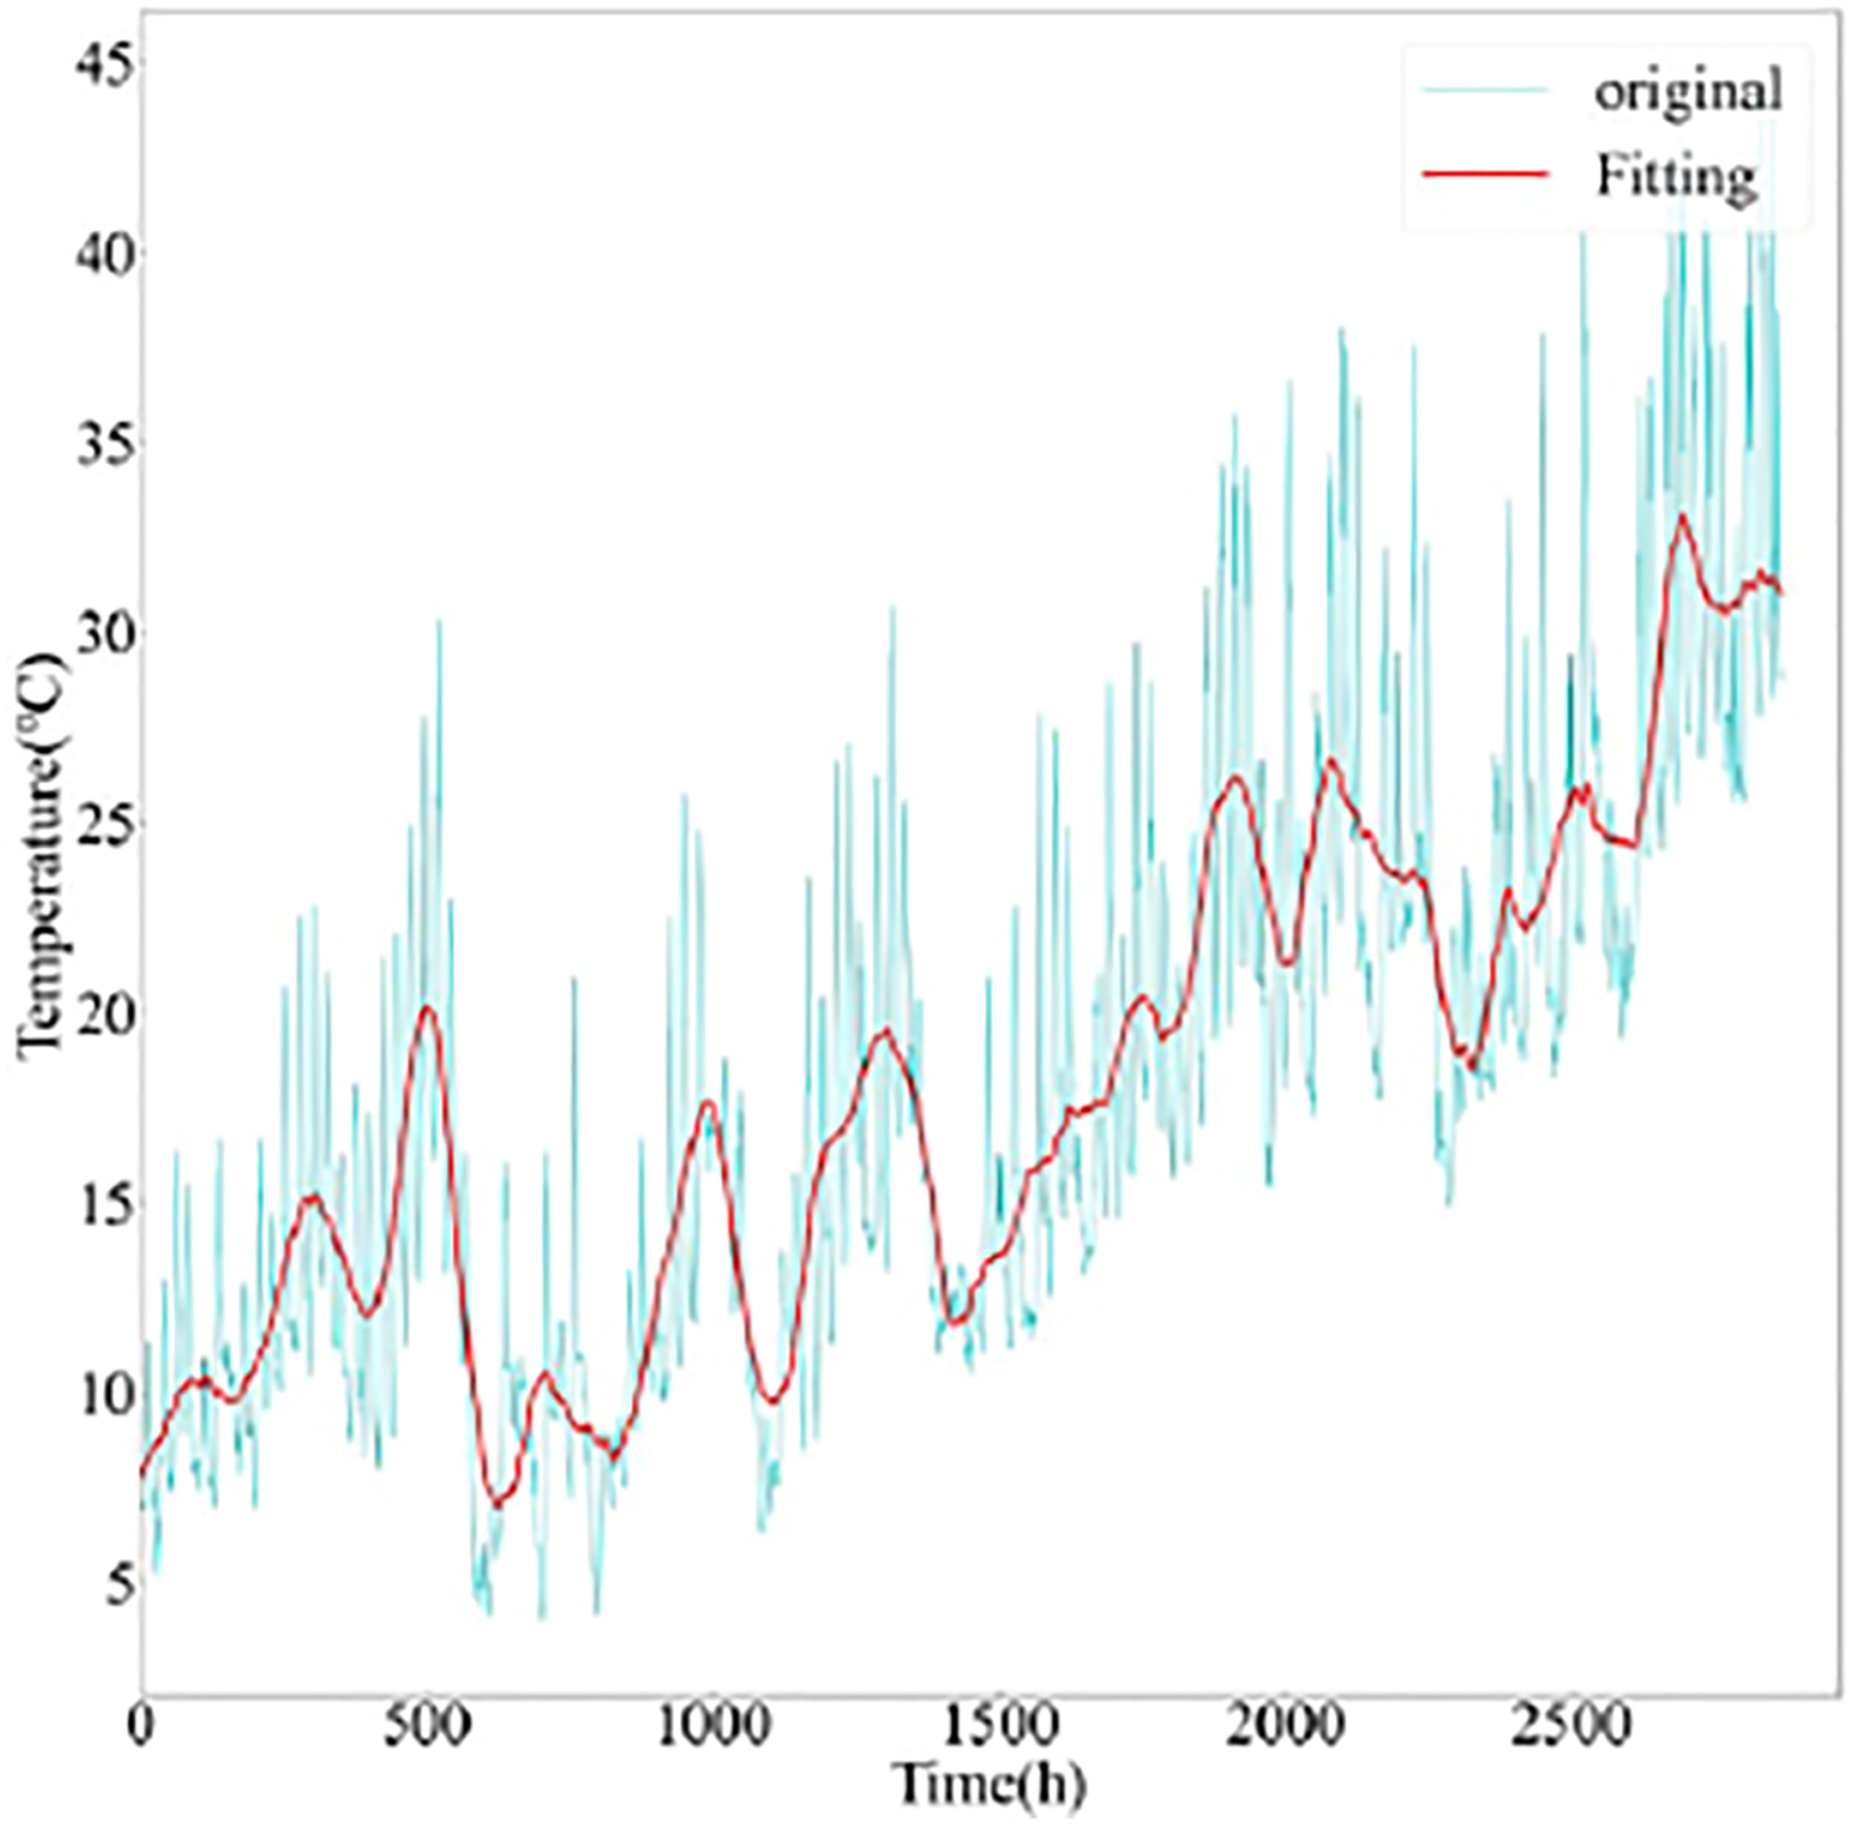
With regard to GPS three-dimension displacement monitoring, Figure 11 illustrates the three-dimension displacement changes of the bridge deck at 1/2 main span in 2 days (June 24 to 25, 2021). At that time, the maximum temperature of main girder is 38.3°C and the minimum temperature is 26.2°C. Temperature fluctuation curve inside the steel box girder with minimum temperature 3.4°C and maximum temperature 48.9°C during the 5 months is illustrated in Figure 12. It can be observed that the vertical deflection of the bridge deck has a strong correlation with the temperature. Deflection variation at 1/2 main span. Temperature change of inside steel box girder.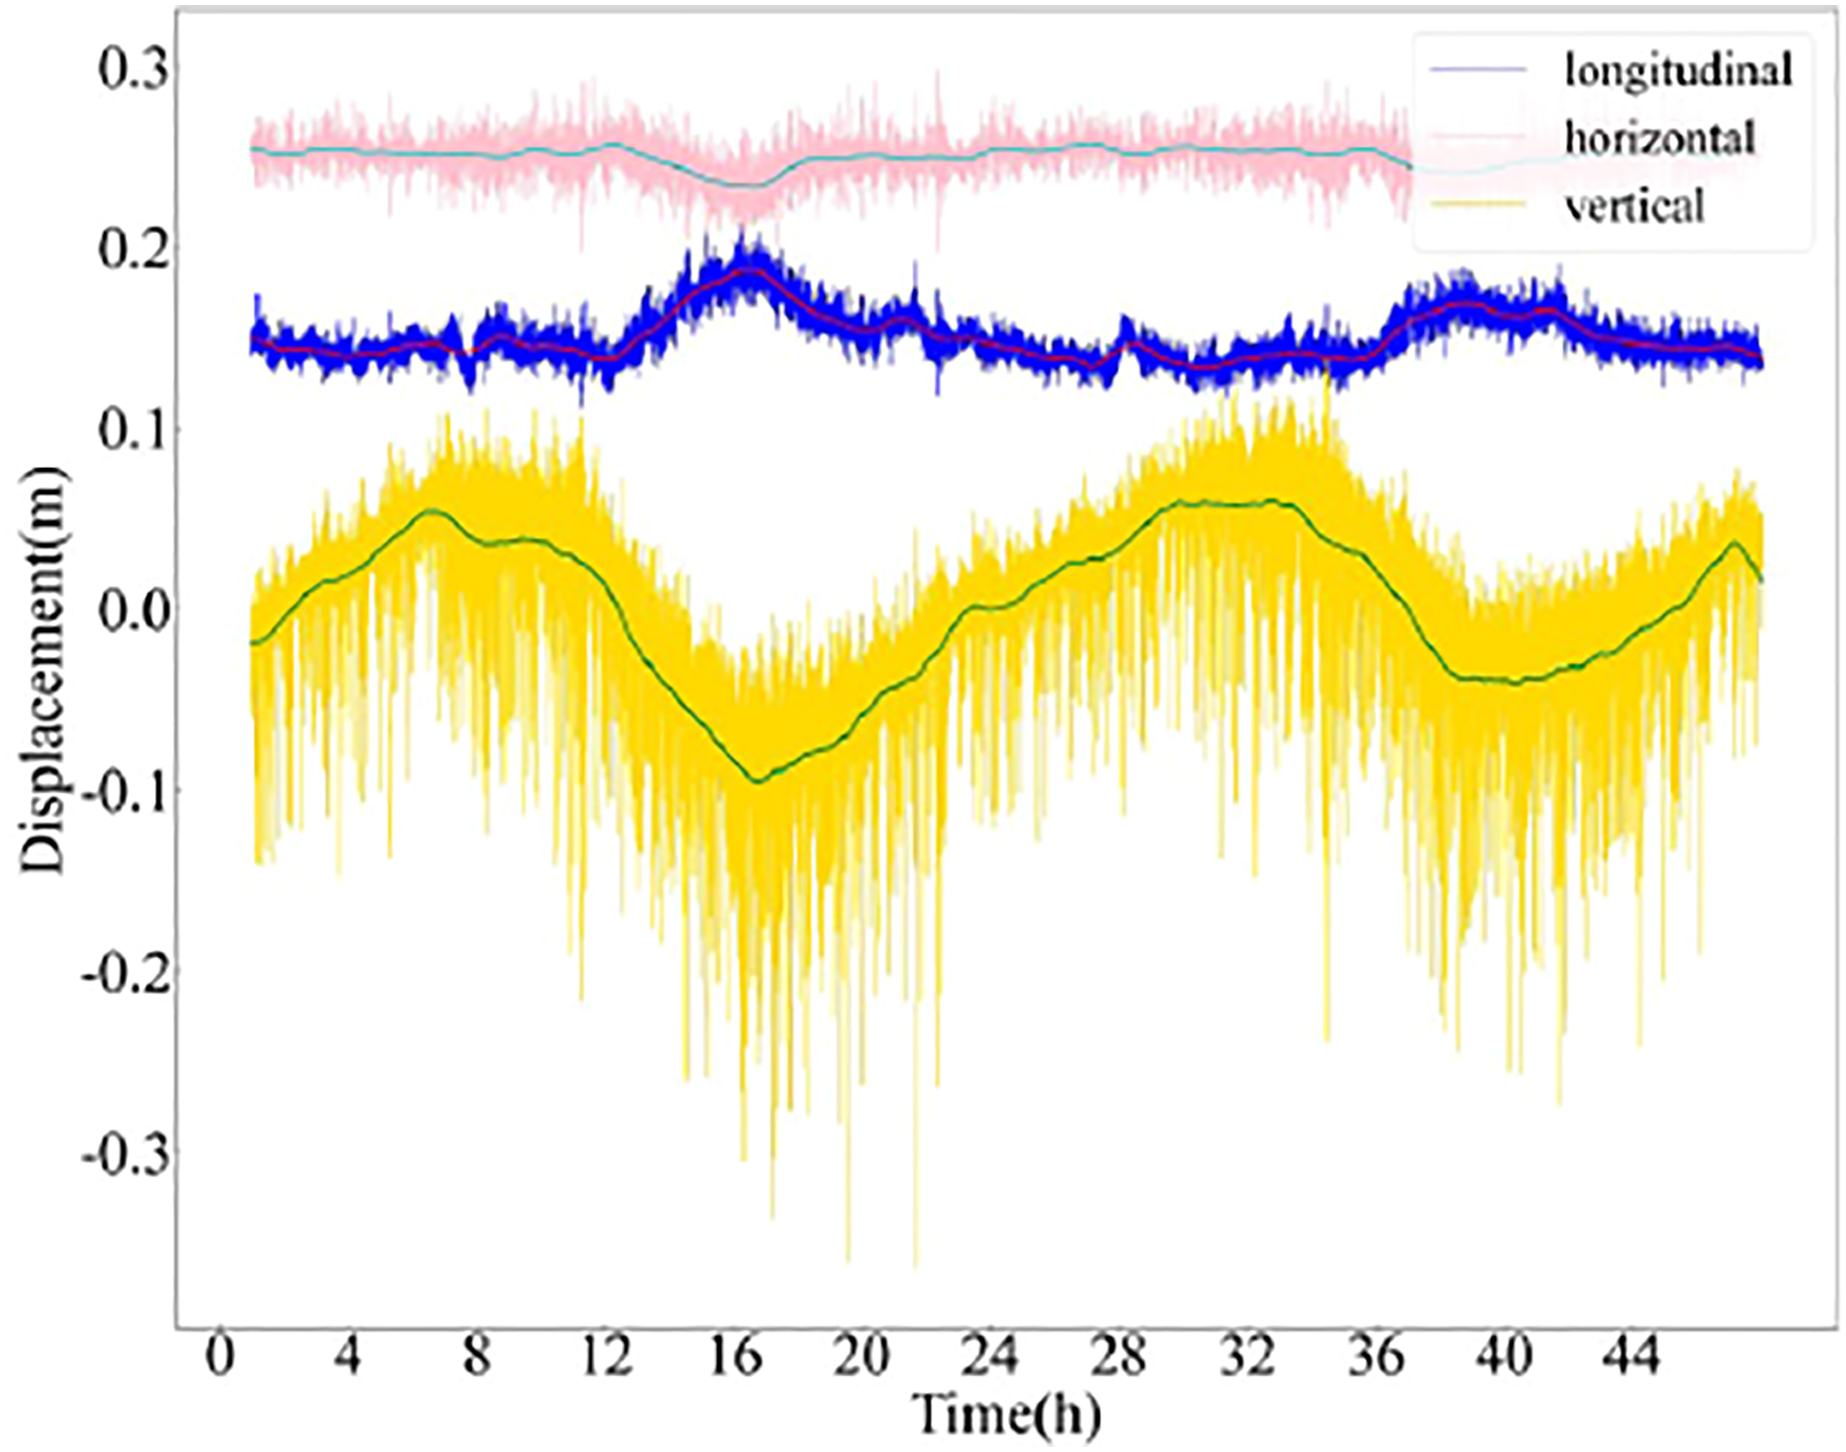
In addition to deflection monitoring at the mid-span by GPS, the liquid level sensors also monitor the deck deflections. The deck deflections with minimum temperature 26.6°C and maximum temperature 37.8°C on 29 June 2021 are as shown in Figure 13. It can be seen that the higher temperature will result in lower bridge deck deflection. In order to obtain the relationship between mid-span deflection and temperature, more data are needed for statistical analysis. Deck deformation at low and high temperature.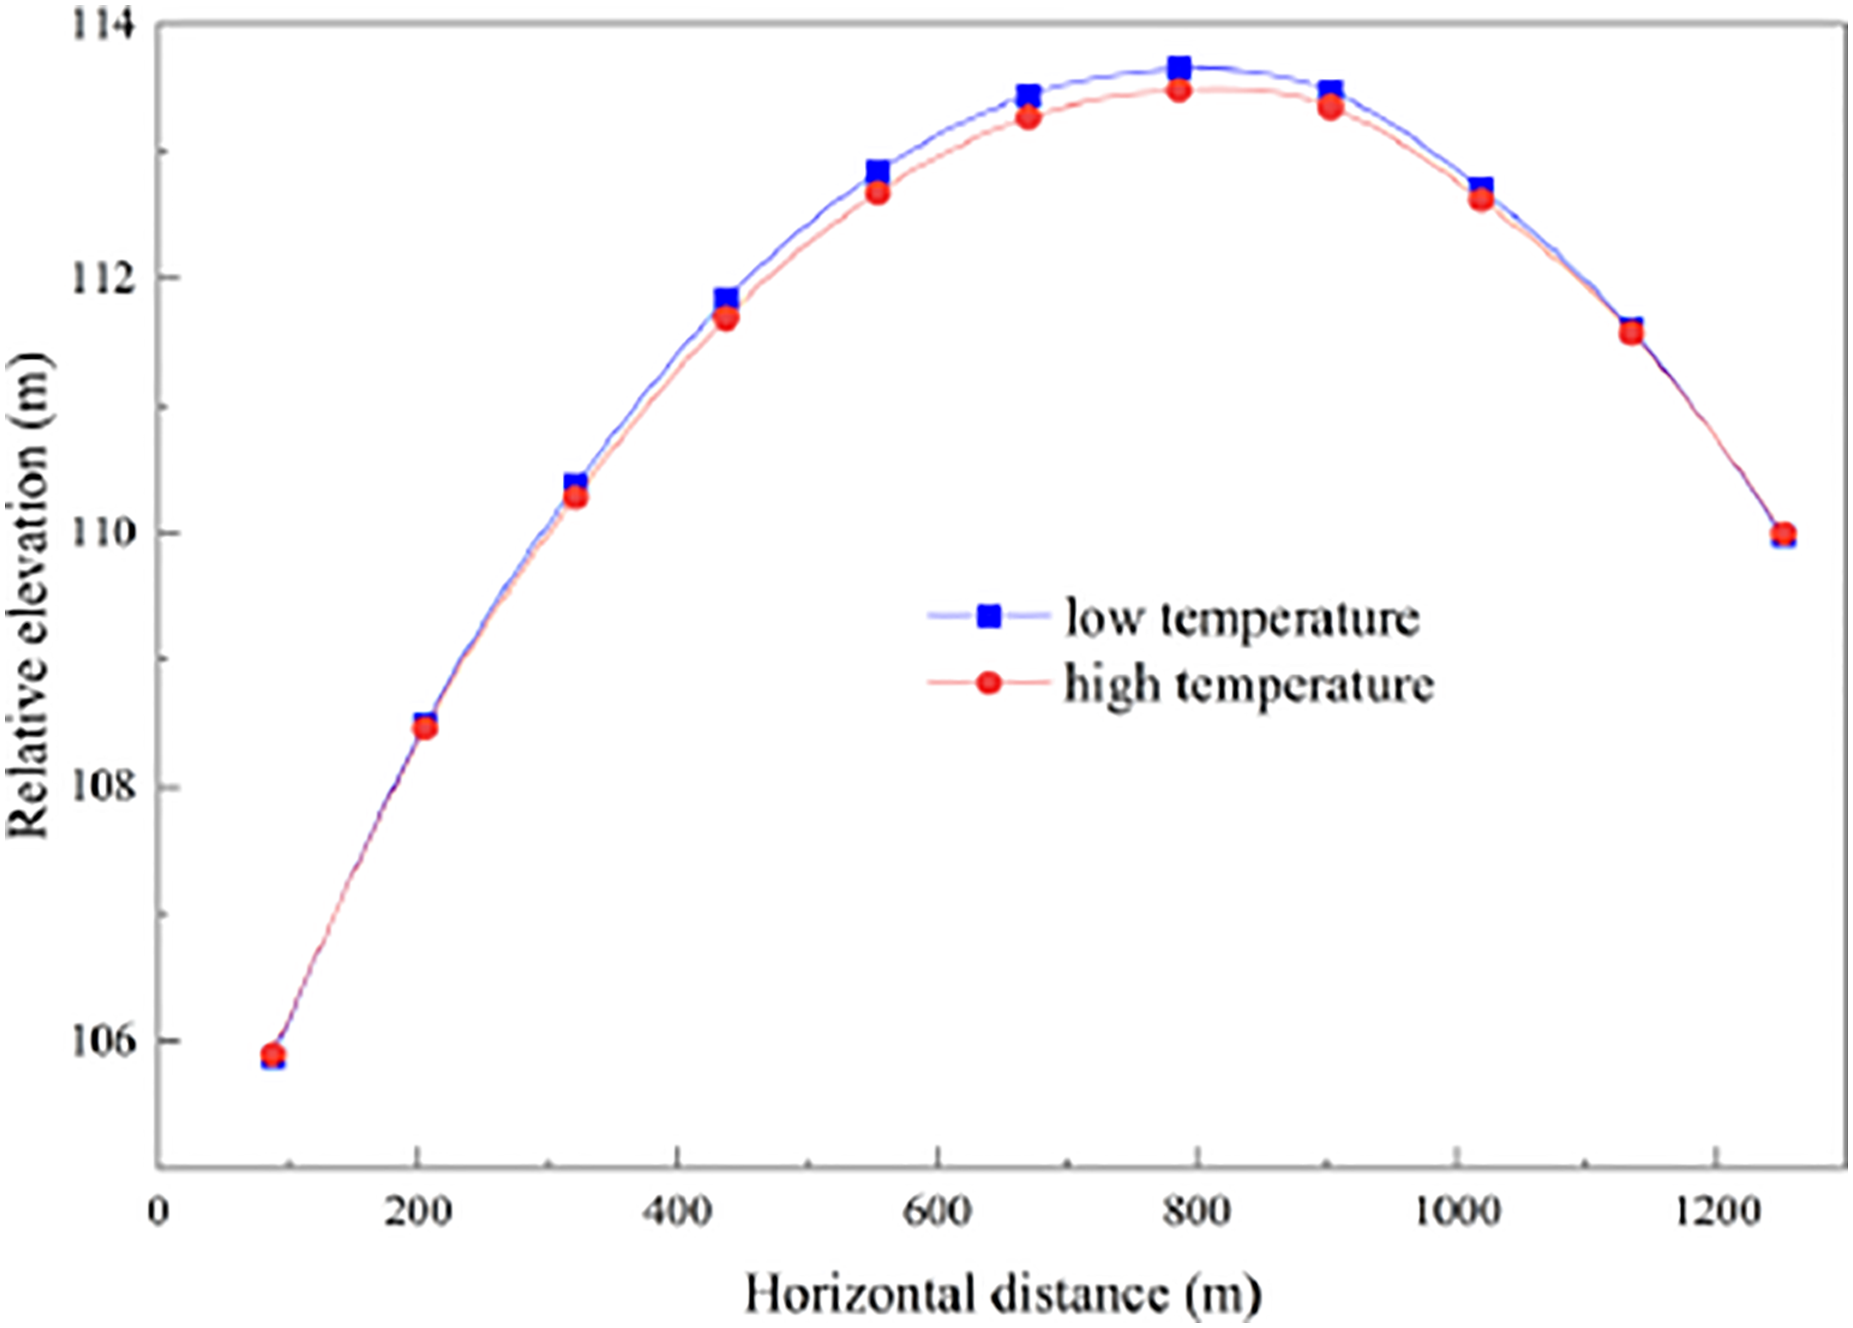
Figure 14 is a scatter diagram of the correlation between temperature and mid-span deflection monitored over 5 months. It is demonstrated that there is a negative correlation between mid-span deflection and temperature. According to the monitored deflection data of deck in 24 h on 01 May 2021, although the short-term change in temperature exceeds 20°C, the displacement of the deck has a change of 23 cm. It implies that the deck deformation has a significant lag effect compared to the temperature variation. The deflection change of such a long-span bridge is closely correlated to the change in temperature. Correlation between mid-span deflection and temperature.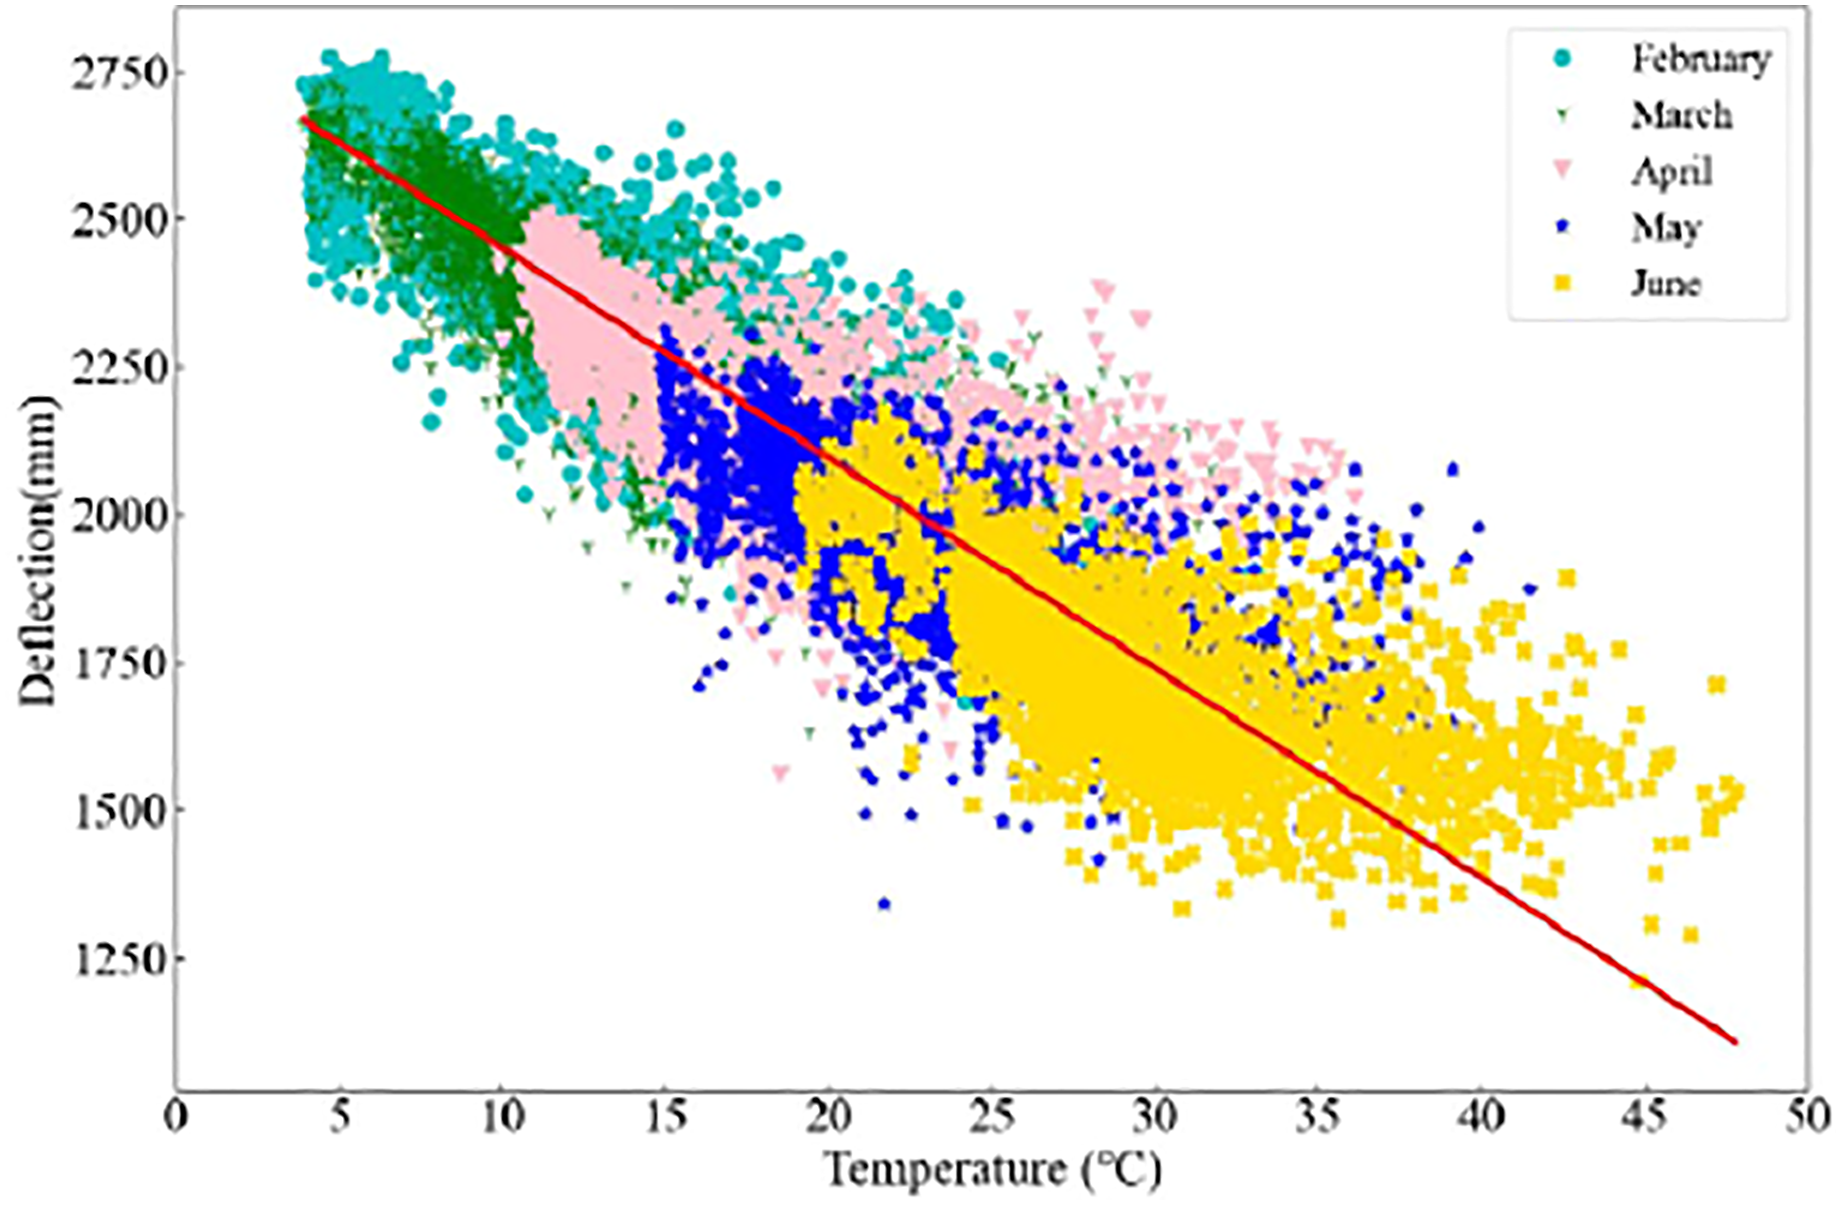
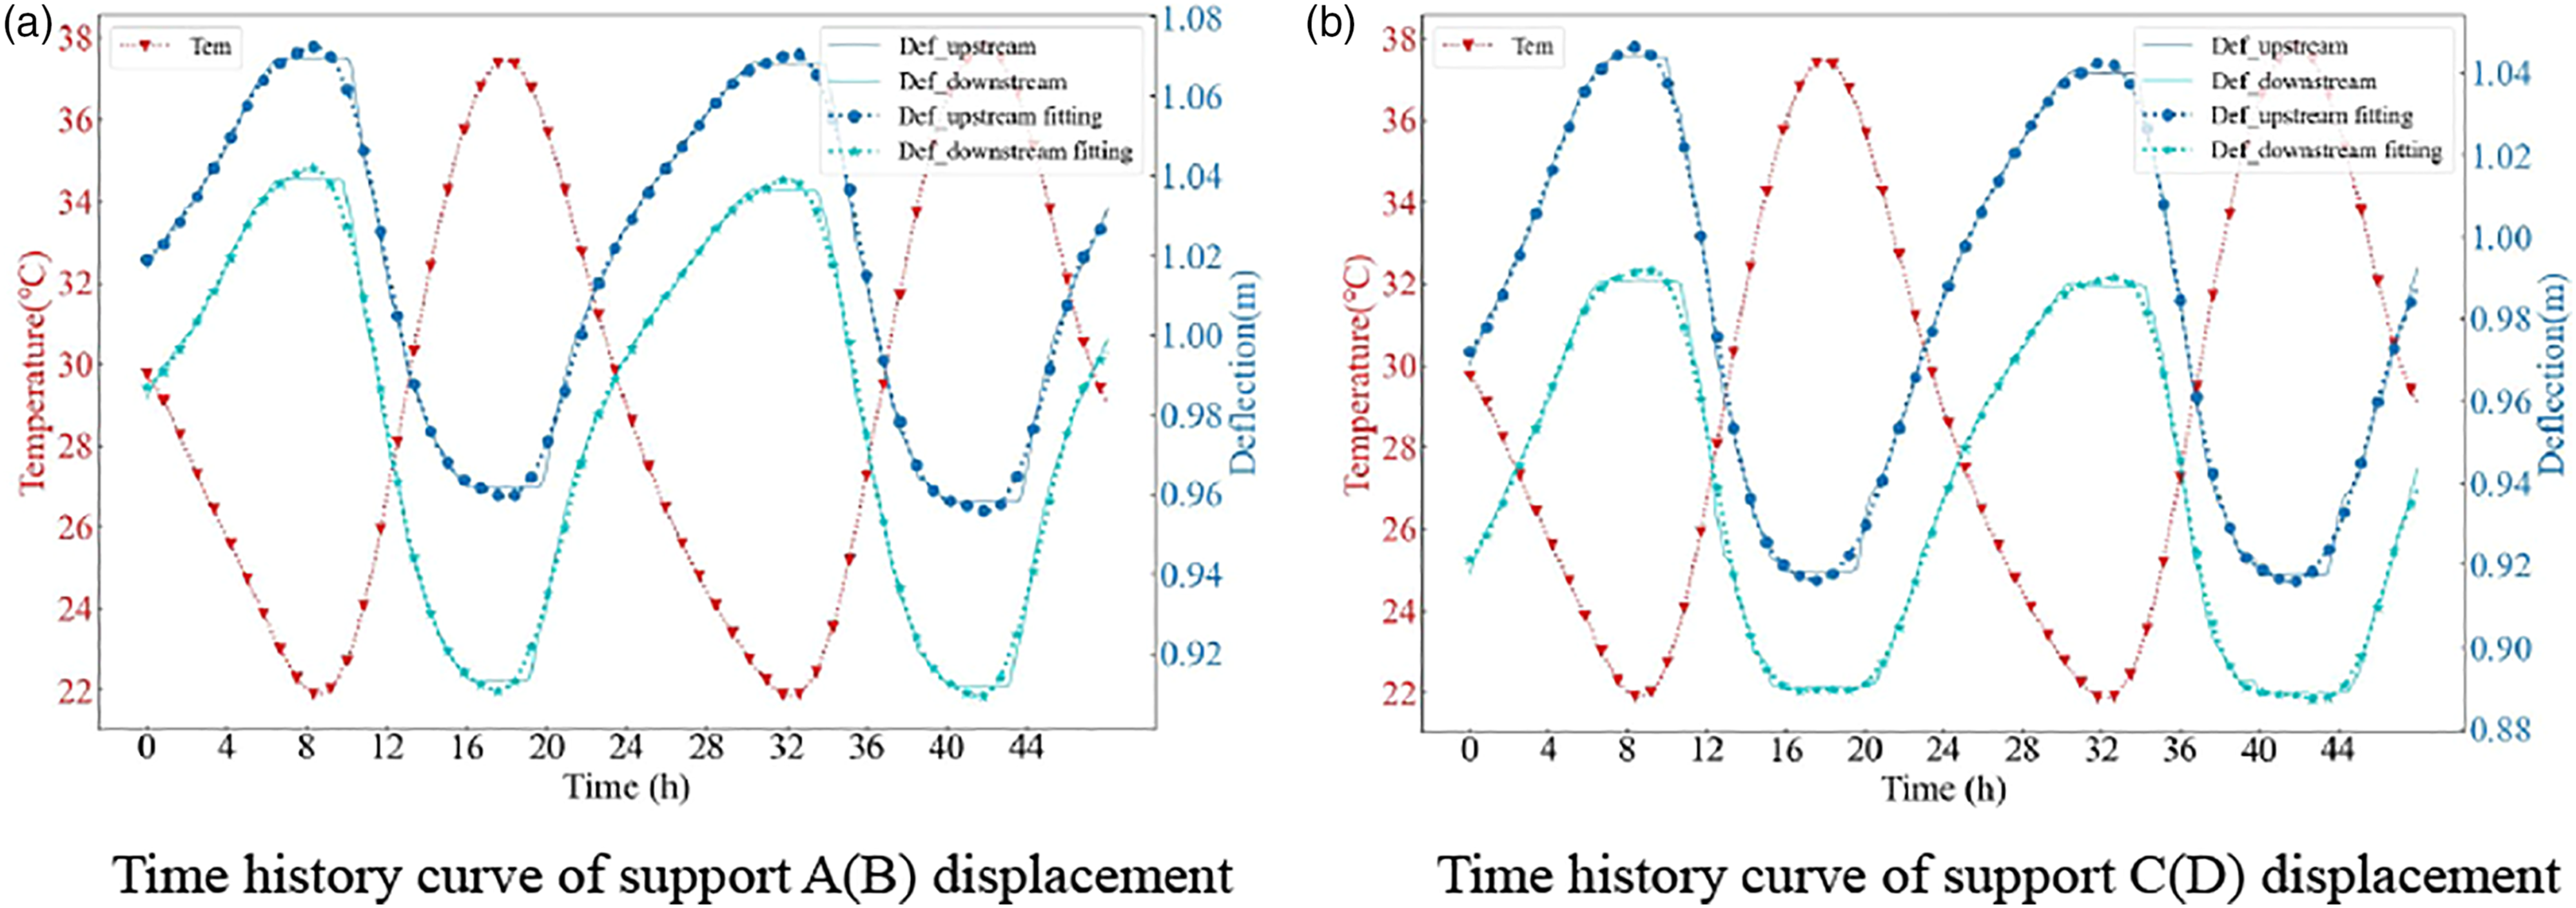
Regarding the bearing displacement monitoring, the magnetostrictive displacement meters sensors and damper arrangement on the location of support A (B) and C (D) are as shown in Figure 15. Figure 16 illustrates the bearing displacement curves and corresponding temperature fluctuations in 2 days (2021.05.01–2021.05.02). It is found that there is a strong negative correlation between bearing displacement and temperature change. At the same bearing end, the displacement of the upstream and downstream bearings is synchronous, and the bearings move slowly and cyclically with the continuous change of temperature. That is also the reason why the damper has a slip band as shown in Figure 15. Magnetostrictive sensors and damper arrangement. Variations of bearing displacement and temperature. (a) Time-history curve of support A(B) displacement. (b) Time-history curve of support C(D) displacement.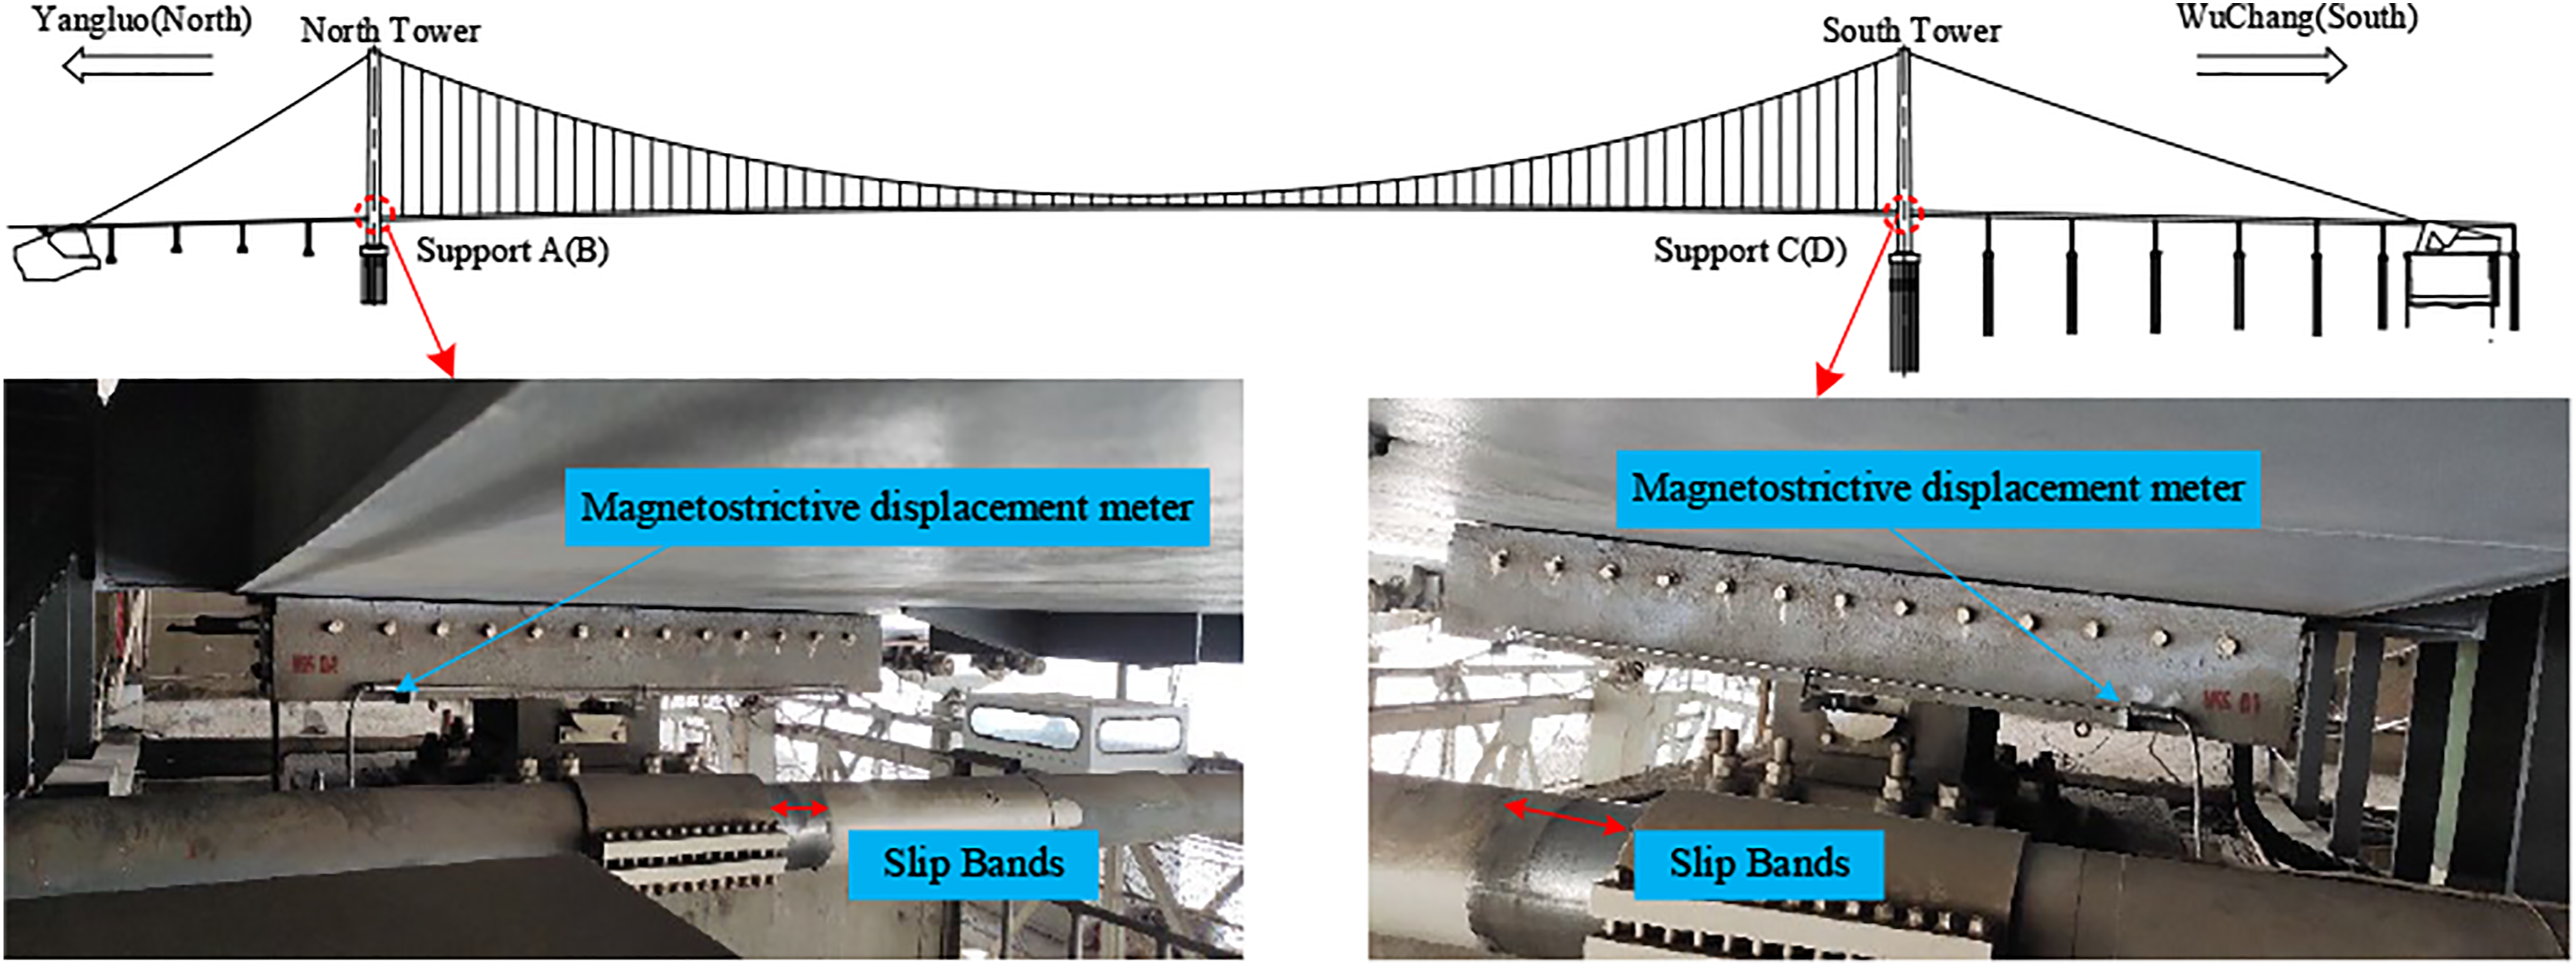
Then 5-month monitoring data from January 2021 to May 2021 are used as an example to demonstrate the correlation between bearing displacement and temperature as shown in Figure 17. It is found that there is a negative linear correlation between bearing displacement and temperature, and the displacement change rate of support A (B) and support C (D) with temperature is average 0.917 cm/°C and 1.139 cm/°C, respectively. Correlation between bearing displacement and temperature.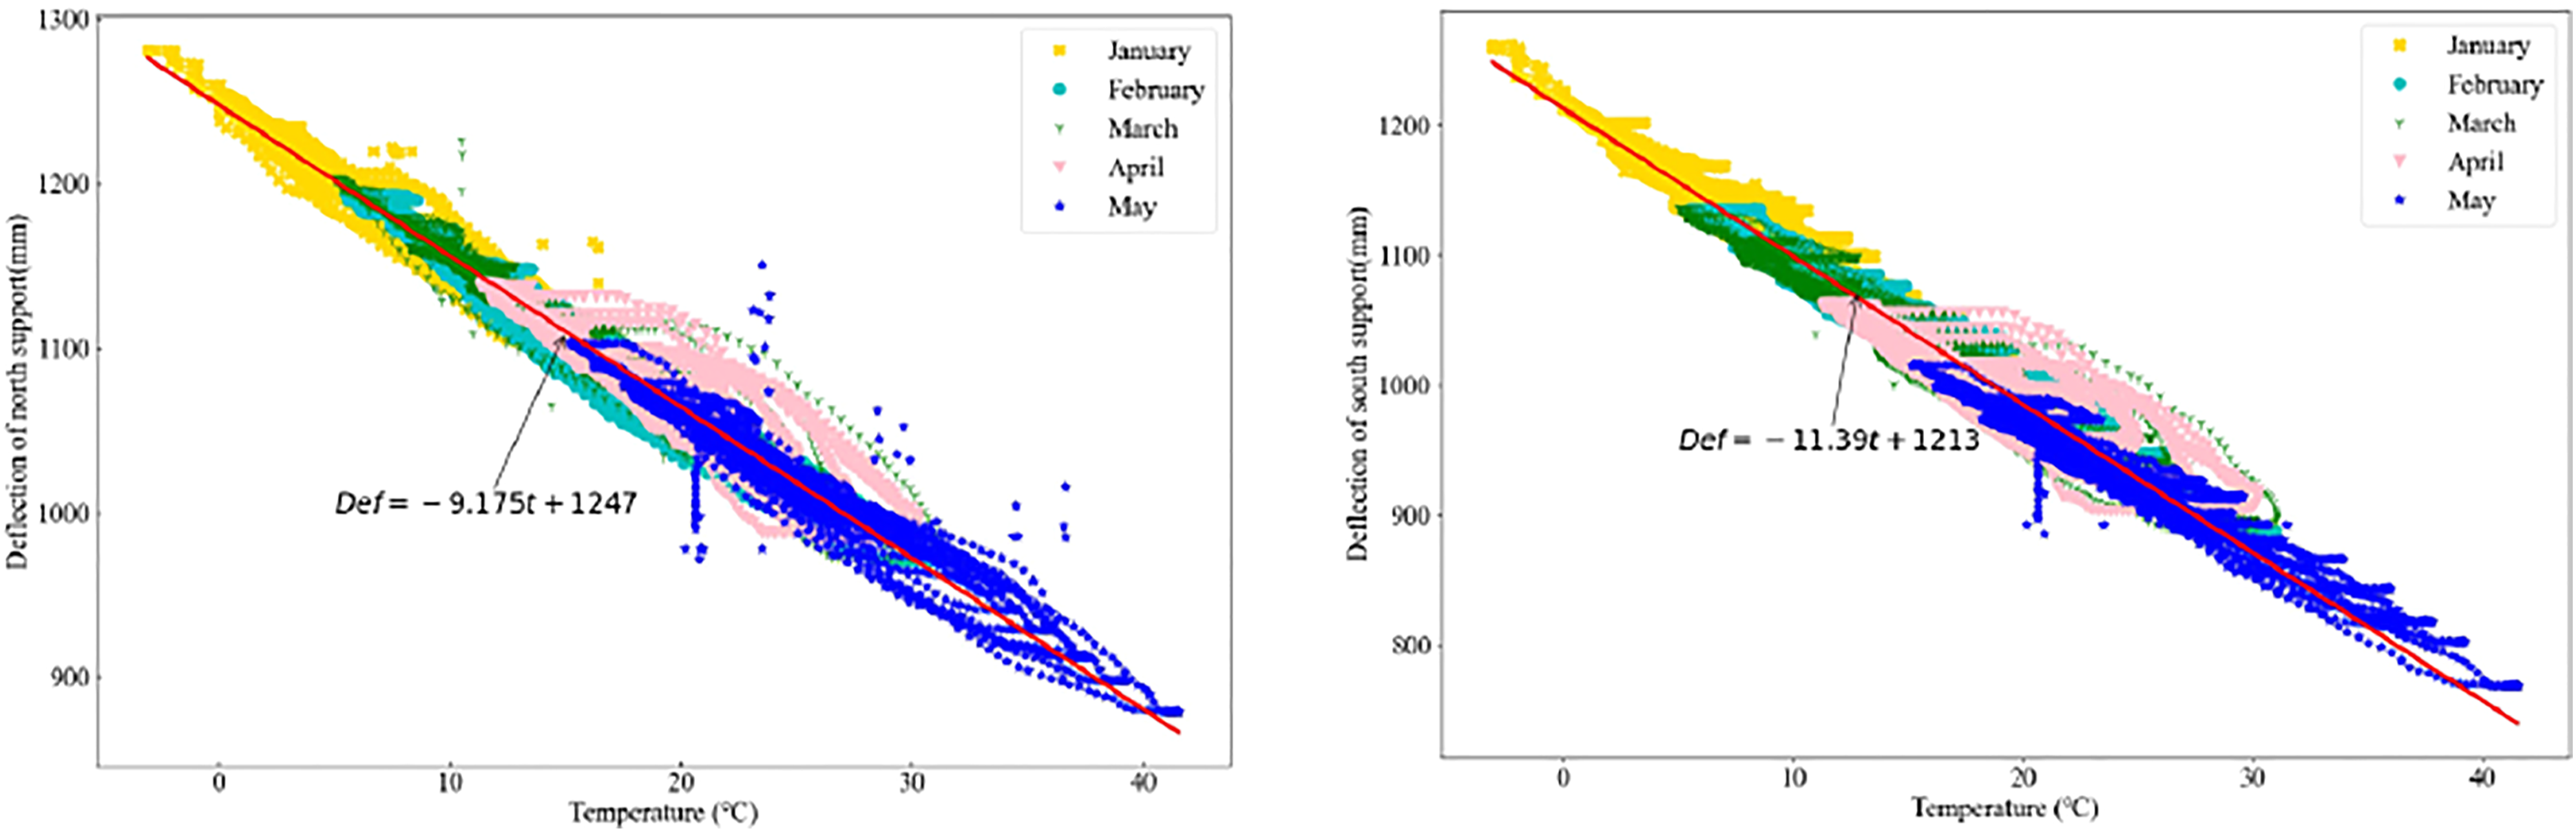
Cable and suspender force monitoring
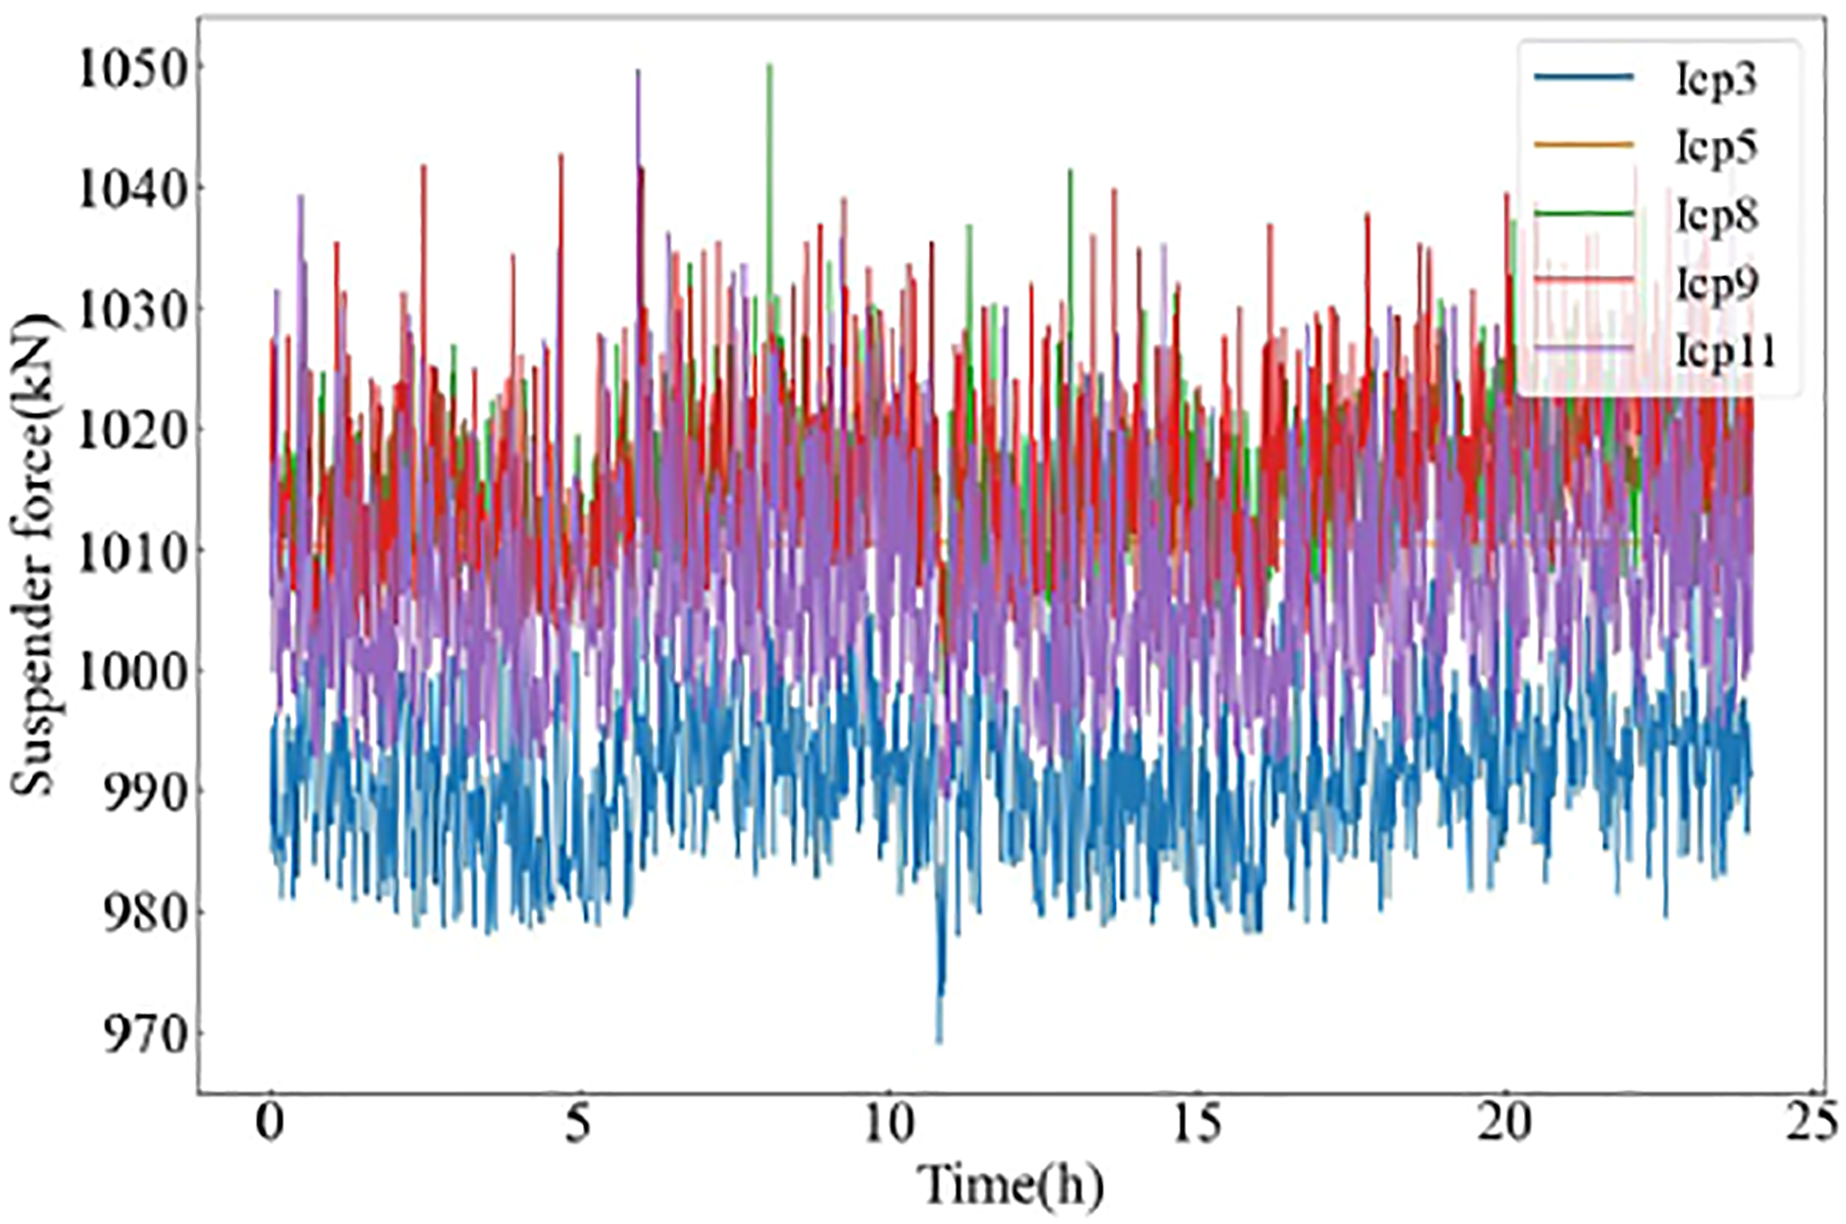
The main cable and suspenders are the important load-bearing structural components in suspension bridges. The force changes in both main cable and suspenders will affect the service state of the bridge (Fan et al., 2020). The suspender tension monitoring of ICP3, ICP5, ICP8, ICP9 and ICP11 is as shown in Figure 18. For 1 day continuous monitoring on 10 March 2021, those suspender force fluctuations are illustrated in Figure 19. At that time, the maximum temperature of the main cable is 17°C and the minimum temperature is 9.5°C. Measured suspenders. Suspender force fluctuation in 1 day.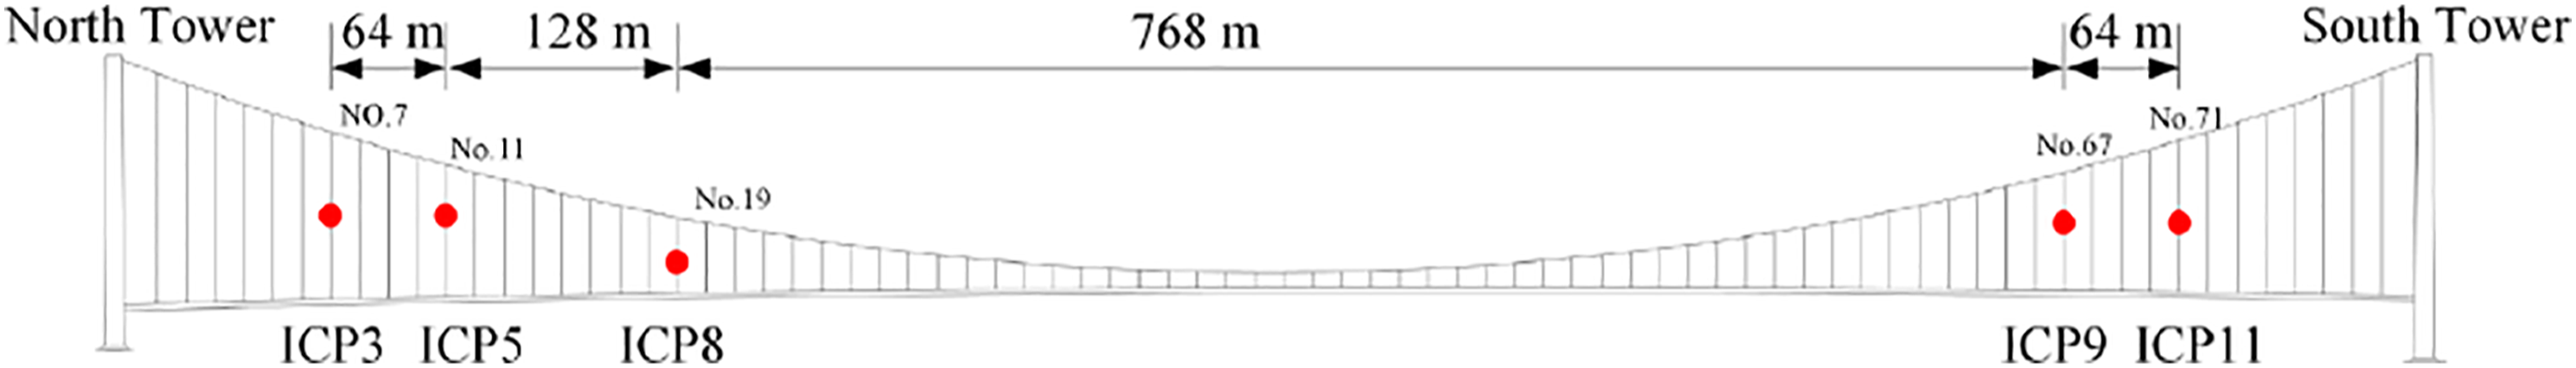
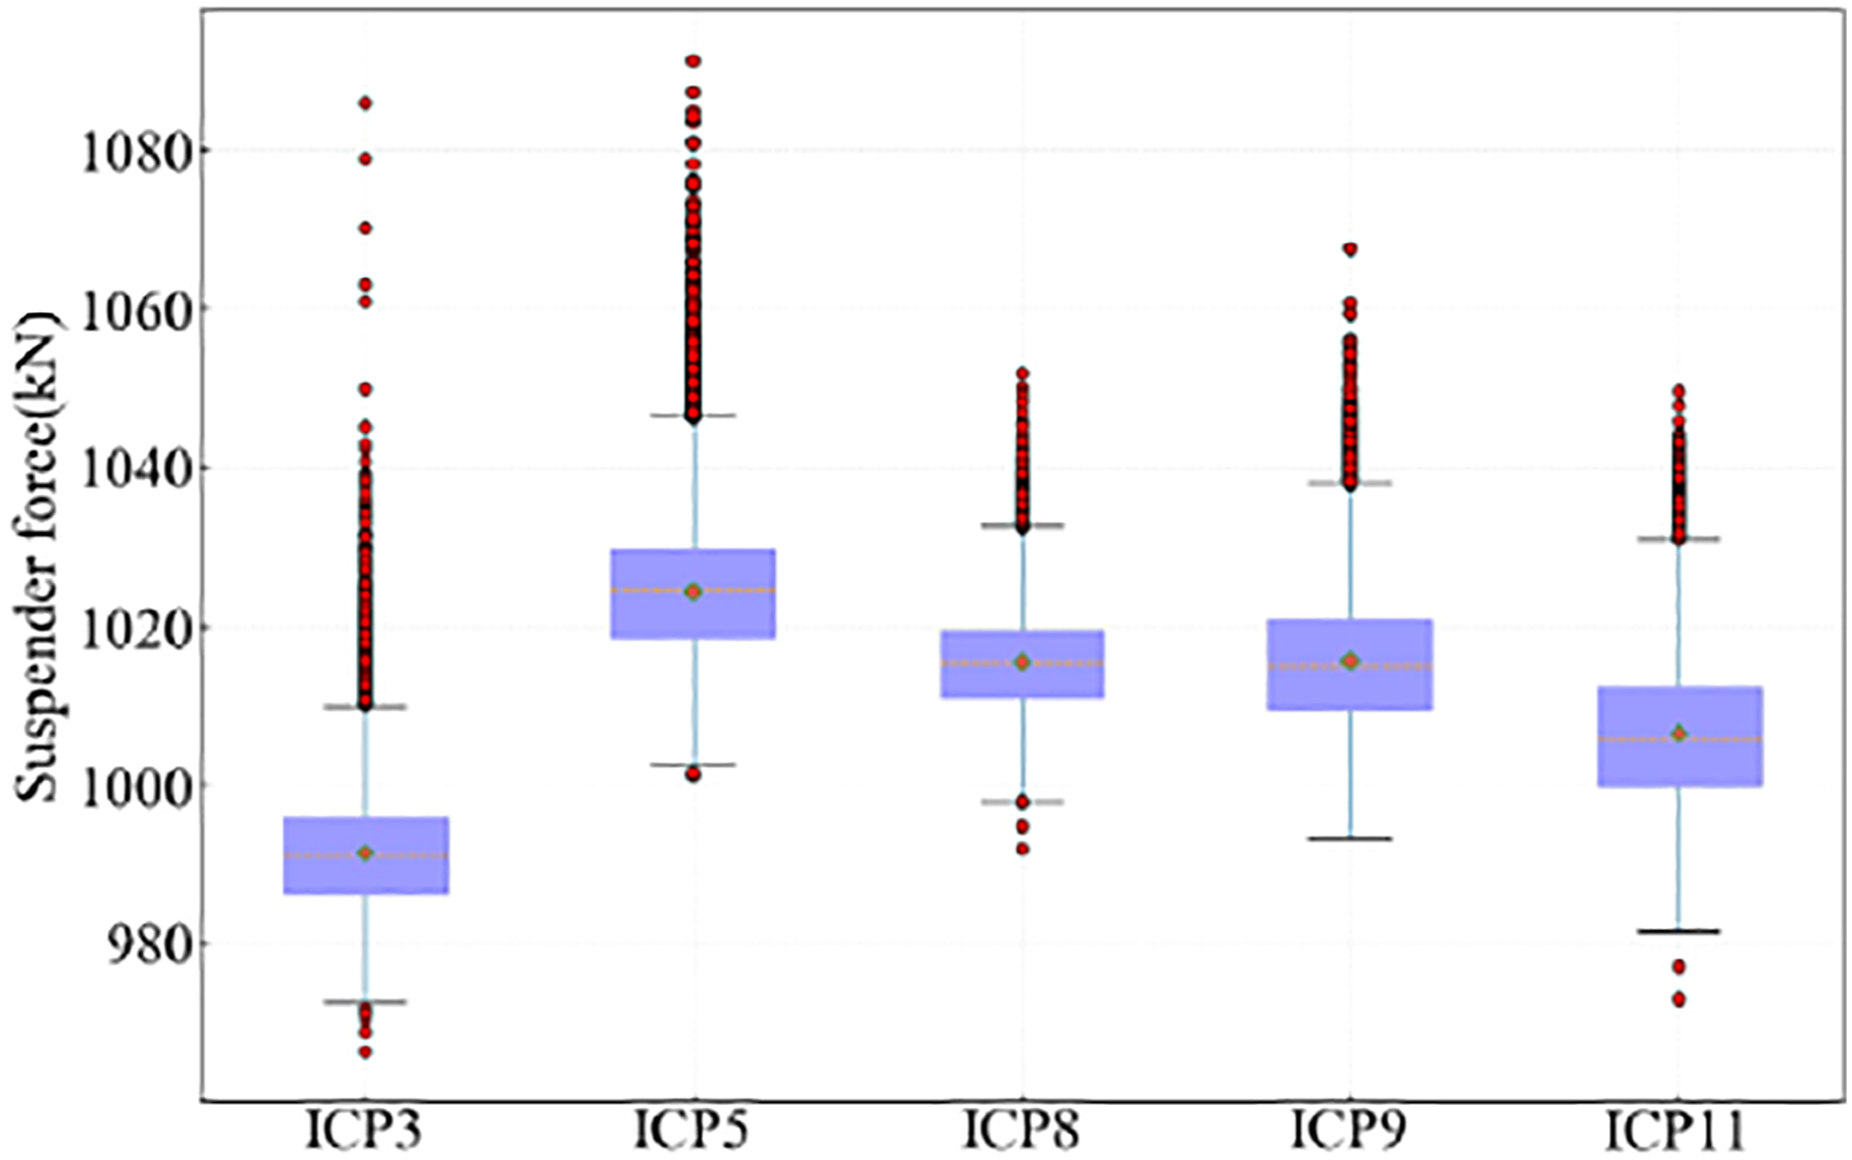
In order to further illustrate the influence of temperature on the suspender forces, ICP3 and ICP8 suspenders are randomly selected as an example. The scatter diagram of suspender forces with temperature from January to February in 2021 are drawn as shown in Figure 20. The results show that the Pearson correlation coefficient between temperature and suspender tension is low (0.05–0.16), which indicates that the suspender force is less affected by temperature. Again, 3-month monitoring data from January to March in 2021 are further used to demonstrate such force changes for Yangluo Yangtze River Bridge. The suspender force changes in these 3 months are shown in Figure 21. The corresponding statistical results of suspension forces in 3 months are listed in Table 3. It can be observed that the tension of each suspender is relatively concentrated, while the abnormal larger values mainly appear on the side of suspenders, which demonstrates that the suspender force distribution is right biased. The standard deviation (STD) reflects the dispersion of the value relative to the mean. According to the statistical results, the STD of suspender tension is small, which reveals that the probability of divergence and variation of suspender forces under normal operation is small. Correlation between environmental temperature and suspender forces. Histogram of suspender tension forces in 3-month. Statistical results of suspension forces (kN).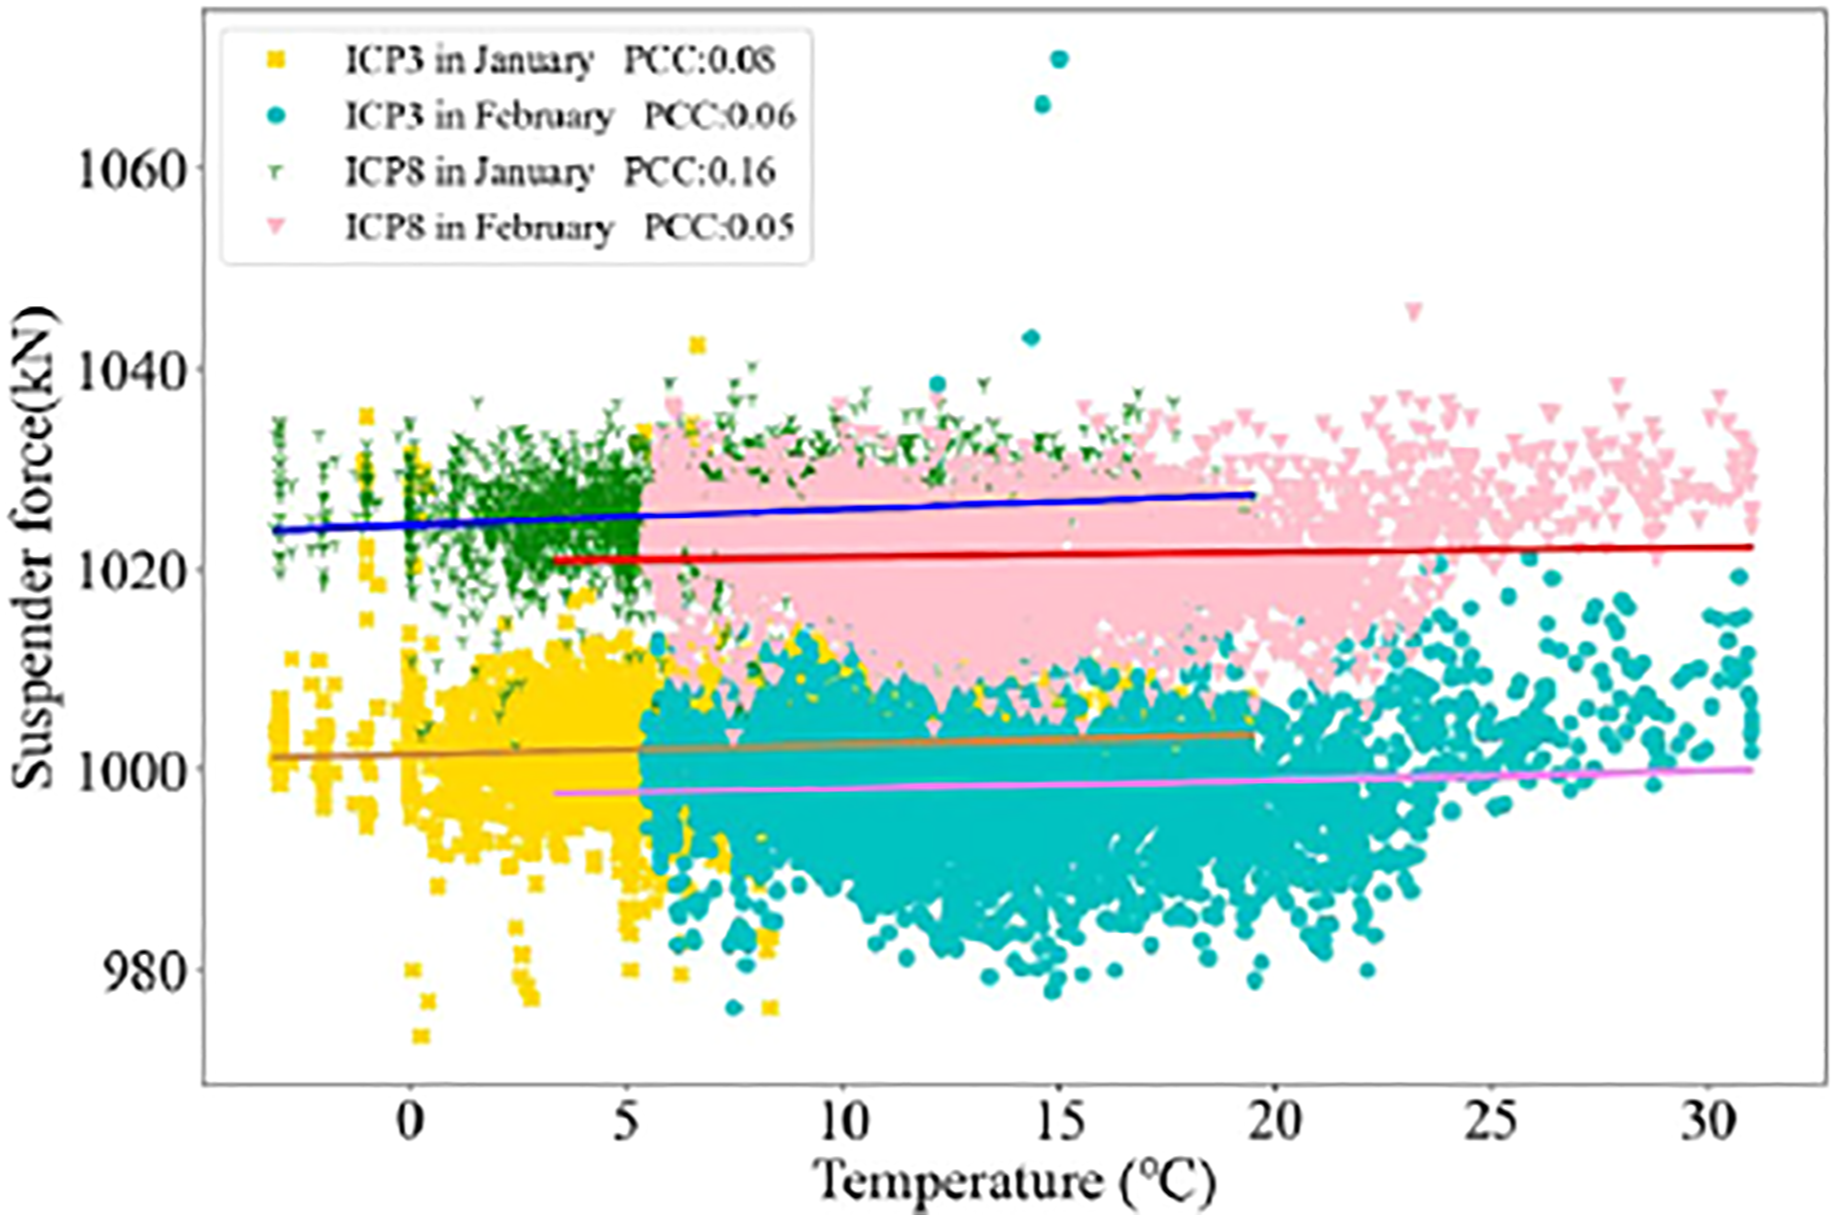

Strain monitoring
Through the strain monitoring of the control section of the main girder, the stress or strain distribution under various loads can be obtained, which provides a basis for structural damage identification, fatigue damage life evaluation and structural state evaluation (Tecchio et al., 2017; Li et al., 2012; Laflamme et al., 2016; Kaloop et al., 2016; Gunes et al., 2020; Bhalla and Kaur, 2018). The vibrating wire strain sensors and electricity resistance strain gauges implemented in the SHM system of Yangluo Yangtze River Bridge are used to monitor the strains or stresses of structural components (tower and steel box girder) under operational loadings such as wind, temperature, and traffic vehicles. For the main steel girder, the measuring points are distributed on the quartered section of the main beam (3 sections in total). Figure 22 is the time-history responses of strain of the midspan section on 26 July 2021. The corresponding temperature change is also given in that day. Strains and temperature of girder cross-section at mid-span in 1 day.
It can be seen that with the continuous change of temperature, the strain of each measuring point fluctuates up and down obviously, which shows a strong correlation with temperature. There is a negative correlation between top flange strains and temperature, while there is a positive correlation between bottom flange strains and temperature. Furthermore, when the temperature gradually decreases from 29.2°C to 27.5°C during 0:00 and 5:00 in that day, the strain gradually increases from 329.5 με to 365.2 με. When the temperature rises continuously to 38.2°C from 5: 00 to 15:00, the strain gradually decreased to 2.6 με.
Operational vibration monitoring
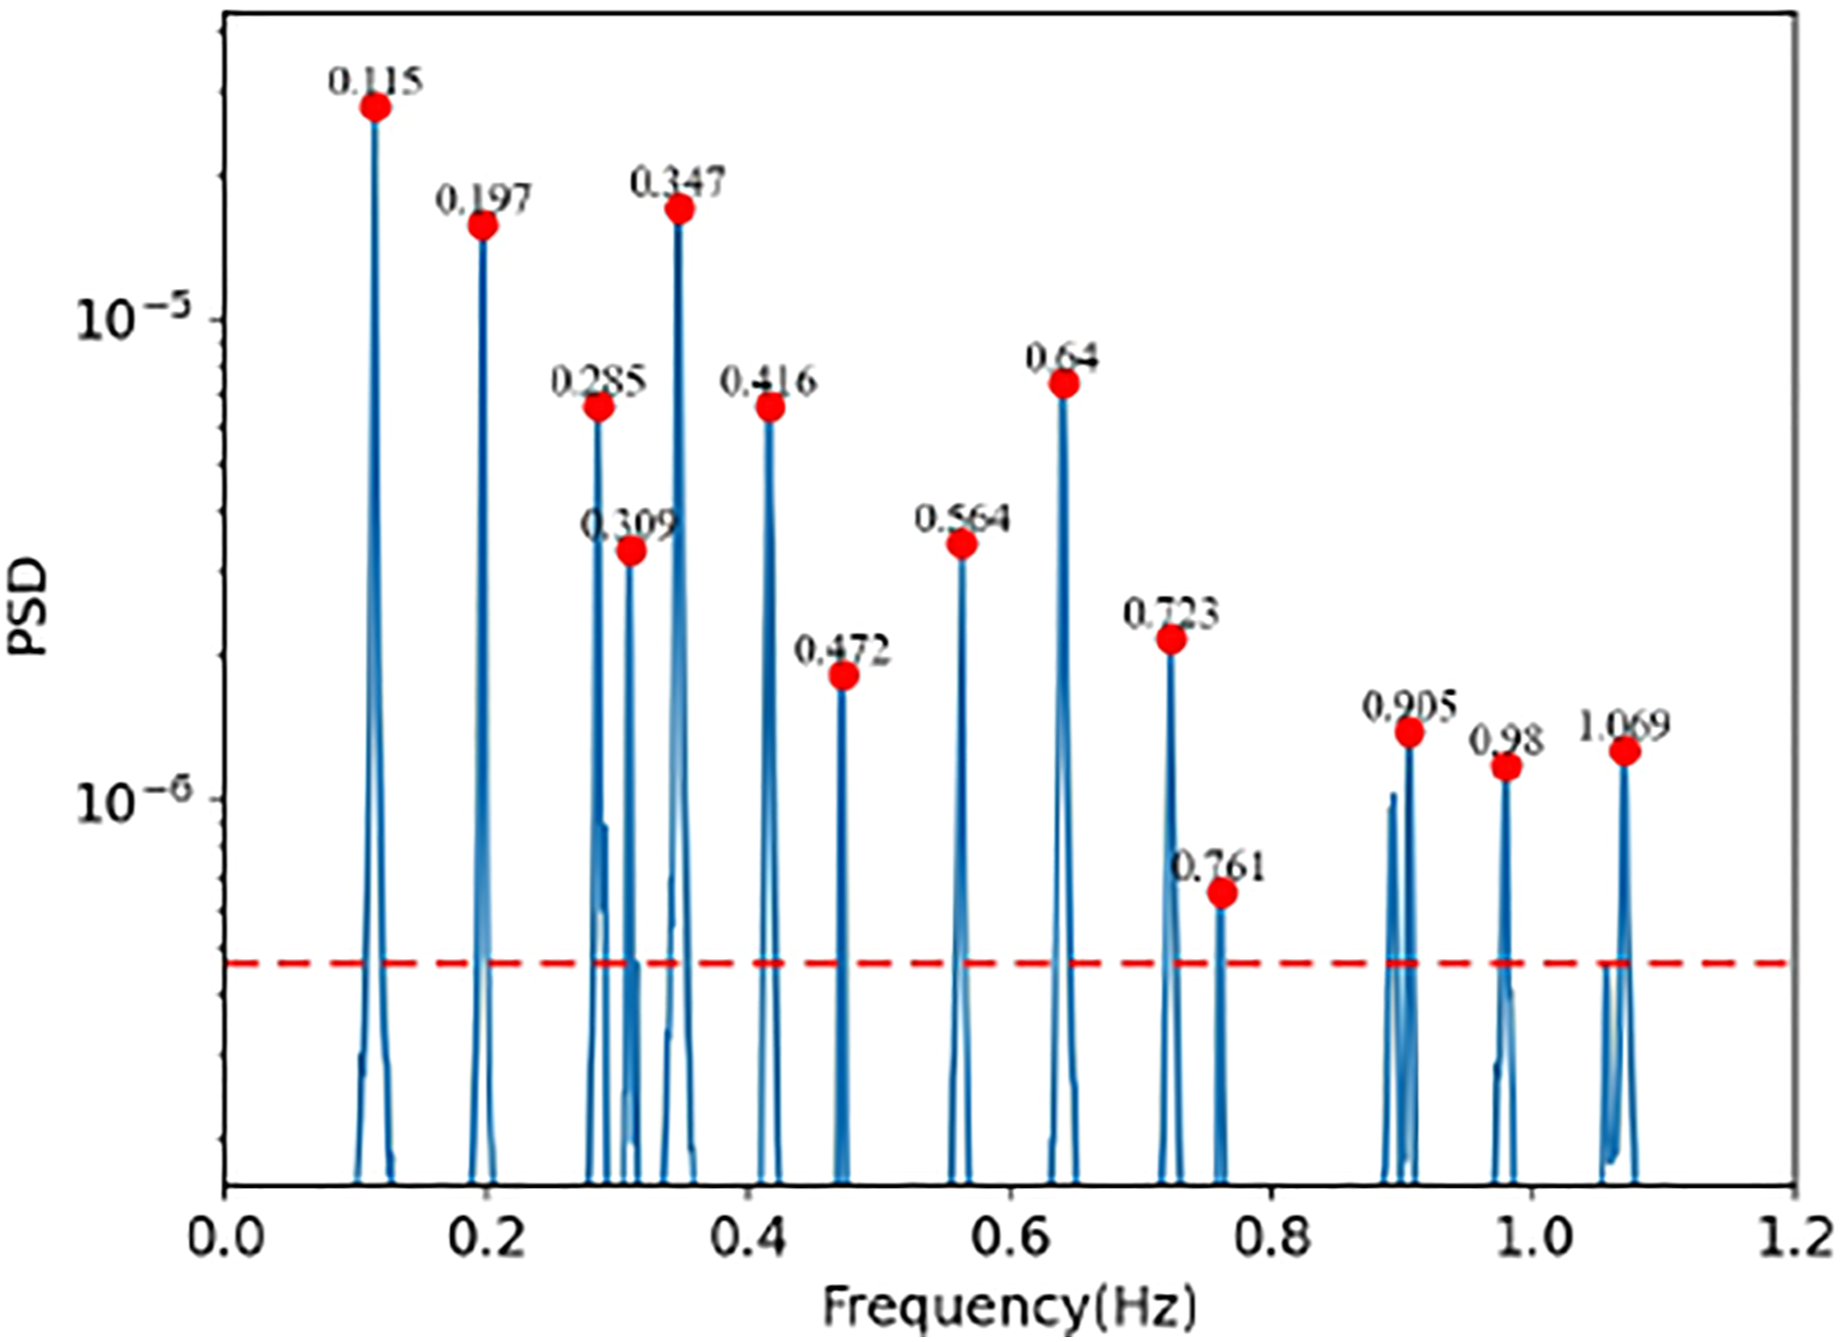
As mentioned above, a total of 14 triaxial accelerometers are installed to monitor the structural operational vibration. These operational vibration accelerations can be used to identify the structural dynamic properties such as natural frequencies, mode shapes, and damping ratios. The typical operational vibration acceleration in vertical direction of one quarter span is shown in Figure 23. It can be seen from the above analysis that temperature has a great impact on the deflection and strain of the bridge. Cao et al. (2021) found the natural frequencies are affected by vehicle parked different location of the bridge. To identify the modal parameters of the bridge, the acceleration data at the quarter span during 12:00–1:00 p.m. on 21 July 2021 is used. At that time, the traffic flow is small and temperature is relatively stable. The power spectral density of those acceleration time responses is shown in Figure 24 so that the natural frequencies of the bridge can be extracted accordingly. Typical vibration acceleration time-history. Power spectral density of accelerations.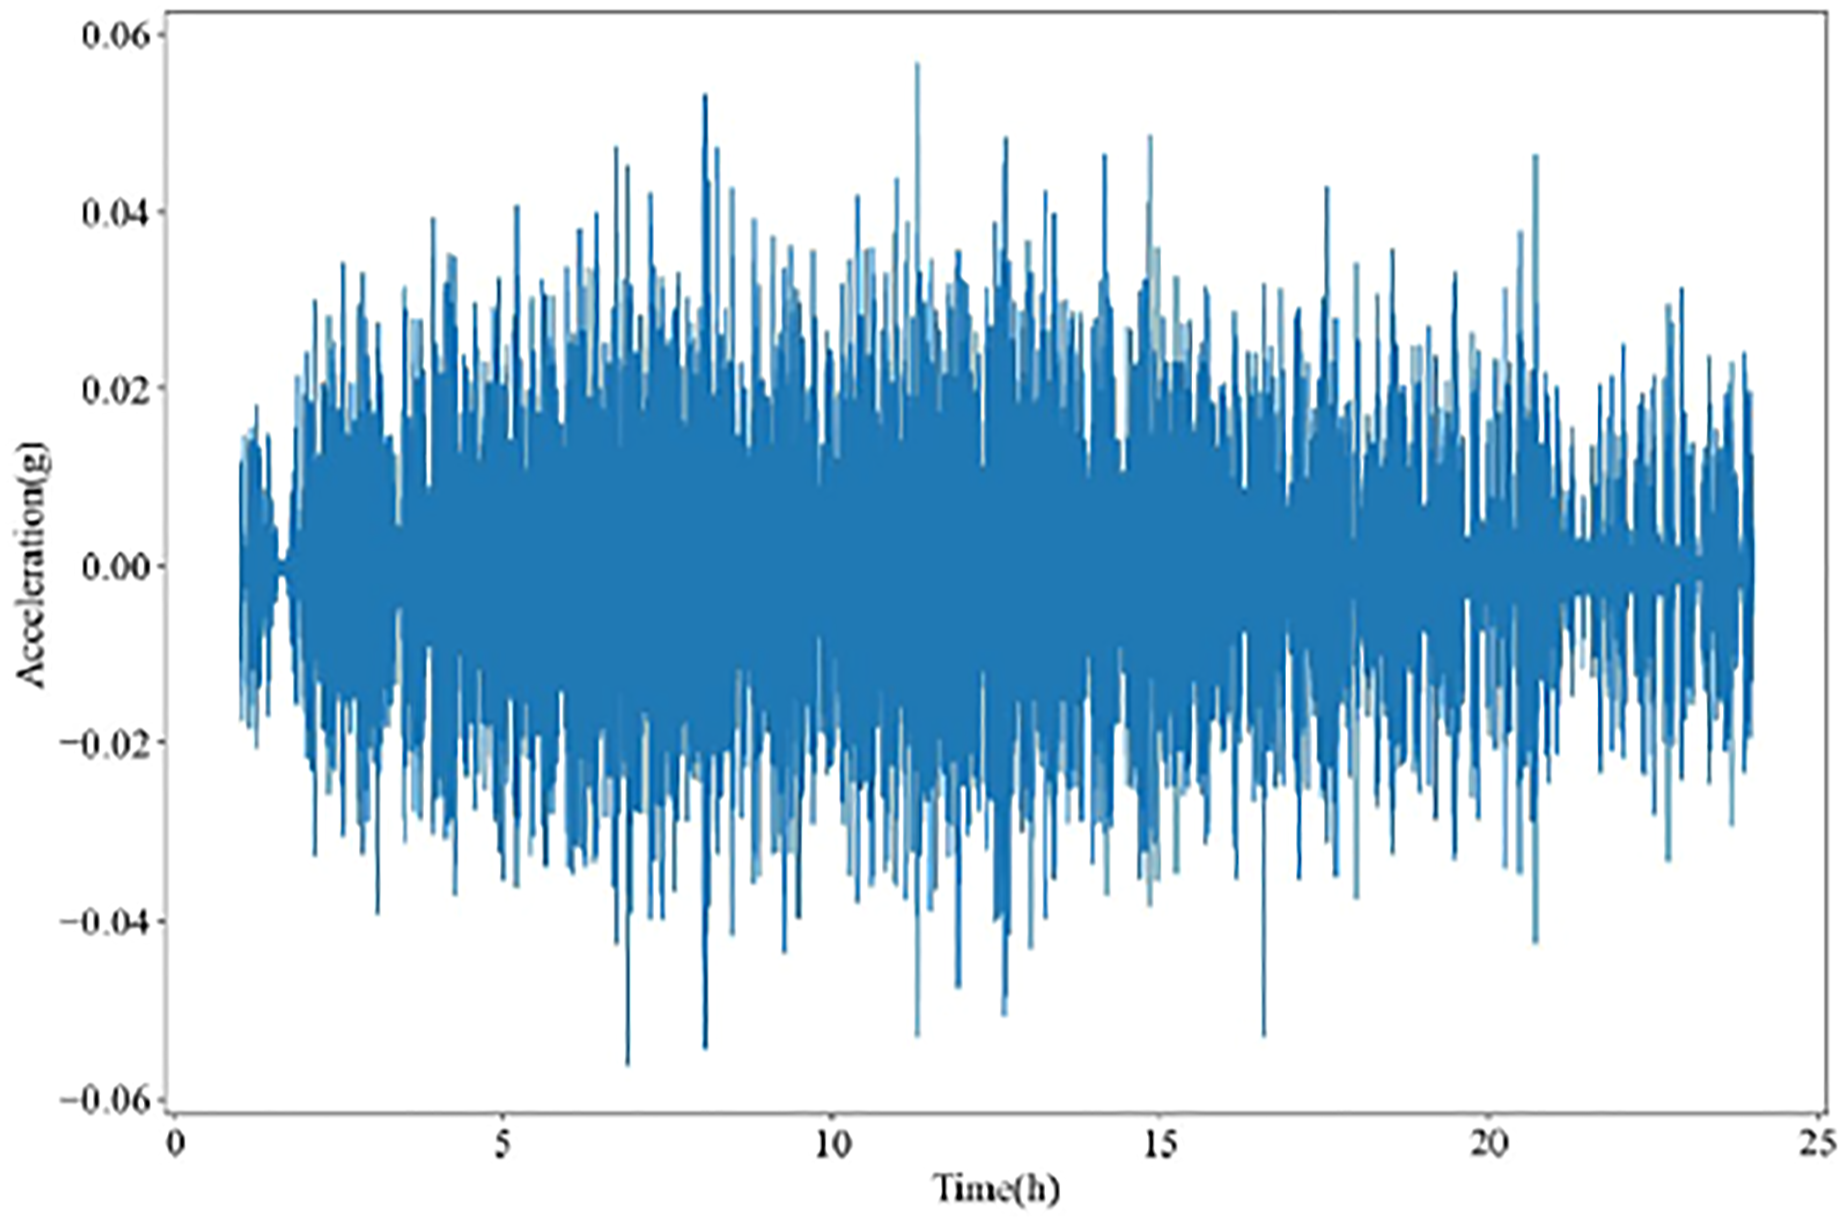
Calculated and identified modal parameters of Yangluo Yangtze River bridge.

Conclusions
In-service bridges are inevitably subjected to climate variation, corrosive environment, service loading, and extreme events such as earthquakes, strong wind loading and vessel collision. The SHM provides a real-time monitoring of various structural changes. Taking a long-term SHM of Yangluo Yangtze River Bridge as an example, this paper presented an implementation of SHM system on the bridge such as sensor layout, data acquisition strategy, and data transmission framework. The typical monitoring results of operational environments, wind loads, traffic loading, structural deformation, bearing displacements, structural strains, and operational vibration responses are demonstrated. The correlation of girder deflection and strain with temperature is presented. The data obtained from the SHM system are helpful to assist the bridge operational functions, performance assessment as well as management of ongoing bridge maintenance with routine inspections. This SHM system of Yangluo Yangtze River Bridge is continuously gathering data and monitoring the structural behavior. It is anticipated that the SHM system of Yangluo Yangtze River Bridge will provide either scientific or technological supports to the service comfort and safety evaluation of the bridge.
Footnotes
Declaration of conflicting interests
The author(s) declared no potential conflicts of interest with respect to the research, authorship, and/or publication of this article.
Funding
The author(s) disclosed receipt of the following financial support for the research, authorship, and/or publication of this article: The paper is supported by the National Natural Science Foundation of China under Grant No. 51778204 and Shenzhen Science and Technology Program under grant Nos. KQTD20180412181337494, ZDSYS20201020162400001 and GJHZ20200731095802007. Data are supplied by China Railway Major Bridge Engineering Group CO., LTD.