



Abstract
This paper presents fatigue behaviors and the stiffness degradation law of concrete continuous beams with external prestressed carbon fiber-reinforced polymer (CFRP) tendons. Three specimens were tested under fatigue loading, and the influence of different load levels on the stiffness degradation and fatigue life were studied, and it was found that the stiffness degradation of three test specimens exhibited a three-stage change rule, namely rapid decrease, stable degradation, and sharp decline, but there are obvious differences in the rate and amplitude of stiffness degradation. The load level has a significant influence on the fatigue life of the test specimens. An analytical model with load level considered was proposed to calculate the residual stiffness and predict the stiffness degradation, which is in good agreement with the test results. The model of stiffness degradation presents a possible solution for practical engineering applications of concrete continuous beams with externally prestressed CFRP tendons subjected to different fatigue loadings.
Introduction
It is widely known that prestressed concrete structures have been widely used in bridges, buildings, and ports, which can effectively improve the durability, stiffness, and crack resistance of the structure and balance the dead weight of structures (Aparicio et al., 2002; Mostafaei et al., 2011). The prestressing tendons with good mechanical properties are the premise to ensure the load-bearing capacity, and the failure of prestressing tendons may trigger overall structural failure. The traditional external prestressed steel strand is prone to corrosion under the influence of corrosive environment, which poses a certain threat to the durability of the concrete structures (Li and Yuan, 2013; Li et al., 2011). CFRP tendons have been widely used in ports, bridges, and other civil engineering structures due to their advantages of corrosion resistance, high strength, light weight, and fatigue resistance, which has a wide range of advantages in large-span, high fatigue, and strong corrosion environment, and is an ideal material to meet the durability requirements of external prestressing tendons (Triantafillou, 1998; Zhao and Zhang, 2007).
Current relevant research achievements have explored the structural performance of the concrete structures with externally prestressed CFRP plates under fatigue loads (Huang et al., 2013; Peng et al., 2016), and the test results indicated that under similar loads, the strain range and maximum strain of the reinforcing bars of beams with prestressed CFRP plates were significantly less than those of beams with non-prestressed CFRP plates. Abdelrahman et al. (1995) conducted fatigue tests on two externally prestressed CFRP reinforced concrete beams with lower fatigue load level and the results showed that the fatigue life of the test specimens could reach more than 2 million cycles, however, the change of the structural bearing capacity and stiffness were not obvious. Grace et al. (1998) conducted fatigue tests on four concrete double T-beams with externally prestressed CFRP tendons with the upper limit of fatigue load less than the cracking load of the specimen, and found that after 7 million cycles of fatigue loading, no obvious fatigue damage occurred in four test specimens, and the prestressing loss of externally prestressed CFRP tendons was small. Elrefai et al. (2012) showed that the fatigue failure of concrete structures with externally prestressed CFRP tendons was caused by the fatigue fracture of internal reinforcement, and increasing externally prestressed CFRP tendons could effectively reduce the stress of internal reinforcement.
All test specimens mentioned above are simply supported beams, however, there are few studies on continuous beams. Only Grace (2000) conducted the response of continuous CFRP prestressed concrete structures with double T-sections under fatigue load. However, the fatigue load of the specimen was lower than that of the practical engineering. In the current research on fatigue performance of the structures, the specific analysis in terms of the influence of different load levels on the fatigue performance of structures and the various stages of fatigue failure remains to be improved. Furthermore, residual stiffness approach has been successfully applied to fatigue damage prediction of the concrete structures under the constant fatigue loading (Wu and Yao, 2010; Wu et al., 2019). However, less attention has been paid to the fatigue damage of the structures under different fatigue loads. In view of this, it is of great significance to study the stiffness degradation law of the externally prestressed CFRP reinforced concrete structures under higher load levels.
Based on three test specimens with different load levels (i.e. 0.550, 0.614, and 0.702), this paper presents fatigue behaviors and the stiffness degradation law of concrete continuous beams with externally prestressed CFRP tendons. An analytical model with load level S considered is proposed to predict the stiffness degradation under different fatigue load, and the calculated results are verified by the test results.
Experimental program
Specimen design
Three concrete continuous beams with externally prestressed CFRP tendons (FB-1, FB-2, and FB-3) were designed to subject to fatigue loads, and the effects of load level on the fatigue performance of the specimens were studied. The dimension and reinforcement details were shown in Figure 1(a). To ensure steel yielding occurred firstly, followed by concrete crushing, and eventually by the rupture of CFRP tendons, the design equivalent reinforcement ratio ρ = (As + Apffu/fy)/(bh0) = 2.9%, where As and Ap were the area of the longitudinal reinforcement and CFRP tandons respectively, ffu was the ultimate tensile strength of CFRP tandons, fy was the yield strength of steel bars, b and h0 were the width of the specimens and the height of the effective compression zone, respectively. The prestressed degree PPR=Apfpe/(Apfpe+Asfy) = 0.407, where fpe was the designed effective prestress, and fpe= 900 MPa (Lan, 2002). Based on the material properties of specimens, the anchorages for CFRP tendons used in the specimen test were self-developed dedicated integral clip anchors, which was loaded by a through-core hydraulic jack. The test continuous beams with T-shaped cross-section were a total length of 6.7 m. Each beam was supported at mid-span to give a span length of 3.2 m. Each beam was 200 mm deep (high) and had a span-depth ratio of 16. Two deformed steel bars with 14-mm diameter were placed at the corner of the tension zone and four steel bars with 8-mm diameter in the compression zone. Steel stirrups with 8-mm diameter were spaced at 100 mm along the length of the beam. The same arrangement was used for three specimens, and the form of each section was shown in Figure 1(b). In order to give full play to the service efficiency of the prestressed CFRP tendons, six steering blocks were set on each side along the axis of the beam, among which the bending angle of CFRP tendons was set as 10°, so that the external CFRP tendons could form the folding line required by the design. The prestressing loss of external CFRP tendons was small, about 3% of the initial tensile stress.

Specimen design: (a) schematic of loading, (b) cross-sections, and (c) layout of displacement meter and concrete strain gauges.
Materials
Prestressed CFRP tendons (made of carbon fibers and vinyl ester resin) produced by Jiangsu Hengshen Co., LTD and deformed steel bars were used as tension reinforcement, and the properties were tested according to Chinese codes GB/T 228.1-2010 (2010) and GB/T 30022-2013 (2013). Three concrete continuous beams were fabricated by a one-time cast, as shown in Figure 2, and Ordinary Portland cement 42.5 was used. Cement, medium sand, Gravel, and water proportions were 1:1.07:2.18:0.43 by weight. The compressive strength of concrete was tested following Chinese code GB/T 50081-2016 (2016). The properties test results of steel bars and CFRP tandons were listed in Table 1, whereas that of the concrete of each specimen were listed in Table 2, and summary of the specimens was listed in Table 3.

Specimen casting: (a) wooden template and steel cage and (b) casting.
Properties of the steel bars and CFRP tandons.

Properties of the concrete of each specimen.

Summary of the specimens.

Test setup and instrumentation
The test fatigue load was mainly controlled by the force sensor on the 500-kN WB electro hydraulic servo fatigue testing machine, as shown in Figure 3. The AB span of continuous beam maintained dead load P1 = 40 kN, while the BC span was imposed fatigue load with the actuator. The fatigue test adopted the loading method of sine wave with equal amplitude, and the loading frequency f of fatigue load was 5 Hz. Before loading, the strain on the concrete and each tension bars (i.e. the steel bars and prestressed CFRP tendons) was obtained by strain gauges distributed in control sections I, III, and V. The displacement meters were installed to measure the deflection, as shown in Figure 1(c).

Fatigue test setup.
Loading procedures
Before fatigue loading, a static load-controlled test was conducted to 15 kN, and then the specimens were unloaded to 0 kN to test the reliability of instruments and devices. Thereafter, fatigue load with a frequency of 5 Hz was performed according to the loading procedure shown in Figure 4, where the upper limit of fatigue load of specimens FB-1, FB-2, and FB-3 was 62.7, 70, and 80 kN, respectively. Defining the load level S = Pi,max/Pu, where Pi,max was upper limit of fatigue load of the ith test specimen; Pu was ultimate static load (Pu = 114 kN) obtained by static load test, and the lower limit of fatigue load was set as 15 kN (0.13 Pu), which was used in the literature (Grace, 2000). Therefore, the load level S of three test specimens was 0.550, 0.614, and 0.702, respectively. The fatigue tests were stopped with the failure of specimens, and fatigue life was obtained.

Schematic diagram of the loading procedure.
The loading process was conducted in four stages: pre-loading, first, second static loading, and formal fatigue loading, waiting for 3 minutes after each loading and unloading stage, and read the data after stabilization.
Test results and discussions
Failure modes
After fatigue tests, the concrete in the tension zone was chiseled and the failure modes of steel bars were observed, as shown in Figure 5. With the increase of load cycles, all test specimens started with fatigue fracture of internal steel bars in control section V (see Figure 1). This may be attributed to the fact that the AB span was a dead load, while the BC span was a fatigue load. Compared with other sections on the continuous beam, the bending moment at section V was higher, and the failure gradually occurred under fatigue load, resulting in a abrupt increase in deflection and crack width. Therefore, the fatigue fracture of the first steel bar was regarded as the symbol of fatigue failure for the test specimens, and the failure modes of three test specimens were basically consistent: When failure occurred, the fatigue fracture of the steel bars occurred at the maximum crack width of the specimen. However, no obvious fatigue damage of the prestressed CFRP tendons and the concrete in the compression zone can be observed. Among them, when the specimen FB-1 failed, one of the steel bars completely fractured, and the rest partially fractured. Meanwhile, the cracks at the bottom of the tensile zone spread continually. When specimen FB-2 failed, the damage degree was obviously greater than that of specimen FB-1 due to higher load level, whereas the failure mode of steel bars was similar to that of specimen FB-1. Among three test specimens, FB-3 showed the greatest degree of damage. The stress of steel bars, externally prestressed CFRP tendons in section V and the strain on the concrete upper surface of the specimens were shown in Figure 6. It could be noted that the stress of the externally prestressed CFRP tendons and steel bars at section V of three test specimens exhibited a three-stage change rule, namely rapid increase, stable change, and sharp increase with the number of load cycles, and the stress of externally prestressed CFRP tendons was obviously higher than that of steel bars. Meanwhile, the compressive strain of concrete on the upper surface of the compression zone also showed a three-stage change rule. However, the concrete strain in three test specimens decreased in varying degrees at the third stage due to the internal force redistribution of the test specimens (Triantafillou, 1998; Zhao and Zhang, 2007). The fatigue life of the specimens FB-1, FB-2, and FB-3 were 2,236,756 cycles, 1,024,317 cycles, and 217,770 cycles, respectively, as shown in Table 3. It could be inferred that the fatigue life decreased as the load level increased from 0.550 to 0.702.

Failure modes of test specimens: (a) FB-1, (b) FB-2, and (c) FB-3.

Stress and strain in section V: (a) stress of steel bars and CFRP tendons and (b) strain on the concrete upper surface.
Moment and deflection
Figure 7 showed the change rule of bending moment and deflection of three test specimens in section V under the various load levels. It could be seen that the initial deflection of specimens FB-1, FB-2 and FB-3 increased in turn in the initial stage, which was mainly due to the influence of load level differences. Furthermore, the change rule of section V deflection of three test specimens with loading cycles was basically consistent. The deflection increased rapidly in the range of 10% of cycle ratio (i.e. the ratio of the number of cycle n to fatigue life N) due to a rapid decline in stiffness, and then steadily increased in the range of 10%–85% of the cycle ratio. When the specimens approached failure, the deflection of section V suddenly increased. Compared with the specimens FB-1 and FB-2, specimen FB-3 showed larger deflection when fatigue failure. In addition, the variation law of bending moment with the number of loading cycles was contrary to deflection. From Figure 7 it could also be shown that there were some differences in stiffness degradation law of test specimens under various load levels. Consequently, it was necessary to study the stiffness degradation laws of specimens with load level considered.

Moment and deflection in section V of each specimen versus the number of load cycles: (a) moment and (b) deflection.
Specimen stiffness degradation law under fatigue load
Stiffness degradation and fatigue life of specimens
The stress of externally prestressed CFRP tendons gradually increases with loading cycles under fatigue load. The different stress distribution of each section and the non-synchronous degradation of material properties lead to the non-uniform degradation of the stiffness of each section along the beam length. Thus, the relative stiffness between cross sections is changed. According to the change rule of bending moment and curvature of section V obtained from the test data, the stiffness of the specimen can be given by equation (1). The curve of the stiffness in terms of each specimen versus the number of loading cycles under different load levels is shown in Figure 8.

Stiffness degradation of test specimens versus the number of load cycles.

where Bi denotes the stiffness of the test specimens, Mi is the bending moment and ϕi is the curvature of the section V after the i-th cycle.
It can be seen from Figure 8 that the stiffness degradation of three specimens presents a three-stage change rule, namely rapid decrease, stable degradation, and sharp decline. However, significant differences in the rate and amplitude of stiffness degradation can be observed. There are some noticeable characteristics as follows. Stage I: The stiffness of this stage degrades rapidly and unsteadily, and the number of load cycles accounts for about 1%–10% of the fatigue life. That is, the cycle ratio (n/N) is between 1% and 10%, in which specimen FB-1 is the smallest (approximately 2%), whereas specimen FB-2 is the largest (approximately 9%). Stage II: after a certain number of loading cycles, the stiffness of each specimen is basically linearly related to the number of load cycles due to the gradual stability of the physical and mechanical properties of the specimens, and the proportion in this stage is more than 80%. Stage III: when the specimen approaches failure, the stiffness suddenly decreases, and the proportion of specimens in this stage is all less than 15%. According to the fatigue test of the three specimens, the test results under fatigue load are summarized in Table 4. In order to explain the relationship between the fatigue load and fatigue life of specimens more clearly, the fatigue life of the specimen is calculated according to ten thousand cycles.
Summary of the test results under fatigue loading.

Table 4 shows that the load level has a significant influence on the fatigue life of the test specimens. When the load level increases from 0.550 to 0.702, the fatigue life of the test specimens decreases from 223.7 to 21.8 ten thousand cycles. That is to say, when the load level increases by 28%, the fatigue life of the test specimen decreases by 90.2%, indicating that the increase of the load level will lead to a significantly decrease in the fatigue life of the specimen, and the impact of the load level cannot be ignored in practical engineering. Furthermore, the regression curves in terms of the fatigue life N and its logarithm (lgN) versus the load level S and its logarithm (lgS) of the three specimens in the range of 0.50–0.75 are shown in Figure 9(a) and (b) respectively, which can be expressed as equation (2).

Fatigue life versus the load level of three test specimens: (a) N-S and (b) lgN-lgS.

In addition, to facilitate the analysis, two critical points (cp1 and cp2) are introduced, where cp1 is the point corresponding to the regression curve when the fatigue life reaches 2 million cycles, and the load level Scp1 is 0.563;cp2 is calculated by using the intersection method of tangent bisector, angular bisector and curve according to the trend of the regression curve, and the corresponding number of load cycles Ncp2 is 76 ten thousand cycles, the load level Scp2 is 0.620. Therefore, the load level in the range of 0.50–0.75 can be divided into three different areas. Area ①: Load level S = 0.500–0.563, corresponding fatigue life is not less than 2 million cycles; Area ②: Load level S = 0.563–0.620, the fatigue life of the test specimens changes steadily with the increase of the load level. Area ③: When the load level S = 0.620–0.750, with the increase of the load level, the fatigue life decline rate of the test specimens increases rapidly, which is not easy to control and more prone to fatigue failure.
Three stage change rule of stiffness degradation under fatigue load
It is highlighted that the number of load cycles and cycle ratio corresponding to each stage of stiffness degradation (i.e. stage I, II, and III) are significantly different. In detail, the average cycle ratio of three specimens are 89% in stage I and II, whereas stage III is 11%. In stage I, the cyclic ratios of specimens FB-1 and FB-3 increase from 2% to 5%. However, the corresponding number of loading cycles decreases from 4.46 to 1.96 ten thousand cycles. For stage III, the cycle ratios of specimens FB-1, FB-2, and FB-3 are not significantly different (approximately 15%, 6%, and 12%, respectively). However, there are significant differences in the number of load cycles. In detail, for specimen FB-1, the number of loading cycles is 33.55 ten thousand cycles, whereas that of specimens FB-2 and FB-3 are only 6.1 and 1.7 ten thousand cycles, respectively. With the increase of load level the number of load cycles corresponding to stage III changes significantly. The fitting curve of the number of load cycles in stage III versus the load level S is shown in Figure 10. Similarly, the change rule of stage I and III also appears in stage II for all specimens, indicating that with the increase of the load level, the number of load cycles of stiffness degradation in each stage decreases and the decline amplitude increases sharply.
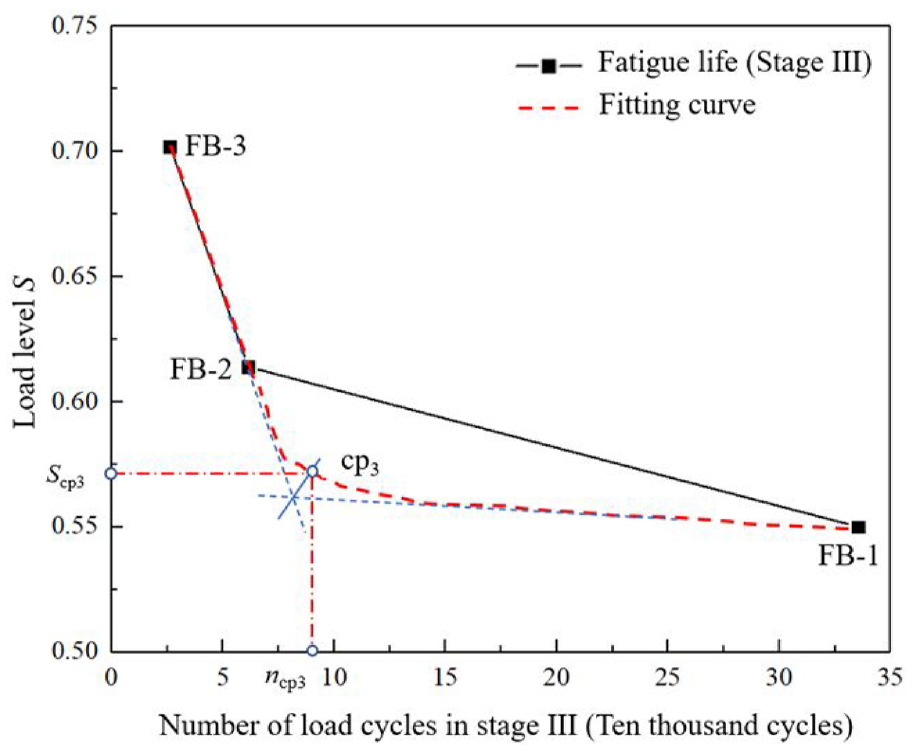
Load level S versus the number of load cycles n in stage III.
From Figure 10 it can be seen that, as the load level increases, the number of cycles in stage III decreases significantly. Obviously, the load level Scp3 (0.572) in Figure 10 is lower than that of Scp2 (0.620) in Figure 9, indicating that the number of load cycles of stage III are more susceptible to load level than stage I and II. Consequently, as the key stage of fatigue failure, stage III is not easy to control. It is of great significance to take reasonable measures to effectively predict the fatigue behavior of the structure and prevent the load cycles of the specimen from entering the stage III of stiffness degradation if the stiffness damage in stage I and II can be considered.
Specimen stiffness degradation mathematical model under different load levels
Stiffness degradation mathematical model
According to literature (Guo et al., 2016), a stiffness damage index model characterizing the law of stiffness degradation is established, as shown in equation (3).

where D is the stiffness damage index, which is defined by stiffness, and D ∈ [0,1]; Bn is the residual stiffness under various applied load level S after nth cycle; B0 is the initial stiffness of the specimen; BN is the failure stiffness after Nth cycle.
Under a given load level, the curve in terms of stiffness damage index (D) versus the cycle ratio (n/N) for three test specimens is shown in Figure 11. With increase of the cycle ratio (n/N), the stiffness damage index (D) also presents a three-stage change rule, which is consistent with the stiffness degradation shown in Figure 8. It can be seen from Figure 11 that, under the same cycle ratio during the initial cycles, the stiffness damage index (D) decreases with the increase of load level S. The maximum value is reached when the load level is 0.550, which is mainly attributed to that the lower the load level S is, the longer the corresponding fatigue life N is. Therefore, the more load cycles the test specimen with lower load level experiences when the cycle ratio is the same. For instance, when the cycle ratio n/N = 0.1, load level S = 0.550, 0.614, and 0.702 correspond to the number of cycles n = 2.23, 1.02, and 0.21 ten thousand cycles, respectively. Although the load level S = 0.702 is relatively high, the number of load cycles experienced by the specimen at this stage dominates the contribution to the stiffness damage of the specimen. Therefore, the stiffness degradation and fatigue damage of the specimen FB-1 is more obvious. However, when the cycle ratio (n/N) approaches to 0.8, the corresponding stiffness damage index D of specimen FB-3 is gradually higher than that of specimen FB-2, and the difference between the three test specimens gradually narrowed (i.e., the spacing S1 > S2 > S3), indicating that the contribution of load level S to the stiffness degradation of specimen increases with the cycle ratio.
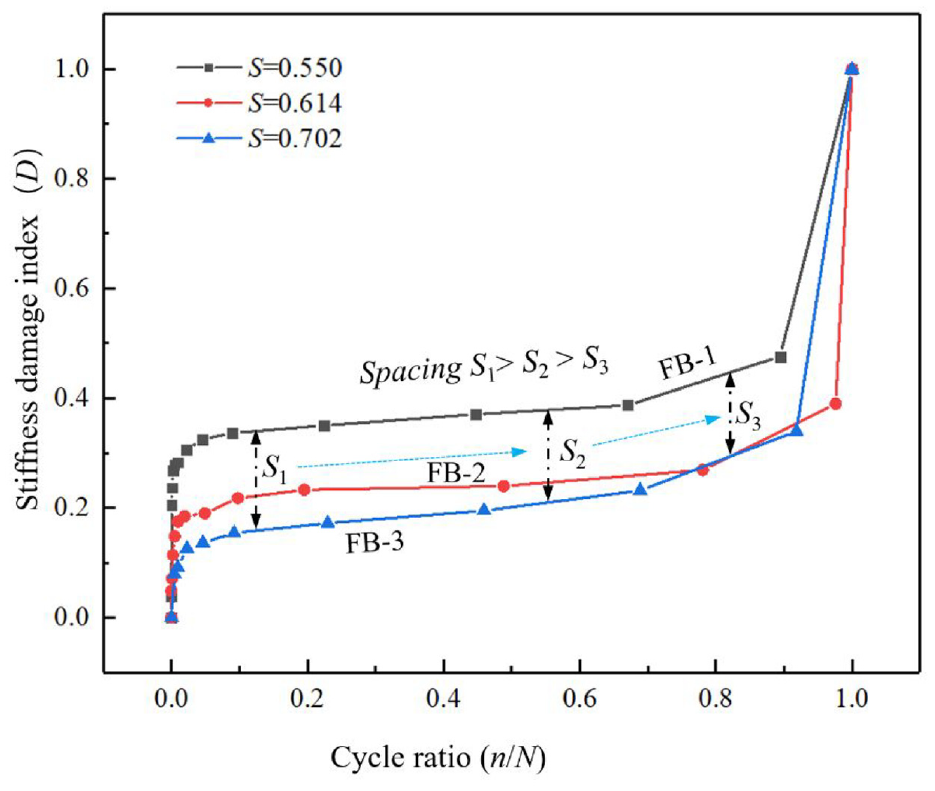
Stiffness damage index D versus cycle ratio (n/N).
According to literature (Yang et al., 1990), the relationship between the residual stiffness Bn and the number of load cycles n in this study can be described as a simple power function expression, as shown in equation (4).

where Q and v are variables, mainly depending on the load level. Integration of equation (4) from n1 to n2 cycles gives

When n1 = 0, n2 = n, the equation (4) is updated by equations (6) and (7)


According to the boundary condition, when Bn = BN for n = N, application of such a boundary condition to equation (7) leads to a relation between Q and v as follows

Substituting equation (8), equation (7) can be expressed as

Furthermore, equation (9) can be written as

where Bn/B0 is the stiffness degradation ratio, representing the relationship between the residual stiffness and the initial stiffness of the specimens after nth cycle, which is also an important index reflecting the law of stiffness degradation. Then the analytical model of stiffness degradation with load level S considered can be rewritten as

According to the equation (11), parameters of initial stiffness B0, residual stiffness Bn, failure stiffness BN, cycle ratio (n/N), load level S, and variable v depending on the load level are included in the stiffness degradation model.
Determination of parameters of stiffness degradation mathematical model
As discussed earlier, the stiffness degradation of three test specimens exhibits a three-stage change rule, namely rapid decrease, stable degradation, and sharp decline, in which the number of load cycles corresponding to stage III is less, accounting for about 11% of fatigue life on average. In addition, although the stiffness degradation ratio of specimens FB-1, FB-2, and FB-3 when fatigue failure is not significantly different under various load levels (approximately 0.290, 0.296, and 0.337, respectively), the sum of load cycles corresponding to stages I and stage II accounts for an average of about 89%. Besides, there is a good power function relationship between the stiffness degradation ratio (Bn/B0) and cycle ratio (n/N) in stage I and II, as shown in Figure 12. The parameters of the stiffness degradation model in equation (11) determined by fitting the stiffness degradation data in stage I and II of the fatigue tests are listed in Table 5.
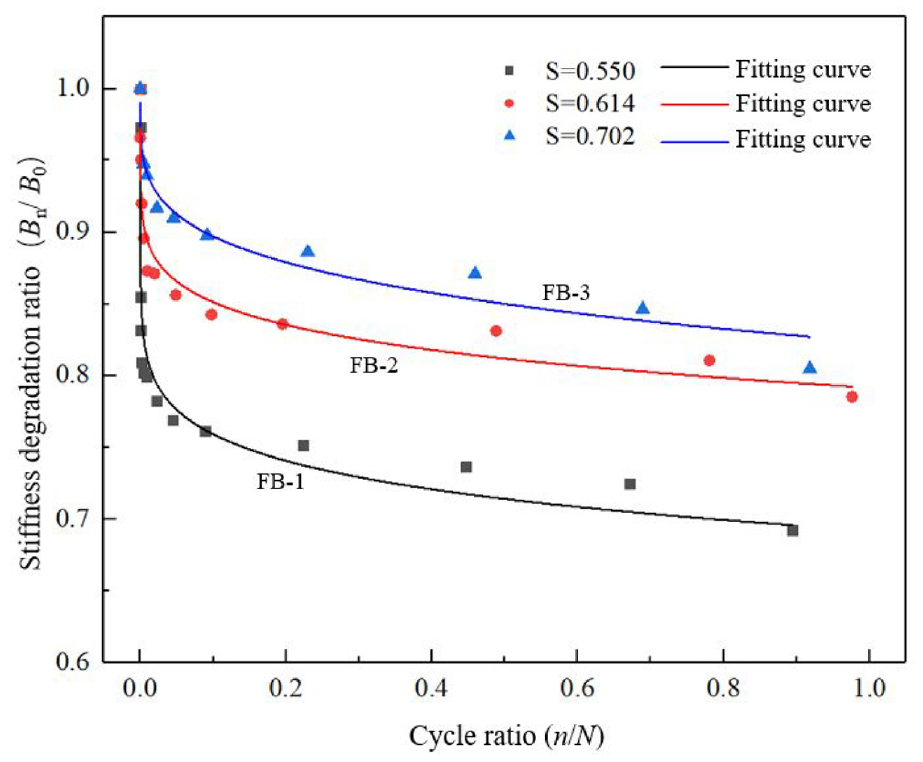
Stiffness degradation ratio (Bn/B0) versus cycle ratio (n/N) in stage I and stage II.
Parameters v under different load level S.

Literature (Yang et al., 1990) shows that the variable v is related to the load level S. According to the data in Table 5, the fitting curve of variable v and parameter S is drawn, as shown in Figure 13. It can be seen that the linear fitting is good, and the relationship between the two parameters can be expressed as equation (12).
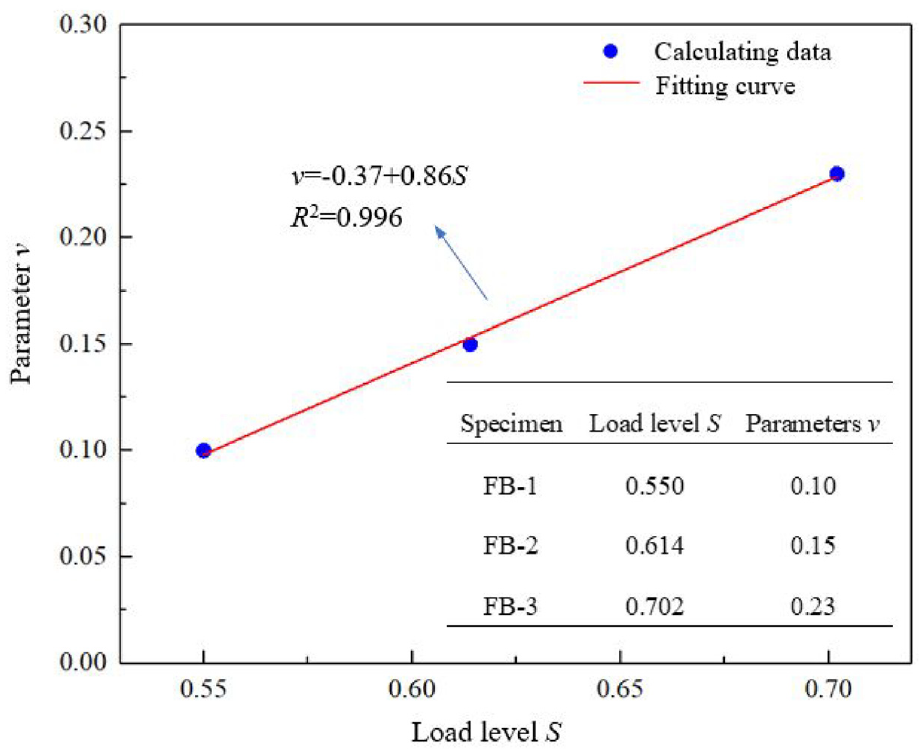
Parameter v versus load level (S).

Therefore, an analytical model of stiffness degradation with load level considered is shown in equation (13), which can well reflect the change law of the stiffness degradation with the load cycles in stage I and II, and predict stiffness degradation under various load levels.

where BN,II and NII are the residual stiffness and the number of load cycles corresponding to the end of stage II, respectively.
On the basis of the above analysis, predicted stiffness degradation curves in terms of Bn/B0 versus n/N of three failed specimens under various load levels are shown in Figure 14. The results show an obvious drop in stiffness during the initial cycles, followed by a region with a stable degradation and sharp decline until the final failure. The stiffness degradation model of concrete continuous beams with externally prestressed CFRP tendons proposed in this article is suitable for predicting the stiffness degradation of structures under various load levels.
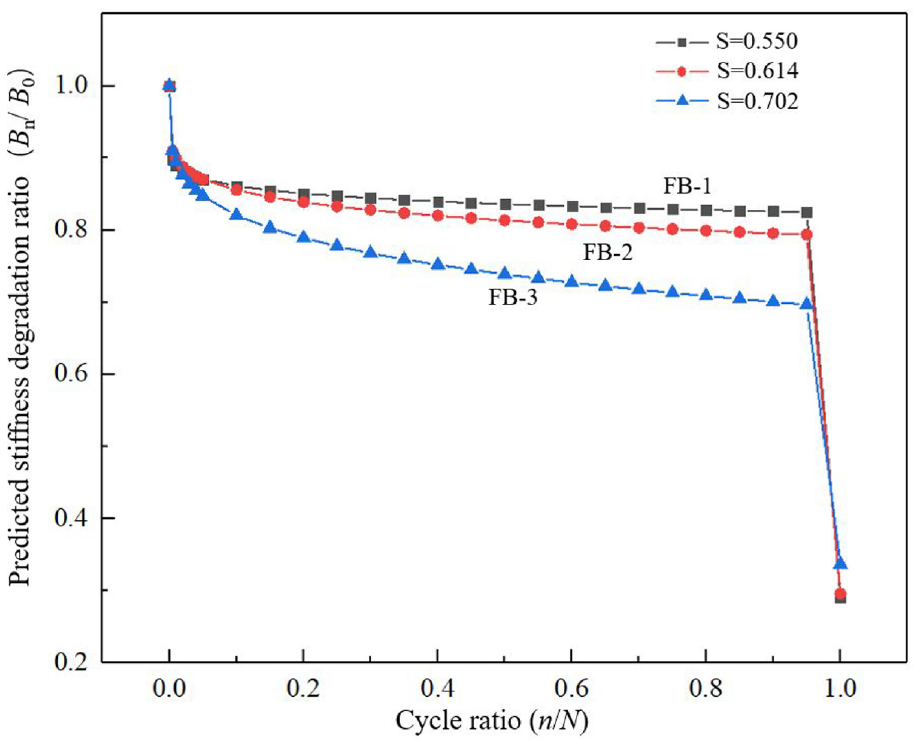
Predicted stiffness degradation of three failed specimens under various load levels.
Furthermore, CFRP tendons adopted in the concrete continuous beams in this study are characterized by high strength and fatigue resistance, and the concrete structures prestressed with externally CFRP tendons can make full use of the performance advantages of CFRP tendons. Compared with steel bars, the stress increment of the externally prestressed CFRP tandons is more obvious under fatigue load due to the distance between CFRP tendons and the neutral axis of specimen section is larger. In addition, the continuous beam is a statically indeterminate structure, which is different from the simply supported single-span beam only bearing the positive bending moment. Furthermore, it is highlighted that the average stress level of the steel bars can be reduced under the effect of moment redistribution and external prestressing. This is attributed to the fact that the moment of the fulcrum of the concrete continuous beams is negative due to the moment redistribution, which can reduce the positive moment of the mid-span section. Therefore, under the same stress amplitude, the fatigue life of the steel bars can be increased, and the fatigue performance of the concrete continuous beams with externally prestressed CFRP tendons can also be effectively improved. Thus, reducing the rate of structural stiffness degradation and prolonging the fatigue life of the structure.
Conclusion
An experimental program was conducted to study fatigue behaviors and the stiffness degradation of concrete continuous beams with prestressed CFRP tendons. A mathematical model with load level S considered is proposed, which was verified by the test results, and the following conclusions can be drawn:
Fatigue failure of concrete continuous beams with externally prestressed CFRP tendons started with the rupture of one steel bar. The other steel bars were partially fractured, but there was not obvious fatigue damage for the prestressed CFRP tendons and the concrete in the compression zone.
Under the different load levels, the stiffness degradation of three test specimens shows a three-stage change rule, namely rapid decrease, stable degradation, and sharp decline, in which the cycle ratio in stage II is the largest, all exceeding 80%. The number of cycles in stage III is more susceptible to load level.
The load level has a significant impact on the fatigue life of the test specimens. When the load level increases by 28% (from 0.550 to 0.702), the fatigue life of the test specimens will decrease by 90.2% (from 2.237 to 0.218 million). The increase of the load level leads to a sharp decrease in fatigue life.
When the cycle ratio (n/N) is the same during the initial cycles, the stiffness damage index D of specimens decreases with the increase of load level S, and the contribution of the number of load cycles to the stiffness damage of specimen is dominant. With the increase of cycle ratio, the difference of stiffness damage index for all specimens gradually narrowed, and the contribution of load level to the stiffness damage of specimens increases.
A mathematical model of stiffness degradation with load level S considered is proposed, which is capable of predicting the fatigue damage behavior, and the predicted stiffness degradation of three test specimens obtained by the proposed model is in good agreement with the test results. The model presented in this article can predict the stiffness degradation of concrete continuous beams with externally prestressed CFRP tendons subjected to different fatigue loads thereby providing a new method for the study of the fatigue performance of the structure.
Footnotes
Declaration of conflicting interests
The author(s) declared no potential conflicts of interest with respect to the research, authorship, and/or publication of this article.
Funding
The author(s) disclosed receipt of the following financial support for the research, authorship, and/or publication of this article: The work is financially supported by the National Key Research and Development Program of China with Grant No. 2017YFC0703000.
