
Abstract
There are large amounts of small-and medium-span girder bridges which bear structural similarity, while the large-scale bridge structures are generally limited in the timely applications of structural vibration characteristics. Therefore, in this study a framework based on machine learning models was proposed to analyze the vibration characteristics of specific line bridge groups. The probability distributions of structural, geometric, and material properties of bridge groups in specific lines were obtained using statistical tools and a Latin hypercube sampling method was used to generate reasonable sample sets for the bridges group, and parameterized finite element models of the bridges were established. Then, the optimal models were tuned and determined to predict fundamental mode and period by the 10-fold cross-validation method applying the numerical simulation results. This study’s results showed that the random forest models divided the vibration modes of the bridge groups into the longitudinal vibrations of the main girders and the longitudinal vibrations of the adjacent spans and side piers with a classification accuracy of greater than 90%, while the artificial neural network models exhibited the lowest normalized mean square error for the periods. The periods mainly ranged between 0.7 and 1.5 s. Furthermore, the bearing settings, ratios of the pier height to section diameters, and boundary types were determined to be the most significant properties influencing the fundamental modes and periods of the examined bridges, by respectively observing the reduced value of the random forest Gini indices and distribution of the generalized weight value of the input variables in artificial neural networks. This study provides an intelligent and efficient method for obtaining vibration characteristics of bridges group for a specific network.
Keywords
Introduction
The first step in analyzing the dynamic response of a multi-degree of freedom system is to calculate the period of free vibration of the structure and the corresponding mode function, as this can provide information related to the seismic response of the structure. For example, AASHTO (2011) and Caltrans (2010) used the fundamental period ratio of adjacent frames to judge the structural uniformity. Although Eurocode 8 (CEN, 2005) and the Chinese seismic specification (MOT, 2020), aiming at the seismic response of the regular medium- and small-span girder bridges, specifically propose a simplified method for calculating the fundamental period of structures based on conversion mass and equivalent stiffness under different conditions, it is not easy to rapidly obtain the mass and stiffness of the bridge structures. It makes particularly important for determining the relationship between the fundamental period and vibration mode and the readily available bridge properties. Zelaschi et al. (2016) first used the bridge population established by Broglio et al. (2010) to draw a preliminary trend line between the fundamental periods and span lengths, and pointed out that it is necessary to improve the relationship. Secondly, univariate and multivariate regression analyses were conducted on the population of randomly generated Italian reinforced concrete bridges, and the relationship between the fundamental period and the variables, such as bridge span length, pier height, and pier section diameter, was estimated. Finally, the ratio of pier height to section diameter was considered to be the most ideal variable of the fundamental period. It is worth noting that the present study, based on the subjective judgment of the researchers, only specified the geometric properties of the bridge for multiple single repeated linear regression analyses, and failed to effectively analyze the impact of properties such as bridge structure and material on the fundamental period.
As the main structural features of highways, small- and medium-span girder bridges are numerous and widely ranged. Simultaneously, compared with other structures, they tend to be similar type of structure. Due to the high calculation costs, it has not been feasible and unnecessary to establish the numerical analysis model of every bridge. Consequently, the other way is to obtain the properties of existing bridges by statistical tools, cover extensive structural configuration, parameterize the bridge, and establish numerical analysis model. The previous related research in this field have built the respective bridge databases in different regions, such as the central region of the United States (Nielson and DesRoches, 2006), California (Mangalathu, 2017), Turkey (Avşar et al., 2011), (Stefanidou and Kappos, 2016), and Italy (Zelaschi et al., 2016). Unfortunately, although these research results have established the seismic vulnerability of regional bridges with intensity measure, there are many shortcomings in the used methods. For example, when variance analysis methods were used to analyze the seismic responses of different bridge types, the hypotheses of independence, and homogeneity of variance must be satisfied (Mangalathu et al., 2016, 2017). In addition, Karamlou and Bocchini (2015) proved that lognormal assumption is the main error sources in probabilistic seismic demand models. The above assumptions have caused a certain deviation in the accuracy of the bridge seismic assessment, but without assumptions, no classical statistical inference can be made.
In recent years, the development of machine learning (ML) makes it possible to avoid the constraint of the aforesaid assumptions, and ML technology has been applied in structural dynamic analysis and earthquake damage prediction. Ghosh et al. (2013) employed radial basis function neural networks and support vector machine techniques to establish seismic demand models of the key components of the concrete simply supported beam bridges. Sun et al. (2019) utilized ridge regressions and support vector machines to analyze the influences of eight specific factors on the peak drift ratios and peak floor accelerations of four typical buildings and to effectively capture the nonlinear responses of high-rise buildings. Mangalathu et al. (2019) and Mangalathu and Jeon (2019), used random forest models to establish the seismic fragility curves for California bridges, and then proposed a method for rapid damage state assessments using ML techniques. Jia et al. (2020) sorted the importance levels of the specific characteristics and identified the seismic damages to the bridges following the Wenchuan earthquake according to the ML models. Xu et al. (2020) applied ML techniques to predict building structure types, and provided a method for obtaining structural types for a city-scale seismic damage simulation. It could be found that the different ML models had displayed different accuracy levels for a variety of research problems based on the analysis of the above-mentioned previous studies.
Herein, considering the deficiency in dynamic characteristic analysis and seismic performance evaluation of small- and medium-span girder bridge groups and the good application background of ML technology, a research framework to predict the vibration characteristic of the type of bridge group based on ML is proposed as the first step of seismic risk assessment of bridge clusters. It should be noted that the designs of the bridge structures were very different from those of highway bridges in China (Wang, 2014). Therefore, it was necessary in this study to first examine the specific attribute characteristics of highway bridges in China. Taking an expressway as an example, the population characteristics of the adopted bridge data including structural data, geometric data, and material data were described their using standard statistical tools. Then, the bridge population was generated based on a Latin hypercube sampling (LHS) method, and a comprehensive bridge attribute configuration was covered. In order to study the relationship between the fundamental vibration characteristics and bridge properties, a set of parametric finite element models of the existing bridges was established to analyze the eigenvalues, and the fundamental vibration modes and periods were successfully obtained. Then, the alternative ML models were trained using the known sample date as the training data to predict the fundamental modes and periods of the unknown samples. Moreover, the relative importance of each bridge attribute was determined using the best ML algorithm, and the effectiveness of the method was verified by examples.
Research framework
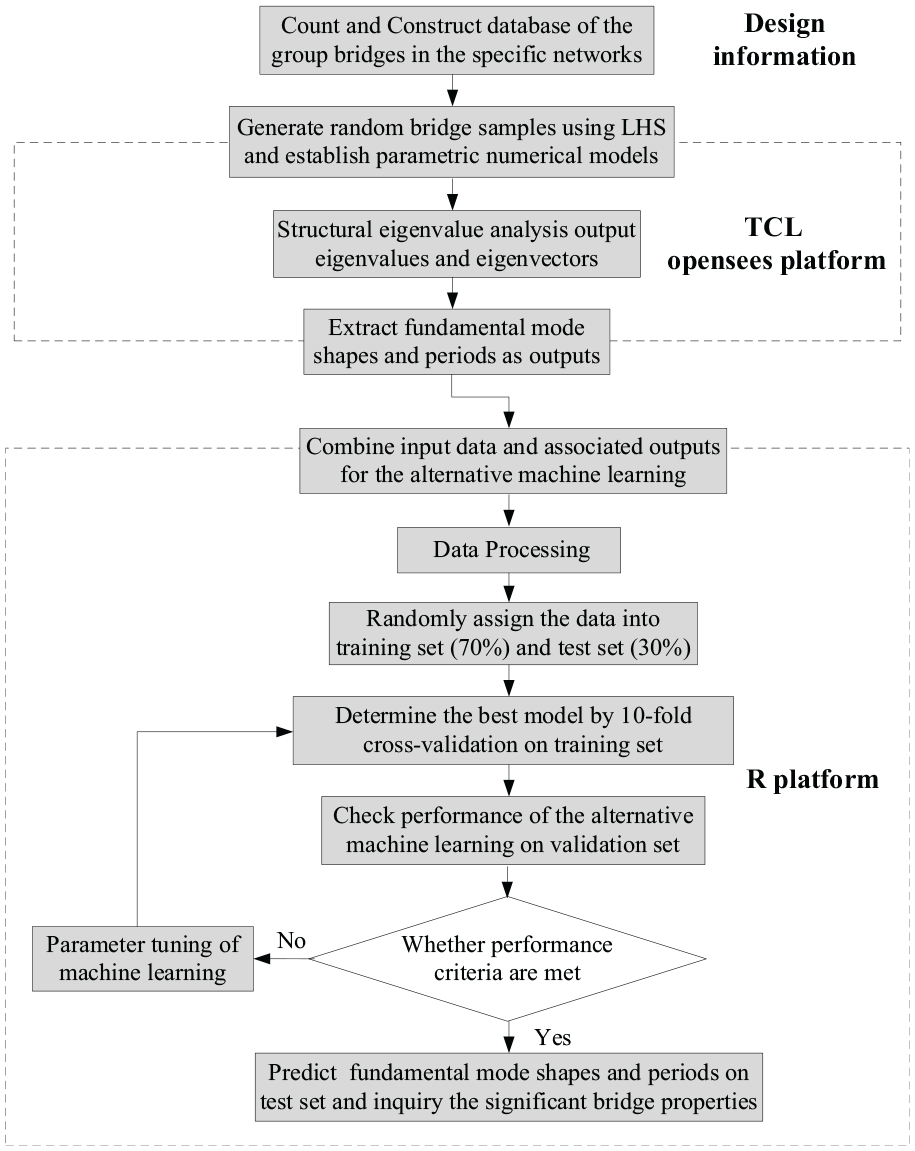
This research investigation presented a method for predicting the dynamic characteristics of line bridge groups using ML models. The method mainly included the following parts: statistics and preparation of the data; numerical analyses of the bridge samples; and tuning analyses of the ML models as follows:
Statistics and fitting of the bridge structure attributes
This portion of the study process mainly included the examination of the characteristics of the bridge structures in the selected line. Due to the nature of the discrete distributions, it was only necessary to count the data frequencies of each attribute in order to generate the corresponding non-parametric probability quality functions. In regard to the bridge attributes with continuous random variables, the known statistical distributions were fitted and allocated. In the present study, Kolmogorov-Smirnov (K-S) goodness of fit tests were used to assign the corresponding distributions, according to the typical α level (0.05) and the p values of the maximum distances between the frequency distributions and the theoretical distributions (Frangopol, 2008).
Establishment of the bridge sample analysis processes
According to the probability distribution of the input bridge attributes, an LHS method was adopted in this study to generate bridge samples with a certain scale (Iman and Conover, 1980). LHS is a stratified random process, which provides an effective method to conduct sampling from the distribution of the variables and ensures that the scope of each variable is covered by layering the edge distributions of each variable to the greatest extent possible. Then, based on the OpenSees package (McKenna et al., 2010) and Tcl language (Brent, 2003), parametric three-dimensional numerical models were defined, and eigenvalue analysis was performed for each bridge sample in order to obtain the fundamental vibration modes and periods.
Data preprocessing
The correlation matrix of the bridge attribute data was calculated to estimate possible dependencies. The data being weak correlation can be used as the input data for the ML models of the bridge population. In addition, in order to ensure that the influence weights of each feature dimension on the objective function were consistent, as well as to improve the convergence speeds of the ML iterative solutions, the normalized data were used. A minimum/maximum normalization method was used to normalize the input attributes so that the influences on the predictions caused by different data scales could be avoided.
Tuning and evaluations of the ML models
In the present study, by taking the attribute data of the bridges as the input data X, and the fundamental mode shapes and periods as the output data Y, the data could be randomly divided into a training data set (70% data) and a test data set (30% data). On the training set, a 10-fold cross-validation method was used for the alternative model selection and parameter adjustments in order to determine the optimal model and parameter configuration (Friedman et al., 2001; Gareth et al., 2013). The process was completed on an R platform (Venables et al., 2020). Due to the fact that the test data set was not used to train the model, the performance of the model in the test data set was essentially a performance measure of the unknown events of the model.
Application of the optimal model
The determined optimal model was applied to the bridges of a specific network, and the fundamental vibration modes and periods of the bridges could be quickly obtained. Then, according to the determination of the important bridge attributes, the advantages of the ML methods in comparison to simplified relationships and numerical results were clarified.
The framework is demonstrated in detail with the studied bridge groups, and a flowchart is given in Figure 1.
Research flowchart.
Bridge population and parametric numerical models
This study mainly applied the design information of 168 bridges within the newly-built Wenchuan-Maerkang Highway. The statistical processing was carried out for the structural and geometric features, along with the material properties, in order to reflect the characteristics of the bridges in the selected line.
The statistics show that the bridges mainly included pre-stressed concrete simply supported T-beam bridges with continuous decks, as well as continuous box girder bridges. Note that the transition curve bridges were assumed to straight line bridges. The majority of bridges were adopted multi-frame and multi-span designs in the network, but the most likely numbers of spans for each frame were 2, 3, and 4. The medium-and small-span bridges could be called as the basic component units of multi-frame and multi-span bridges. If a single frame was extracted, it tended to be different from the three boundary conditions. That is, two sides may be adjacent spans: one side may be an adjacent span; one side may be an abutment; or both sides may be abutments, denoted as A, B, and C, respectively.
The configurations of the superstructures met the general design of Chinese bridges. The simply supported girder bridges (SSGBs) adopted the form of multiple small T-beams and the main girder forms of the continuous girder bridges (CGBs) were single boxes with multiple cells. The bearing system of the SSGBs employed laminated rubber bearings under each T girder, and selectively set PTFE sliding rubber bearings at both ends of one frame, forming A, B, and C three types of bearing schemes. The supporting systems of the CGBs mainly adopted two types of bearing schemes. One type was a pot bearing scheme with longitudinal fixed piers, and the other included two laminated rubber bearings under box girders for one pier, designated D and E in turn.
The piers adopted the two-column bents, of which sections were all circular. Since the design indices of the piers may potentially have been affected by other factors, the correlation analysis was carried out for the span lengths, column heights, transverse column height ratios of the same piers, column spacings, column diameters, longitudinal reinforcement ratios, and stirrup ratios. The obtained data distributions and spearman correlation coefficient (Frangopol, 2008) matrix are demonstrated in Figure 2. The correlation coefficient describes the degree and rank of the correlation between the two variables. It was found that the column diameters had obvious correlations with the spans, column heights, and column spacings, and could not be input into the population bridge as an independent variable. Meanwhile, the other indices had displayed no obvious correlations. Therefore, they were input as independent variables. Following the data transformation, the column heights, transverse column height ratios, and longitudinal reinforcement ratios, were found to meet the normal distribution standards.
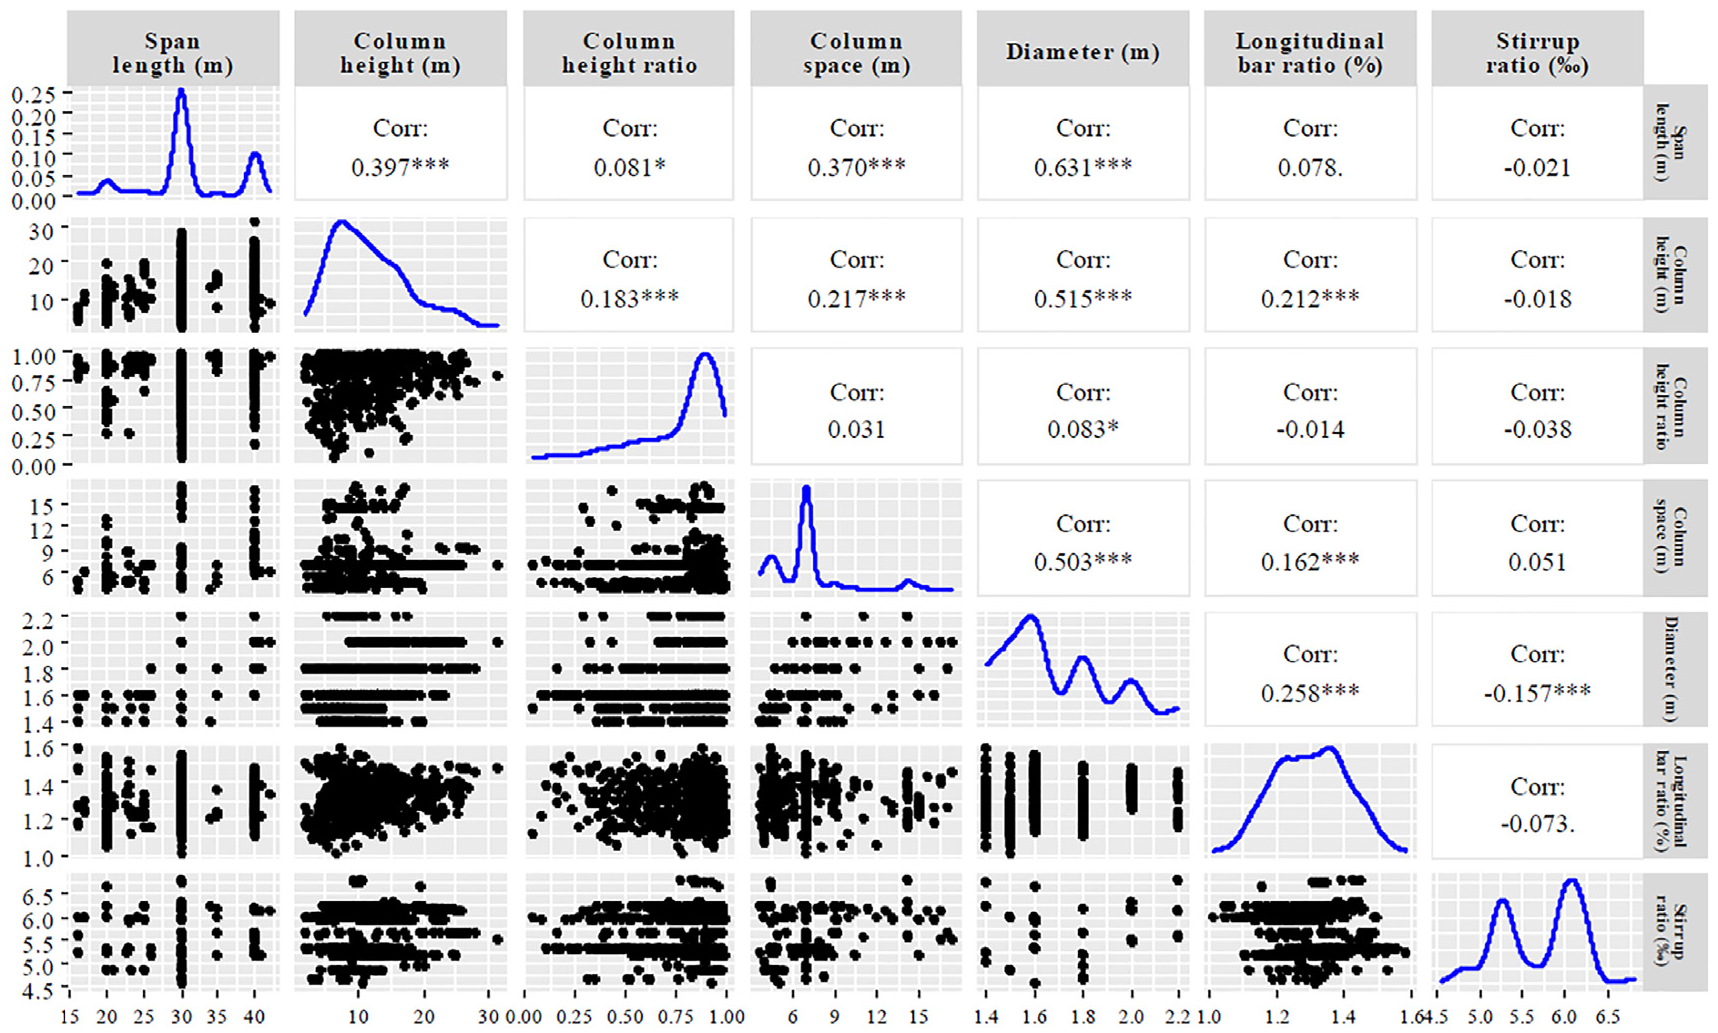
Data distribution and correlation coefficient matrix of the pier attributes.
The bridge foundations of the network adopted columnar pile foundation types without bearing platforms, and the distribution of the foundation stiffness was acquired by the calculation of 589 foundations.
In terms of the materials used in the bridges, the statistical distributions directly cite the standard statistics and the existing research reports (Mangalathu, 2017; MOHU, 2015). Table 1 summarizes the statistical results of the above-mentioned bridge properties.
Statistical distribution of the bridge attributes.

In the table, the normal and lognormal distribution parameters are the mean and standard deviations; and the uniform distribution parameters are the upper and lower limits. The span lengths of SSGBs were mainly 30 and 40 m. A 12 m standard width was used for the deck width and the other widths were uniformly distributed within 8–24 m.
As can be clearly seen in Figure 2, there were the bimodal pattern in the kernel density diagram of the stirrup ratios. Therefore, a mixed normal expectation maximization EM algorithm (Benaglia et al., 2009) was utilized to estimate the parameters, and the probability density function was obtained using equation (1):

Where N is the probability density function of the normal distribution.
In the current investigation, the longitudinal layouts of the bridge pier heights were statistically analyzed. In accordance with the number of piers, different pier height combinations and arrangements in longitudinal direction were observed and divided into the following six categories: single pier layouts (A); equal pier height layouts (B); medium high and side short layouts (C); medium low and side high layouts (D); uniform gradual pier height layouts (E); and irregular layouts (F), which were classified as qualitative variable input.
In accordance with the basic principle of LHS, 1800 bridge samples with 95% guarantee rates were generated by the statistical sampling of the bridge attributes, and the numerical models of the examined samples were established, as configured in Figure 3. The superstructures were modeled by the elastic beam-column elements, with lumped masses along the centerline. Then, the elastic-plastic fiber beam elements were used to simulate the piers, in which Mander models were adopted for the concrete fiber, and bilinear models were utilized for the reinforcement fiber. The foundations adopted six linear and elastic springs. However, due to the fact that this study had mainly carried out modal analyses of the bridge structures, the laminated rubber bearings and the fixed directions of the pot bearings were simulated using linear springs, and the stiffness values were provided by the statistical results. The PTFE bearings and the sliding directions of pot bearings were not constrained. The abutments were considered to have large stiffness characteristics, which were simplified as the springs with large stiffness. These were characterized by bilinear responses along the horizontal direction and were fixed on the ground.
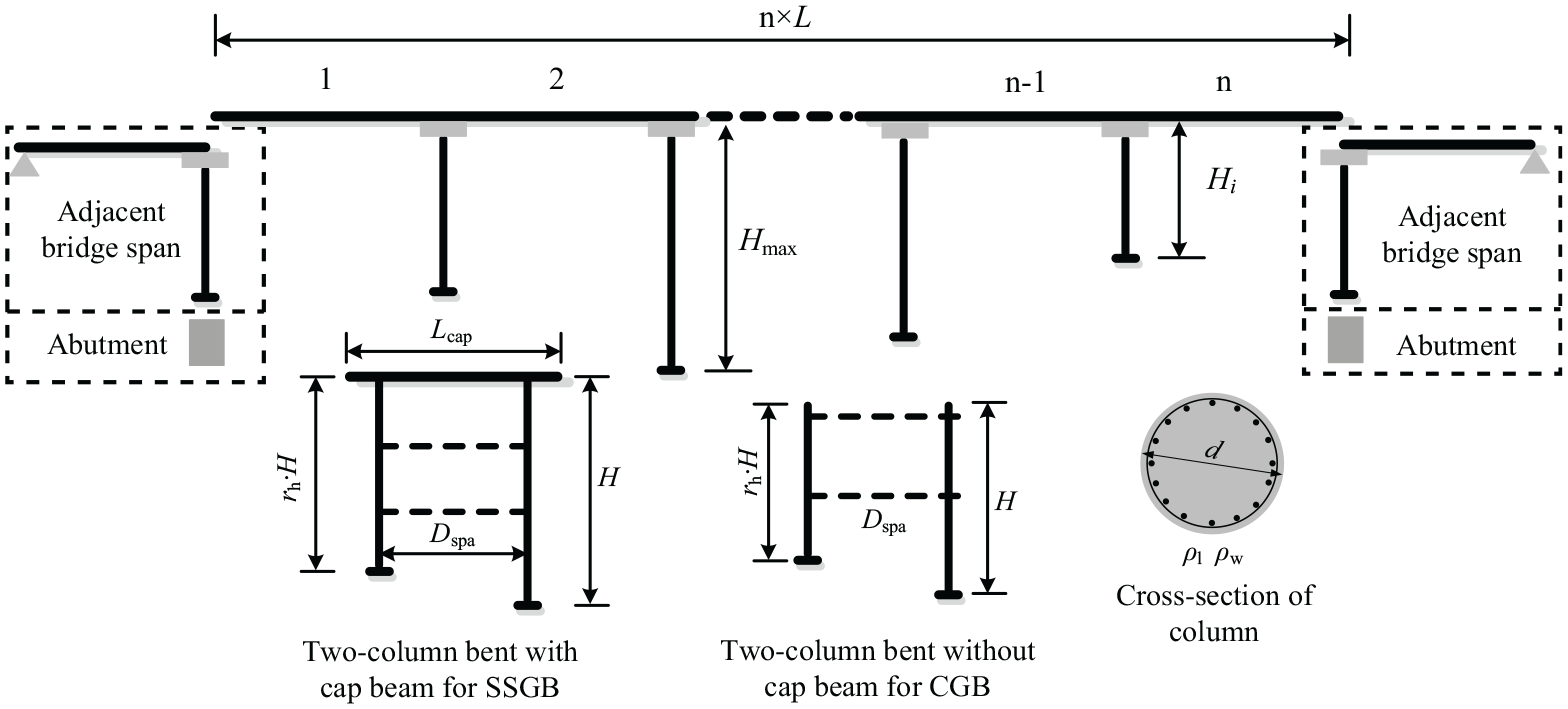
The configuration of one analytical frame bridge.
Overview of the alternative ML models
ML techniques can provide learning capabilities for computers through data experience (Friedman et al., 2001), including a wide range of methods based on classification and regression processes. In this study, referring to the previous research results, support vector machine (SVM), artificial neural network (ANN), and random forest (RF) were used to examine the fundamental mode shapes and periods of bridge groups based on the classification and regression, respectively.
SVM
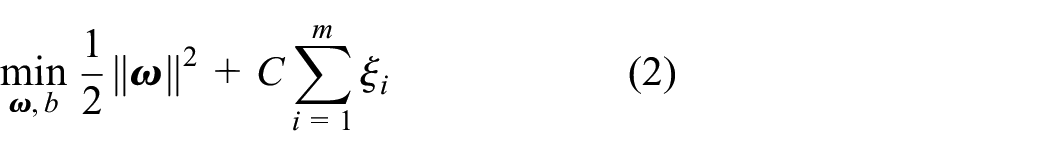
The SVM classification models have the ability to identify hyperplanes with the largest intervals within a sample space based on the training data, and then use multiple support vectors to define the class boundaries or regression tolerance interval band (Cristianini and Shawe-Taylor, 2000). The SVM models were expressed as follows:
Subject to

Where
ANN
ANNs are based on the establishment of the nonlinear functional relationships of the input characteristics to predict the response parameters (Haykin, 2004). ANNs are composed of input layers, hidden layers, and output layers, and each layer is consisted of basic unit neurons. A single neuron receives input signals from other neurons and transmits them through weighted connections. The input signals received by the neurons are compared with their threshold values in order to suppress or amplify them, and then the output of the neurons is generated using “activation function” conversion, as shown in equation (4).

Where f is referred to as the activation function, which is generally a sigmoid function; n indicates the number of input neurons; ωij denotes the connection weight; xj represents the input value of neuron j; and θi and yi are the threshold value and output value of the hidden layer neuron i, respectively.
A complete training process needs a back-propagation process. The errors are determined based on the loss functions, and minimized by optimizing the connection weights. The neurons are connected according to a certain level to build an ANN. The efficiency of the neural networks will be dependent on the number of hidden layers and neurons. Hornik et al. (1989) confirmed that neural networks can approach arbitrary complex continuous functions with arbitrary precision, by including only enough neurons in one hidden layer. Therefore, the setting of the number of hidden layer neurons is considered to be the key to accurate predictions.
RF
The RF method is an ensemble learning method which is composed of a set of tree structures (Breiman, 2001). A random feature selection process is introduced into the training process of the decision tree based on a “bagging” method. On one hand, two-thirds of the training data will be used for repeated sampling in a “bag,” and each tree is constructed independently. The average value of all the tree results is final output for the prediction process. On the other hand, RF does not use all of the variables in each decision tree split, but selects the best feature subsets containing K variables according to the error rate of the out-of-bag (OOB) data. The steps involved in the RF Method included:
The nt training samples were randomly selected from the training set;
The feature subset was randomly selected in order to obtain the best segmentation, and a decision tree was generated from each sample;
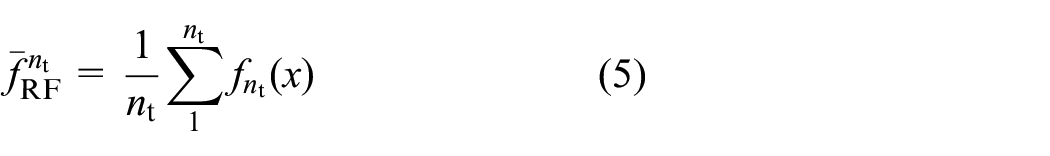
The output of the new data set was predicted by the prediction sum of the average nt decision trees, which can be expressed as:
Where
The keys to building an RF model were the number of random variables and the number of trees when the decision trees split. It was observed that the large number of trees results RF generally not being over fit.
Vibration characteristic analysis of the bridges based on ML models
In accordance with the proposed research framework, SVM, ANN, and RF algorithms were used in the present research to tune the parameters and determine the most applicable algorithms for the vibration characteristic analyses. The input variables included the number of spans (Nspan); span lengths (L); deck widths (Dw); boundary types (BouType); and bearing setting types (BeaSet) of the bridges. In addition, the ratios of the applied pier heights to section diameters (Ha.d); transverse column height ratios in one pier (rh); deviation values based on the maximum of pier height (σh); longitudinal arrangements of the pier heights (Hlayout); longitudinal reinforcement ratios (ρl) and stirrup ratios (ρw); translational (PileKT) and rotational stiffnesses (PileKR) of the pile foundations; strength levels of the concrete (fcon) and reinforcements (fste); and the accessary mass (Mass) of the superstructures were considered and analyzed.
Model debugging
Using the eigenvectors which were obtained by finite element modal analysis, the entire bridge structure is divided into several component groups including the girders, piers, abutments, and adjacent spans, then the fundamental modal participation factors of each component group in the three translational degrees of freedom are computed and compared. The fundamental vibration modes of the structure can be divided into labels representing the “longitudinal vibration of the main girder” and “longitudinal vibration of the adjacent span with side piers” by comparing the factors, which are regarded as two level dummy variables in ML models. According to the statistics of the fundamental period of 1800 bridges, as shown in Figure 4, the data follow normal distribution, and 70% of the bridges have periods between 0.7 and 1.5 s.
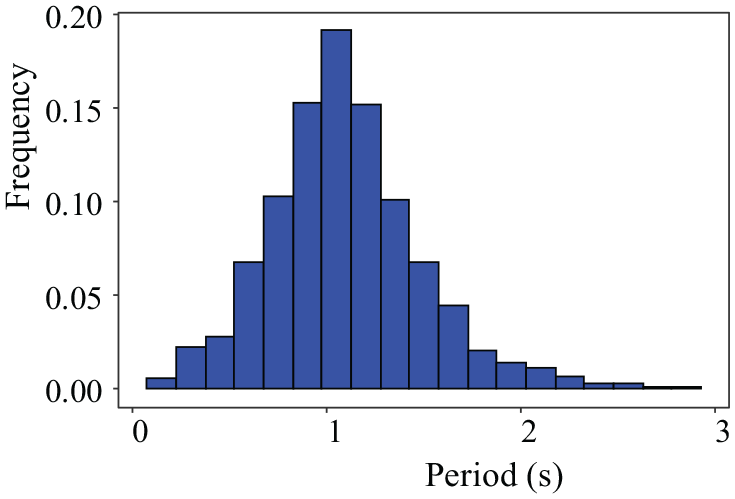
Fundamental period distribution of 1800 bridges.
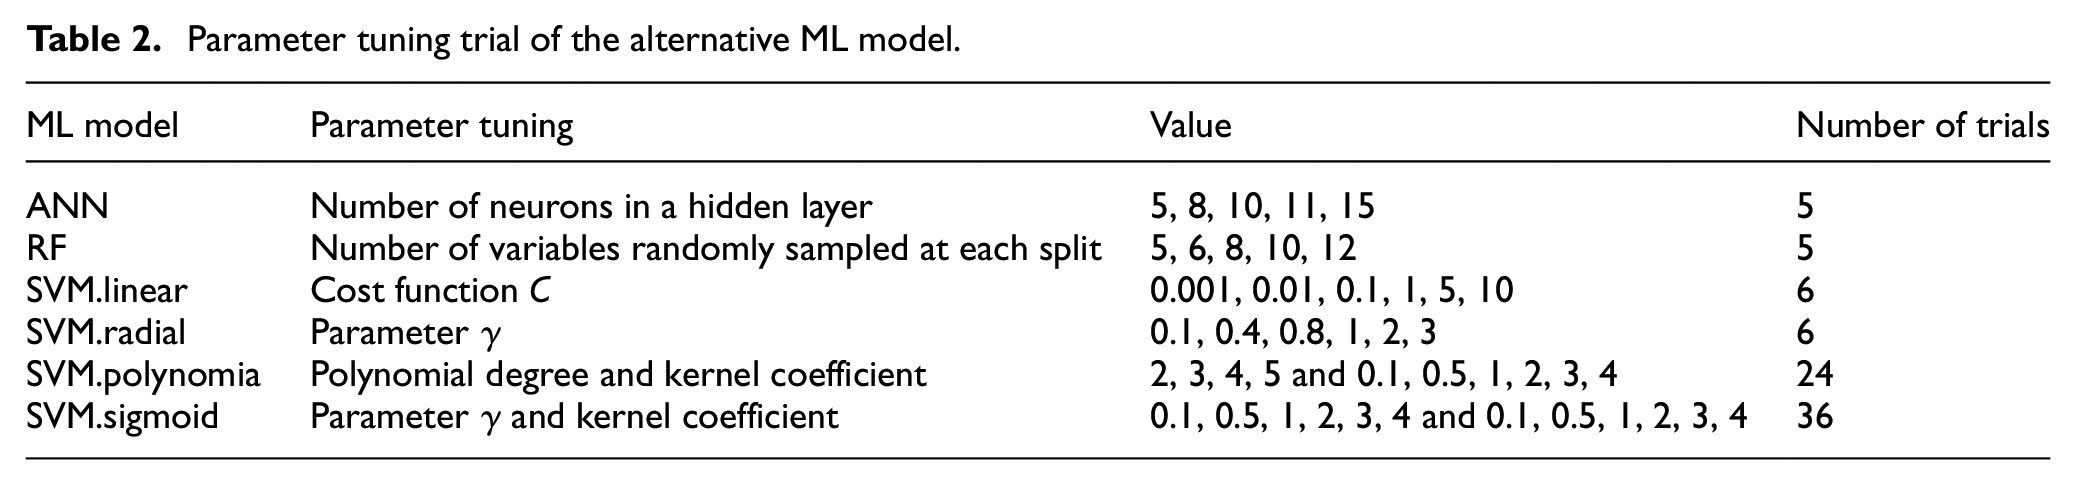
In step 4 of the research framework, a parameter tuning grid was established for each candidate ML model to obtain the ideal parameter configuration for each algorithm, as shown in Table 2. Figure 5 demonstrates the results. For the classification of fundamental vibration modes, the overall accuracy is taken as the index, which is defined as the ratio of label accurately predicted by the ML model to total data. SVM uses sigmoid kernel function, the optimal parameters of which are (0.1, 0.1), while the average classification accuracy is less than 78%. The performance of the model in the training set and the validation set are significantly different. The performance among the candidate models is the poorest. When SVM uses radial basis function and polynomial kernel function, the performance of the model on the validation set is significantly lower than that on the training set, thus indicating that the data size has a great impact on the performance of the model. SVM uses linear kernel function, and the optimal parameter C is 5. Due to the large cost function C, the model has the potential of over-fitting and poor generalization ability. When the number of neurons in the hidden layer of the ANN is 10, then the results of 10 experiments on the training set are all 1, while the accuracy on the verification set is significantly lower than that on the training set, with an average of 89.6%. This shows that the algorithm is easily affected by the size of the data. The RF model achieved the best performance when eight random variables were used in each tree splitting. The performances of the model were consistent in the training set and the verification set. The average accuracy of the 10-fold cross-validation was 91.8%. Compared with other models, the performance of each test on the validation set was the most stable. Therefore, RF is the most suitable classification.
Parameter tuning trial of the alternative ML model.
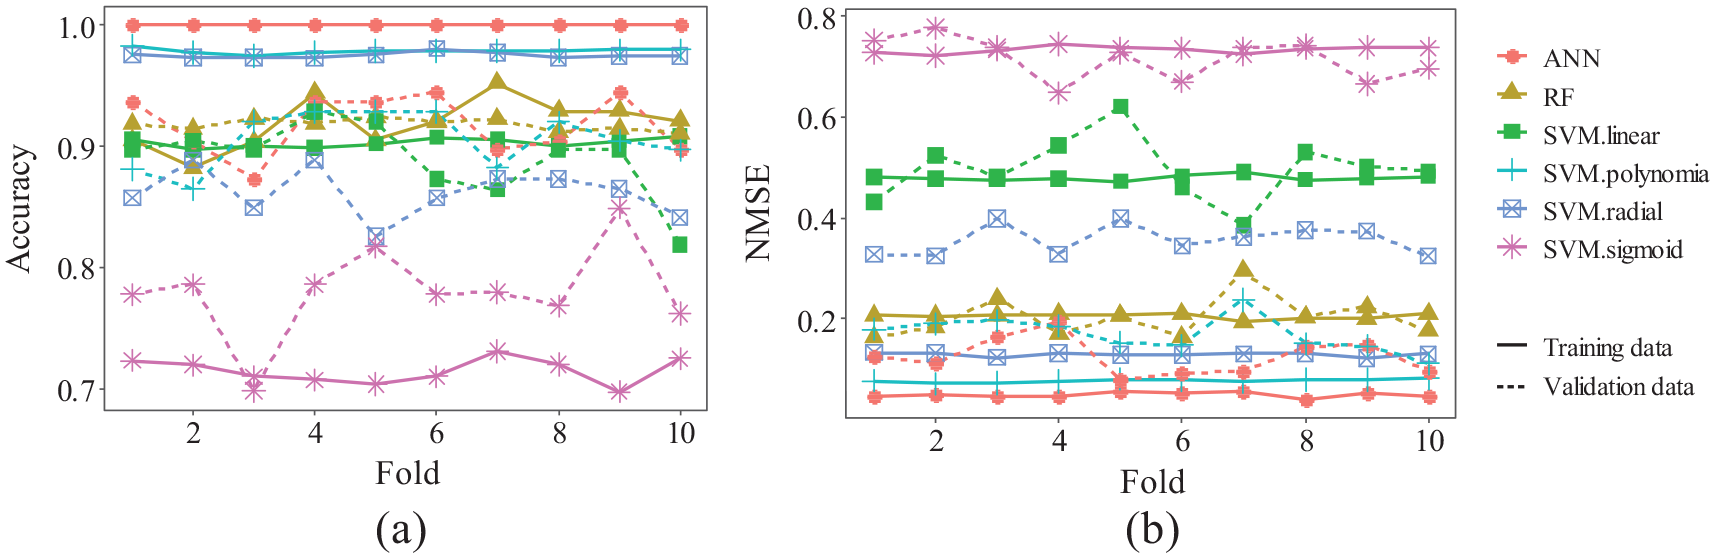
The results of 10-fold cross-validation with the best parameter configuration: (a) mode shape and (b) period.
For the regression of the fundamental period, the normalized mean square error (NMSE) is used as the measurement index, as seen in equation (6). The smaller the value is, the better the performance of the model will be. Alternatively, the determination coefficient R2 can be applied for evaluation. The indicator is directly proportional to the model performance due to the fact that the sum of the two indicators is 1.0.
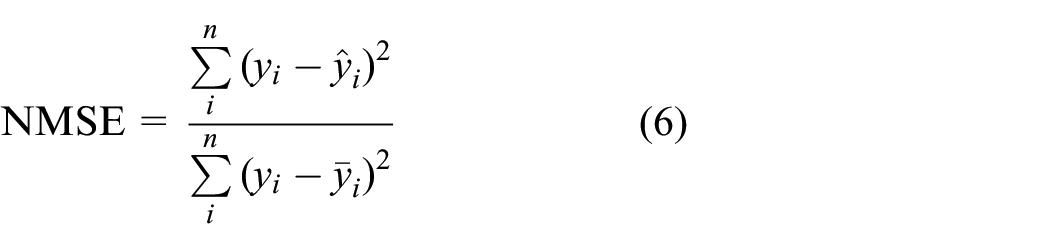
Where yi,
Fundamental mode analysis
RF models were used to examine the relationships between the fundamental mode shapes and the input bridge attributes. A total of eight random variables were used for each tree splitting. The sensitivity of the OOB data errors to the number of trees on the training sets was evaluated. A total number of 260 trees can achieve high reliability for the classification problem because of the basically constant error rates after 260 trees, as seen from Figure 6.
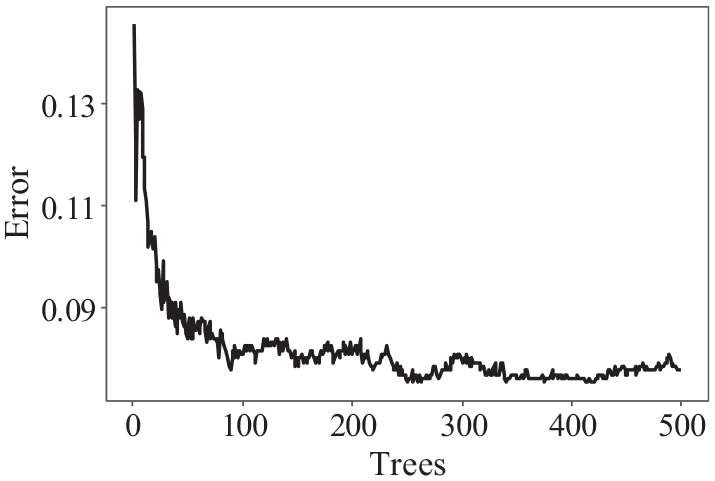
Training OOB data errors with the number of trees.
Confusion matrixes can be used to measure the generalization abilities of ML models. This study’s confusion matrixes of the assignment labels based on the training set and test set are shown in Figure 7. The percentage of prediction tags correctly assigned by the ML model was known as the precision. On the other hand, the percentage of actual correctly assigned tags was called as the recall. The high recall and precision rates verified the ability of ML algorithm to accurately classify the data (Friedman et al., 2001). Figure 7(a) details that the precision of the RF models in both the training set and test set had reached 92%. This indicated that the RF models had the ability to correctly assign the mode shapes of the bridges with unknown attributes in the network. As detailed in Figure 7(b), the recall of the confusion matrixes on the test set indicated that the algorithm had correctly predicted 374 out of 389 actual girder vibrations. Simultaneously, 124 of 151 actual adjacent span vibrations were correctly predicted by the algorithm, which indicated that when the training model was available, RF models could be used to predict the fundamental mode shapes of other small-and medium-span bridges in the network.
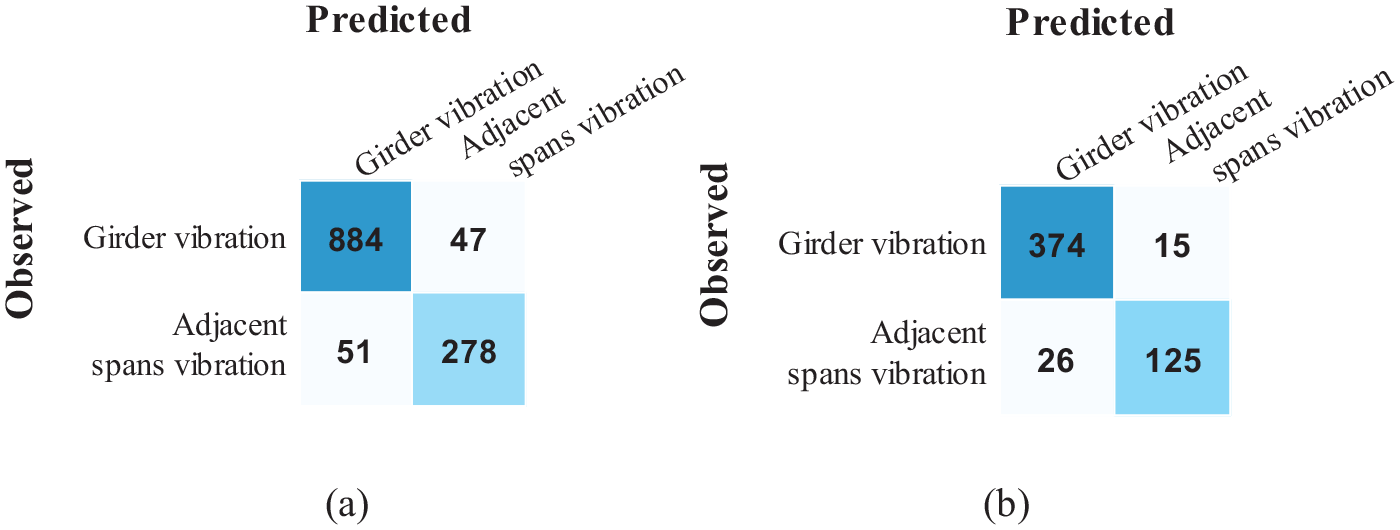
Confusion matrix of the fundamental mode shape classification: (a) training set and (b) test set.
In addition, RF models can determine the relative importance of each input bridge attribute. These are generally measured by GI reduction, and its calculation is shown in equation (7). Its meaning is the average change of node splitting impurity of each feature in all the RF trees after deleting any independent variables. Therefore, the greater the index changes are, the more important the variable will be.

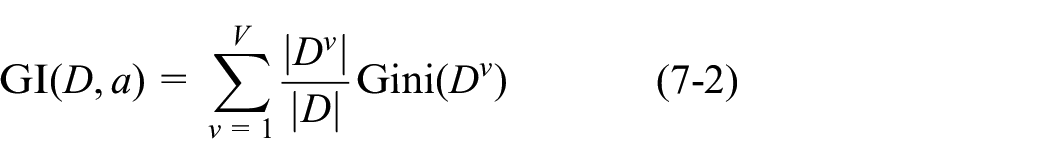
Where pk indicates the proportions of the class k samples (k = 1, 2, …, K); and a and V denote that the discrete feature a may have the V values.
Figure 8 demonstrates the relative importance of each input parameter considered in the present study to its fundamental mode shape label assignment. Since the vibration classification labels were the main girder vibrations and adjacent span vibrations, the boundary conditions were the directly influencing factors. Additionally, the bearing systems, as well as the ratios of the pier heights to their diameters (called as the slenderness ratios), were considered to be the most significant parameters.

Variable importance of the RF models to the fundamental mode shape classifications.
The detailed results of the RF model regarding how the critical attributes affect the mode shape classification are shown in Figure 9. For example, (A, B) indicates that the boundary type is A, and the bearing scheme is B. The investigated classification results revealed that the fundamental vibration mode of the SSGBs was the main girder vibration when the laminated rubber bearings were uniformly installed. Furthermore, when the PTFE sliding plate bearings were equipped at the expansion joints and the pier slenderness ratio was less than 7.5, then the adjacent span was earlier than the vibration of the main girder. When only the PTFE sliding plate bearings were installed at the abutment, if the adjacent span was caused to vibrate first, then the slenderness ratio of the column should not exceed 5.0. Compared with plate rubber bearings and thick and short piers, the small friction coefficient of PTFE sliding plate bearings at the expansion joints and the slender piers would render the stiffness of a frame bridge smaller, resulting in the main girder being prone to vibration. In CGBs, the application of pot bearings led to the longitudinal fixed piers system. It can be considered that the main girder would vibrate if the pier slenderness ratio was greater than 7.5. In addition, when laminated rubber bearings were applied, the main beam will vibrate first for the pier slenderness ratio estimation of greater than 10.0. It can be seen that the fixed pier directly determined the longitudinal stiffness of the CGBs, but the laminated rubber bearings can evenly distribute the structural stiffness in the longitudinal direction.

Fundamental mode shape classification results according to the important attributes.
Fundamental period analysis
In this study, ANN models were used to regress the input bridge attributes and fundamental periods. According to the results of tuning parameter, the ANN models had adopted single hidden layers with 10 neurons. The scatter trend of the observed values and the fitted values of the ANN models in the training set are detailed in Figure 10, which shows that the scatter points were distributed on both sides of the diagonal line and the fitting effects were excellent. The determination coefficient R2 was set as 0.951. It was found that the R2 could reach 0.894 by examining the performance results of the models in the test set. It was observed that the ANN models had displayed the ability to accurately fit the fundamental periods of the small- and medium-span girder bridges according to the input bridge properties.
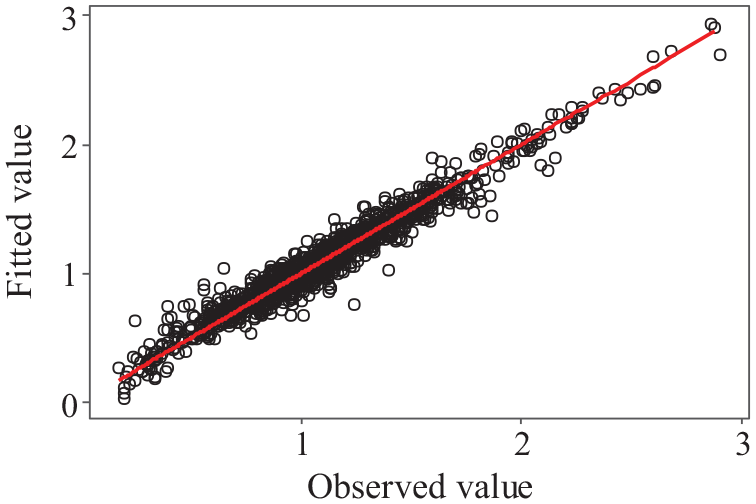
Fitted values and observed values of the ANN models.
In order to determine which bridge attributes were the most important for the accurate predictions of the fundamental periods, the generalized weights defined in the neural network could be used to measure the importance of the input variables. The generalized weights of the ith input variables gw i were defined as follows:
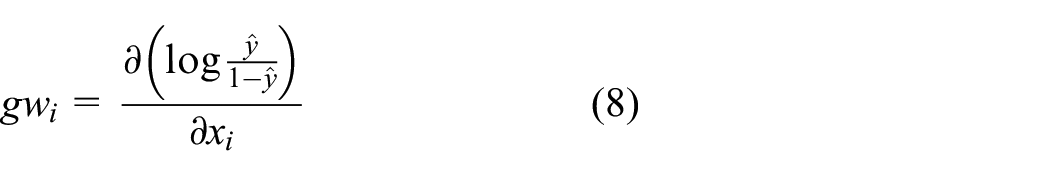
The above-mentioned formula was the partial derivative of the logarithmic dominance function. If the partial derivatives of the ith input variables xi at all the predicted values were almost zero, then this indicated that the values changes of the variables had no effect on the logarithmic dominance functions, that is, the input variables had little influence on the output variables. The generalized weight distributions of some of the input variables are detailed in Figure 11. It can be seen that the generalized weight distributions of the bearing settings and bridge boundary types were obviously asymmetric. In addition, when compared with the other bridge attributes (such as the reinforcement ratios and pile foundation stiffness), the ratios of the pier heights to the section diameters were found to have a wide range of generalized weight distributions, and were at a higher level overall. Therefore, as indicated by the results, the bearing settings, ratios of the pier heights to section diameters, and the bridge boundary types were the variables which had significant impacts on the fundamental periods of the bridges.
Generalized weight distributions of some of the bridge attributes.
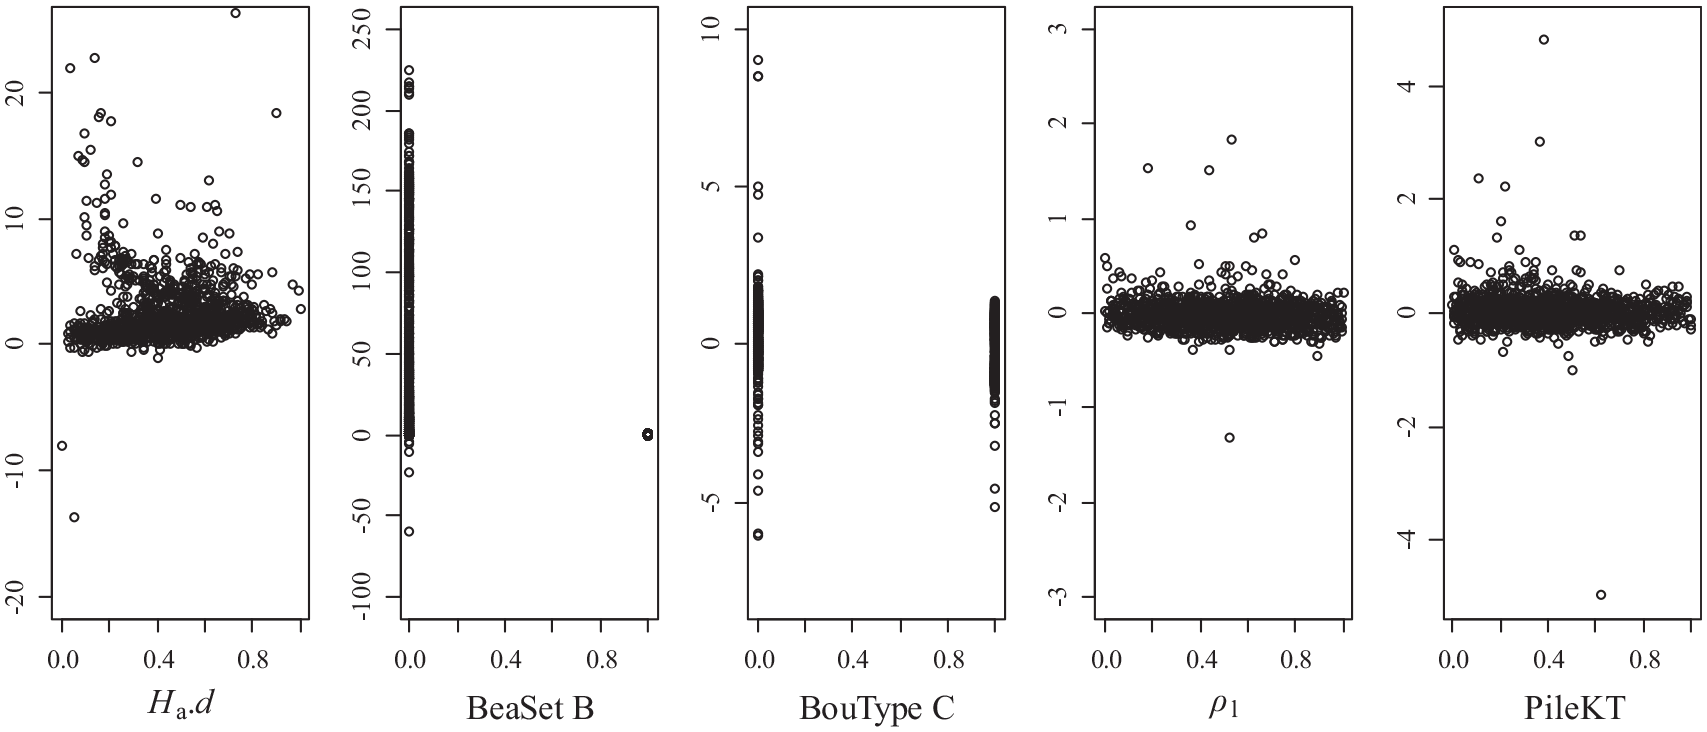
The regression results of the ANN models showed that the fundamental periods increased with the slenderness ratio of the pier columns under different boundary types and bearing settings, as detailed in Figure 12. Compared to the uniform equipping of laminated rubber bearings, the gradients of periods with slenderness ratios tended to increase when the PTFE sliding plate bearings were installed in the SSGBs for the same boundary type. The variation rates of the periods with slenderness ratios were the largest when the fixed piers were set with pot bearings in the CGBs. Conversely, when the laminated rubber bearings were adopted, the slope value was the smallest. Since bearings and piers respectively are designed as anti-seismic fuses and the primary earthquake-resisting components, their stiffness levels can determine bridge dynamic performance and further affect the periods. Compared with the other two critical attributes, the boundary type affects the main bridge structure and the adjacent structure which will occur to vibrate first, which is determined by the results of the order following the solution of the eigenvalues, and the primary reason lies on the differences in the mass and stiffness between a structural frame and the adjacent spans. On one hand, the fitting effect exhibited in Figure 12 is poor and unstable from the determination coefficient R2 of the traditional linear regressions with single variable under the different conditions. On the other hand, it can be observed that the detailed information of the bridges is not easily obtained, yet the structural and geometric characteristics which can be easily obtained are particularly significant. It was meaningful for the bridges group to rapidly consider the trend between the critical parameters and the fundamental periods during the initial stages.
Simplified regression relationship between the fundamental periods and the important properties.
Parameterized vibration characteristic analytical ML models are developed for the case bridge groups owing to their superior performance relative to the traditional multiple repeated single-parameter regressions, which here have several advantages. First, the fundamental mode and period of the bridge can be quickly obtained by the best models for a wide range of cases without repeated finite element simulations, if the point estimates of the bridge attributes are available. Second, the sensitivity of vibration characteristic to a specific parameter or combination of different attributes can be studied by the trained optimal models, rather than by the control variable method repeated many times. Finally, in terms of the effect of traditional linear regression using important attributes, the accuracy of the optimal model has been greatly improved.
To demonstrate the effectiveness of the optimal ML model, the individual parameter configurations of an SSGB and a CGB in the line are examined, as demonstrated in Table 3. The fundamental mode and period obtained by using the research framework proposed in this paper are compared with the results of finite element method (FEM), as shown in Figure 13. The fundamental mode shapes identified by the optimal ML model are consistent with that of the FEM outputs. Also, the fundamental periods of the optimal ML model are 1.5 and 0.664 s respectively, and the relative error with the FEM calculation value is 6.61% and 1.88% respectively. It can be seen that the ML models presented in this paper enable adequate and efficient predictions of bridge-specific vibration characteristics with low computational cost. These features may be incorporated within regional risk assessment packages for efficient computation of bridges vibration characteristics in transportation networks.
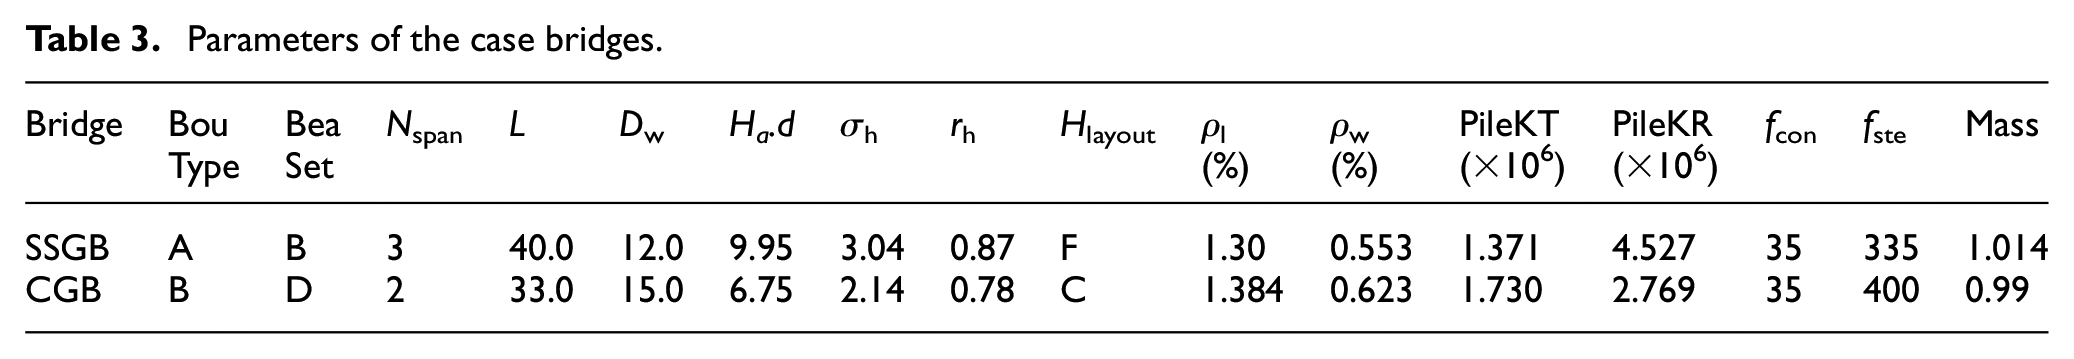
Parameters of the case bridges.
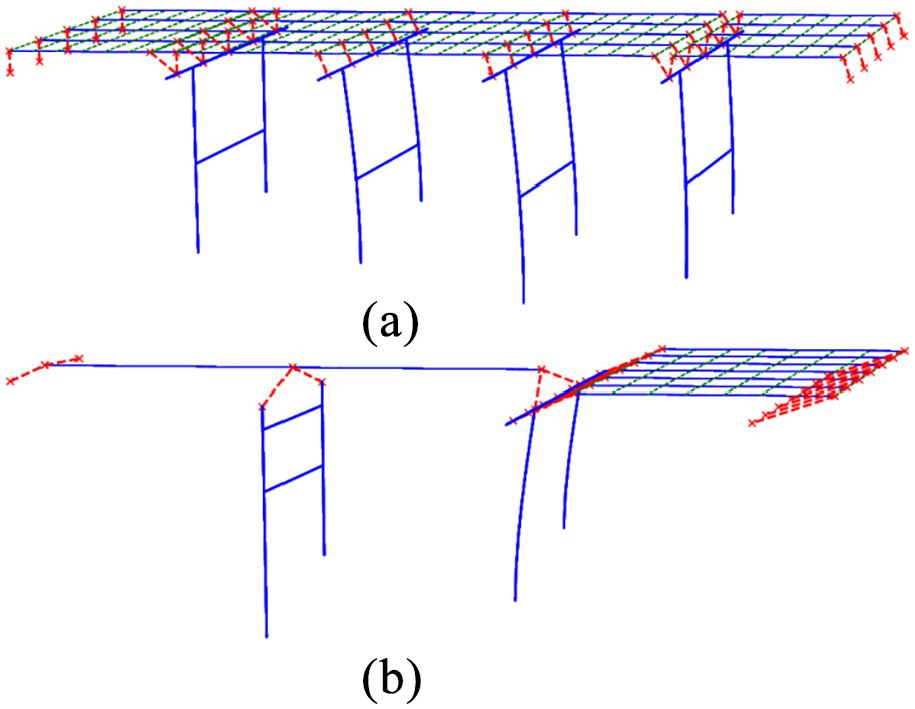
Comparison of proposed ML models and FEM for vibration characteristic of the case bridges: (a) SSGB with girder vibration label and (b) CGB with adjacent span vibration label.
Conclusions
In the present study, based on the statistics and sampling of bridges in the examined highway system, the fundamental mode shapes and periods of the sampled bridge groups were analyzed using research framework ML models. The following conclusions were reached in this study from the obtained results:
The statistical distributions based on non-parametric statistics and goodness of fit tests were determined to accurately represent the structural, geometric, and material properties of the bridges in the examined line. Using the statistical distribution patterns, the parameterized bridge numerical models of 1800 bridge samples generated by LHS were established. These provided a basis for the accurate dynamic analyses of the bridge groups.
The fundamental vibration modes were successfully divided into the longitudinal vibrations of the main girders and longitudinal vibrations of adjacent spans and side piers. The fundamental periods were confirmed to have satisfied the normal distribution requirements and were mainly distributed in the range of 0.7–1.5 s. Although all of the attributes were directly mixed together to estimate the mode shapes and periods, the RF models were found to have the best performance with an accuracy of more than 90% for vibration mode problems. Meanwhile, the ANN models had achieved the best performance for the periodic problem. The shortcomings including grouping the bridge classes and traditional multiple repeated single-parameter regression can be eliminated by the framework suggested in this study.
The most sensitive attributes affecting the fundamental mode shapes and periods were the bearing settings, ratios of the pier heights to the section diameters, and the boundary types. The simplified relationships between the periods and the important attributes were obtained in further investigation. It is possible to apply the critical bridge attributes for simplicity although this may affect the accuracy, which cannot match that of the best model.
The interest of the proposed framework is to intelligently accelerate the estimation processes of the structural vibration characteristics when the available information is limited and would be generally suitable for future dynamic characteristics estimation of the similar structures. Note that the trained optimal ML models should be directly applied to bridges similar to the sample bridge group, and further studies are needed to assess the performance of the proposed framework for other bridge configurations and areas.
Footnotes
Declaration of conflicting interests
The author(s) declared no potential conflicts of interest with respect to the research, authorship, and/or publication of this article.
Funding
The author(s) disclosed receipt of the following financial support for the research, authorship, and/or publication of this article: This study was funded by the Science and Technology Project of Transportation Group of Shanxi Province (18-JKKJ-08, 18-JKKJ-08 and 19-JKKJ-11), This study was supported by the Transportation Construction Science and Technology Project of Department of Transportation of Shanxi Province (2020-2-01), Transportation Construction Science and Technology Project of the Transportation Department of Inner Mongolia Autonomous Region (NJ-2020-17).