



Abstract
Bridge modal identification using an instrumented test vehicle as a moving sensor is promising but challenging. A key factor is to extract bridge dynamic components from vehicle responses measured when the bridge is operating. A new method based on an advanced adaptive signal decomposition technique, the successive variational mode decomposition (SVMD), has been developed to estimate the bridge modal parameters from the dynamic responses of a passing test vehicle. When bridge-related dynamic components are extracted from the decomposition, the natural excitation technique and/or random-decrement technique based fitting methods are used to estimate the modal frequencies and damping ratios of the bridge. Effects of measurement noise, moving speed and vehicle properties on the decomposition are investigated numerically. The superiority of SVMD in the decomposition is verified by comparing to another adaptive decomposition technique, the singular spectrum decomposition. The results of the proposed method confirm that the bridge modal frequencies can be identified from bridge related components with high accuracy, while damping ratio is more sensitive to the random operational load. Finally, the feasibility of the proposed method for bridge monitoring using a moving test vehicle is further verified by an in-situ experimental test on a cable-stayed bridge. The components related to the bridge dynamic responses are successfully extracted from vehicle responses.
Keywords
Introduction
Bridge modal identification using an instrumented test vehicle has drawn great attention due to its significant potential for quick scan of bridge structural health conditions (Locke et al., 2020; Yang et al., 2020). The sensing vehicle measuring bridge dynamic responses under operational conditions is more convenient and cost-effective compared to the conventional fixed sensing networks mounted on the structure. Modal parameters identified from vehicle responses can be used to assess the health conditions of bridge (Mei et al., 2019). However, the extraction of useful dynamic information from vehicle responses for bridge health monitoring is not trivial (Hester and González, 2017; Tan et al., 2019). The vertical dynamic response of vehicle passing over a bridge is a multi-component signal mainly including the bridge dynamic component, vehicle dynamic component and driving component (Yang et al., 2004). When bridge surface roughness is considered, the vehicle related dynamic component is amplified and the bridge related dynamic information becomes less visible.
To enhance the drive-by bridge modal identification, signal processing techniques have been used to reduce the effects of road surface roughness and to extract bridge related dynamic information. Wavelet transform based methods have been used to separate the bridge dynamic information from the vehicle dynamic response (Jian et al., 2020; Li et al., 2021). However, the selection for the optimal wavelet parameters is an arbitrary process that may cause uncertainties (Tan et al., 2020). Empirical mode decomposition (EMD) as a data-adaptive technique has been used to decompose vehicle response (Yang and Chang, 2009; Yang and Lee, 2018) into a set of intrinsic mode functions (IMFs). The recovered IMFs by repeated siftings process in EMD made bridge frequencies more visible in the first few IMFs. The IMFs extracted from vehicle response were used as damage indicators of bridge structure (Kildashti et al., 2020; O’Brien et al., 2017). EEMD method introduced by Wu and Huang (2009) to address the mode mixing problem of the EMD was used to identify bridge modal frequencies from vehicle response (Zhu and Malekjafarian, 2019). The results showed that EEMD method provided better performance on the decomposition of vehicle responses compared to EMD. Singular spectrum analysis (SSA) (Elsner and Tsonis, 1996) is another powerful technique for time series decomposition and eigenvalue identification that has been applied in the field of drive-by bridge modal identification. Yang et al. (2013) applied SSA method to identify the bridge frequencies from the test vehicle response. A combination of SSA with band-pass filter can filter out the vehicle-related dynamic components to improve the scan of bridge modal parameters. Li et al. (2019a) proposed a drive-by blind modal identification method (SSA-BSS) by combining SSA and second-order blind identification. However, SSA method requires manual selection of the embedding length. A new adaptive method, singular spectrum decomposition (SSD), for decomposing time series into narrow-banded components was proposed in (Bonizzi et al., 2014). The method is originated from SSA with an automated choice of fundamental parameters. Singular spectrum decomposition method has been shown to retrieve different components concealed in the data accurately to many fields. However, to the best knowledge of the authors, SSD has not been used to analyze vehicle responses for drive-by bridge inspection.
Moreover, Dragomiretskiy and Zosso (2014) proposed the variational mode decomposition (VMD), a noniterative and adaptive signal processing method. Due to its solid mathematical theoretical foundation compared with EMD, VMD-based methods have been used in different areas, such as the analysis of seismic signal (Li et al., 2018), underwater acoustic signal (Li et al., 2019b), structural system identification (Ni et al., 2018) and load data of mechanical systems (Fu et al., 2020). Tian and Zhang (2020) utilized VMD to decompose vehicle-induced bridge responses into IMFs to extract dynamic properties of the VBI coupled system. Yang et al. (2021) used VMD to extract the mono-components from contact-point responses of a VBI model to identify the frequencies and damping ratios of the bridge. The results demonstrated that VMD performed more efficiently and elegantly than EMD/EEMD in extracting the mono-component responses. Despite of its extensive application, the performance of VMD is greatly affected by the manually preset mode number and mode frequency bandwidth control parameter (Zhang et al., 2018). Nazari and Sakhaei (2020) proposed a novel successive variational mode decomposition (SVMD) method which extracts the components successively from signals. It is more effective for the signal decomposition than VMD when the number of components is unknown.
From the above literature review, it is found that the operational bridge modal identification from vehicle responses is challenging. Therefore, a method based on SVMD is developed to estimate the bridge modal parameters using a passing test vehicle. It can successively decompose vehicle responses into meaningful mono-components without requiring the number of components contained in the vehicle responses. This study investigates its performance in the decomposition of vehicle responses by comparing with that of SSD. The bridge related components are extracted to identify frequencies and damping ratios by incorporating natural excitation technique (NExT) and/or random-decrement technique (RDT) based modal identification algorithms, respectively.
The rest of the paper is organized as follows. Vehicle-bridge interaction model considering operational load presents the vehicle bridge interaction model that describes the dynamics of bridge structure under operational moving load and the response measurement of moving test vehicle. Bridge modal identification based on adaptive signal decomposition from a test vehicle briefly introduces the SVMD for the decomposition of vehicle responses. The NExT and RDT to be used for damping ratio identification are also described. Extensive numerical study is conducted in Numerical study to demonstrate the decomposition results of the adaptive techniques. Feasibility of the incorporated damping ratio identification methods is investigated. Finally, the vehicle response measured from an in-situ vehicle-bridge interaction test is used to further verify the effectiveness of the decomposition methods which is followed by conclusions.
Vehicle-bridge interaction model considering operational load
For the implementation of vibration-based bridge health monitoring, sufficient external load is usually required to excite the bridge structure to a certain extent (Makki Alamdari et al., 2021). For a bridge subjected to a medium to large volume of random operational traffic, the spatio-temporal load pattern can be modeled as a random white noise with sufficient accuracy (Sadeghi Eshkevari et al., 2020). Therefore, the VBI model considered for bridge modal identification is shown in Figure 1. The moving load P in the figure represents the operational load and a widely used single-degree-of-freedom quarter car is utilized as the instrumented test vehicle. The acceleration response measured from the sensing vehicle is used for bridge modal identification. The operational load enters the bridge ahead of the sensing vehicle with a moving speed

The model of drive-by bridge inspection in operational condition.
Bridge model under operational load
The simply supported bridge with a length L can be modelled with finite element model. When the moving operational load

where

where NN is the total number of DOFs for the bridge model; the shape function

with
Dynamics of the test vehicle
The vehicle parameters are:

where
Model of road surface roughness
A widely used random roughness surface simulated based on ISO-8606 (1995) is considered. The random roughness in time domain can be given as follows (Henchi et al., 1998)

where

Road roughness profile.
Bridge modal identification based on adaptive signal decomposition from a test vehicle
SVMD
For the multi-component vehicle response with N data points,

where

The decomposition method is based on the following four criteria
(1) Each mode should be compact around its center frequency. The k-th mode minimizes the following criterion:

where
(2) The energy of the residual signal

To get minimized spectral overlap between

where
(3) Besides the minimization of criteria

This added criterion is represented as follows

where
(4) The last constrain is to guarantee the reconstruction of

When k-1 modes are known, the problem of extracting the k-th mode can be expressed as a constrained minimization problem, in which a combination of
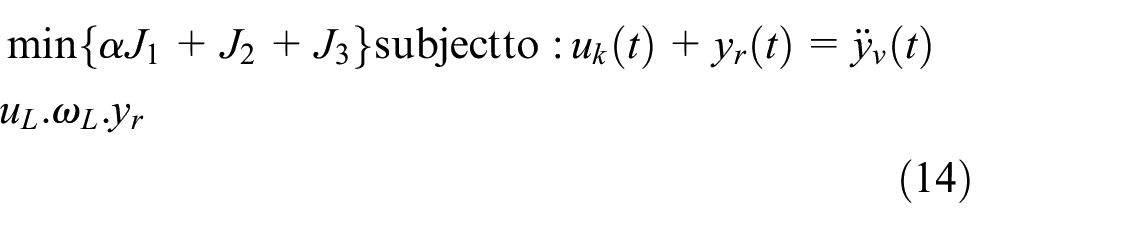
where
Bridge modal identification using a moving test vehicle
In this study, it is assumed that the properties of sensing vehicle are known, and vehicle’s frequencies are not coincided with those of bridge. Therefore, the bridge related dynamic mono-components can be extracted from vehicle response for the identification of bridge modal frequency and damping ratio (Yang et al., 2021). When the mono-components related to the bridge dynamic modes are extracted, the frequency can be easily identified and the damping ratio for each mode can be estimated by the least-squares fitting an exponential decay to the envelop of the impulse response function (IRF) of the system. Since the IRF is not directly available, the NExT and/or RDT are applied to extract the impulse response function from the mono-component.
The NExT and RDT can be used to estimate the impulse response function by calculating the auto-correlation function of the measured response of a structure under random or ambient excitation. The auto-correlation function is closely related to the free-decay response of the structure (James et al., 1993). For NExT, the correlation function can be estimated using direct procedure with time domain data or via calculating spectral density functions. The calculation of correlation function requires a preset time lag T. While the principle of RDT is to estimate random decrement signatures by averaging time segments of the responses. These segments are selected under certain triggering conditions. For the application of RDT, two key parameters, i.e. the trigger threshold

Flow chart of the bridge modal identification using moving test vehicle.
Numerical study
Numerical study is conducted to analyze the effectiveness of the method for extracting mono-components from vehicle responses and drive-by bridge modal identification. The properties of the bridge are: length

The operational load and vehicle response. (a) The operational load, (b) Vehicle response and PSD of response.
Drive-by bridge modal identification using SVMD and SSD
The performance of SVMD for decomposing the vehicle responses is investigated by comparing to that of SSD. The noise polluted measurement of the vehicle response is simulated as ynoisy = ytrue+noise%× SD(ytrue)×WGN, where ytrue is the calculated vehicle response;

The decomposed components by singular spectrum decomposition and successive variational mode decomposition. (a) In time domain, (b) In frequency domain.
Parametric study
Different measurement noise
The effects of the measurement noise on the decomposition performance of the methods are studied by considering different noise levels to be added into the simulated vehicle acceleration. Three different noise levels are considered, i.e. 0%, 5%, and 15%. The decomposition on the noise polluted measurements is performed using SSD and SVMD respectively. The obtained components and their spectra considering different noise levels are shown in Figure 6(a) and (b), respectively. In the figure, three components related to the first bridge mode, the vehicle mode and the second bridge mode can be clearly identified, respectively. The results confirm the robustness of two techniques to the measurement noise. In the rest part of the numerical study, 5% measurement noise is used in the simulation.

The decomposed components considering different measurement noise. (a) Using singular spectrum decomposition, (b) Using successive variational mode decomposition.
Effect of the vehicle speed
In the previous study, the vehicle speed is set as 2 m/s. To study the effects of vehicle speed on the decomposition, a higher vehicle speed is considered, i.e. 6 m/s. SSD and SVMD are used to decompose the vehicle response and the decomposed components are shown in Figure 7 along with their spectra. The results show that only the vehicle related dynamic component is clearly extracted. The components related to the bridge are heavily contaminated due to the effects of surface roughness and higher vehicle speed. When a high vehicle speed is used, the dynamic response of test vehicle will be enhanced. The vehicle-related dynamic component in the response become more prominent that makes the bridge-related dynamic component less visible. Besides, a lower vehicle speed can lead to a longer measurement time of the response that is beneficial to the identification of higher vibration mode of the bridge and a higher accuracy of the modal parameters. Therefore, it is confirmed that a low speed of sensing vehicle is beneficial to the drive-by bridge health monitoring. Moreover, it can be seen that SVMD outperforms SSD in extracting purer modes.

The decomposed components in time and frequency domains when vehicle speed is 6 m/s. (a) In time domain, (b) In frequency domain.
Extraction of close modes between the vehicle and bridge
In above studies the frequency ratio between the vehicle and bridge frequency is 6.99/2.68 = 2.61. To further study the performance of the adaptive methods, a close frequency case between the vehicle and bridge is discussed. The stiffness of the vehicle suspension is set as 1/4 of the original value. Therefore, the fundamental frequency of the vehicle becomes 3.49 Hz and the frequency ratio between the vehicle and bridge is 1.30. The vehicle response is analyzed using those two methods and the results are shown in Figure 8. Figure 8(a) shows the components and their spectra using SSD and the decomposed components by SVMD are shown in Figure 8(b). In Figure 8(a), the first component is dominated by the first bridge mode, the second component includes both the vehicle and the first bridge modes and there is a clear peak related to the second bridge mode in the third component. The results show that the vehicle and the first bridge modes cannot be separated successfully by SSD. In Figure 8(b), three components are separated successfully and the first, second and third components are related to the first bridge, the vehicle and the second bridge modes respectively. The results show that SVMD can identify both the vehicle and bridge modes for the close mode case.

The decomposed components in time and frequency domains. (a) Using singular spectrum decomposition, (b) Using successive variational mode decomposition.
Bridge modal parameter identification using multiple passes
The effectiveness of adaptive signal decomposition using SVMD has been discussed in Drive-by bridge modal identification using SVMD and SSD and Parametric study. This section is to study the bridge modal identification using extracted dynamic components. The dynamic modes decomposed by SVMD are used to estimate the bridge frequencies and damping ratios. To evaluate the accuracy of the proposed drive-by bridge modal identification method, the Monte Carlo method with 50 simulations is used to generate the vehicle response dataset to simulate multiple passes of the sensing vehicle considering random operational load. Each of these responses is analyzed by SVMD, and the components related to the first two dynamic modes of bridge are used for the identification of frequency and damping ratio. Another two different damping ratio values of bridge, i.e. 0.02 and 0.03 are also considered in simulating vehicle responses. The mean values and the standard deviation (std) of the identified frequencies for 50 passes are presented in Table 1. It can be seen that the mean values are very close to the theoretical values and the errors are all less than 1.5%. The results confirm that the bridge modal frequencies can be identified with high accuracy using the developed method.
Identified frequency considering different damping ratios.

The curve-fitting modal identification methods based on NExT and RDT are used to estimate the damping ratios from bridge dynamic components. As mentioned in Bridge modal identification using a moving test vehicle, the time lag T need to be preset. As such, five time lags,
Identified damping ratio considering random operational load.

For multiple tests using the vehicle, each of the identified first modal frequency and damping ratio of the bridge are shown in Figure 9. The result shows that both the frequency and damping ratio vary around the true values and the mean value from multiple tests can reduce the uncertainty due to the random operational load and measurement noise. The result also confirms that the identification of damping ratio involves more uncertainty and inaccuracy.

The identified modal parameters from multiple tests.
Experimental study on a cable-stayed bridge
In-situ vehicle-bridge interaction test is conducted to further verify the proposed method. Figure 10 shows the bridge and test vehicle for the experimental investigation. The bridge is a single lane cabled-stayed bridge with a span 46m and a width 6m crossing a busy highway. A long-term monitoring system has been installed on the bridge including a dense array of accelerometers under the bridge deck. The dynamic monitoring system continuously records the vibration response of the bridge and produces a file with an acceleration time series every 10 min at a sampling rate of 600 Hz. A total number of 66 10-mimute-file were elaborately selected from 22 days of monitoring data which were analyzed using the covariance-driven stochastic subspace identification method for modal parameter identification (Sun et al., 2017). The mean value of the natural frequency for each mode from the datasets is used as reference baseline and the first five modal frequencies of bridge are presented in Table 3. It was found that not all the modes were extracted from every signal dataset measured from bridge. The last column of Table 3 is the percentage of identification for each particular mode among 66 datasets. The percentage of identification for the third and fourth modes among the datasets is relatively small which means that these two modes are not dominated and less likely to be identified.

Bridge and vehicle used for experimental test.
Identified bridge frequencies using sensors on the bridge (Sun et al., 2017).

For the bridge modal identification using a test vehicle, a Hyundai Tucson 2006 vehicle is used. A wireless accelerometer (manufactured by BeanAir) is installed on the top surface of the dashboard of the vehicle. The vehicle responses are measured when it stops on the ground and on the bridge deck with its engine idling, respectively. Figure 11 shows the measured responses and their spectra. The results show that there are two dominated peaks at 17.5 Hz and 23.3 Hz in the spectrum and they are the vehicle engine-related frequencies as it is idling. In the results when the vehicle parks on the bridge deck, the peak at about 2.0 Hz is also visible and that is related to the first bridge vibration mode. The vehicle is driven multiple times on the ground with different speeds at 10, 20 and 30 km/h, respectively. The dynamic responses measured from the wireless sensor are used for spectrum analysis with Fourier transform. After analyzing all the responses, the first three vibration frequencies of the vehicle body when it is moving are about 1.1, 1.5–1.8 and 2.2–2.7 Hz, respectively.

Response measurements when vehicle stops on the road and bridge.
The dynamic response measured from the wireless sensor when the vehicle passes the bridge at a speed 10 km/h is shown in Figure 12. Successive variational mode decomposition and SSD are used to decompose the vehicle response. Figure 13(a) and (b) show the decomposed components and their spectra, respectively. In Figure 13(a), five components are extracted using SVMD. The frequencies of first two components are 1.05 Hz and 1.56 Hz and they are related to the vehicle dynamic responses. Other three components are around 2.05 Hz, 3.56 Hz and 6.23 Hz. Compared with the results using sensors on the bridge, these three components are corresponding to the first, second and fifth dynamic modes of the bridge respectively. The results show that the SVMD can successfully extract the bridge related dynamic components from vehicle response. Figure 13(b) shows three components extracted by SSD. The results show that the bridge related components are not extracted successfully. This further confirms the numerical results that the SVMD can decompose the mono-components from the vehicle responses when the frequencies of the vehicle and bridge are close.

Response measured in the vehicle and the response spectrum.

The decomposed components using successive variational mode decomposition and singular spectrum decomposition. (a) Using successive variational mode decomposition, (b) Using singular spectrum decomposition.
Conclusions
This study investigates the operational bridge modal identification based on the adaptive decomposition of vehicle responses using SVMD. The performance of SVMD is compared to that of SSD. Results of the parametric analysis demonstrate that the SVMD can extract the mono-components from vehicle responses effectively. The investigation confirms that the SVMD performs better than the SSD, especially when the frequencies of the components in the vehicle response are close. The NExT and RDT based modal identifications are incorporated to analyze the bridge related dynamic components to estimate the modal frequencies and damping ratios. The bridge modal parameters are identified accurately by computing the mean value of multiple tests when the damping ratio is 0.01 and 0.02, respectively. The damping ratio identification is more sensitive to the operational load than the frequency identification and the multiple tests can improve the accuracy of damping ratio identification when the bridge is subjected to random operational load. The contact-point response of the bridge usually calculated from vehicle response contains more dynamic information related to the bridge. The proposed SVMD based method has potential to improve the bridge modal identification using the contact-point response due to its effectiveness and accuracy in signal decomposition, that deserves further study in the future.
Footnotes
Declaration of conflicting interests
The author(s) declared no potential conflicts of interest with respect to the research, authorship, and/or publication of this article.
Funding
The author(s) disclosed receipt of the following financial support for the research, authorship, and/or publication of this article: This research is supported in part by research funding of the National Natural Science Foundation of China (52108288, 52078461, U1709207, 51878433), Key R&D program of Zhejiang (2019C03098) and Zhejiang Provincial Postdoctoral Science Foundation (ZJ2020024). The financial aid is gratefully acknowledged.
