




Abstract
Because of the excellent tensile and compressive strength and durability of ultra-high-performance concrete (UHPC), a precast UHPC tube filled with normal concrete (NC) (abbreviated as NFUT) has been proposed to accelerate structure construction, reduce maintenance cost, and enhance the bearing capacity. However, the long-term deformation of the NFUT composite column has been rarely studied. To numerically analyze the long-term deformation of the new NFUT composite column due to concrete creep and shrinkage, the individual creep and shrinkage models for the NC column and the precast UHPC tube are needed. The objective of the present research was to conduct the shrinkage and creep tests and determine the creep and shrinkage models for the NFUT structure, fitting the existing models in different codes and standards with collected test data. Results showed that the B3 model effectively simulates the creep and shrinkage of the NC column, and the modified ACI209 model is suited for the creep of the precast UHPC tube. Moreover, a finite element model (FEM) of an actual bridge using the NFUT composite piers is established to verify the proposed models and highlight the structure’s advantages. Through the FEM result comparison between the full NC and NFUT composite piers, the maximal vertical deformation of the pier top is reduced by 56.6%, and the average NC stress at the pier bottom is reduced by 19.9% due to the 10-year shrinkage and creep in the composite piers. The NFUT piers significantly reduce the midspan vertical deformation and side-span rotations around the transverse direction, while its effect on the key cross-sectional normal stresses of the main girder is small.
Introduction
In recent decades, ultra-high-performance concrete (UHPC) has been developed by the particle packing density method, which optimizes the constituents and proportions from the nanoscale to microscale to get a more uniform and homogeneous microstructure with less porosity and voids (De Larrard and Sedran 1994; Graybeal 2006). UHPC with a low water-cement ratio (smaller than 0.2) exhibits high tensile strength, compressive strength, low permeability, and high durability due to the high internal densification (Graybeal and Baby 2013; Meng and Khayat 2016, 2018; Richard and Cheyrezy 1994; Wille et al., 2014a). After the UHPC is subject to thermal treatments, the mechanical properties can be further enhanced because of the activation of silica fume and pozzolanic reactions that are beneficial to refining the pore size at a micro-level (Garas et al., 2012). Also, the creep and shrinkage of UHPC after steam curing are reduced, making it suitable for prefabricating concrete structures in a casting plant (Garas et al., 2009) before transporting them for on-site construction. With the addition of steel fibers, the cracking resistance, toughness, and post-cracking ductility of UHPC are improved (Alberti et al., 2018; Baby et al., 2013; Larsen and Thorstensen 2020; Wille et al., 2014b; Yoo et al., 2016). Based on these excellent physical and mechanical properties, UHPC has been a popular solution for new and existing engineering structures to overcome some of the challenges encountered in conventional concrete, accelerate structure construction, and reduce the maintenance cost (Brühwiler 2017; Habel et al., 2007).
One of the recent applications is using a precast UHPC tube filled with normal concrete (NC) (abbreviated as NFUT) as a composite column. This composite structure has been proposed by Shan et al. (2018 and 2021), and the concept stems from the concrete-filled steel tube composite column (Jiao et al., 2020; Younas et al., 2021). The precast UHPC tube has three functions in the composite column: bearing considerable external load, confining the NC core, and functioning as the formwork. Also, the UHPC-NC cross-section shows acceptable composite behavior (Hussein et al., 2016). The axial compression behavior and seismic behavior of the NFUT composite column have been experimentally investigated by Shan et al. (2018 and 2021). Also, Tian et al. (2020 and 2021) experimentally and numerically investigated the static and cyclic mechanical behavior of the NFUT composite column. However, the long-term deformation of the NFUT composite column has been rarely studied. To study the creep and shrinkage of the individual components, the precast NFUT column provides a basis for further theoretical and numerical analysis of the long-term deformation, giving design suggestions and promoting future applications in structural engineering.
For the UHPC shrinkage and creep studies, the shrinkage of UHPC was reduced after steam curing (Collepardi et al., 1997), and a similar conclusion was found by Richard and Cheyrezy (1994) for UHPC after thermal curing at 90
To further enrich the concrete creep and shrinkage behavior database in the natural environment, this study conducted shrinkage and creep tests for NC and NFUT columns. Then, the precast NFUT column shrinkage effect was investigated by comparing the existing shrinkage models from different codes. The creep behavior of the precast UHPC tube was studied to obtain the creep model for further numerical analysis of the NFUT composite column. In addition, an application case using the NFUT composite column in a bridge was numerically investigated using a finite element method (FEM) for highlighting the technical advantages of the new NFUT composite bridge pier.
Existing shrinkage and creep models
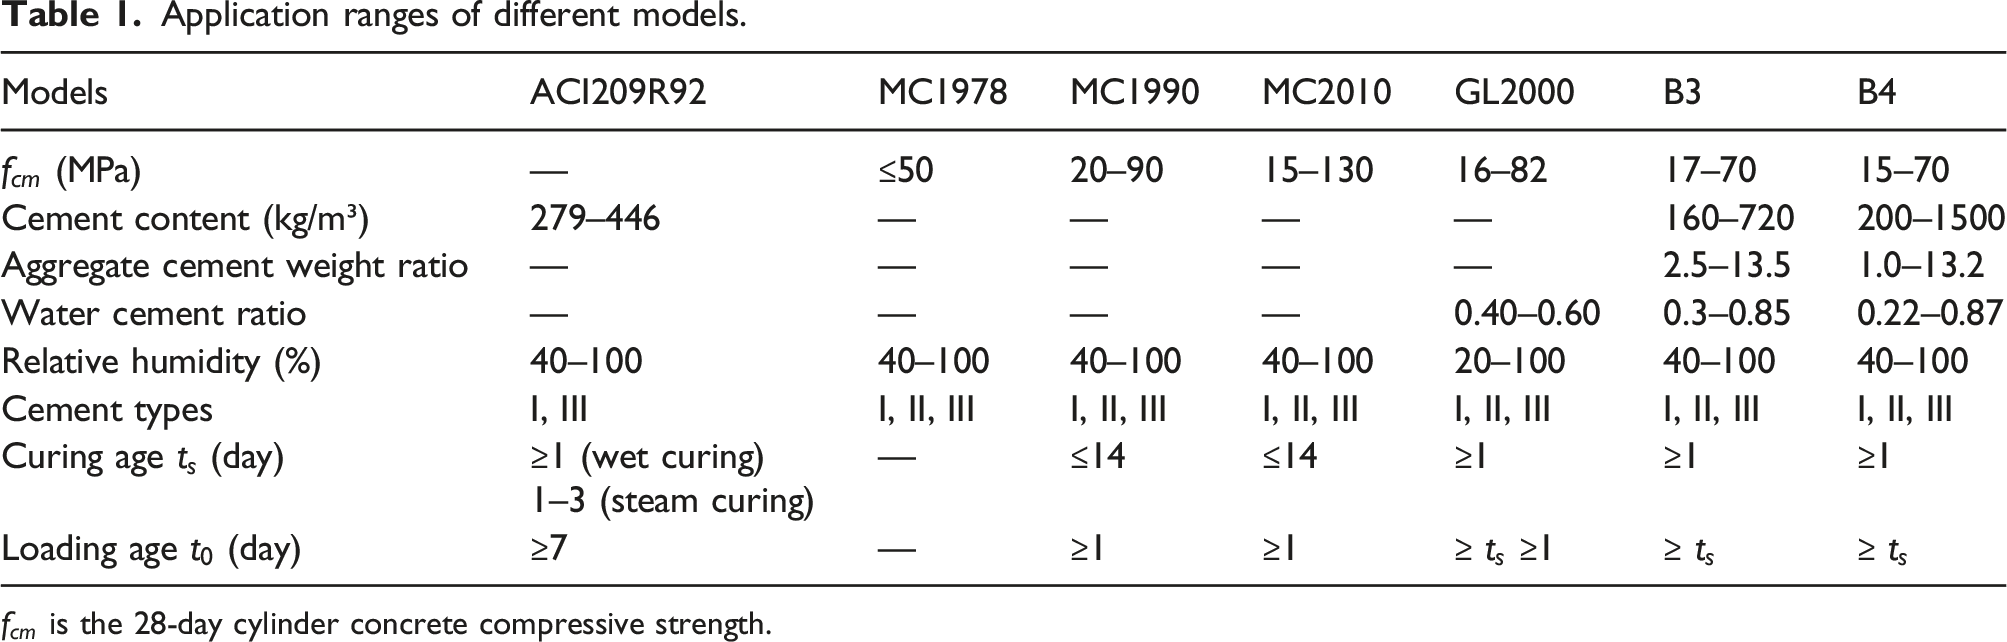
Application ranges of different models.
Experimental program
Specimen design and preparation
Specimen parameters.

The nominal stress level is defined as a ratio of the axial load divided by the cross-sectional area of the specimen.

Specimen details (unit: mm) (a) NC, (b) UHPC tube, and (c) NFUT columns.
Loading and instrumentation
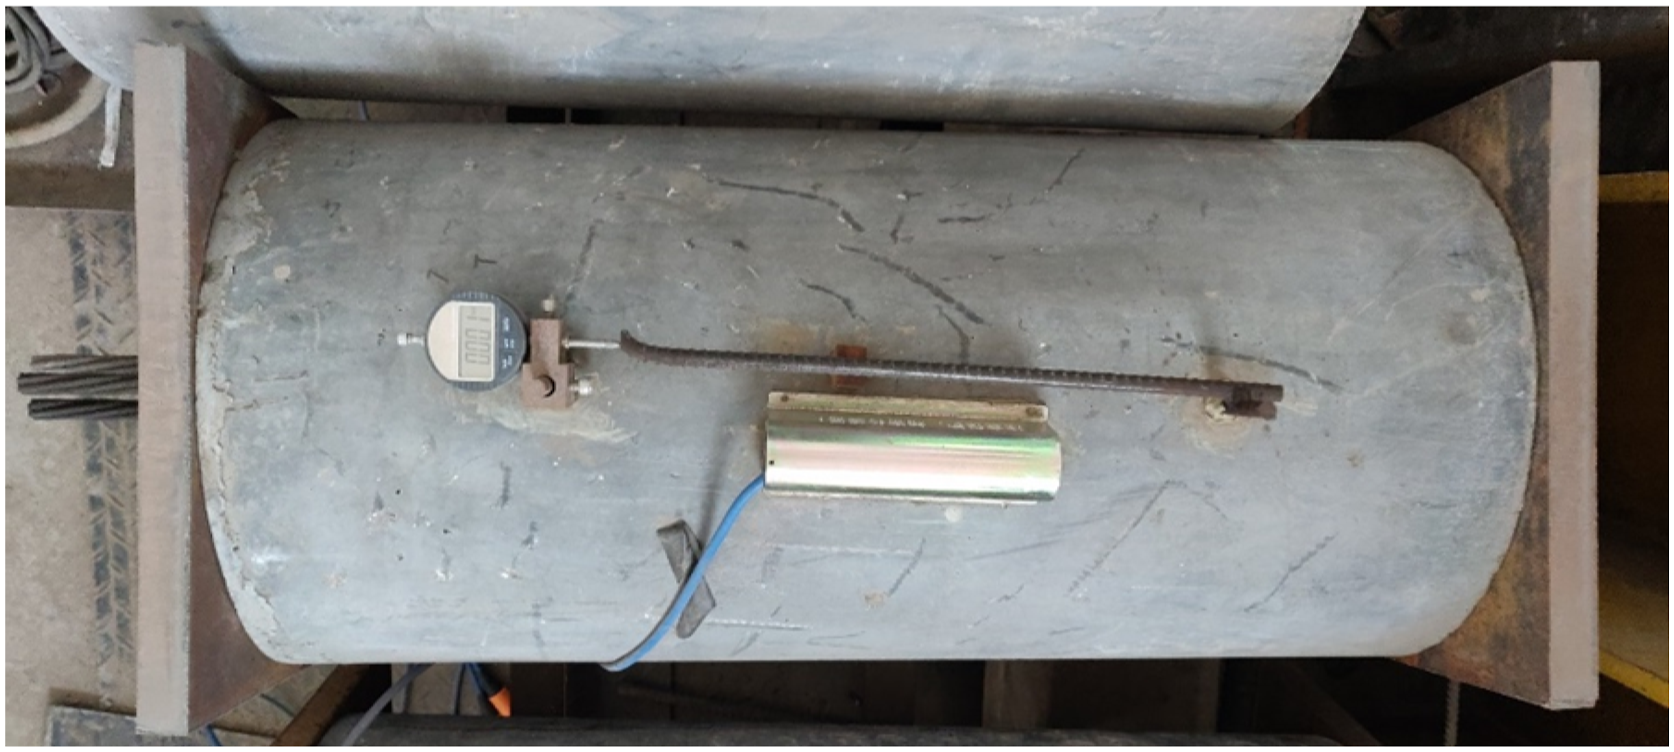
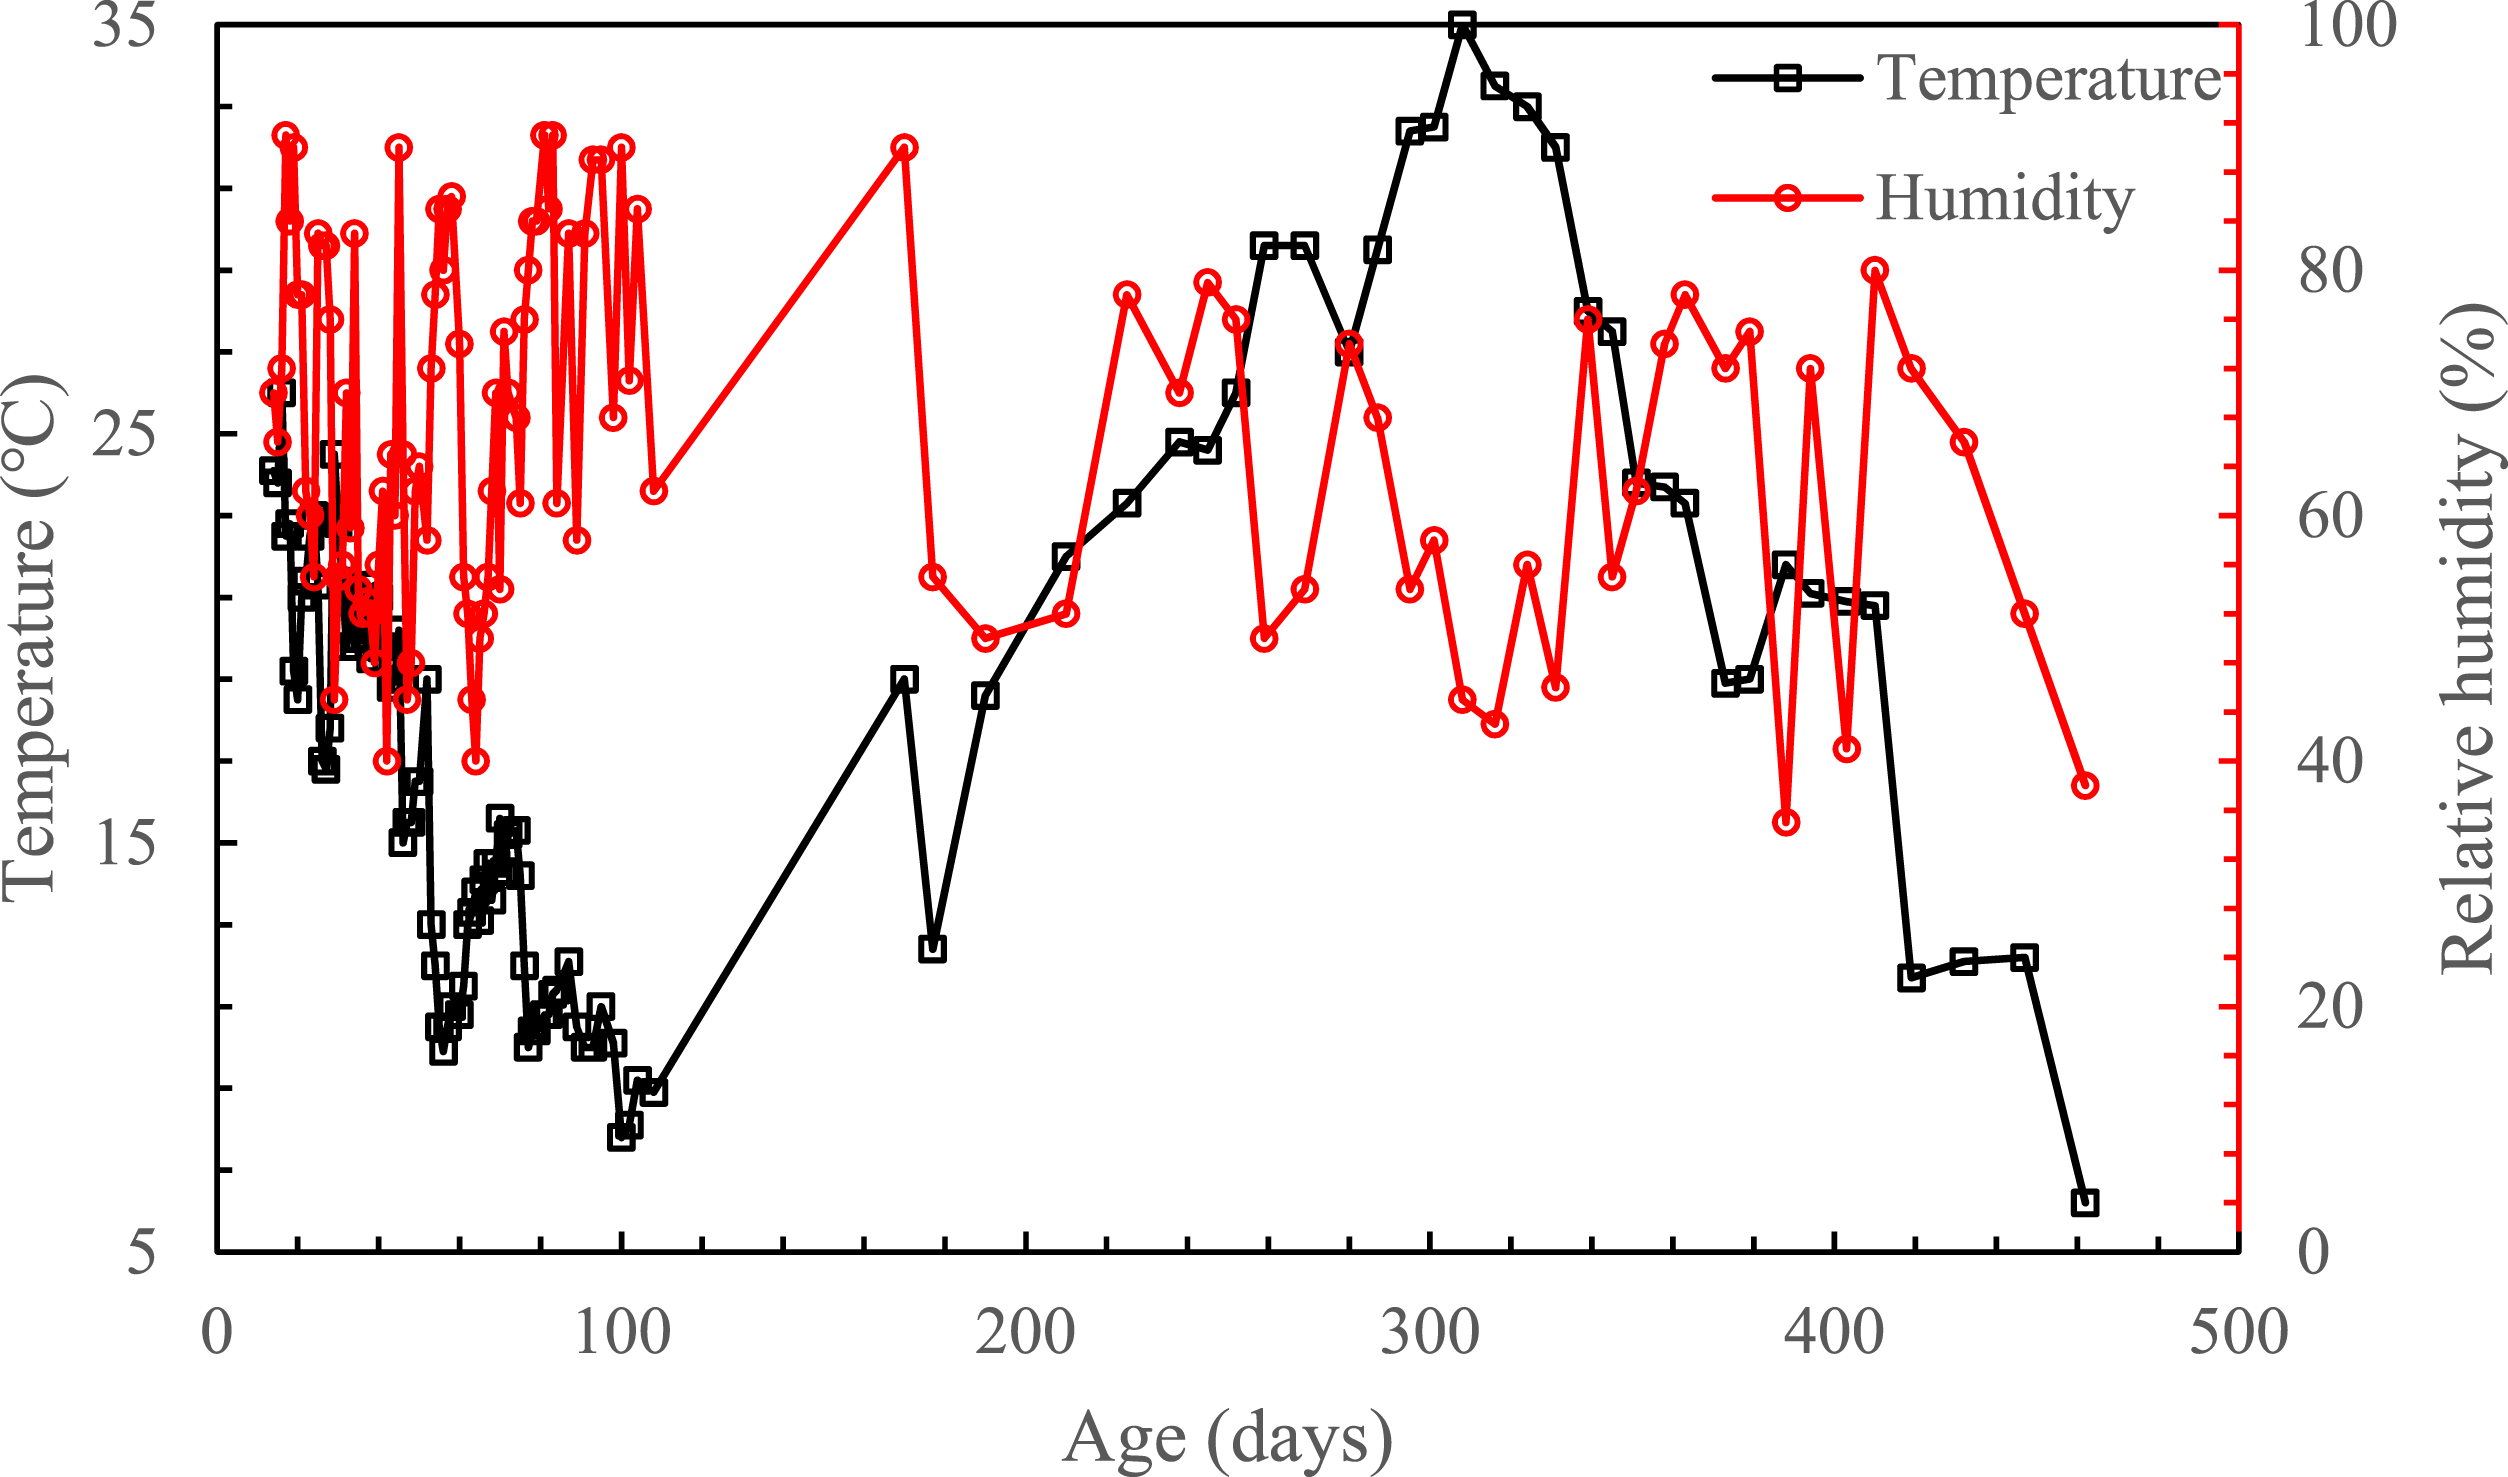
The steel strands were used to apply the creep loading using a double-tensioned technology, as shown in Figure 2. This double-tensioned technology can effectively reduce the prestressed loss, stabilize, and simplify the creep loading (Shao et al., 2014). The measuring points and installation of vibration-based strain gauges and dial gauges are shown in Figures 2 and 3. The two strain gauges were embedded before the NC was cast to measure shrinkage and creep of the NC column. Also, one dial gauge with a gauge length of 400 mm was installed on the surface of the NC column. For measuring creep of the UHPC tube, one surface attached strain gauge and one dial gauge were installed on the UHPC tube surface. The total shrinkage and creep test period were 433 days. In the first 60 days, the time interval for measurement was 1 day, while the time interval became 2 weeks later due to the COVID19 pandemic. The shrinkage and creep specimens were exposed in the natural lab environment. The temperature and humidity conditions during the test are shown in Figure 4. Loading setup and measuring points (a) NC column and (b) UHPC tube. Installation of surface-attached strain gauge and dial gauge on UHPC tube. Measured environmental temperature and humidity.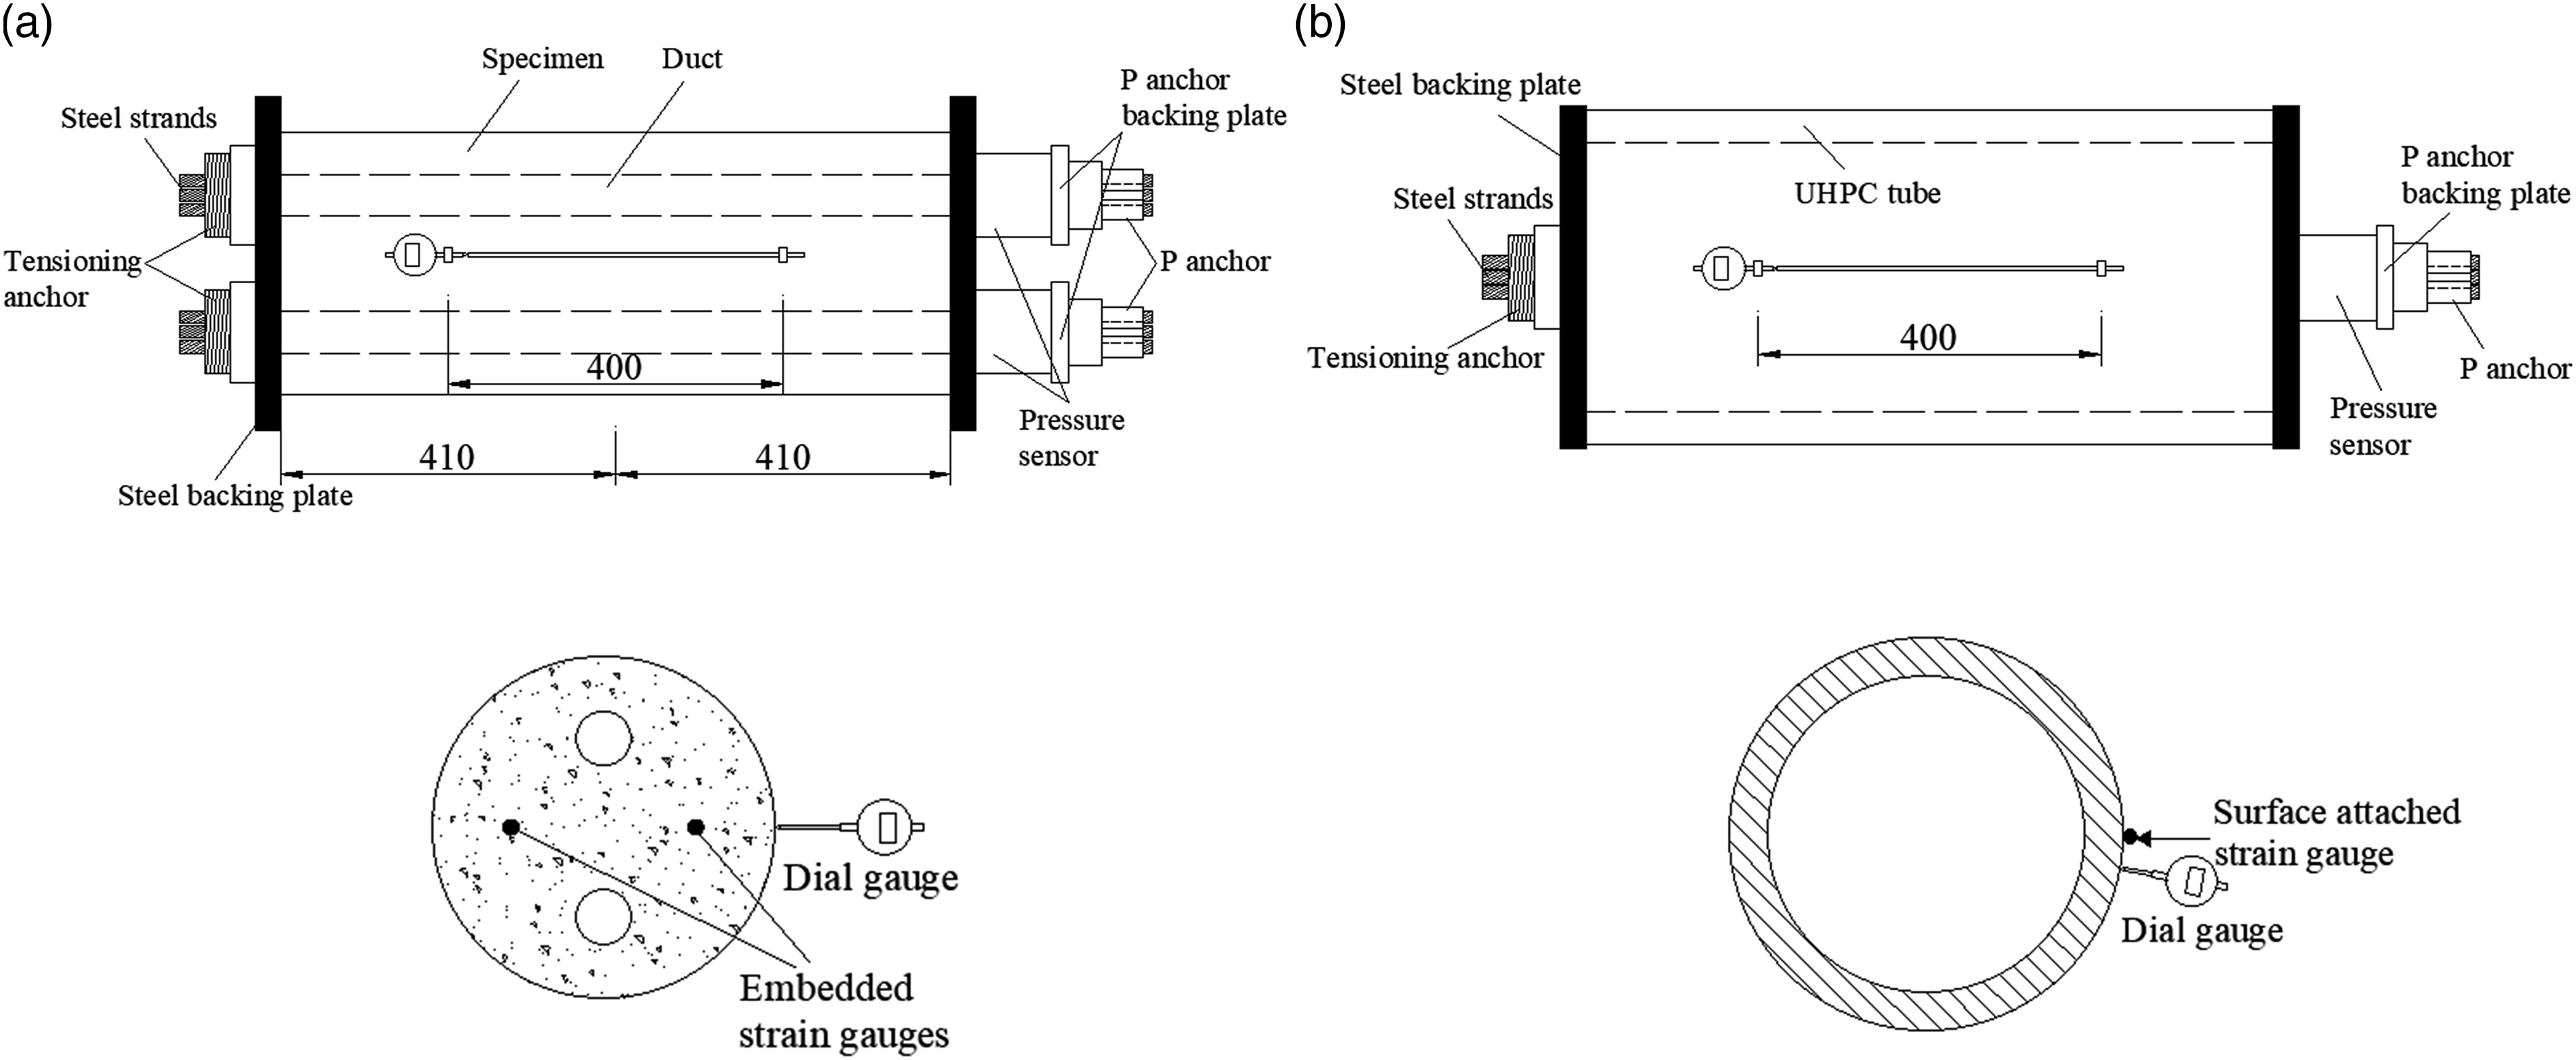
Moreover, to measure the shrinkage of the NC core of the NFUT composite column, two embedded strain gauges and one dial gauge were used, which resembles those for the NC column. However, attention should be paid to installing the dial gauge, and the drilled holes penetrating through the wall of the precast UHPC tube before casting NC were needed to install the dial gauge to measure the NC core strain. Sine vibration-based strain gauges were used, the measured strain results need to be calibrated due to the temperature effect. Equation (1) shows the calibration formula.
Mix proportions of NC and UHPC.
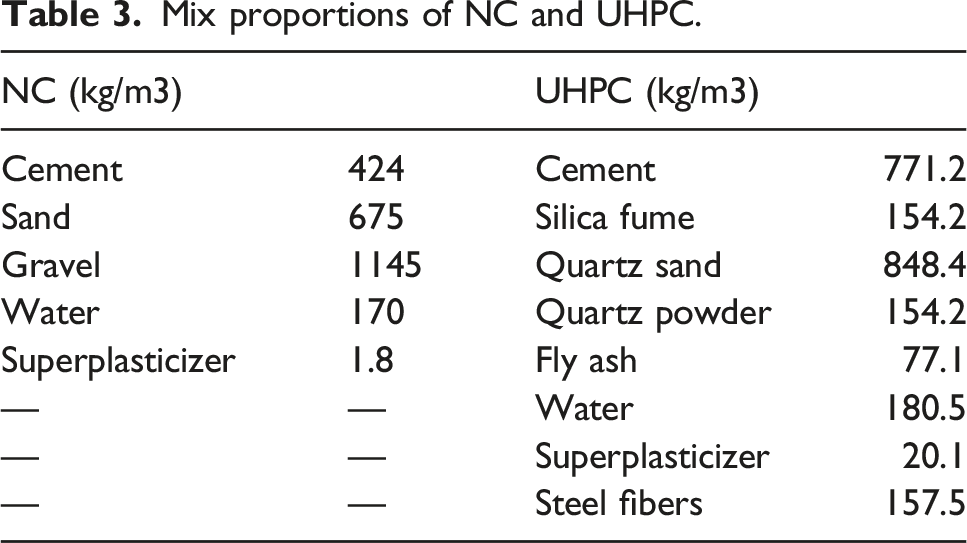
In accordance with the codes Ministry of Housing and Urban–Rural Development (2002) and AQSIQ and SA (2015), the mechanical properties of the NC and UHPC were tested, respectively. The specimens with dimensions of 150 mm × 150 mm × 150 mm and 150 mm × 150 mm × 300 mm were prepared for the NC. The specimens with dimensions of 100 mm × 100 mm × 100 mm and 100 mm × 100 mm × 300 mm were prepared for the UHPC. The specimens for the mechanical properties were cast with the same batch and had the same curing conditions as the tested specimens. The UHPC was steam cured at a temperature of 90
Results and discussion
Shrinkage and creep test results
Figure 5 shows the shrinkage strain results of the S-NC and S-CC, and each curve represents the average measured results from the embedded strain gauges or dial gauge. For example, the S-NC-1 curve represents the average strain result from the embedded strain gauges. The measured results show good consistency for each specimen. Overall, the shrinkage strain of the S-NC specimen is greater than the NC core of the S-CC specimen. When the tests end, the shrinkage strain of the NC core is 61.9% of that of the S-NC specimen, which is attributed to the volume surface area ratio and restraint of the UHPC tube. The NC core of the S-CC specimen is restrained by the UHPC tube and has a small contacting area with the air (i.e., high volume surface area ratio), resulting in slow inside water transportation and slow shrinkage development. Shrinkage strains of S-NC and S-CC specimens.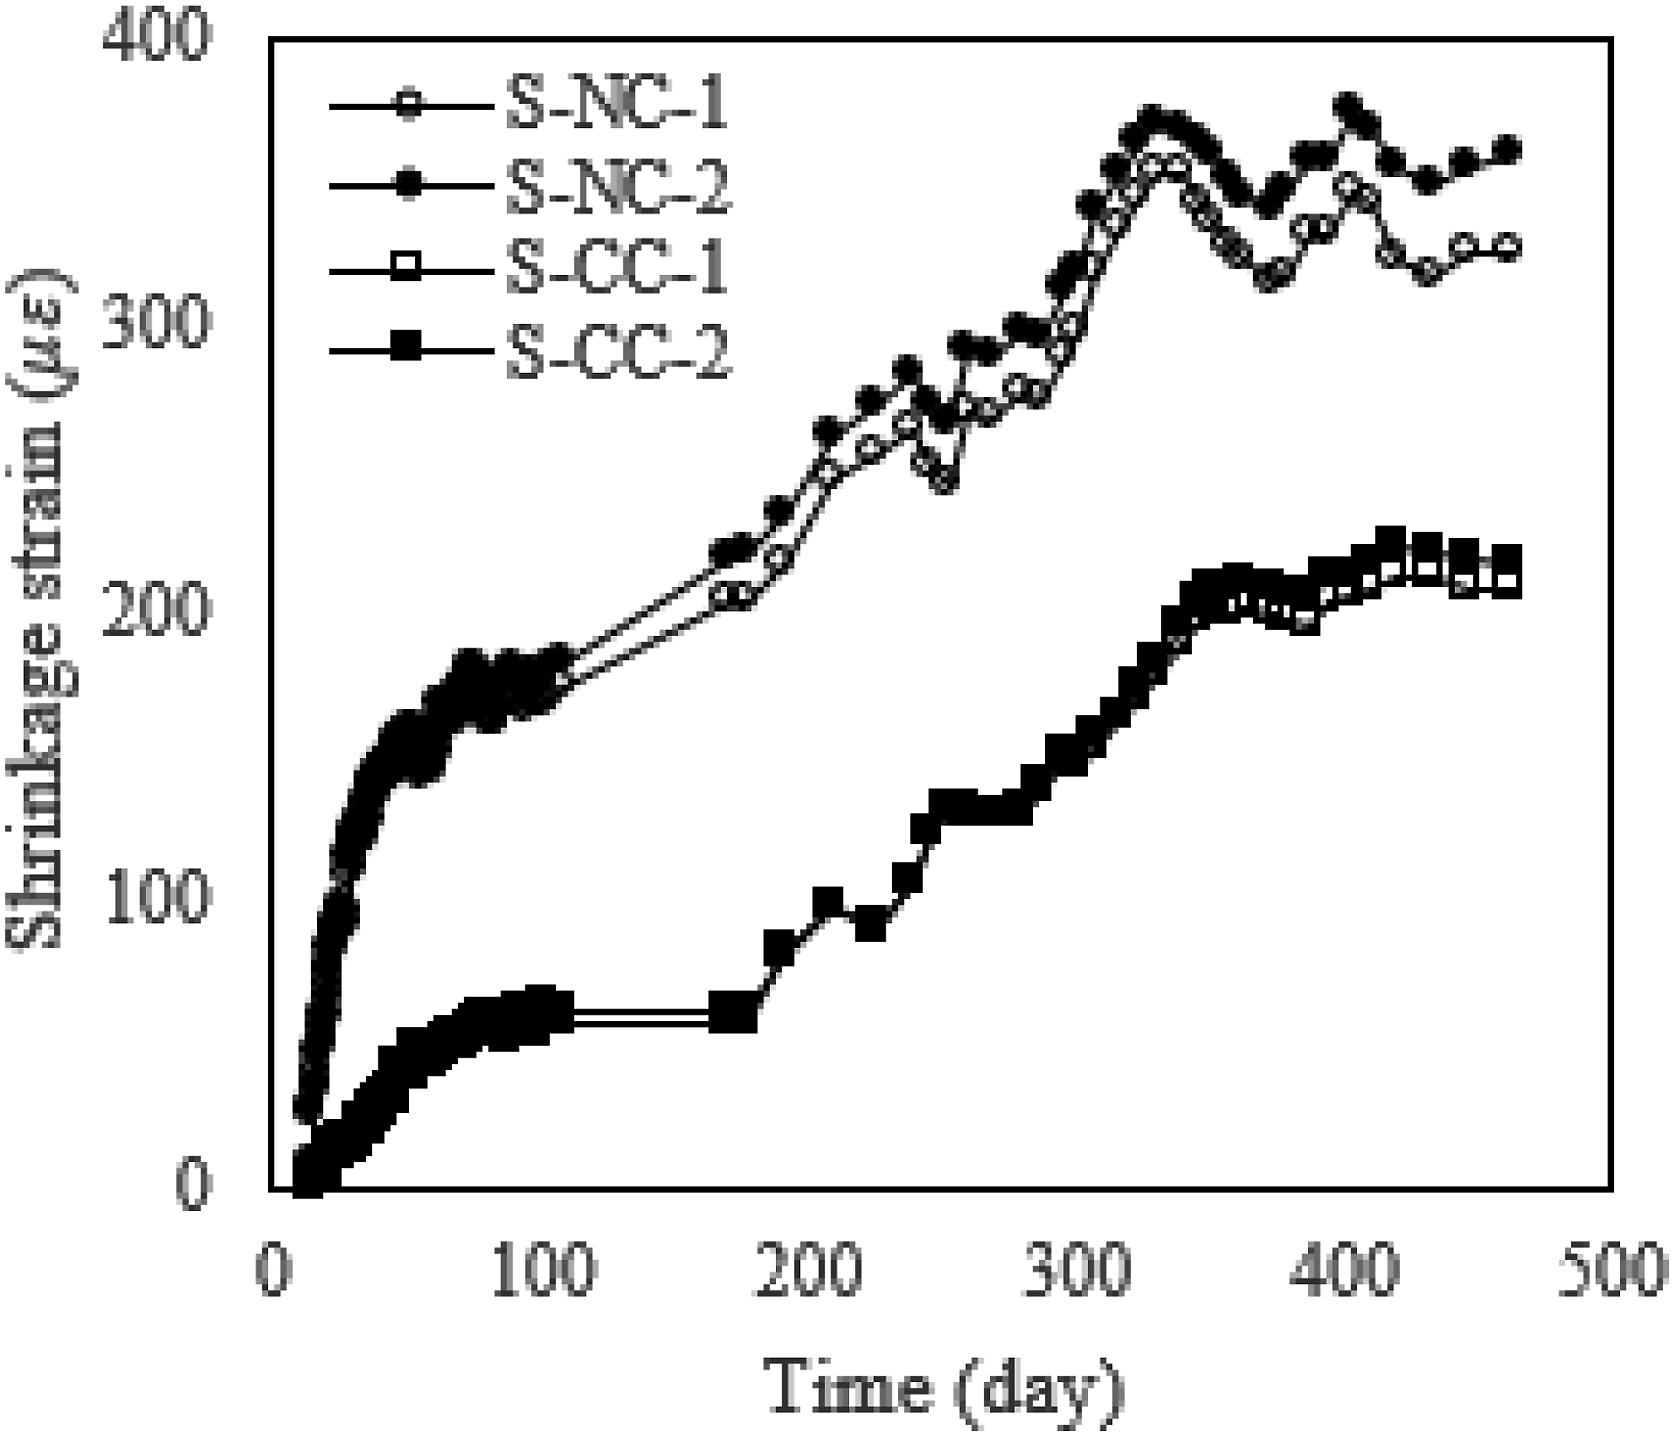
Moreover, the shrinkage strains of the S-NC and S-CC specimens show different varying trends. The S-NC shrinkage develops quickly in the early stage (linear increase in the first month), and the shrinkage strain development gradually becomes slow (especially after 330 days). For the S-CC specimen, the overall shrinkage development rate shows a slight change (almost unchanged after 350 days). Furthermore, both shrinkage developments depend on environmental conditions (seasonable temperature and relative humidity). At 70–170 days, the low temperature and high relative humidity reduce the shrinkage development rate. However, the shrinkage development becomes slow with time, and it is not easy to quantify the influencing degree of this environmental condition.
On the other hand, at about 300 days, the shrinkage development rate increases due to the fast water transportation in the high temperature and low relative humidity. A slightly greater increase rate in the shrinkage strain of the S-CC specimen can be speculated due to higher water content (less water loss in the early stage) than the S-NC specimen. Although the NC core of the S-CC specimen has a high volume surface area ratio, it shows similar shrinkage strain development to the S-NC specimen at this stage. Figure 6 shows the creep strain developments of the C-NC and C-UT specimens. Note that one set of data in Figure 6(b) represents the average measured result from the surface-attached strain gauge and dial gauge because no embedded strain gauges were installed on the UHPC tube (i.e., C-UT). From Figure 6, the creep strain of NC develops quickly at an early age, and the development slows down. After 300 days, the creep strain curve tends to be flat. However, the UHPC creep strain develops very rapidly at an early age, and only a slight increment can be observed after 100 days. The total creep strain of UHPC subject to steam curing is much smaller than the NC. Creep strains of (a) C-NC and (b) C-UT specimens.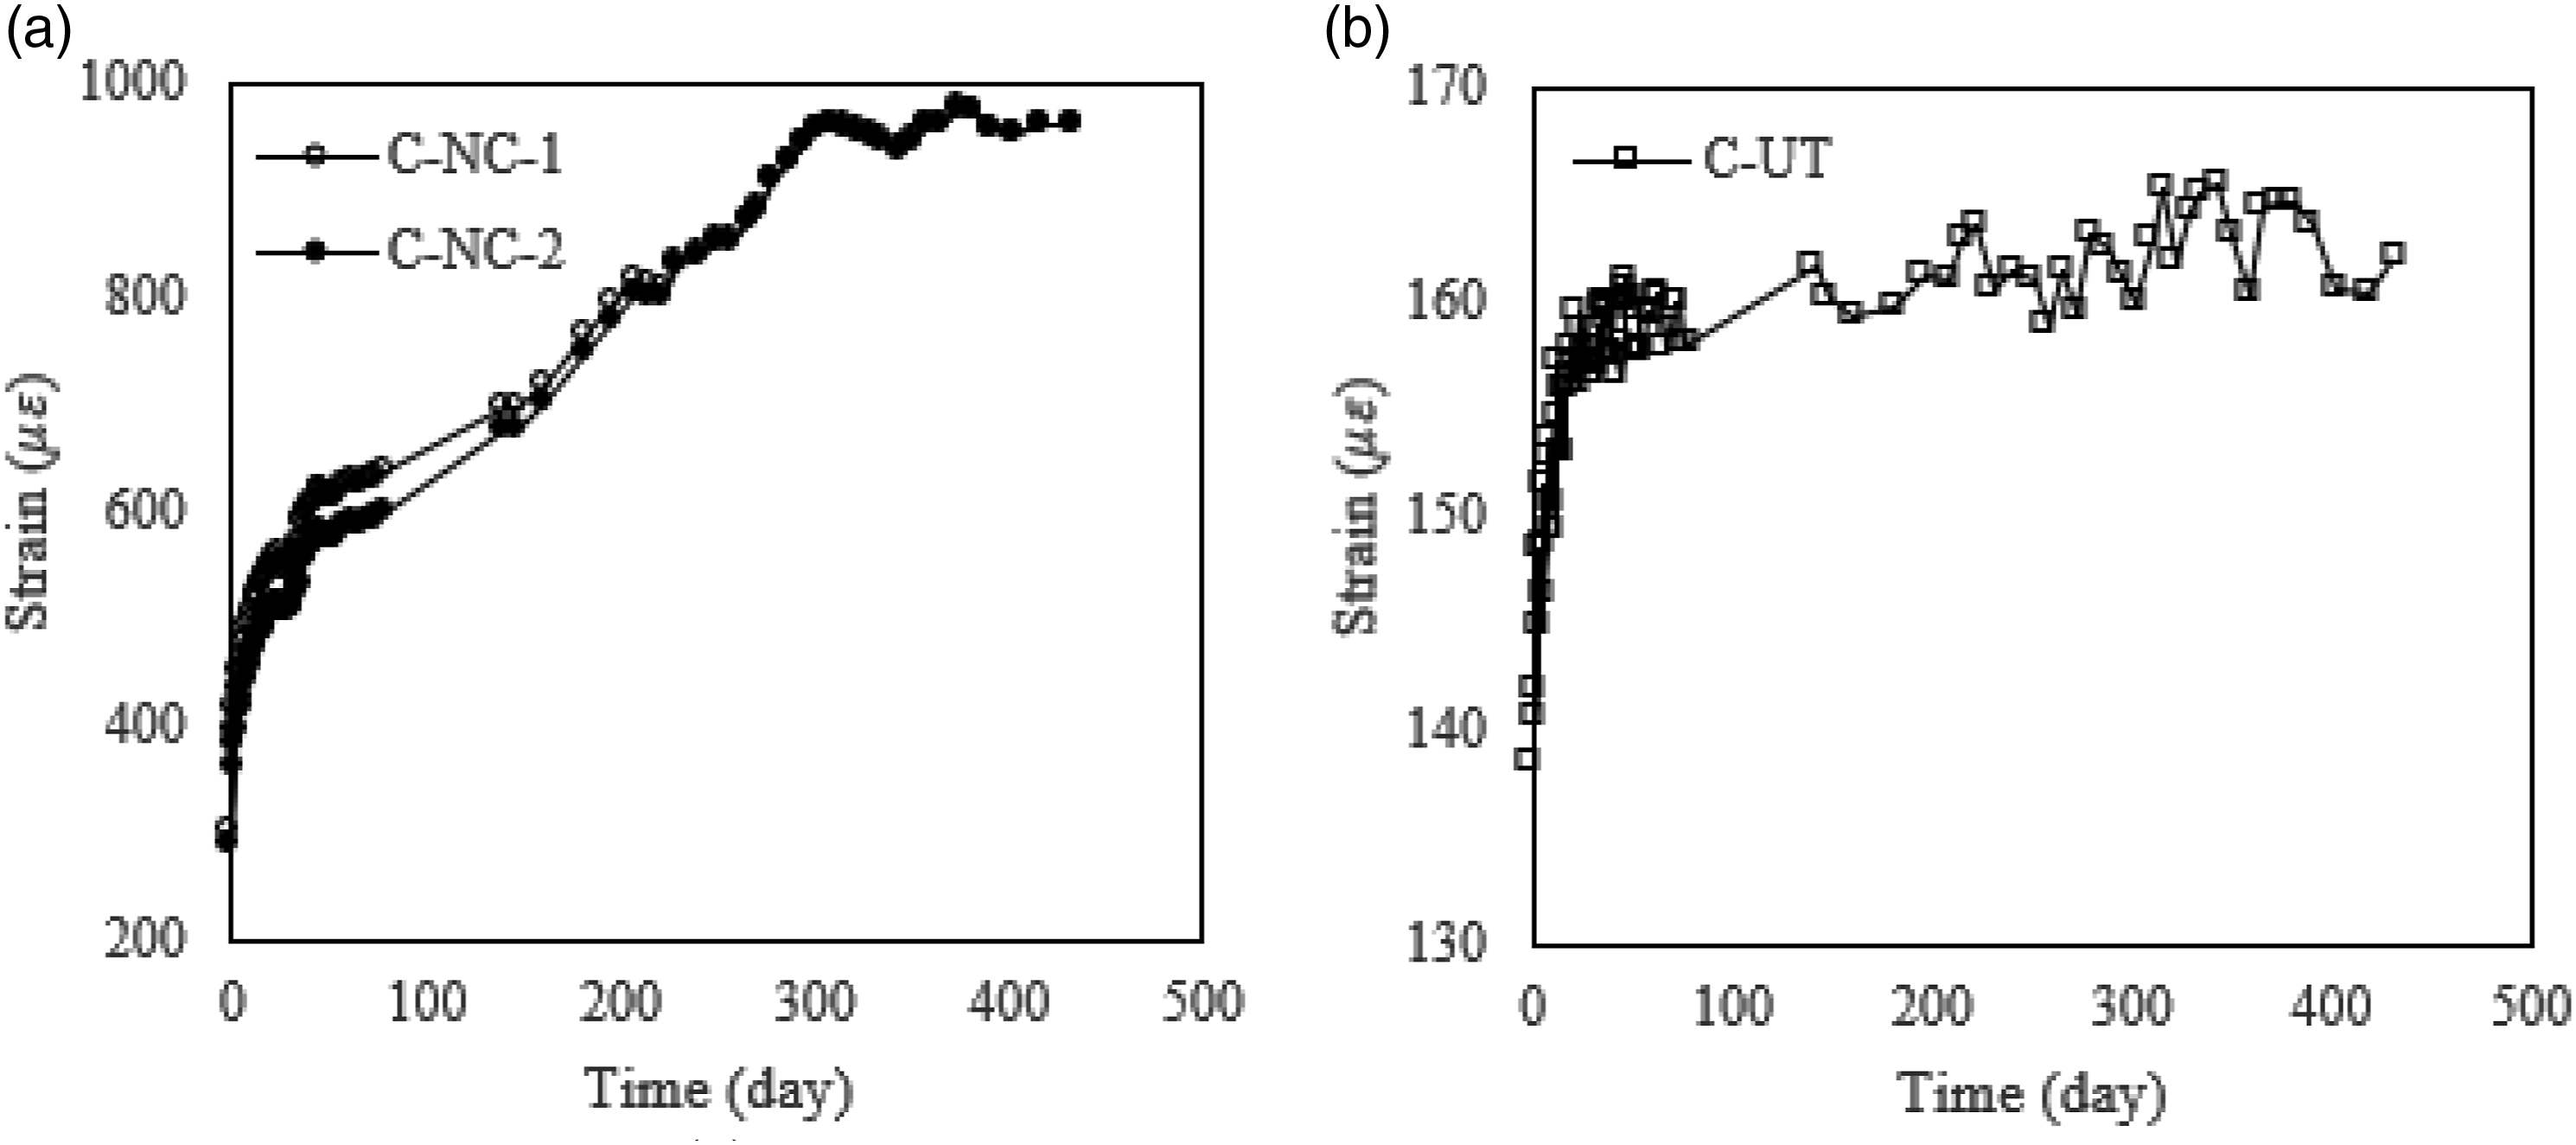
Comparison between shrinkage models
This section compares the predicted shrinkage strain results from different models with the test results to choose a suitable model for the following finite element analysis. Based on the experimental conditions, the basic parameters for ACI209, MC1978, MC1990, MC2010, GL2000, and B3 and B4 models are as follows. The measured average relative humidity was 66.5%. The cement content, sand ratio, slump, and cubic compressive strength of the NC were 24 kg/m3, 37%, 80, and 42.4 MPa, respectively. The cylinder compressive strength can be calculated in accordance with the code Ministry of Transport (2018). The drying age was 14 days, and the loading age was 28 days. Other parameters needed for the models included: the volume surface area ratio, effective thickness, and theoretical thickness of the S-NC specimen were 47.8 mm, 151.9 mm, and 108.7 mm, respectively, while such values were 72.2 mm, 201.7 mm, and 144.3 mm for C-NC specimen due to the steel plates at the specimen ends for the creep loading. These basic parameters also apply to the creep models in the next section.
Figure 7 shows shrinkage strain comparison of the S-NC and S-CC specimens. It can be seen that the MC1978 model underestimates the shrinkage strains, and the ACI 209 and GL2000 models overestimate the shrinkage strains for both the S-NC and S-CC specimens. For the S-NC specimen, the predicted results by the MC1990 and B3 models approach the test ones, and the B3 model is slightly better than the MC1990 and B4 models. The MC2010 model still shows slightly overestimated results. The models show different scatterings for the NC core in the S-CC specimen. The GL2000, B3, and MC2010 models show relatively better predictions. The GL2000 model generally overestimates the shrinkage strains, but the final shrinkage strain is well predicted. The B3 model shows good agreement with the test results before 300 days and underestimates the strains in the later stage where the test shrinkage strain develops rapidly. However, the MC2010 model shows better prediction than the B3 model in the later stage. Overall, the B3 model shows better-predicted results than other models and describes concrete shrinkage in the finite element analysis. Comparison of shrinkage strains of (a) S-NC and (b) S-CC specimens.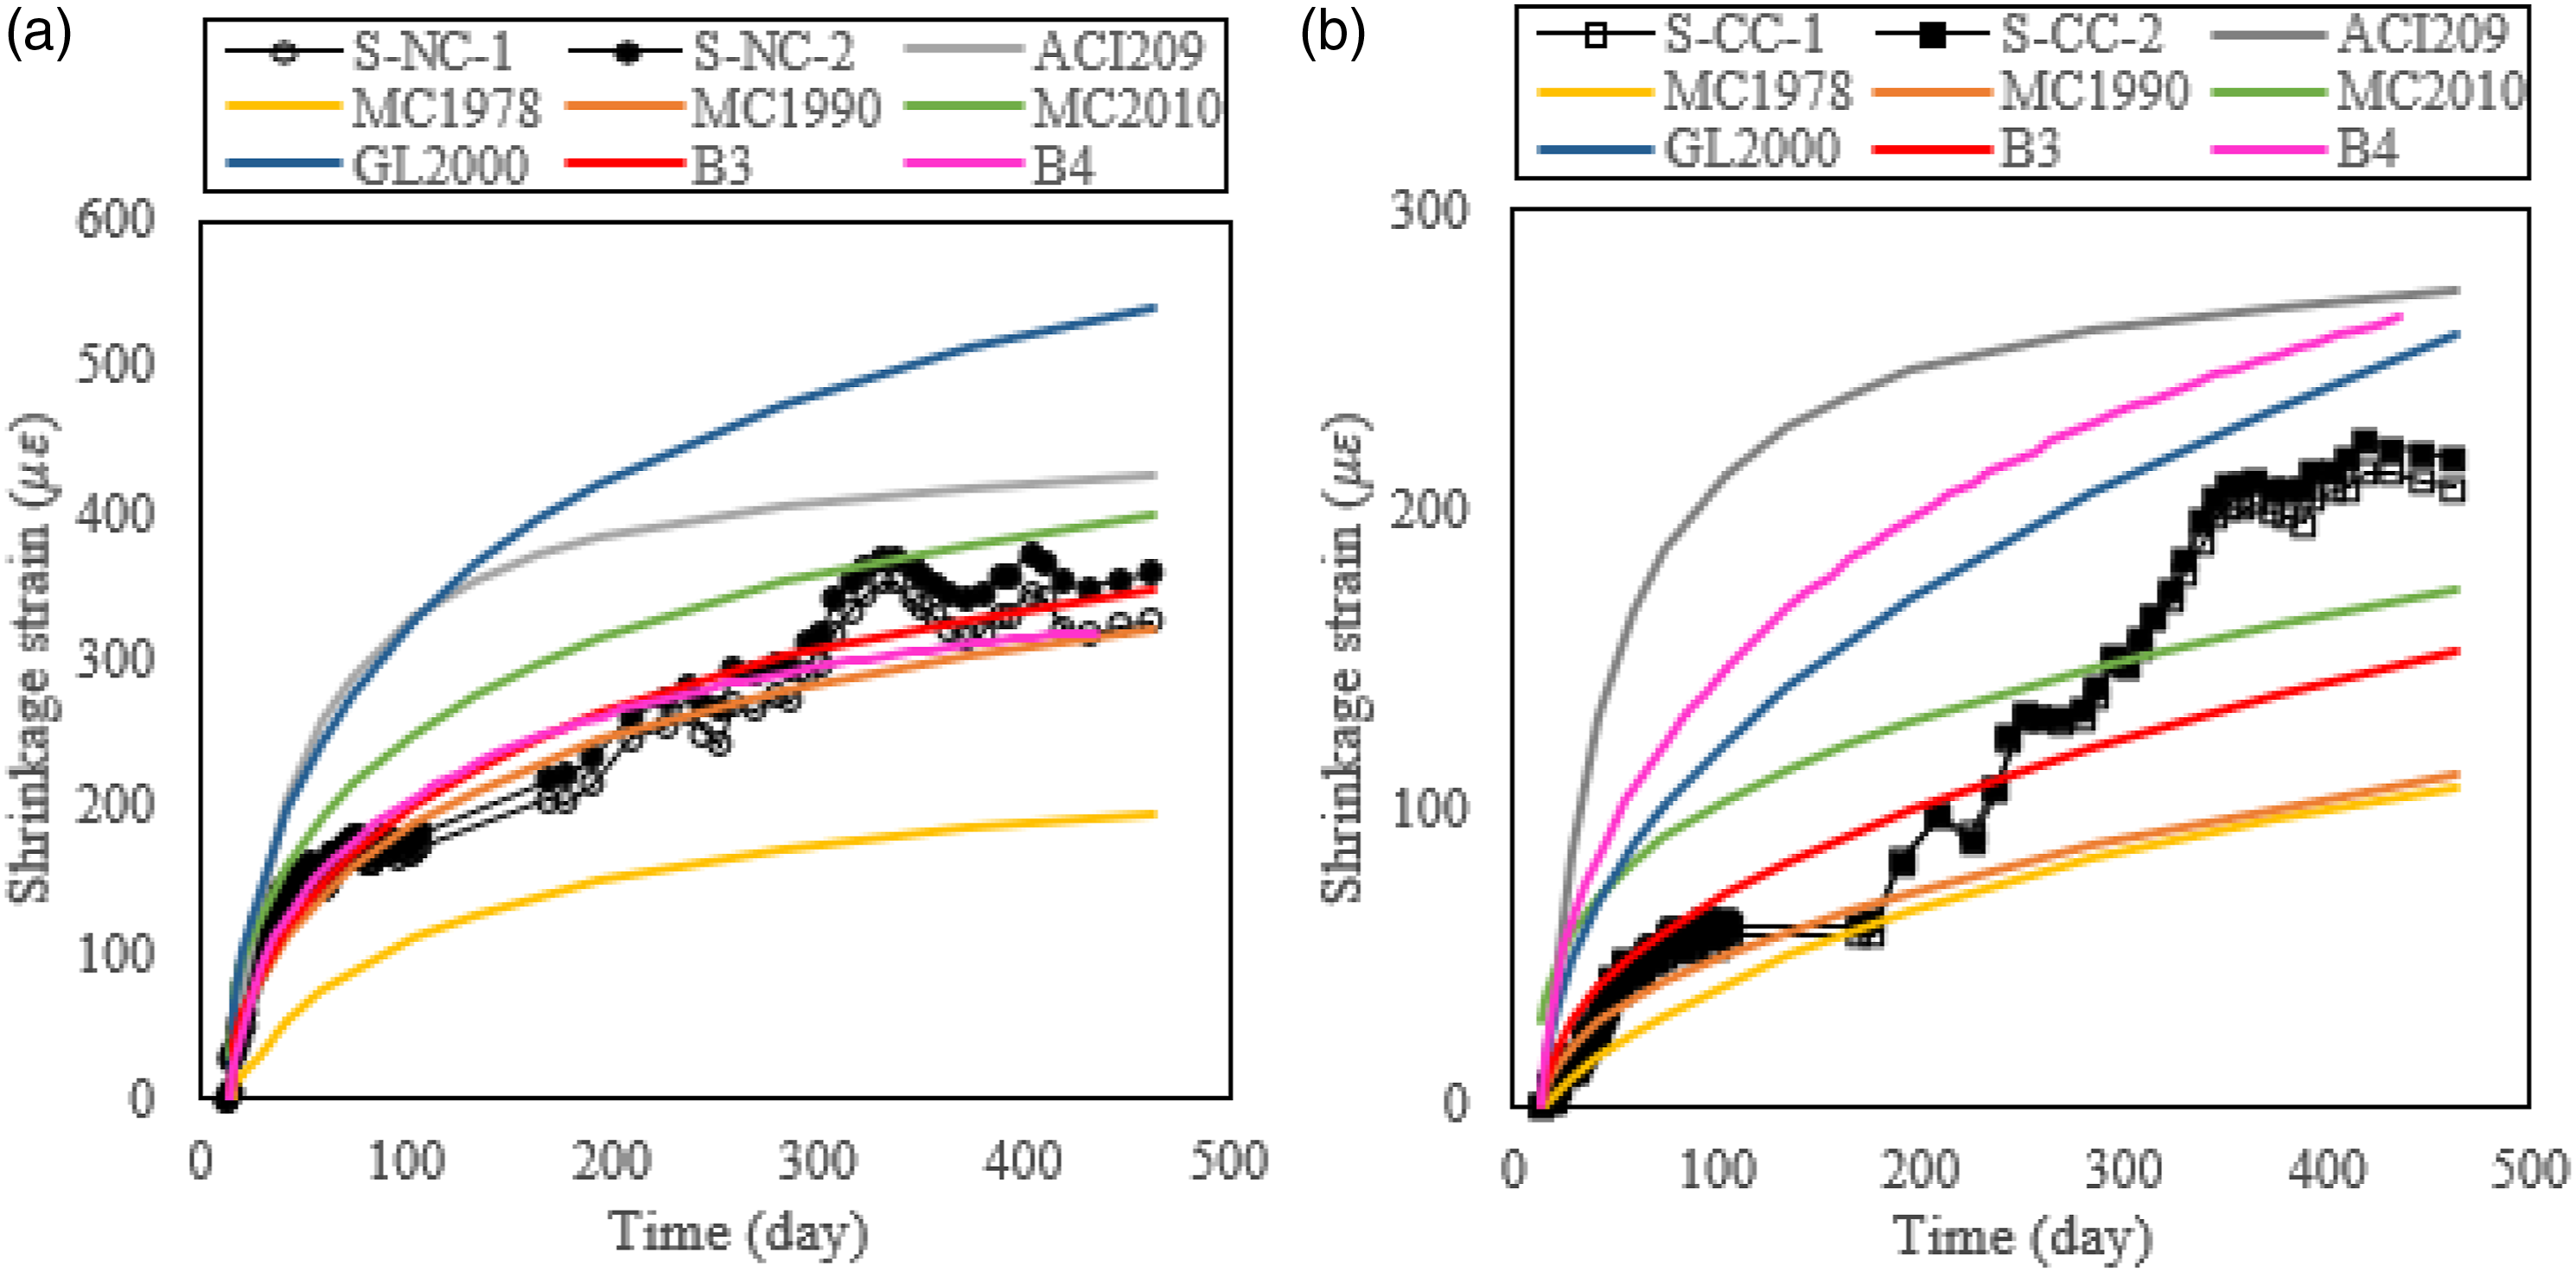
Comparison between creep models
Figure 8 shows the comparison of the creep coefficients of the C-NC and C-UT specimens. For the C-NC specimen, it can be seen that the ACI 209 and B4 models underestimate the creep coefficients. The MC1978 model shows good agreement in the early stage and overestimates the results later, while the MC1990 and MC2010 models show similar overestimated predictions. The GL2000 model overestimates the coefficients in the early stage and approaches the test results in the later stage. The GL2000 predictions are better than MC1990 and MC2010 models in general. Among all the models, the B3 model shows good agreement with the test results in the early and later stages, and the final creep coefficient is well predicted. Therefore, the B3 model is used for describing the concrete creep in the finite element analysis. Comparison of creep coefficient of (a) C-NC and (b) C-UT specimens.
The model to describe the UHPC creep does not have a unified formula. From the test data, the UHPC creep strain is small and shows scattering during the test due to the varying environmental conditions. To facilitate the description of the UHPC creep in the finite element analysis, the MC1990/2010 and ACI 209 models are used to fit the test results. The equations (2) and (3) are fitted for the creep coefficient curve of the UHPC tube. It is found that the residual sum of squares for these equations are 0.0187 and 0.0168, respectively, and thus equation (3) from ACI 209 is used for the UHPC creep analysis. Figure 8(b) shows the fitted curve by equation (3).

NFUT application
Model establishment
In the present study, the long-term deformation of a highway bridge in practical engineering is investigated through a finite element package for modeling bridge structures, Midas Civil. It is a continuous rigid frame bridge with 67.5 m + 125 m +67.5 m spans. The cross-sectional depths of the main box girder made by NC vary from 7.32 m over the piers to 3 m at the midspan. The heights of two piers (21# and 22#) made by NC are 102.510 m and 110.068 m, respectively. The top cross-section of the pier is 6.5 m Continuous rigid frame bridge model. (a) Full NC cross-section (b) NFUT composite cross-section (unit: cm).
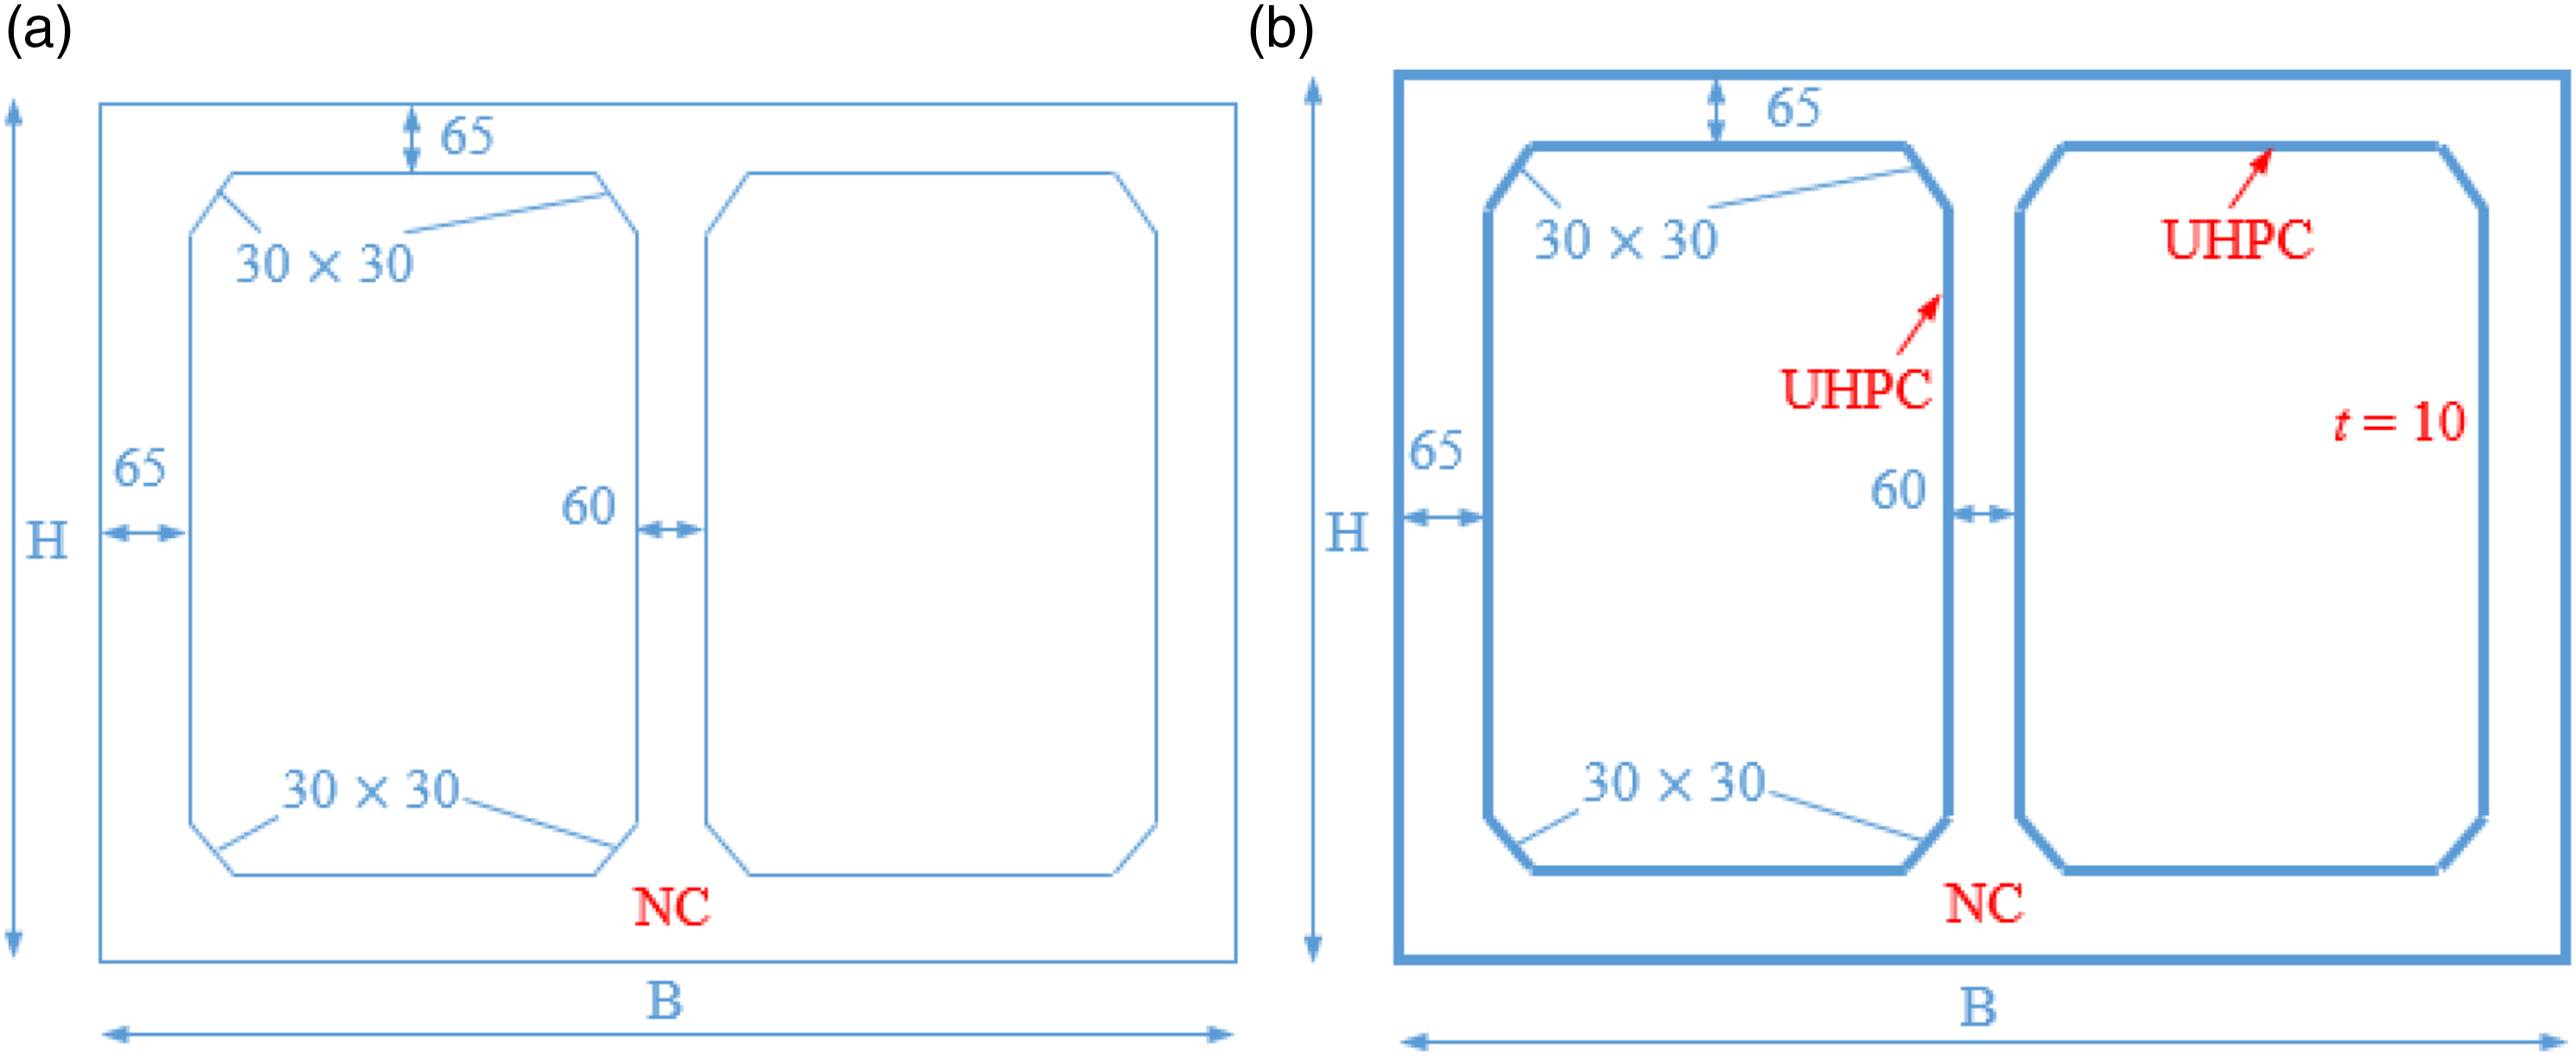
The beam elements with axial and flexural forces were used to simulate the UHPC and NC components because the long-term deflection of a long-span prestressed concrete bridge is mainly caused by the creep-induced longitudinal deformation and section rotation of a box girder. Using beam elements can achieve the expected results and save computational time. The truss elements with only axial force (i.e., tension and compression) were used to simulate the longitudinal prestressing tendons, and the equivalent temperature drop method was used to apply the tension force of these tendons. For the displacement boundary conditions, the two clamped ends at the pier foundation were set, and two simply supported ends free of the longitudinal restraint at the two side-span bearings were set. The combined section method for performing construction stage analysis available in Midas Civil was used for simulating the NFUT composite cross-section to consider different time-dependent material properties due to the shrinkage and creep. This method has been applied to analyze the long-term creep-induced deflection in continuous box-girder bridges (Zhang et al., 2018). The combined section method is usually applied for simulating a composite section made with different materials or the same material with varying properties, accounting for the composite effect and time-dependent effect (such as creep and shrinkage) in the composite structure analysis. Therefore, the elements for the NFUT were activated with the defined material properties and shrinkage and creep functions according to the construction stages of the NFUT composite columns. The three construction stages of each segment of the composite pier are shown in Figure 11. To analyze the long-term deformation, the time-dependent materials are essential to be defined. For the NC, the B3 ensembled model was used for predicting the NC creep and shrinkage because this model shows good prediction accuracy of the creep and shrinkage. For the UHPC, the creep coefficient can be calculated by equation (3) to predict the creep behavior of the precast UHPC tube in the numerical simulation. Also, the shrinkage of the UHPC tube after steam curing is negligible. The three construction stages of each segment of the NFUT composite pier.
Results discussion
By comparing the numerical results using two kinds of cross-sections for the bridge pier (model I for the full NC pier and model II for the NFUT composite pier), the differences of long-term vertical deformation of the pier top, normal stress of the pier bottom, vertical deformation along the longitudinal direction and rotation around the transverse direction of the main girder, and normal stress of the key cross-section of the main girder are discussed.
Although the pier deformation (i.e., elastic deformation and shrinkage and creep induced deformation) can be adjusted before the completion of the last segment of the pier, the accumulated vertical deformations of the pier top caused by the pier construction, the main girder construction, and the long-term shrinkage and creep in the service stage are compared by using models I and II. Also, the bottom pier stresses of the two models are compared to investigate the difference in the stress redistribution. Because the two piers (21# and 22#) have similar heights, the computing results of 21# pier were analyzed. Figure 12 shows the accumulated vertical deformation comparison in different construction stages. Note that the vertical deformation of the pier top is adjusted to zero at the initiation of the main girder construction. Comparing to model I, the vertical deformations of the pier top in model II are decreased by 34.8%, 27.9%, 39.3%, 47.1%, 51.1%, and 56.6%, respectively, at the end of the pier construction, the end of the main girder construction (closure), 1 year, 3 years, 5 years, and 10 years after completion of the bridge. The reduction of the vertical deformation caused by the shrinkage and creep becomes significant as the year goes. It is concluded that using the NFUT composite pier can effectively reduce the long-term vertical deformation of the pier top. The stresses of the pier bottom of models I and II after 10-year shrinkage and creep are shown in Table 4. From Table 4, the NC stresses of the pier bottom in model II are smaller than those in the model I, while the UHPC stresses are higher than NC stresses in model II because of the stress redistribution. The NC stress reductions of 23.8% and 16.0% depend on the stress level and loading age. The height of the pier segment gradually increases during construction, and the load level increases. Also, the loading age of the pier increases due to the construction of the main girder. After the completion of the bridge, the load level reaches the maximum, and the loading age has been 288 days for the pier bottom in the numerical model, which reduces the concrete shrinkage and creep and resulting the degree of stress redistribution. Also, the stresses of the two sides of the pier bottom are different with different reductions because the pier is subjected to the bending moment except for the axial load. Vertical displacement development of pier top with time from the model I and II. 10-year shrinkage and creep induced normal stress of 21# pier bottom.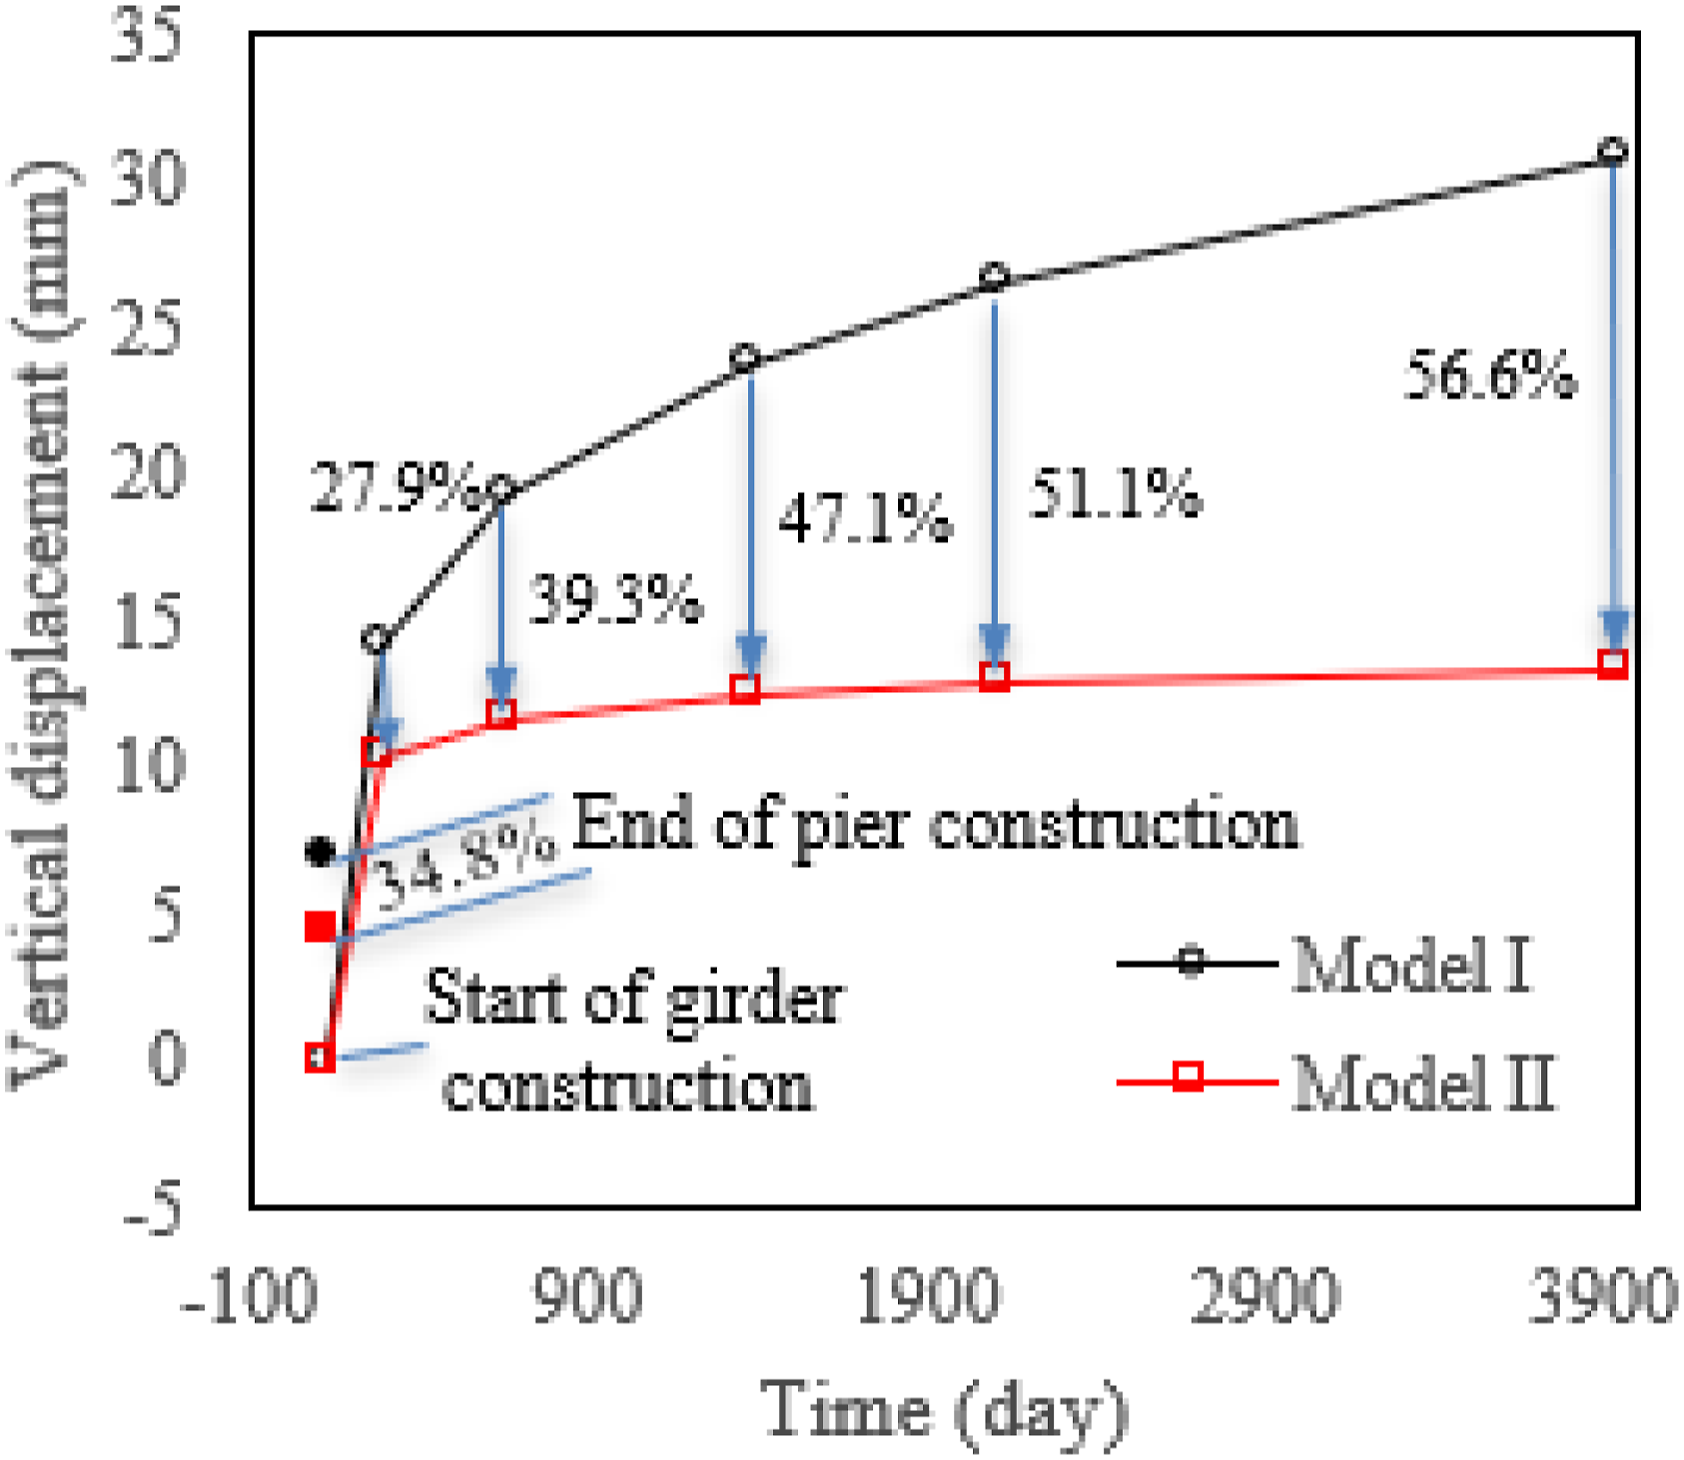

From the above numerical results, the long-term deformation of the NFUT composite pier is significantly more minor than the full NC pier, which affects the main girder deformation and stress as well. Figure 13 compares the main girder vertical deformation and cross-sectional rotation around the transverse direction after 10-year concrete shrinkage and creep using models I and II. From Figure 13(a), the midspan vertical deformation is decreased most significantly by 73.8% in model II, improving the long-term midspan deflection. From Figure 13(b), the rotations of the middle span in models I and II are similar, while the rotations of the side spans show much difference. The rotations of the side spans and the segments near the piers in model II are significantly smaller than those in model I. The normal stresses in the typical cross-sections calculated using models I and II because of the 10-year concrete shrinkage and creep are listed in Table 5, where the negative values represent the compressive stresses. Because the two piers' heights are similar, and the ends of the main girder are free of the longitudinal displacement and rotation, the main girder stresses in the two models are similar from Table 5. Compared to model I, the top slab stresses of the main girder in these locations decrease, while the bottom slab stresses increase in model II. (a) Vertical displacement and (b) rotation distributions of the main girder from the model I and II after 10-year shrinkage and creep. 10-year shrinkage and creep induced normal stress of the main girder.

Summary and Conclusion
As UHPC is creating new NFUT structures to solve some of the challenges encountered in conventional concrete, the long-term deformation behavior of these structures needs to be studied to enhance structural reliability and safety further. The present study experimentally investigates the shrinkage and creep models of the NC column and precast UHPC tube in order for that the models can be used for analysis and design of the NFUT composite. The NFUT composite pier is proposed to replace the full NC pier in an actual bridge. An actual bridge is numerically simulated to investigate the effect of the 10-year concrete shrinkage and creep and the NFUT composite pier on the long-term performance of the bridge. The conclusions can be drawn as follows: • From the comparison with the existing models, the B3 model is suited for simulating the shrinkage and creep of the NC column, while the test creep data of the precast UHPC tube is fitted using the ACI 209 model with the small residual sum of squares. However, these models from preliminary concrete test data need more data for validation, and thus, the numerical results of the bridge adopting these models are limited to the present study. • The shrinkage of the NFUT composite is smaller than the NC column due to the restraint of the precast UHPC tube. • The numerical modeling verifies the effectiveness of the shrinkage and creep models of the NC column and precast UHPC tube from the tests. The vertical deformations of the pier top in the NFUT composite pier are decreased by 34.8%, 27.9%, 39.3%, 47.1%, 51.1%, and 56.6%, at the end of the pier construction, the end of the main girder construction (closure), 1 year, 3 years, 5 years, and 10 years after completion of the bridge comparing to the full NC pier, respectively. • The UHPC normal stress is greater than the NC at the pier bottom due to the stress redistribution, and the average NC stress is reduced by 19.9% in the composite pier. Also, the NFUT composite pier significantly reduces the midspan vertical deformation by 73.8% and the side-span rotations, while the normal stresses on the top and bottom slabs of the main girder cross-section do not significantly vary when using the composite pier.
Footnotes
Declaration of conflicting interests
The author(s) declared no potential conflicts of interest with respect to the research, authorship, and/or publication of this article.
Funding
The author(s) disclosed receipt of the following financial support for the research, authorship, and/or publication of this article: This research is sponsored by the National Natural Science Foundation of China (Grant Nos. 51578226 and 51778221). Financial support to complete this study was provided by the University of Nebraska, Lincoln, through Mid-America Transportation Center under Contract # 00059709.
