
Abstract
To optimize conventional composite beam, this paper proposes a new steel-concrete composite beam without top flange, and discusses the shear behavior of this novel web-embedded steel-concrete composite beam (WSCB). Five patterns of embedded shear connectors are proposed, including the shapes of swallow tail, gear, modified gear, circular hole, and steel bar. A shear experiment on ten specimens with the shear span ratio λ = 1.5 were conducted, considering effects of the concrete slab width (B) and the shear connector pattern. The experiments showed two typical shear failure modes depending on the shear connector type. All five kinds of shear connectors guaranteed good integral action in the specimens. The concrete slab width B shows an obvious positive effect on the shear capacity and ductility. Furthermore, a FE model was established and verified by the experimental results to investigate the shear mechanism of WSCB. According to the experimental and numerical analysis results, a specific calculation method for the shear capacity of the WSCB is proposed, which includes the contributions from the steel web and concrete slab.
Introduction
The conventional composite beam is composed of H-section steel beam and concrete slab, between which headed studs are used as common shear connectors (Crisinel, 1990; Classen and Hegger, 2017; Classen et al., 2018Classen, 2018). Shear connectors have been studied and improved continuously for a few decades. However, most shear connectors require a lot of welding work on the top flange of H-section steel beam. Meanwhile, the top flange is close to the neutral axis of the section and has low stress level under positive bending moment. It contributes little to the bending capacity of the composite beam (Feldmann et al., 2016). To optimize conventional composite beam, nowadays, many new composite beams are proposed. Yaser Sahloddin et al. (2021) proposes an innovative steel–concrete composite beam fabricated using self-compacting cementitious (SCC) composite, thin-walled steel plates, and hollow sections. Sung-Won Yoo and Jinkyo F.Choo (2016) studied eight composite beams with varying stud spacing and UHPC slab thickness to examine experimentally the flexural behavior with respect to the stud spacing and slab thickness. A moment–curvature analysis method was proposed and showed good agreement for the composite beam with steel fiber reinforced UHPC slab.
A new steel-concrete composite beam without steel top flange is proposed by this paper, in which the shear connector is formed by cutting the top of steel web and embedded in the concrete slab. This composite beam, referred as web-embedded steel-concrete composite beam (WSCB), has the following advantages: (1) an average of 20% of steel consumption may be reduced; (2) the headed studs are replaced by web-embedded connectors to avoid the welding process (Grant et al., 1977).
The WSCB has been studied since 2000. A type of connector named puzzle-shaped dowels (PZ) was used to construct the bridge in Pöcking (Harnatkiewicz et al., 2011) and some other innovative bridges (Johnson and May, 1975). The above bridge projects had shown that the PZ dowel has promising characteristics. Therefore, many scholars began to study this new type of connector. W. Lorenc et al. (2020) studied 19 full scale puzzle-shaped (PZ) composite dowel shear connectors by push-out tests. It was discovered that the steel dowel undergoing plastic deformation is a major factor for concrete failure. Classen proposed models for calculation of shear-slip characteristic, considering the composite dowel’s shear capacity and elastic stiffness (Li et al., 2012). The proposed models determined the dowel’s geometrical dimensions for a ductile connector behavior.
Research is also conducted by Chinese scholars in the past decade. Li et al.Li and Li (2009a, 2009b) studied push-out and pull-out behavior of the trapezoid connector by tests. The results indicated that the shear capacity of this connector was strong enough to guarantee the fully shear connection between concrete slab and steel beam. A test of composite beam using notched web of inverted T-shaped steel section was also carried out (Li et al., 2012), based on which the calculation of bending capacity and shear capacity were proposed.
To expand the research and in-depth investigate mechanical behavior of shear connectors in the WSCB, this paper presents five patterns of web-embedded shear connectors: (1) swallow tail; (2) gear; (3) modified gear; (4) circular hole; (5) steel bar. A shear experiment of WSCB was carried out following previous push-out and bending experiments. The parameters of concrete slab width (B) and the connector pattern were considered in this experiment. Possible failure modes and shear behavior of WSCB were researched. A FE model for simulating the WSCB was established and verified with the test results. Finally, an appropriate calculation method for shear capacity of WSCB was proposed.
Experimental program
Specimen design
In order to investigate the shear behavior of WSCB, ten specimens were designed and tested. The scale ratio of specimens is 1:1. According to the Code for design of composite structures (JGJ138, 2016), the concrete slab width(B) were chosen: B = 1150 mm for specimens CB-1 to CB-5 and B = 800 mm for specimens CB-6 to CB-10. Each group of specimens was configured with five pattern connectors. In order to ensure the shear failure of all specimens, the shear span ratio of all ten specimens λ = 1.5. And all the specimens shared the following common parameters: bottom flange width bf = 150 mm; bottom flange thickness tf = 10 mm; steel web thickness tw = 8 mm; steel web depth hw = 170 mm; concrete slab thickness D = 80 mm; beam length L = 3400 mm; effective beam length (the distance between the two supports) L0 = 2600 mm; beam depth H = 260 mm; shear connector spacing ds = 170 mm; embedded depth de = 55 mm.
The detailed connectors are shown in Figure 1, in which the dimensions of each connector are given. Note that the modified gear connector has extra orthogonal gear connector. Both circular hole connector and steel bar connector allow the distributing bars to pass through the holes. Five patterns of embedded shear connectors. (a) Details of WSCB (with swallow tail connector); (b) Details of gear connector; (c) Details of modified gear connector; (d) Details of circular hole connector; (e) Details of steel bar connector.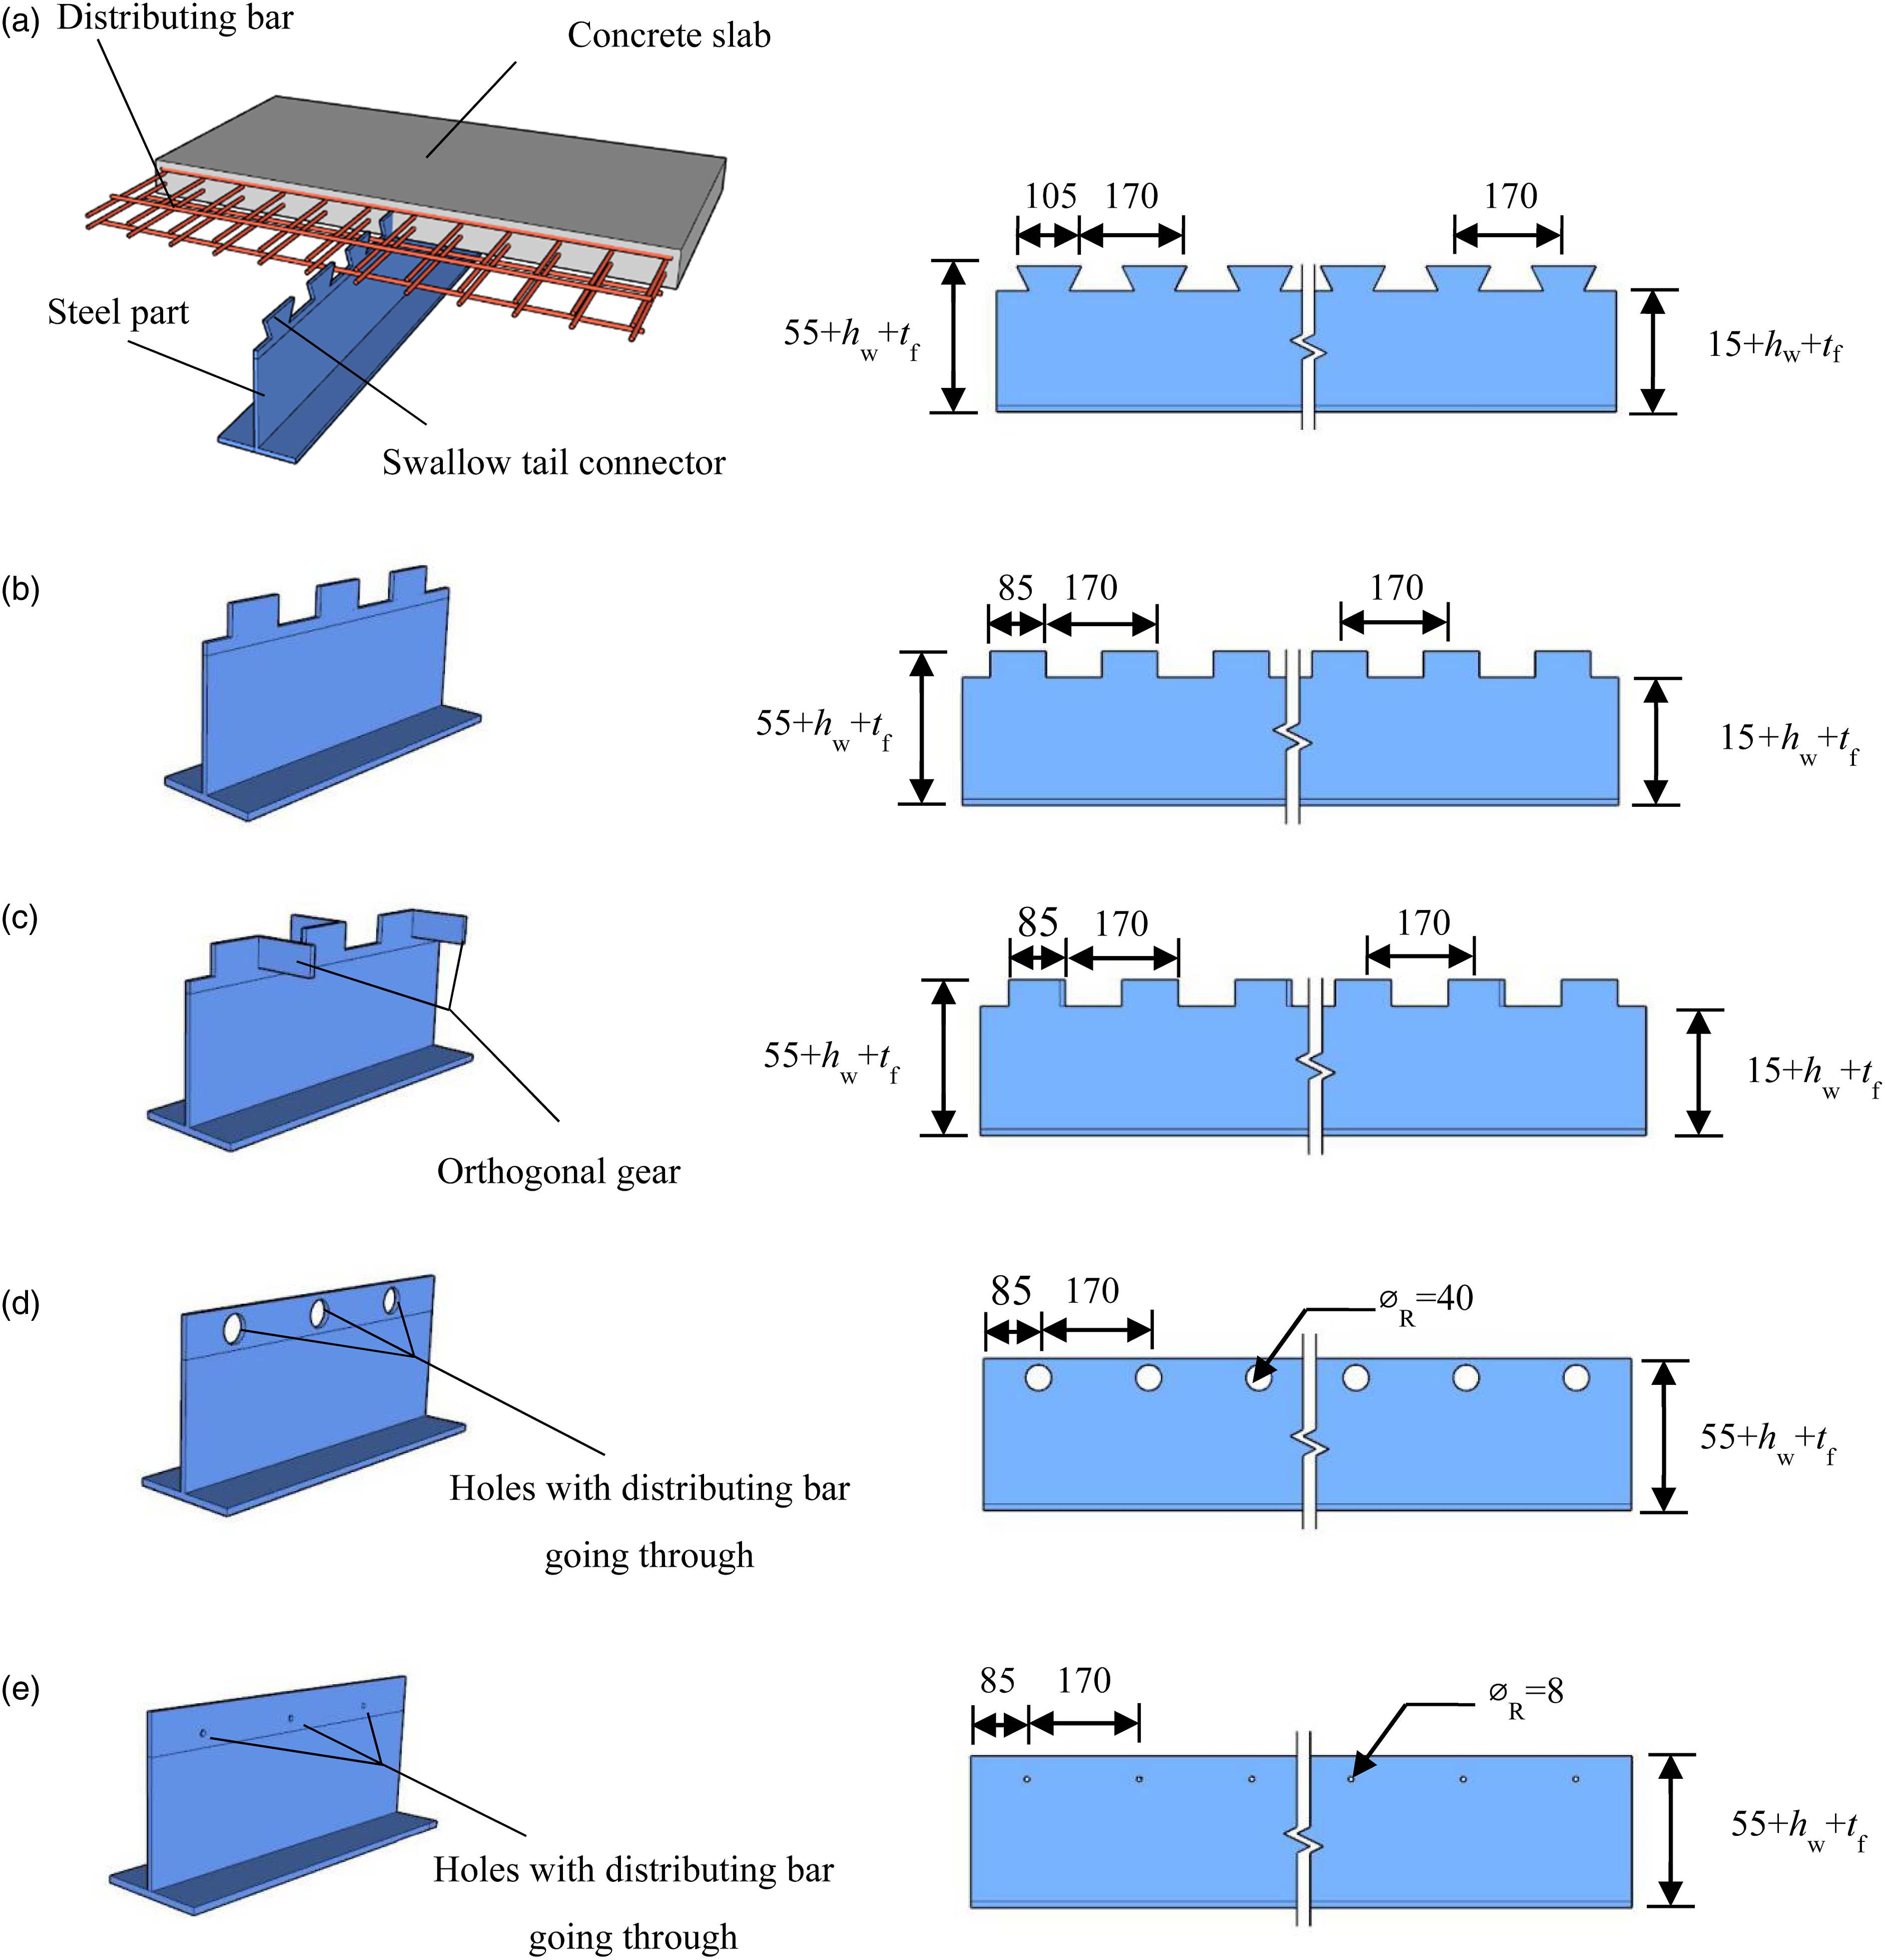
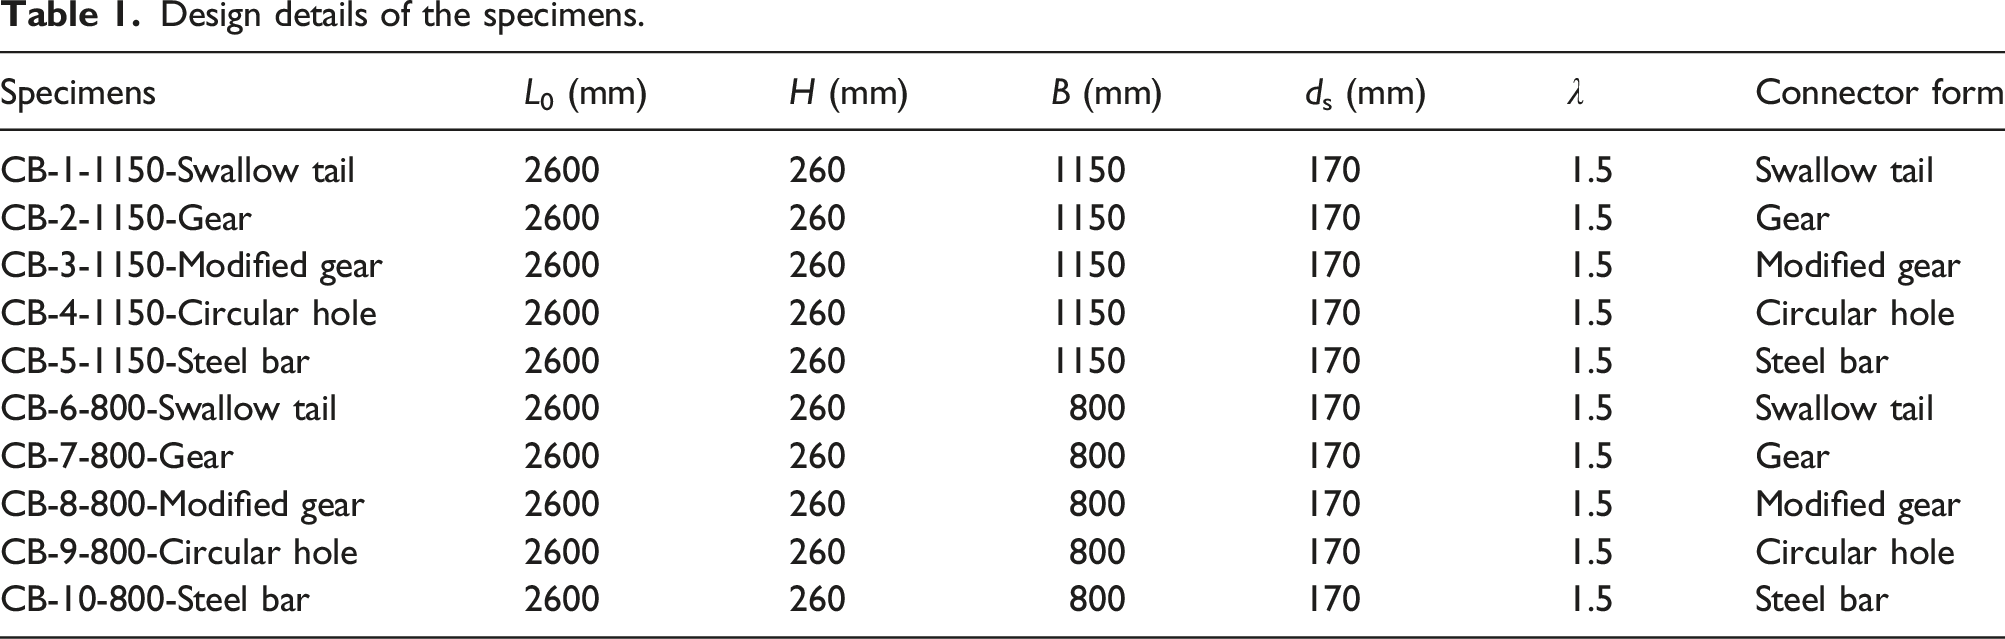
Design details of the specimens.
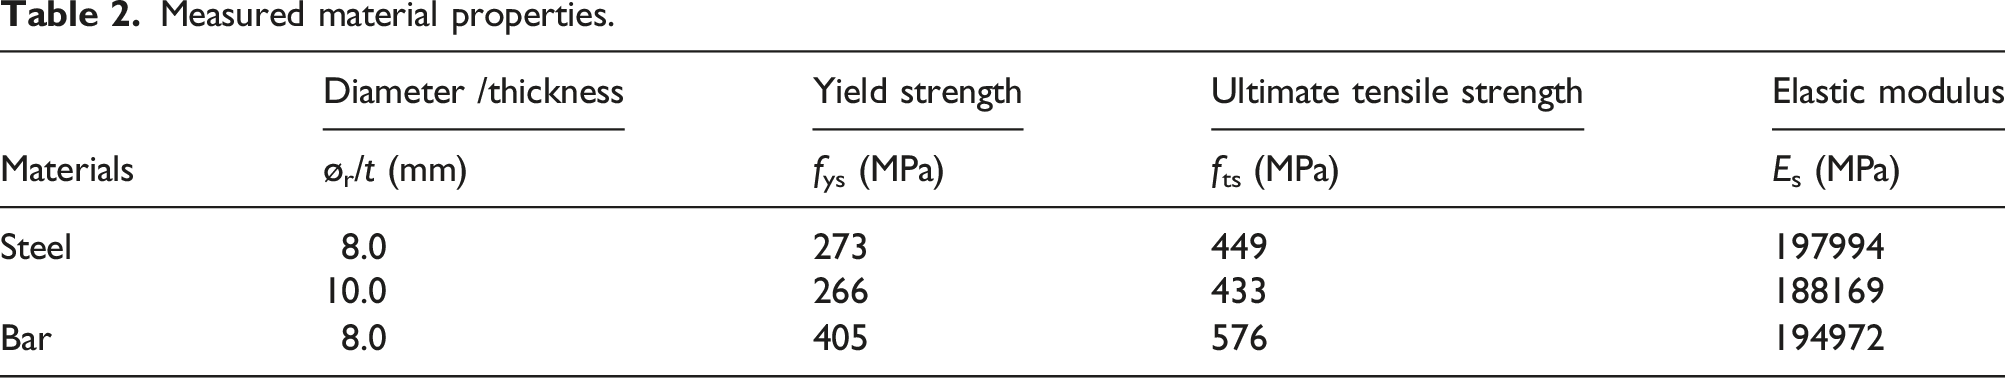
Material properties
Measured material properties.
Loading and measuring scheme
The WSCB specimens were simply-supported and loaded simultaneously with a 200-ton hydraulic actuator. A steel spreader beam enabled two-point loading during the test procedures, as shown in Figure 2. The loading process was performed using a hybrid load-displacement control scheme (GB/T228.1, 2010; GB/T 50081, 2002). In the elastic stage, the load-controlled scheme was selected, with a loading rate of 60 kN/min for each load increment of 50 kN. It was retained for about 3 min at the end of each load increment to monitor the readings and to record the progressively developed cracks. When the steel bottom flange yielded, it was converted to displacement-controlled scheme with a load rate of 3 mm/min. When the load dropped to 85% of the peak load in the descending stage, the specimen was considered to be in failure and the test terminated. Loading devices. (a) Loading photo; (b) Loading diagram.
To measure the deflection of each WSCB specimen, three linear variable differential transformers (LVDTs) were arranged at the mid-span and two loading points (V1-V3) respectively, as shown in Figure 3. To research the effective width, strain gauges were arranged along the concrete slab width at the middle cross section of composite beam (strain gauge Group1 in Figure 3). And to verify the plane cross-section assumption at the mid-span, strain gauges were arranged along the composite beam depth (strain gauge Group2 in Figure 3). Six strain gauges were placed at bottom flange of steel part (strain gauge Group3 in Figure 3) in order to determine the yield load. Another six strain gauge rosettes were attached along the steel web depth in shear span (strain gauge Group4 in Figure 3) to monitor the shear stress. Measurement scheme.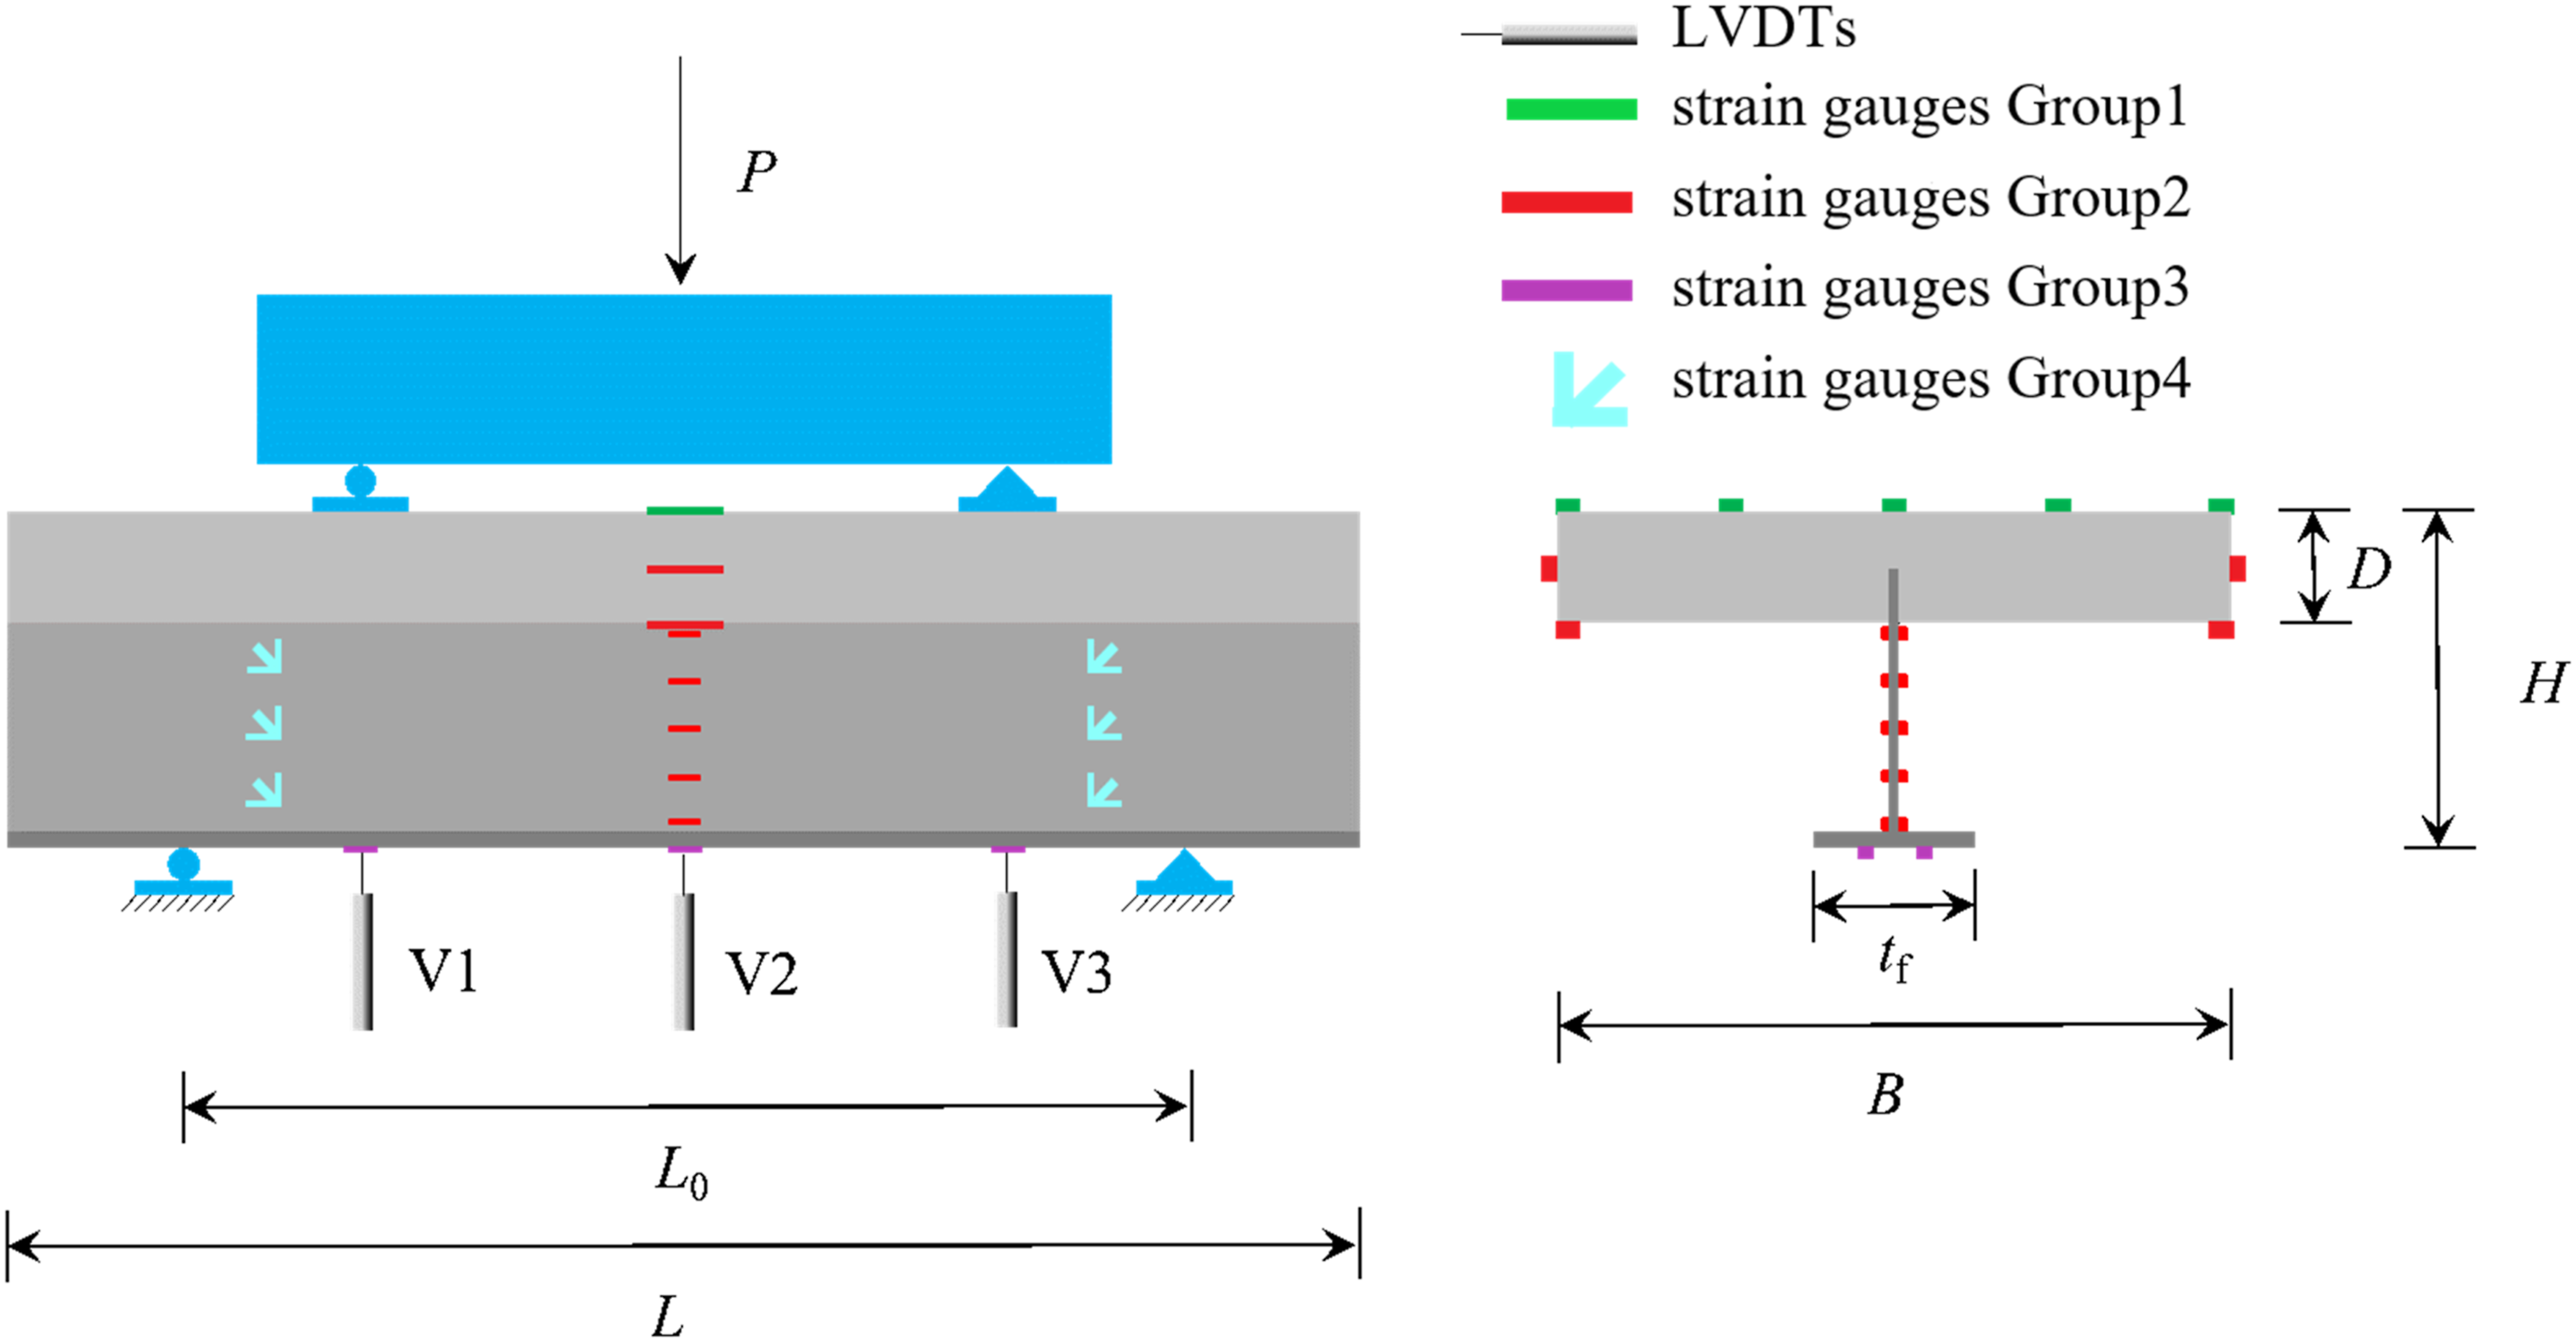
Analysis of test results
Failure mode
The specimens displayed two different failure modes: diagonal shear failure and concrete slab crushing failure.
Diagonal shear failure
The failure modes of most specimens (except CB-3 and CB-8) could be summarized as diagonal shear failure. Take 800 mm slab width group as examples to describe the specific phenomena.
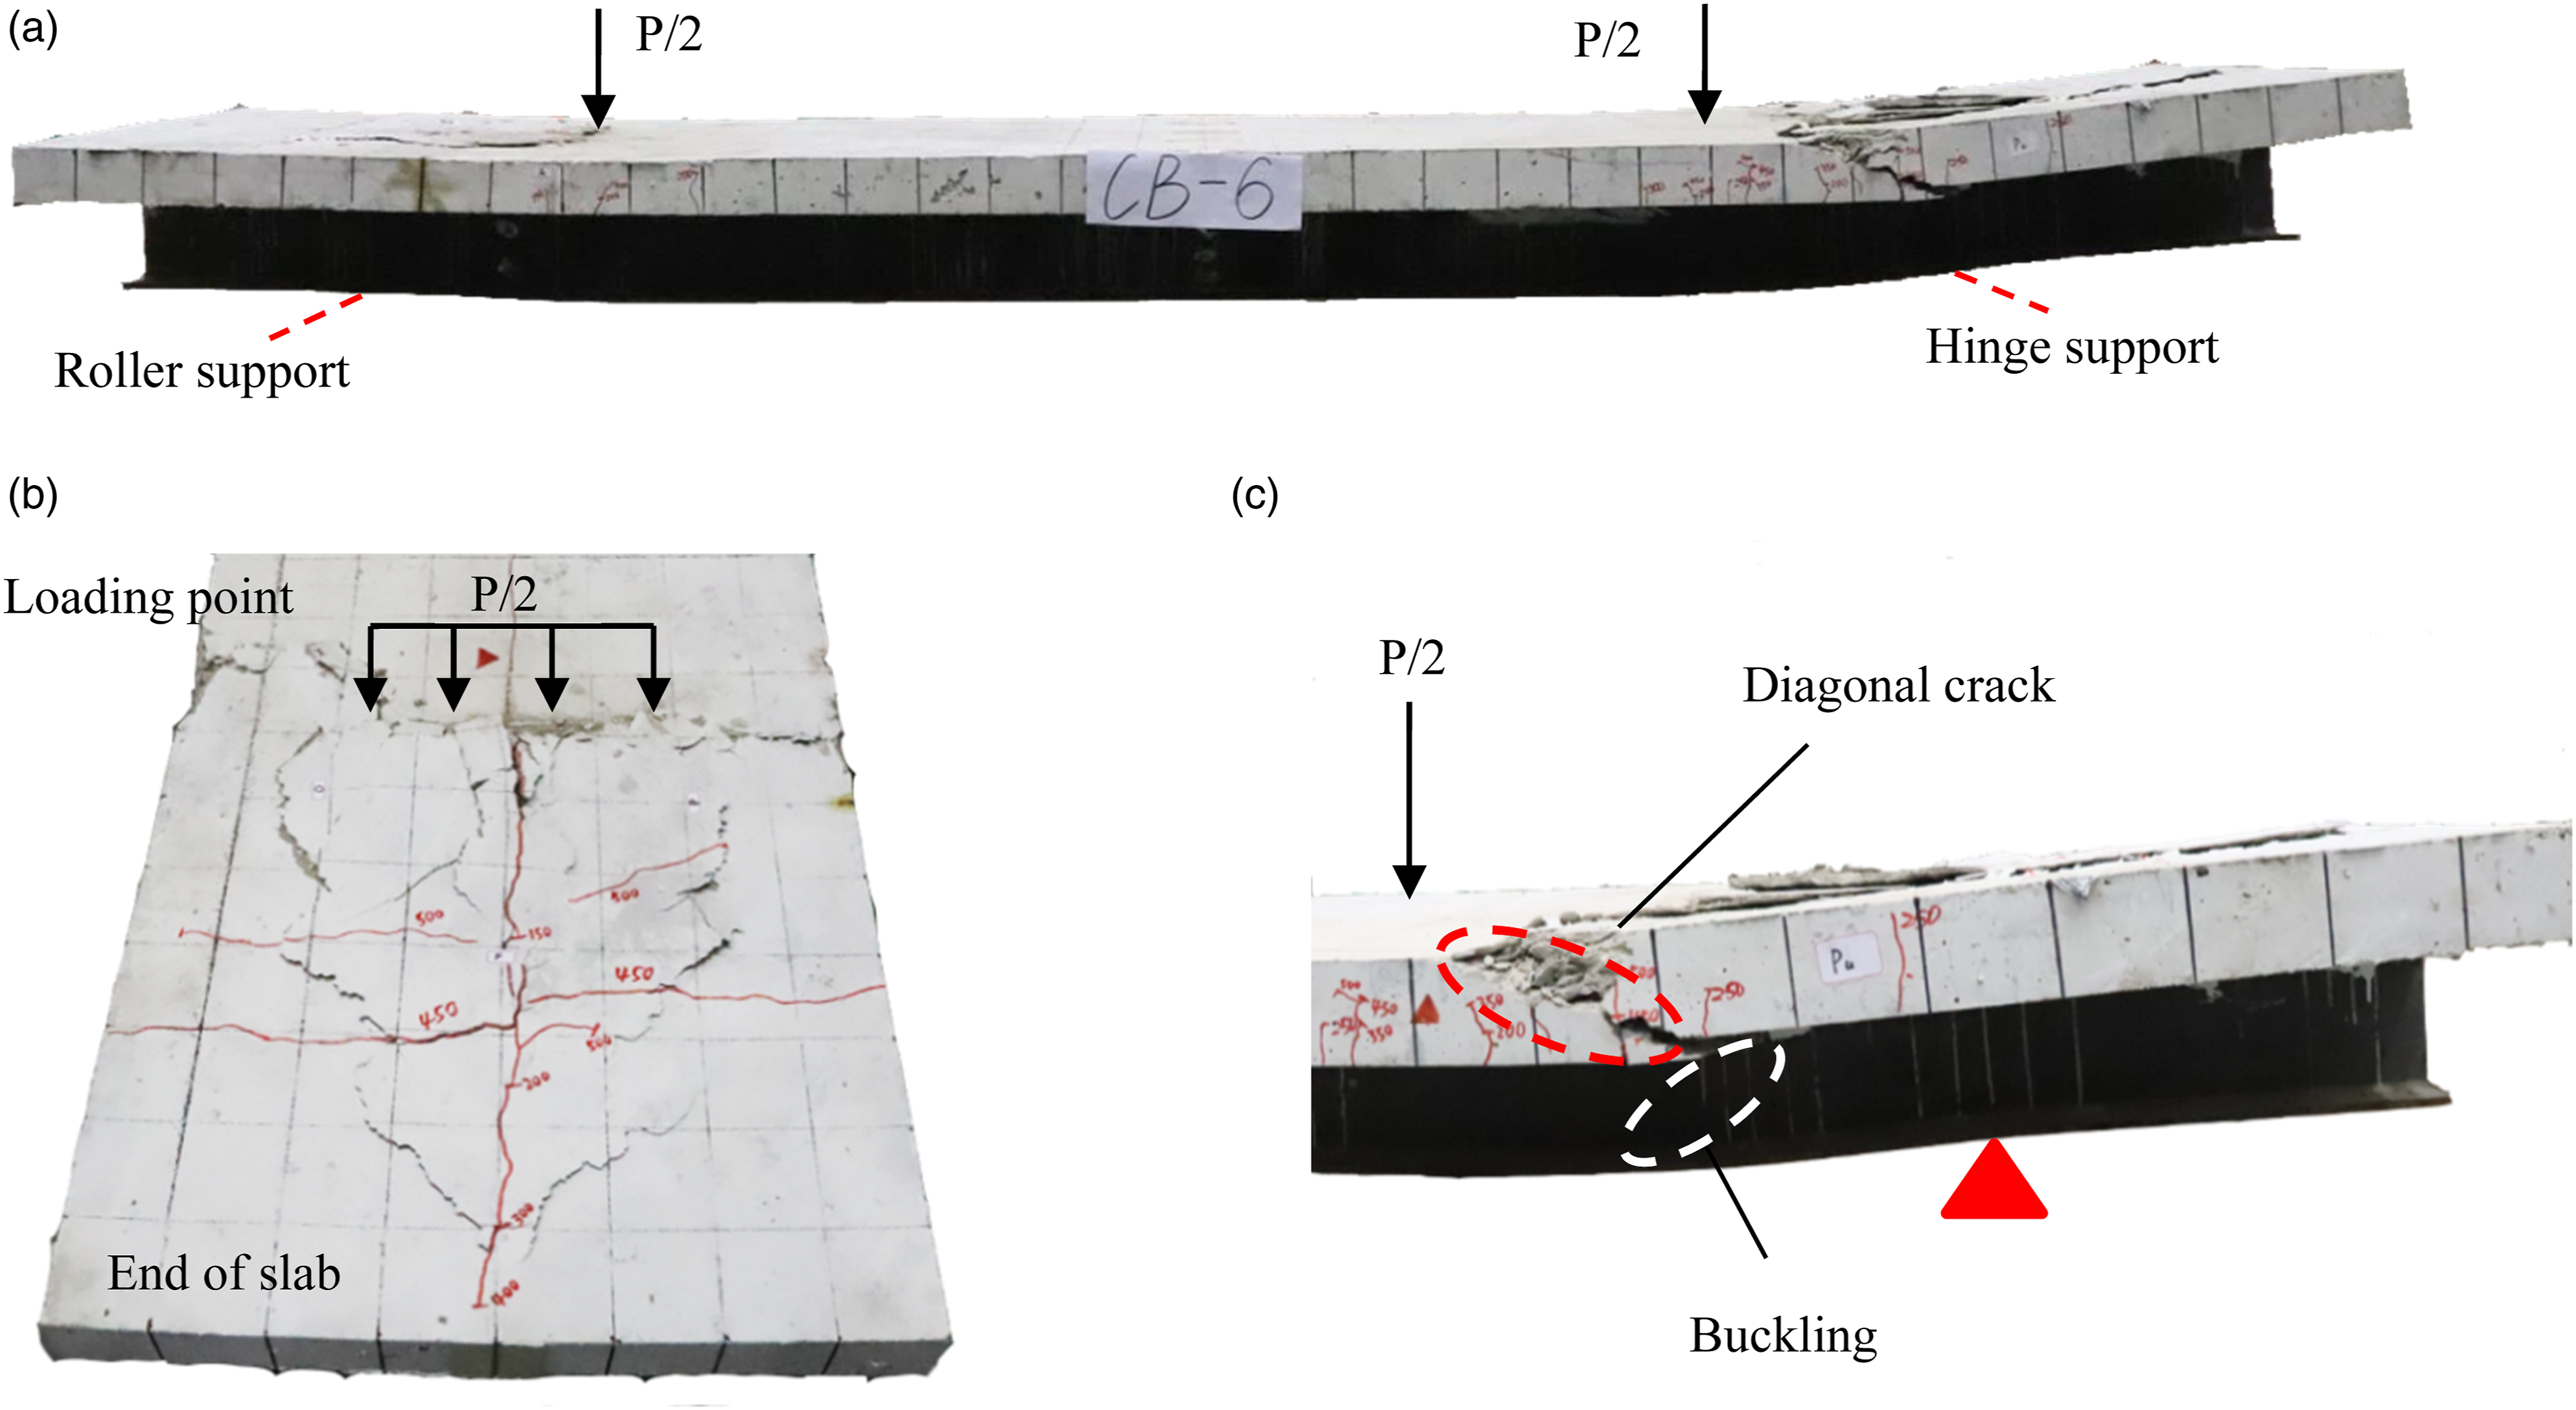
When loading to 0.3Pu (Pu is the peak load), the first longitudinal crack appeared on concrete slab top in the shear span due to the punching action of embedded connectors (Figure 4). When loading to 0.8Pu, the steel bottom flange yielded and the tree-like cracks occurred on the top of the slab because of the longitudinal shear force from the connectors. When loading to peak load Pu, the tree-like cracks developed severely (Figure 5(a) and (b)) and the steel web began to buckle in shear span (Figure 5(c)). During the load descending stage, a diagonal crack formed near the loading point in the shear span. The diagonal crack ran through the entire slab section, which led to a sharp load drop and test terminated (Figure 5(c)). Crack development process. Specimen CB-6-800-Swallow tail. (a) Diagonal shear failure and deflection; (b) Treelike cracks; (c) Diagonal crack.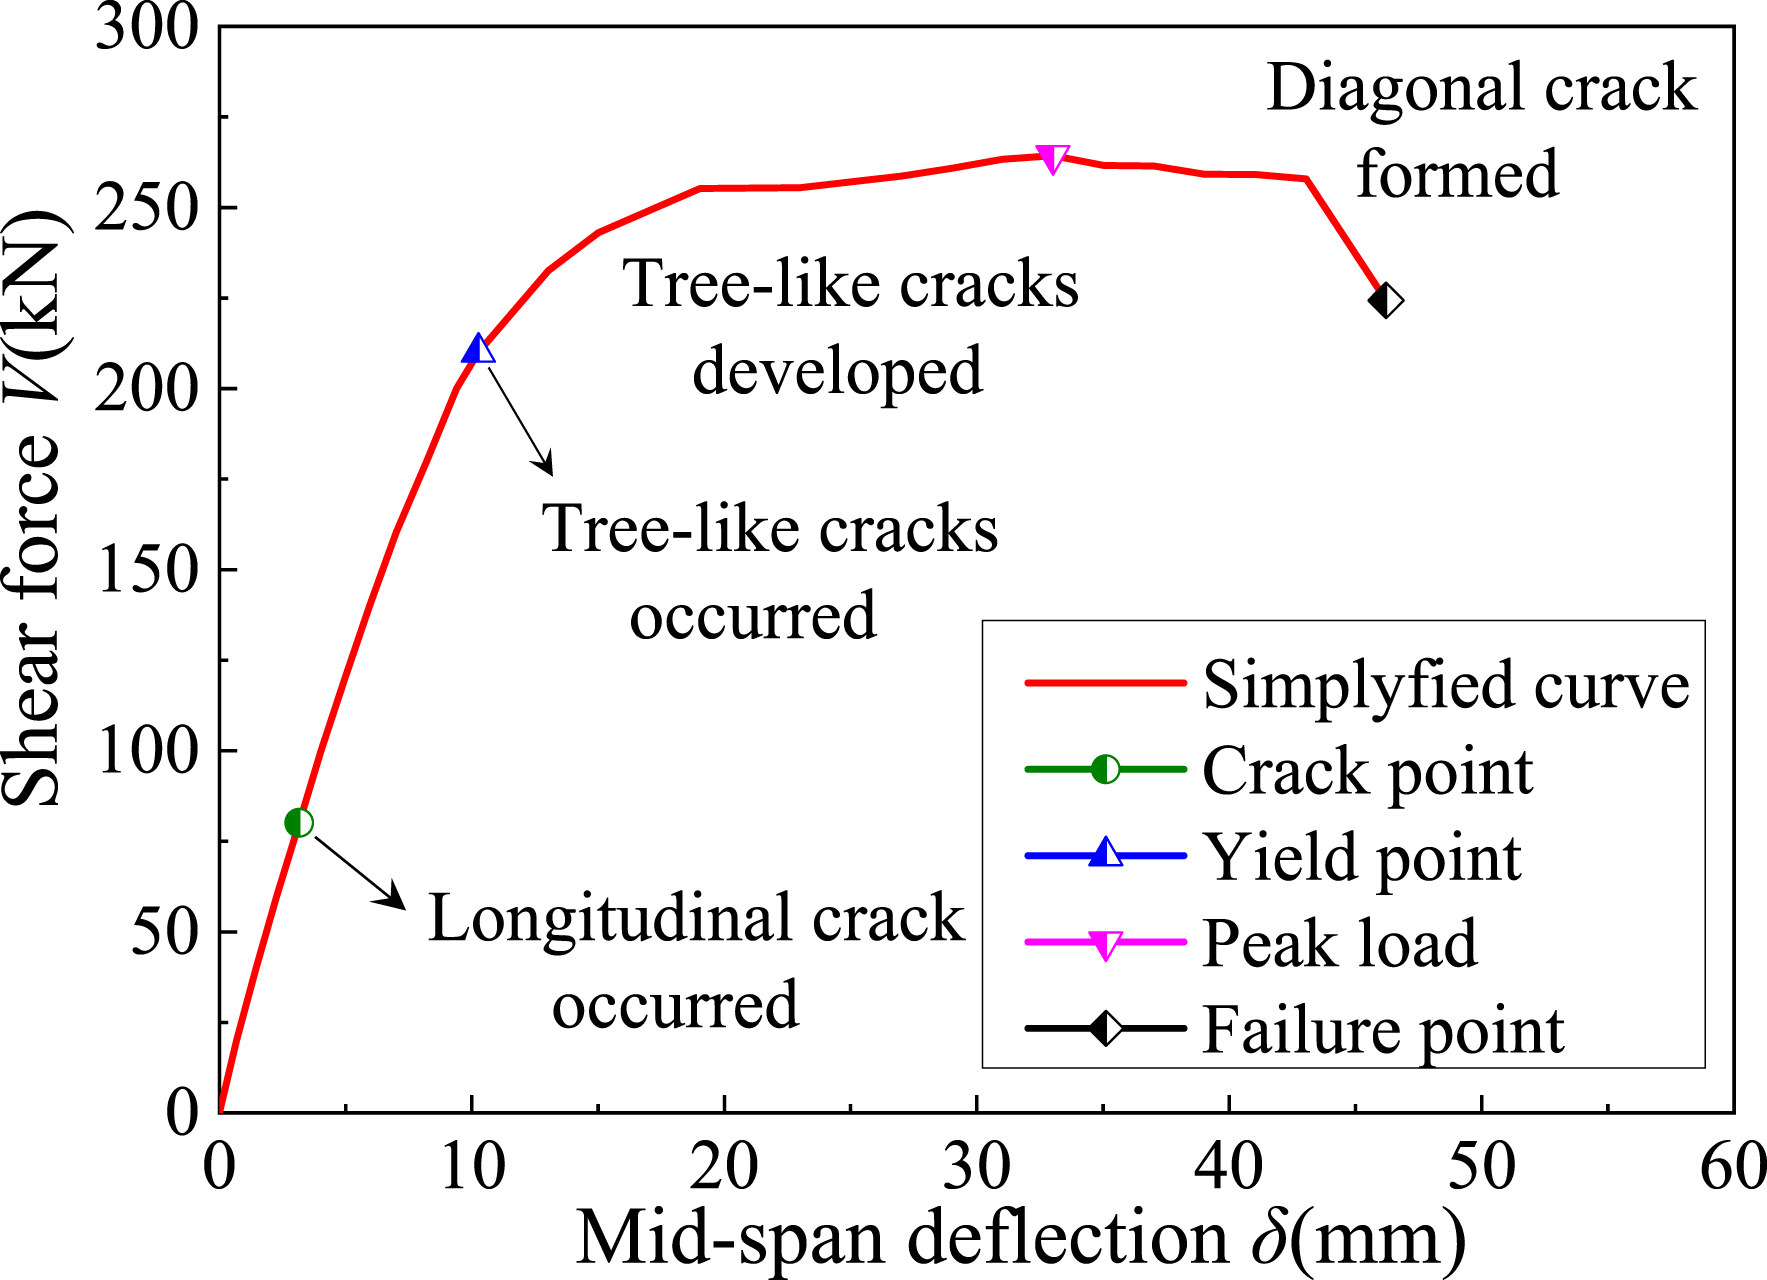
Concrete slab crushing failure
Specimens CB-3 and CB-8 with modified gear shear connectors performed concrete slab crushing failure. Figure 6(a) shows the ultimate failure phenomenon of specimen CB-8. Before the peak load was reached, the test phenomenon of this failure mode was similar with that of the diagonal shear failure. During the load descending stage, there was no obvious diagonal crack on the slab, but crack concentration area in shear span (Figure 6(a)). The modified gear shear connector had larger influence area in concrete than other shear connectors, therefore it made cracks evenly distributed in shear span. The cracks developed more seriously so that concrete crushing occurred at the top of the slab and peeling of large pieces of concrete resulted in specimen failure (Figure 6(b)). Specimen CB-8-800-Modified gear. (a) Concrete slab crushing failure and deflection; (b) Concrete crushing; (c) Buckling of steel beam.
The concrete crushing area, which is different from other specimens, is obviously caused by the orthogonal gears. The influence zone diffuses upward from the bottom angle of the orthogonal gears to the top of the concrete slab. As shown in
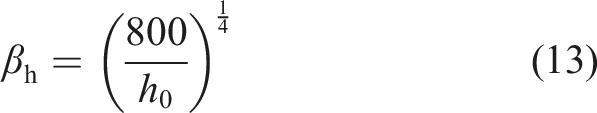
Figure 7, the width of the orthogonal gear bs = 85 mm, and the width of the crushing area bcrack = 400 mm. So the diffusion angle of influence zone is determined to be 60°. Influence zone of modified gear connectors.
Based on the test results, the concrete crushing area on the top of the slab is the extension of connector influence zone, which has a trapezoid cross section in the slab. The influence zone has a extension angleof 60°.
Load-displacement curves
The load-displacement curves of all WSCB specimens were obtained in the test and shown in Figure 8. Table 3 shows the mechanical performance indexes of each WSCB specimen, including initial stiffness (k), yield load (Vy), peak load (Vu), ductility factor (μ), and plastic development coefficient (γs). Load versus mid-span deflection curves. (a) 1150 mm-width group; (b) 800 mm-width group. Mechanical performance index.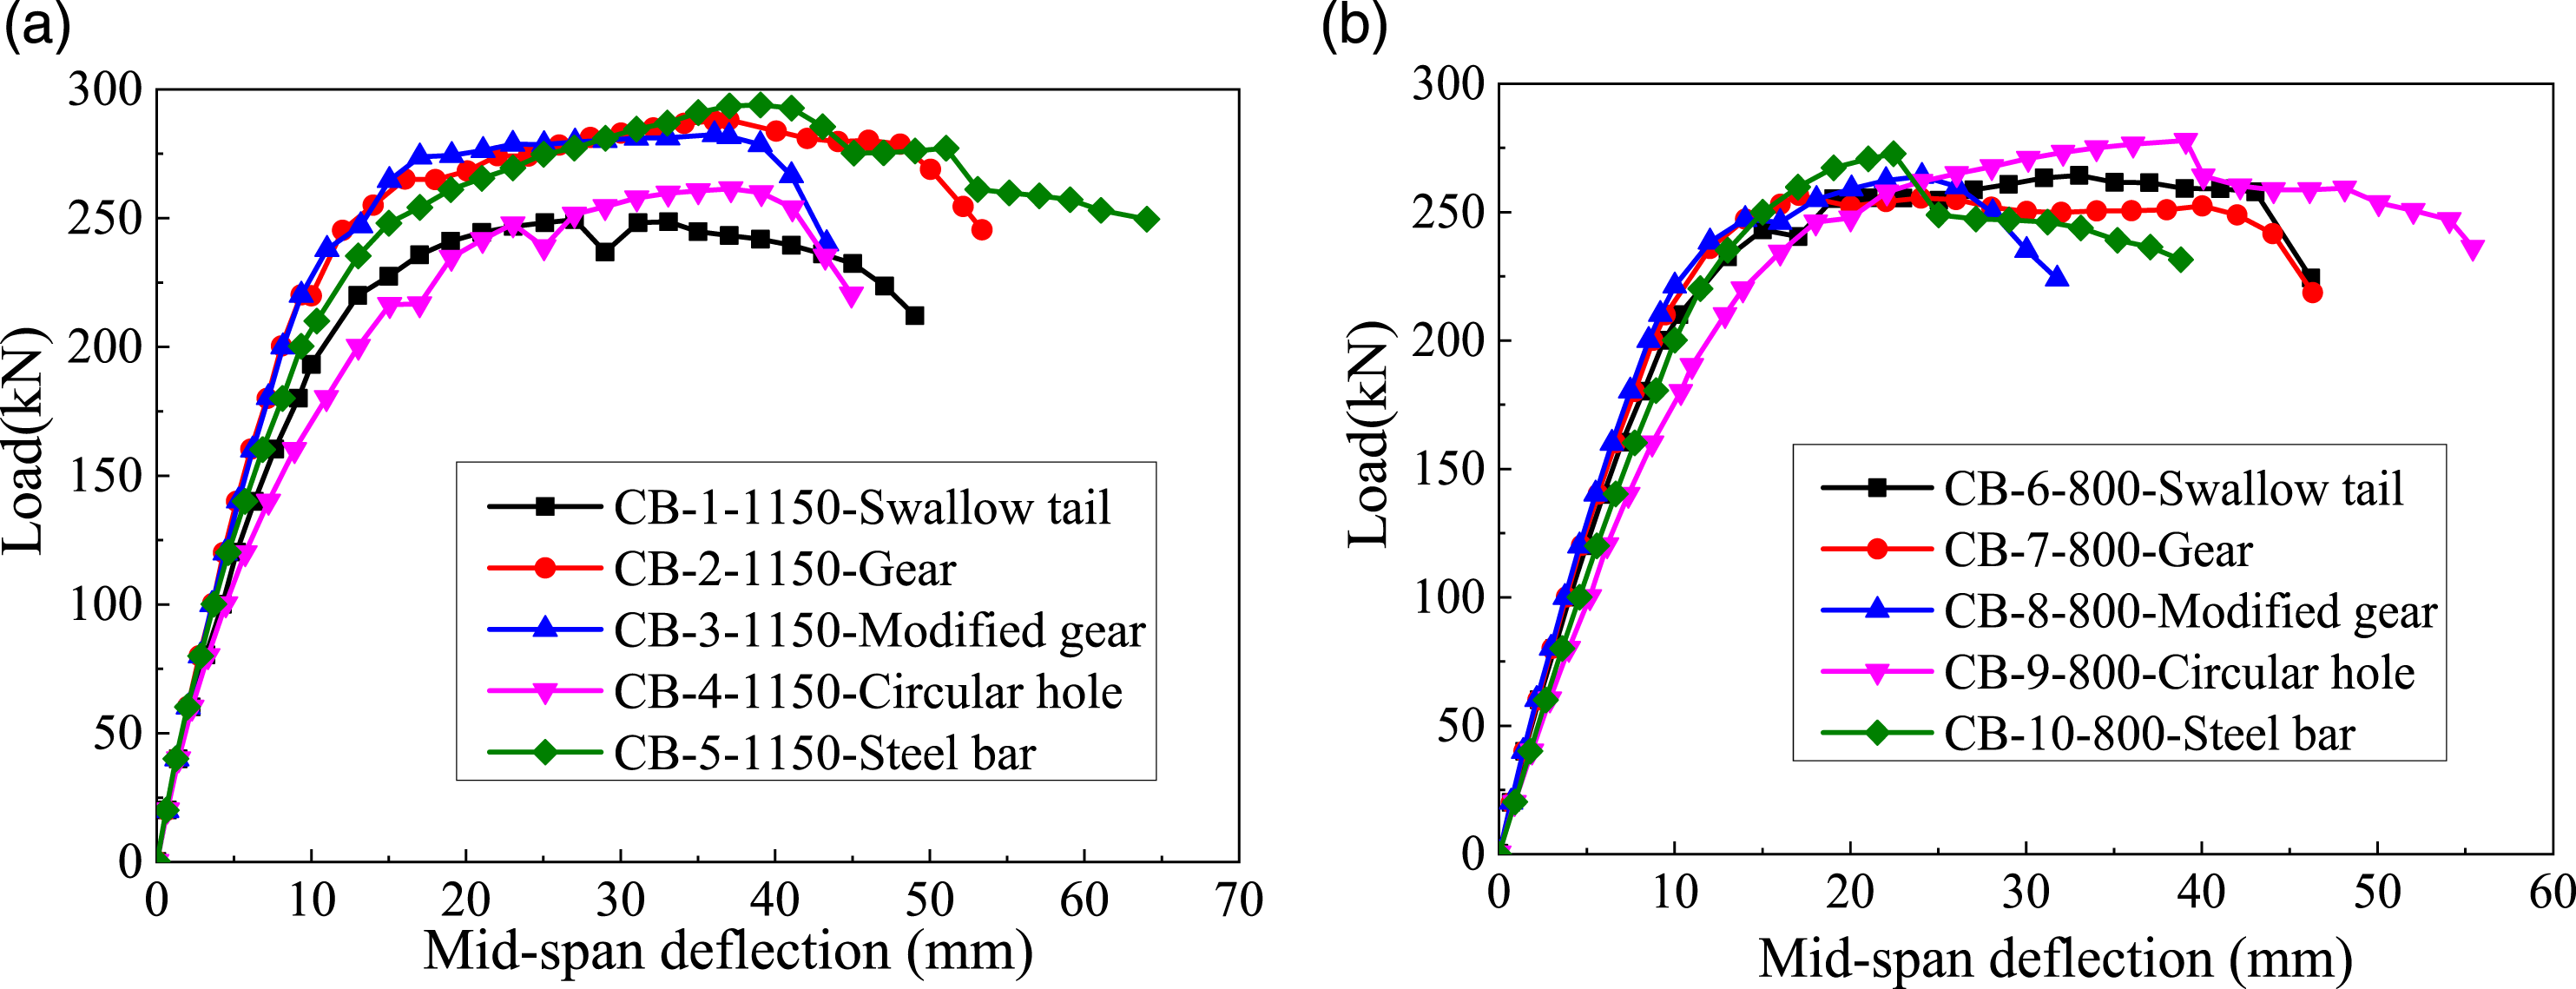
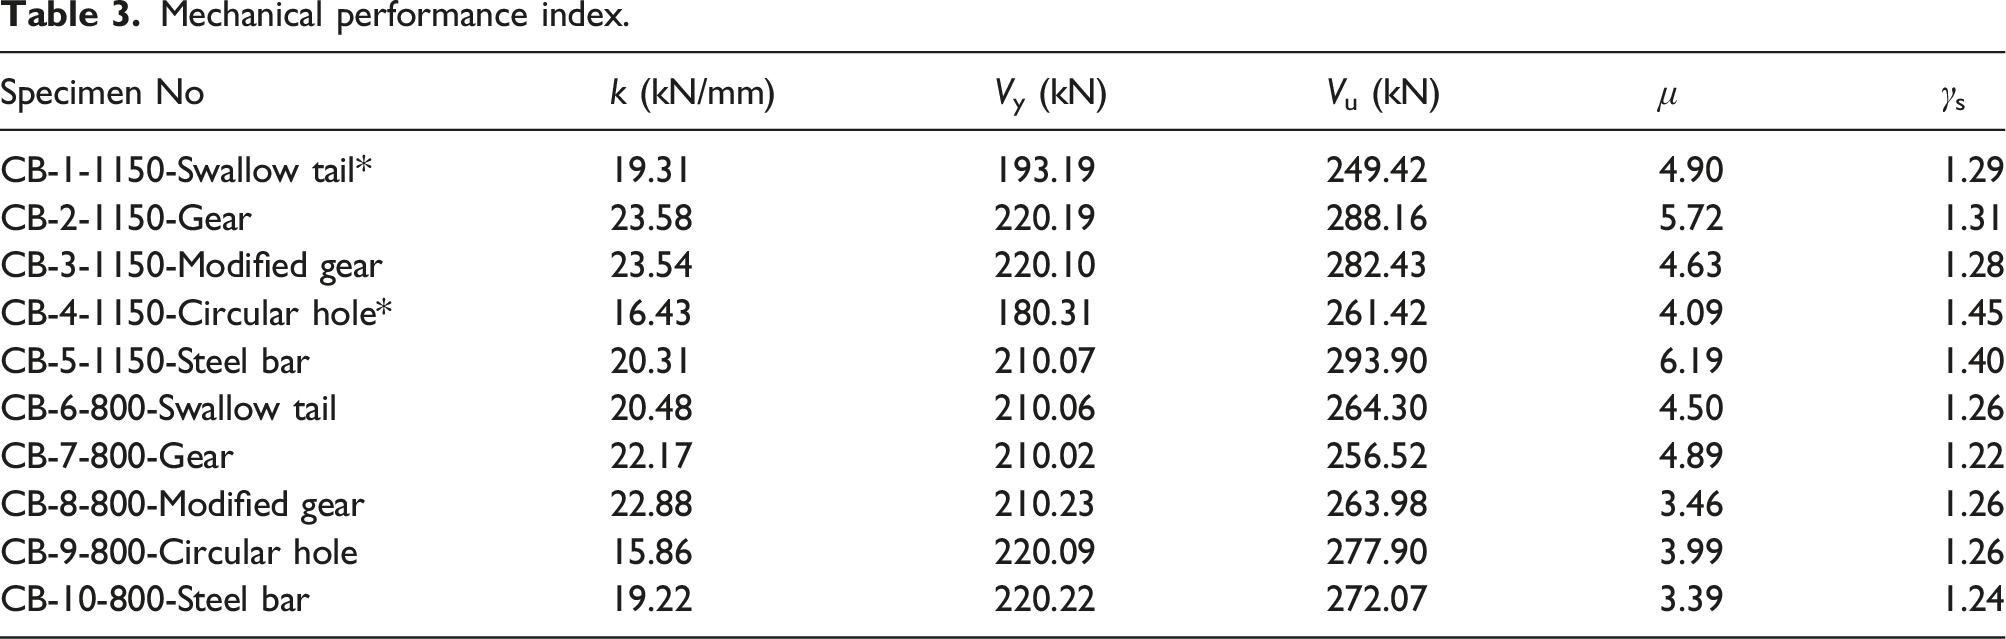
The initial stiffness k is taken as the secant stiffness of the load-displacement curve before yielding of bottom flange. The ductility coefficient μ and plastic development coefficient γs are respectively calculated by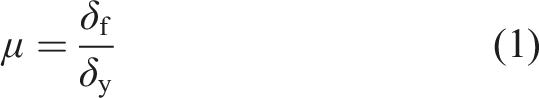

In general, the WSCB specimens performed well in ductility. The μ value is 3.39–6.19 for all specimens. The plastic development coefficient γs of all the specimens exceeds 1.2, demonstrating that the bearing capacity have adequate redundancy after yielding. The specimens with circular holes or steel bars exhibit lower initial stiffness compared with other specimens. This is because the deformation of concrete slab and steel beam is coordinated mainly by rebar in holes, which is weaker than the interlocking between concrete dowel and steel dowel. However, the shear capacity of the specimens with circular holes orsteel bars is higher than other specimens due to smaller reduction on the web top. (1) Concrete slab width
By comparison of 1150 mm-width slab group and 800 mm-width slab group, the initial stiffness, peak load, and ductility factor of 1150 mm-width group were generally higher than those of 800 mm-width group, which indicated that properly increasing the width of the concrete slab within the parametric range of this test was conducive to improve the mechanical properties. (2) Pattern of connectors
① Gear and modified gear
The load-displacement curves of specimens with gears (CB-2 and CB-7) and modified gears (CB-3 and CB-8) basically coincided in the stiffness, yield load and peak load, indicating that the orthogonal gear in the specimens CB-3 and CB-8 contributed little to the shear capacity of WSCB. Furthermore, the specimens with gears were a little more ductile than the specimens with modified gears due to the different failure modes (Figures 5 and 6).
② Circular hole and steel bar
The initial stiffness of specimens with circular holes (CB-5 and CB-10) was smaller than that of specimens with steel bars (CB-4 and CB-9), while the peak bearing capacities were close (eg. Vu(CB-9) = 277.90 kN; Vu(CB-10) = 272.07 kN), which proved that the concrete dowels forming in the circular hole connector could reduce the initial shear stiffness but contributed little to the overall shear capacity. Besides, the ductility of specimens with circular holes are close or slightly better than specimen with steel bars (eg. μ(CB-9) = 3.99, μ(CB-10) = 3.39). It is noted that the ductility of CB-4 is lower exceptionally, due to the instability of steel web caused by faulty installation.
③ Swallow tail, gear and modified gear
The specimens with swallow tail connectors (CB-1 and CB-6) have similar initial stiffness and peak bearing capacity compared with specimens installed with gears or modified gears. Due to unprecise manufacturing of specimen CB-1, the concrete slab was not perpendicular to the steel web, resulting in slight overall buckling of the web during the later loading, which reduced the overall bearing capacity and ductility.
Strain analysis
Longitudinal strain of bottom flange
Longitudinal strain gauges were arranged in the bottom flange at mid-span and loading cross section. The load-strain curves are given in Figure 9. Longitudinal strain development of bottom flange.(a) 1150 mm-width specimens at loading cross section; (b) 1150 mm-width specimens at mid-span; (c) 800 mm-width specimens at loading cross section; (d) 800 mm-width specimens at mid-span; (e) Specimen CB-6-800-Swallow tail; (f) Specimens CB-8-800-Modified gear.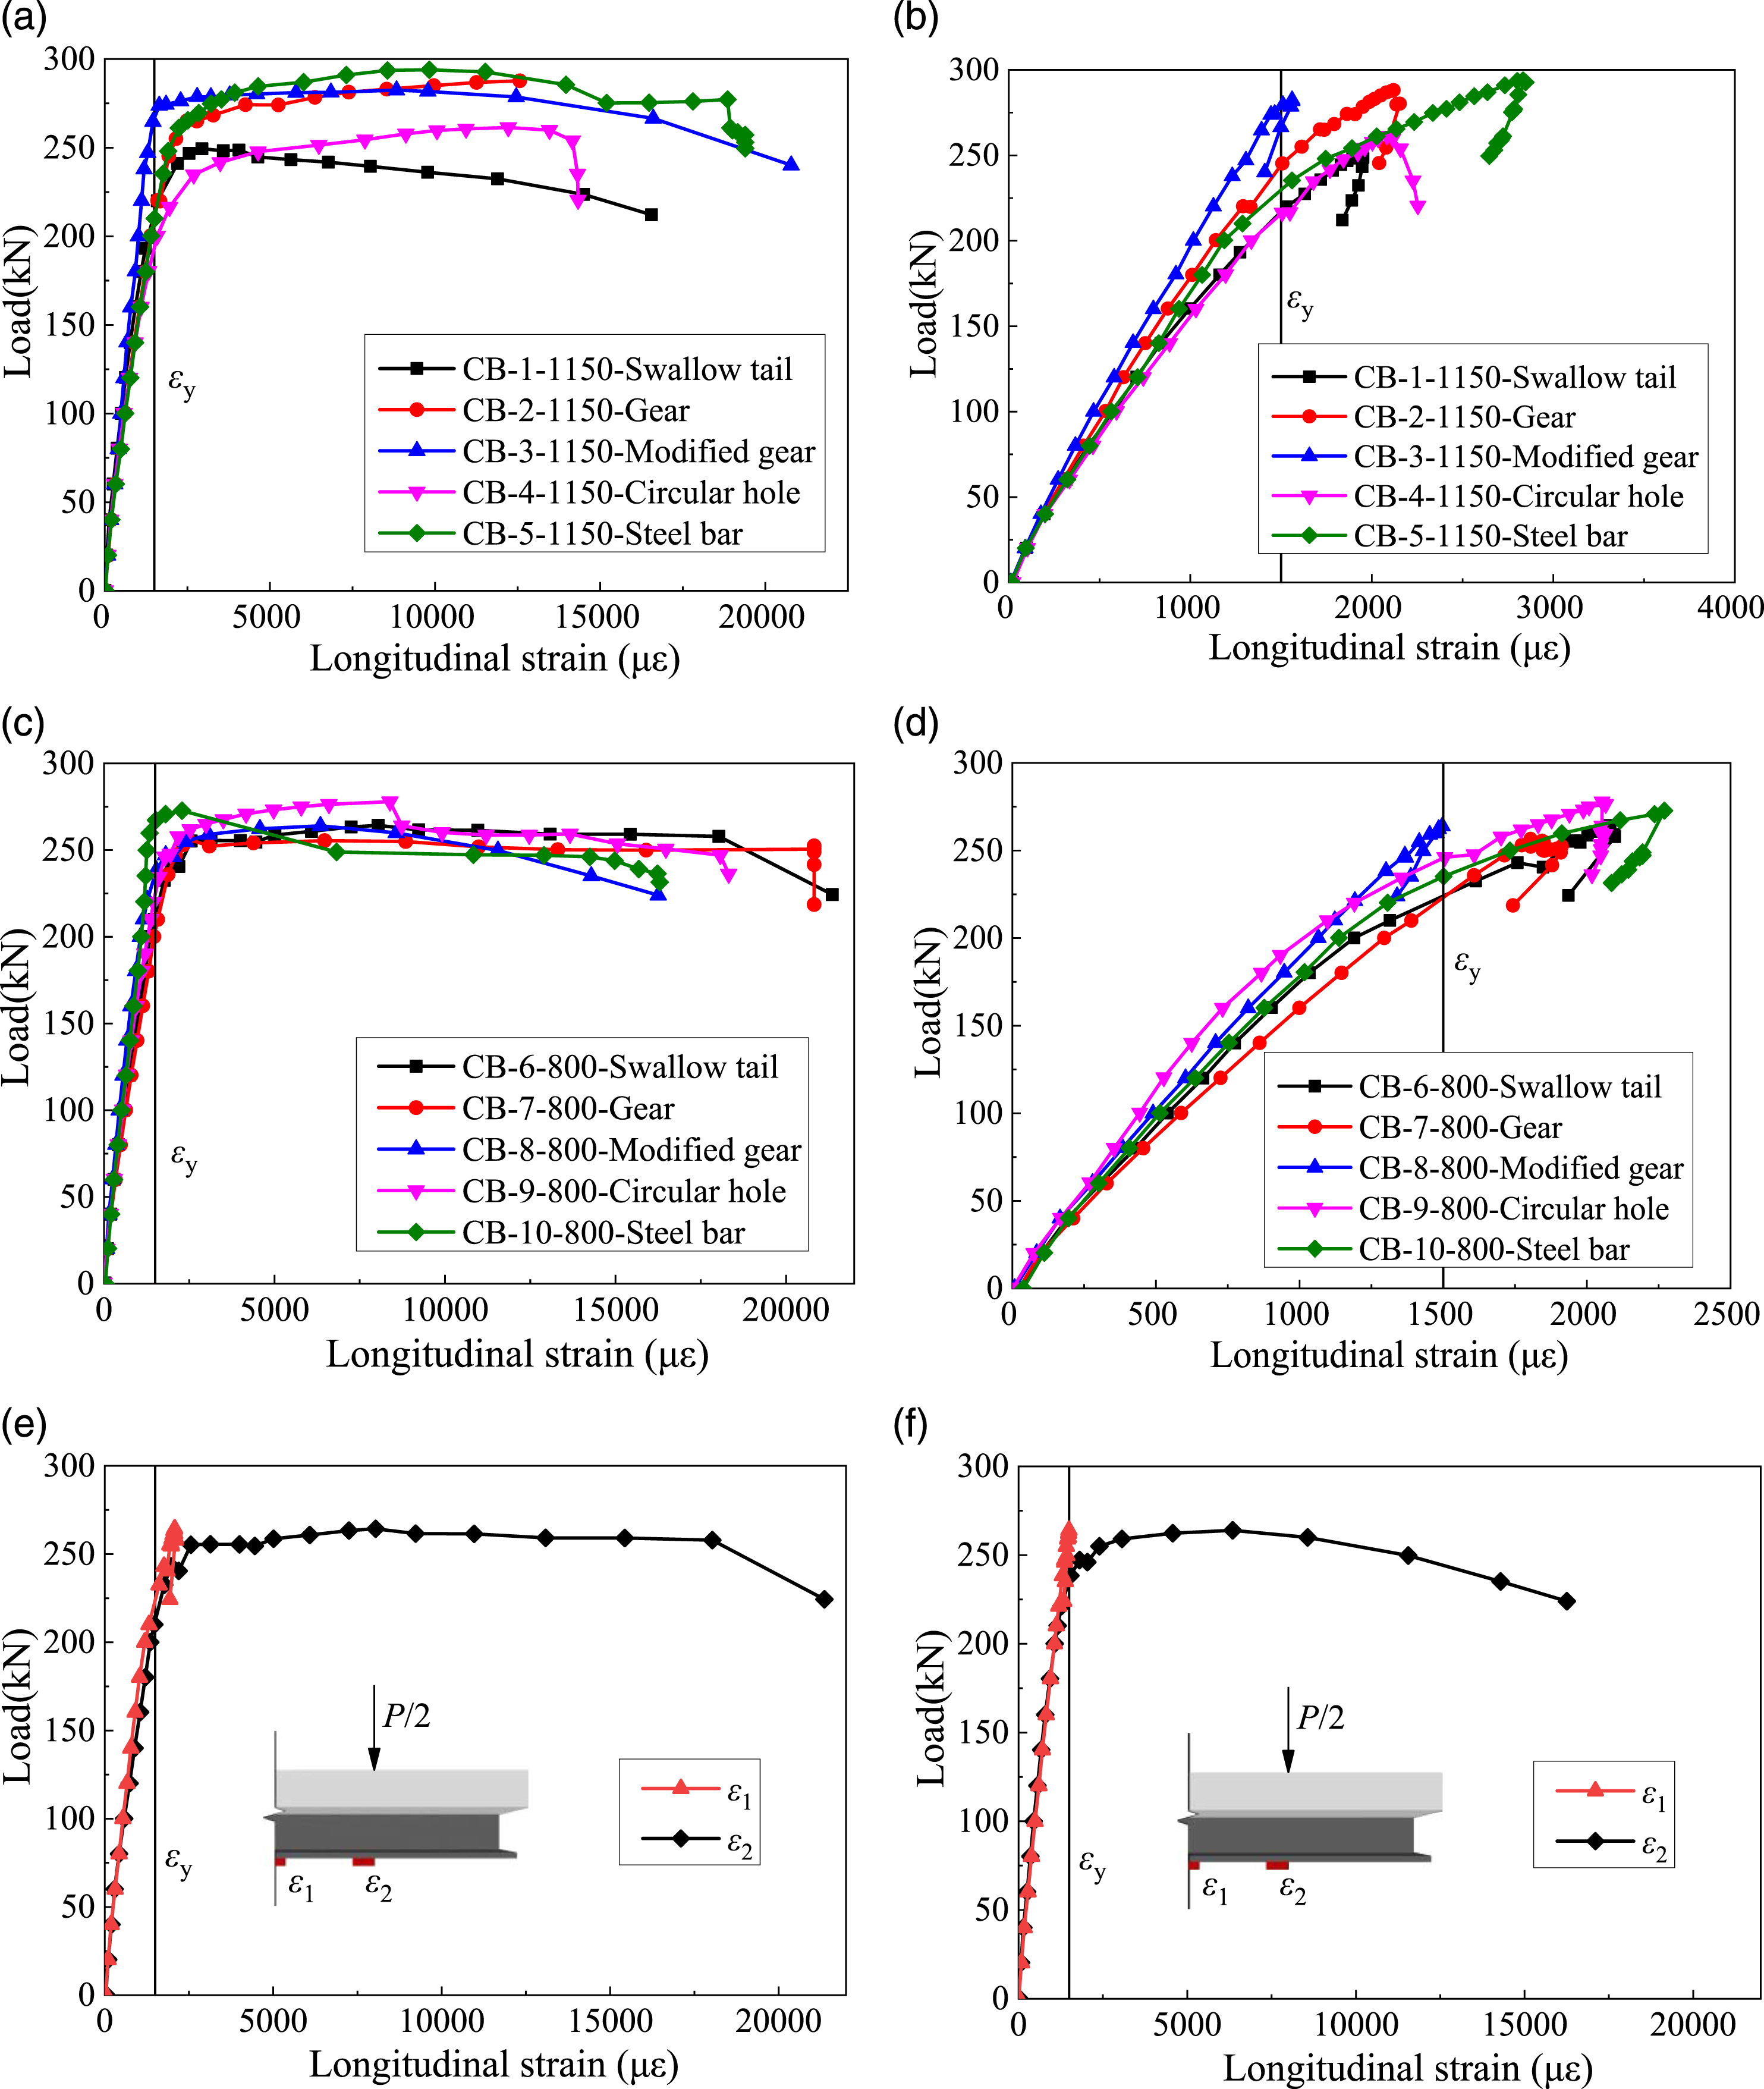
As observed from the curves, the strains of the concrete slab were measured from the top surface near the mid-span loading point (Li et al., 2012). The steel bottom flange at loading cross section reached yield strain 1500με before the peak load. Then the strain increased rapidly and exceeded 15000με during the load descending stage. Meanwhile, the load-strain curves at mid-span cross section reached the yield strain with the slope equal to that at loading cross section in elastic stage. After yielding, the strain increased slightly and stayed below 3000με till the end of the test, demonstrating that the strains at different sections performed significant difference after the bottom flange yielded.
Longitudinal strain distribution within slab width
Figure 10 shows the longitudinal concrete strain distribution within the slab width, which clearly indicates the shear lag effect. Five strain gauges were uniformly attached on the top surface of the concrete slab at the mid-span (Figure 3). Longitudinal strain distribution within slab width. (a) Specimen CB-8-800-Modified gear; (b) Specimen CB-9-800-Circular hole.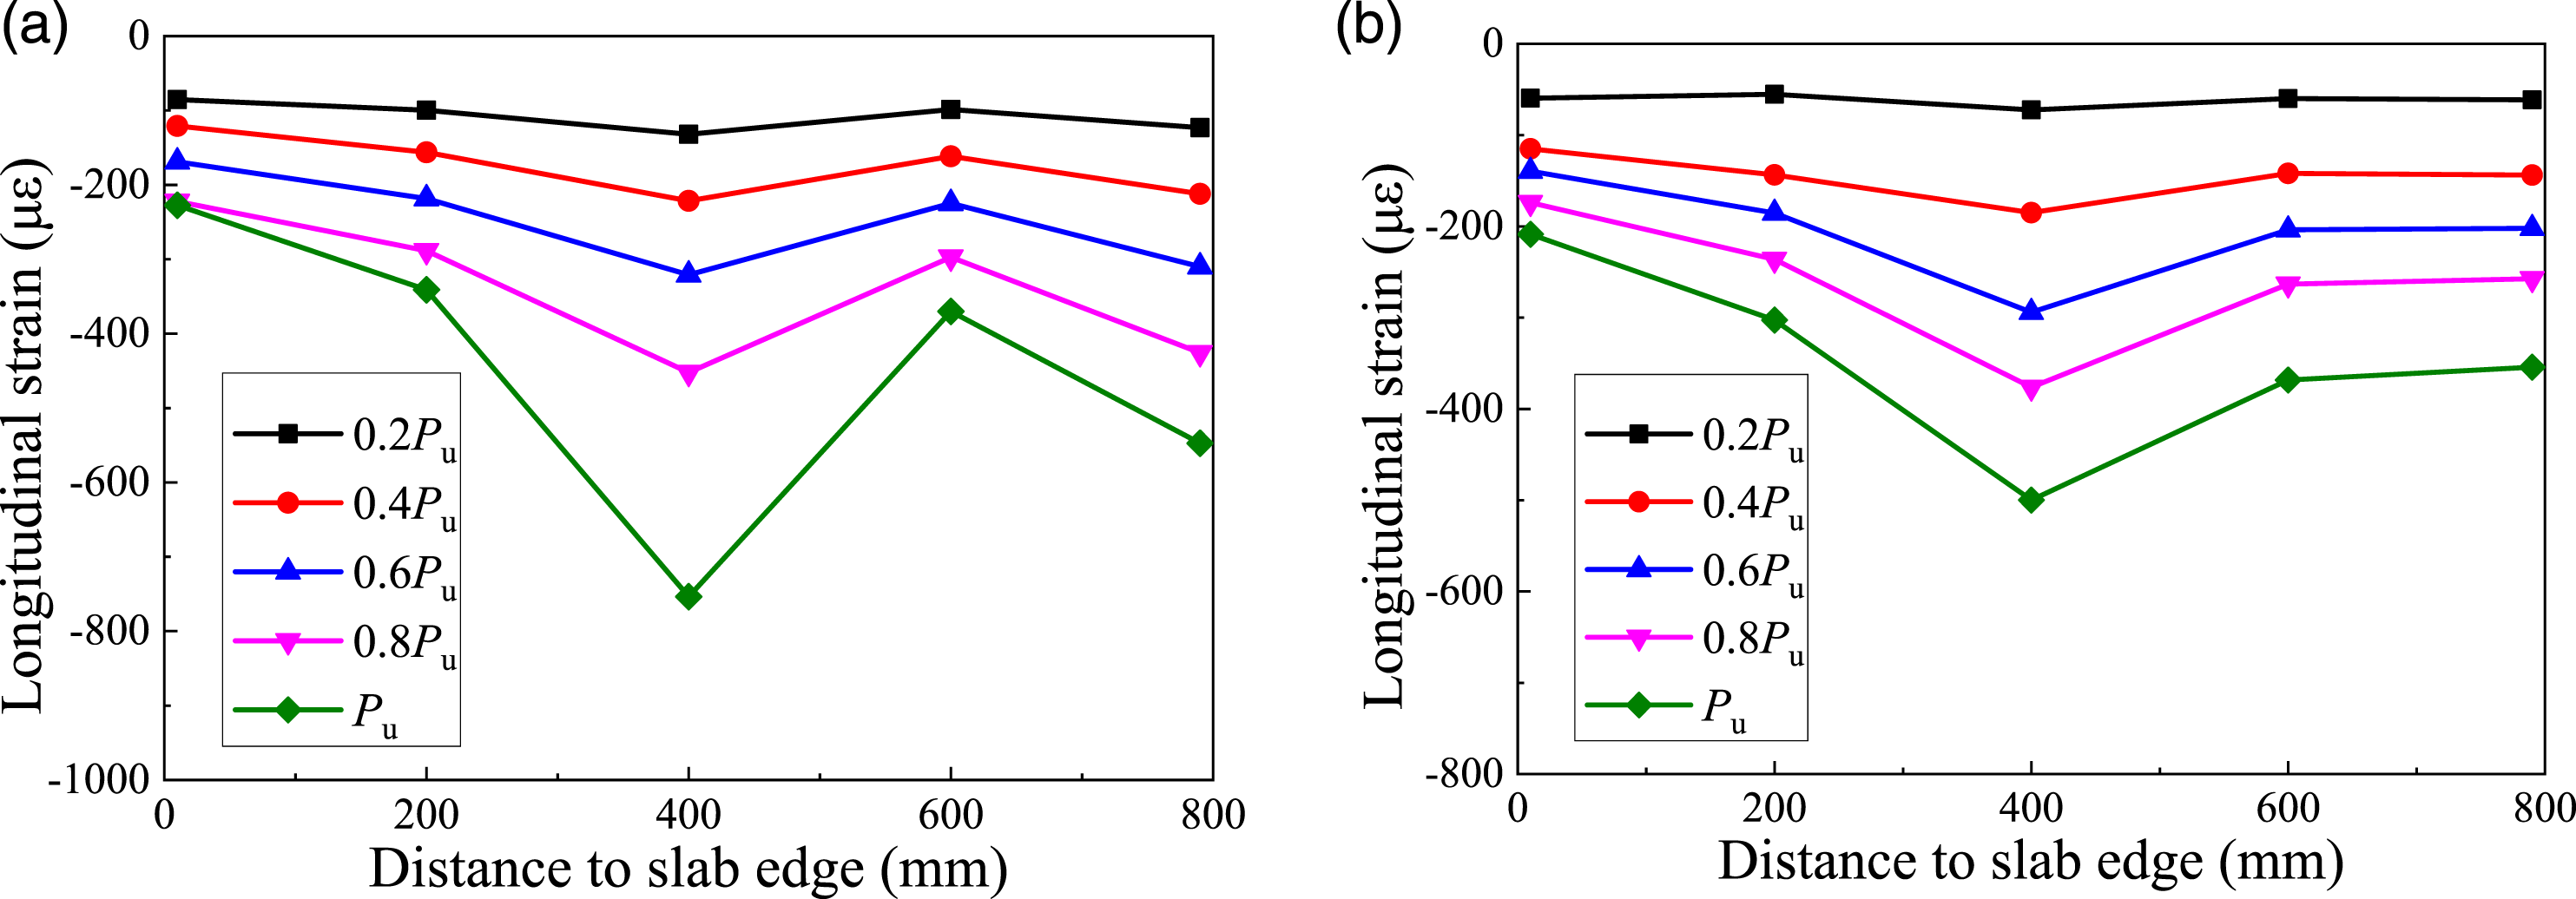
Before the load of 0.4Pu, the longitudinal strains within the slab width were approximately equal, indicating a uniform compressive deformation for the concrete slab. When the load exceeded 0.4Pu, the strains in the middle part of the slab developed faster than those near the slab edges. The former was approximately 50–200% larger than the latter at the peak load Pu. But all the strains did not exceed the peak compressive strain 1410με (Lorenc et al., 2014a). So the concrete located in pure bending span didn’t reach the stress limit state, indicating that the entire composite beam is in a shear failure mode rather than bending failure mode.
Longitudinal strain distribution along the beam depth
Typical longitudinal strain distributions along the beam depth at the mid-span are given in Figure 11. The concrete slab and steel beam worked integrally in the elastic stage, therefore a common neutral axis (NA) existed in the concrete slab, which gradually moved upward due to the concrete cracking in the tensile region. The longitudinal strains were linearly distributed along the beam depth, revealing that the plane cross-section assumption was satisfied. After the load of 0.8Pu, specimens with modified gears still performed well in integral action, while the common NA in other specimens was changed into two NAs. At peak load, only one measure point at the lower portion of web exceeded 1500με, indicating that the flexure failure did not occur in the test. Typical longitudinal strain distribution along the beam depth at the mid-span. (a) CB-8-800-Modified gear; (b) CB-10-800-Steel bar.
Analysis of Strain gauge rosettes
To determine the possible shear failure development of the specimens in the shear span and monitor the stress in the steel webs, six groups of strain rosettes were arranged vertically on the steel web (Ru, Rm, and Rd in the Figure 12). Strain gauge and strain rosette layout.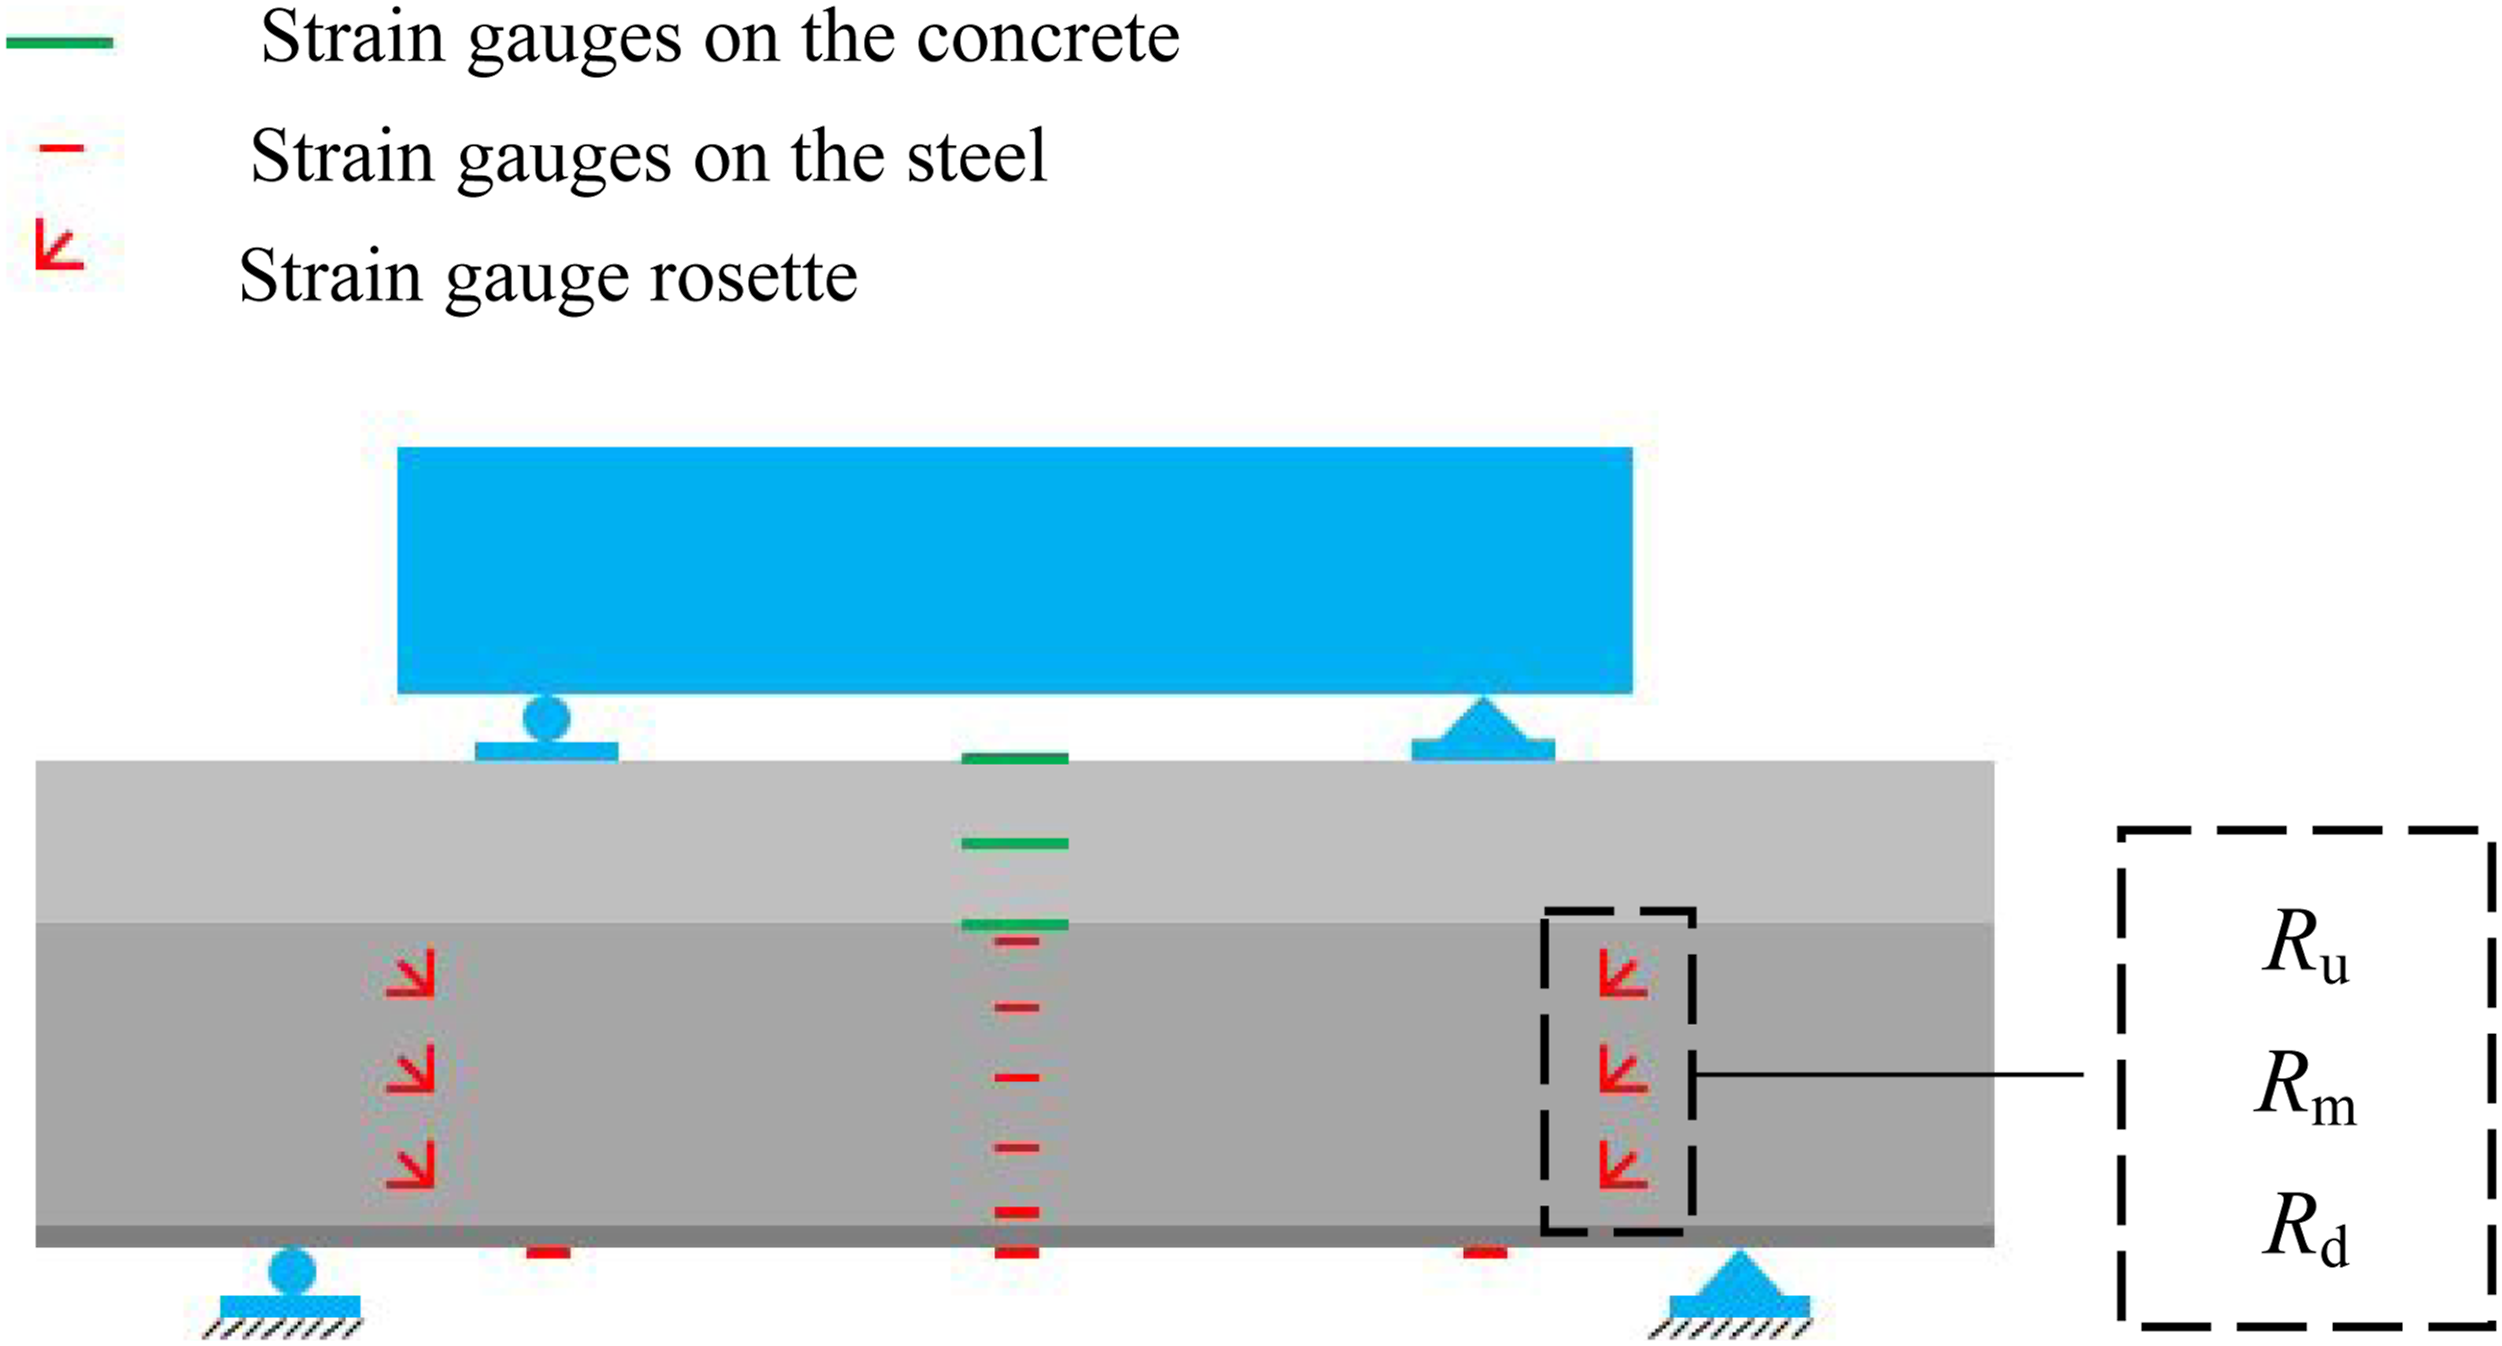
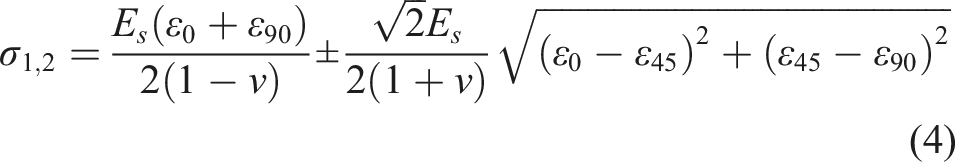
The strains in the steel web were recorded during the test. The principal strain (ε1, ε2), principal stresses (σ1, σ2), and corresponding principal stress orientation α0 are defined according to following formulae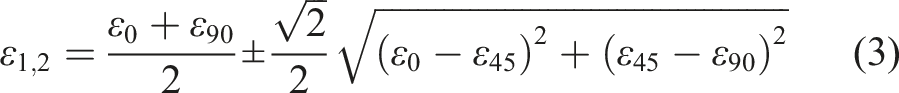

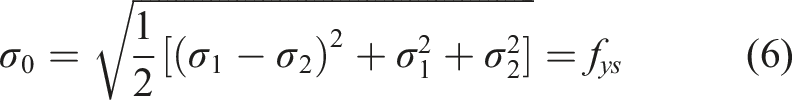
The yield load (P0y) of steel web in the shear span.

From Table 4, it suggests that steel web in the shear span yielded from bottom to top. The experimental yield loads were generally lower than those obtained from steel bottom flange. The entire web in the shear span yielded before the peak load, proving that shear failure occurred in all WSCB specimens.
To sum up, from the experimental results, it is suggested that: (1) the entire composite beam showed failure mode rather than bending failure mode. (2) the diagonal shear failure and concrete slab crushing failure are two typical shear failure modes, depending on the different shear connector types; (3) the WSCB specimens performed well in ductility, and the shear capacity of the specimens with circular holes or steel bars is higher than other specimens due to smaller reduction on the web top; (4) steel web in the shear span yielded from bottom to top and the entire web in the shear span yielded before the peak load.
Finite element analysis
Material, interaction and boundary condition
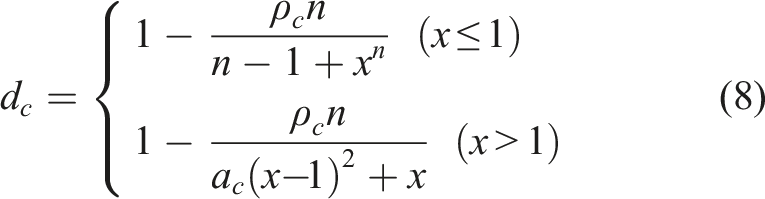
A finite element (FE) model is established using ABAQUS software. A concrete damage plasticity model (Lubliner et al., 1989; Newmark et al., 1951) is adopted for concrete constitution. Five parameters, describing its yield function and plastic flow procedure, are taken as following values: the dilation angle is 15°; the eccentricity is 0.1; the fb0/fc0 is 1.16; the K is 0.75 and the viscosity parameter is 0.0002. The input uniaxial stress-strain relationship curve (Figure 13(a)) of plain concrete is determined according to Appendix C of a China Code for design of concrete structures (GB 50010, 2010), as shown below. Uniaxial stress-strain curves of concrete and steel. (a) Concrete; (b) Steel.
The uniaxial compressive stress-strain relationship of concrete is
The uniaxial tensile stress-strain relationship of concrete is

The steel constitution employs a perfect uniaxial elastic-plastic relation curve (Figure 13(b)) (Schmitt et al., 2004; Seidl et al., 2013). The elastic modulus Es and yield strength fy are determined according to the material coupon test (Table 2). The Poisson’s ratio of steel is 0.3.
The concrete and steel are modelled using an 8-node linear brick solid element C3D8R with reduced integration and hourglass control. The distributing bar was modelled with a two-node truss element T3D2. A surface-to-surface contact interaction is applied to describe the relation between steel beam and concrete slab, specifying a hard contact property in the normal direction and a frictionless property in the tangential direction. This interaction allows separation between the concrete and steel after loading. Besides, the distributing bars are embedded in the concrete slab. The boundary condition and loading criterion are modeled completely according to those in the experiment (Figure 14). Loading and boundary conditions.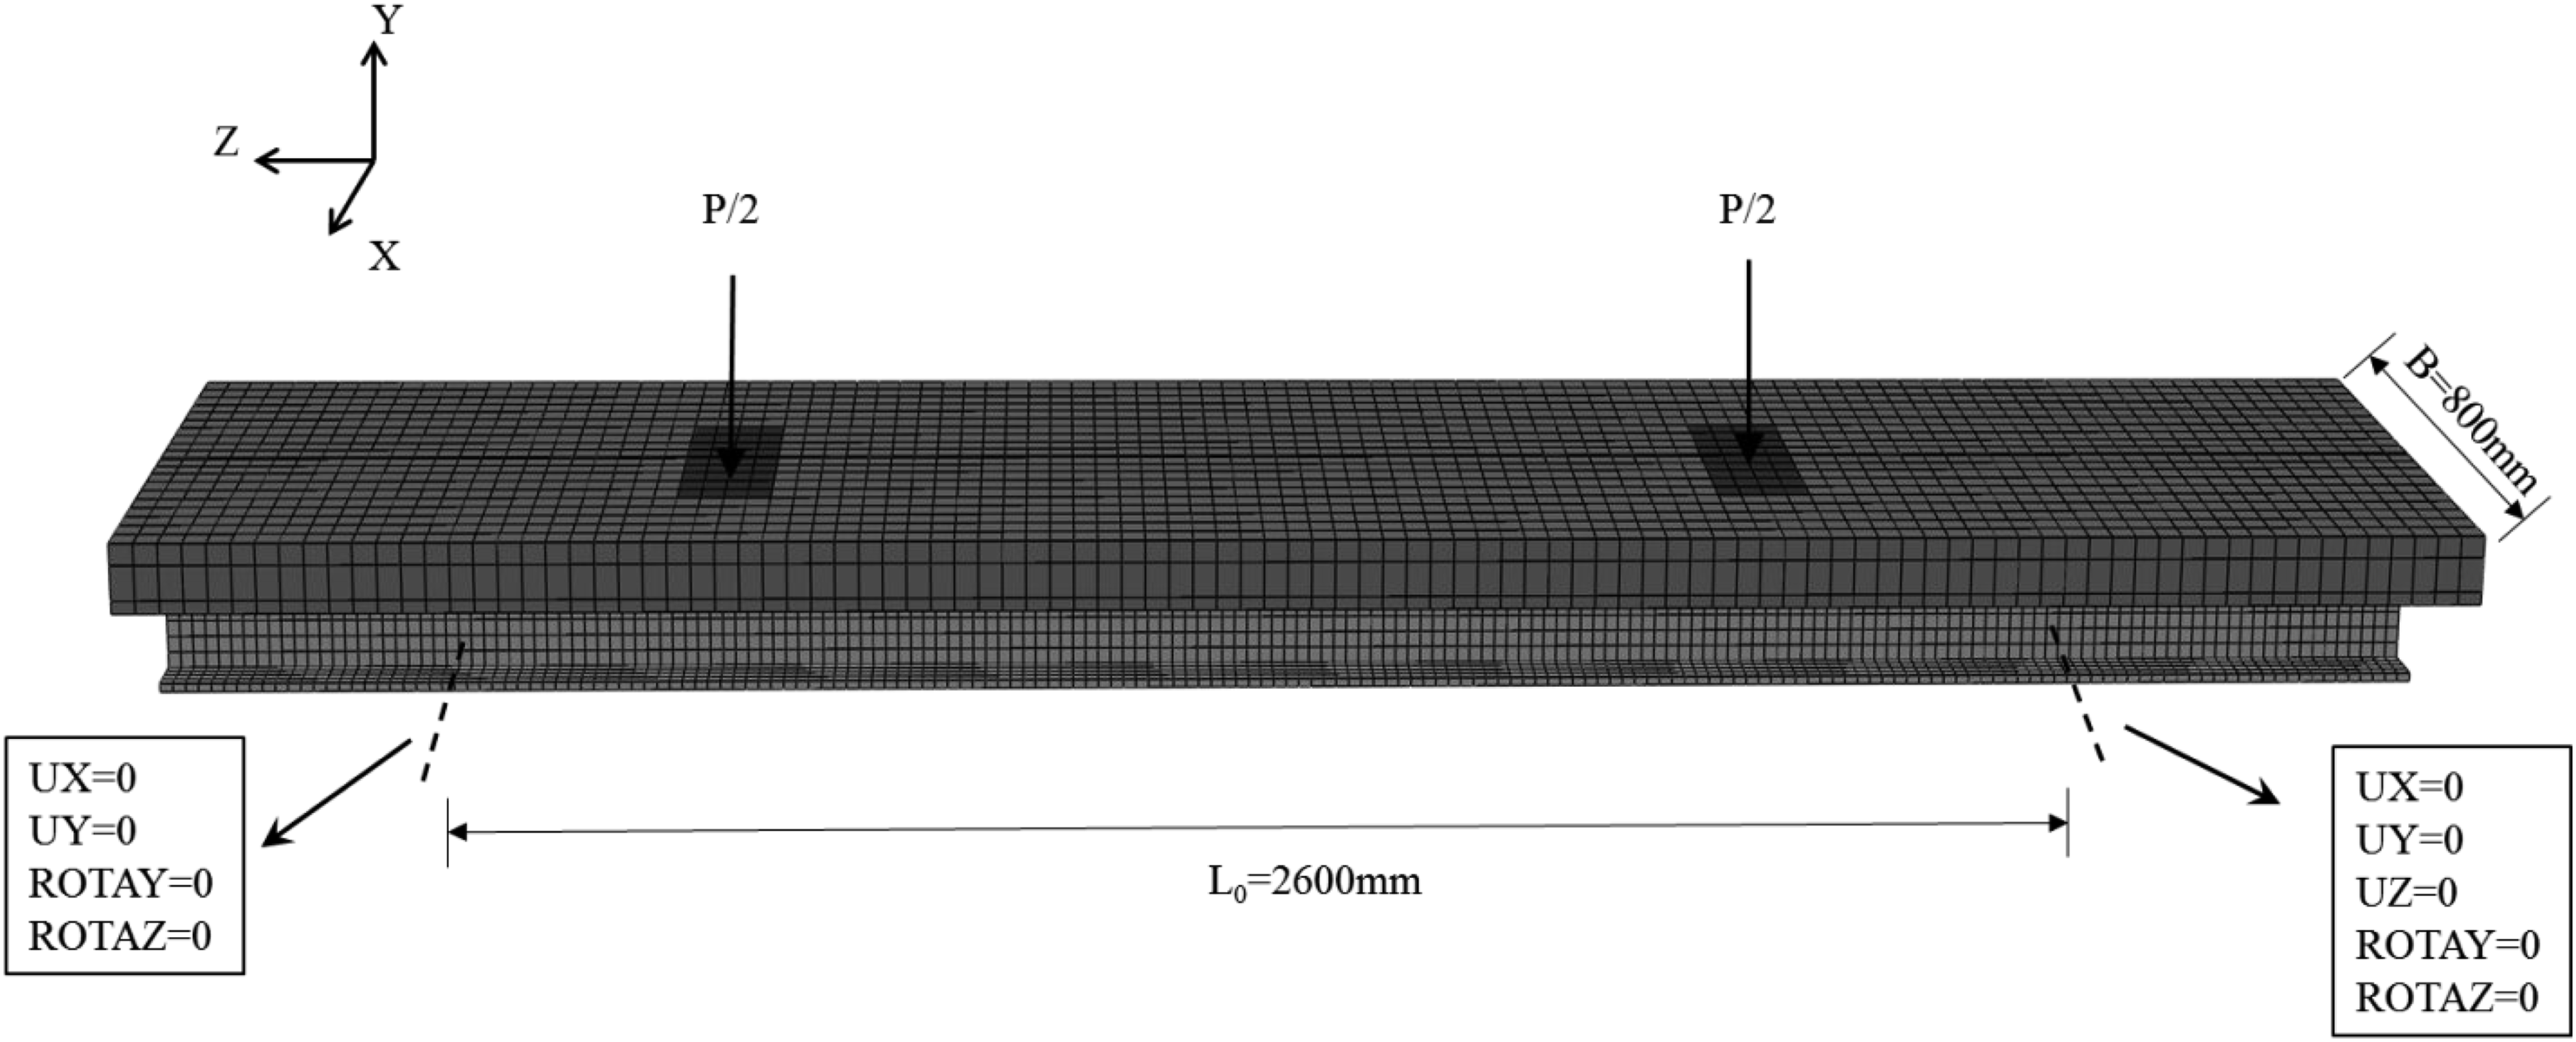
Verification of finite element model
The load-displacement curves are calculated with the FE model and compared with experimental results in Figure 15. The comparison shows that the load-displacement curves of FE model agree well with the experimental curves in shear capacity, while the stiffness of FE model is slightly higher than test stiffness due to the virtual displacement in the test. Comparison of the test and FEM load-mid-span deflection. (a) CB-6-800-Swallow tail; (b) CB-8-800-Modified gear.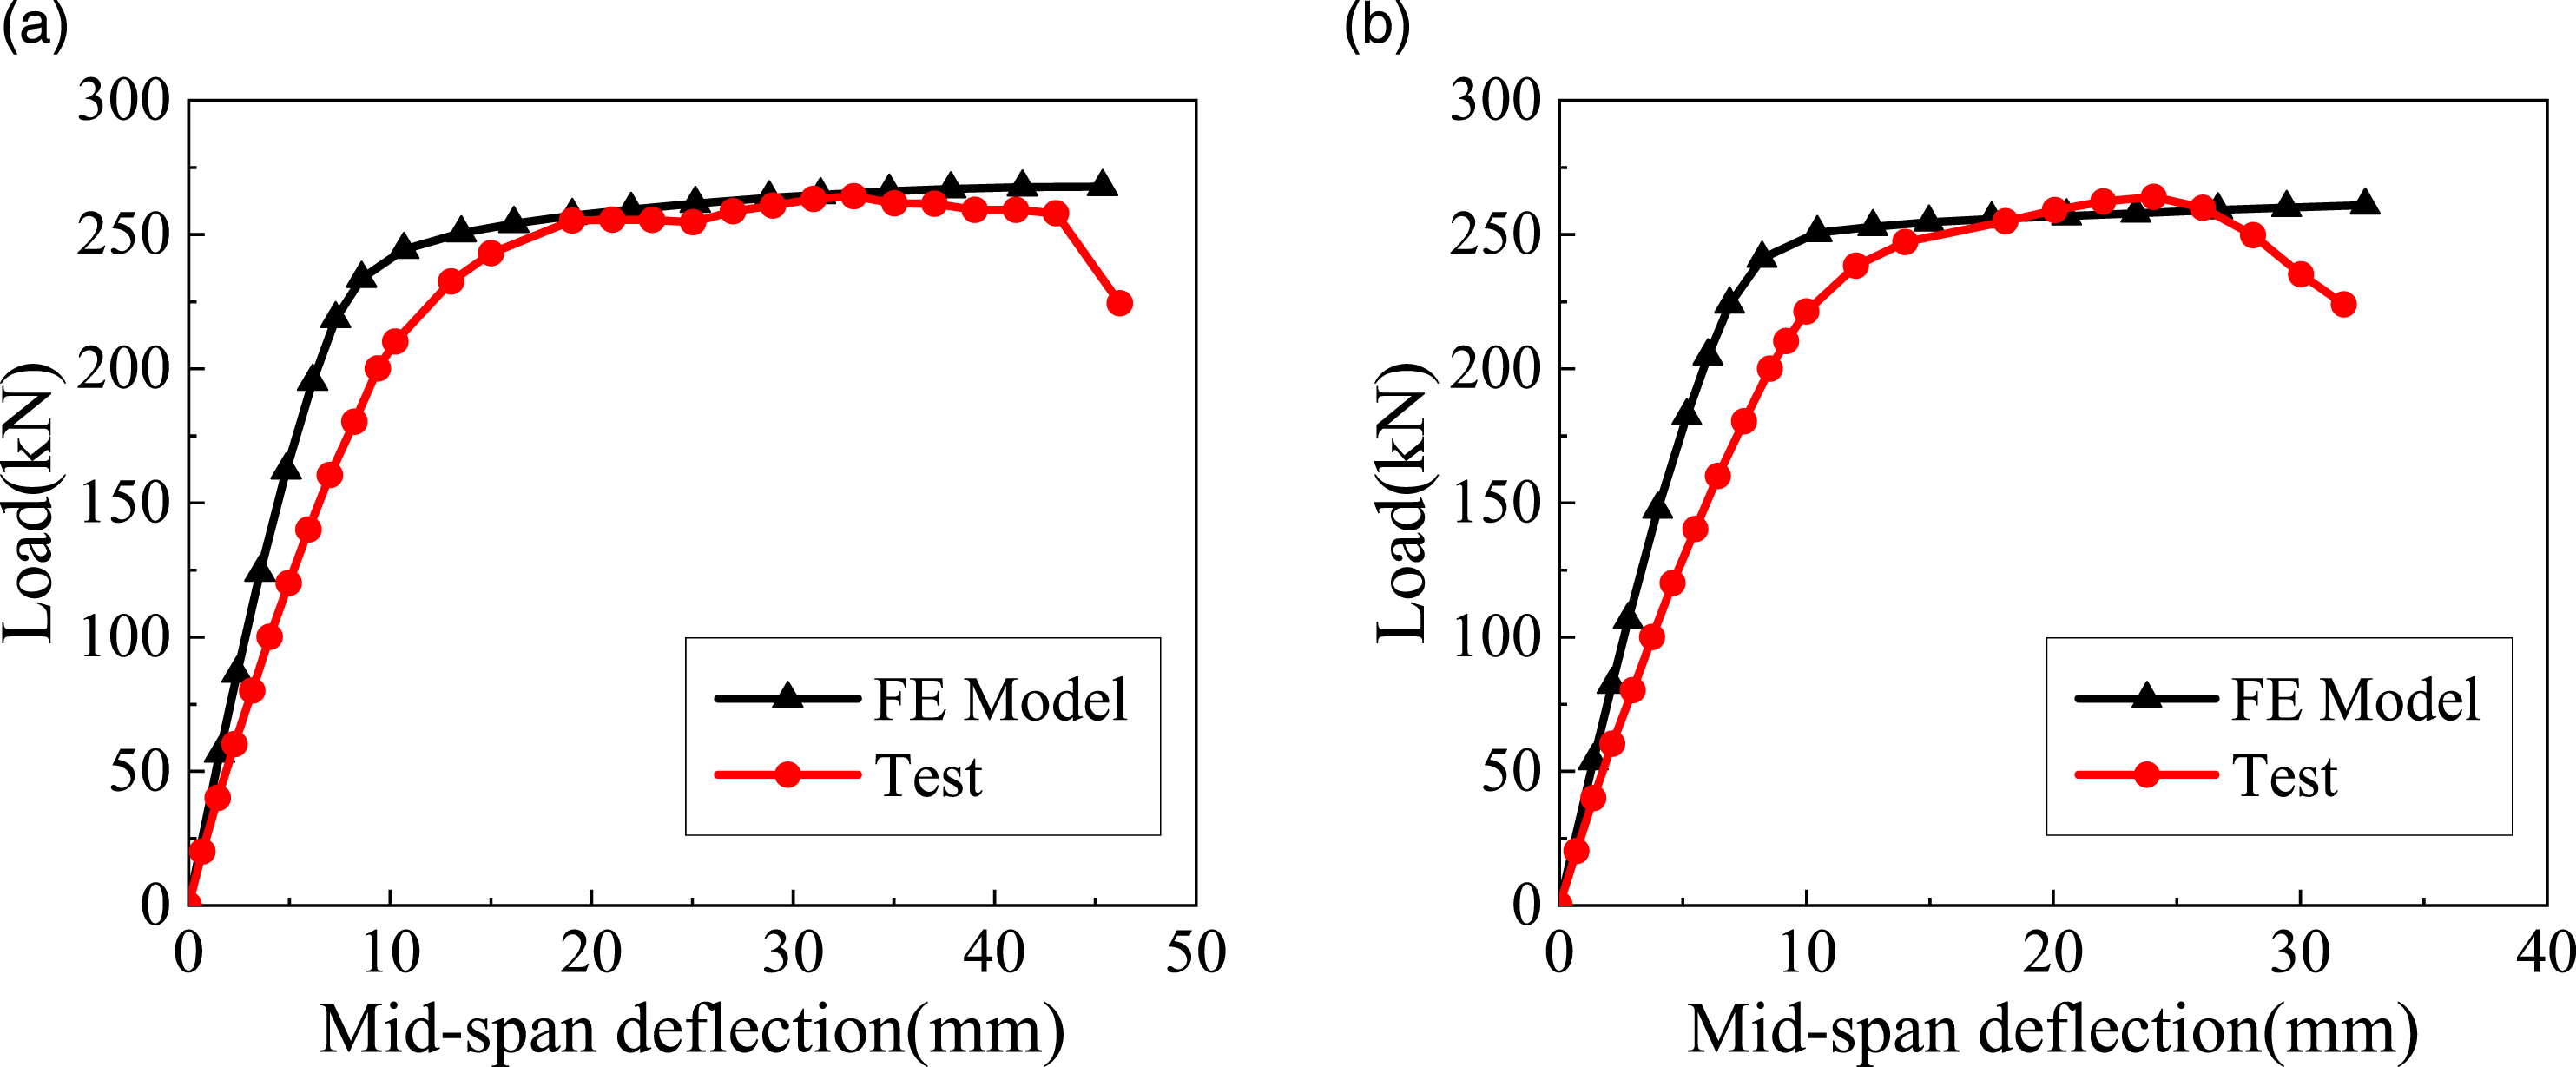
Figure 16 shows the distribution of stress and deflection of some typical specimens under peak load. The steel web in the shear span basically yields and shows obvious shear deformation, which is in good agreement with the experimental results. The principal stress vector is also given in Figure 16(a). The compressive principal stress direction varies from 35° to 39°. The embedded shear connectors yield in the shear span, indicating that the shear connectors reinforce the composite effect between steel beam and concrete slab. Stress and deformation. (a) Steel part of CB-6 (unit: Pa); (b) Concrete slab of CB-6 (unit: Pa); (c) Steel part of CB-8 (unit: Pa); (d) Concrete slab of CB-8 (unit: Pa).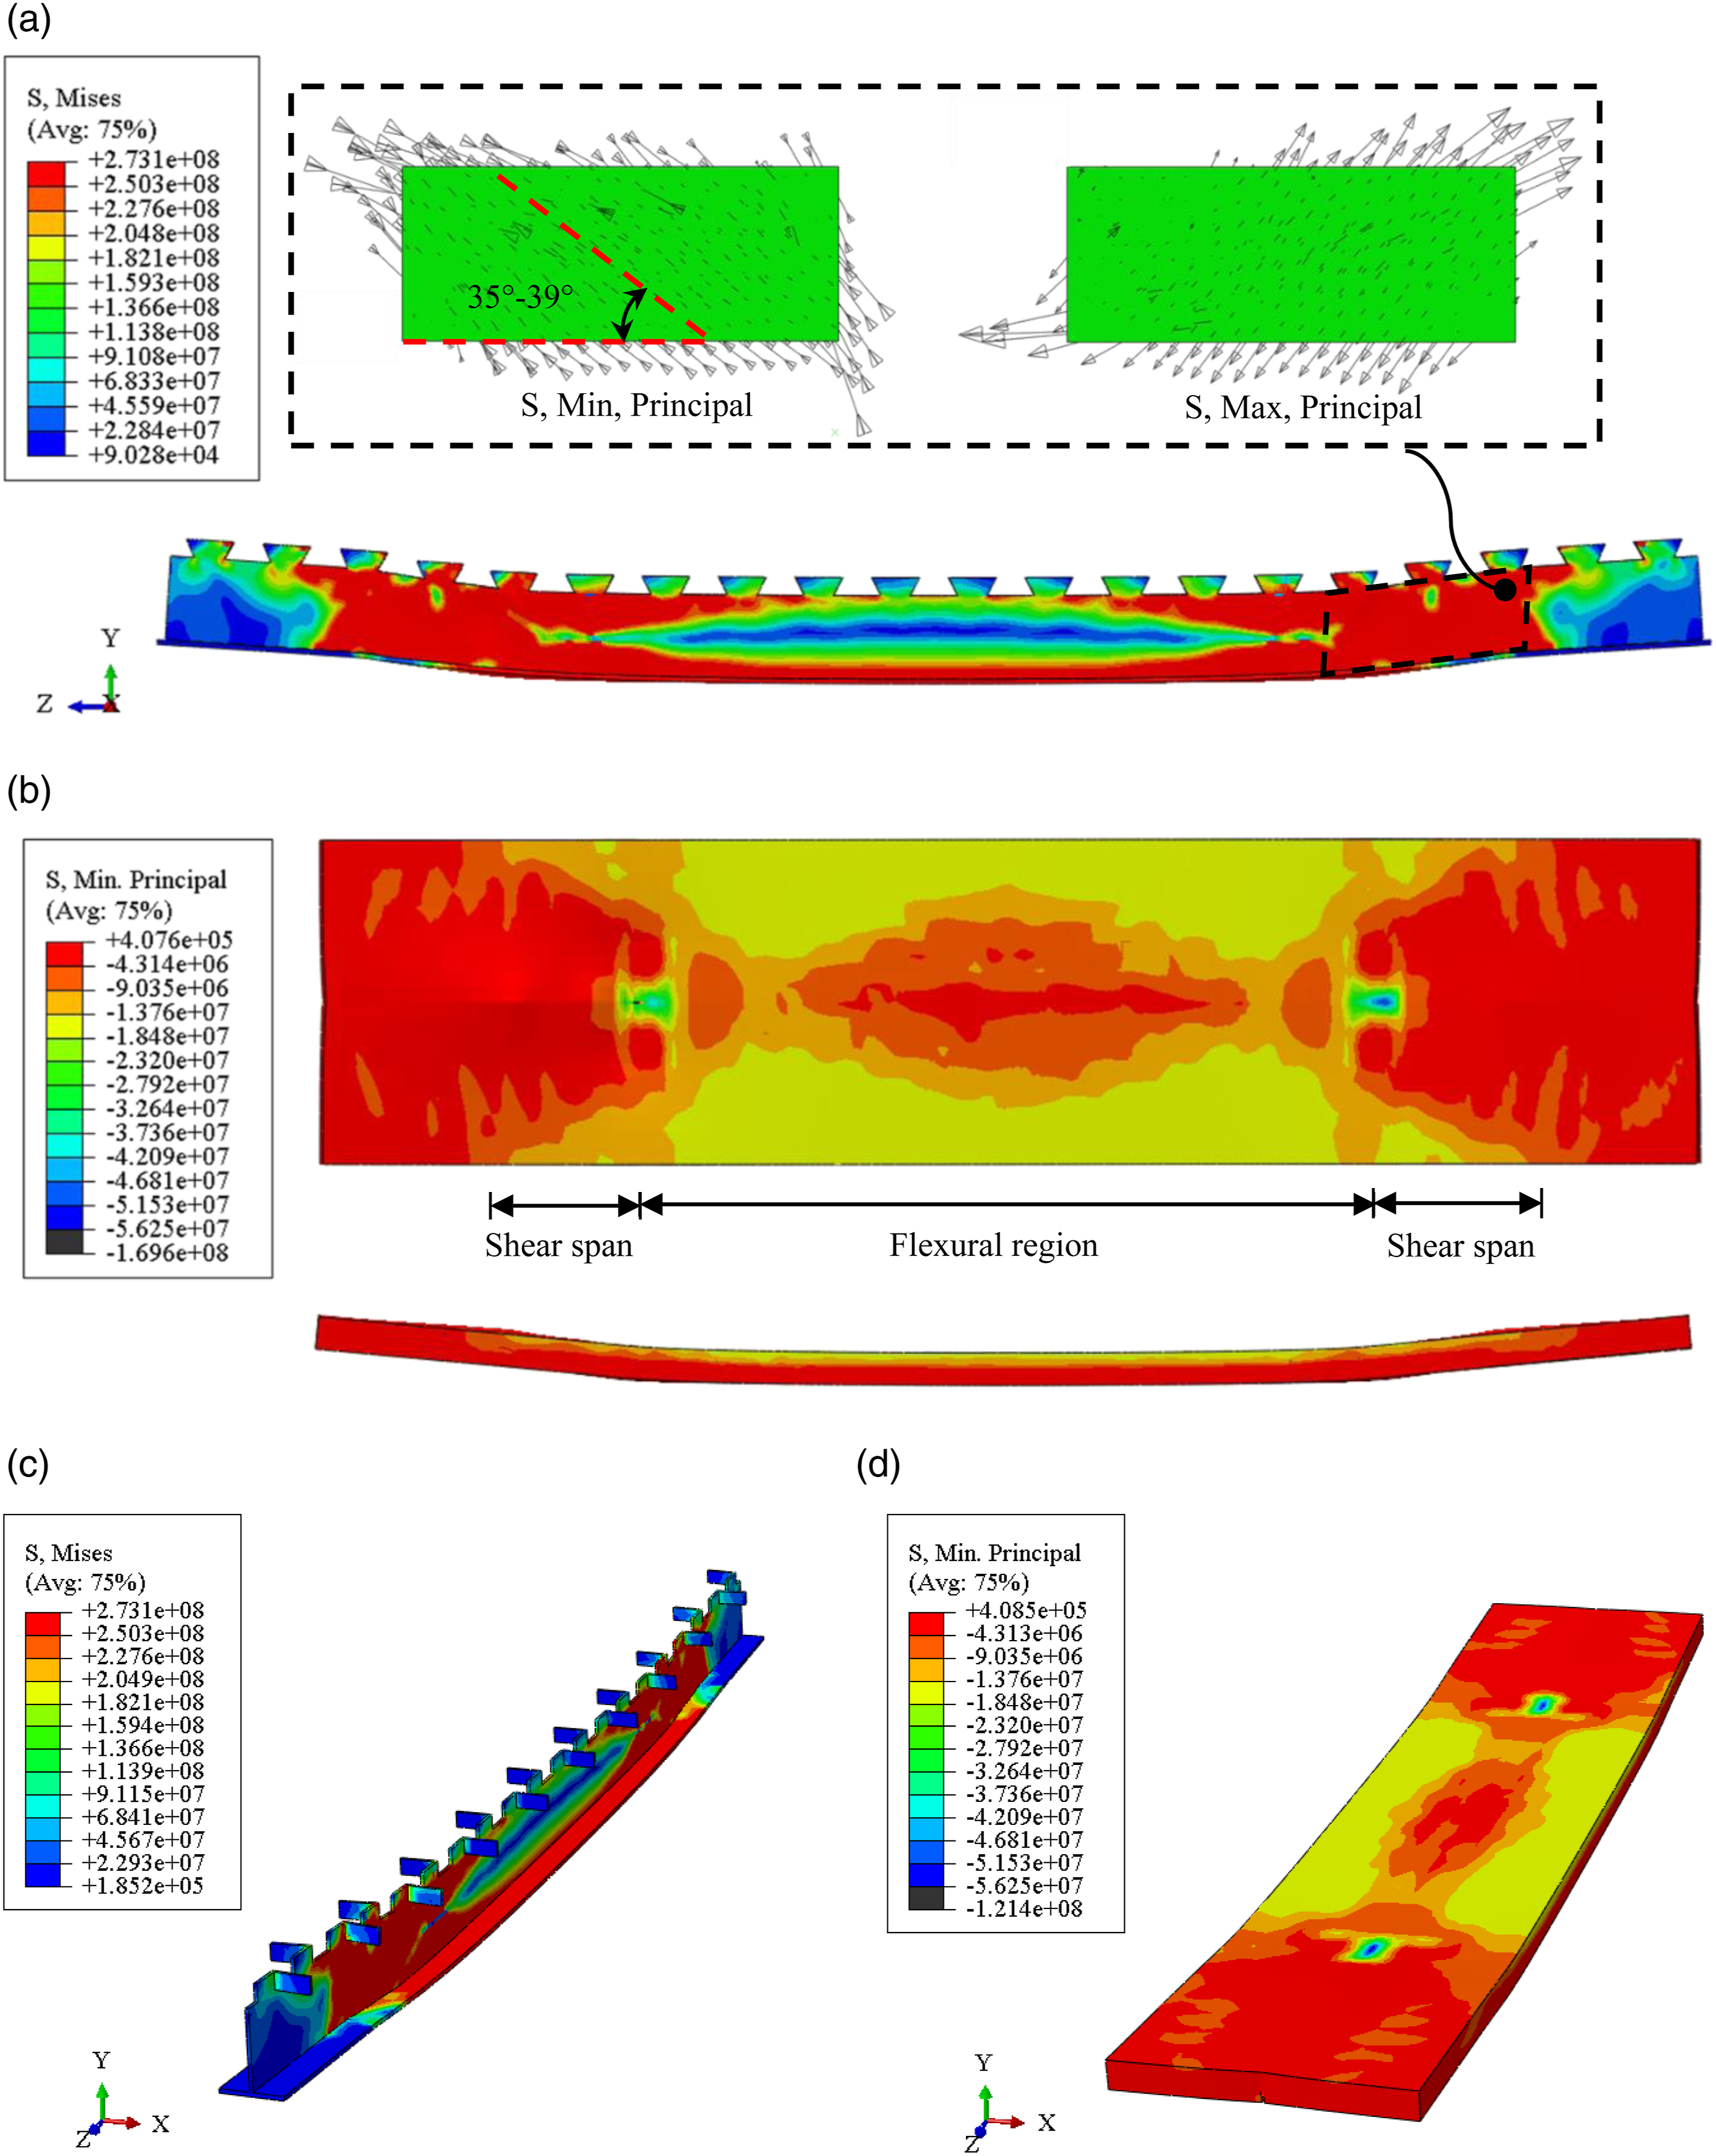
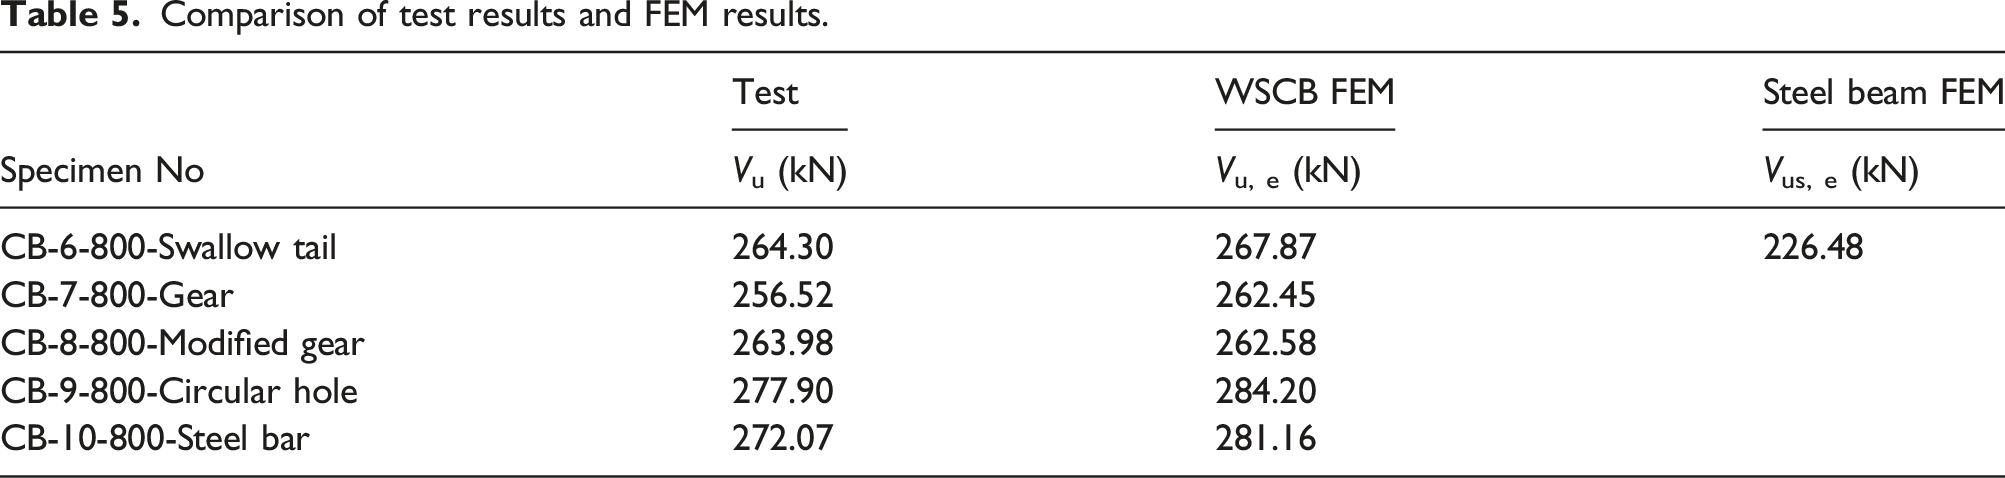
Comparison of test results and FEM results.
Shear capacity
Shear capacity in JGJ 138-2016

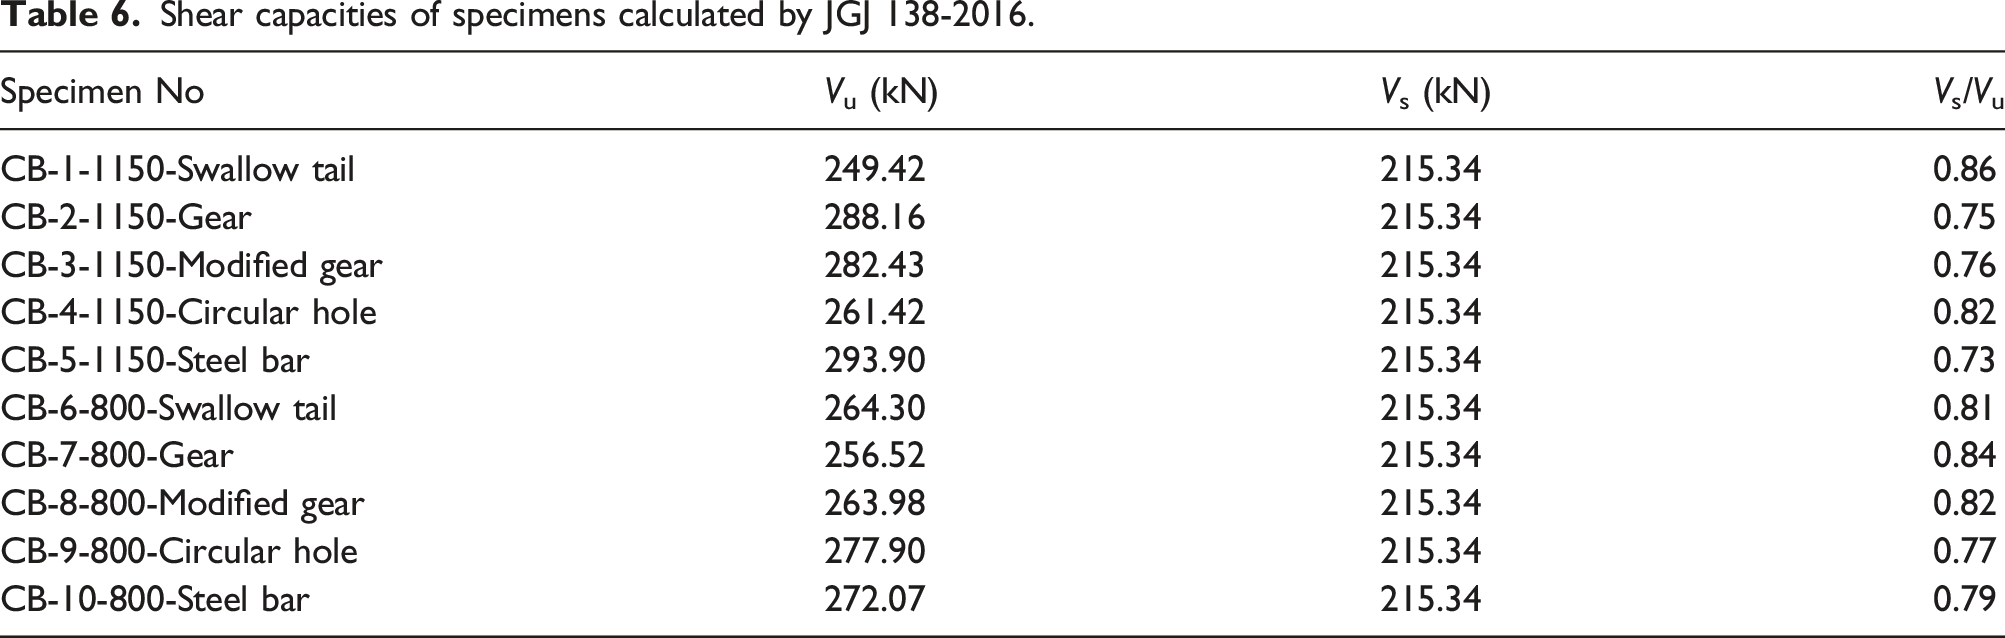
Shear capacities of specimens calculated by JGJ 138-2016.
Shear capacity considering contribution of concrete slab

Shear capacities of specimens considering concrete slab contribution.
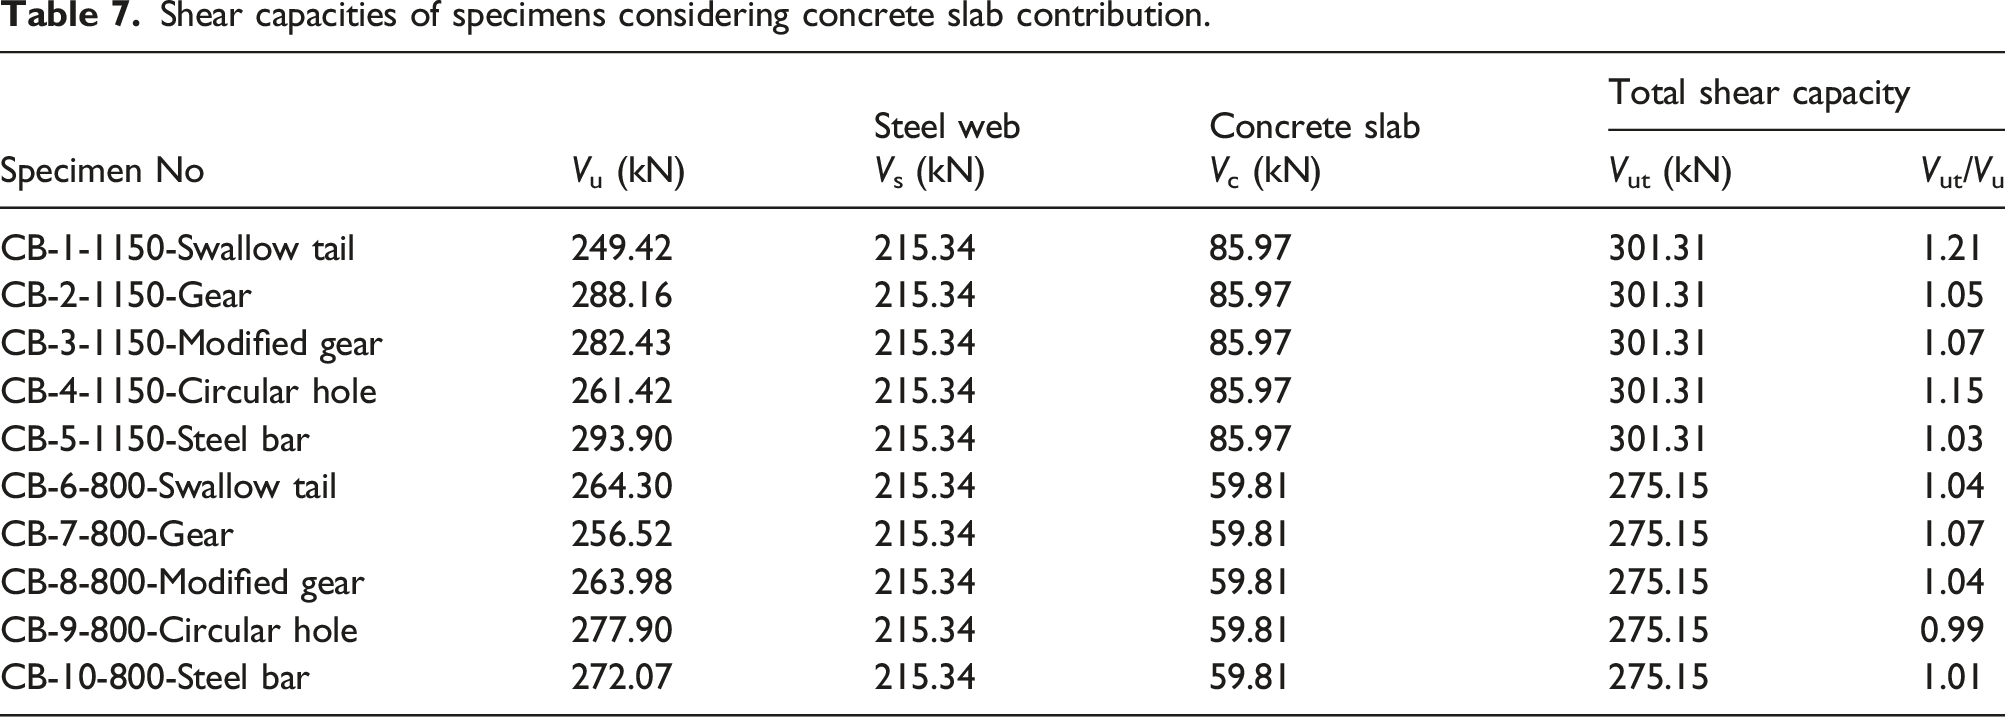
The mean value of “Vut/Vu” is 1.066 and the variance is 0.003964. They represent the theoretical calculation and experimental results agreed well. For CB-1 and CB-4, the experimental shear capacities and calculated values didn’t agree very well. The reason why they did not reach the peak bearing capacity is casting and installation problems.
In summary, with the integral action achieved, the shear capacity of WSCB (Vut) should consider the contributions of steel web and concrete slab as
Conclusions
The shear behavior of ten WSCB specimens was investigated experimentally, considering the parameters of concrete slab width (B) and shear connector pattern. Based on this study, the following conclusions can be drawn: (1) The steel web in shear span yields in all the specimens and the entire composite beam is in a shear failure mode rather than bending failure mode. Two typical shear failure modes were observed: concrete slab crushing failure when configuring the modified gear connector, and diagonal shear failure for the other four connectors. The concrete slab crushing failure mode is more inclined to brittle failure. Hence the modified gear connector is not recommended to be used in the WSCB. Steel web in the shear span yielded from bottom to top and the entire web in the shear span yielded before the peak load. (2) The ductility factor μ value is 3.39–6.19 for all specimens. It means the WSCB specimens with five patterns of web-embedded shear connectors all performed well in ductility. (3) The plastic development coefficient γs of all the specimens exceeds 1.2, demonstrating that the bearing capacity have adequate redundancy after yielding. (4) The specimens with circular holes or steel bars exhibit lower initial stiffness compared with other specimens, but higher shear capacity than other specimens due to smaller reduction on the web top. (5) A FE model is built with ABAQUS software and verified with experimental results. The compressive principal stress direction varies from 35° to 39° and reached the yield strength. It is consistent with the experimental results. The FE model is further used to investigate the load carrying mechanism of WSCB. (6) A calculation method for design shear capacity is presented, considering the contributions of steel web and concrete slab. The prediction of shear capacity for WSCB agrees well with the test values.
Footnotes
Acknowledgements
This research is supported by National Natural Science Foundation of China (Grant No. 52178112, 51878098, 51208241) and Natural Science Foundation Project of CQ CSTC (cstc2019jcyj-msxmX0580).
Declaration of conflicting interests
The author(s) declared no potential conflicts of interest with respect to the research, authorship, and/or publication of this article.
Funding
The author(s) disclosed receipt of the following financial support for the research, authorship, and/or publication of this article: This work was supported by National Natural Science Foundation of China (No. 52178112, 51878098, 51208241) and Natural Science Foundation Project of CQ CSTC (cstc2019jcyj-msxmX0580).