Artificial neural networks approach for prediction of axial loading capacity of circular normal strength concrete columns confined by both transverse steel reinforcement and carbon fiber reinforced polymer wraps
Available accessResearch articleFirst published online 2022
Artificial neural networks approach for prediction of axial loading capacity of circular normal strength concrete columns confined by both transverse steel reinforcement and carbon fiber reinforced polymer wraps
A few empirical models for the axial loading capacity (ALC) of circular normal strength concrete (NSC) columns wrapped by carbon fiber reinforced polymer (CFRP) sheets and interior transverse steel reinforcement (TSR) (CSC columns) are available in the literature. The deficiency of those models is that they were proposed based on a small number of tests by considering limited parameters of CSC columns. Therefore, the main aim of the current investigation is to propose the improved empirical models for the ALC of CSC columns by including the interaction mechanism between TSR and FRP confining behavior. To secure this aim, a general regression analysis technique and artificial neural networks (NNs) on the experimental outcomes of 76 CSC columns collected from the previous investigations were employed. The proposed NN model was adjusted for the different number of hidden layers and neurons to achieve an optimized model. The suggested NN and empirical models portrayed a close agreement with the testing database with R2 = 0.998 and R2 = 0.892, respectively. The NN model reported a higher accuracy than the theoretical model. The comparative investigation solidly authenticated the superiority and accuracy of the anticipated strength models for CSC columns.
The literature review represents that the accuracy for predicting the ALC of CFRP-wrapped columns internally confined with TSR (CSC) members is less because those models were proposed employing simple spreadsheets, a small quantity of testing data, simple curve fittings, and neglecting the interaction of both CFRPs and TSR confinements. Moreover, the differences in the predictions of these equations from the experimental outcomes may also be ascribed to the main reason that they neglected various parameters of CSC columns for predicting the ALC. The interaction mechanism between the TSR and the concrete and similarly, the interaction of CFRP wraps with the concrete were not explicitly encountered. However, artificial neural network (NNs) modeling is the modern technology that can accurately capture the complex nature of composites and their interactions with the structural elements. This tool has attracted researchers because of its effective performance in capturing the structural behavior of various concrete components subjected to different loading conditions (Ashrafi et al., 2010). The NNs are nonlinear that can capture the interaction mechanism and complex behavior of various parameters without getting knowledge of their nature and interaction. The empirical equations developed on the databases do not consider the complex behavior, their nature, and interrelationships of various parameters of CSC members. Furthermore, the deviations in the predictions of the empirical equations proposed for the ALC of CSC columns are high due to the noisy data points used for anticipation of the models. Therefore, NN can be considered an effective technique for capturing the behavior of composite structural elements in which different parameters of the components are automatically managed whereas performing the training procedure (Kurtoğlu et al., 2022, Sonebi et al., 2016; Bakbak and Kurtoğlu 2019; Graciano et al., 2021). A large number of studies are available in the literature that predicts the ALC of different composite structural elements using different machine learning modeling techniques such as NNs, genetic programming, regression, and curve fitting (Cevik and Cabalar, 2008; Cevik and Guzelbey, 2008; Cevik et al., 2010; Naderpour et al., 2010, 2019a, 2019b; Elsanadedy et al., 2012; Pham and Hadi, 2014; Cascardi et al., 2017; Hadhood et al., 2019) but they depicted less accuracy compared with the currently suggested models.
Scope and significance
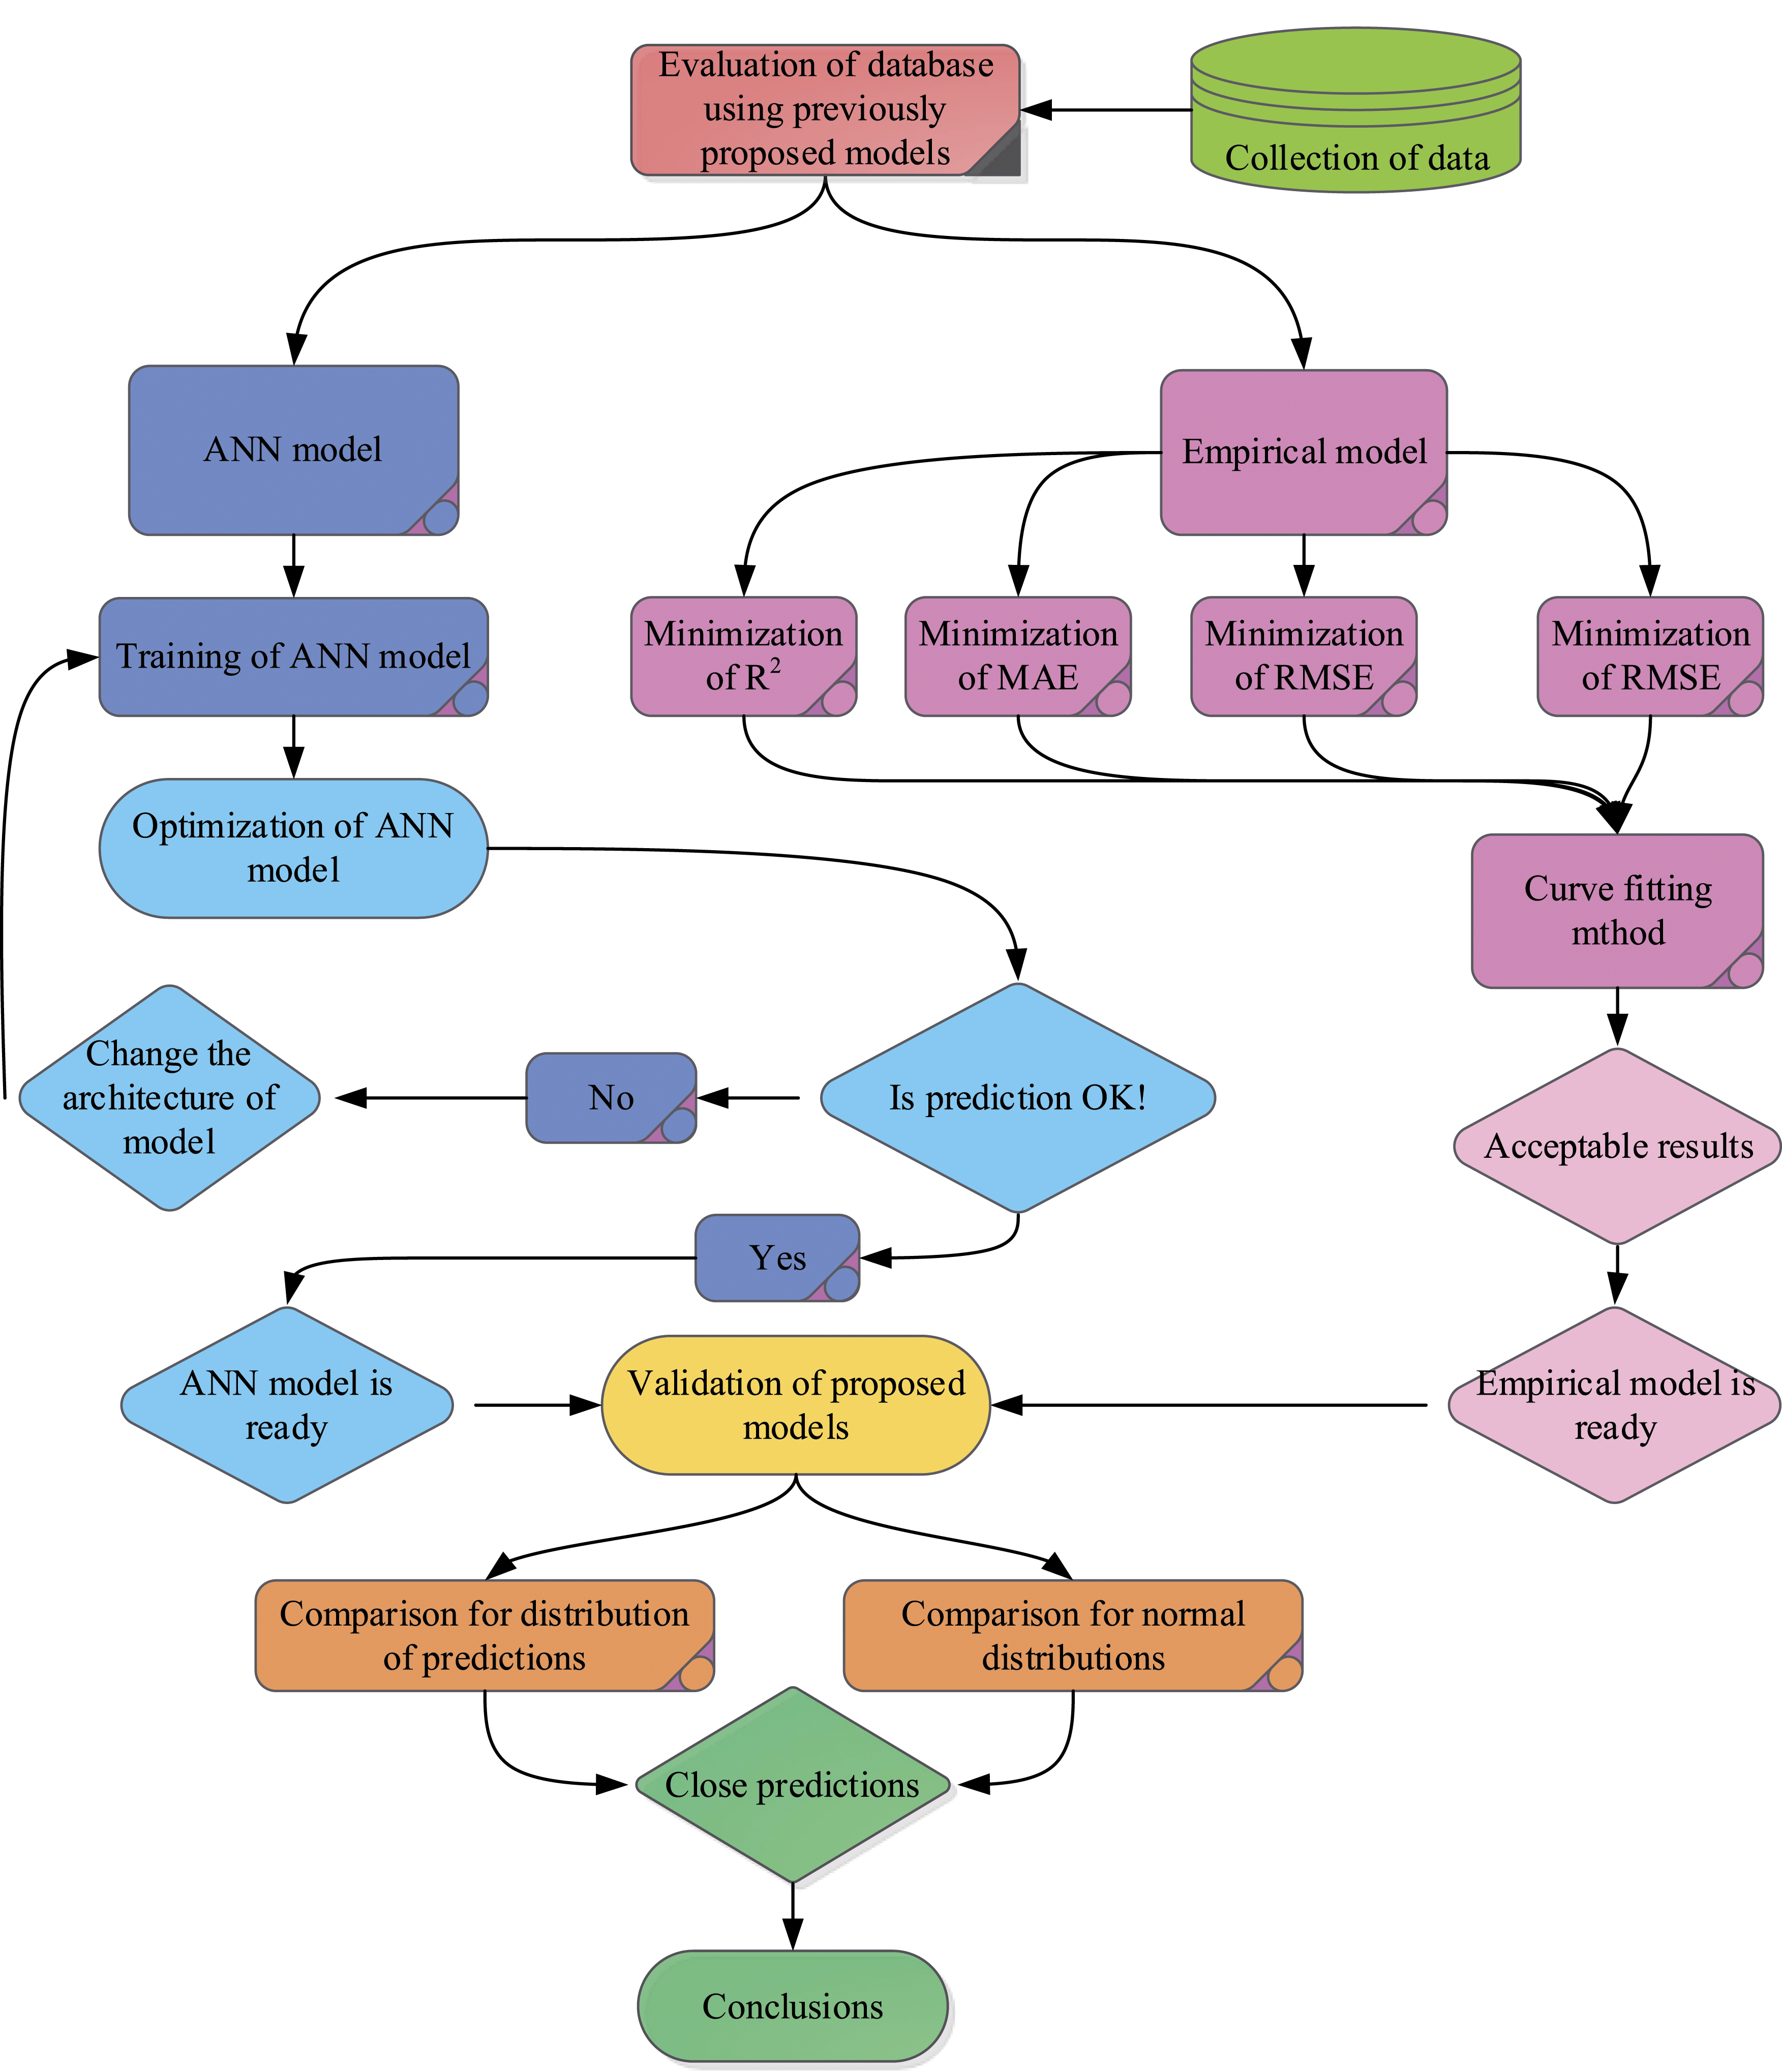
The main aim of the current investigation is to propose an empirical/theoretical model and NN model for calculating the ALC of circular normal strength concrete (NSC) compression members wrapped by CFRPs and internal TSR by involving the interaction between the CFRP wraps and TSR confining mechanism. For achieving this aim, regression analysis and neural network modeling on the database of 76 CSC members taken from the previous investigations were employed. In order to secure a general form of the currently suggested empirical model, the assessment of the previous models for the CSC columns proposed in the literature studies was carried out employing the developed dataset. The NN model for the ALC of CSC columns has been proposed using the multilayer feed-forward NNs (MLFNNs) process. The performances of the proposed strength models were assessed employing the dataset points and related to the predictions of the previously suggested ALC equations. The present work is helpful for the structural engineers in analyzing and designing the circular NSC columns wrapped by CFRP sheets and internal TSR. The procedure of the current study has been described in Figure 1.
The procedure of the present investigation.
Confinement mechanics
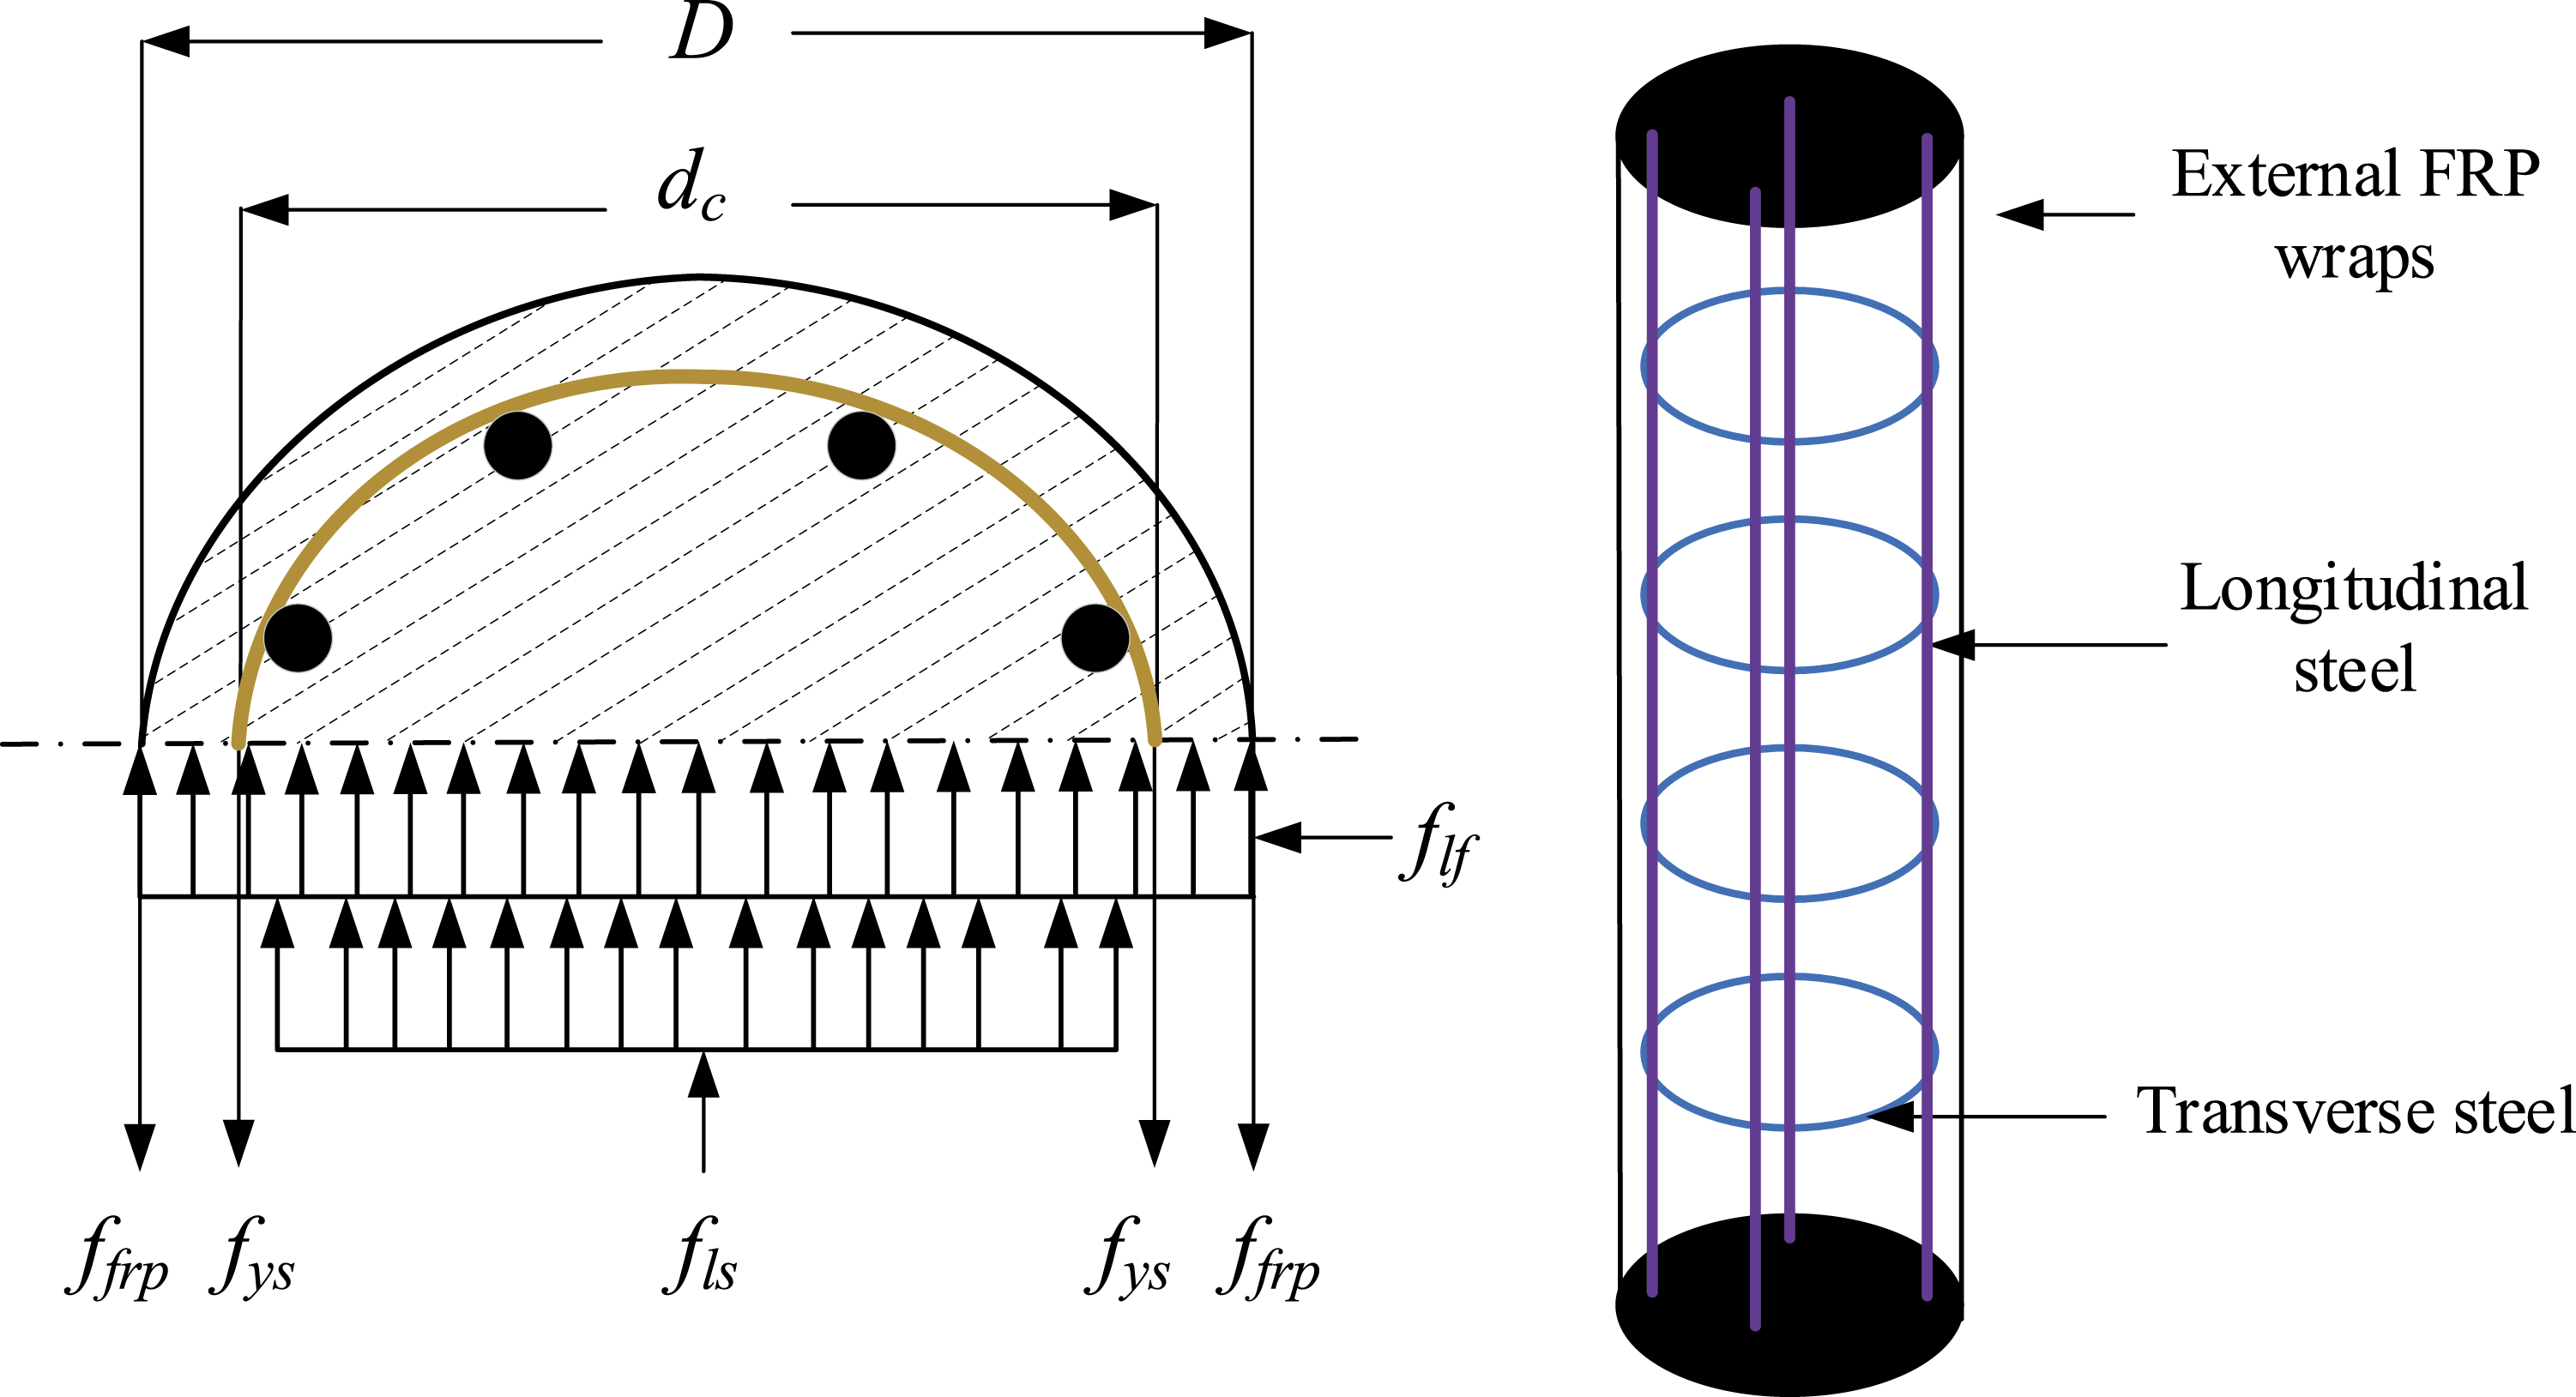
The expansion of concrete in the transverse direction takes place when the axial compression loading is applied to the CSC columns producing the stresses in the transverse reinforcements and confinements provided by the TSR and CFRP wraps which try to resist the lateral expansion of core concrete. The geometry of the specimens, amount of TSR, the number of FRP wraps, and the mechanical properties of FRP wraps are the parameters upon which the ultimate confining stress of the compression members is confined with TSR and CFRPs depends. The confining stress is reached the maximum value when the circumferential strain of the FRP composites approaches its maximum strain related to damage to the specimens. The confining mechanism of TSR and CFRPs for CSC columns is presented in Figure 2. The CFRP wraps and the transverse stress due to the TSR can be summed up to obtain the total confining stress of CSC columns (Teng et al., 2015). This expression is given as follows:
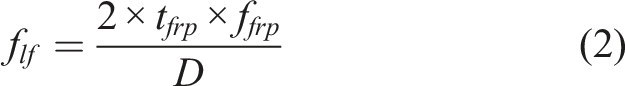
Where describes the transverse confining stress produced due to CFRP wraps applied to the core, it is provided by:
Where shows the thickness of the one FRP layer, shows the tensile strength of FRP wraps, shows the diameter of the core, shows the transverse confining stress delivered by TSR applied to the core, it is provided by:
And, shows a cross-sectional area, shows the yielding stress of steel material, shows the vertical center-to-center distance and is the diameter of TSR from the center of hoops/spirals. When the cross-section of the specimens is circular, the transverse confining stress produced due to the TSR can be provided as follows:
Where, shows the constant for efficiency for the confinement of TSR. Following Mander et al. (Mander et al., 1988), the constant of efficiency for TSR is given as follows:
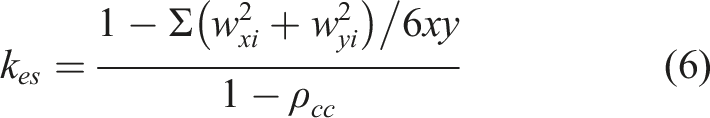
Where is the constant of horizontal efficiency as provided by:
Where, and are the clear distances between adjacent longitudinal bars in the horizontal and vertical directions of the cross-section of the column, respectively. With, =1 for the circular NSC columns and is the constant of vertical efficiency given by equation (7) for both steel hoops and steel spirals.
Confining mechanism of FRPs and TSR on a circular member.
Existing strength models
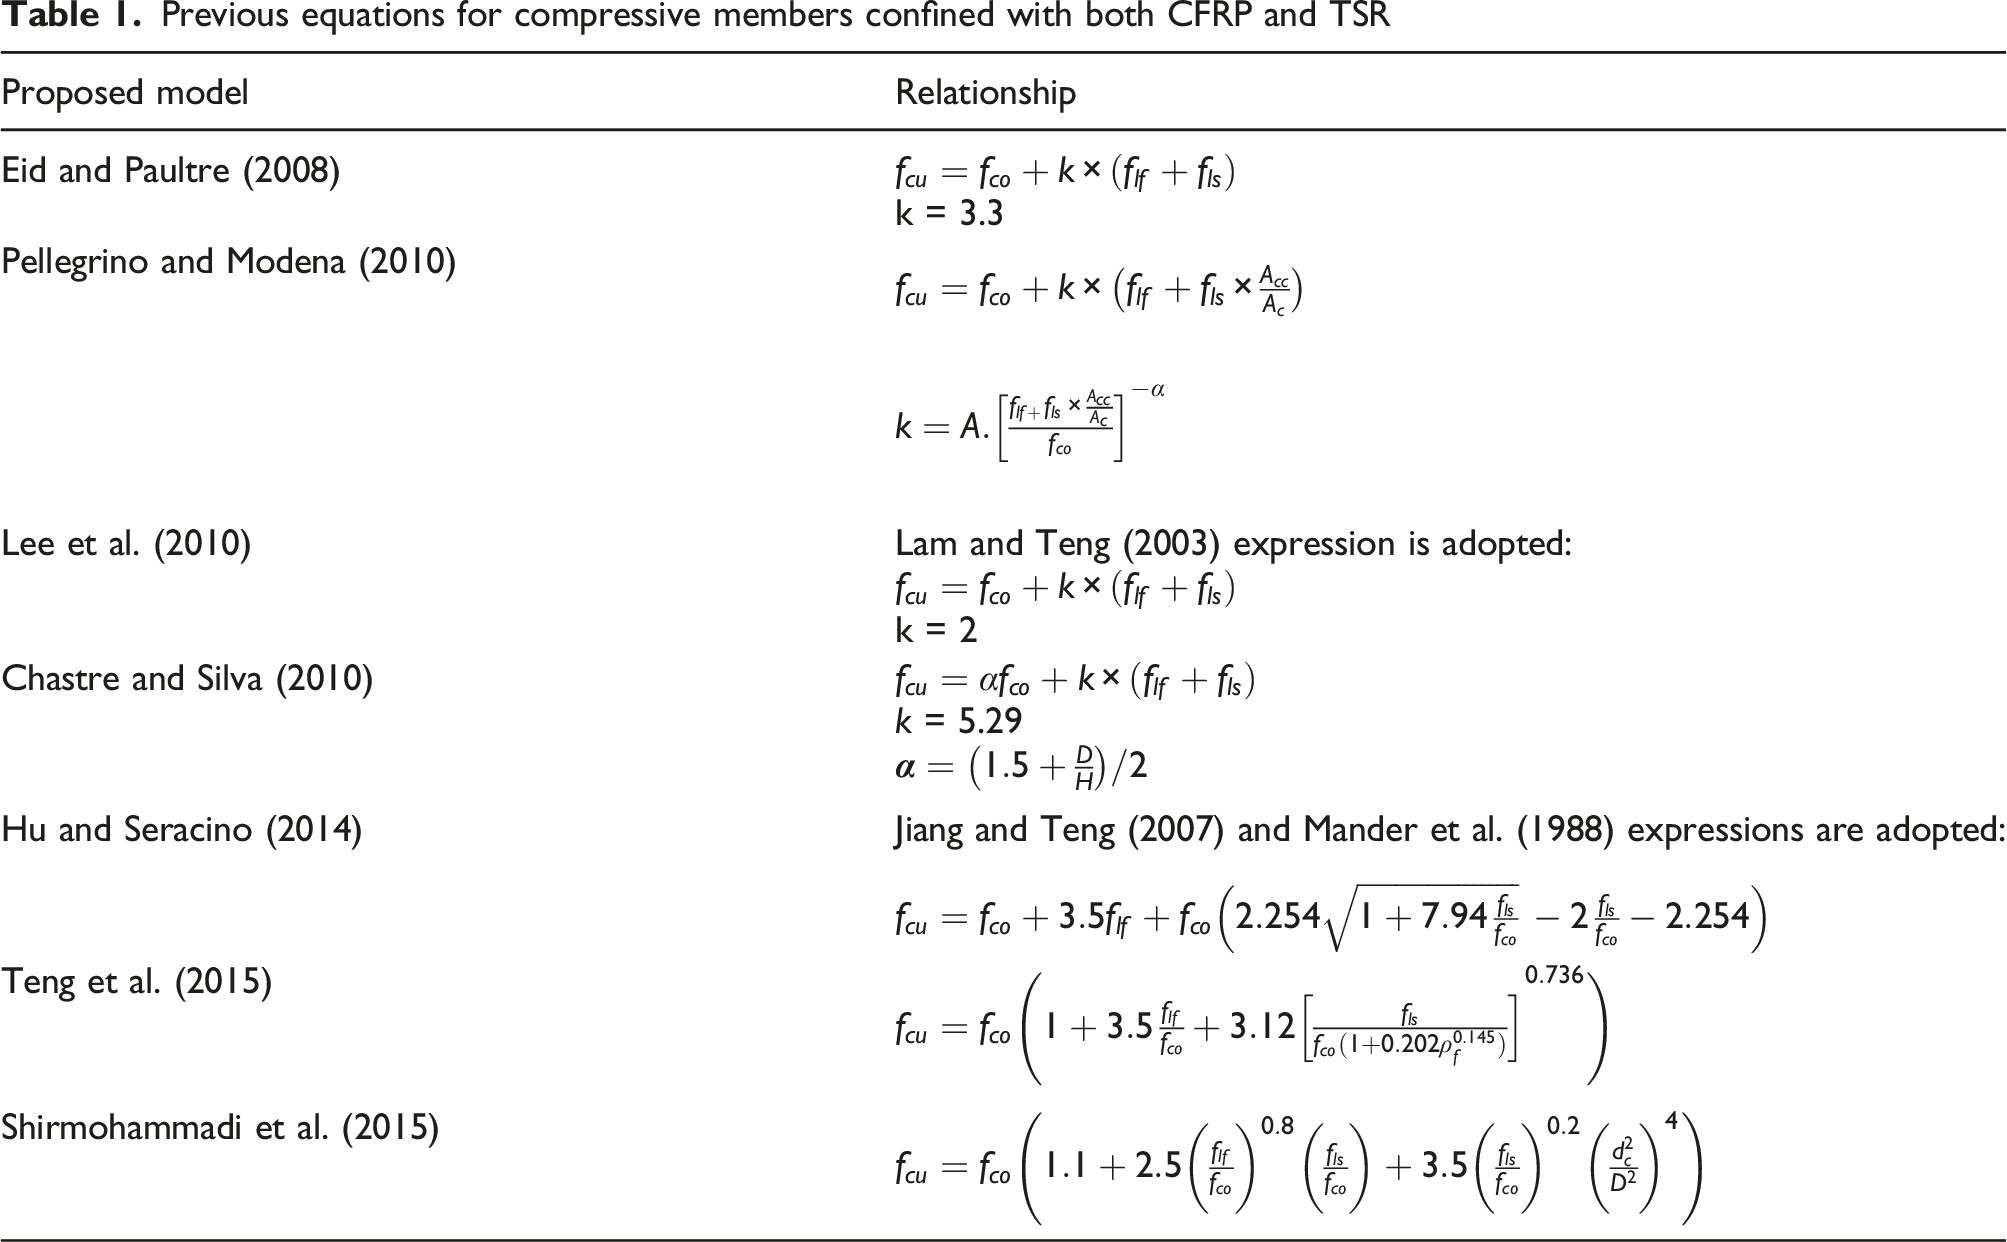
In the previous studies, most of the models for the ALC of the CSC columns were proposed using the general form of the equation suggested by Richard and Abbott (Richard and Abbott, 1975), which has the following simple form:
Where and describe the compression strengths of the wrapped and the unwrapped concrete, correspondingly, k shows the confining efficiency constant and shows the transverse confinement stress delivered by the CFRP composite. Whereas considering the joint involvement of TSR and CFRP composites for the transverse confinement action of CSC members, a few researchers worked in this area (Chastre and Silva, 2010; Eid and Paultre, 2008; Hu and Seracino, 2014; Lee et al., 2010; Lin and Teng, 2019; Pellegrino and Modena, 2010; Teng et al., 2015) by taking the general form given by Mander et al. (1988). These researchers replaced the stress produced by CFRP wraps with the joint stress produced by both CFRPs and TSR as given by equation (1). These models have been presented in Table 1. The selection of such models was done based on their greater accuracy, application in the previous studies, and the easiness of their use.where indicates the compression stress of unwrapped concrete; indicates the confining stress produced by CFRP wraps; indicates the confining stress produced by TSR; shows the area of the core surrounded by the TSR; shows the cross-section of compressive members; and indicate the constants; and show the modulus of elasticity and the thickness of the CFRP sheets, correspondingly; and show the modulus of elasticity and the cross-sectional area of TSR, correspondingly; shows the diameter of the core enclosed by the TSR; shows the vertical distance between the TSR hoops/spirals; indicates the confinement efficiency constant to counter the confining nonuniformity over the length of the sample, and and are the diameters and the length of the CSC compressive member, correspondingly.
Previous equations for compressive members confined with both CFRP and TSR
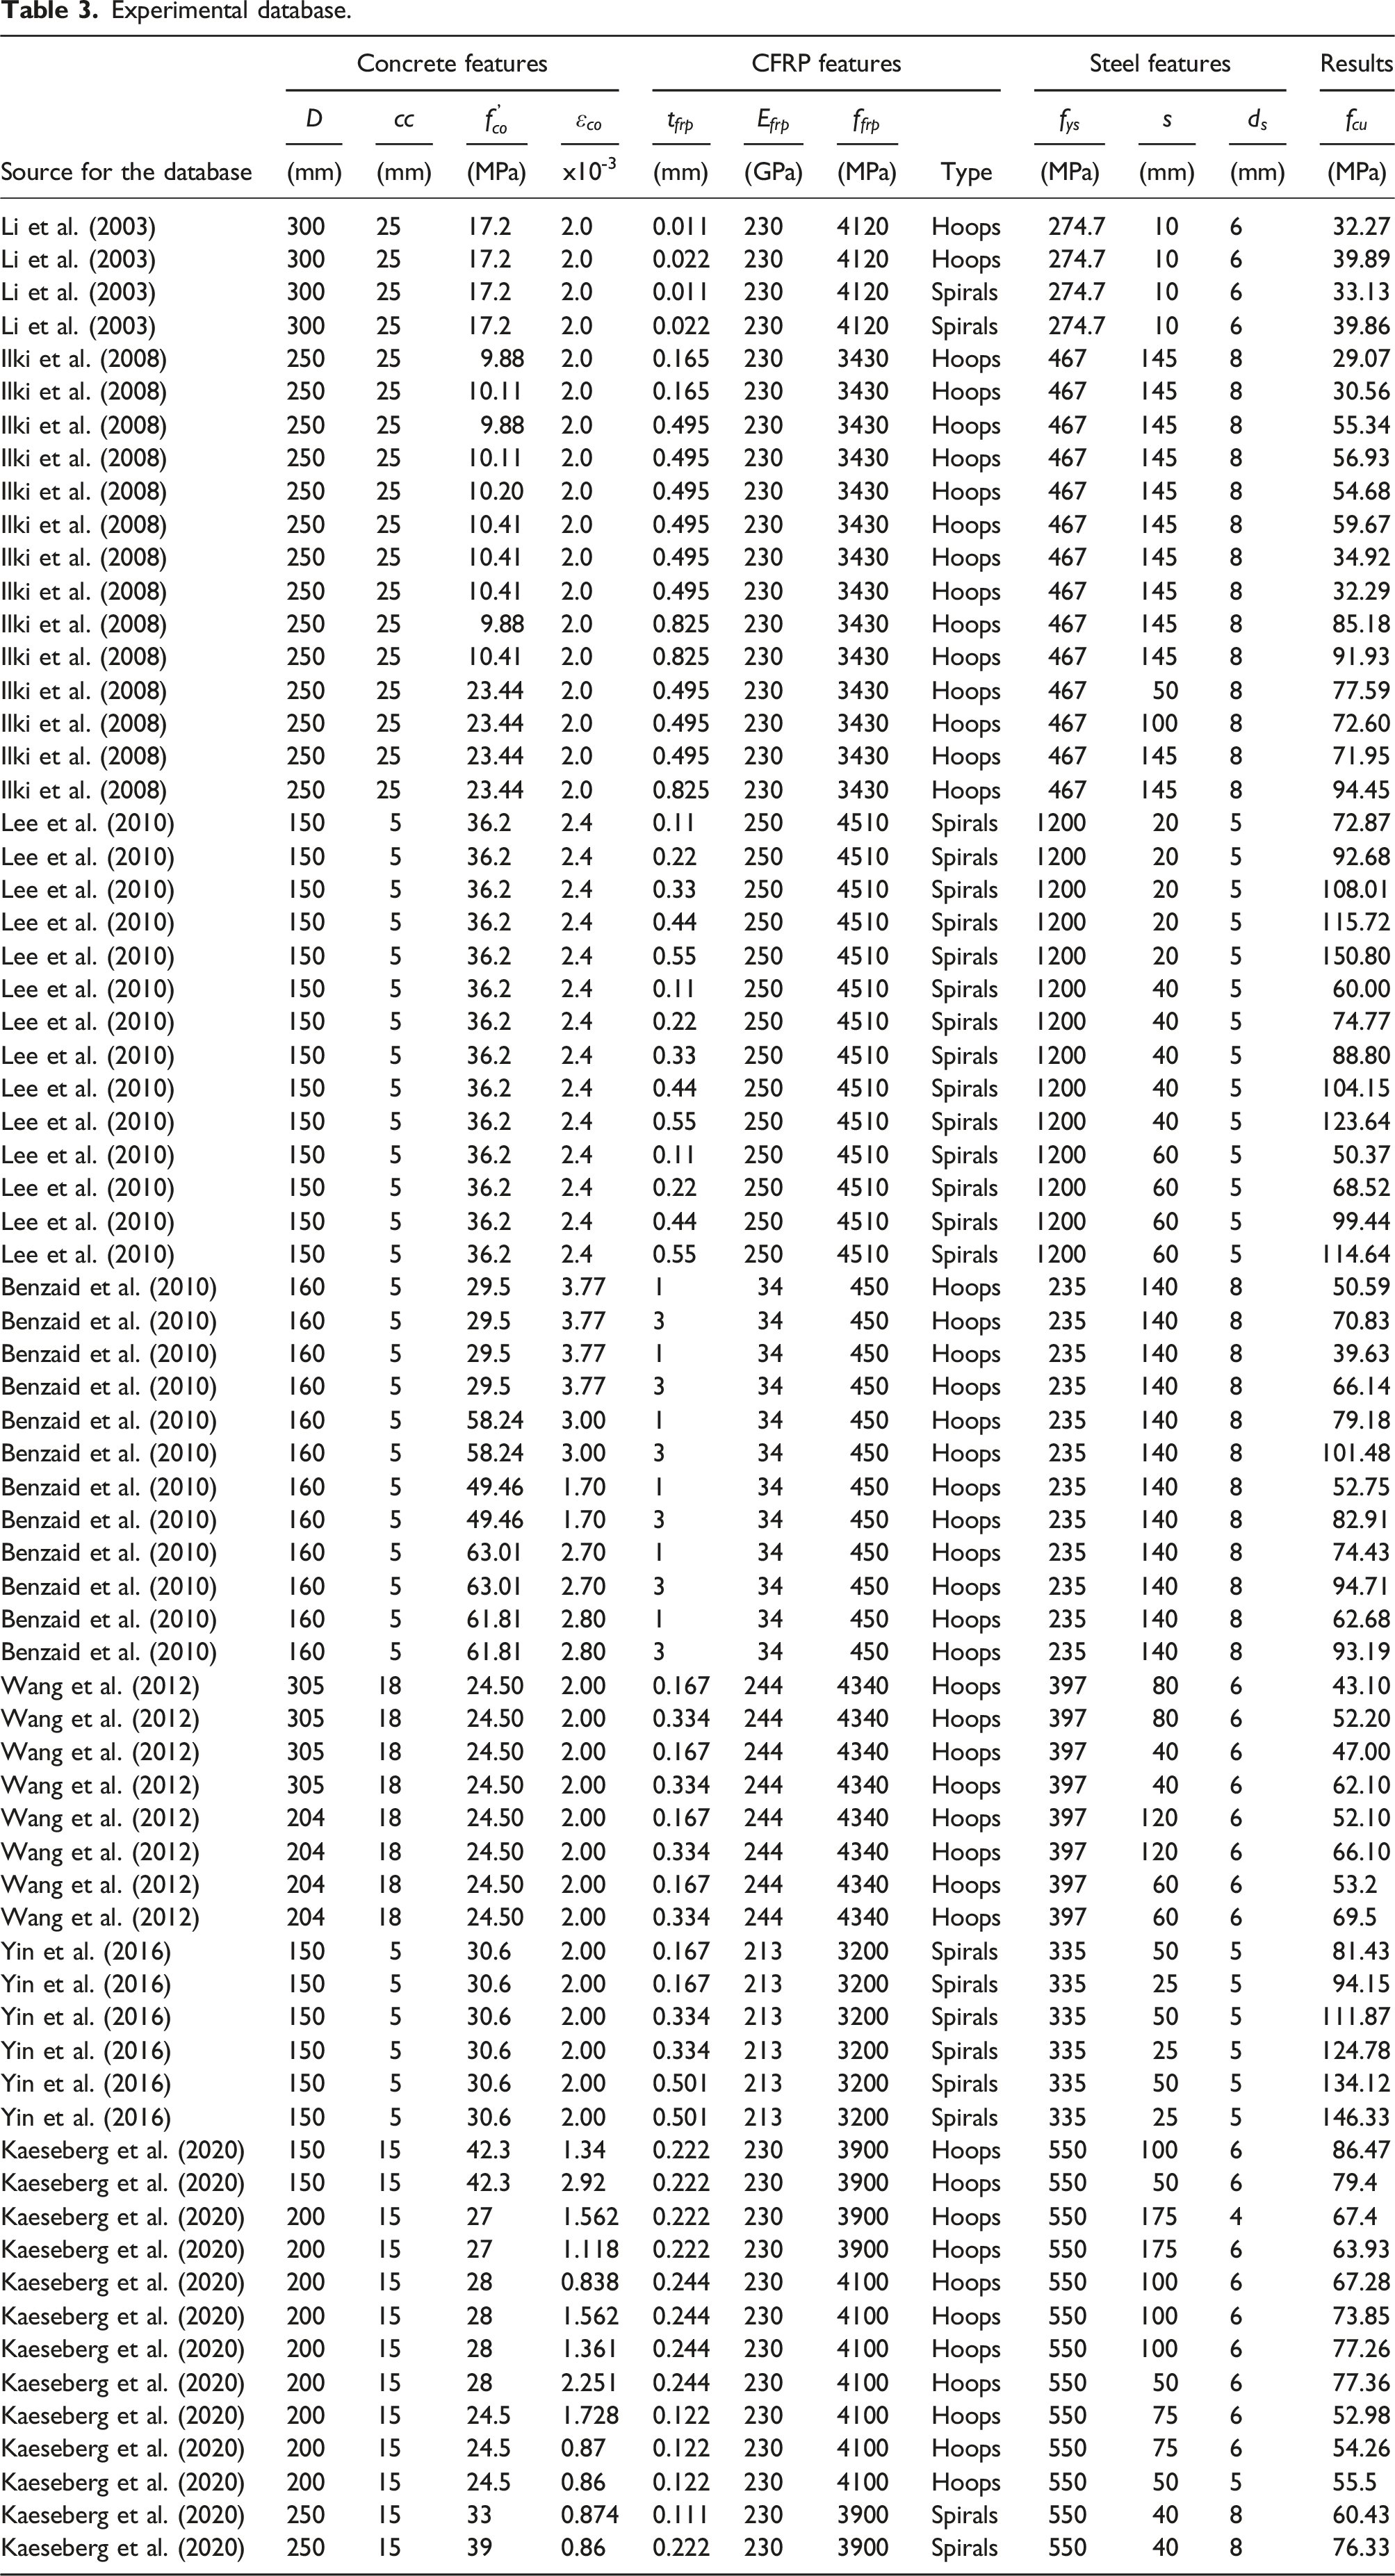
Whereas constructing the database for the ALC of CSC columns, a few studies could be found in the literature that assessed the behavior of compressive members confined with TSR and CFRPs. Therefore, a database of only 76 samples was developed that was used for proposing the new empirical model and NN models. The present study composed the database from the experimental investigations carried out by Benzaid et al. (2010), Lee et al. (2010), Yin et al. (2016), Li et al. (2003), Ilki et al. (2008), Wang et al. (2012), and Kaeseberg et al. (2020).
The available models for the ALC of CSC compressive members in the previous studies were taken for the assessment over the constructed dataset of 76 sample points using various statistical parameters including mean square error (), coefficient of determination (), mean absolute error (), and root means square error (). The database contained the next particulars for each specimen: diameter of CSC columns (), the compression strength of concrete (), concrete cover (), the axial compression strain of concrete (), the thickness of FRPs (), the elastic modulus of FRPs (), the tensile strength of FRPs (), the tensile strength of TSR (), the vertical spacing of TSR (), and the diameter of TSR (). The sample points also portray the testing outcomes of the peak compression strength () of wrapped concrete.
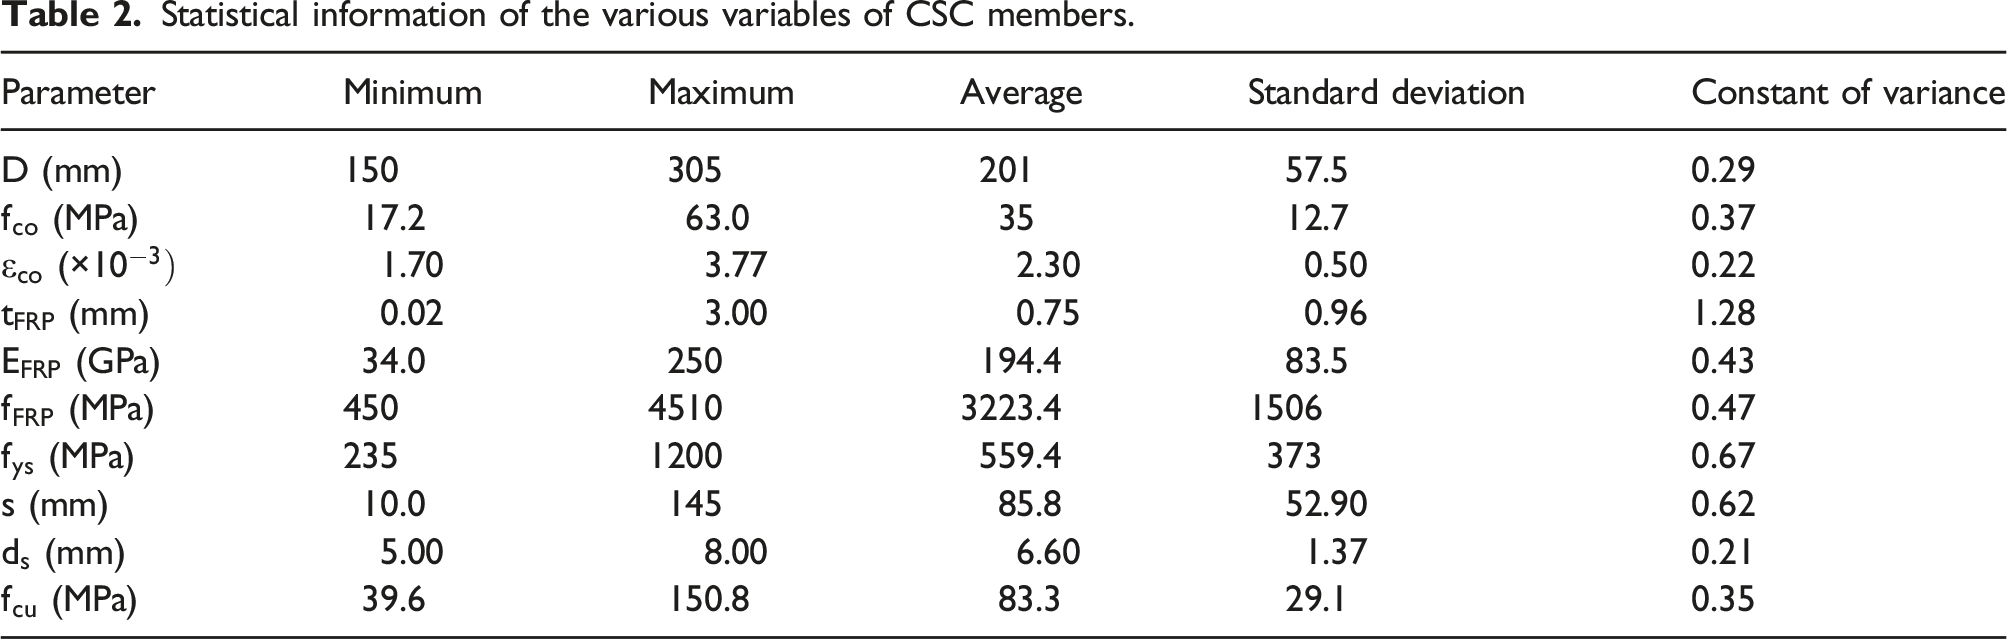
A database of 76 CFRP-wrapped and transverse steel-reinforced concrete columns was constructed from the previous works (Benzaid et al., 2010; Ilki et al., 2008; Kaeseberg et al., 2020; Li et al., 2003; Lee, et al., 2010; Wang et al., 2012; Yin et al., 2016). Table 2 presents the statistical information of the deviation of different variables linked to the CFRP and TSR wrapped concrete CSC samples. In the constructed data points, the transverse confinement was either steel hoops or steel spirals. It contained 48 samples transversely wrapped with internal steel hoops and externally wrapped with CFRPs whereas the remaining 28 CSC members were transversely wrapped with internal steel spirals and externally wrapped with CFRPs. All the samples, their geometric details, material details, and results are presented in Table 3. The following key points were observed during the construction of the database from the previous studies: (a) the CSC members having the unwrapped concrete strength within the range of 10 to 63 MPa were taken, (b) the CSC members having TSR in the form of steel hoops or steel spirals were taken, (c) the CSC members being confined by only CFRP wraps were taken, (d) only the CSC members being wrapped with CFRP wraps methods were taken, (e) only the CSC members that were wrapped with continuous confining sheets/TSR were taken. The compressive members with partial confinement (i.e., FRP strips) were neglected in the present database.
Statistical information of the various variables of CSC members.
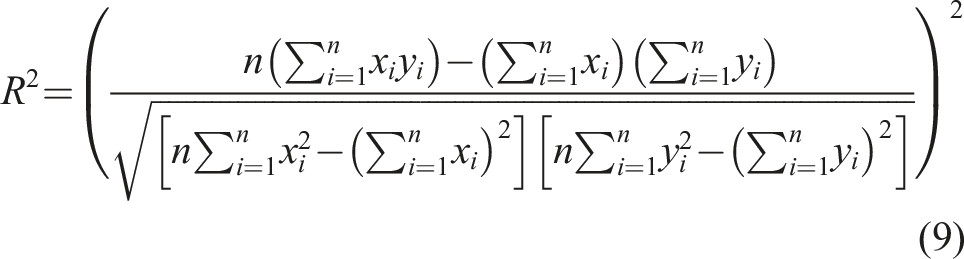
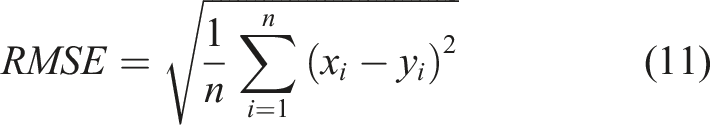
In the current study, the assessment of seven different equations proposed for the ALC of CSC compressive members (see Table 1) was carried out using 76 sample points. Various statistical parameters including , , and were employed for the assessment of the previous equations. These statistical parameters are presented in equation (9), equation (10), and equation (11), correspondingly:
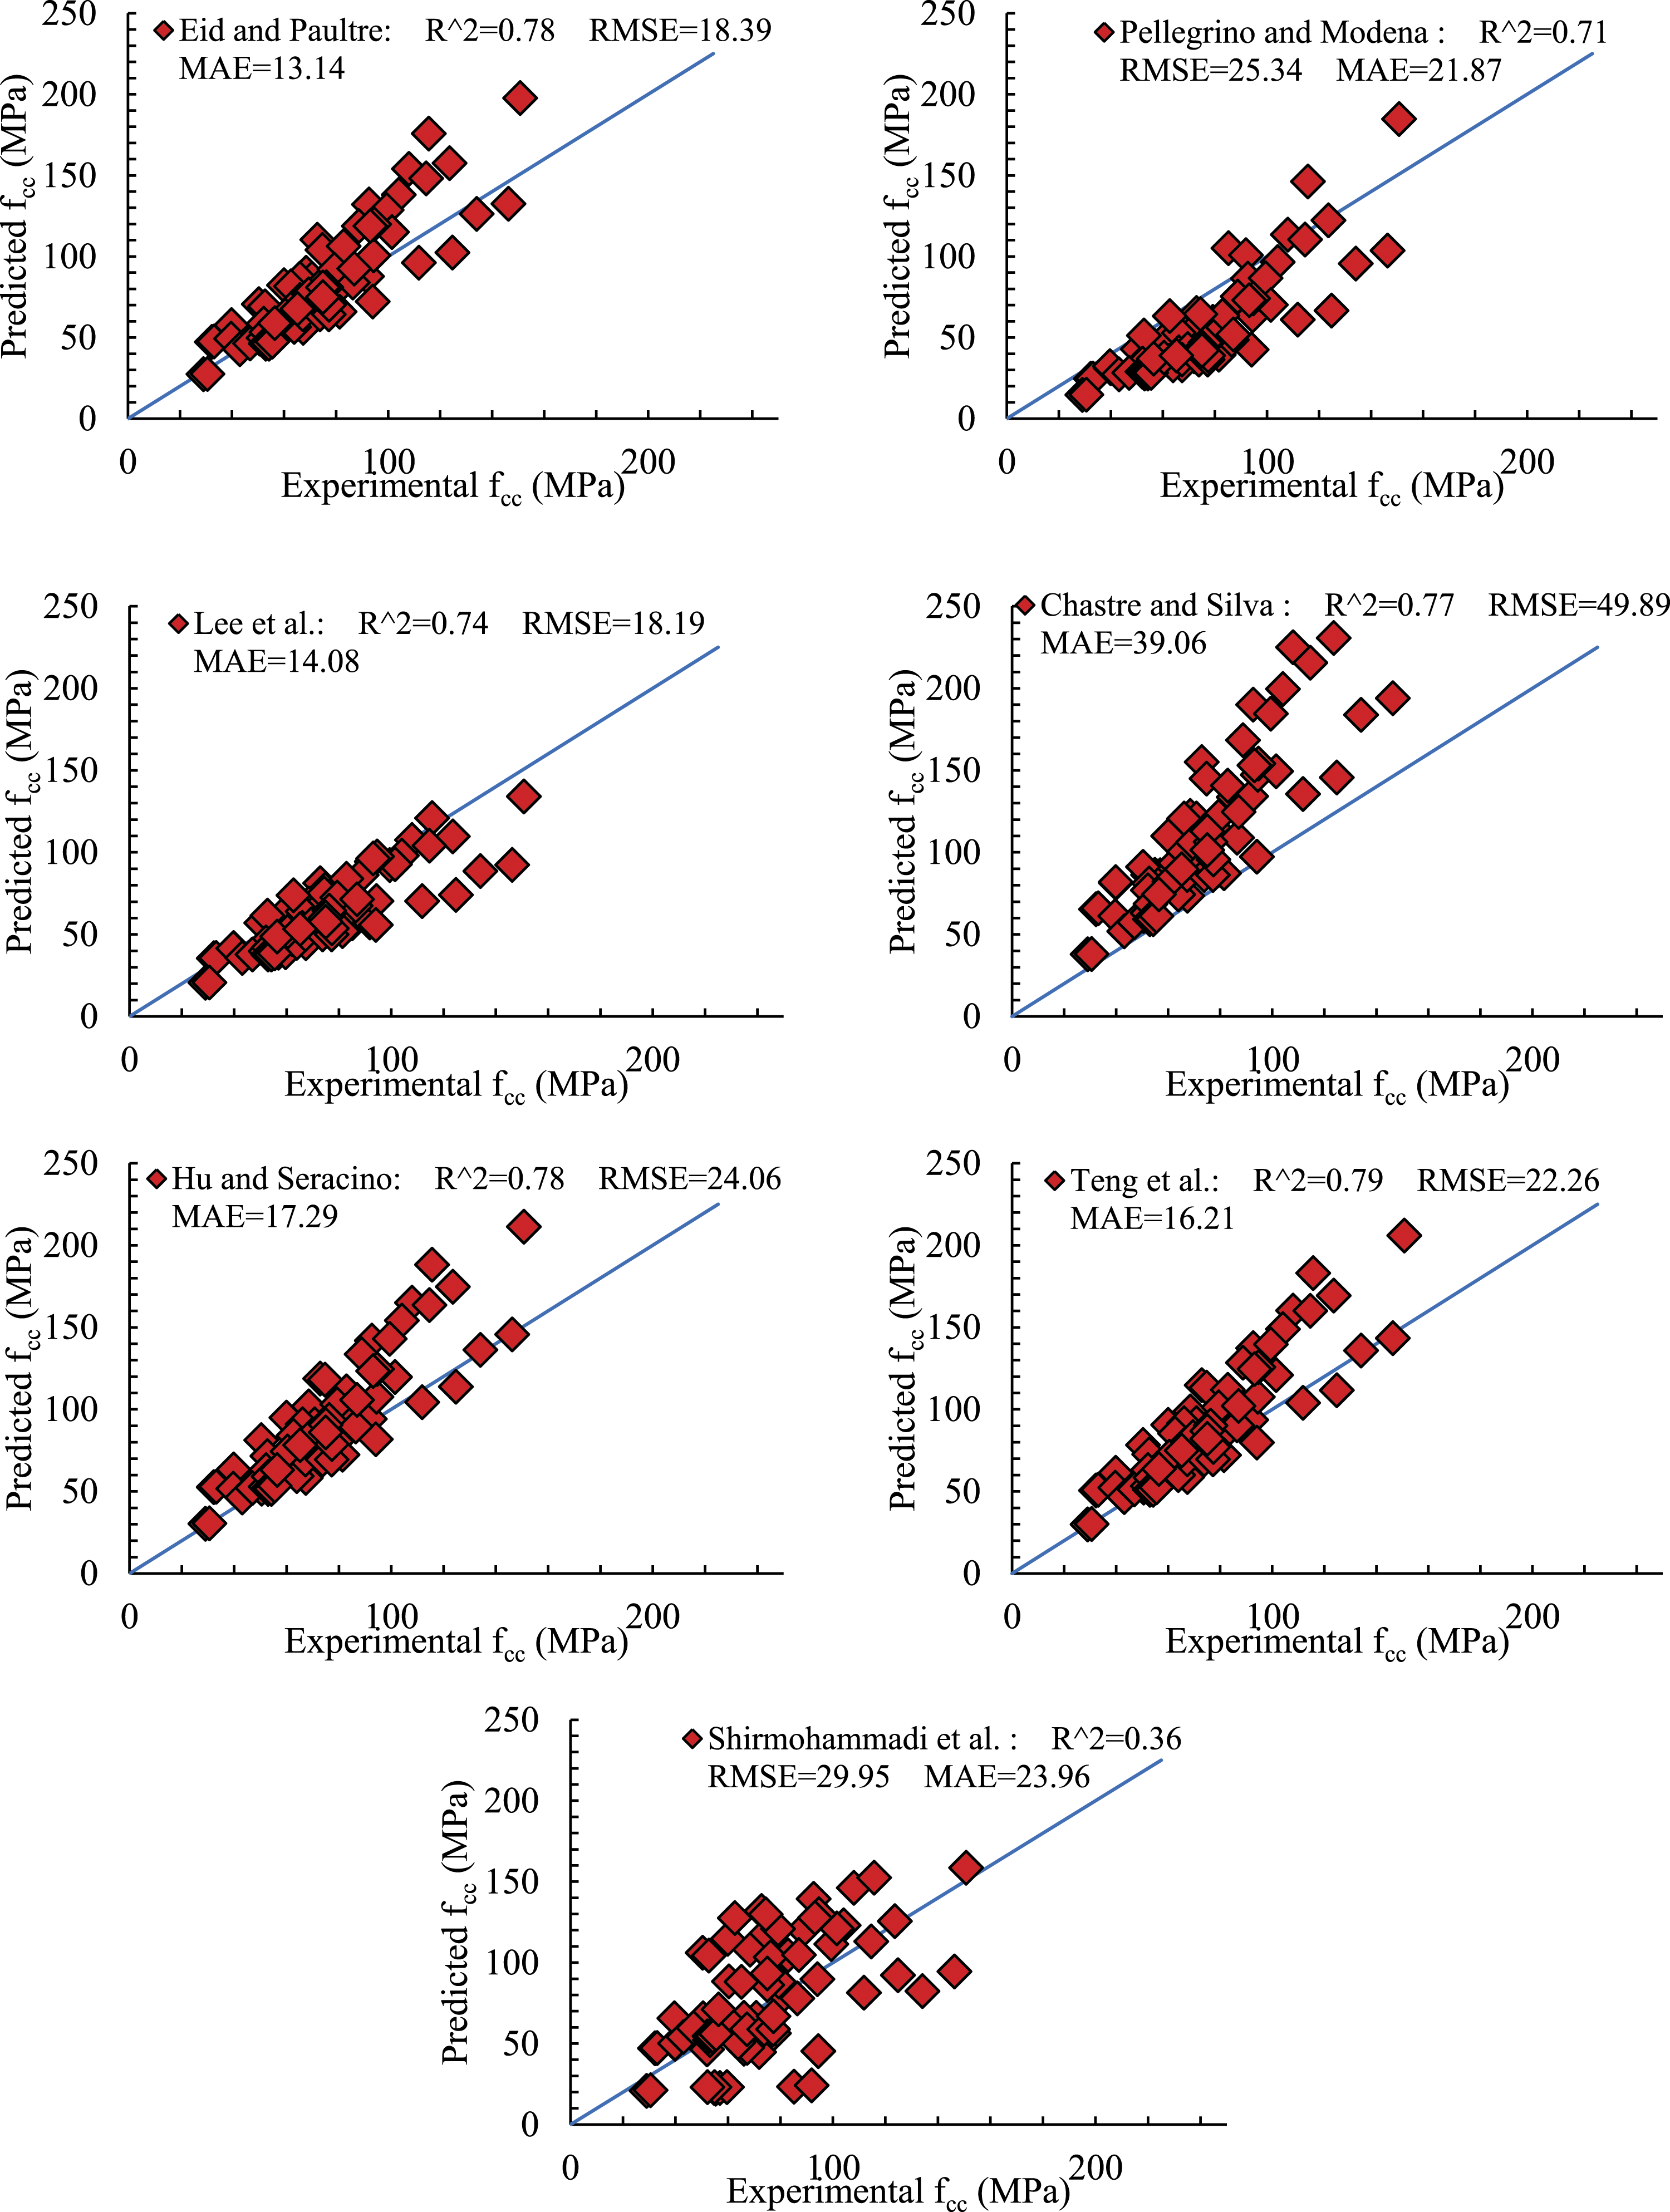
Where shows the test results, shows the predicted results, and indicates the number of the data points. The value of the coefficient can be varied from zero to one showing the perfect correlation at one. When the value of increases from zero onwards, the error of the predictions increases. Similarly, the values of should be minimum in order to secure more accurate predictions. The values of errors are minimized in the present study to obtain better results for the suggested empirical model. Figure 3 shows the evaluations of the previous equations for the ALC of CSC columns over the produced dataset using the three above-mentioned statistical parameters.
Evaluations of previously proposed equations for CSC columns.
The presentation of the equation suggested by Eid and Paultre (2008) was better than other models with the statistical parameters having the values of , , and . However, this equation did not present a good value for the parameter . The equation suggested by Pellegrino and Modena (2010) showed its presentation with , , and . The Lee et al. (2010) model depicted the presentation with , , and with the least value of as compared with the predictions of the previous equations. Correspondingly, the equation proposed by Chastre and Silva (2010) depicted its precision with the statistical indices (, , and ) portraying the greater values of errors ( and ) equated with the remaining equations. The main reason behind the discrepancies of this equations can be attributed to the development of this model based on the steel hoops without involving the involvement of steel spirals in TSR. But the present study contains the database which includes the samples transversely confined with steel spirals also. Thus, the format of the equation suggested by Chastre and Silva (2010) is not a general form that could be applicable for both steel spirals and steel hoops in the TSR.
The equations suggested by Hu and Seracino (2014) represented a better presentation in terms of but the other parameters depicted greater values of statistical errors. However, the equation suggested by Teng et al. (2015) showed a good behavior for having a value of 0.79. The other statistical indices had the value of 22.26 and 16.21 for and , correspondingly. Because the index is dominant for assessing the performance of the predictions, therefore, the general form of the equation suggested by the Teng et al. (2015) model was taken as the general format of the currently suggested empirical model in the present study. The equation given by Shirmohammadi et al. (2015) represented a poor behavior for the constructed dataset with , , and . Small number of experimental noisy data points for suggesting this model can be the main reason for the higher discrepancies of this model.
Neural network modelling
NNs are the computing systems vaguely stimulated by the biological neural networks that establish animal brains. A neural network model is based on an assemblage of linked nodes known as artificial neurons that roughly make the neurons in a biological brain. Many scientists are interested in this area for their research purpose due to the good behavior of NNs for forecasting the performance of composite structures. After importing the data to the NNs, some electronic functions are performed like the mind of humans and animals.
NNs are computing systems that are influenced in some way by the biological neural networks that make up animal brains. To illustrate their effect, the functions are developed and assessed based on the vast databases provided to the application. Because of their adaptability and ability to store the information generated during the training phase, NN simulations can learn, classify, and forecast various outputs. Various neurons in NNs are connected by complicated layers known as hidden layers. Each input variable’s influence is defined by a specific weight that connects all of the neurons. Different model parameters are provided by the neurons, which are increased by their weight to change their value for correct predictions. After summation with the bias, the neurons' generated values are redistributed via linkages. The values are then used by a predetermined activation function to describe the connection between distinct buried layers of neurons. Lastly, equation (12) can be used to express the output function.
In this equation, shows the weights, shows the input values, and b shows the bias value.
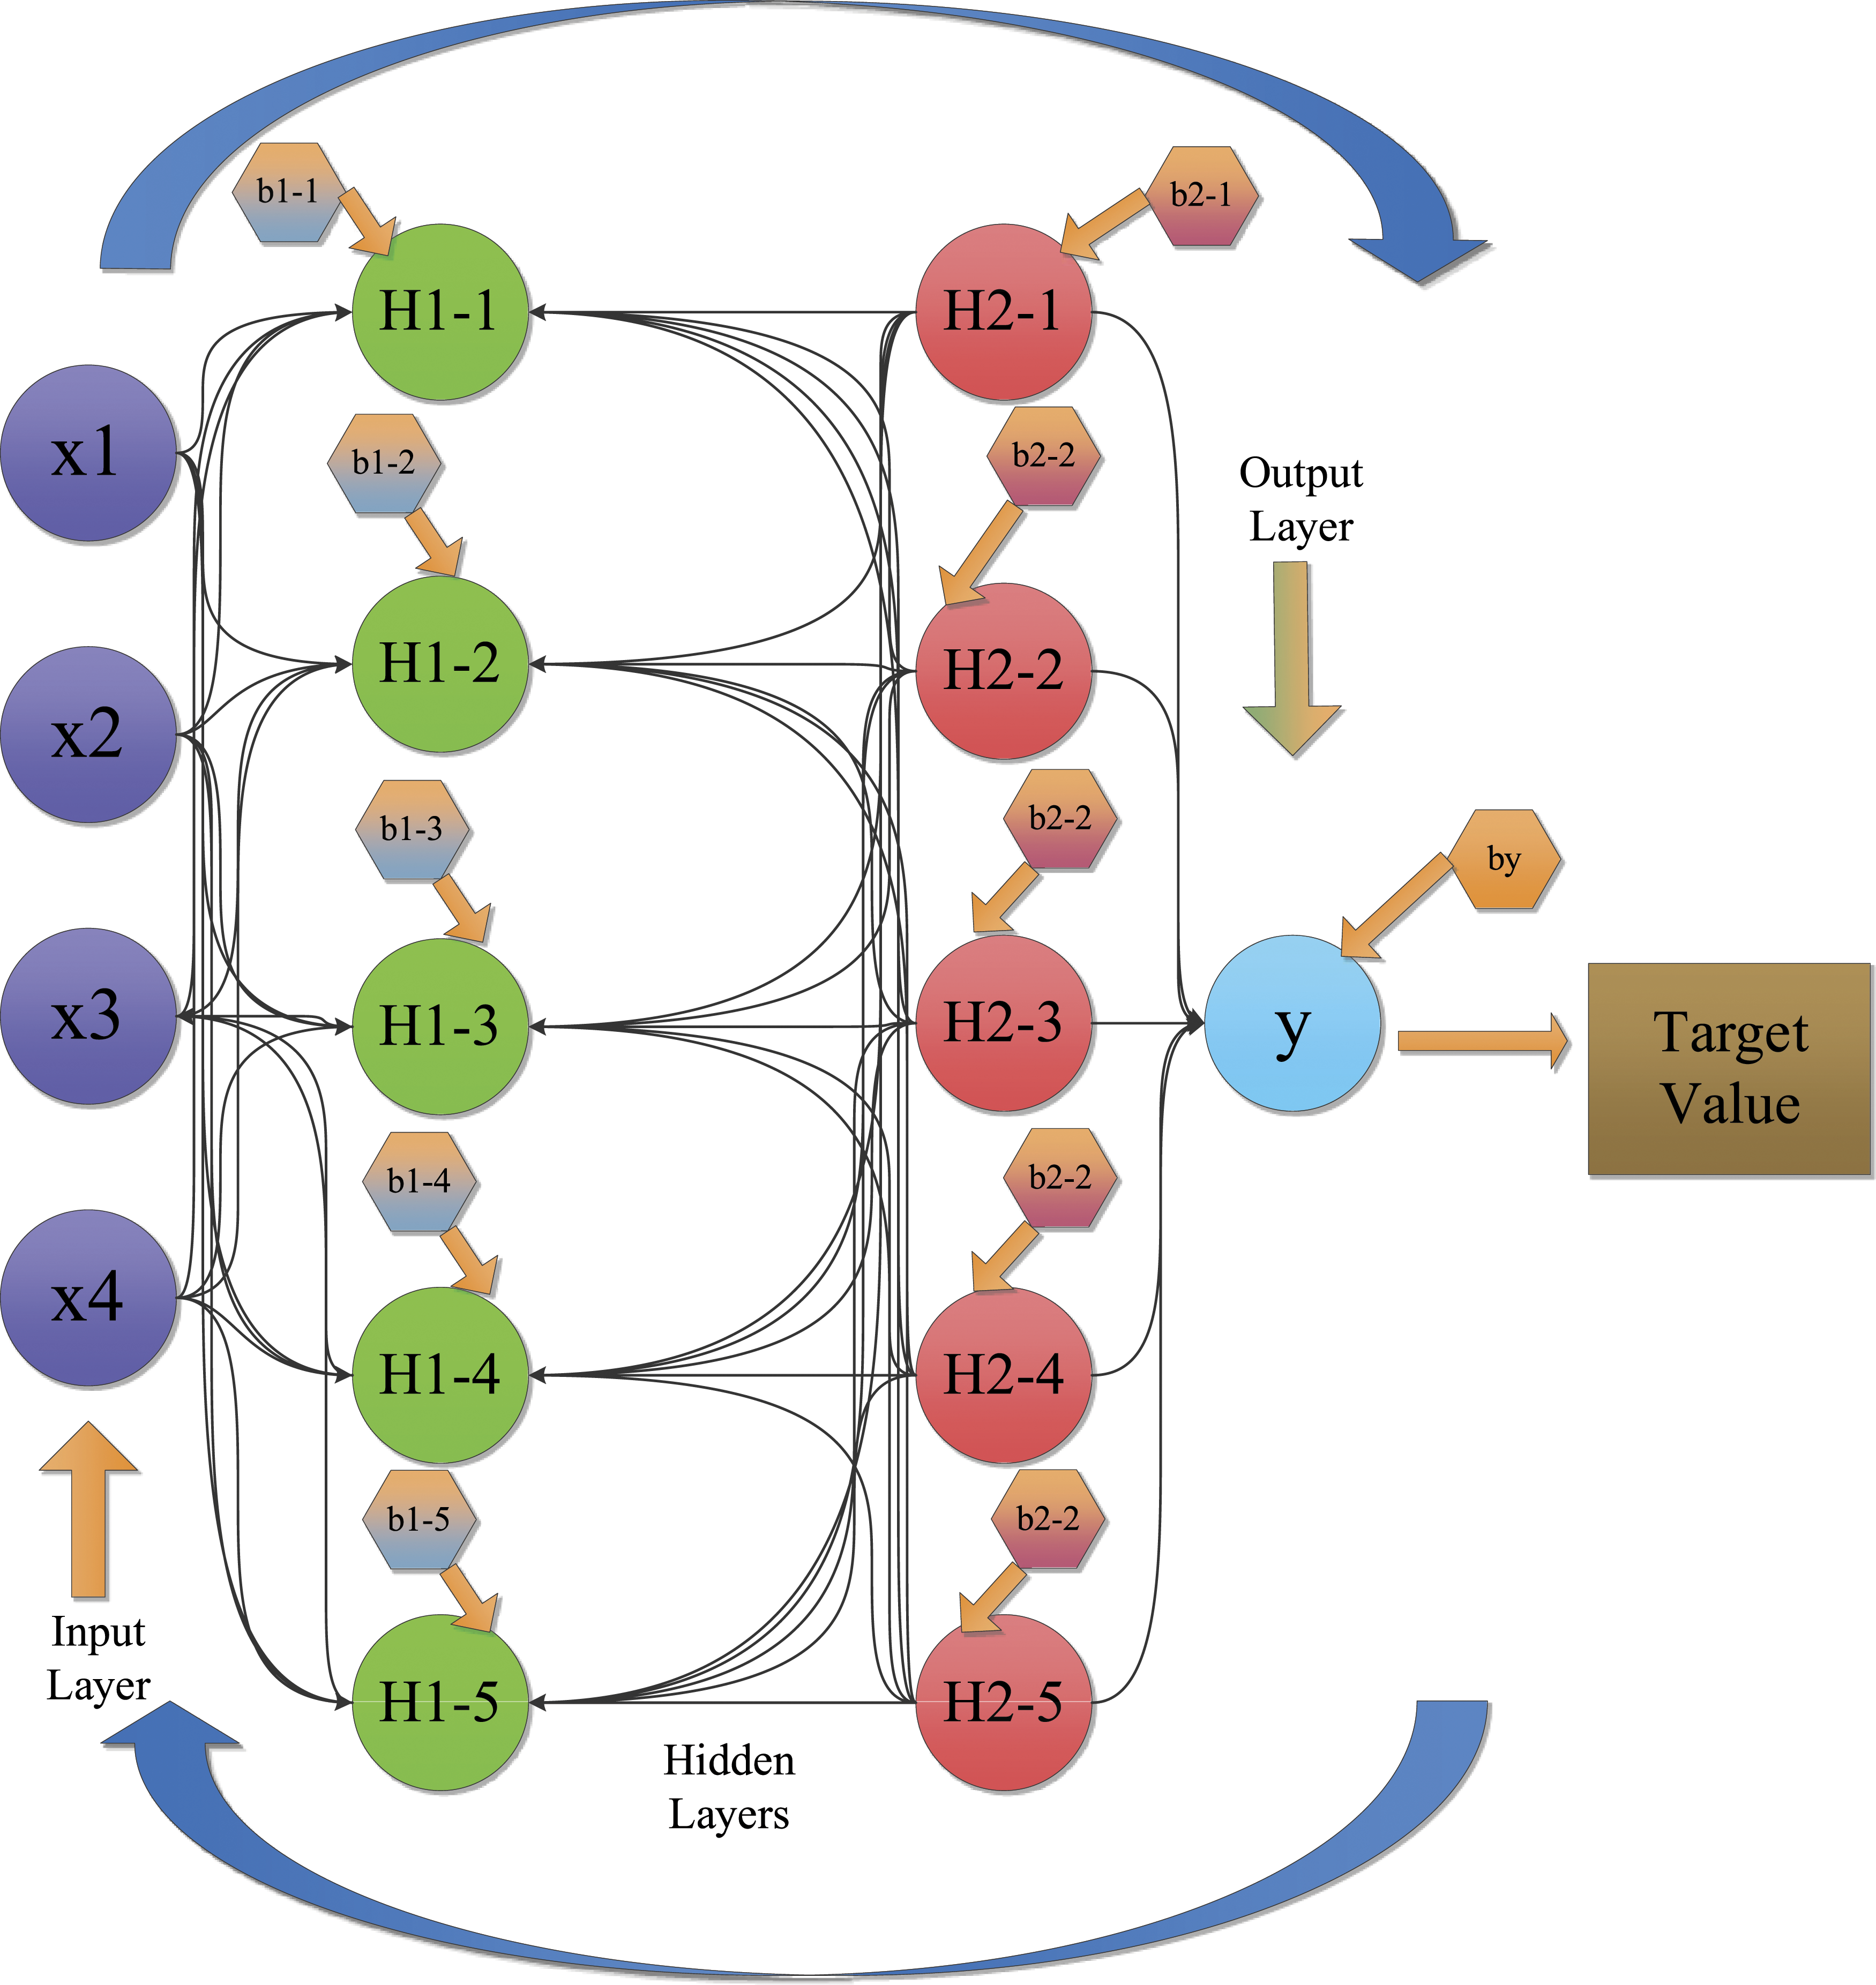
The ALC of CSC columns has been anticipated in this investigation utilizing the NN approach over the constructed experimental database. The MLFNNs portrayed the optimal estimates for the FRP wrapped components in the preceding investigations (Cladera and Mari, 2004a; Cladera and Marí, 2004b) as presented in Figure 4. Thus, the MLFNNs and the multi-layer free forward back-propagation (MLFFBP) have been utilized in this study to predict the ALC of CSC compressive members. The input layer contained ten (10) variables of CSC columns that include the diameter of CSC columns (), the compression stress of unwrapped concrete (), concrete cover (), the axial compression strain of concrete (), the thickness of FRPs (), the elastic modulus of FRPs (), the tensile strength of FRPs (), the tensile strength of TSR (), the vertical spacing of TSR (), and the diameter of TSR ().
The feed-forward and back propagation procedure.
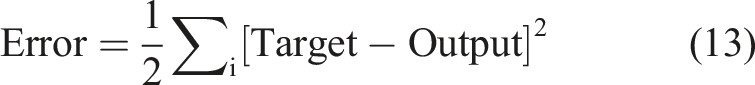
The input data is handled in NN models for diverse processes using different functions to detect correlations between distinct input parameters and the modeling’s output variable. The number of hidden layers and the structure of the model are determined by the neural networks used in NN modeling. Finally, the output is collected in the form of the axial strength of CSC members. In NN, the output parameters could be two or more. The specified activation function has a considerable impact on the output and performance of NN models. The signals generated by the many neurons in the input layers are controlled from left to right of the NN architecture, eventually reaching the output layer on the right side as shown in Figure 4. Hyperbolic functions were used as predetermined activation functions in this study to evaluate testing data from CSC columns between the NN model’s inputs, hidden, and output layers. The error provided by the hyperbolic function during the training of networks is calculated from equation (13) which was minimized.
The back-propagation procedure is utilized to minimalizing the error produced by the predefined activation hyperbolic functions that carry out the iterations to attain the optimal estimates (LeCun et al., 2012). The search procedure is repetitive from the right to the left side of the NN structure to comprehend and assemble the data provided by the input layers during the MLFFBP process. The major goal of this back-propagation procedure is to find the optimal values for the weights that were initially allocated at random, such that the output parameters are close to the desired axial strength of CSC members. This search procedure is repeated until close estimations are produced, thus minimizing statistical errors (such as , , and ).
Structure of networks
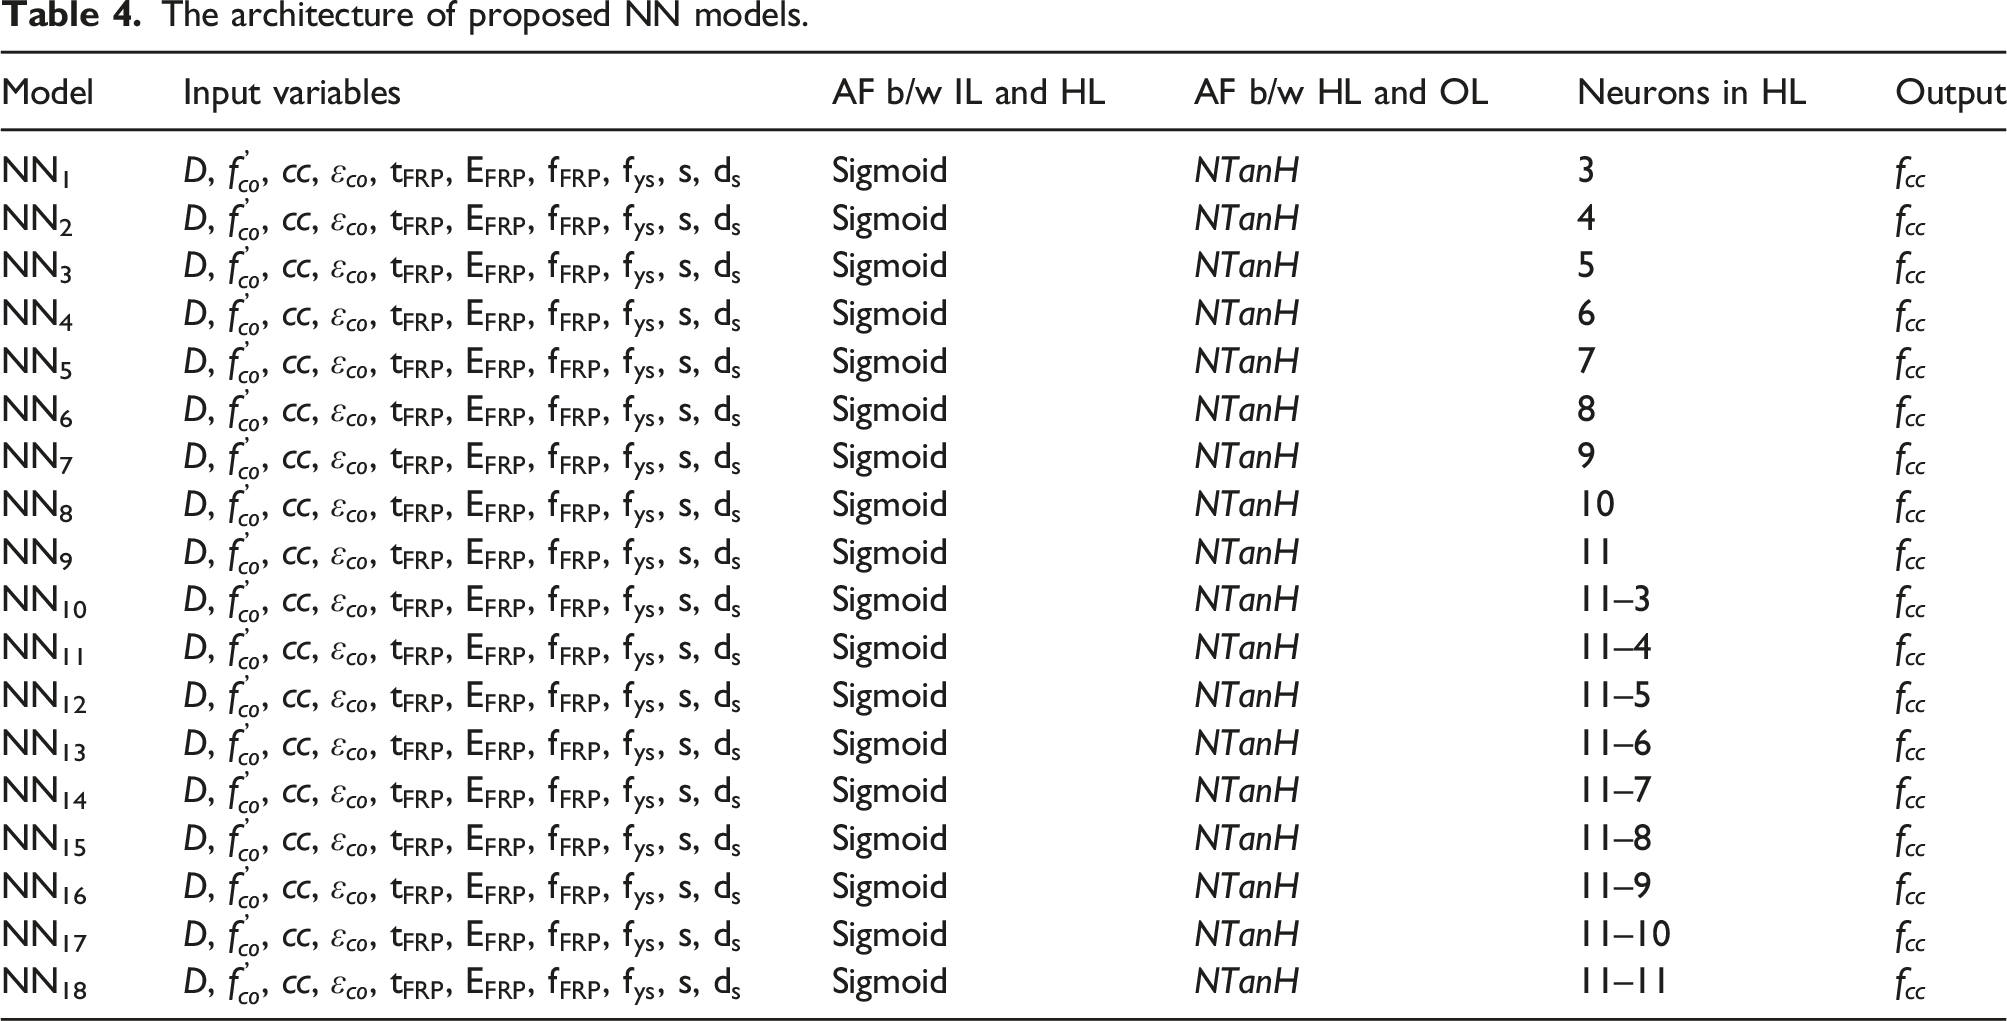
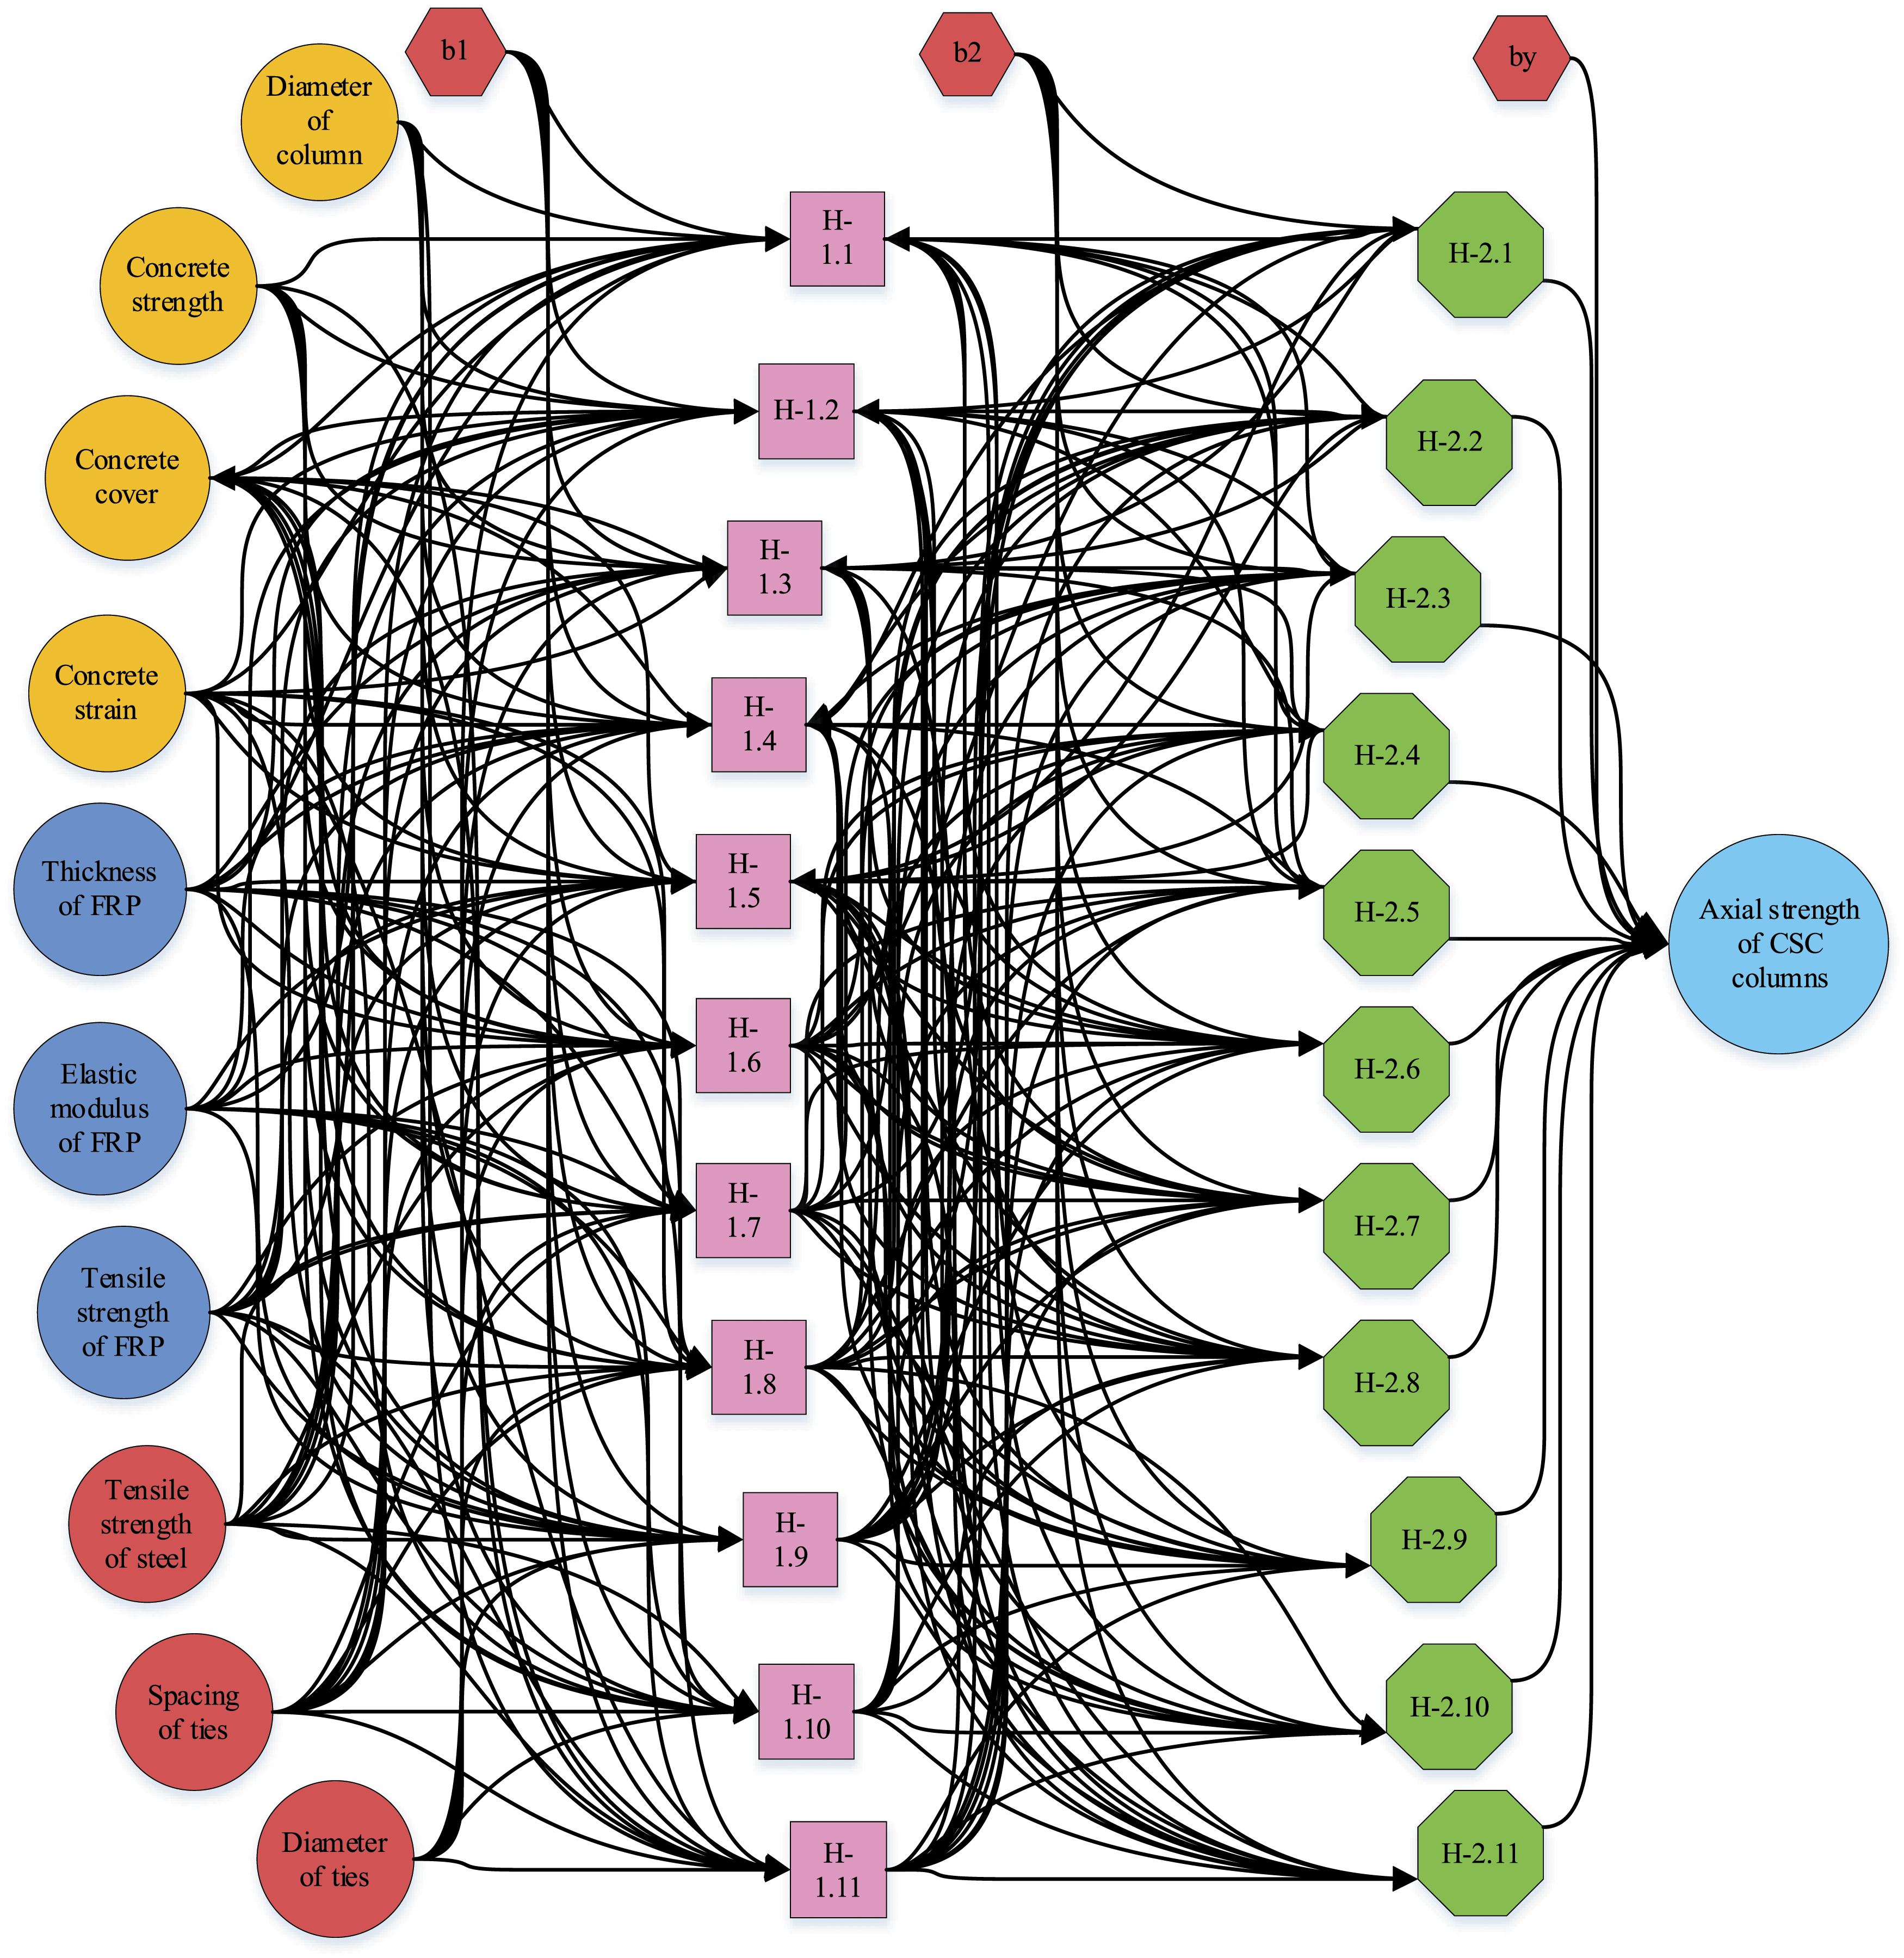
The architecture of models has a substantial impact on their performance. It is necessary to determine the type of activation functions (AF) for each layer, as well as the total number of neurons in each hidden layer (HL) and the overall number of HL. Because there are no guidelines, NN design is based on problem type and is determined through iterations. The parameters of the NN configurations investigated in this study to discover the most effective architecture are listed in Table 4. The Sigmoid function was used between the input layer (IL) and HL, and the function was used between the HL and output layers (OL), to create a maximum of eighteen NN simulations with varying numbers of neurons in the HL, and activation functions. Figure 5 depicts the NN model suggested in this work for determining the ALC of CSC members. After calibration, the model yielded 11 neurons in the 1st HL and 11 neurons in the 2nd HL for the optimal results.
The architecture of proposed NN models.
Model
Input variables
AF b/w IL and HL
AF b/w HL and OL
Neurons in HL
Output
NN1
, , , , , , , , ,
Sigmoid
3
NN2
, , , , , , , , ,
Sigmoid
4
NN3
, , , , , , , , ,
Sigmoid
5
NN4
, , , , , , , , ,
Sigmoid
6
NN5
, , , , , , , , ,
Sigmoid
7
NN6
, , , , , , , , ,
Sigmoid
8
NN7
, , , , , , , , ,
Sigmoid
9
NN8
, , , , , , , , ,
Sigmoid
10
NN9
, , , , , , , , ,
Sigmoid
11
NN10
, , , , , , , , ,
Sigmoid
11–3
NN11
, , , , , , , , ,
Sigmoid
11–4
NN12
, , , , , , , , ,
Sigmoid
11–5
NN13
, , , , , , , , ,
Sigmoid
11–6
NN14
, , , , , , , , ,
Sigmoid
11–7
NN15
, , , , , , , , ,
Sigmoid
11–8
NN16
, , , , , , , , ,
Sigmoid
11–9
NN17
, , , , , , , , ,
Sigmoid
11–10
NN18
, , , , , , , , ,
Sigmoid
11–11
Structure of proposed NNS model.
Normalization of databank
The normalization and standardization process for the NN models also influences the estimates of the proposed models. Due to different units, various variables of the CSC members are normalized between 0.9 and 0.2 to obtain unit-less parameters in order to attain better estimates of the proposed NN model. According to a previous study Ref. (LeCun et al., 2012), the processing and learning rate of the proposed NN models become slow if the normalization and standardization of the various variables do not carry out. Furthermore, it is necessary to secure the better performance of the NN model to carry out the normalization of the data points. The normalization process for the variables of the CSC members was done using equation (14) in the present study.
where x shows the value of the variable attained from the constructed dataset, X shows the normalized value of the variables attained from the constructed dataset, shows the ultimate value, and Δ shows the deviation between the two values (lowest value () and the highest value ()). For example, the normalization process for the parameter ‘’ was done with the maximum value of and minimum value of . The value of Δ = 53.13 MPa has been used in this parameter. The normalized values of have the maximum value of 0.9, minimum value of 0.3, and average value of 0.53 with a standard deviation of 0.15 and coefficient of variation of 0.28. Similarly, all the other parameters of the CSC columns (, , , , , , , , ) were normalized using the same methodology.
Calibration of NN model
To calibrate the NN models in this study, the MLFFBP approach and empirical datasets were considered (LeCun et al., 2012). The normalized data was originally separated into three sets; one for training, one for validation, and the other for testing to prevent overfitting and improve the NN’s efficiency. The database is subdivided into 60% for the training, 20% for the validation, and 20% for the testing of the NN model. The MLFFBP of training was used for the 100 epochs that were stopped by satisfying any one of the situations: (1) the failure of 20 validations happened (2) the performance goal of 0.0001 was attained (3) the performance gradient reduces to 10 −10. The choice of the best executing NN model was carried out by determining their , , and presented by equations (10–12). These statistical indices can be employed for examining and choosing of NN model providing the best presentation for its estimates (Castellano and Fanelli, 2000; Krogh and Vedelsby, 1995; Utans et al., 1995).
Figure 6 shows the indices for training, validation, testing, and all database values versus the number of hidden layers neurons in multiple NN trials. The change of against the neurons in the 2nd hidden layer is depicted in the 2nd half of Figure 6(a). The hidden neurons in the 1st hidden layer were maintained constant at 11, whereas the neurons in the 2nd layer varied from 3 to 11. As can be seen, maximizing the capacity of neurons in the 1st layer improves the model’s efficiency. When the number of neurons in the 2nd hidden layer is increased from 3 to 11, the precision of the proposed NN model is increased giving the best performance using 11 neurons in the 2nd layer also. Considering 3 neurons in the 1st layer presented the values of = 0.862, = 9.86, and = 5.56, whereas adding the 2nd layer, these indices presented the values of = 0.998, = 2.54, and = 1.66 for the 11 neurons in the 1st and 11 neurons in the 2nd layer. Though the accuracy of the NN model increased by increasing the number of neurons in the hidden layers, it also resulted in the complexity of the NN formula and functions making them large. Thus, to minimize the processing time of the computer and to develop a simple NN model, the number of neurons was kept constant at 11 in both layers to propose the final model.
Statistical indices for the estimates of the suggested NN models (a) for different numbers of neurons (b) RMSE for different numbers of neurons, (c) MAE for different numbers of neurons in hidden layers.
The statistical information and assessments of the estimates of NN models for the ALC of CSC compressive members are presented in Table 5. The comparative investigation depicted that the NN model NN18 showed the highest precision of all suggested NN models. This model is presented in Appendix A. Concerning the lowest value, the estimated value was 29.17 MPa whereas the experimental lowest value of ALC was 29.07 MPa showing that the suggested NN model NN18 estimated the lowest experimental value of ALC with only a 0.34% deviation. Likewise, concerning the highest value, the estimated value was 149.75 MPa whereas the experimental highest value of ALC was 150.8 MPa showing that the suggested NN model NN18 estimated the highest experimental value of ALC with only a 0.7% deviation. Concerning the variance between the lowest and highest value, the estimated difference was 120.58 whereas the experimental variance of ALC was 121.73 MPa showing that the suggested NN model NN18 estimated the variance between the lowest and highest value of ALC with only a 0.94% discrepancy.
Statistical information of various NN models for ALC of CSC members.
ALC (MPa)
Highest value
Lowest value
Difference
Average
COV
St. Dev
Experimental
150.8
29.07
121.73
73.88
0.36
26.18
NN1
134.79
21.24
113.55
74.77
0.36
26.38
NN2
142.65
29.58
113.07
75.34
0.38
28.07
NN3
139.98
27.16
112.82
74.73
0.36
26.41
NN4
131.72
24.24
107.49
74.06
0.35
25.2
NN5
140.97
31.51
109.46
75.19
0.36
26.65
NN6
146.34
29.8
116.53
75.49
0.37
27.75
NN7
143.71
16.1
127.61
73.43
0.38
27.67
NN8
146.47
27.12
119.36
72.67
0.39
27.68
NN9
145.16
28.7
116.45
74.23
0.36
25.99
NN10
146.84
28.78
118.06
73.53
0.37
26.8
NN11
146.88
30.33
116.56
73.66
0.36
26.32
NN12
147.39
28.15
119.25
73.79
0.36
26.45
NN13
146.32
28.24
118.08
73.4
0.37
26.91
NN14
146.23
29.7
116.53
74.66
0.35
25.87
NN15
146.53
28.32
118.21
73.98
0.36
26.38
NN16
144.48
30.03
114.45
73.93
0.36
26
NN17
145.85
28.89
116.96
73.76
0.37
26.58
NN18
149.75
29.17
120.58
73.86
0.36
26.13
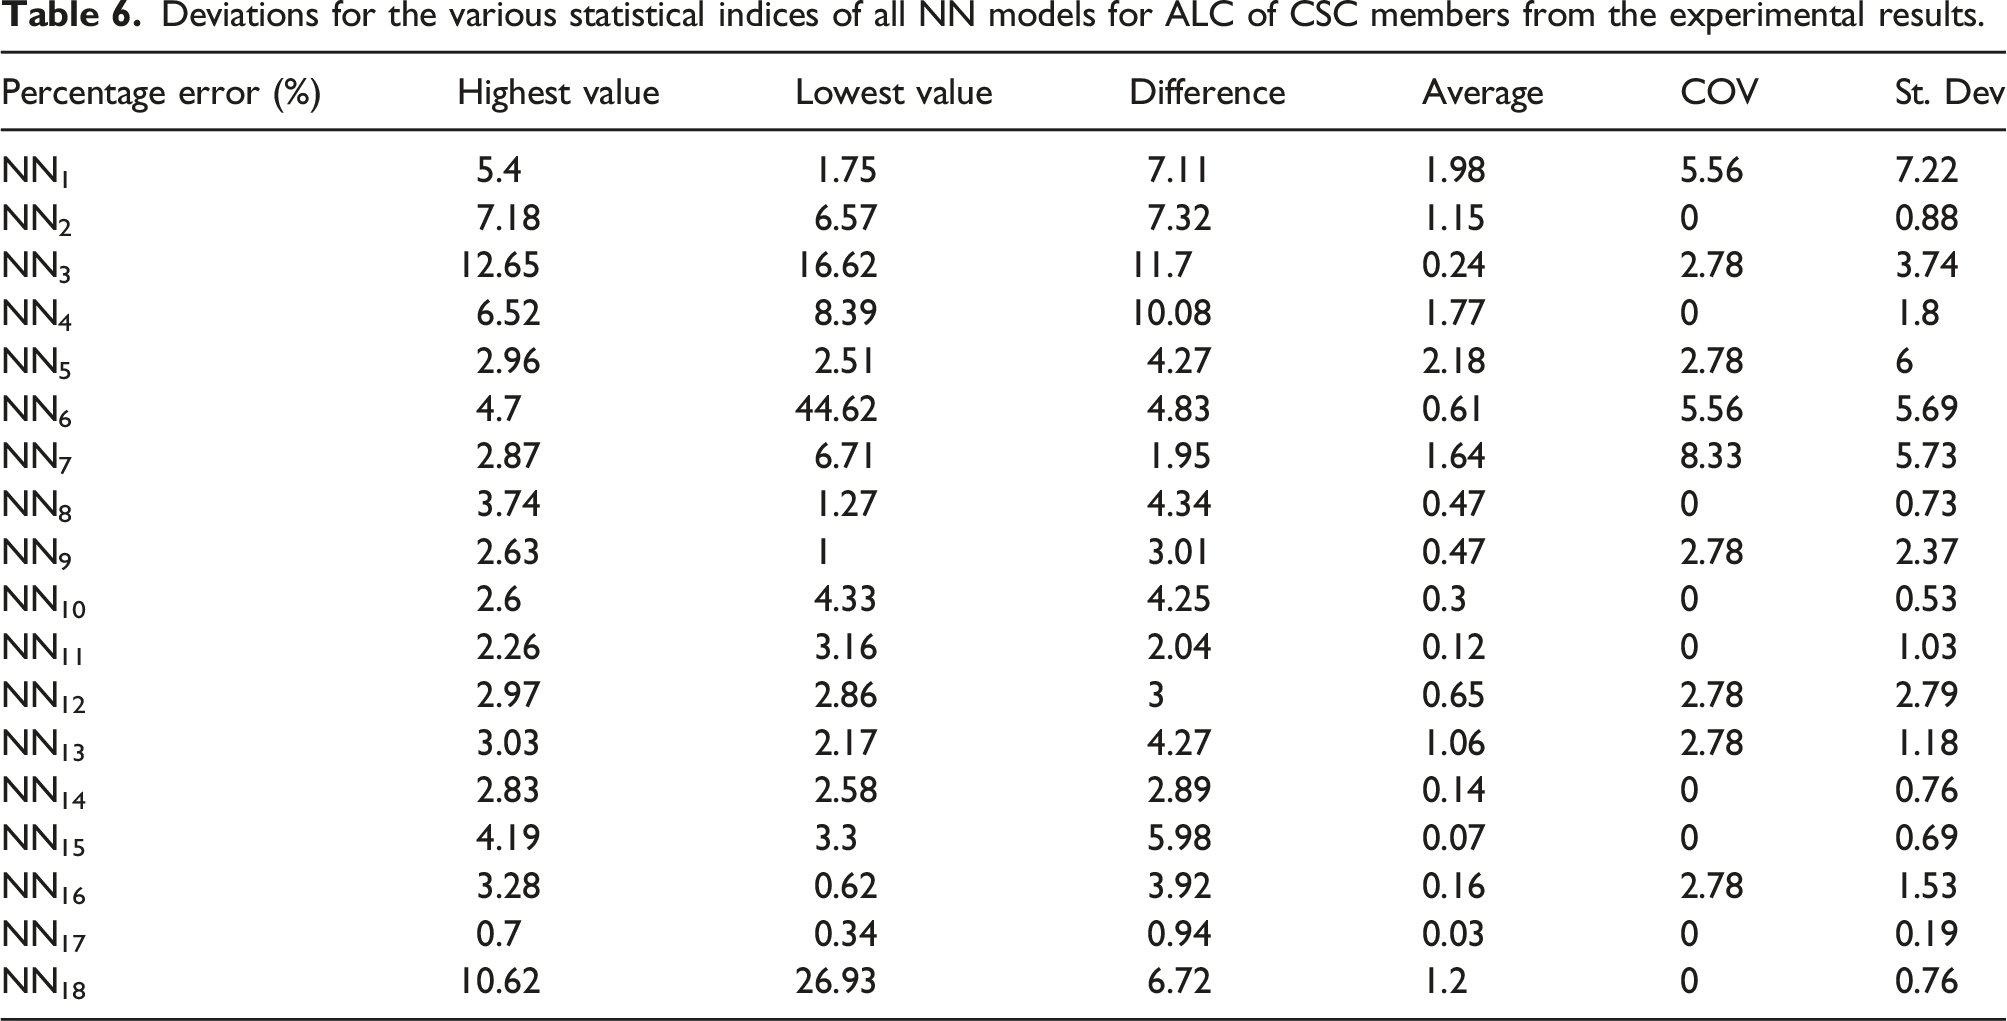
Discussing the average value of ALC, the estimated value was 73.86 MPa whereas the experimental average value of ALC was 73.88 MPa showing that the suggested NN model NN18 estimated the average experimental value of ALC with only a 0.03% deviation. Likewise, discussing the coefficient of variance (COV), the estimated ALC portrayed no error from the experimental value. Lastly, discussing the standard deviation (St. Dev) of ALC, the estimated values showed a St. Dev of 26.13 whereas the experimental results of ALC portrayed St. Dev of 26.18 reporting that the suggested NN model NN18 estimated the ALC with only 0.19% error in standard deviation. Consequently, the suggested NN model with eleven neurons in the 1st as well as 2nd hidden layers is the optimal NN model for predicting the ALC of CSC compressive members. All the deviations from the experimental results for various statistical indices attained from the suggested NN models are presented in Table 6.
Deviations for the various statistical indices of all NN models for ALC of CSC members from the experimental results.
Percentage error (%)
Highest value
Lowest value
Difference
Average
COV
St. Dev
NN1
5.4
1.75
7.11
1.98
5.56
7.22
NN2
7.18
6.57
7.32
1.15
0
0.88
NN3
12.65
16.62
11.7
0.24
2.78
3.74
NN4
6.52
8.39
10.08
1.77
0
1.8
NN5
2.96
2.51
4.27
2.18
2.78
6
NN6
4.7
44.62
4.83
0.61
5.56
5.69
NN7
2.87
6.71
1.95
1.64
8.33
5.73
NN8
3.74
1.27
4.34
0.47
0
0.73
NN9
2.63
1
3.01
0.47
2.78
2.37
NN10
2.6
4.33
4.25
0.3
0
0.53
NN11
2.26
3.16
2.04
0.12
0
1.03
NN12
2.97
2.86
3
0.65
2.78
2.79
NN13
3.03
2.17
4.27
1.06
2.78
1.18
NN14
2.83
2.58
2.89
0.14
0
0.76
NN15
4.19
3.3
5.98
0.07
0
0.69
NN16
3.28
0.62
3.92
0.16
2.78
1.53
NN17
0.7
0.34
0.94
0.03
0
0.19
NN18
10.62
26.93
6.72
1.2
0
0.76
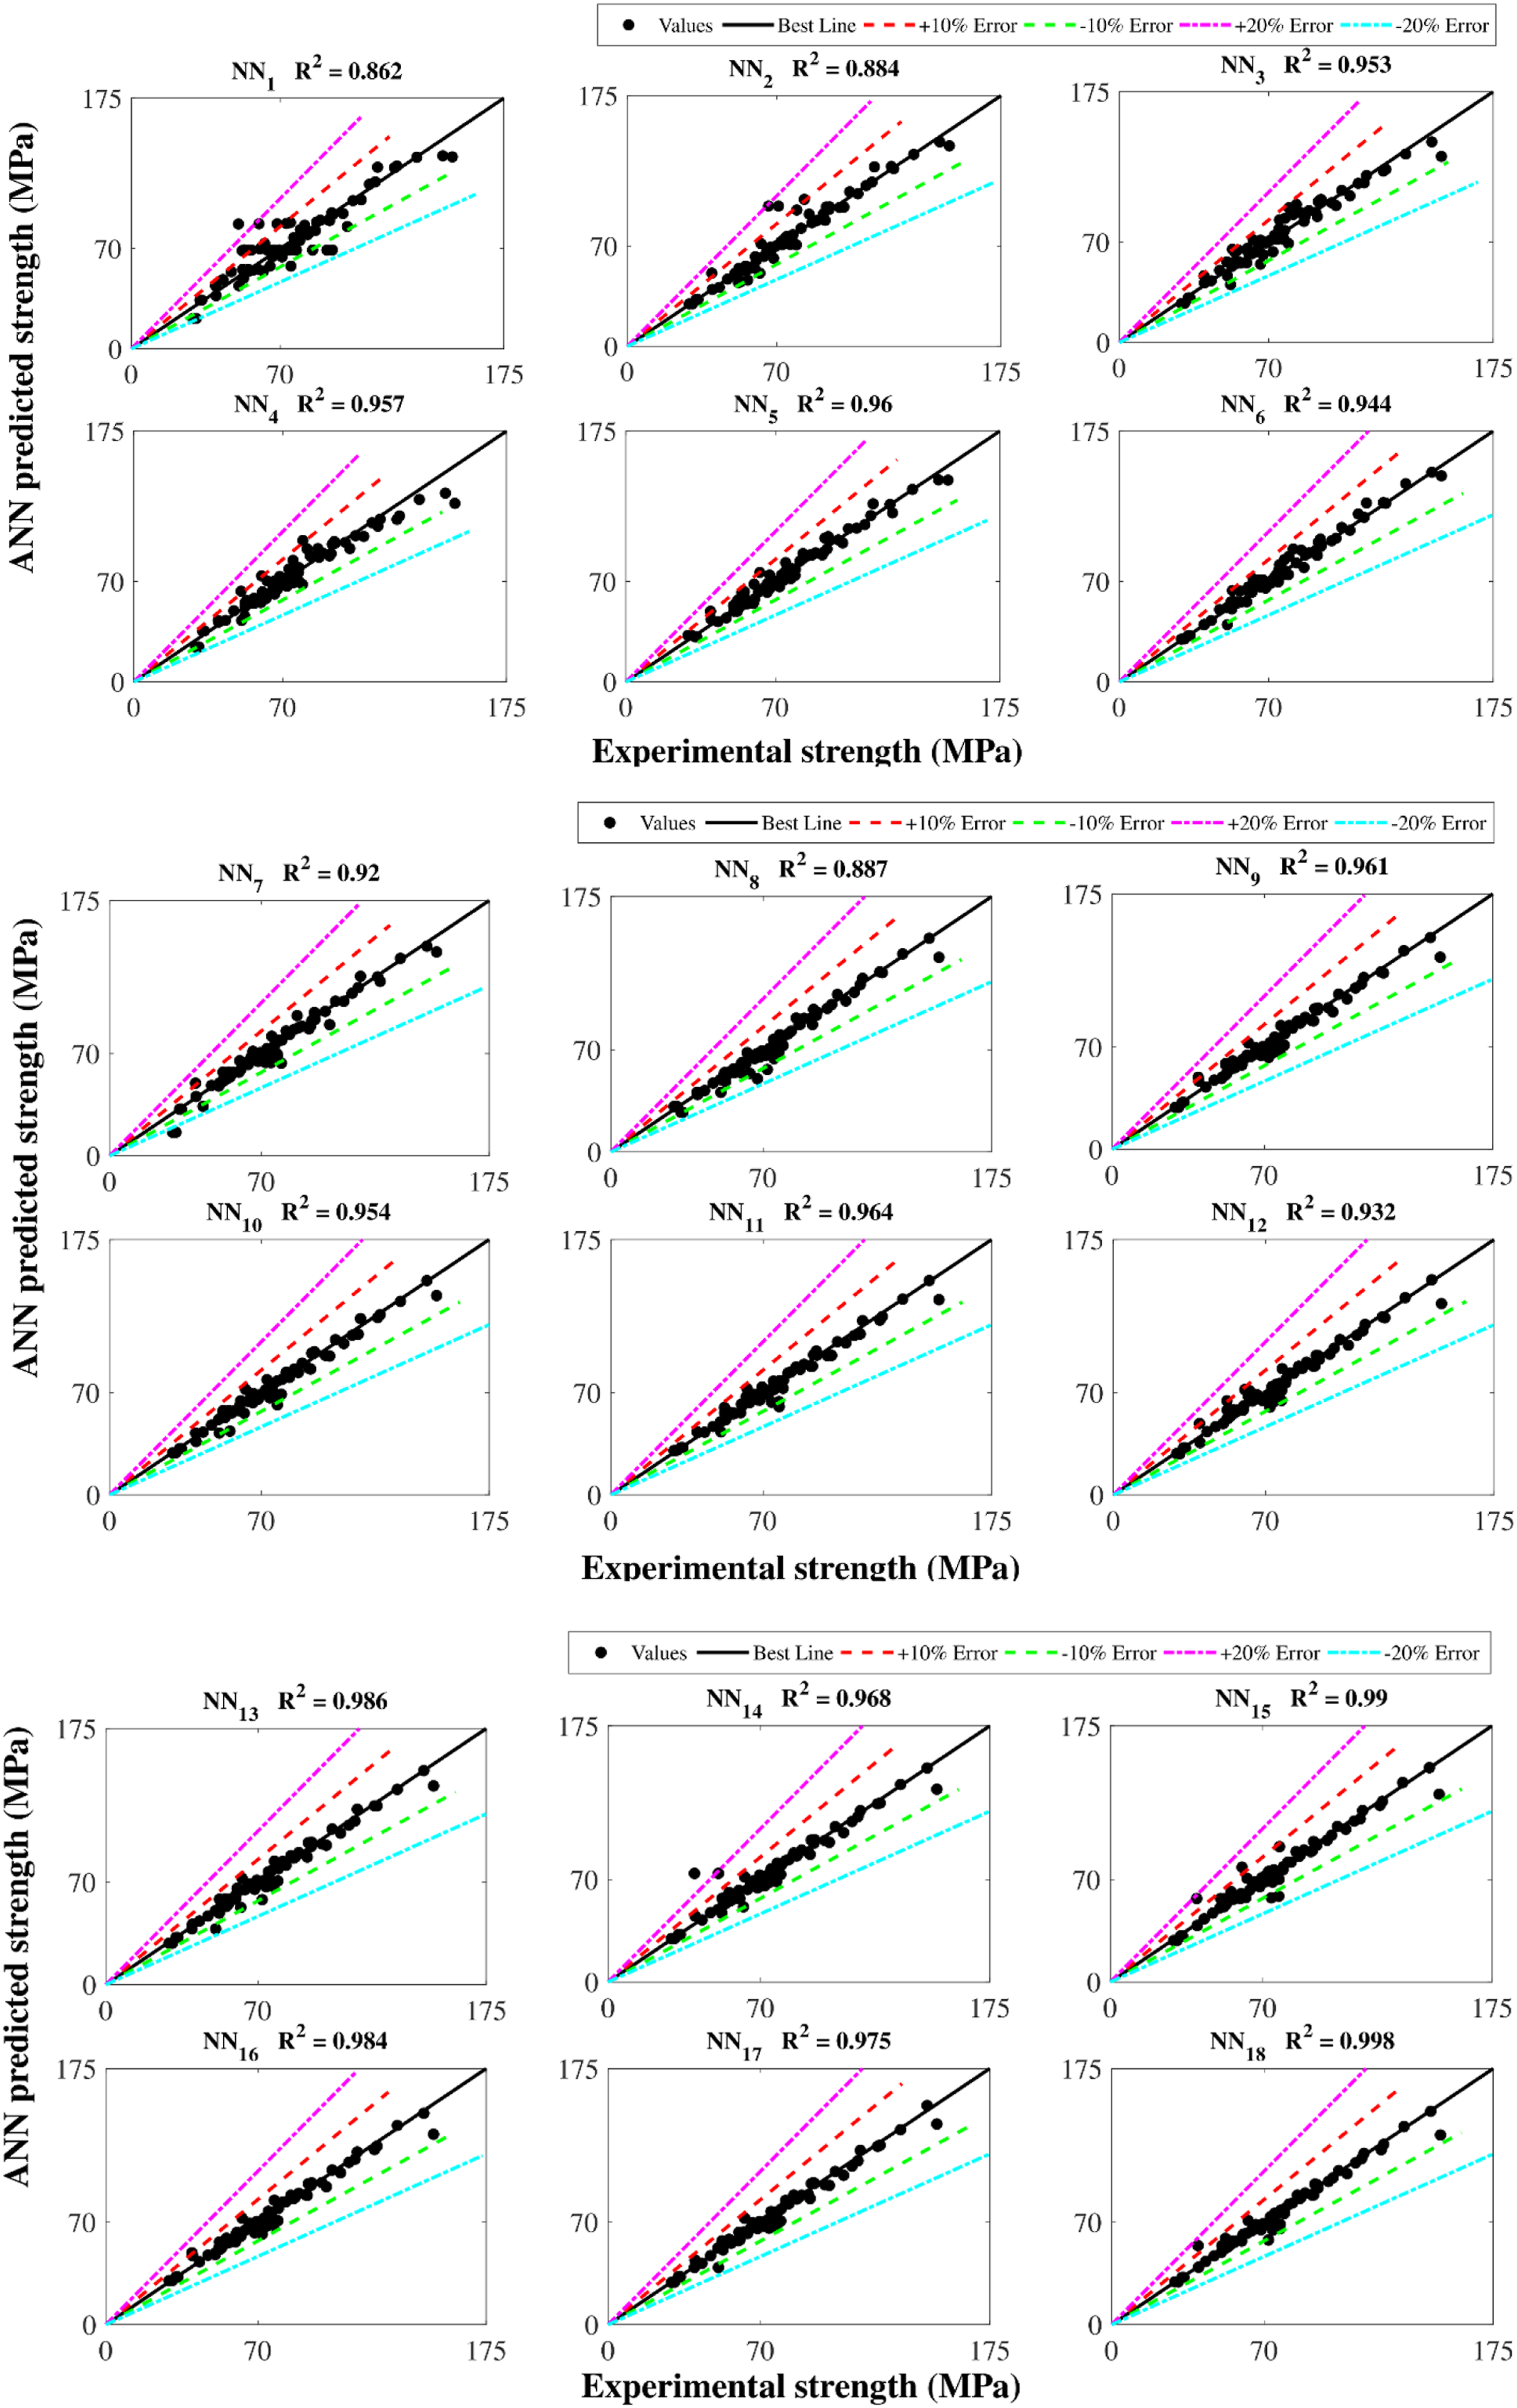
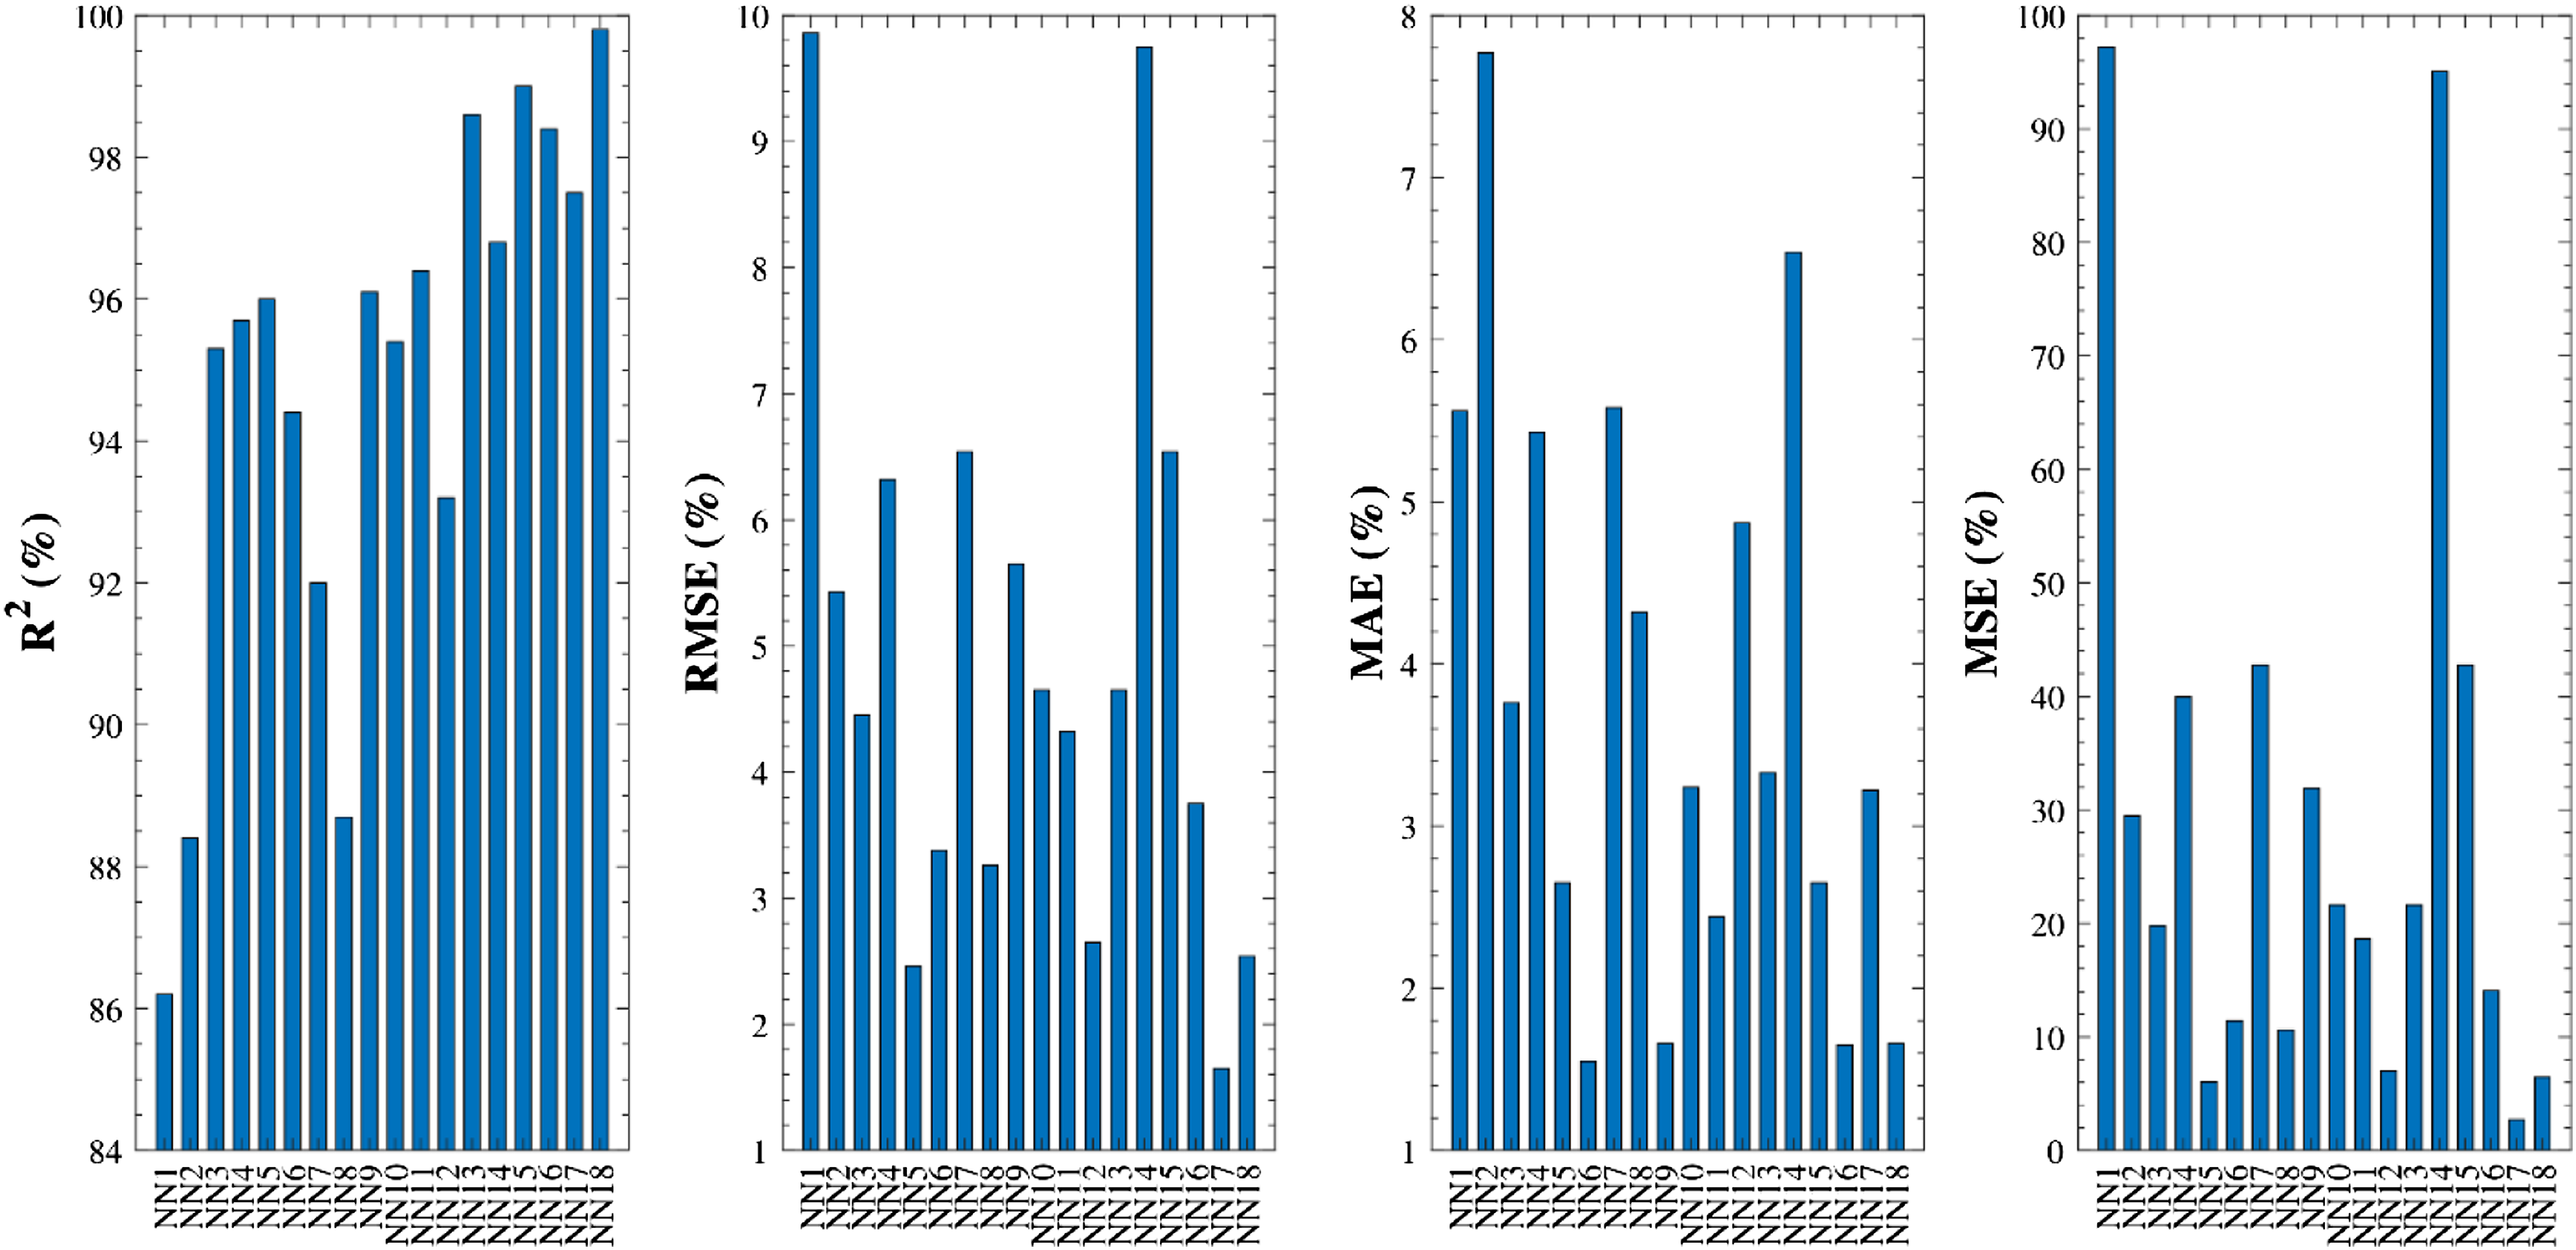
Figure 7 displays the graph between the experimental values and NN estimated values of the ALC of CSC members. The optimal estimations were secured from the NN18 model with R2 = 0.998, RMSE = 2.54, MAE = 1.66, and MSE = 6.45. Four different statistical errors , , , and mean square error () of the estimates of different NN models for the ALC of CSC members are shown in Figure 8. The optimal NN model will be that showing the lowest errors (, , and ) and the largest . The assessments of different NN models show that the model NN18 displays the lower values of errors ( = 2.54, = 1.66, and = 6.45) and the largest values of = 0.998. Consequently, this model is chosen as the most precise model for estimating the ALC of CSC members.
Performance of different NN models for ALC of CSC members.
Performance of different NN models for statistical indices.
Proposed empirical model
To suggest a new empirical model for estimating the ALC of CSC members over the constructed database, the general regression technique and curve-fitting analysis were employed. As discussed in the previous sections, the Teng et al. (2015) model presented a better performance over the dataset. Therefore, the general format of the newly suggested empirical equation was kept similar to that of the Teng et al. (2015) model. Small amendments in the format of the proposed model were carried out to secure the more accurate results and to precisely capture the interaction mechanism between TSR, CFRPs, and concrete. The general regression procedure and the curve fitting using MATLAB are used to minimize the errors and improve the coefficient of determination for the most accurate predictions. Finally, the following equation is proposed for estimating the of CSC members:
where is the confinement efficiency constant of TSR that has been calculated from the previous study (Li et al., 2003), shows the modulus of elasticity of TSR, shows the cross-sectional area of TSR, D shows the diameter of CSC members, shows the thickness of CFRP wraps, shows the center to center distance between TSR, and shows the core area of concrete .
Validation of suggested models
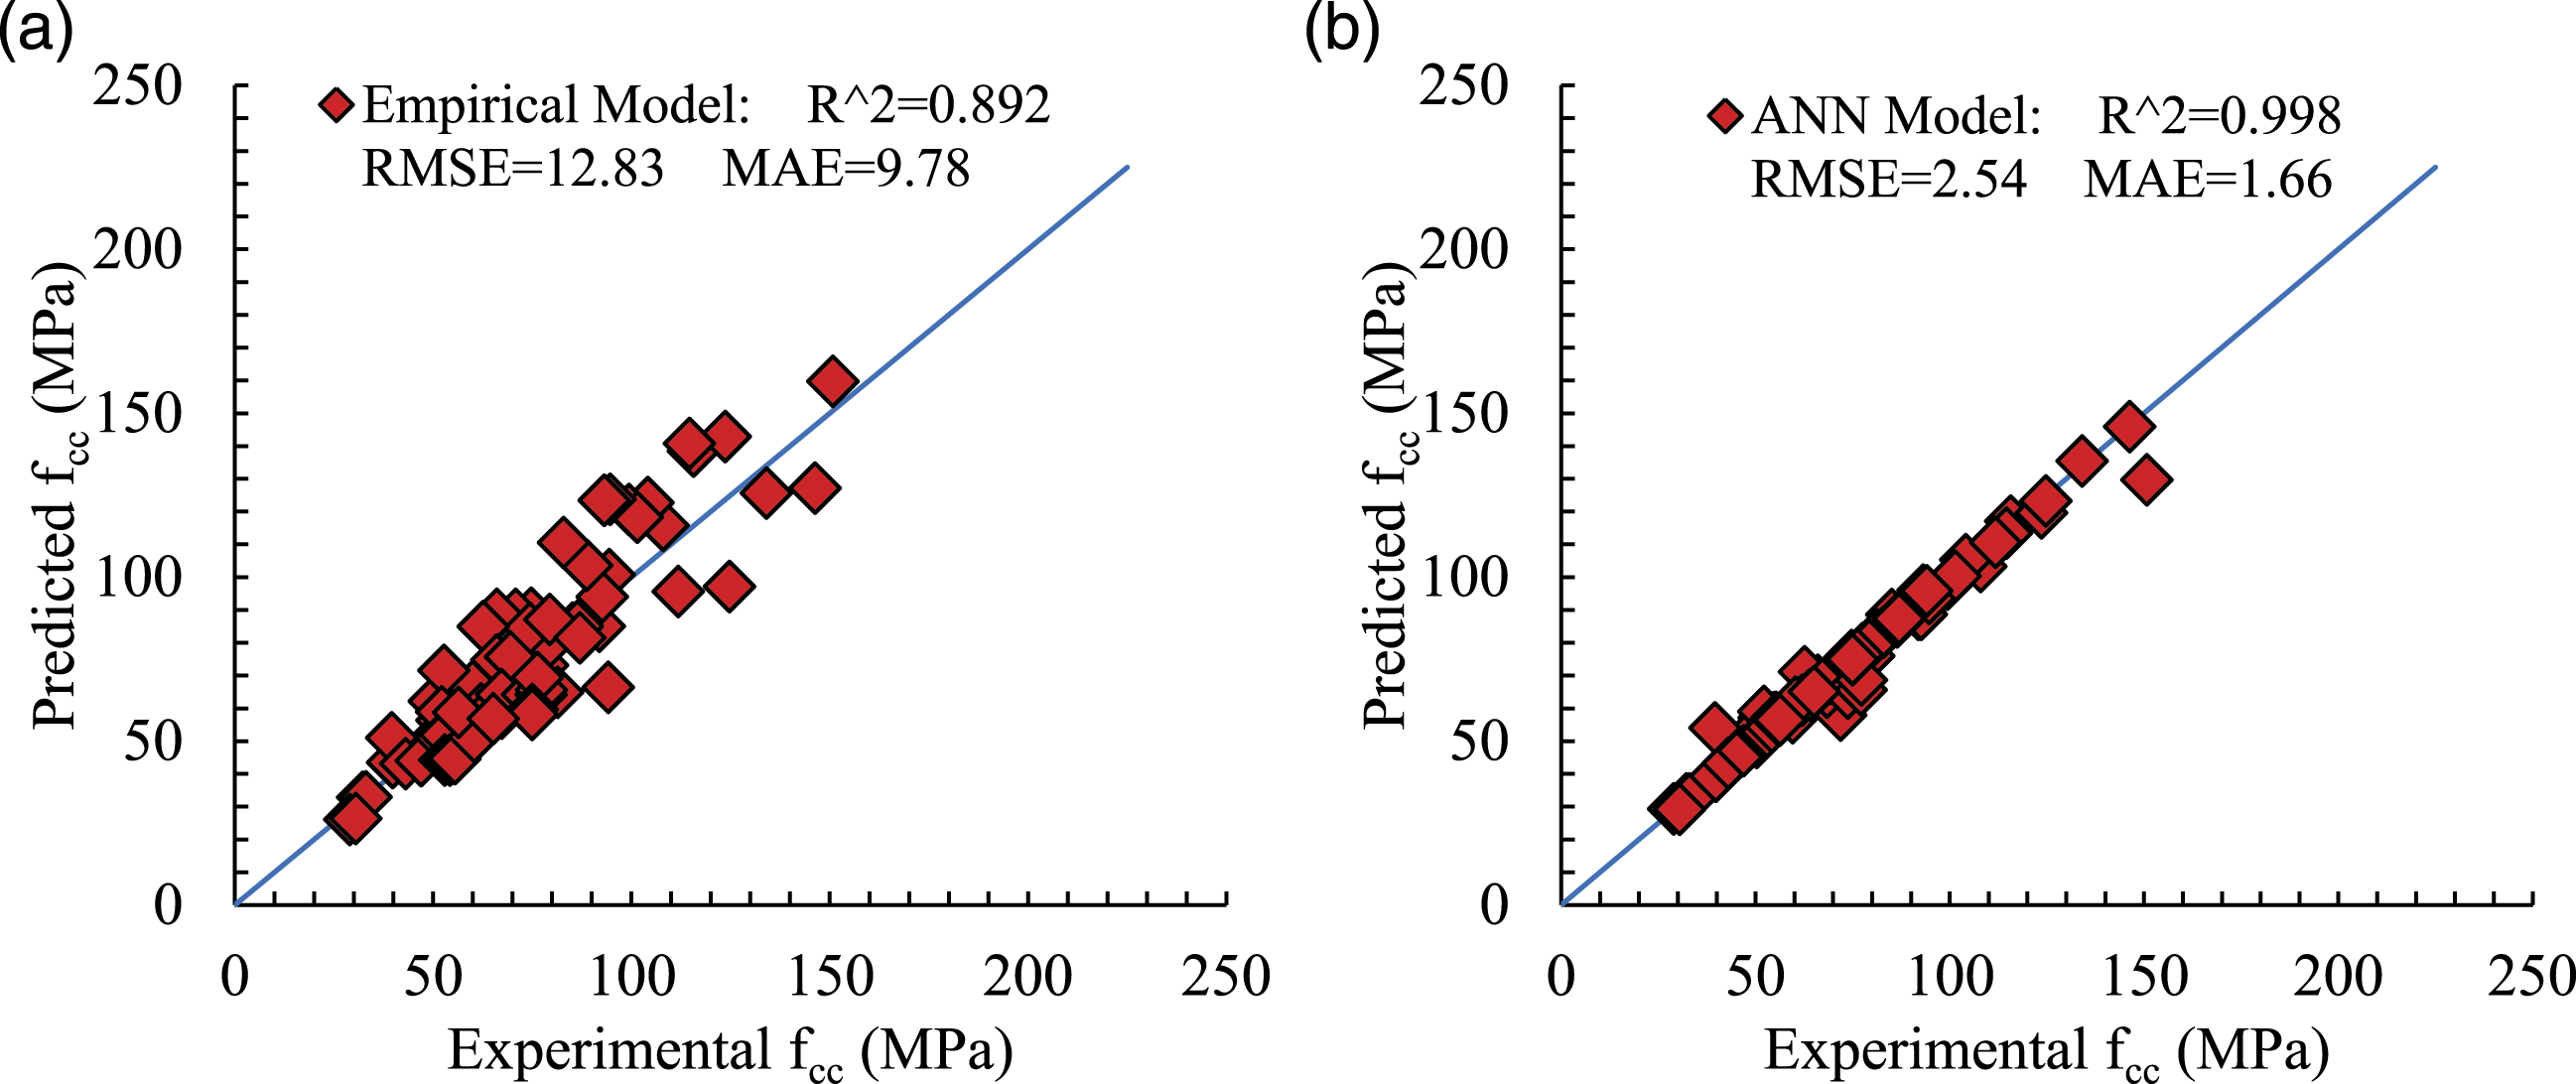
The assessment of the suggested NN and empirical equations for their predictions has been displayed in Figure 9. The proposed empirical model portrayed = 0.892, = 12.83, and = 9.78 and the suggested NN model depicted = 0.998, = 2.54, and = 1.66 which are better than all earlier empirical models of ALC of CSC columns. The lowest experimental value of was 29.07 MPa whereas the suggested empirical and NN models exhibited the lowest value of 26.07 MPa and 29.17 MPa, correspondingly. Similarly, the highest experimental value of was 150.8 MPa whereas the highest anticipated values of given by the suggested empirical and NN models were 159.72 MPa and 145.85 MPa, respectively. These differences indicate the errors of only 11.5% and 0.34% for the lowest value and 5.9% and 3.28% for the highest value of obtained from empirical and N models, respectively, as compared with the testing outcomes of the dataset.
Estimates of suggested models over the dataset for (a) empirical model (b) NN model.
By comparing the statistical indices obtained for the estimates of the empirical model for the ALC of CSC members, the value of is 89.2% which was greater than all other preceding empirical models for the ALC of CSC members. Similarly, concerning the statistical indices of the estimates of the anticipated NN strength model, the value of is 99.8% which was higher than all other previous NN models for the ALC of CSC members. The suggested equation is more accurate than the earlier models when the value of is used. On the other hand, the reduced values of the statistical errors ( and ) lead to the higher accuracy of the predictions. It can be seen that the projected models portrayed the reduced values of errors ( = 12.83 and = 9.78 for the empirical model, = 2.54 and = 1.66 for the NN model) as compared with the previously suggested equations.
Figure 10 presents the spreading of the ratios of wrapped to unwrapped strengths () secured from various equations including the proposed models. A total of 6 testing values of occur in the range 1–1.50, 48 values occur in 1.51–3.0, 20 values occur in 3.01–6, and 2 values occur in 6.01–200. The Eid and Paultre (2008) equation portrayed a good arrangement for the spreading of ratios but the other presentations and statistical indices for this equation were not as good as attained from the suggested equation. The suggested empirical equation depicted 4 values of in 1–1.50, 45 values in 1.51–3.0, 25 values in 3.01–6, and 2 values in 6.01–200. On the other hand, the suggested NN model showed 6 values of in 1–1.50, 51 values in 1.51–3.0, 17 values in 3.01–6, and 2 values in 6.01–200. The Shirmohammadi et al. (2015) equation depicted a high discrepancy from the testing results. All the ratios of present in 6.01–200. The greater deviations of this equation may be credited to the cause that the equation was suggested employing a small dataset points without explicitly authenticating the equation and considering the confining mechanism of TSR.
Distribution of the ratios of prophesied from various equations.
Figure 11 shows the normalized spreading of the ratios of testing to estimated strengths attained from different equations. The suggested empirical and NN models accomplished well for the normal distribution of with only 0.05% and 0.02% differences from unity, correspondingly. The higher the eccentricity from the unity, the higher the error in the estimates of the suggested model (Ahmad et al., 2020; Raza et al., 2020a, 2020b). The Eid and Paultre (Eid and Paultre 2008) equation also accomplished well for the normal distribution of with only 6% eccentricity from unity. Therefore, the suggested model described and authenticated the greater accuracy for the normal distribution of as associated with the earlier equations. The Shirmohammadi et al. (2015) model showed a week performance and described the highest eccentricity of 1823% from unity. This noteworthy eccentricity designates imprecision of the equation because this equation was recommended based on a small dataset without steadily authenticating it. The equations proposed by Hu and Seracino (2014), Chastre and Silva (2010), Lee et al. (2010), and Pellegrino and Modena (2010) portrayed the eccentricities of 11%, 25%, 21%, and 46% from unity.
Normal distribution for the estimations of different equations.
Comparison of predictions
The statistical constants for the predictions of the various models from the previous studies and the currently proposed models have been presented in Figure 12. The highest deviation for the constant of determination was observed for the model proposed by Shirmohammadi et al. (2015) with a value of only 0.36 in comparison with the predictions of proposed empirical and NN models having the values for this constant as 0.892 and 0.998, respectively.
Comparison of and RMSE of various previous models and proposed models.
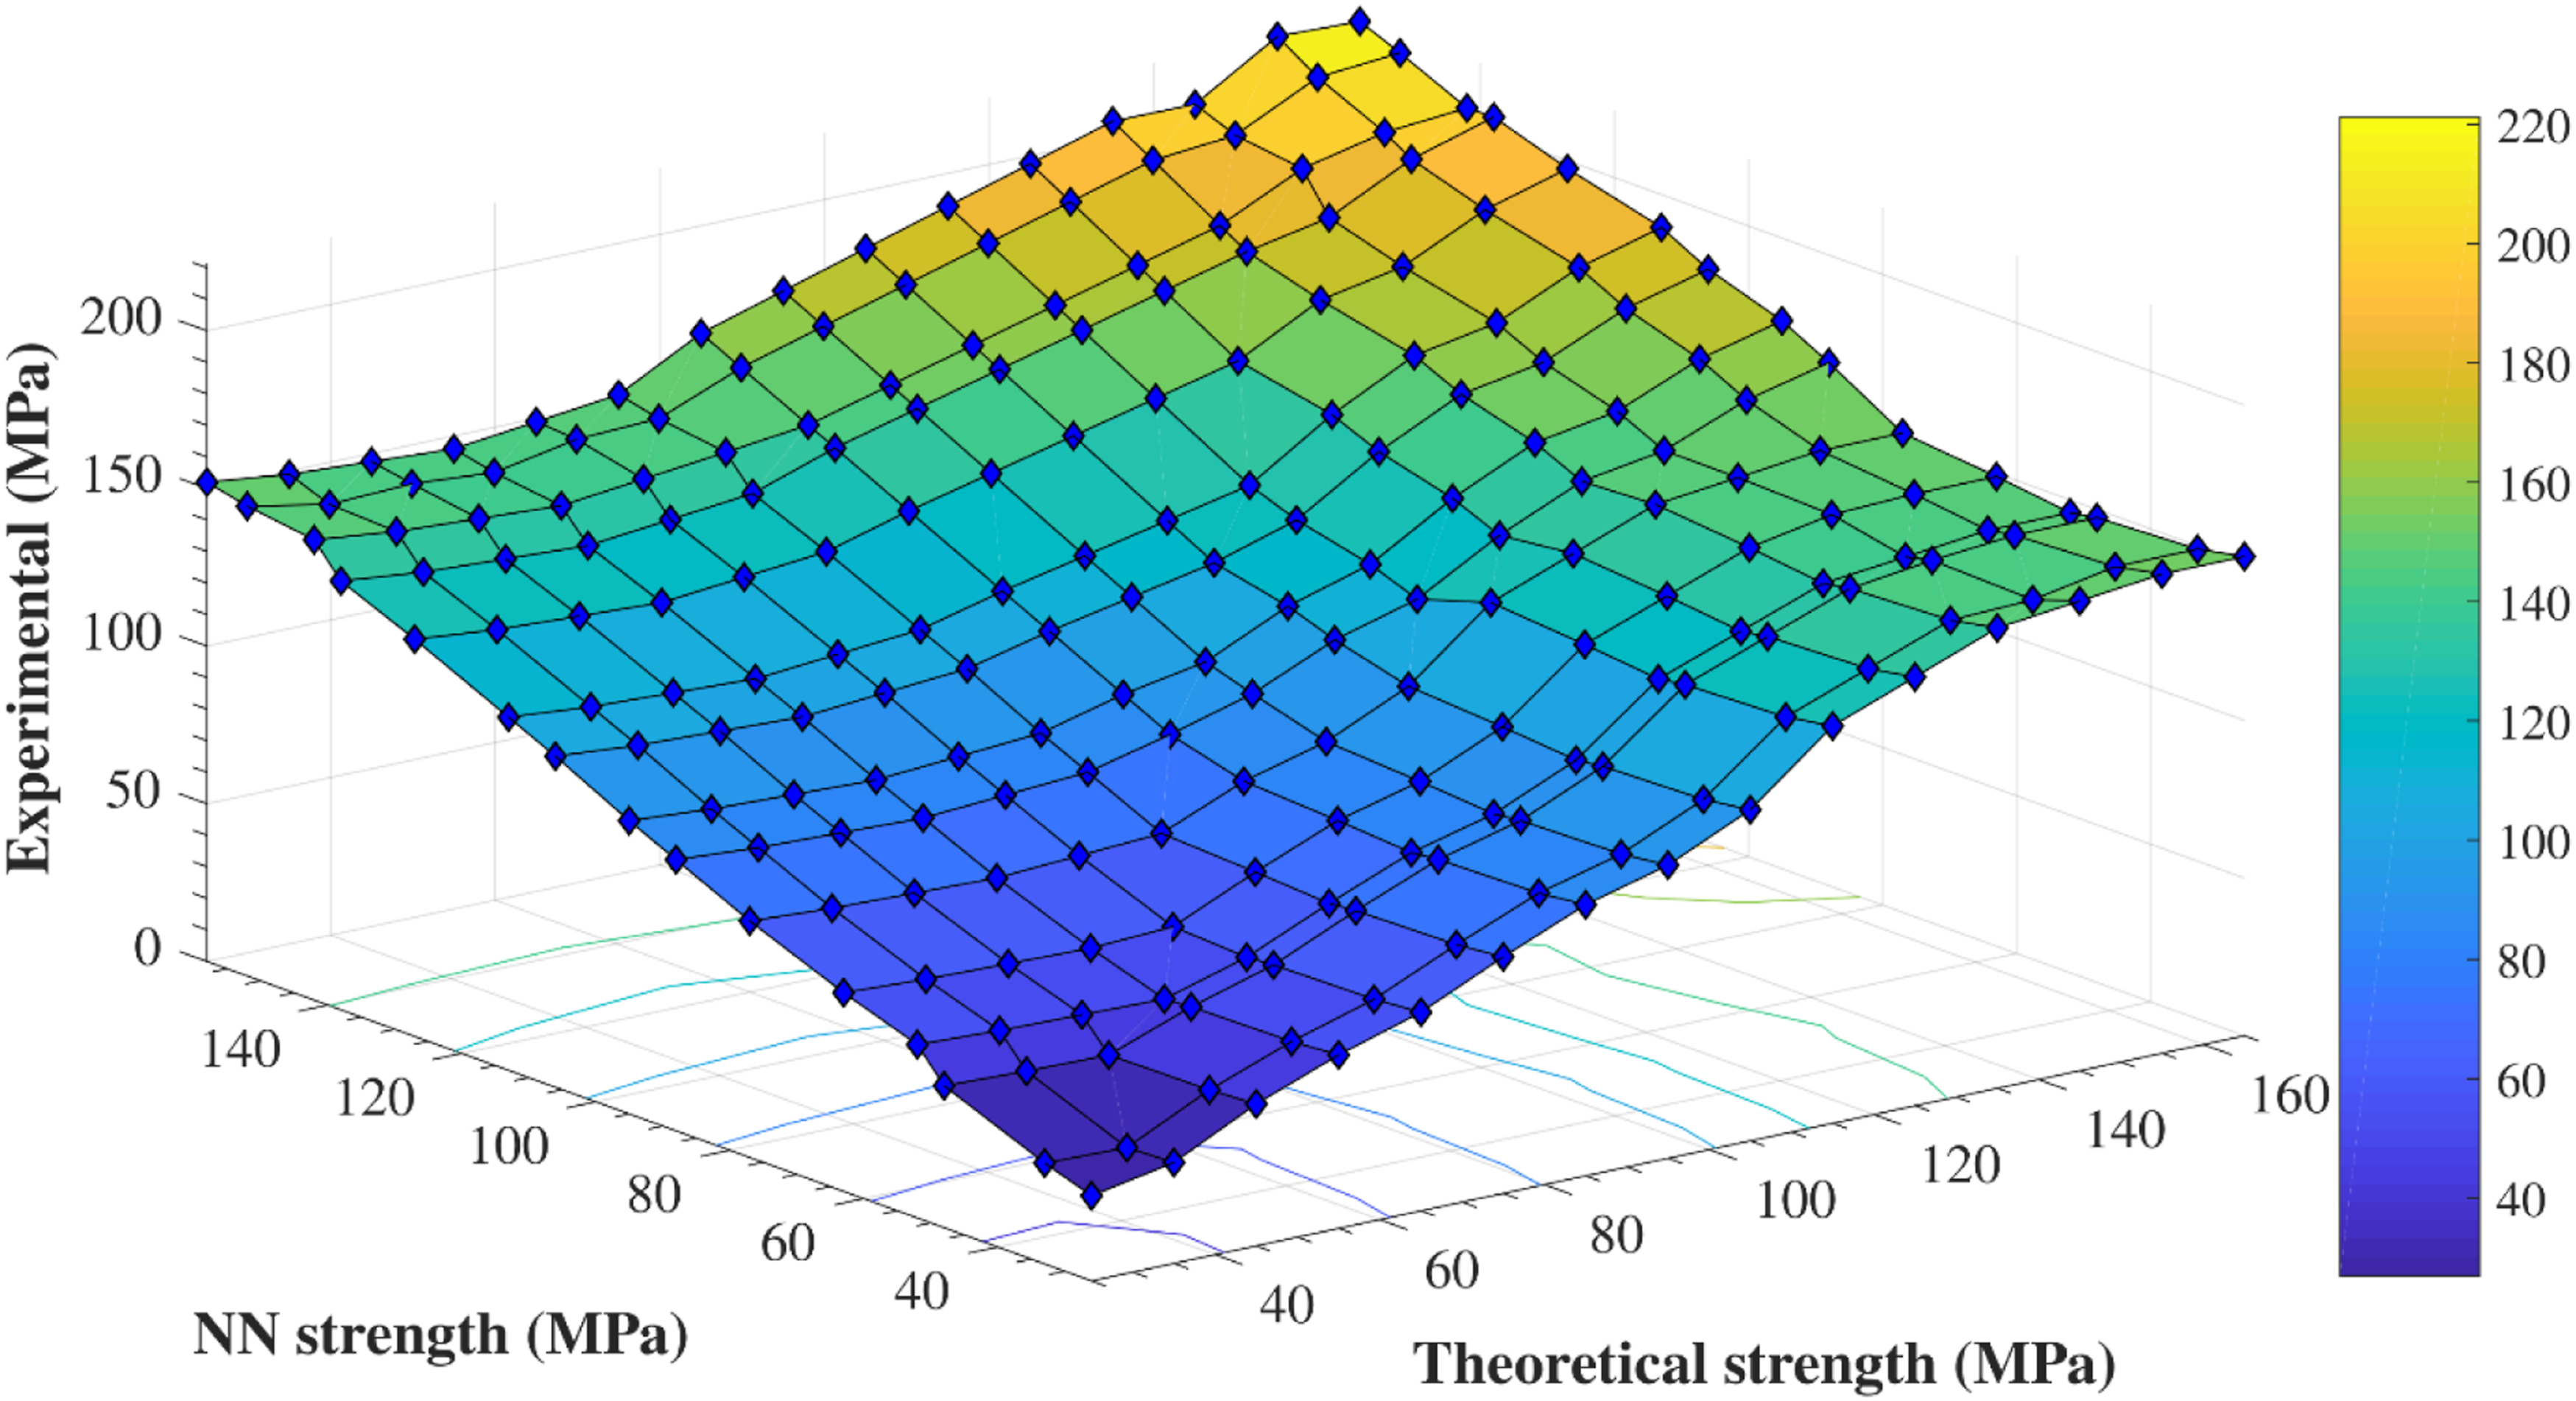
A comprehensive comparative investigation of the estimations of the recommended NN model, the estimations of the empirical model, and the testing outcomes for the ALC of CSC members have been presented in Figure 13. This comparative study represents that the estimations of both proposed models have good agreement with each other with = 0.944. The deviation between the average value of experimental outcomes of the database and that of estimations of the NN model was 0.65 MPa although the variance between the average value of experimental results of the dataset and empirical estimations was 1.96 MPa. These comparisons present that the accuracy of the suggested NN model is higher than that of the empirical model. Furthermore, the calibrated NN model showed the estimations with = 0.998, and the recommended empirical model showed the estimations with = 0.892 which validates the higher accuracy and dominance of the NN model over the empirical equation for the ALC of CSC members. Nevertheless, the estimations of both recommended models described a close agreement between themselves and the testing results.
Comparison between suggested models against experimental outcomes.
Conclusions
This investigation aims to develop the empirical and NN models for the ALC of circular NSC columns wrapped by CFRPs and internal TSR by involving the interaction between the CFRP wraps and the TSR confining mechanism. A dataset of 76 CSC specimens has been constructed from the literature studies for proposing these models with greater accuracy. The followings are the main findings of the current study:
The proposed model performed well over the developed database and presented the highest accuracy with = 0.892, = 12.83, and = 9.78 as compared with the previously recommended ALC models for NSC compressive members wrapped by CFRP sheets and internal TSR.
Eighteen different neural network models are suggested in the current investigation by changing the number of neurons and hidden layers. The optimal NN model (NN18) with 11 neurons in the 1st as well as 2nd hidden layer depicted the greater accuracy with = 0.998, = 2.54, and = 1.66.
The distribution of the predictions and the normal distribution of the ratio for different strength models sturdily authenticated the better performance and greater accuracy of the recommended empirical and NN models.
The comparative investigation between the estimations of empirical and NN models determined that the NN model described greater accuracy as equated to the empirical equation. The estimates of both empirical and NN models portrayed their correlation with = 0.944. Therefore, the proposed empirical and neural network models are accurate enough to be used for predicting the ALC of CSC columns during the analysis and design of such structural members.
Footnotes
Acknowledgements
The authors extend their appreciation to the Deanship of Scientific Research at King Khalid University for funding this work through the Small Groups Project under grant number R.G.P. 1/221/43.
Declaration of Conflicting Interests
The author(s) declared no potential conflicts of interest with respect to the research, authorship, and/or publication of this article.
Funding
The author(s) disclosed receipt of the following financial support for the research, authorship, and/or publication of this article: The authors extend their appreciation to the Deanship of Scientific Research at King Khalid University for funding this work through the Small Groups Project under grant number R.G.P. 1/221/43.
AhmadAKhanQUZRazaA (2020) Reliability analysis of strength models for CFRP-confined concrete cylinders. Composite Structures244: 112312.
2.
AlgburiAHSheikhMNHadiMN (2019) Analytical investigation on the behavior of circular and square RC columns strengthened with RPC and wrapped with FRP under uniaxial compression. Journal of Building Engineering25: 100833.
3.
AliLNawazABaiY, et al. (2020) Numerical Simulations of GFRP-Reinforced Columns Having Polypropylene and Polyvinyl Alcohol Fibers. Complexity14: 8841795.
4.
AliSAForthJP (2021) An experimental and analytical investigation of reinforced concrete beam-column joints strengthened with a range of CFRP schemes applied only to the beam. Advances in Structural Engineering24: 13694332211007371.
5.
Al-NimryHNeqreshM (2019) Confinement effects of unidirectional CFRP sheets on axial and bending capacities of square RC columns. Engineering Structures196: 109329.
6.
AshrafiHRJalalMGarmsiriK (2010) Prediction of load–displacement curve of concrete reinforced by composite fibers (steel and polymeric) using artificial neural network. Expert Systems with Applications37(12): 7663–7668.
7.
AslamHMUKhanQUZSamiA, et al. (2021) Axial compressive behavior of damaged steel and GFRP bars reinforced concrete columns retrofitted with CFRP laminates. Composite Structures258: 113206.
8.
BakbakDKurtoğluAE (2019) Shear resistance of reinforced aerated concrete slabs: prediction via artificial neural networks. Journal of Sustainable Construction Materials and Technologies4(2): 344–350.
9.
BenzaidRMesbahHChikhNE (2010) FRP-confined concrete cylinders: axial compression experiments and strength model. Journal of Reinforced plastics and composites29(16): 2469–2488.
10.
BerradiaMKassoulA (2018) Ultimate strength and strain models proposed for CFRP confined concrete cylinders. Steel and Composite Structures29(4): 465–481.
11.
CaoSWuCWangW (2020) Behavior of FRP confined UHPFRC-filled steel tube columns under axial compressive loading. Journal of Building Engineering32: 101511.
12.
CascardiAMicelliFAielloMA (2017) An Artificial Neural Networks model for the prediction of the compressive strength of FRP-confined concrete circular columns. Engineering Structures140: 199–208.
13.
CastellanoGFanelliAM (2000) Variable selection using neural-network models. Neurocomputing31(1–4): 1–13.
14.
CevikACabalarAF (2008) A genetic programming based formulation for the strength enhancement of fiber reinforced polymer confined concrete cylinders. Journal of applied polymer science110(5): 3087–3095.
15.
CevikAGöğüşMTGüzelbeyİH, et al. (2010) Soft computing based formulation for strength enhancement of CFRP confined concrete cylinders. Advances in Engineering Software41(4): 527–536.
16.
CevikAGuzelbeyIH (2008) Neural network modeling of strength enhancement for CFRP confined concrete cylinders. Building and Environment43(5): 751–763.
17.
ChastreCSilvaMA (2010) Monotonic axial behavior and modelling of RC circular columns confined with CFRP. Engineering Structures32(8): 2268–2277.
18.
CladeraAMariAR (2004a) Shear design procedure for reinforced normal and high-strength concrete beams using artificial neural networks Part II: beams with stirrups. Engineering structures26(7): 927–936.
19.
CladeraAMariAR (2004b) Shear design procedure for reinforced normal and high-strength concrete beams using artificial neural networks. Part I: beams without stirrups. Engineering Structures26(7): 917–926.
20.
CuiCSheikhS (2010) Analytical model for circular normal-and high-strength concrete columns confined with FRP. Journal of Composites for Construction14(5): 562–572.
21.
EidRPaultreP (2008) Analytical model for FRP-confined circular reinforced concrete columns. Journal of Composites for Construction12(5): 541–552.
22.
El OuniMHRazaA (2021) Data-driven analysis of concrete-filled steel-tube CFRP-confined NSC columns. Mechanics of Advanced Materials and Structures: 1–22. Online ahead of print.
23.
El-KashifKFOHazemA-RRozikMA, et al. (2020) Strengthening of deficient reinforced concrete columns subjected to concentric and eccentric loads. Advances in Structural Engineering23(7): 1322–1335.
24.
ElsanadedyHAl-SalloumYAAbbasH, et al. (2012) Prediction of strength parameters of FRP-confined concrete. Composites Part B: Engineering43(2): 228–239.
25.
FahmyMFWuZ (2010) Evaluating and proposing models of circular concrete columns confined with different FRP composites. Composites Part B: Engineering41(3): 199–213.
26.
FerrottoMFFischerONiedermeierR (2018) Experimental investigation on the compressive behavior of short term preloaded carbon fiber reinforced polymer confined concrete columns. Structural Concrete19(4): 988–1001.
27.
GracianoCKurtogluAECasanovaE (2021) Machine Learning Approach for Predicting the Patch Load Resistance of Slender Austenitic Stainless Steel Girders. Structures30: 198–205. Elsevier.
28.
GuoZXueXYeM, et al. (2021) Experimental research on pultruded concrete-filled GFRP tubular short columns externally strengthened with CFRP. Composite Structures255: 112943.
29.
HadhoodAMBenmokraneBNanniA, et al. (2019) Assessment of design guidelines of concrete columns reinforced with glass fiber-reinforced polymer bars. ACI Structural Journal116(4): 193–207.
30.
HarajliMH (2006) Axial stress–strain relationship for FRP confined circular and rectangular concrete columns. Cement and Concrete Composites28(10): 938–948.
31.
HarajliMHHantoucheESoudkiK (2006) Stress-strain model for fiber-reinforced polymer jacketed concrete columns. Structural Journal103(5): 672–682.
32.
HuHSeracinoR (2014) Analytical model for FRP-and-steel-confined circular concrete columns in compression. Journal of Composites for Construction18(3): A4013012.
33.
HuangJLiTZhuD, et al. (2020) Compressive behavior of circular and square concrete column externally confined by different types of basalt fiber–reinforced polymer. Advances in Structural Engineering23(8): 1534–1547.
34.
IlkiAKumbasarNKocV (2004) Low strength concrete members externally confined with FRP sheets. Structural Engineering and Mechanics18(2): 167–194.
35.
IlkiAPekerOKaramukE, et al. (2008) FRP retrofit of low and medium strength circular and rectangular reinforced concrete columns. Journal of Materials in Civil Engineering20(2): 169–188.
36.
İşleyenÜKGhoroubiRMercimekÖ, et al. (2021) Effect of anchorage number and CFRP strips length on behavior of strengthened glulam timber beam for flexural loading. Advances in Structural Engineering24: 1369433220988622.
KaesebergSMessererDHolschemacherK (2020) Experimental study on concrete under combined FRP–steel confinement. Materials13(20): 4467.
39.
KawashimaKHosotaniMYonedaK (2000) Carbon fiber sheet retrofit of reinforced concrete bridge piers Proc. In: Int. Workshop on Annual Commemoration of Chi-Chi Earthquake. Taiwan, ROC: National Center for Research on Earthquake Engineering Taipei.
40.
KeshtegarBGholampourAOzbakkalogluT, et al. (2020) Reliability analysis of FRP-confined concrete at ultimate using conjugate search direction method. Polymers12(3): 707.
41.
KhanQSSheikhMNHadiMN (2020) Experimental results of circular FRP tube confined concrete (CFFT) and comparison with analytical models. Journal of Building Engineering29: 101157.
42.
KroghAVedelsbyJ (1995) Neural network ensembles, cross validation, and active learning. Advances in Neyral Information Processing Systems7: 21–238.
43.
KurtoğluAEAnilÖÇevikA (2022) A Machine learning based Constitutive Bond slip Model for Anchored CFRP Strips Externally Bonded on Concrete Members. Structural Concrete23: 1828–1844.
44.
LamLTengJ (2003) Design-oriented stress–strain model for FRP-confined concrete. Construction and building materials17(6–7): 471–489.
45.
LamLTengJ (2004) Ultimate condition of fiber reinforced polymer-confined concrete. Journal of Composites for Construction8(6): 539–548.
46.
LamLTengJCheungC, et al. (2006) FRP-confined concrete under axial cyclic compression. Cement and Concrete Composites28(10): 949–958.
47.
LeCunYABottouLOrrGB, et al. (2012) Efficient Backprop Neural Networks: Tricks of the Trade. Berlin, Germany: Springer, pp. 9–48.
48.
LeeJ-YYiC-KJeongH-S, et al. (2010) Compressive response of concrete confined with steel spirals and FRP composites. Journal of Composite Materials44(4): 481–504.
49.
LiSJiaoC-J (2021) Behavior of CFRP-confined reactive powder concrete-filled steel tubes under axial compression. Advances in Structural Engineering24(7): 1368–1383.
50.
LiYFangTChernC (2003) A constitutive model for concrete cylinder confined by steel reinforcement and carbon fibre sheet Proc. In: Pacific Conf. On Earthquake Engineering. New Zealand: Univ. of Canterbury Christchurch.
51.
LimJCOzbakkalogluT (2014) Design model for FRP-confined normal-and high-strength concrete square and rectangular columns. Magazine of Concrete Research66(20): 1020–1035.
52.
LinGTengJ (2019) Stress-strain model for FRP-confined concrete in eccentrically loaded circular columns. Journal of Composites for Construction23(3): 04019017.
53.
ManderJBPriestleyMJParkR (1988) Theoretical stress-strain model for confined concrete. Journal of structural engineering114(8): 1804–1826.
54.
MirmiranAShahawyMSamaanM, et al. (1998) Effect of column parameters on FRP-confined concrete. Journal of Composites for construction2(4): 175–185.
55.
NaderpourHNagaiKHajiMMirrashidM (2019a) Adaptive neuro fuzzy inference modeling and sensitivity analysis for capacity estimation of fiber-reinforced polymer strengthened circular reinforced concrete columns. Expert Systems36(4): e12410.
56.
NaderpourHNagaiKFakharianPHajiM (2019b) Innovative models for prediction of compressive strength of FRP-confined circular reinforced concrete columns using soft computing methods. Composite Structures215: 69–84.
57.
NaderpourHKheyroddinAAmiriGG (2010) Prediction of FRP-confined compressive strength of concrete using artificial neural networks. Composite Structures92(12): 2817–2829.
58.
ObaidatYTAshteyatAMAlfarisSF (2020) A new technique for repairing reinforced concrete columns. Journal of Building Engineering30: 101256.
59.
OzbakkalogluTLimJC (2013) Axial compressive behavior of FRP-confined concrete: experimental test database and a new design-oriented model. Composites Part B: Engineering55: 607–634.
60.
PellegrinoCModenaC (2010) Analytical model for FRP confinement of concrete columns with and without internal steel reinforcement. Journal of Composites for Construction14(6): 693–705.
61.
PhamTMHadiMNS (2014) Predicting stress and strain of FRP-confined square/rectangular columns using artificial neural networks. Journal of Composites for Construction18(6): 04014019.
62.
PourAFGholampourAOzbakkalogluT (2018) Influence of the measurement method on axial strains of FRP-confined concrete under compression. Composite Structures188: 415–424.
63.
PourAFGholampourAZhengJ, et al. (2019) Behavior of FRP-confined high-strength concrete under eccentric compression: tests on concrete-filled FRP tube columns. Composite Structures220: 261–272.
64.
RafiqueUAliARazaA (2021) Structural behavior of GFRP reinforced recycled aggregate concrete columns with polyvinyl alcohol and polypropylene fibers. Advances in Structural Engineering24: 13694332211017997.
65.
RazaARafiqueU (2020) Efficiency of GFRP bars and hoops in recycled aggregate concrete columns: experimental and numerical study. Composite Structures255: 112986.
66.
RazaAManaloACRafiqueU, et al. (2021a) Concentrically loaded recycled aggregate geopolymer concrete columns reinforced with GFRP bars and spirals. Composite Structures268: 113968.
67.
RazaAAliBMasoodB, et al. (2021b) Axial Performance of GFRP Composite Bars and Spirals in Circular Hollow Concrete Columns. Structures29: 600–613. Elsevier.
68.
RazaAAliBNawazMA, et al. (2020a) Structural performance of FRP-RC compression members wrapped with FRP composites. Structures27: 1693–1709.
69.
RazaAKhanQAhmadA (2019) Numerical investigation of load-carrying capacity of GFRP-reinforced rectangular concrete members using CDP model in ABAQUS. Advances in Civil Engineering2019: 1745341.
70.
RazaAKhanQAhmadA (2021c) Investigation of HFRC columns reinforced with GFRP bars and spirals under concentric and eccentric loadings. Engineering Structures227: 111461.
71.
RazaAShahSARHaqF, et al. (2020b) Prediction of axial load-carrying capacity of GFRP-reinforced concrete columns through artificial neural networks. Structures28: 1557–1571.
72.
RichardRMAbbottBJ (1975) Versatile elastic-plastic stress-strain formula. Journal of the Engineering Mechanics Division101(4): 511–515.
73.
RousakisTCRakitzisTDKarabinisAI (2012) Design-oriented strength model for FRP-confined concrete members. Journal of Composites for Construction16(6): 615–625.
74.
SadeghianPFamA (2015) Improved design-oriented confinement models for FRP-wrapped concrete cylinders based on statistical analyses. Engineering Structures87: 162–182.
75.
ShahawyMMirmiranABeitelmanT (2000) Tests and modeling of carbon-wrapped concrete columns. Composites Part B: Engineering31(6–7): 471–480.
76.
ShirmohammadiFEsmaeilyAKiaeipourZ (2015) Stress–strain model for circular concrete columns confined by FRP and conventional lateral steel. Engineering Structures84: 395–405.
77.
SmithSTKimSJZhangH (2010) Behavior and effectiveness of FRP wrap in the confinement of large concrete cylinders. Journal of Composites for Construction14(5): 573–582.
78.
SonebiMGrünewaldSCevikA, et al. (2016) Modelling fresh properties of self-compacting concrete using neural network technique. Computers and Concrete18(4): 903–920.
79.
SpoelstraMRMontiG (1999) FRP-confined concrete model. Journal of composites for construction3(3): 143–150.
80.
TengJLinGYuT (2015) Analysis-oriented stress-strain model for concrete under combined FRP-steel confinement. Journal of Composites for Construction19(5): 04014084.
81.
TengJJiangTLamL, et al. (2009) Refinement of a design-oriented stress–strain model for FRP-confined concrete. Journal of Composites for Construction13(4): 269–278.
82.
TuJGaoKHeL, et al. (2019) Experimental study on the axial compression performance of GFRP-reinforced concrete square columns. Advances in Structural Engineering22(7): 1554–1565.
83.
UtansJMoodyJRehfussS, et al. (1995) Input variable selection for neural networks: application to predicting the U.S. Business cycle. In: IEEE Transactions on Knowledge and Data Engineering. Piscataway, NJ: IEEE. pp. 118–122.
84.
WangQ-lLiJShaoY-b, et al. (2015) Flexural performances of square concrete filled CFRP-steel tubes (S-CF-CFRP-ST). Advances in Structural Engineering18(8): 1319–1344.
85.
WangZWangDSmithST, et al. (2012) Experimental testing and analytical modeling of CFRP-confined large circular RC columns subjected to cyclic axial compression. Engineering Structures40: 64–74.
86.
WuY-FLiuTOehlersDJ (2006) Fundamental principles that govern retrofitting of reinforced concrete columns by steel and FRP jacketing. Advances in Structural Engineering9(4): 507–533.
87.
XiaoYWuH (2003) Compressive behavior of concrete confined by various types of FRP composite jackets. Journal of Reinforced Plastics and Composites22(13): 1187–1201.
88.
YinPHuangLYanL, et al. (2016) Compressive behavior of concrete confined by CFRP and transverse spiral reinforcement. Part A: experimental study. Materials and Structures49(3): 1001–1011.
89.
YoussefMNFengMQMosallamAS (2007) Stress–strain model for concrete confined by FRP composites. Composites Part B: Engineering38(5–6): 614–628.
90.
YoussfOHassanliRMillsJE (2017) Mechanical performance of FRP-confined and unconfined crumb rubber concrete containing high rubber content. Journal of Building Engineering11: 115–126.
91.
ZengJ-JZhangX-WChenG-M, et al. (2020) FRP-confined recycled glass aggregate concrete: concept and axial compressive behavior. Journal of Building Engineering30: 101288.
92.
ZengYLiXAliAH, et al. (2021) Comparative study on the flexural strengthening of RC beams using EB CFRP sheets, NSM CFRP bars, P-SWRs, and their combinations. Advances in Structural Engineering24(5): 1009–1023.
93.
ZhangBZhaoJ-LHuangT, et al. (2020) Effect of fiber angles on hybrid fiber-reinforced polymer–concrete–steel double-skin tubular columns under monotonic axial compression. Advances in Structural Engineering23(7): 1487–1504.
94.
ZhuZAhmadIMirmiranA (2005) Effect of column parameters on axial compression behavior of concrete-filled FRP tubes. Advances in Structural Engineering8(4): 443–449.