



Abstract
Responses of vortex-induced vibration (VIV) of long-span bridges are commonly measured at first via wind tunnel tests of sectional model and then converted to the prototype ones of the corresponding full bridges by some approximate formulae. In this paper, a time-domain full bridge analysis method was presented for predicting nonlinear VIV responses mode-by-mode based on a polynomial type of nonlinear mathematical model of vortex-induced force (VIF) on bridge deck cross section. In this method, the motion-dependant self-excited force (SEF) components of VIF were regarded as fully correlated span-wise in the case of smooth flow, while the motion-independent harmonic pure vortex-shedding force (PVSF) component of VIF was regarded as incompletely correlated along the bridge span. To take into account the incomplete span-wise correlation of PVSF, an equivalent generalized PVSF including the effect of the incomplete span-wise correlation of PVSF was defined by using a span-wise correlation coefficient of PVSF which could be obtained through a sectional model wind tunnel test of simultaneous pressure measurement. As an application example, the VIV responses of 12 vertical modes of a steel box deck cable stayed bridge with a main span of 688 m were analysed, and were compared with those converted with two approximate converting formulae, respectively, based on Scanlan’s linear and nonlinear mathematical model of VIF. It is found that the influence of the incomplete span-wise correlation of PVSF on the bridge VIV response is very small and can then be ignored.
Keywords
Introduction
Steel closed box deck has been recognized as having good aerodynamic performance against flutter instability, and thus widely adopted in the construction of long-span bridges. However, it is also prone to vortex-induced resonance (VIV), such as observed on the Ishikari Kako Bridge in Japan (Bureden, 1991), the Storebelt Bridge in Danmark (Larsen et al., 2000), the Second Severn Crossing in the UK (Macdonald et al., 2002), the Xihoumen Bridge in China (Li et al., 2011, 2014), the Trans-Tokyo Bay crossing bridge in Japan (Fujino and Yoshida, 2002), the Yi Sun-sin Bridge in Korean (Hwang et al., 2020), and recently happened on the Humen bridge in China in May 2020 (Ge et al., 2022; Zhao et al., 2022), etc. Although VIV is not a catastrophic wind-induce vibration but a self-limited vibration with less destructivity, frequent VIVs with significant amplitudes will cause not only fatigue problems to structures but also discomfort problems to drivers or pedestrians. Thus, VIV of long-span bridges must be taken seriously and controlled within an acceptable level of amplitude in the design stage, requiring an accurate or reasonable prediction of VIV responses.
Because the aeroelastic nonlinearity mechanism of bridge VIV has not been understood very clearly, and the VIV analysis theory has not been well developed, prediction on bridge VIV responses has commonly depended on wind tunnel tests for many decades. Wind tunnel tests of full bridge aeroelastic model are occasionally used for the prediction on VIV responses only if the concerned bridges are not very large and the wind tunnels used for the tests are large enough. Otherwise, the geometrical fine details of small appurtenant components of the concerned bridges, such as handrails, crashbarriers, overhaul-dolly rails, flow deflectors, etc., which may exert significant roles on the VIV performance, are generally difficult to be simulated precisely at small length scales below 1/100. Therefore, wind tunnel tests of sectional model at relatively large length scales, generally between 1/20-1/80, has retained, and will retain a central role in practice of VIV prediction of long-span bridges for more years yet (Irwin 1998). A so-called “3D vibration effect of whole bridge”, containing both coupling effects from the vibrations of bridge components other than the deck and from the vibrations of all bridge components including the deck in all degree of freedoms, on the VIV responses can be considered in the sectional model tests via taking the following equivalent mass (

However, the mode shape of the sectional model is uniform along its longitudinal axis and is totally different from the mode shape of the prototype bridge deck, which varies along its longitudinal axis. The question hence comes how to determine the maximal VIV amplitude of the prototype bridge deck based on the measured VIV amplitude in the sectional model test.
By considering only the pure vortex shedding component and ignoring the aeroelastic self-excited force (SEF) components in the vortex-induced force (VIF), Irwin (1998) first established a conversion relation between the non-dimensional VIV amplitudes of the sectional model and the prototype bridge,


Larsen (COWI, 2003a, 2003b) pointed out that the VIV amplitude of the prototype bridge is equal to that of the sectional model if the aeroelastic component of VIF is ignored and the following equivalent mass is simulated of in the wind tunnel test.

This means that the correction of the VIV response with

Zhu (2005) also pointed out that the equivalent mass as shown in equation (1) should be used in the simulation of model mass to meet the similarity of the aeroelastic effect. Similar to Zhu’s work, Zhang and Chen (2011) deduced more complicated conversion relationships based on the Scanlan’s nonlinear model (Simiu and Scanlan, 1996) and Larsen’s generalized nonlinear model (Larsen, 1995) of VIF, as shown in equations (6) and (7), to consider the nonlinear effect of aeroelastic SEF. The corresponding correction coefficients of mode shape can be expressed as equation (8), where, ν is a shape parameter for non-linear behaviour of VIF, and equals to 1 for the Scanlan’s nonlinear model, otherwise for Larsen’s generalized nonlinear model.
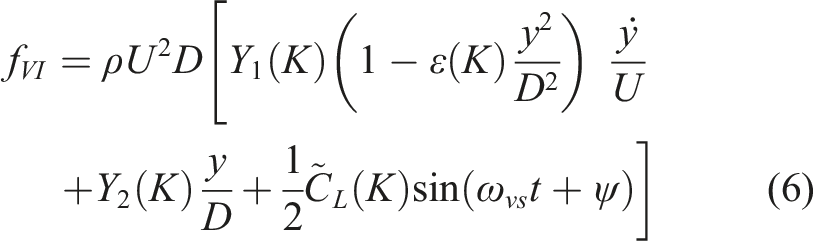


Zhou et al. (2020) presented the following conversion relationship based on cubic polynomial modal of VIF for the case that the modal damping ratios of the sectional model and the prototype bridge are not consistent.
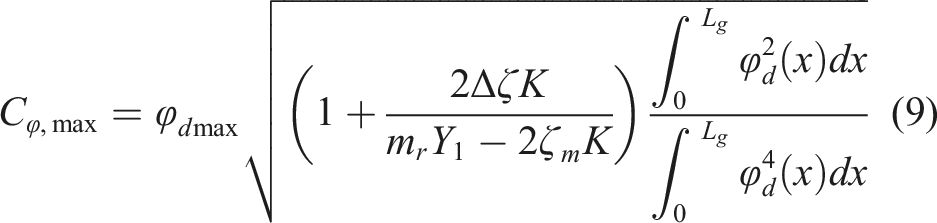
Based on a multi-point elastic supported continuous beam wind tunnel test and a strip model wind tunnel test, Zhou et al. (2017) and Zhang et al. (2022) separately investigated the combined three-dimensional (3D) effects due to mode shape and imperfect correlation of excitation forces on VIV, directly via wind tunnel test method. A comprehensive correction factor, regarding both mode shape and span-wise correlation effect, of about 1.1 to 1.3, for the VIV amplitude was proposed for practical use when extrapolating the section-model results to their full-scale values.
Another way to determine the maximal VIV amplitude of the prototype bridge deck is to carry out a full bridge analysis of VIV based on a proper mathematical model of VIF. Ehsan and Scanlan (1990) proposed a full-bridge analysis method of VIV based on the Scanlan’s nonlinear model. To consider the effect of incomplete span-wise correlation of VIF, the parameters of SEF,
Barhoush et al. (1995) established a time domain FEM approach for full-bridge VIV analysis also based on Scanlan’s nonlinear model of VIF. Diana et al. (2006) also presented a FEM approach for full-bridge VIV analysis by embedding equivalent oscillators, simulating the flow vortices shedding from the deck, into the FEM model. Zhu et al. (2018) proposed a mode-by-mode analysis method for VIV responses of long-span bridges under non-uniformly distributed turbulent winds by ignoring the contribution of PVSF. Zhang et al. (2020) also conducted full-bridge VIV analyses of a cable-stayed bridge and a suspension bridge by a mode-by-mode approach when comparing the predicative capabilities of various types of VIF models, where, a 4:1 rectangular cylinder was taken as the decks of the two bridges. However, in all the above-mentioned full-bridge VIV analyses, the VIF was assumed to be fully correlated along bridge span. The effect of the incomplete span-wise correlation of VIF and PVSF on the VIV response were not considered.
Sun et al. (2019) carried out a systematic investigation on the span-wise correlation of VIFs on typical bluff bodies, including a 4:1 (width-to-depth ratio) rectangular (REC) cylinder, a 3.6:1 trapezoidal (TRA) box girder similar with the girder of Great Belt East Bridge and a 8.5:1 flat streamlined (STR) box girder. The results show that with the increase of the oscillation amplitude of VIV, the span-wise correlation of the total VIF enhances to some extent for the TRA and STR girders, while weakens to some degrees for the REC cylinder. Furthermore, the test results also indicate that the span-wise correlation of the total VIF during VIV will increase as the section configuration evolves from blunt body to streamline body. The phenomena that structural motion may enhance the span-wise correlation of VIF on a similar flat STR girder of about 9.1:1 width-to-depth ratio, a centrally-slotted box girder and a 5:1 width-to-depth ratio REC girder has also been reported by Meng et al. (2015), Zhu et al. (2017) and Zhang et al. (2022), respectively.
From the viewpoint of aerodynamics and aeroelastic, it is obvious that the SEF component will increase with the increase of vibration amplitude as well as with the increase of the width-to-depth ratio of the girder. Meanwhile, the action of shedding vortices on the girder will weaken with the increase of vibration amplitude due to the disturbance from girder vibration, also with the enhancement of the streamline characteristics of girders. Furthermore, the synchronism of vortex shedding along girder span can also be reduced due to the disturbance from girder vibration.
It can then be inferred that the proportion of SEF component in the total VIF on the REC girder with a 4:1 or smaller width-to-depth ratio should be quite low and the spanwise correlation property of VIF will be dominated by that of its PVSF component. Thus, the span-wise correlation of VIF as well as PVSF on the 4:1 REC girder weakens with the increase of vibration amplitude.
Contrarily, for the TRA and STR girder, the proportion of SEF component in the total VIF should significantly rise while the proportion of PSVF drops remarkably because their streamline properties become much better. Thus, the span-wise correlation of the VIFs on these two kinds of girders enhanced with the increase of vibration amplitude as well as with the enhancement of the streamline characteristics of girder.
Further noticing that the span-wise correlation coefficients of VIF exceed 0.9, even approach 1.0 for flat STR girders (Meng et al., 2015; Sun et al., 2019) and a centrally-slotted girder (Zhu et al., 2017), it is thus reasonable to regard the SEF component of VIF as fully correlated along the girder span, and to attribute the span-wise incomplete correlation behaviour of VIF to the span-wise incomplete correlation of PSVF. Based on this assumption, Meng et al. (2015) extracted the span-wise correlation coefficient of PVSF from that of the total VIF and found that the span-wise of PVSF was rather poor. Therefore, it is better to separately consider the span-wise correlation properties of the SEF and PVSF in full-bridge VIV analysis. To this end, a mode-by-mode full-bridge VIV analysis approach was developed by assuming the SEF being fully correlated in span-wise direction and considering the effect of the span-wise incomplete correlation effect of PVSF individually.
Background bridge
Basic information
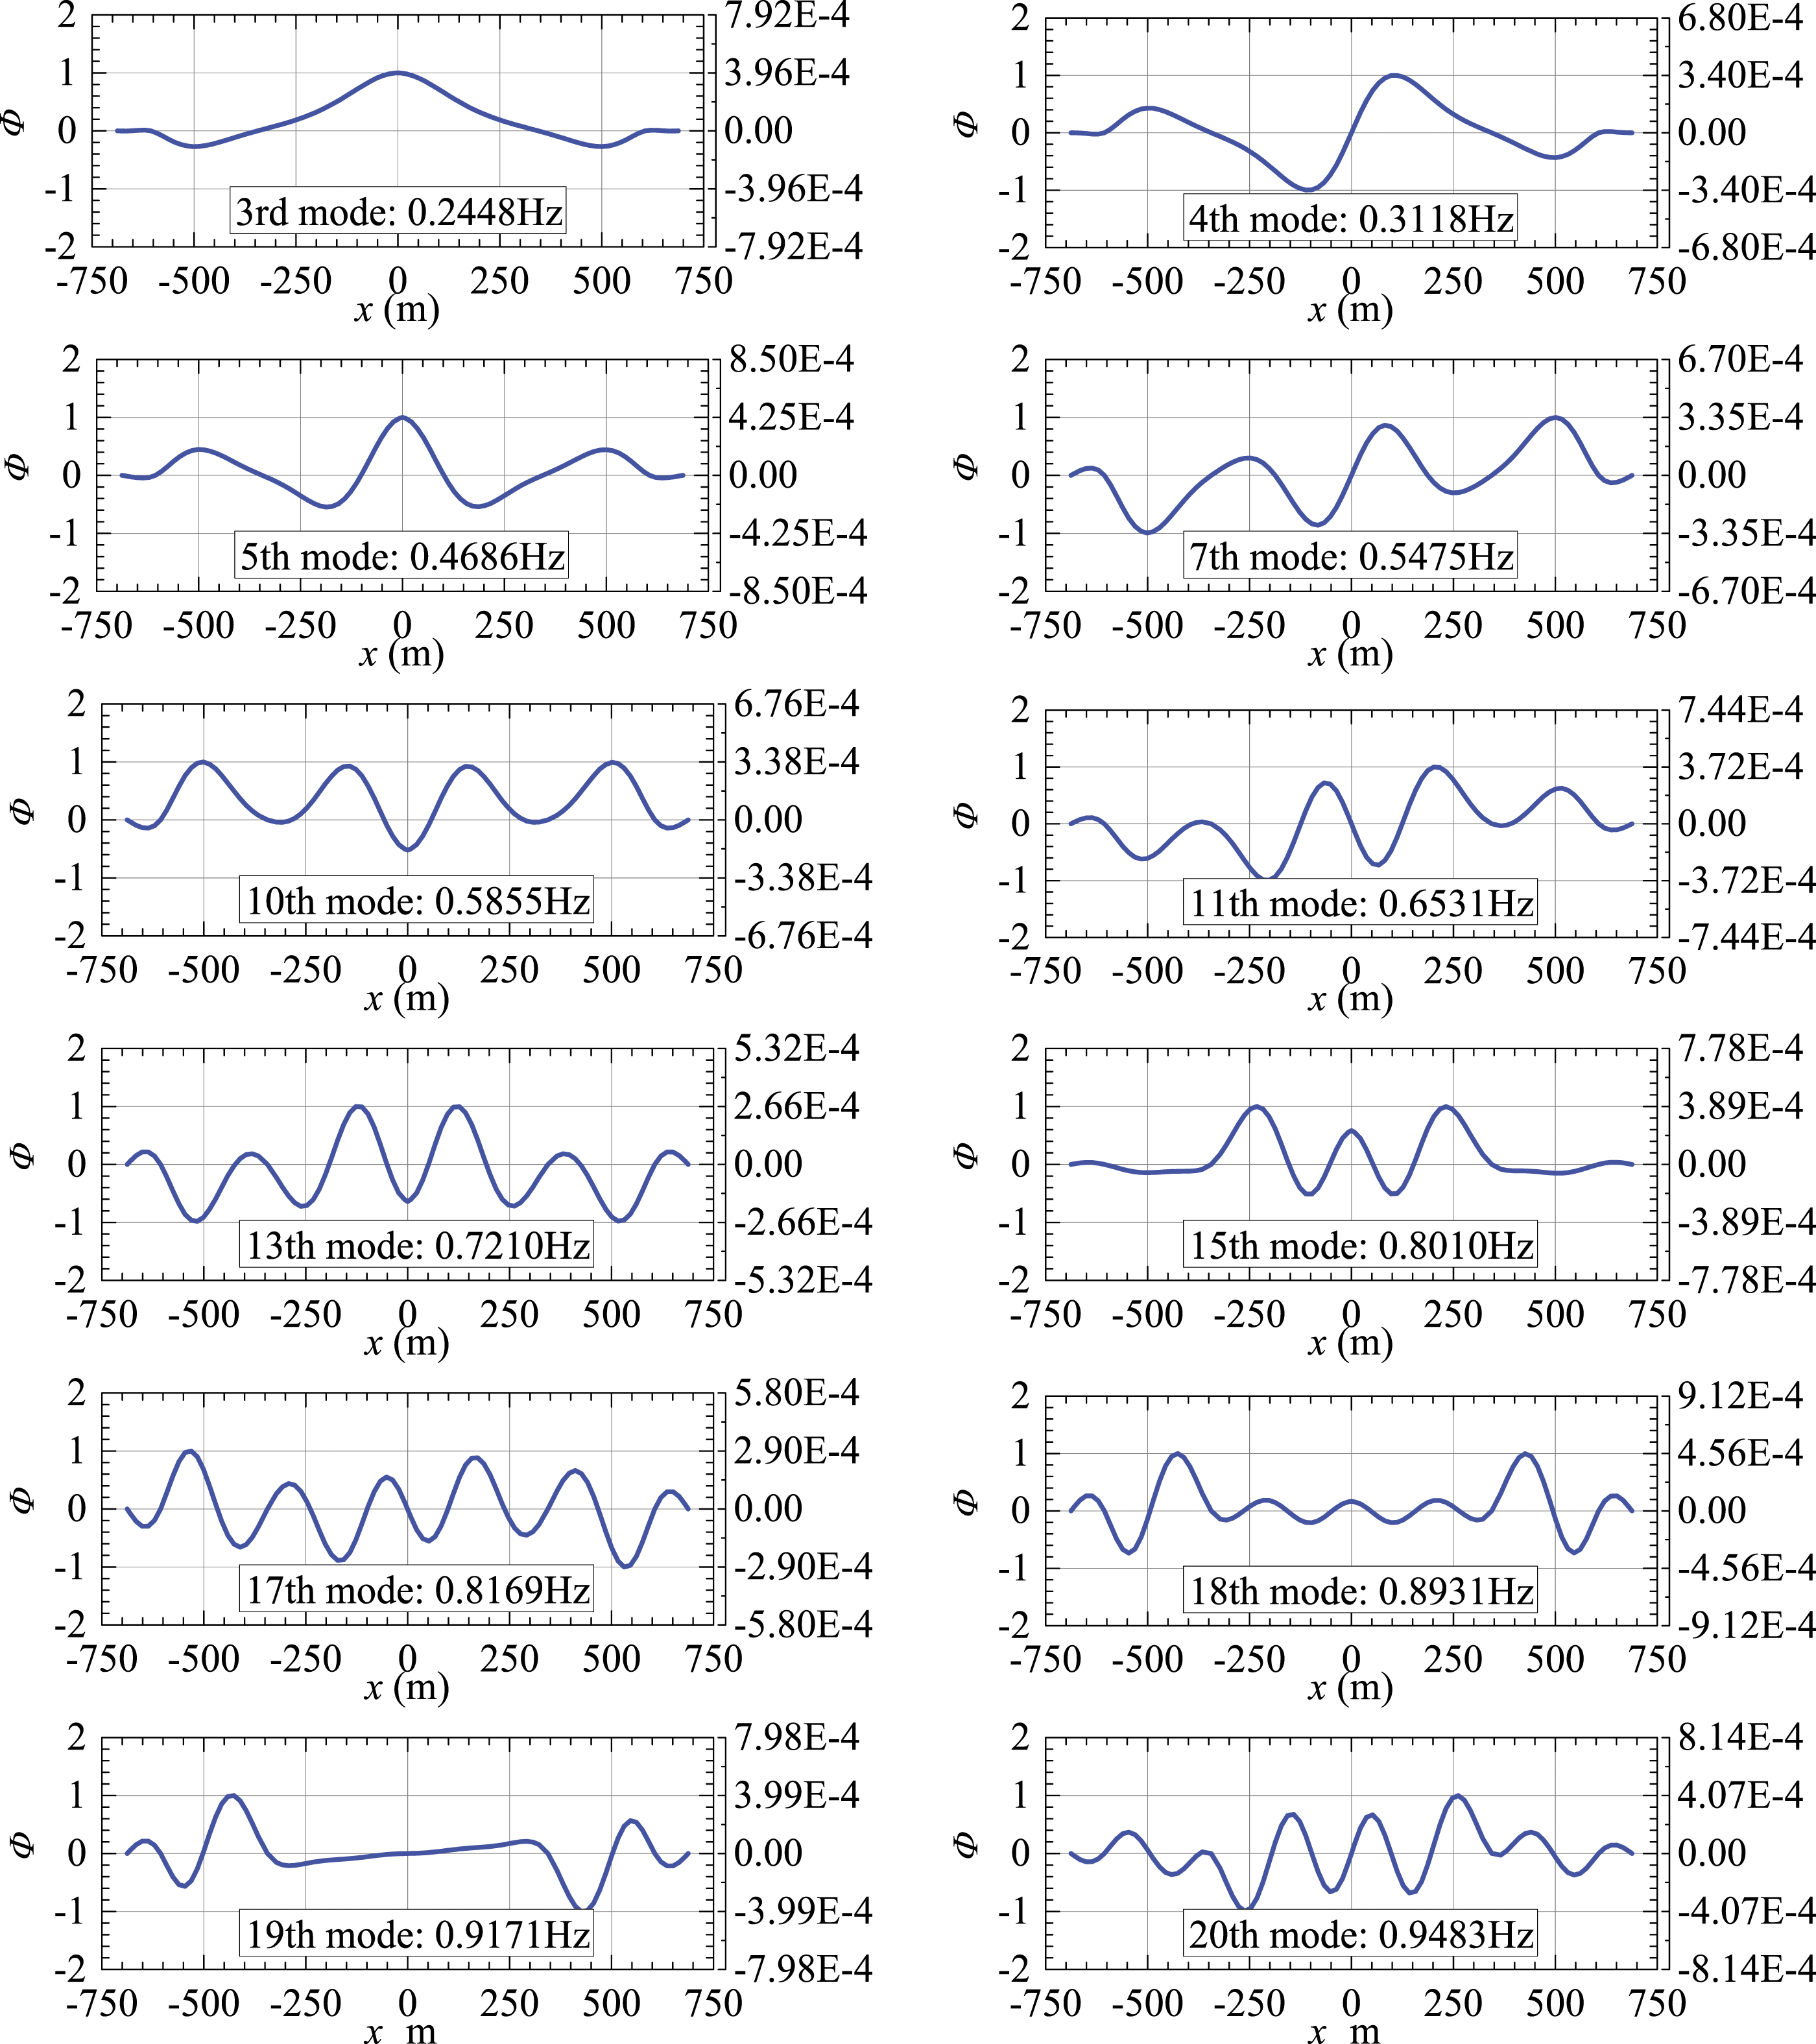
Xiangshan Harbour Bridge, located in Ningbo of China, is taken as an engineering background in this study. As shown in Figures 1 and 2, it is a double-tower cable-stayed bridge with two inclined cable planes and a flat closed steel box deck, and five spans of 82 + 262 + 688 + 262 + 82 = 1376 m. The deck width and depth (B and D) of the original design scheme, which suffered significant vertical VIV in wind tunnel test, are 32.0 m and 3.5 m, respectively. The computed frequencies and the corresponding mode shapes of its first 12 natural modes are shown in Figure 3. Elevation layout of Xiangshan harbour bridge. Cross section of Xiangshan harbour bridge. Vertical modal frequencies and mode shapes of Xiangshan harbour bridge: the value of the left ordinate indicates that the mode function is normalized according to the maximum displacement, and the numerical value of the right ordinate indicates that it is normalized according to the mass.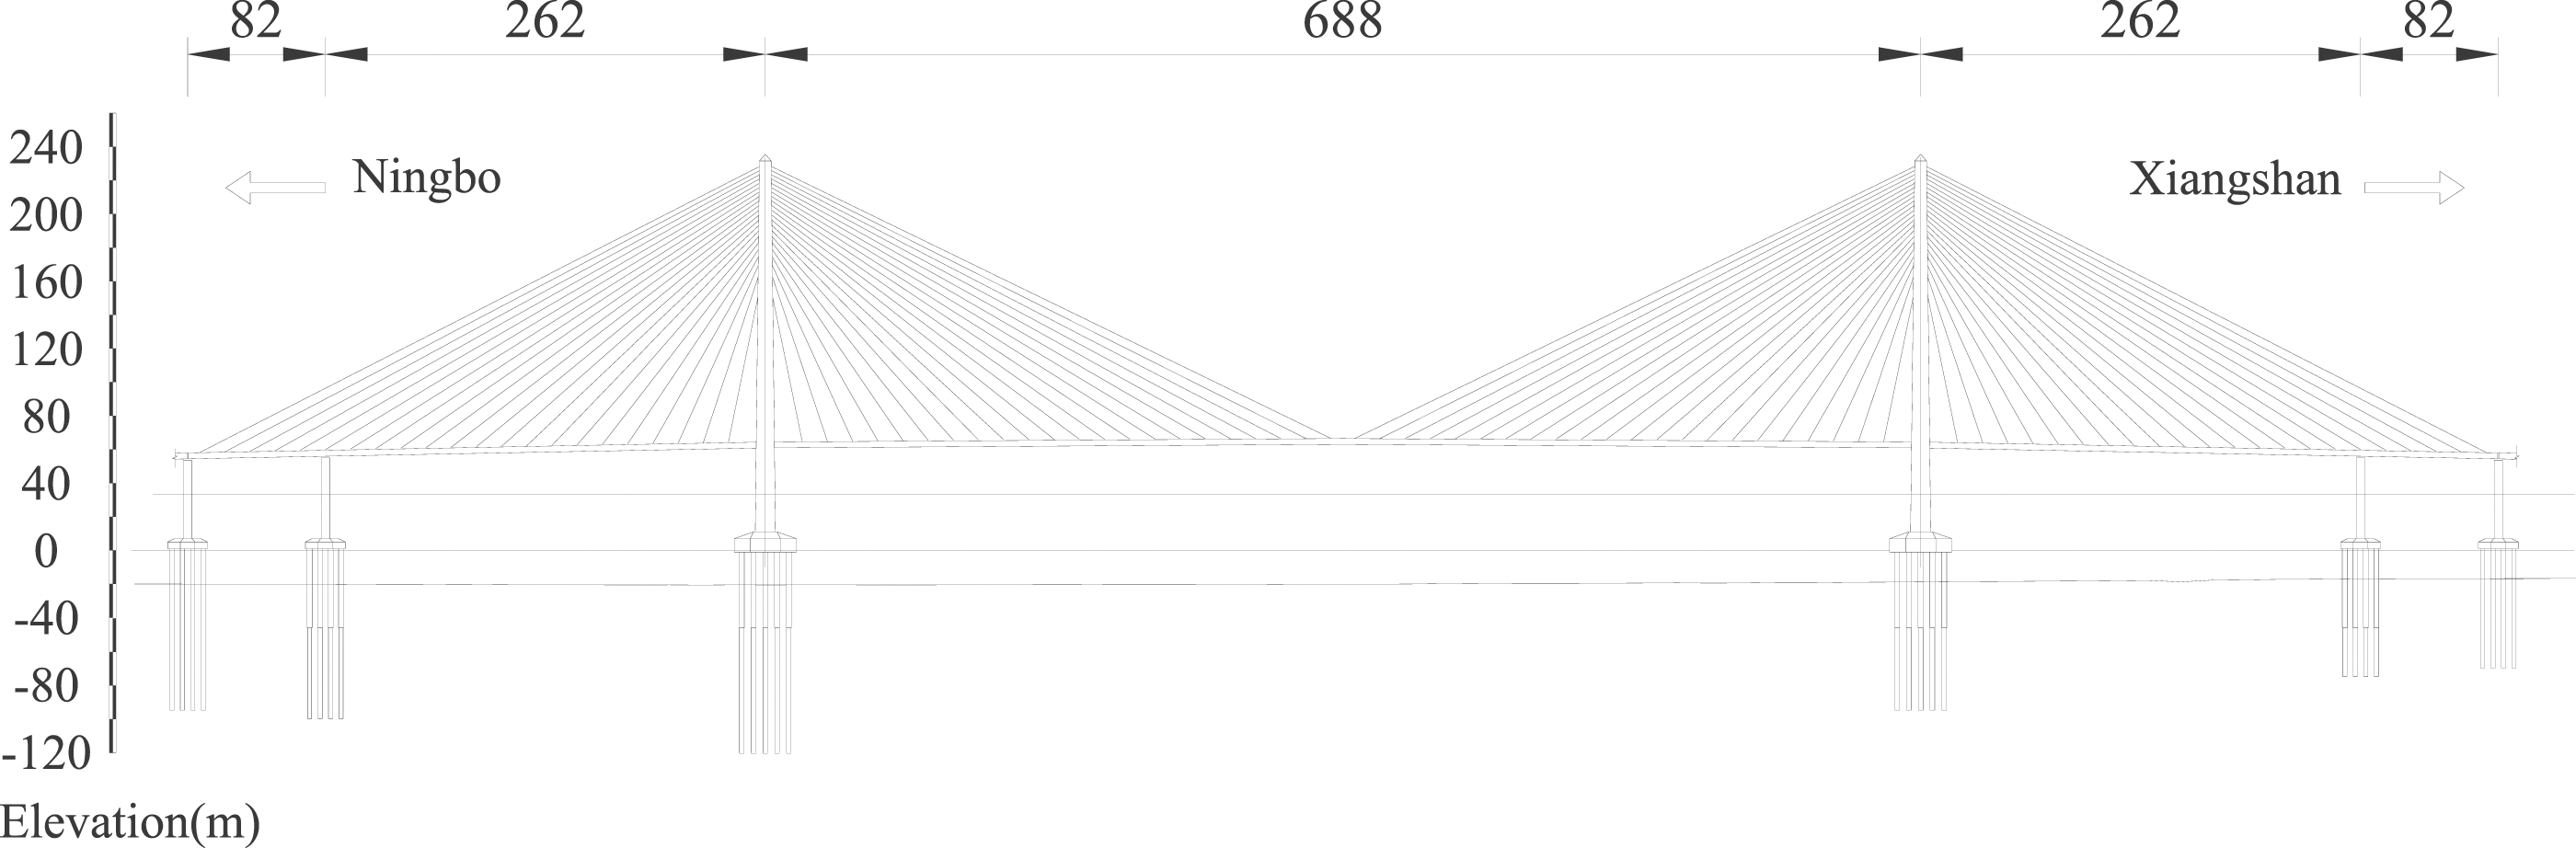

Mathematical model of nonlinear VIF
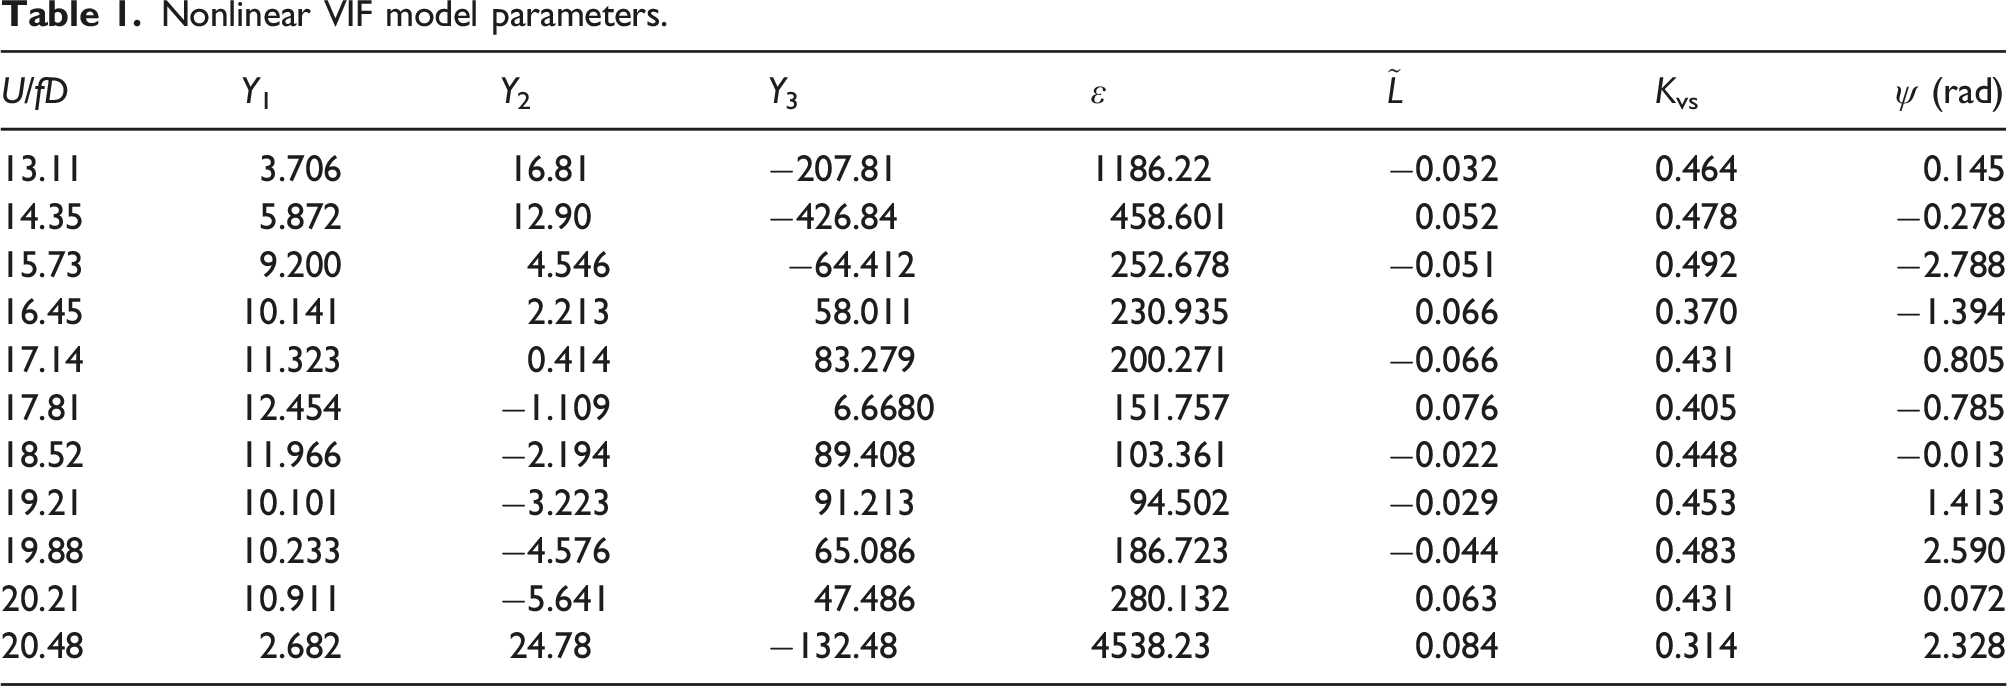
As discussed in Zhu et al. (2013), a series of wind tunnel tests of sectional model with a large scale of 1/20 were carried out to investigate the mathematical model of the nonlinear VIF of the closed box deck of Xiangshan Habour Bridge (see Figure 2). Simultaneously with the measurement of the VIV displacement response, the dynamic lift force and torsional moment acting on the middle part of the model “coat” were measured by using four single-component force balances installed in the model and fixed on the “rigid” internal steel frame of the sectional model. The VIFs acting on the model were then extracted and analysed carefully, and the following cubic polynomial model for the nonlinear vertical VIF was presented and verified for the flat closed box cross section of Xiangshan Habour Bridge:
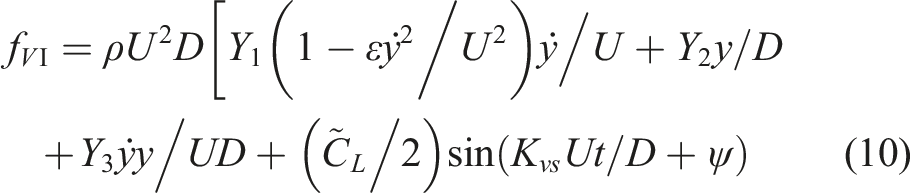
Nonlinear VIF model parameters.
Span-wise correlation coefficient of PVSF
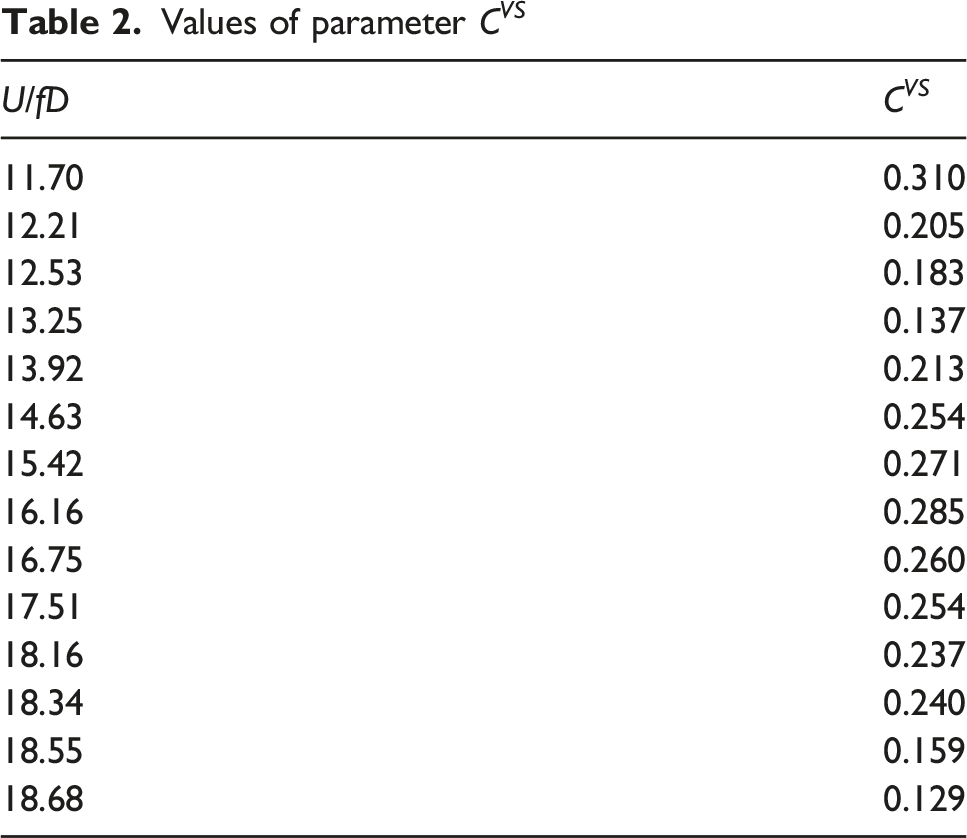
As discussed in Meng et al. (2015), the span-wise correlation coefficient of the PVSF 
Values of parameter C VS
Mode-by-mode method for full bridge VIV analysis
By employing the nonlinear mathematical model of VIF as shown in equation (10), the motion equation of the bridge deck in a smooth flow can be expressed as following: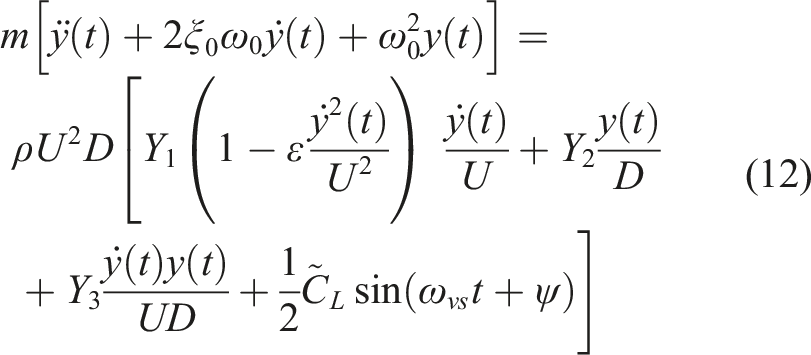
Because VIV of structures commonly occurs at a single natural mode and the nonlinear effect of the aerodynamic stiffness on the total stiffness of the vibration system is generally weak, the VIV response of long-span bridges can then be analysed mode by mode. By denoting the non-dimensional displacement reduced y/D, the reduced time Ut/D, and the reduced circular frequency ω0D/U by η, s and K0, the non-dimensional VIV response of a certain mode can be expressed as:
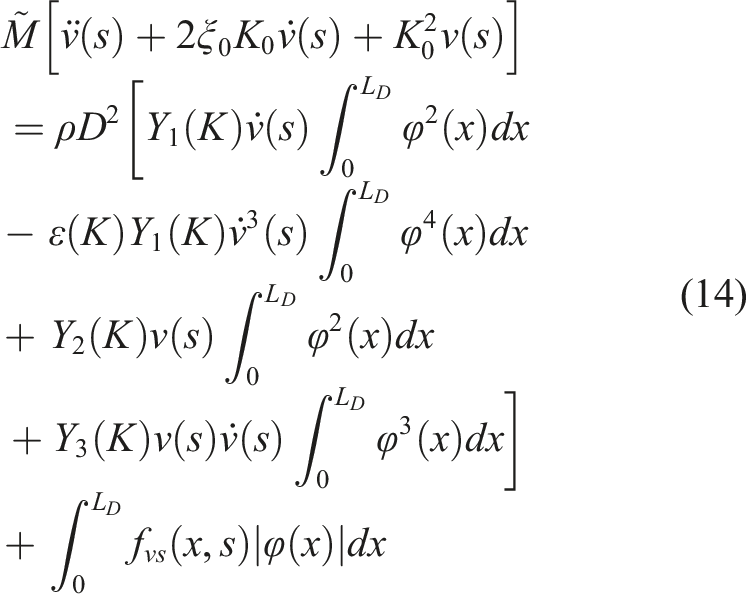
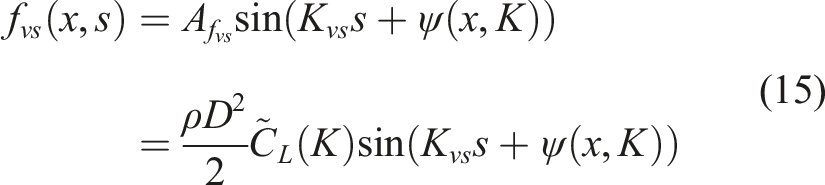


Let’s define the generalized pure VSF as:
Then, 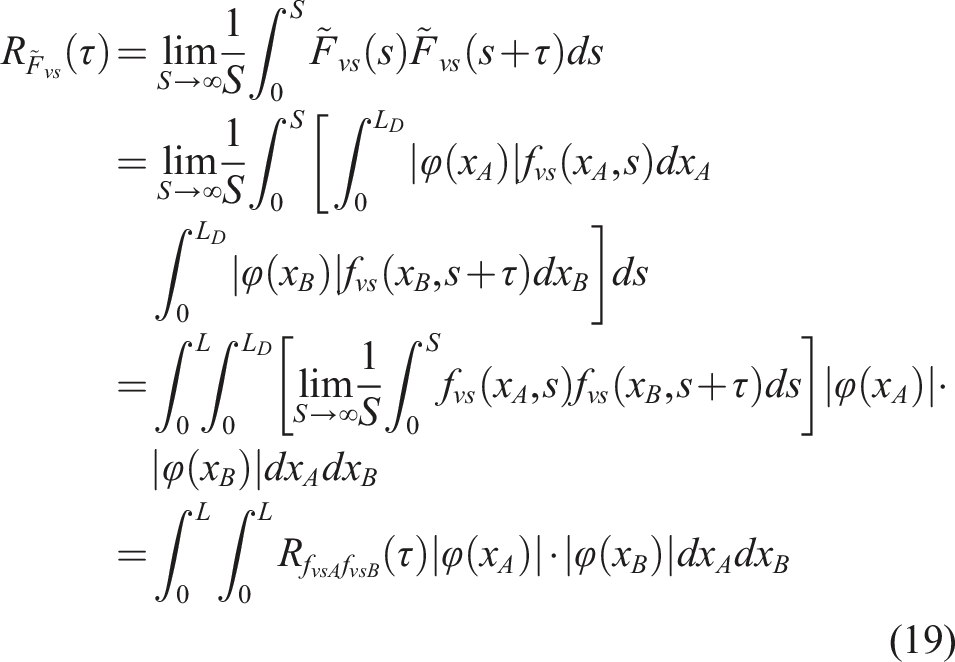
One can then obtain the auto spectrum of 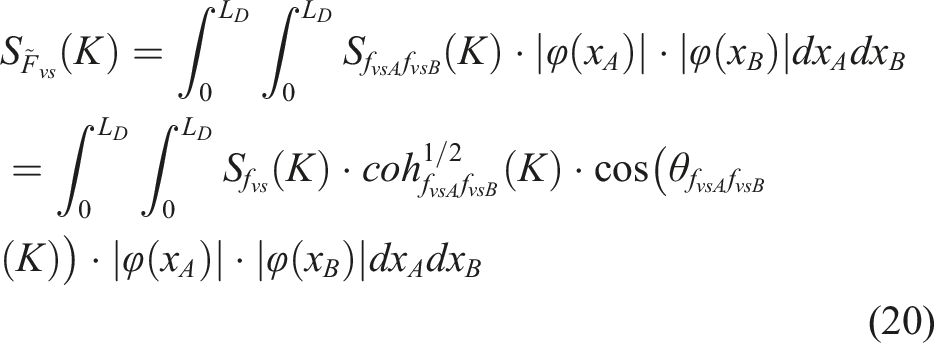
Inserting equation (17) into equation (20):
Now, let’s constitute an equivalent generalized PVSF, 
Obviously,
The auto spectrum of 
Thus By comparing equation (23) with equation (21), one can establish the relationship between 

By solving the above equation mode by mode in time domain, the VIV responses of different modes can then be obtained. Furthermore, it is noticed that: (1) with the decrease of the spatial separation,
Numerical examples
m eq and C φv of different modes.
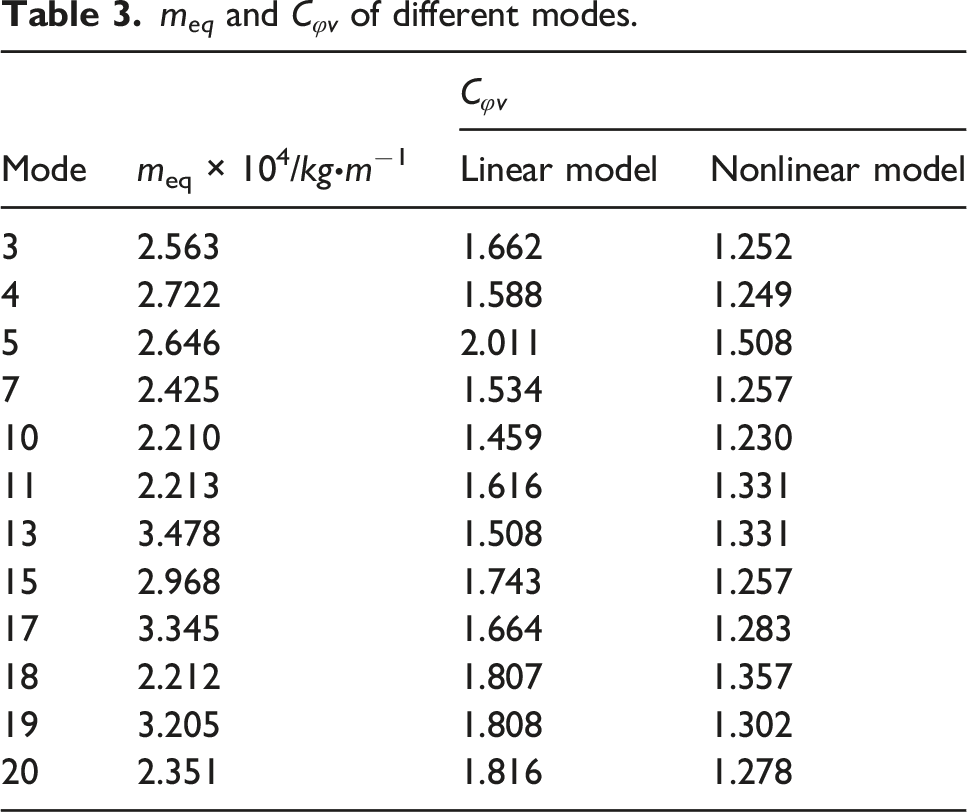
Figure 4 shows the results of vertical VIV responses of the bridge, where the red thick solid lines represent the computed vertical VIV responses of the 12 modes. The horizontal wine dashed line is the vertical VIV response estimated with the sectional model test results amplified directly by the length scale, which is significantly smaller than the computed maximal responses of all the 12 modes. The black thin solid lines with hollow dots indicate the vertical VIV responses of the concerned modes estimated by converting the test response of sectional model in light of equation (2) and (3) with C
R
= 1, which are remarkably larger than the calculated ones. The blue thin solid lines with solid squares represent the vertical VIV responses of the concerned modes estimated by converting the test response of sectional model in light of equations (2) and (8) with C
R
= 1 and ν = 1, which are rather close to the calculated ones for the first three modes, and deviate from the calculated ones more significant for higher order modes. VIV responses of Xiangshan Harbour Bridge versus wind speed.
It can be seen from Figure 4 that the amplitude of VIV for different modes are quite different from each other. These discrepancies are commonly caused by the combined three-dimensional effects due to mode shape, modal equivalent mass, and imperfect correlation of VIF when the structural damping is assumed to be the same in all modes in this study. However, in the case of Xiangshan Harbour Bridge, the span-wise correlation property seems has very limited effect on the VIV response, which can be inferred from Figure 5. It can be found that the computed vertical VIV responses of all the 12 vertical bending modes remain almost unchanged whatever the PVSF is supposed to be completely correlated, partially correlated or totally uncorrelated along the bridge span. Considering the modal equivalent mass also depend on mode shape, thus, for Xiangshan Harbour Bridge, the differences of VIV response for different modes are due to the 3D mode shape effect. Comparison of VIV responses obtained with different span-wise correlations of VSF.
To make a clear comparison between the VIV responses of different modes, which as aforementioned are affected by the 3D effect, the dimensionless lock-in curves of all calculated modes are plotted in Figure 6. The lock-in curves of different modes have considerable differences, which are mainly reflected in two aspects. On the one hand, the VIV amplitudes are different within the range of structural modes considered, the largest vertical bending VIV occurs at the fifth mode, which corresponds to the second-order symmetric vertical bending of the main beam (show in Figure 3), and the smallest VIV occurs at the 13th mode, which corresponds to the fourth-order symmetric vertical bending (show in Figure 3). On the other hand, the lock-in range of wind speed also varies with the structural modal. For Xiangshan Harbour Bridge, the difference in the starting wind velocity among different modes is obvious, while the difference in the ending wind velocity is not significant, that leads to the different lengths of lock-in wind speed range. Nondimensional lock-in curve of Xiangshan harbour bridge.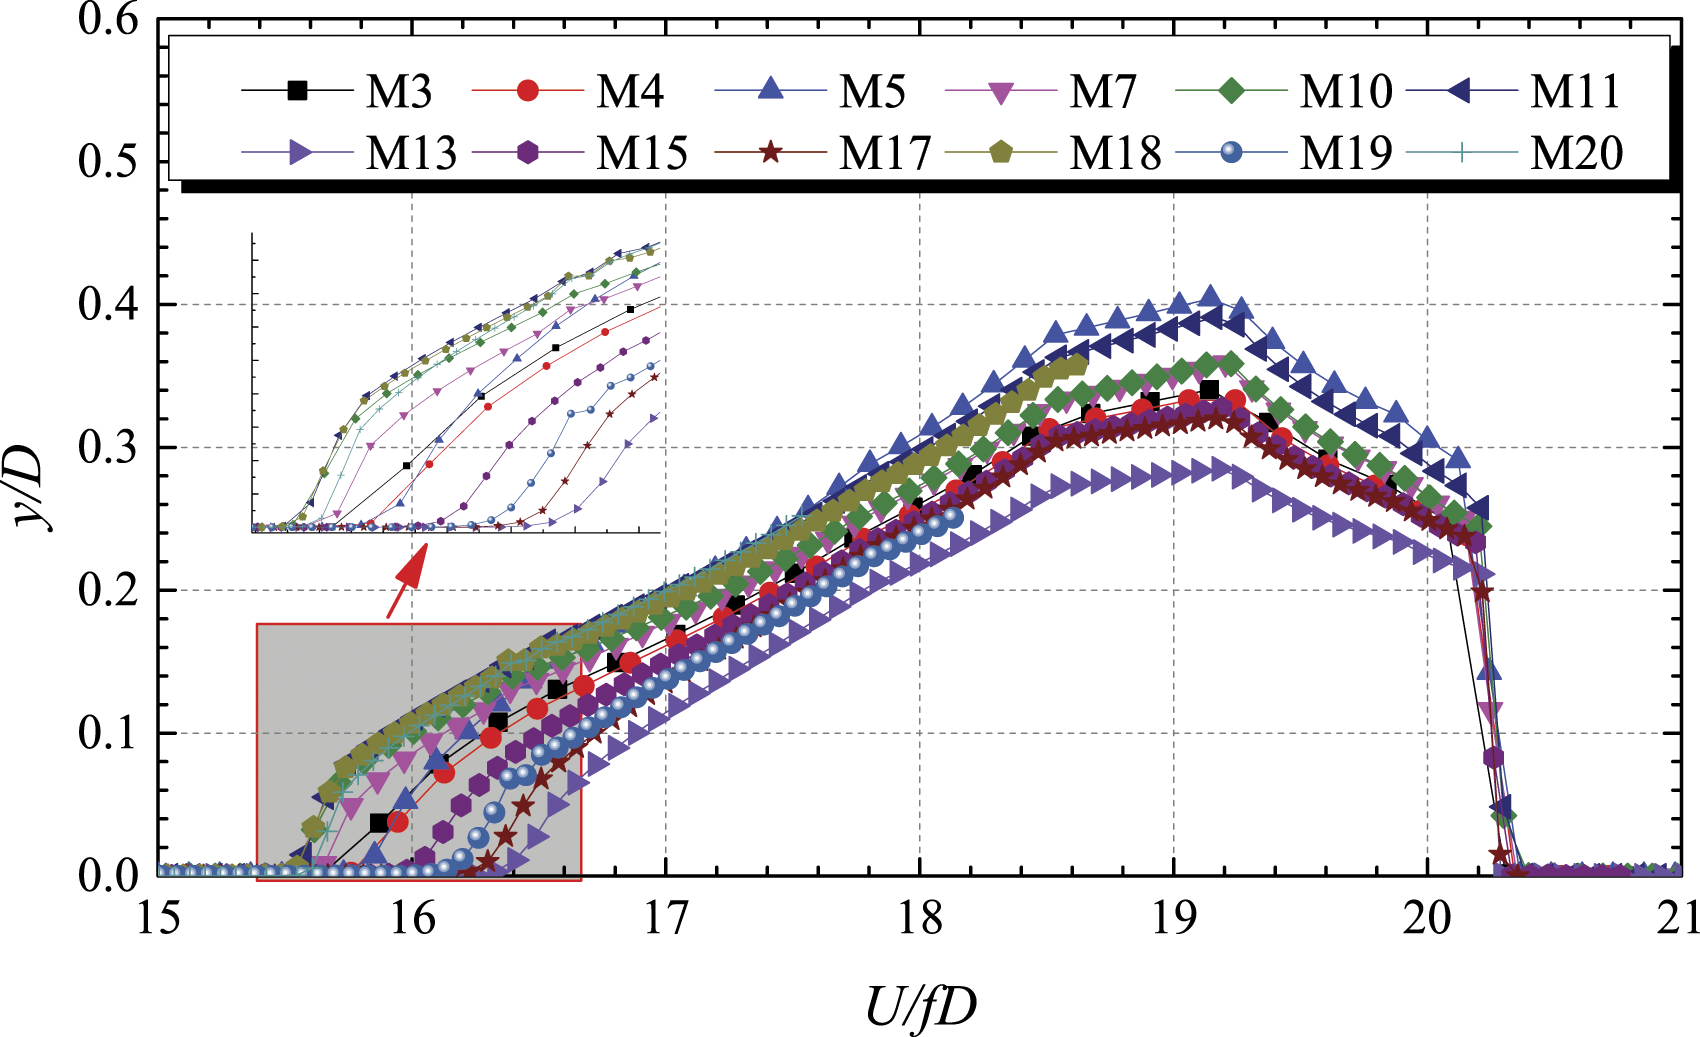
In addition, Figure 4 also shows an interesting phenomenon. For a long-span cable-stayed bridge with dense modes, the lock-in wind speed ranges of different modes may overlap. According to the mode-by-mode analysis method proposed in this study, which decouples all the different modes first and then solve the equation of motion in dependently. Thus, for the overlapping region, it is still not possible to determine which mode will lock the motion of the structure, or even whether the structure will move in the form of a multi-mode coupling manner. Although this problem does not affect the maximum amplitude of VIV, it is worthwhile to solve in the future for mechanism exploration or for fatigue evaluation.
The VIV response predicted by Scanlan’s linear and nonlinear models using the conversion approaches derived by Zhu (2005) and Zhang and Chen (2011) were also presented in Figure 4. The conversion factor C φv is listed in Table 3. It can be found that the VIV response calculated with the full bridge analysis method proposed here can obtain a result close to the ones calculated by Scanlan’s nonlinear model, while is much smaller than the results obtained by the Scanlan’s linear model. The reason for that the linear model always leads much larger VIV amplitude result is that it provides a constant value of system damping, which means that the additional nonlinear damping introduced by the flow as the increase of oscillation will be absent in the linear model.
The reason for that the full bridge VIV response is not sensitive to the correlation of VIF (as show in Figure 5) is the employment of flat close box deck on Xiangshan Harbour Bridge. As the streamline feature of such bridge deck, the proportion of PVSF is very small, comparing with its counterpart of the SEF component. As an example, Figure 7 shows the comparison between PVSF and SEF at the peak response of VIV. It can be seen from the figure that the magnitude of SEF is more than 500 times of that of PVSF. As the energy of PVSF is very small, the influence of incomplete correlation of PVSF on the overall VIV response of streamlined box girder is very limited. However, for other types of blunt bridge girder where the vortex shedding force accounts for a large proportion, such as the box girders with an almost vertical front web, which are frequently adopted on various types of long-span steel beam bridges, notable influence of the incomplete correlation of the PVSF on the VIV response may be expected and should be further investigated in the future. Comparison between SEF and PVSF, (a) time domain, (b) frequency domain.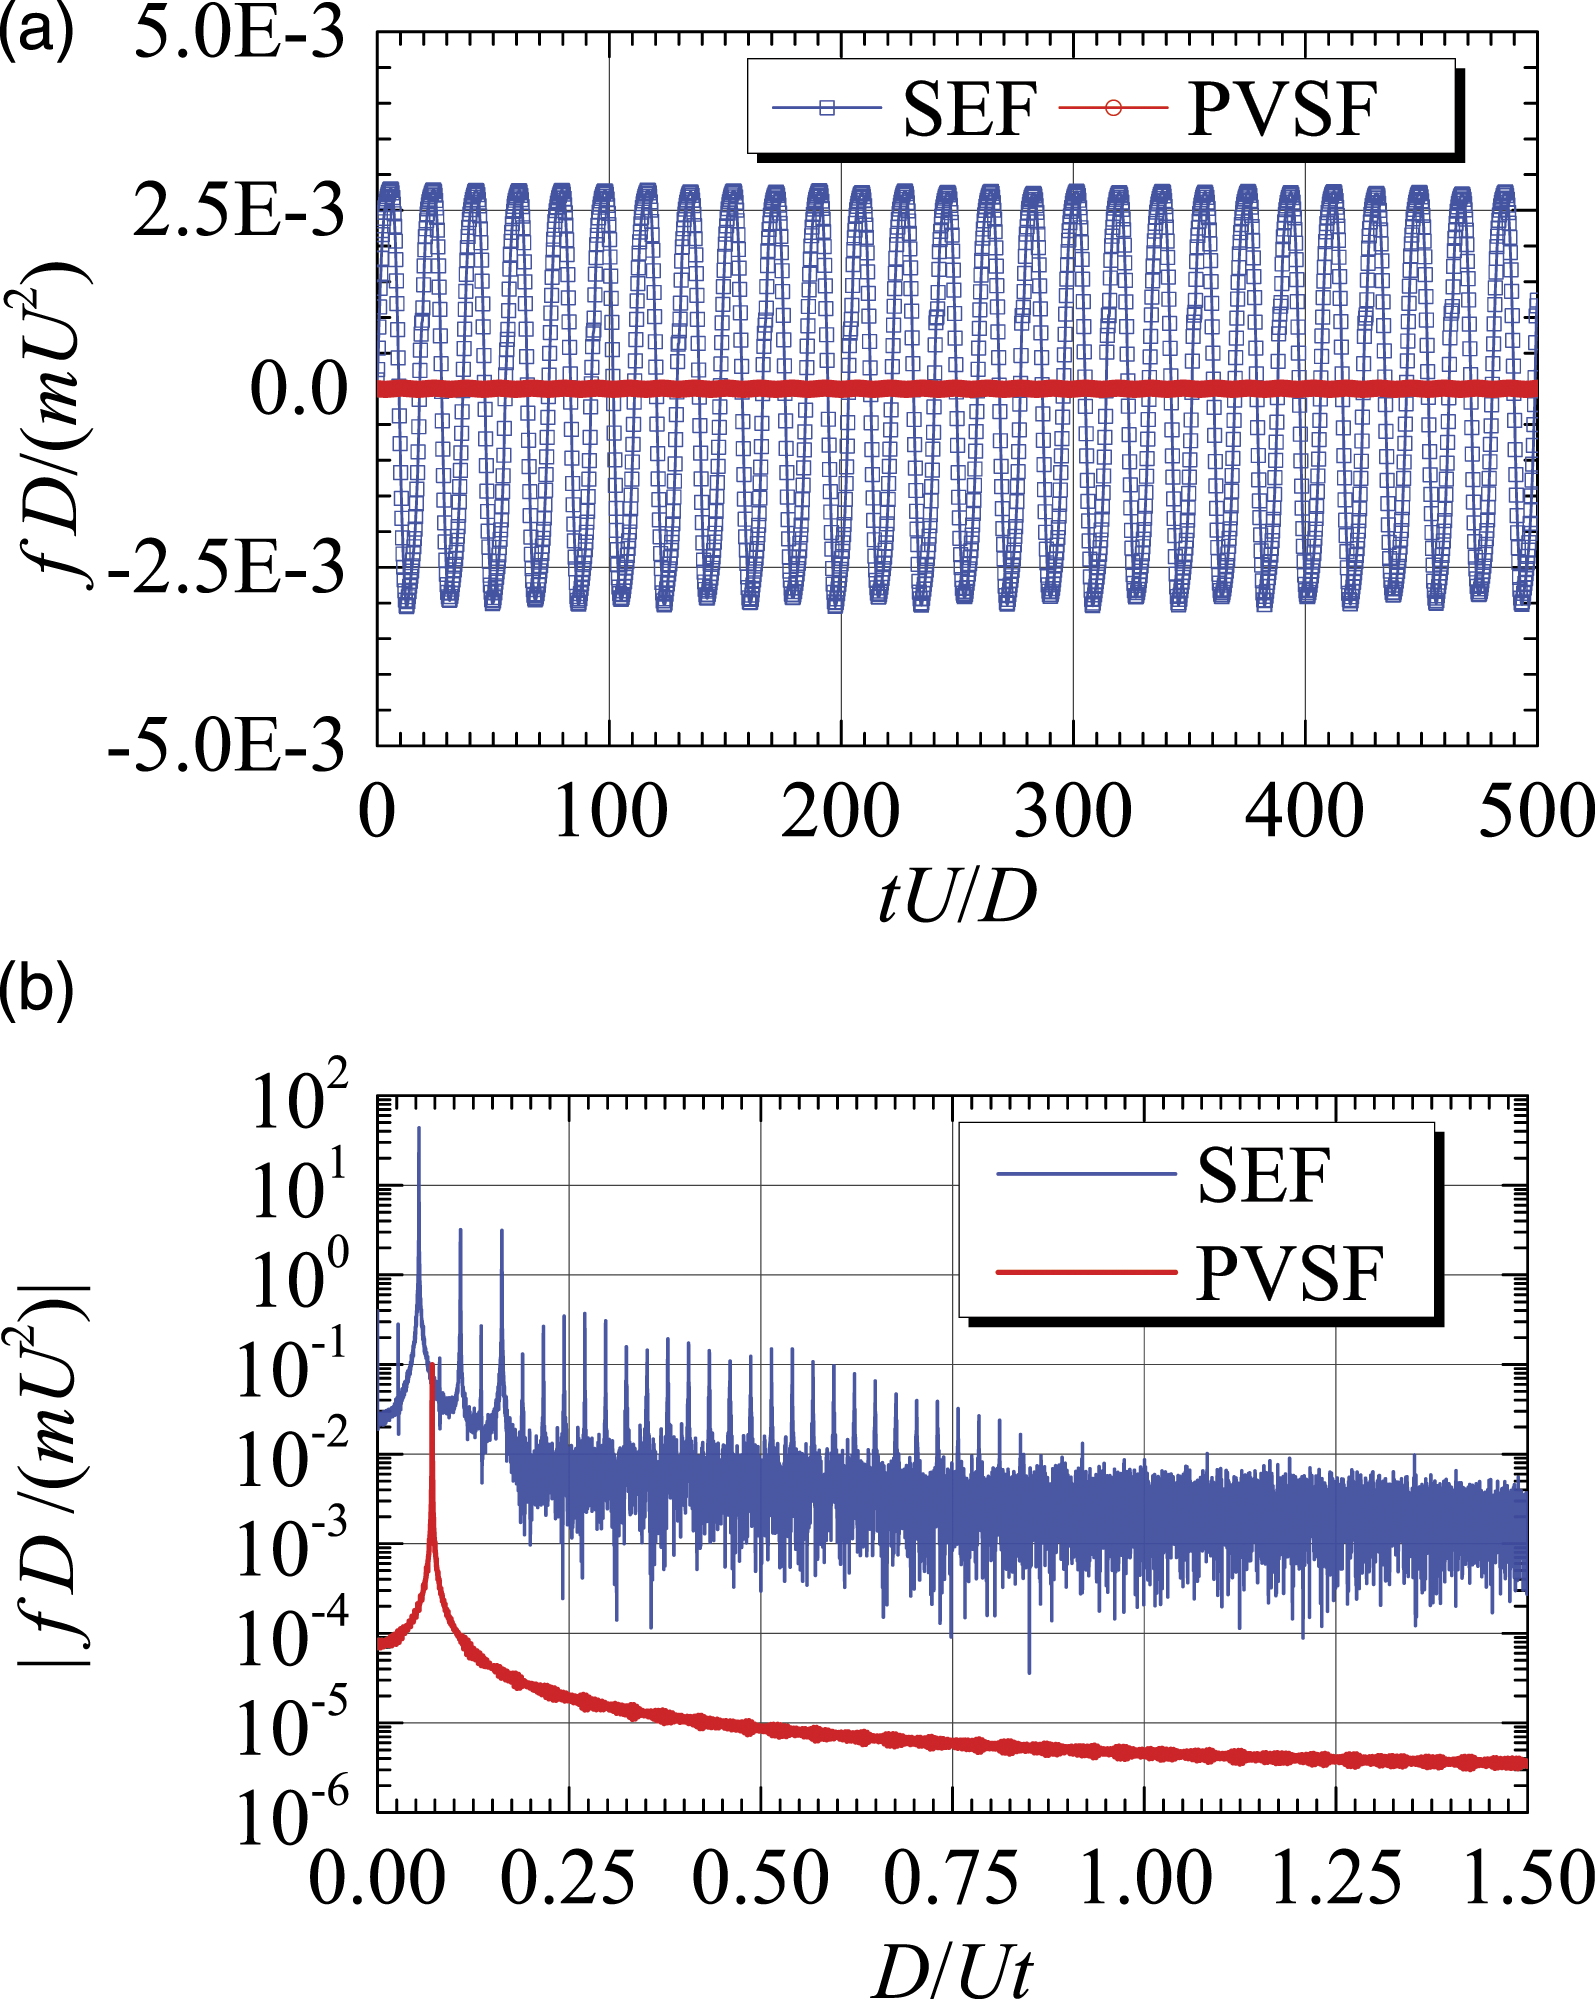
Conclusions
(1) A mode-by-mode full-bridge time-domain method was presented in this paper for VIV analysis of long-span bridges. This method can consider both the nonlinear effect of VIF and the incompletely span-wise correlation of PVSF. Although the formula deduction was based on the special cubic polynomial mathematical model of vertical VIF of the flat box deck of Xiangshan Habour Bridge, the principle of this method is applicable to other types of bridge deck, and also adequate to the torsional VIV analysis, which may have different concrete polynomial forms of VIF mathematical model. (2) The analysis results of the vertical VIV responses of Xiangshan Harbour Bridge show that the converting relationship between the responses of sectional model and prototype bridge based Scanlan’s linear model of VIF may be too conservative, whereas the conversion of the sectional model test results directly by length scale may underestimate the VIV responses of prototype bridges. The converting relationship deduced from Scanlan’s nonlinear model of VIF in this bridge case is reasonable for lower order modes, but maybe not for higher order modes. (3) The span-wise correlation behaviour of the PVSF plays little influence on the VIV responses of streamline flat box decks. The reason is that when VIV happens with sufficient large of amplitude, the SEF takes major portion of VIF, which is neatly perfectly correlated along the bridge span in the smooth flow.
Footnotes
Declaration of conflicting interests
The author(s) declared no potential conflicts of interest with respect to the research, authorship, and/or publication of this article.
Funding
The author(s) disclosed receipt of the following financial support for the research, authorship, and/or publication of this article: The work described in this paper was jointly supported by the National Natural Science Foundation of China (Grant 51938012, 50978204), and the Open Project Fund from Key Laboratory of Transport Industry of Bridge Wind Resistance Technology (KLWRTBMC19-01), China.
