
Abstract
Understanding the failure mechanisms of steel-bar reinforced ultra high performance fibre reinforced concrete (UHPFRC) beams is crucial to improving their design but challenging because of the contrast between beam size and fibre size. We develop a 2D mesoscale finite element model with the fibres explicitly resolved to bridge this gap by simulating the damaging and fracturing processes of the beams. To make fibre distribution in the model mechanically representative, we propose a method to project the fibres from 3D to 2D. The continuum damaged plasticity model is used as the constitutive law for the UHPC matrix, and the zero-thickness cohesive elements with softening constitutive law are used to model the nonlinear bond-slip behaviour of the fibre- and bar-matrix interfaces. The models are validated against experimental data obtained from 3 and 4-point loading tests by comparing the simulated and measured fracturing processes, crack patterns and the load-displacement curves. The validated models are then used to analyse the sensitivity of the shear strength of the beams to fibre content, shear span-to-depth ratio, as well as shear and longitudinal reinforcement ratios in the beam, from which a shear strength equation is proposed to improve the design of reinforced UHPFRC beams. The improvement of the new equation over the AFGC equation is demonstrated against experimental data measured from 32 beams with various material properties.
Keywords
Introduction
The ultra high performance steel fibre reinforced concrete (UHPFRC) is a comparatively new fibre reinforced concrete (FRC). Its superior mechanical properties, including high compressive strength (>150MPa), tensile strength (>8MPa), fracture energy (40kJ/m2) and durability, make it potential to replace the conventional reinforcing steel bars in reinforced concrete (RC) structures, such as thin slabs and shells (Alberti et al., 2014; Serna et al., 2009; Pujadas et al., 2014). It has hence attracted increased interest from both researchers and engineers over the past decades (Richard and Cheyrezy, 1995). However, because steel-bar reinforced and unreinforced UHPFRC structures are 5–10 times more expensive than normal strength concrete (NSC), their practical applications in engineering projects are still limited (Aitcin, 2000; Voort et al., 2008; Russell and Graybeal, 2013). Understanding the mechanisms underlying the change in shear strength of UHPFRC structures with fibre content and other material properties is essential to reducing their costs and facilitating their application.
Modulated by casting procedure, the orientation and distribution of steel fibres in UHPFRC structures are opaque and spatially random (Barnett et al., 2010; Boulekbache et al., 2010; Deeb et al., 2014), while their consequence for structural performance remains elusive, despite decade of studies (Bertram and Hegger, 2012; Baby et al., 2013; Qing et al., 2019; Yang et al., 2010). Tomography techniques such as X-ray computed tomography (CT) can visualise the components in UHPFRC at resolutions as fine as a few microns (Qsymah et al., 2017; Yang et al., 2020; Zhang et al., 2021; Zhan and Meschke, 2016), but their high cost and the trade-off between spatial resolution and the size of samples for scanning means that CT is not applicable to identify fibres in large UHPFRC beams.
Traditional FRC and UHPFRC models for macroscale represent the heterogeneous micro-features and their impact implicitly using constitutive laws, such as the damaged plasticity model (Mahmud et al., 2013), the microplane model (Liu et al., 2009), the failure surface model (Özcan et al., 2009), and the stress transfer-based model (Lu et al., 2017). Parameters in these models are usually determined from laboratory tests. While the macroscale models can predict structure failure, they are unable to unveil whether the failure is caused by individual fibres, bars, matrix, material interfaces, or their combination. Mesoscale modelling with these micro-features explicitly resolved can bridge this gap and has the potential to improve UHPFRC design (Zhang et al., 2022).
Various meso-scale models have been developed over the past decades (Ellis et al., 2014; Jia et al., 2015; Laranjeira et al., 2010; Zhang and Yu, 2016), but most of them are to simulate single fibre pull-out tests (SFPTs) or calculate bulk mechanical properties of specimens. The random fibre distribution in these models is either numerically generated or obtained from CT images (Qsymah et al., 2017; Zhang et al., 2021), with the fibre-matrix interaction described by the tensile stress-strain constitutive laws estimated from the load-slip curves from SFPT tests (Kang et al., 2014; Pros et al., 2012). One shortcoming of these methods is that the constitutive laws are empirical and unable to differentiate the impacts of fibre elongation and bond-slip on the fibre-matrix interfaces. They are thus inadequate to describe the stress on individual fibres (Cunha et al., 2012; Yu et al., 2016). As an improvement, Zhang et al. (2018) developed a discrete-continuum model with the fibre-matrix interfacial debonding described by softening cohesive elements.
There have been some experimental studies on shear capacity and shear behaviour of UHPFRC beams and girders without shear reinforcement (Baby et al., 2014; Voo et al., 2010). In general, however, there is still a lack of accurate understanding of how the shear behaviour of bar-reinforced UHPFRC beams varies with design parameters, such as fibre content and orientation, beam slenderness, shear reinforcement ratio, longitudinal reinforcement ratio and prestressing level (Baby et al., 2013). As a result, the design of UHPFRC beams usually uses a high safety margin (Florent et al., 2013; Graybeal, 2006). Understanding the effects of individual design parameters on the shear behaviour and failure mechanisms of UHPFRC beams is therefore essential to improve their design.
The primary objective of this paper is to propose a mesoscale model to help improve design of steel bar-reinforced UHPFRC beams. Fibre distribution in UHPFRC beams is three-dimensional, however, because of the contrast between beam size and fibre size, directly modelling 3D beams with all fibres explicitly resolved is computationally infeasible. We hence model the 3D beam by a 2D plane and propose a method to project the fibres from 3D to 2D to ensure that the results simulated from the 2D model are mechanically equivalent. The 2D models are tested against experimental data measured from real-size structural members. They are then used to analyse the sensitivity of shear strength of the beams to design parameters including fibre content, shear span-to-depth ratio, shear reinforcement ratio, and longitudinal reinforcement ratio, from which an equation is proposed to improve the shear design of UHPFRC beams, with or without the stirrups, under 3- and 4-point bending. This equation is applied to experimental data obtained from 32 beam tests with different material properties, and its improvement is demonstrated against the method recommended by the AFGC code (2002).
Finite element modelling
Determination of fibre content for the 2D models
The fibre distribution in the 2D mesoscale FE models is calculated by projecting the fibres in 3D into a 2D plane, with the effects of out-of-plane distributed fibres, matrix size and fibre volume fraction taken into account. We firstly generate N fibres randomly distributed in a cube of size L
m
using a Matlab code, with the fibre length and fibre volume fraction represented by L
f
and A
f
, respectively (Figure 1(a)). Each fibre is then projected into a 2D plane (Figures 1(b)–(c)), based on that only fibres whose cross-sections and contacting interfaces are parallel to the 2D plane can carry load. This is a conservative approach for structural design as it neglects the out-of-thickness. The total length of all fibres in the 2D plane is represented by L
2D
, and the projecting ratio is defined as K2D = L
2D
/(N·L
f
). To investigate the effect of out-of-plane thickness in the 2D models, we generate 9000 samples with the fibre volume content varying from 0.2 to 3.0% and sample size (L
m
) from 1 to 15L
f
. For each combination of sample size and fibre content, there are 50 samples with the random fibre distribution in them independent of each other. Figure 2(a) shows the change in K2D and its mean obtained from 750 samples with the normalized sample size (by L
f
) for A
f
= 1.0%, and Figure 2(b) shows the change in the mean K
2D
of the 9000 samples with the normalized sample size for different A
f
. It is evident that K
2D
asymptotes to 0.631 when L
m
≥5L
f
, regardless of A
f
, indicating that the minimum sample size to avoid out-of-plane thickness effect in the 2D model is 5 times the fibre length. The associated area fraction in the 2D model is approximately 0.631A
f
. To avoid non-conforming elements and meshing difficulty when the projected fibres are not long enough in the 2D plane, the number of projected fibres is modified to N
2D
based on the area fraction of fibre 0.631A
f
and the fibre length L
f
, as illustrated in Figure 1(d). Projection of fibres in 2D from 3D. Change in K2D of 750 samples with normalized cube size L
m
/L
f
when A
f
=10%.

Generation of FE meshes
The reinforced UHPFRC beams consist of UHPC matrix, steel fibres, steel bars, fibre-matrix and bar-matrix interfaces. The matrix is discretized by the four-node isoparametric elements (CPS4R in Abaqus). The steel bars, stirrups and randomly distributed fibres are modelled by the two-node Timoshenko beam elements (B21), with their bending resistance represented by the elastoplastic constitutive laws. The fibre diameter is not explicitly simulated but input as a parameter to compute the elemental stiffness. The zero-thickness cohesive elements (COH2D4 in Abaqus) are inserted between the fibres/steel bars and the matrix to represent their interfaces in a way illustrated in Figure 3(a), where the fibres and steel bars are treated as boundaries of the matrix in mesh generation. The fibres, steel bars and interfaces are defined by double layers of nodes, and they “float” over the UHPC matrix (Figure 3(b)) to avoid fine mesh localization in the matrix adjacent the thin fibres, which would occur if directly loading the fibre nodes on the matrix plane. Visually, the projected fibres could intersect in the 2D plane as shown illustratively in Figure 3(b). Computationally, however, such an intersection does not have any mechanical impact as the nodes of different fibres at the intersection are differentiated using different node numbers, i.e., N1 of fibre 1, N2 of fibre 2 and N3 of the matrix. Such fibres do not intersect with each other in the modelling. Displacement constraints are applied to the nodes of these elements to deform the 2D plane, and the fibre and bar elements in the model can only move longitudinally along their axes as illustrated in Figure 3(b). Generation of FE meshes.
Constitutive laws for matrix and fibre/bar-matrix interfaces
The widely used concrete damaged plasticity (CDP) model in Abaqus for damage and fracture of concrete-like materials is employed to model the nonlinear constitutive behaviour of the UHPC matrix (Earij et al., 2017; Mahmud et al., 2013; Lee and Fenves, 1998; Huang et al., 2015; Huang et al., 2016). It defines the compressive hardening, tensile softening, damage initiation and evolution. The pre-peak stress-strain relationships between compression and tension are assumed to be linearly elastic, while the post-peak softening compressive behaviour is described by the model of Guo (2004):

The tensile softening behaviour of the UHPC matrix is described by the following traction (σ
t
)-crack opening displacement (w) curve (Hordijk, 1992), to minimize the impact of mesh:

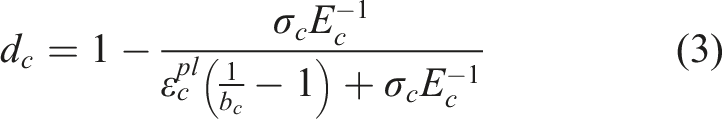
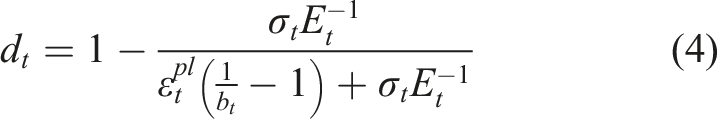
The compression damage index d
c
and the tension damage index d
t
in the CDP model are estimated by the following equations (Birtel and Mark, 2006) assuming the compressive and tensile plastic strains are proportional to the inelastic compression and tension strains respectively, with the proportionalities being constant:
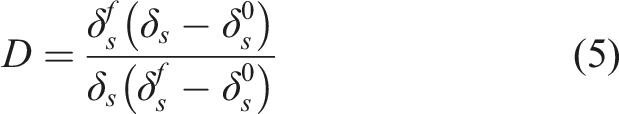
The shear traction (t
s
)-slip (δ
s
) curve shown in Figure 4 is used as the constitutive law for the cohesive elements to simulate the softening bond-slip behaviour of both fibre-matrix and bar-matrix interfaces. The maximum normal traction t
n0
is assumed to be ten times the shear traction t
s0
to ensure that only interfacial shear slip (i.e., no opening) is allowed. Damage initiation emerges when the shear traction reaches t
s0
. The following linear function is used as the criterion to determine the damage evolution in the cohesive elements: Linear softening bond-slip law for the cohesive elements to model the interface.
Numerical examples, results and discussion
Two beam examples with experimental data are modelled. After a number of trial-errors, the Abaqus/Explicit solver with a total time 0.05s and time increment 1 × 10⁻⁷s is used in all simulations to ensure the quasi-static loading condition. The loading is applied by uniformly distributing displacements at the loading points. A PC with an Intel(R) Core i9-9900K
Example 1: A UHPFRC beam reinforced with longitudinal steel bars
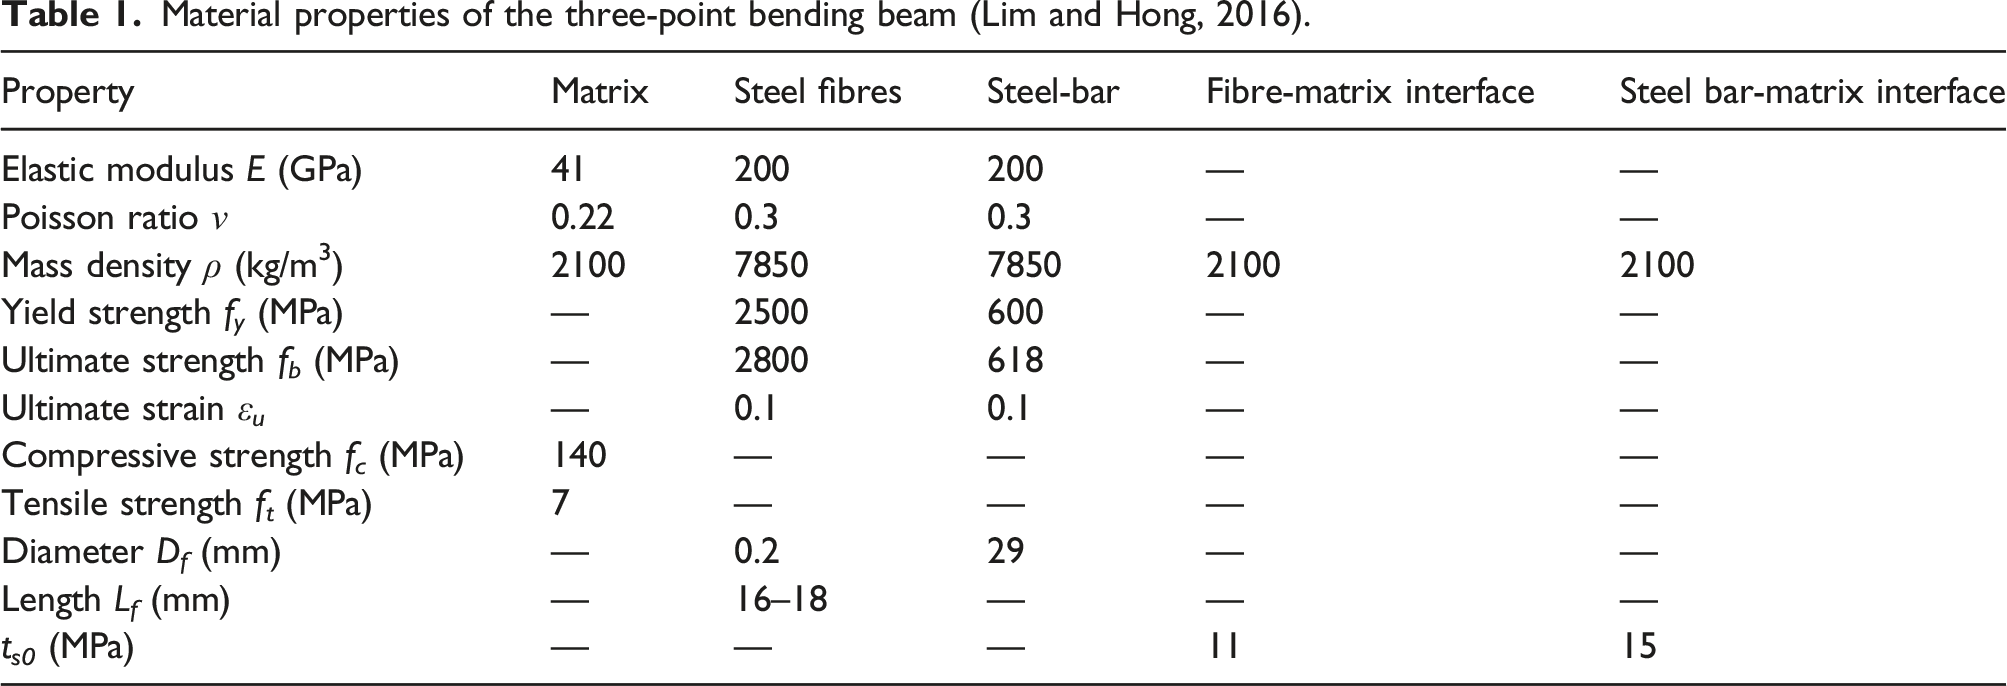
The simply supported reinforced UHPFRC beam tested by Lim and Hong (2016) under three-point bending is modelled first. The boundary conditions and geometries are shown in Figure 5. The beam has longitudinal steel reinforcements only, and the concrete cover is 30 mm. Half of the beam is modelled, considering the symmetry. The fibre volume fraction is 1.5%. After trials-errors, the interfacial bonding strength t
s0
for the fibre-matrix and bar-matrix interfaces is 11MPa and 15MPa respectively, and the initial stiffness in the softening laws for the fibre-matrix and bar-matrix interfaces is 3×10⁵MPa/mm and 2×10⁵MPa/mm respectively. Other material properties are determined from the experiments (Lim and Hong, 2016), and their values are given in Table 1. In all simulations, the fibre-matrix and bar-matrix interfaces are assumed to have the same density as the matrix. Boundary conditions and geometries of the three-point bending beam. Material properties of the three-point bending beam (Lim and Hong, 2016).
Mesh sensitivity
Mesh sensitivity is analysed with the elemental size being 0.75mm, 1mm and 2mm. As an illustration, Figures 6(a)–(c) compare the three meshes for a beam having the same fibre distribution. The final crack patterns simulated from the three meshes using a tensile damage index DAMAGET≥0.9 are shown in Figures 6(d)–(f), with the simulated macro-cracks represented by red matrix elements. For comparison, the crack pattern measured from the experiment is shown in Figure 6(g). As expected, finer meshes result in narrower cracks, typical for the crack band concept used in the CDP model. The simulated load (F)-displacement (δ) curves from the three meshes are shown in Figure 7, along with the experimental results. Overall, they agree well in terms of both load-displacement curves and final crack patterns. Considering computational accuracy and efficiency, the mesh size 1mm is used in the following analysis of the impact of fibres for this example. The three FE meshes (a–c), and the simulated final crack patterns (d–f) for Example 1. Simulated load (F)-displacement (δ) curves from the three meshes for Example 1.

Load-displacement curves and cracking processes
We simulated four random fibre distributions and showed their load-displacement curves in Figure 8. The simulated final crack patterns and load-displacement curves agree well with the experimental results. Figure 9 illustratively shows five deforming stages, corresponding to Points 1–5 on the load-displacement curve respectively, snapshotted from one simulation. Cracks do not appear in the elastic stage (Figure 9(a)). At the peak load (Figure 9(b)), a few flexural cracks, emanating from the beam, pass through the main bars first and then propagate towards the loading point. The damage occurs on the bar-matrix interfaces, indicating an interfacial slip. After the peak load, an increased number of flexural cracks develop along the bottom and then propagate towards the loading point until a crack approaches the right support after the main bars yield (Figure 9(c)). This crack pattern remains unchanged except the two diagonal cracks, which continue to widen (Figure 9(d)) until a crack appears on the top surface, followed by a sudden failure (Figure 9(e)). This is a typical shear diagonal failure mode for RC beams without shear links under three-point bending (Khuntisa et al., 1999; Yang and Chen, 2005). Load (F)-displacement (δ) curves simulated for the five samples in Example 1. Typical cracking process and pattern simulated for Example 1

Example 2: UHPFRC beams reinforced with longitudinal bars and stirrups
This example models the three UHPFRC beams reported in Bahij et al. (2017). They are reinforced by longitudinal bars and stirrups under four-point bending. The parameters for the three beams are: Beam-A (a/d = 1.8, s = 200 mm), Beam-B (a/d = 1.8, s = 370 mm), and Beam-C (a/d = 2.6, s = 370 mm). Figure 10 shows illustratively the dimensions and boundary conditions of Beam-A. For all three beams, the volume fraction of steel fibre is 1.0%, the concrete cover is 35 mm, the effective depth d is 182.5 mm, the interfacial strength t
s0
is 10 MPa for the fibre-matrix interfaces and 15 MPa for the bar-matrix interfaces, the initial stiffnesses in the softening laws for the fibre-matrix and bar-matrix interfaces are 3×10⁵MPa/mm and 2×10⁵MPa/mm, respectively. Other material properties are taken from Bahij et al. (2017) and their values are given in Table 2. For each beam, five samples with the random fibre distribution in them independent of each other are simulated. Geometries and boundary conditions for the beams in Example 2 Material properties of the three ultra high performance fibre reinforced concrete beams (Bahij et al., 2017).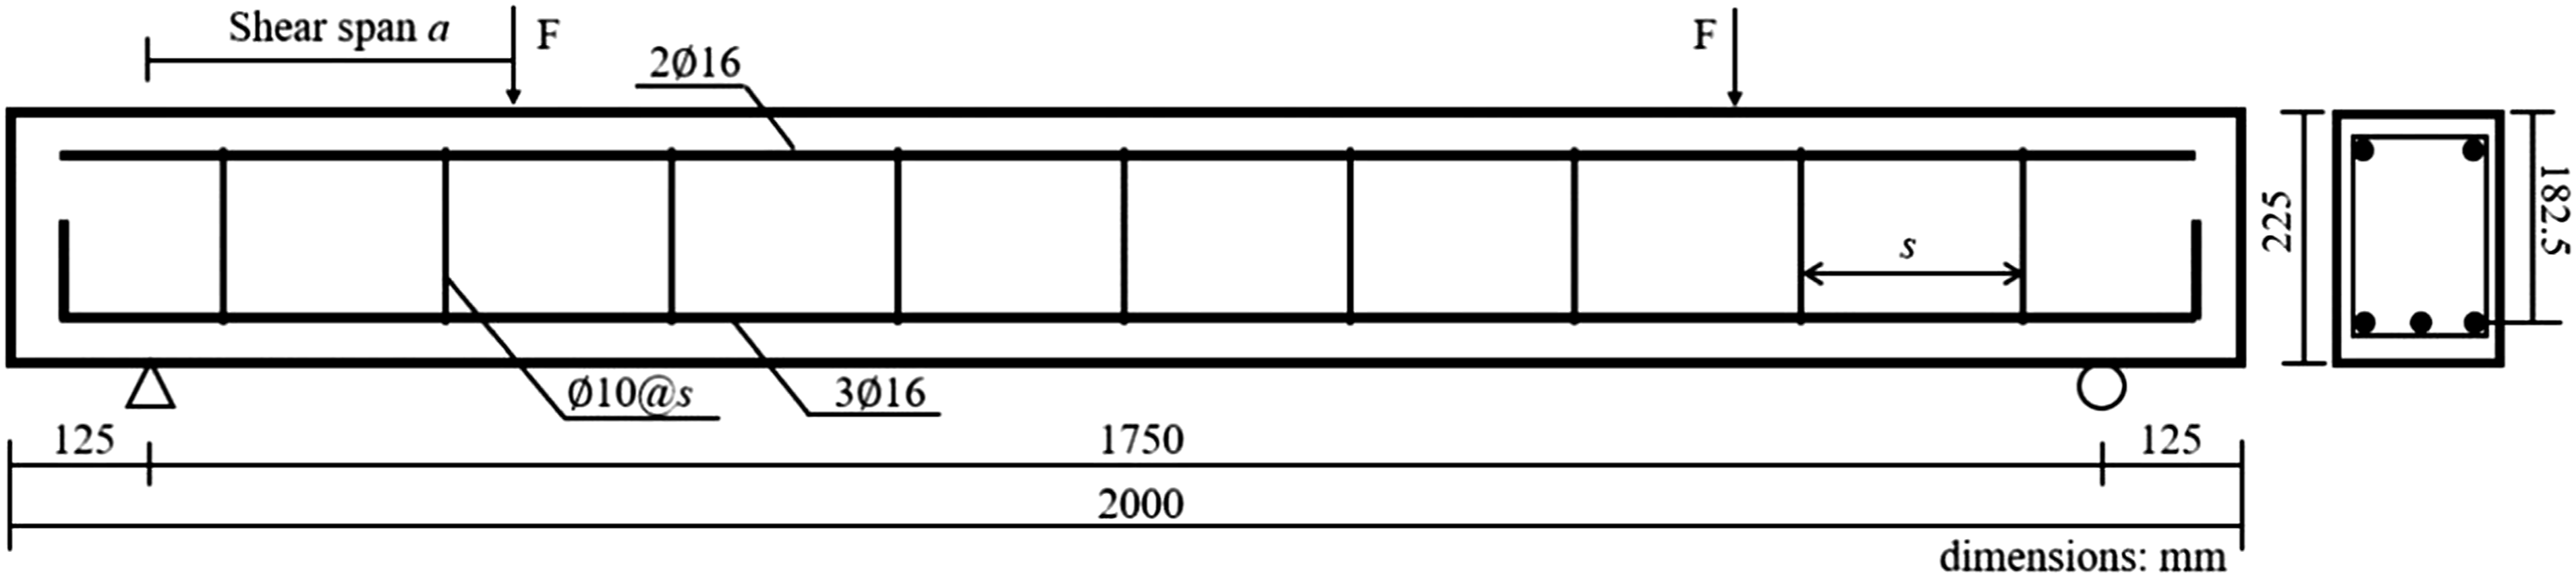

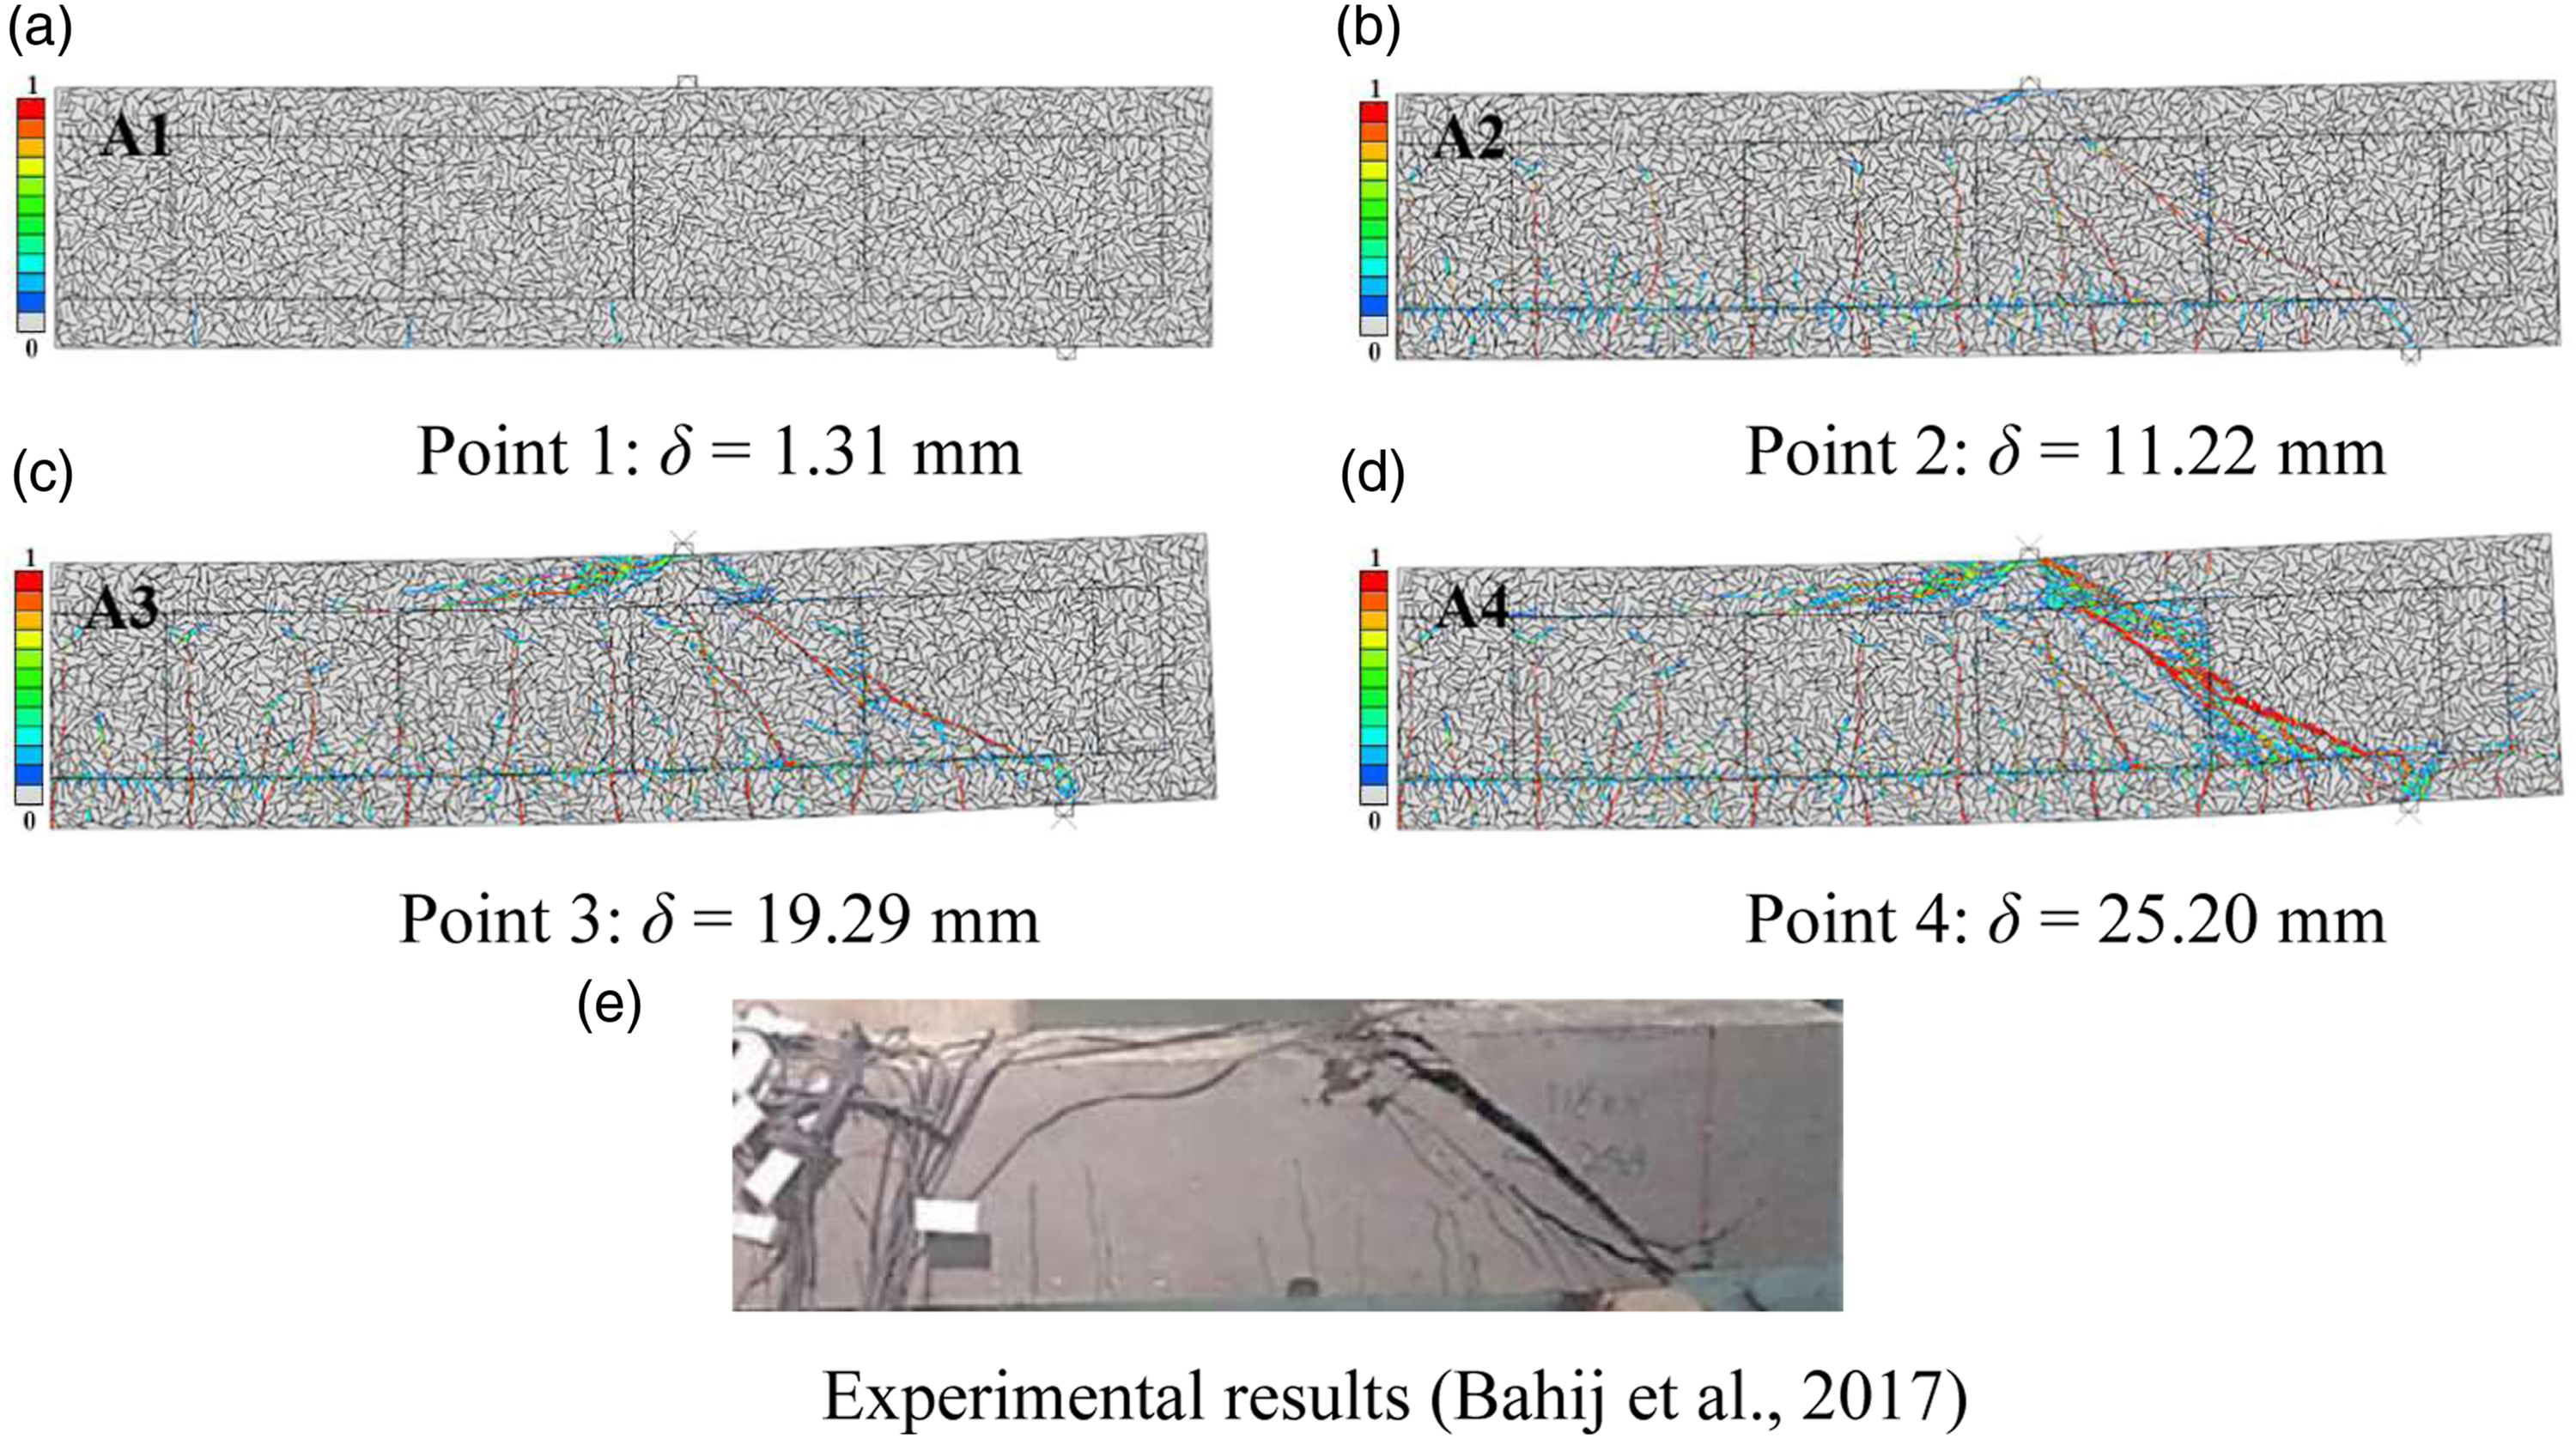
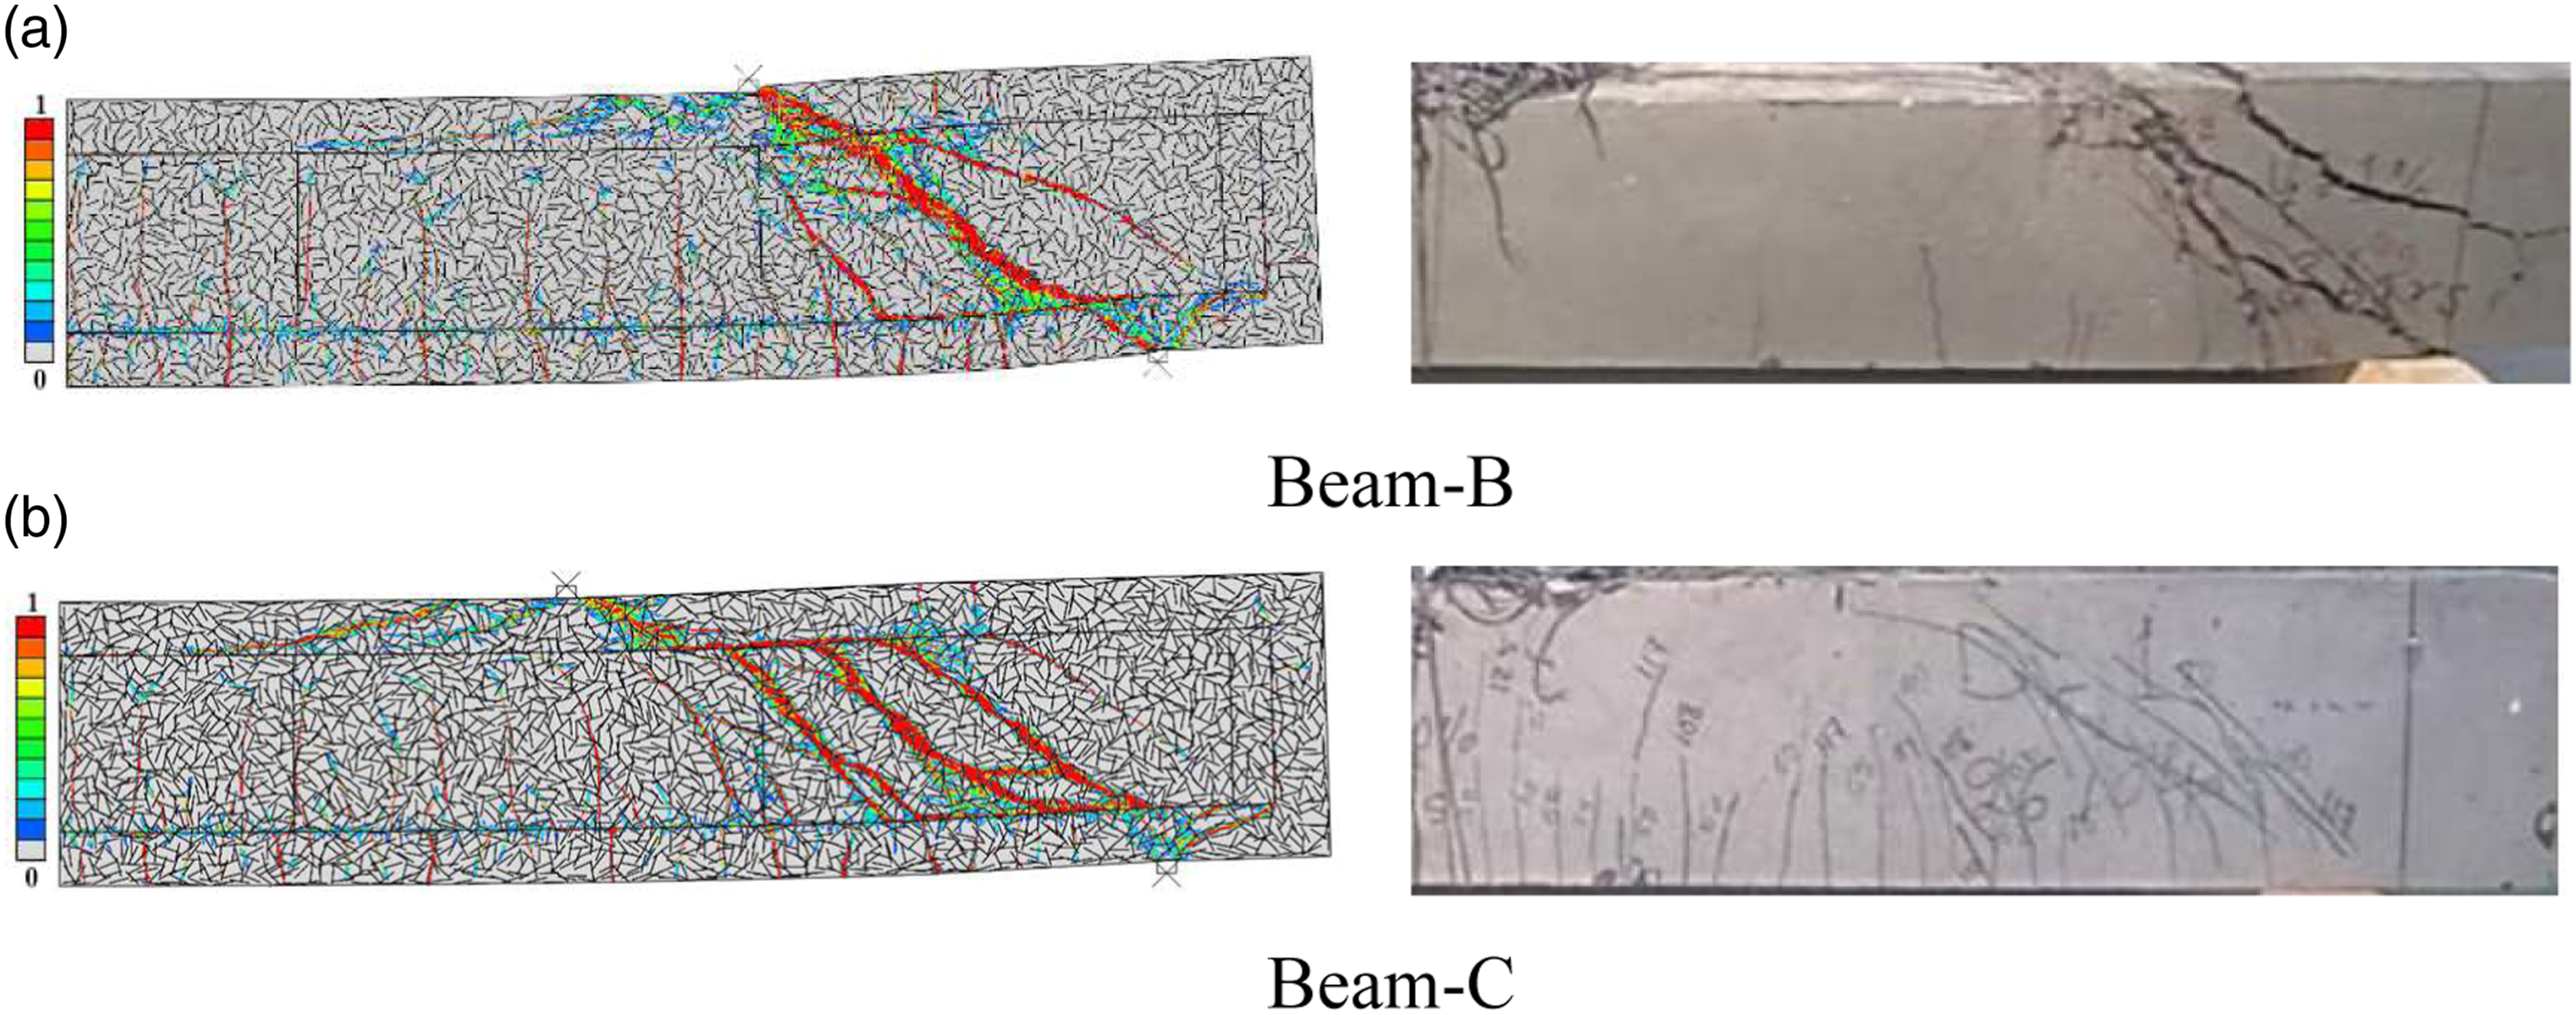
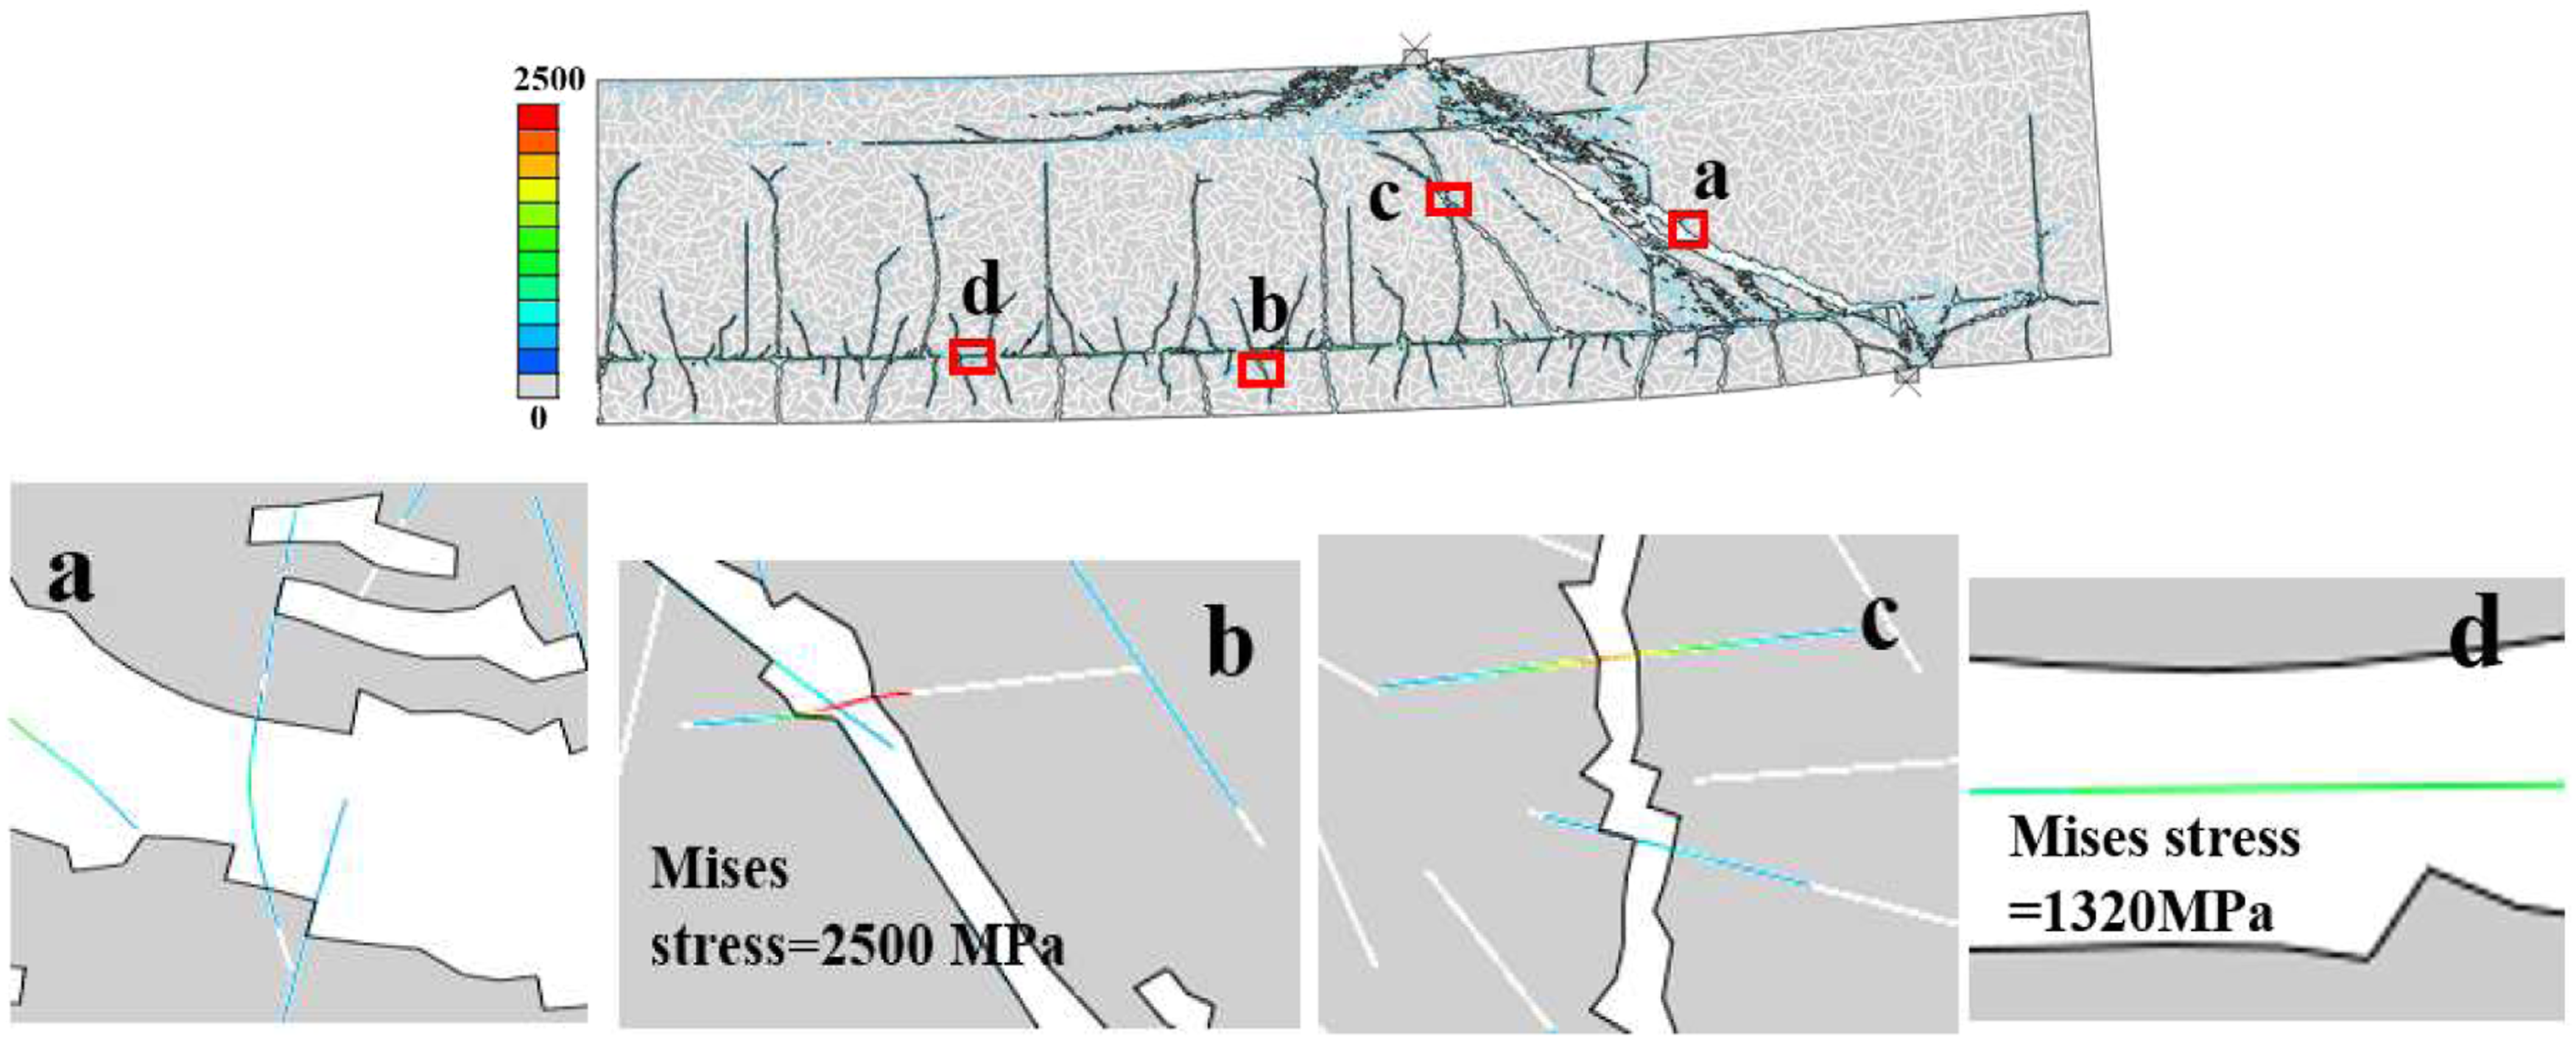
Figure 11 shows the simulated shear load-midspan displacement curves for the three beams in comparison with experimental data (Bahij et al., 2017). As anticipated, the peak shear load decreases as the stirrup spacing or the shear span to effective depth ratio increases, typical for RC beams. An increase in s (or lower shear reinforcement ratio) or a/d makes the structural behaviour more brittle in terms of lower deflection at the same loading level and lower dissipated energy (the area under the curve). In addition, the same level of randomness in the fibre distribution appears to result in less scattered data in the more brittle beams (Figures 11(b)–(c)). Figure 12 shows an exemplary cracking process in Beam-A, typical compression-shear failure for RC beams when a/d is in the range of 1–3. Figures 12(d) and 13 show the final crack patterns (at δ = 25.2 mm) simulated for the three beams, in comparison with the experimental observation (Figures 12(e) and 13). Figure 14 shows several local cut-off regions from Beam-A (Figure 16(d)) to visualize fibre deformation and stresses, in which the matrix elements with DAMAGET ≥ 0.6 are removed to highlight the fibres. In the figures, fibre bending and pull-out (Figure 14(a)), fibre yielding (Figure 14(b)), fibre bridging (Figure 14(c)) and steel bar yielding (Figure 14(d)) are all visible. Simulated shear load-displacement curves in comparison with experimental results for the three beams in Example 2 Simulated cracking process and pattern in comparison with experimental data for Beam-A in Example 2 Simulated final crack patterns in comparison with experimental data for Beam-B and Beam-C in Example 2 Cut-off views of simulated failure modes (Figure 12(d)) for Beam-A in Example 2. Change in load with displacement for different A
f
(a); changes in the shear strength and the coefficient γ
f
with A
f
(b, c).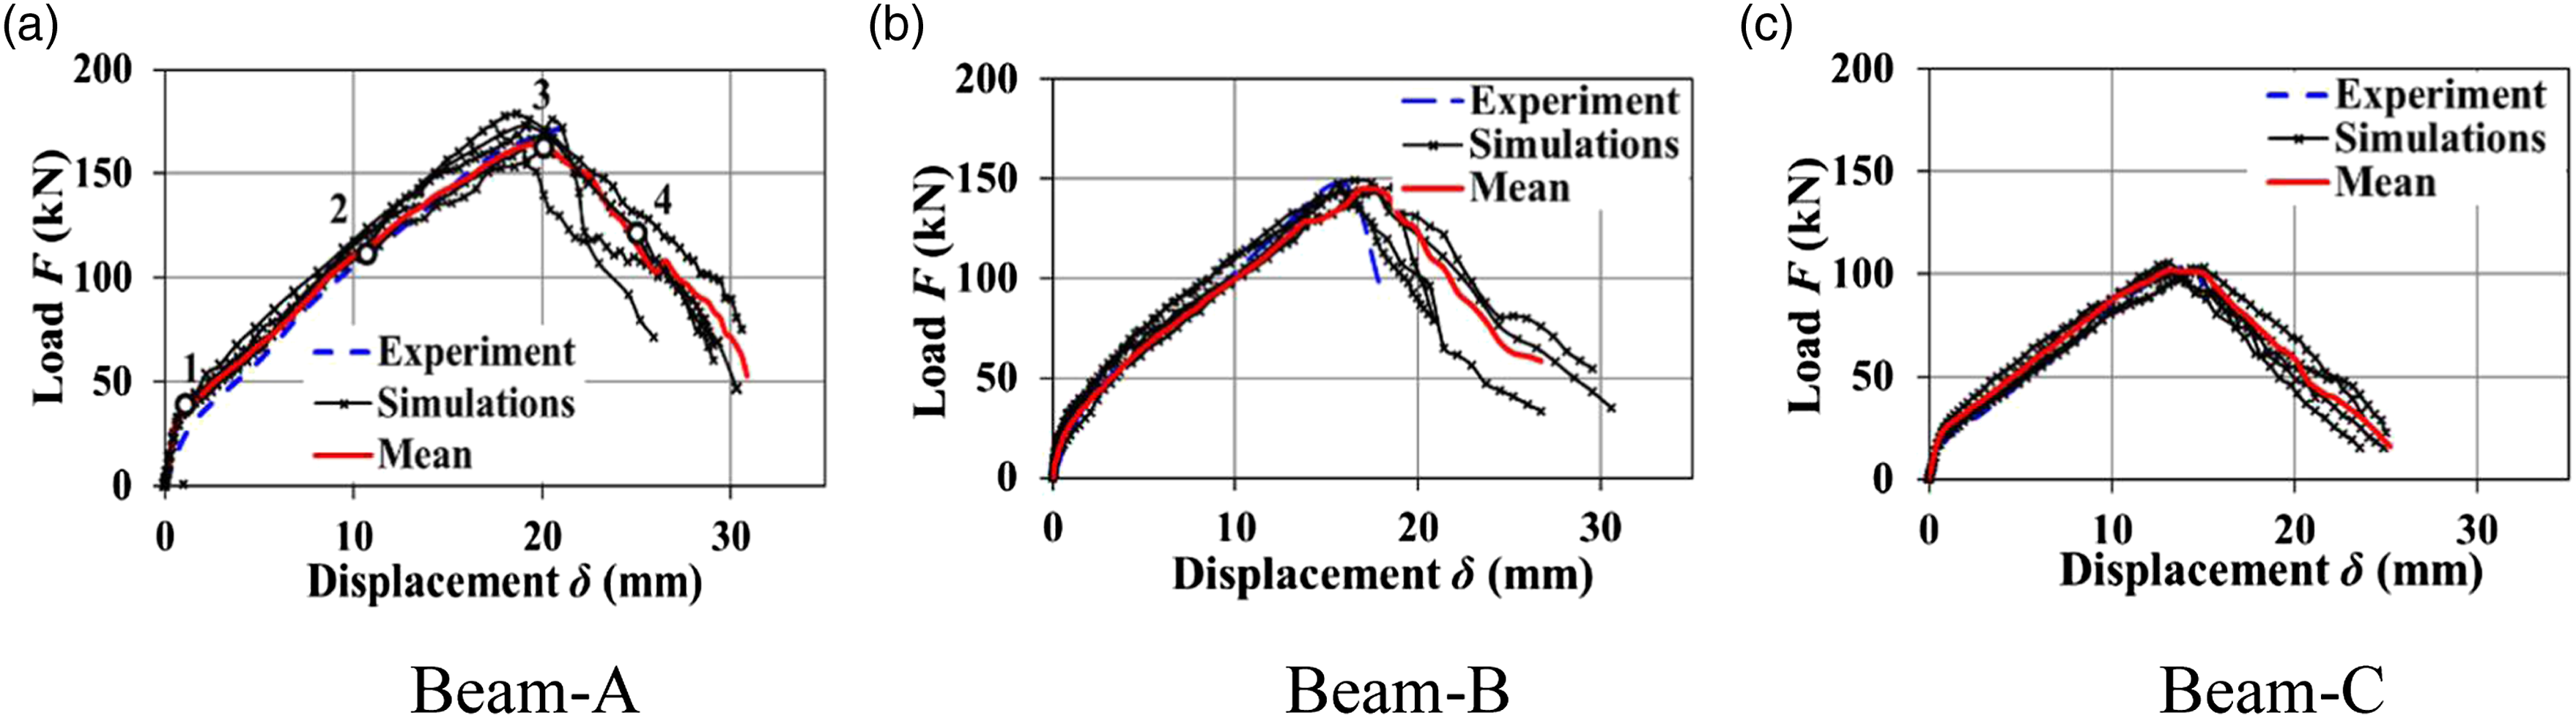
Using the meso-scale model to improve the shear design of UHPFRC beams
The close agreement between the simulated and measured crack patterns and load-displacement curves for beams with different material properties and under various bending conditions indicates that the 2D models capture the mechanisms underlying beam failures at material scale. They can thus be used to help design UHPFRC beams. Taking the reinforced UHPFRC beam in Example 2 as an example, we explain how the mesoscale model can improve the shear design, considering four key parameters, each varyingwidely to cover the values possibly used in application.
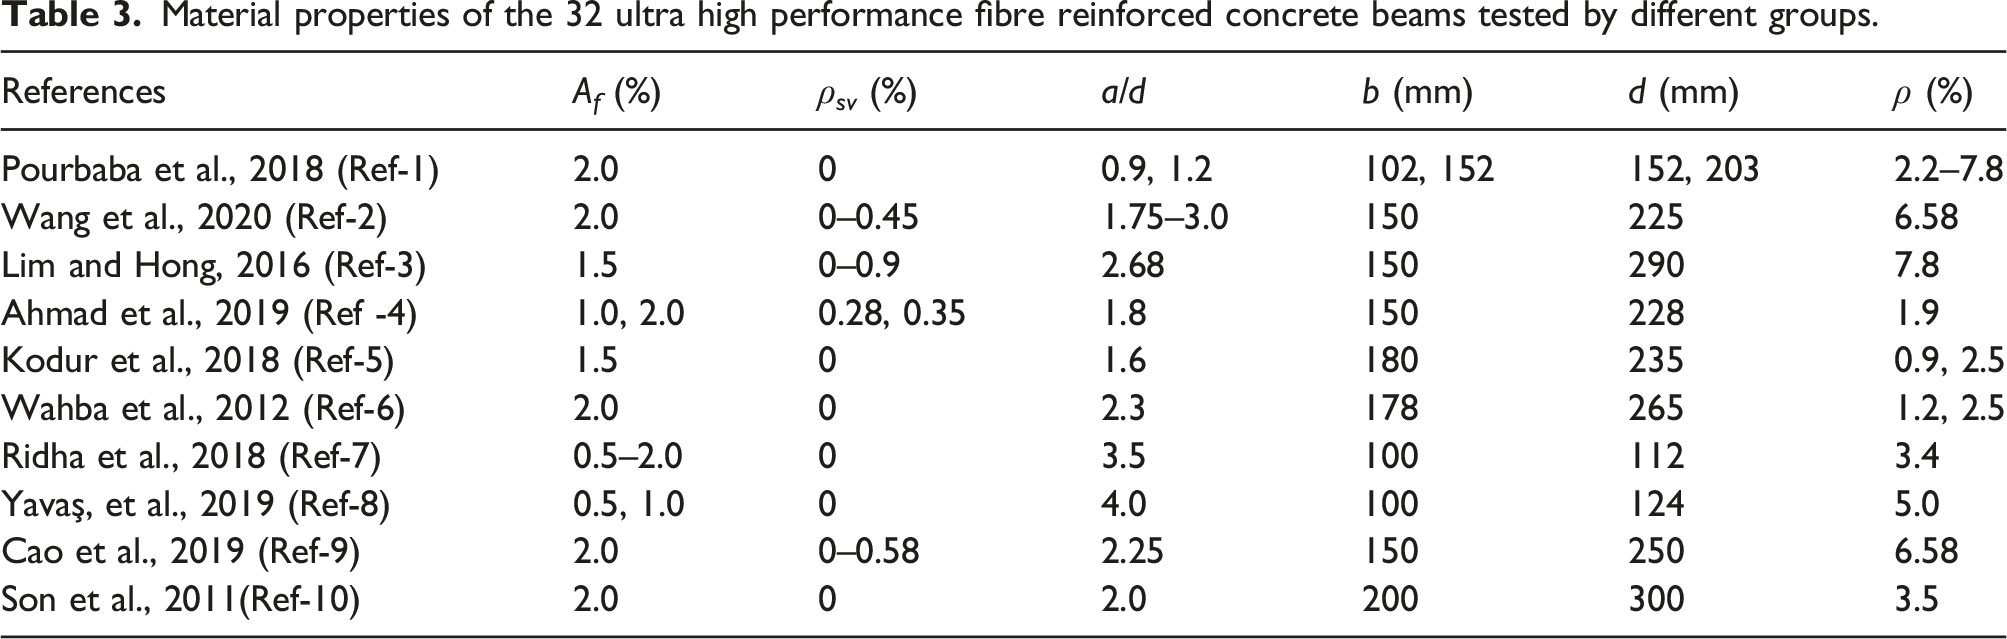
The values of the four parameters are: fibre volume fraction A f (0.5%, 1.0%, 1.5% and 2.0%), the shear span-to-depth ratio a/d (1.0, 1.4, 1.8, 2.2, 2.6, 3.0 and 3.5), the shear reinforcement ratio ρ sv (1.04%, 0.52%, 0.35% and 0.26%), and the main bar (or flexural) reinforcement ratio ρ (1.29%, 1.94%, 2.58% and 3.23%). The reference parameters are ρ sv = 0.28% (or s = 370 mm), A f = 1.0%, a/d = 1.8 and ρ = 1.94%, associated with Beam-B in Example 2. Overall, there are 16 combinations of parameters in the analyses. For each combination, 30 samples are randomly generated, with fibre distribution in them independent of each other. The shear strength calculated from the simulations is compared with that estimated from the design equation recommended by AFGC (AFGC, 2002), from which an improved equation is proposed.
The AFGC recommended shear strength equation for UHPFRC beams
The AFGC recommended design equation (AFGC, 2002) for shear strength of reinforced UHPFRC beams is:

V
s
is calculated from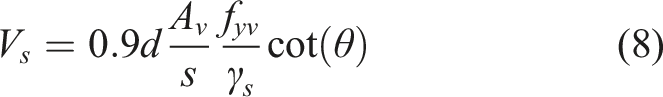
V
fb
is calculated from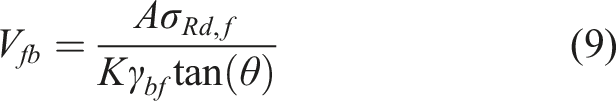

Effects of the fibre volume fraction
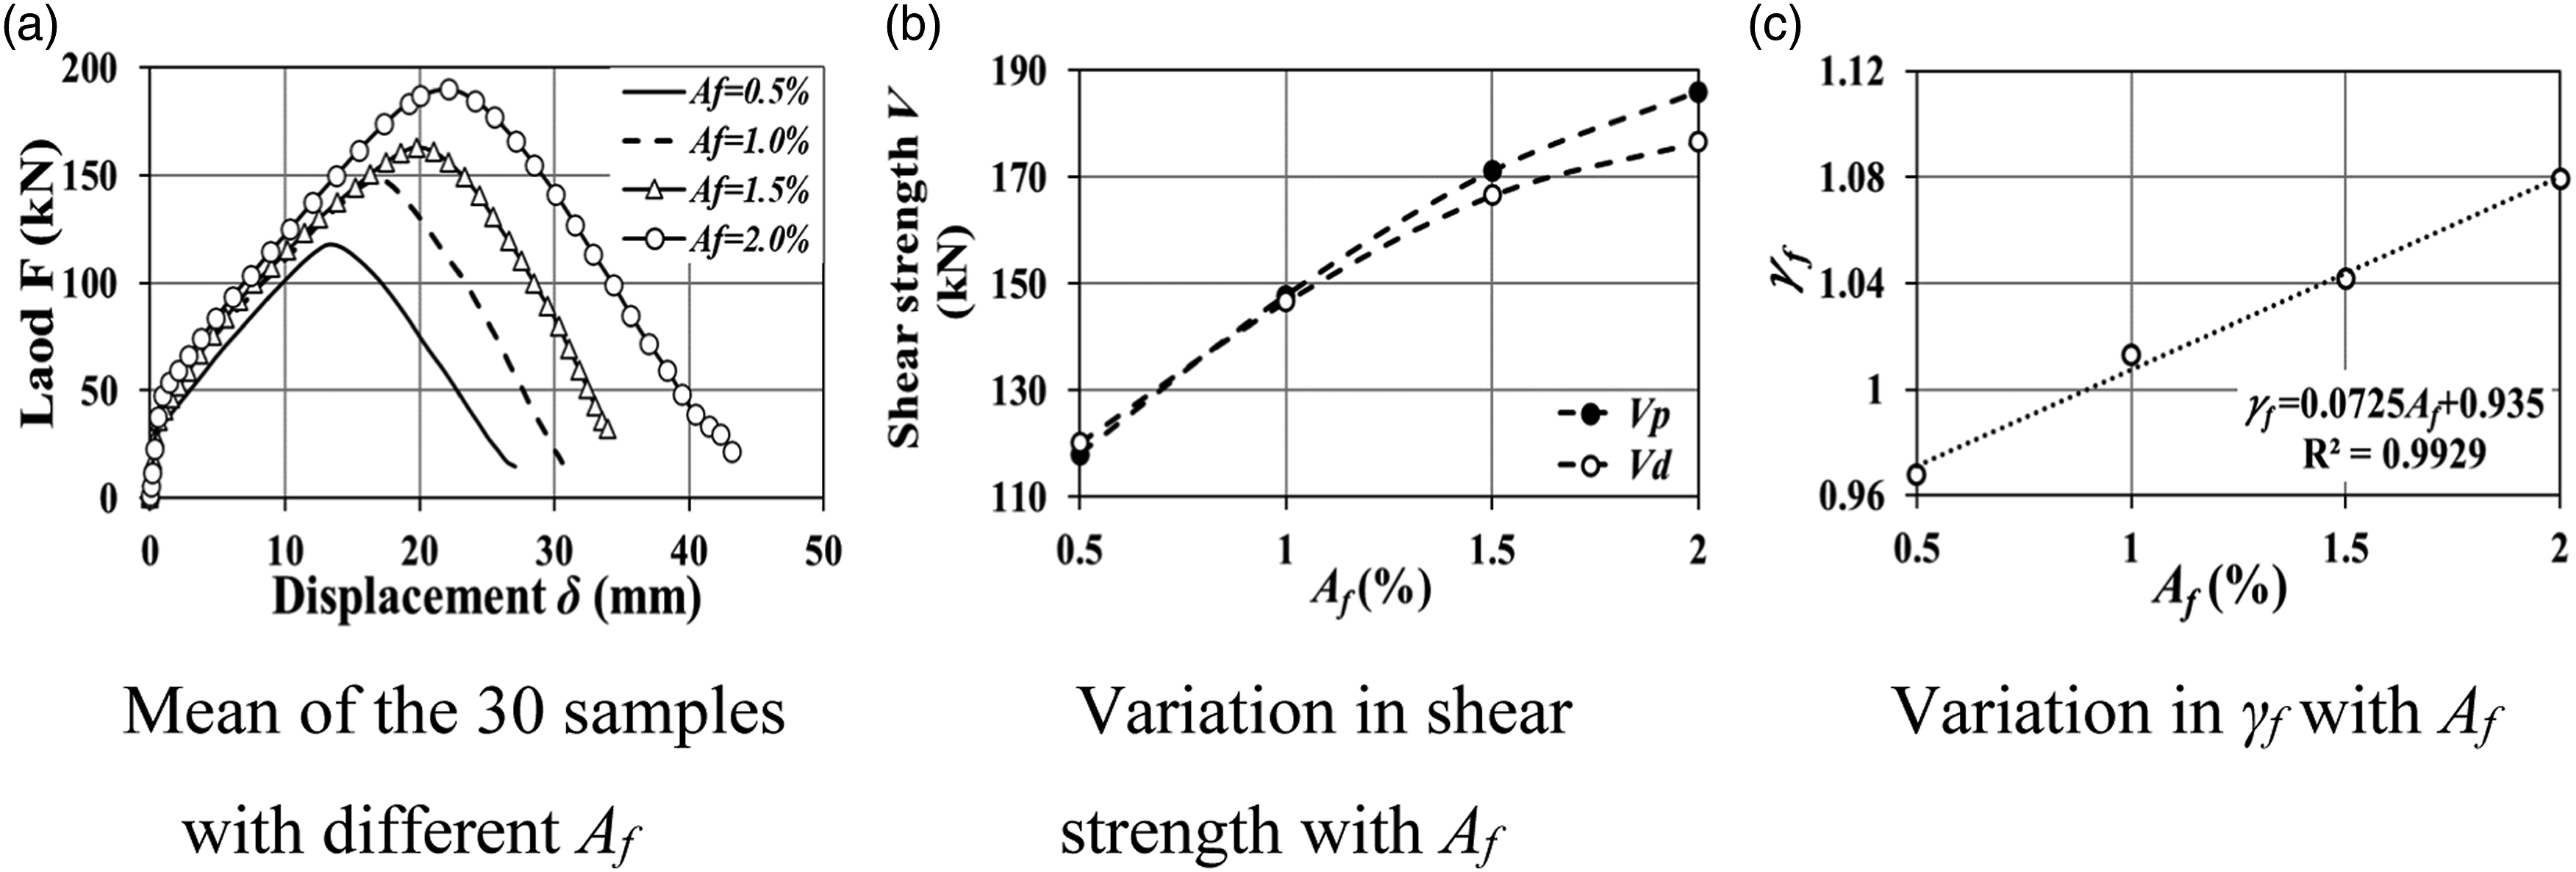
Figures 15(a)–(d) show the predicted shear load-midspan displacement curves calculated from the 30 samples with different A
f
. As an example, the effects of sample number on peak shear load V
p
(the predicted shear strength) and its standard deviation for A
f
= 1.0% are shown in Figures 15(e) and 15(f), respectively. It is clear that 30 samples are sufficient to obtain statistically convergent results. Figure 16(a) shows the mean shear load-midspan displacement curves of the 30 samples for different A
f
, indicating that A
f
affects both the shear strength V
p
and the post-peak response (or ductility) significantly. The shear load-displacement curve simulated for the 30 samples with different A
f
.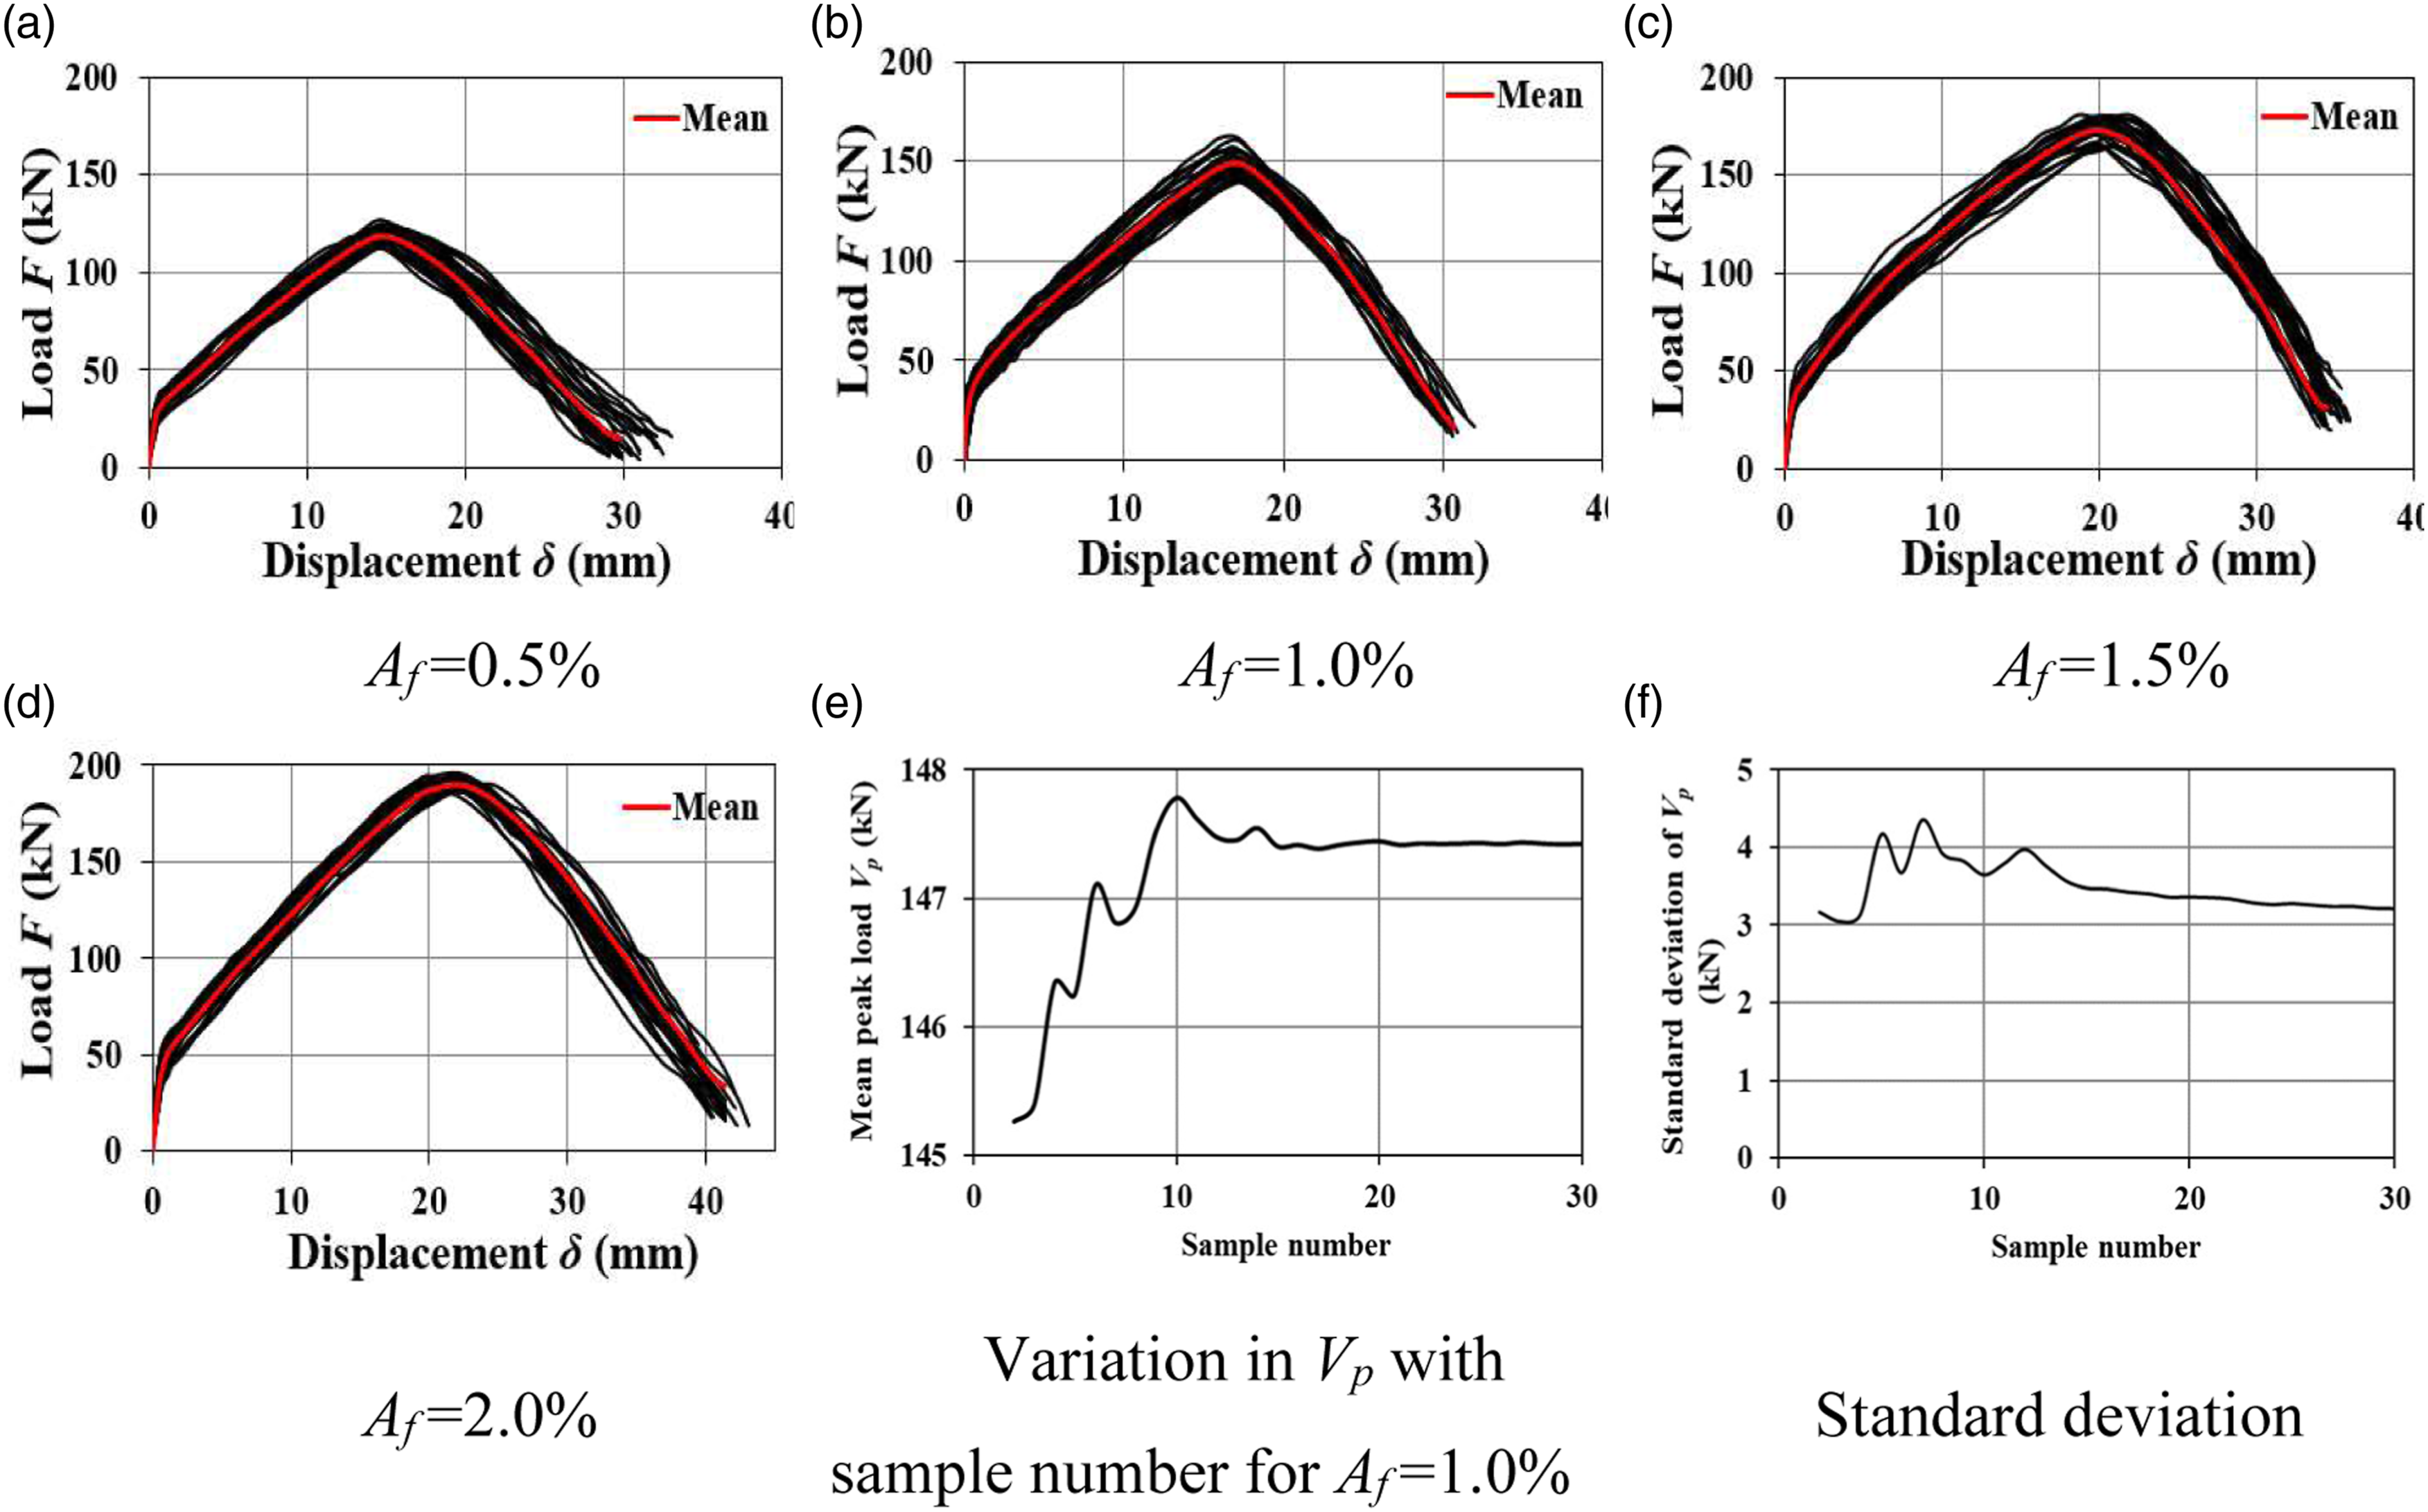
The variations in V
p
and V
d
calculated from equation (6) with A
f
are shown in Figure 16(b). V
p
increases asymptotically as A
f
increases, indicating the existence of an optimal fibre volume fraction for design. This is typical for reinforced UHPFRC beams (Baby et al., 2013; Bertram and Hegger, 2012). The difference between V
p
and V
d
is negligible when A
f
is less than 1.0%, but it increases by 2.7% and 5.1% when A
f
increases to 1.5% and 2.0%, respectively, indicating that the AFGC design equation underestimates the shear strength for A
f
>1.0%. This underestimation can be corrected by multiplying V
d
by a coefficient γ
f
calculated as follows:
The accuracy of equation (11) is shown in Figure 16(c) (R2 = 0.9929).
Effects of the shear span-to-depth ratio (a/d)
Figure 17(a) shows the mean shear load-midspan displacement curves calculated from the 30 samples for different a/d, as well as those in Figures 13(a)–(b) for a/d = 1.8 and 2.6. When a/d increases from 1.0 to 2.6, V
p
decreases sharply from 267.5kN to 105.7kN. A further increase in a/d beyond 2.6, however, does not lead to a noticeable change in V
p
. This is consistent with experimental results of conventional RC beams and UHPFRC beams (Bertram and Hegger, 2012; Tadepalli et al., 2015). Change in load with displacement for different a/d (a); changes in the shear strength and the coefficient γ
a
with a/d (b, c).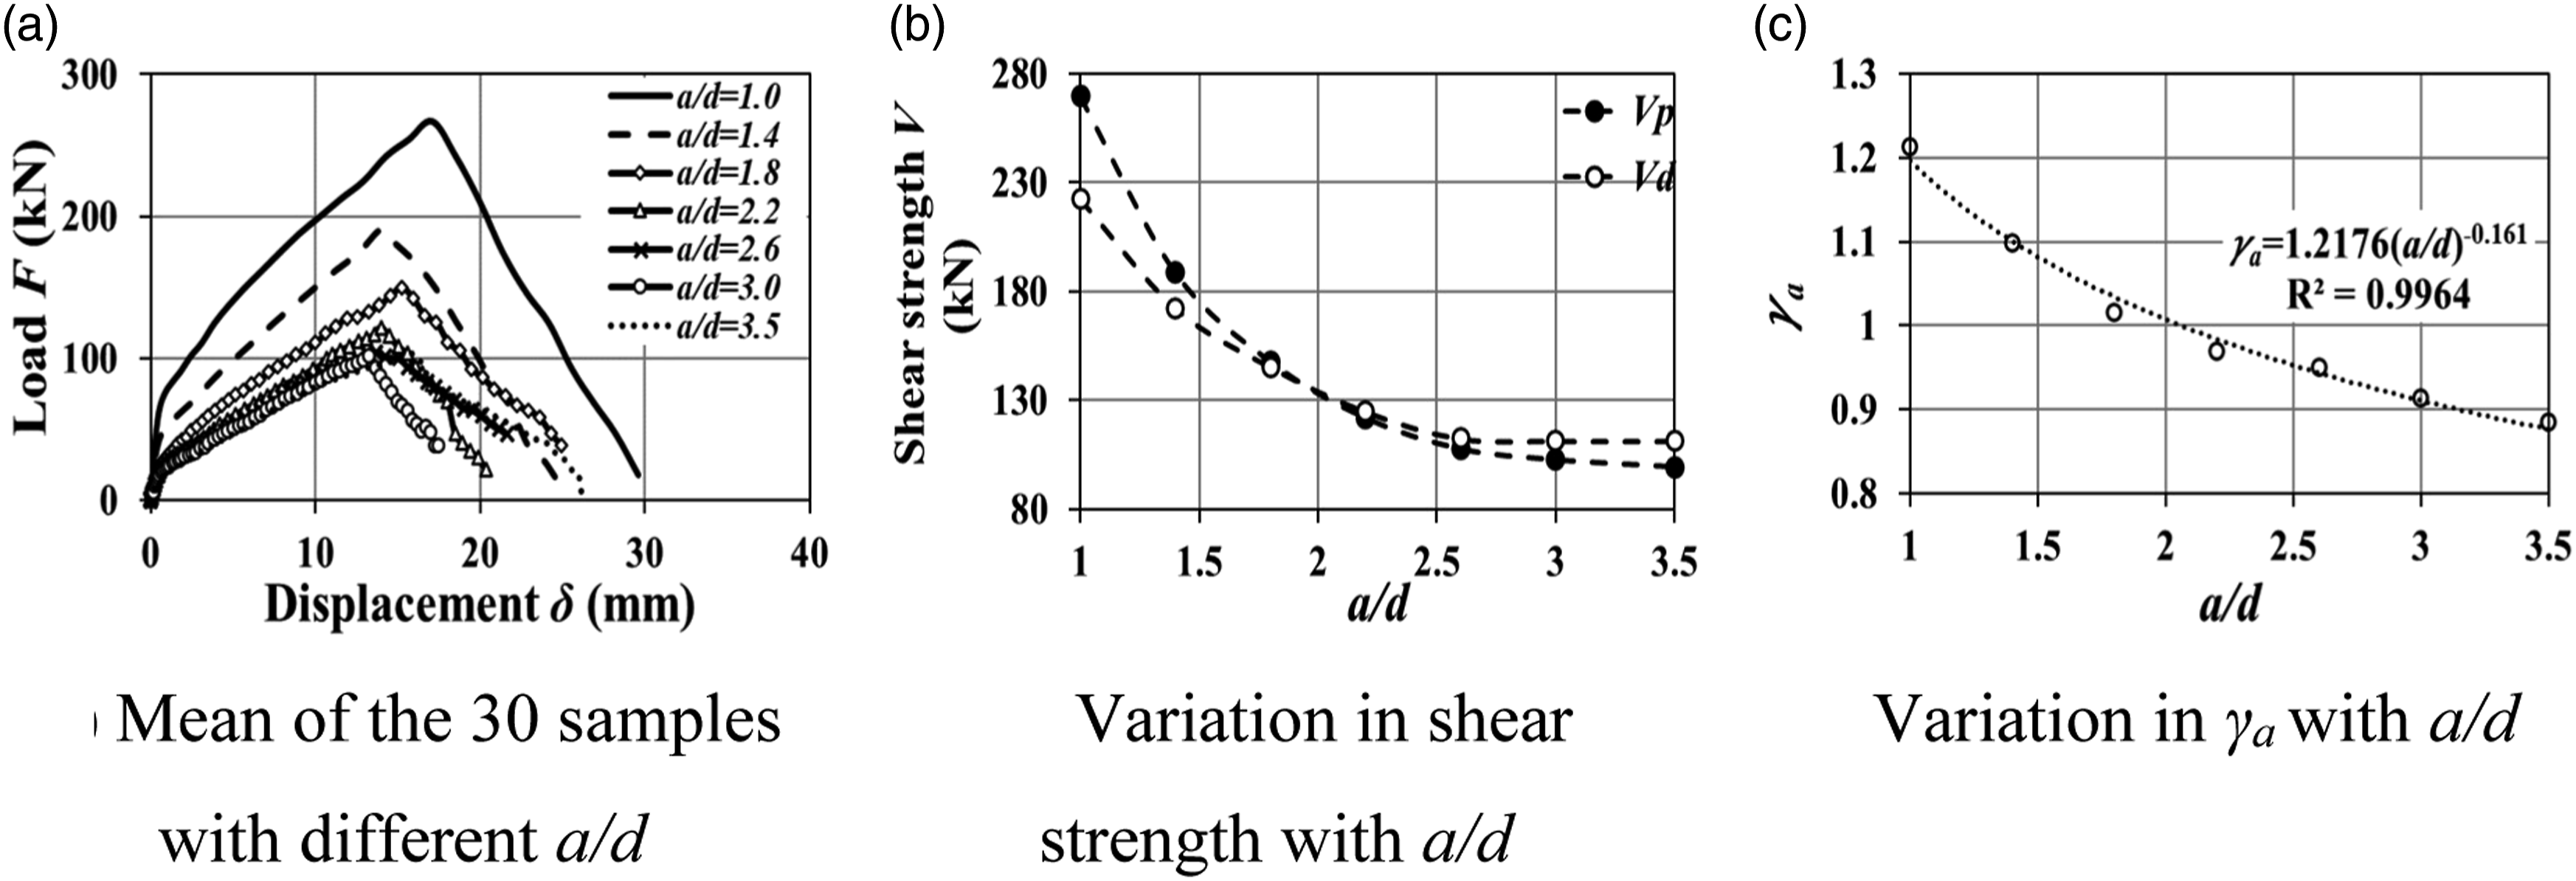
The variations in V
p
and V
d
with a/d are shown in Figure 17(b). V
p
and V
d
are close only when a/d is in the range of 1.8–2.6. Since the AFGC design equation does not explicitly consider the effects of a/d, it significantly underestimates the shear strength by 17.9% when a/d = 1.0 and 12.1% when a/d is 3.0 and 3.5. Eurocode 2 accounts for the increase in the shear strength of RC beams when a/d is in the range of 0.5–2.0 by a multiplier β = 2d/a (2004). Applying this approach to the AFGC design equation, however, leads to large errors when a/d is low. Multiplying V
d
by a coefficient γ
a
calculated as follows can substantially improve the accuracy:
The accuracy of equation (12) is shown in Figure 17(c) (R2 = 0.9964).
Effects of the shear reinforcement ratio (ρ sv )
Figure 18(a) shows the mean load-midspan displacement curves calculated from the 30 samples for different ρ
sv
. The variations in V
p
and V
d
with ρ
sv
are shown in Figure 18(b). They are virtually identical, indicating that the AFGC design equation describes the effect of stirrups well. When ρ
sv
increases from 0.26% to 1.04%, the shear strength increases by 57.8% from 137.3kN to 216.7kN, indicating that, similar to conventional RC beams, the use of shear links is most effective to enhance the shear strength of UHPFRC beams. Change in load and displacement for different ρ
sv
(a); change in shear strength with ρ
sv
(b).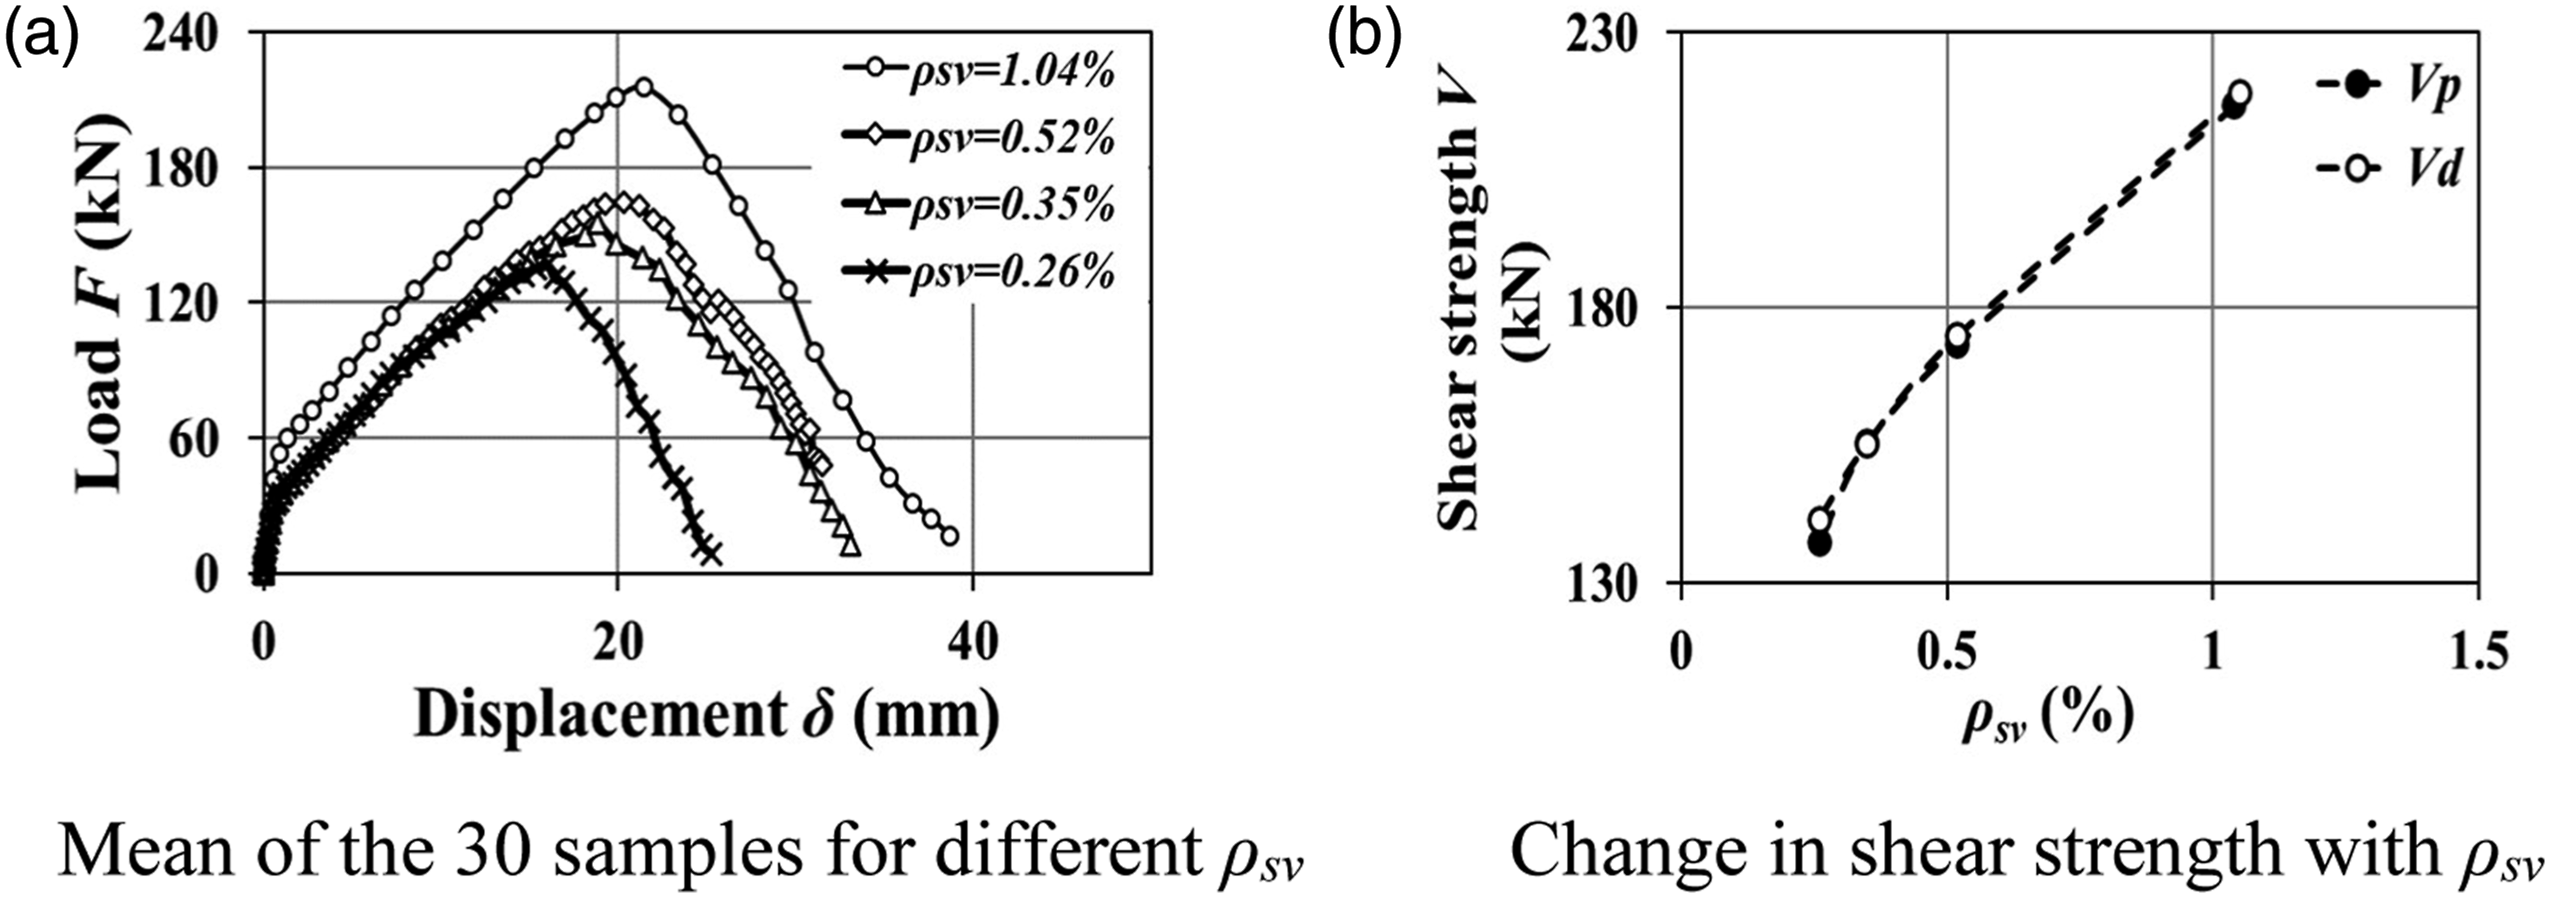
Effects of the main steel-bar reinforcement ratio (ρ)
The dowel action refers to the resistance of flexural reinforcement to opening and slipping of the shear cracks. In the design of conventional RC beams, because of the low tensile strength of the concrete cover and the low bond strength of the steel bars-matrix interfaces, this resistance is insufficient and often omitted. SFRC materials have higher tensile strength and bonding, and the dowel actions of SFRC beams are thus much stronger (Narayanan and Darwish, 1987; Kwak et al., 2002; Sharma, 1986; Pourbaba et al., 2019). Previous study showed that the dowel action could contribute 10%–35% of the shear resistance of SFRC beams without stirrups (Zarrinpour and Chao, 2017).
Figure 19(a) shows the mean shear load-midspan displacement curves calculated from the 30 samples for different ρ. When ρ increases from 1.29% to 3.23%, V
p
increases by 9.6% from 143.1kN to 156.8kN, because increasing ρ increases the flexural steel bars, thereby enhancing the dowel action. This is consistent with experimental results of steel-bar reinforced UHPFRC beams (Hasgul et al., 2018; Meda et al., 2012). Figure 19(b) shows the variations in V
p
and V
d
with ρ. Equation (6) does not consider ρ and the errors of the shear strength estimated by it varies with ρ. When ρ is 3.23%, equation (6) underestimates the shear strength by 6%, while when ρ is 3.23%, it overestimates the strength by 3.21%. The overestimated shear strength is due to the negative effect of insufficient flexural reinforcement on shear strength and ductility, which results in stress concentration from the bars. This is consistent with the experimental results for SFRC and UHPFRC beams when ρ is low (Dancygier and Berkover, 2016; Hasgul et al., 2018; Turker et al., 2019; Yang et al., 2010; Yoo and Yoon, 2015). Therefore, low flexural reinforcement ratio should be avoided in design. Change in load with displacement for different ρ (a); change in the shear strength and the added term V
ρ
with ρ (b, c).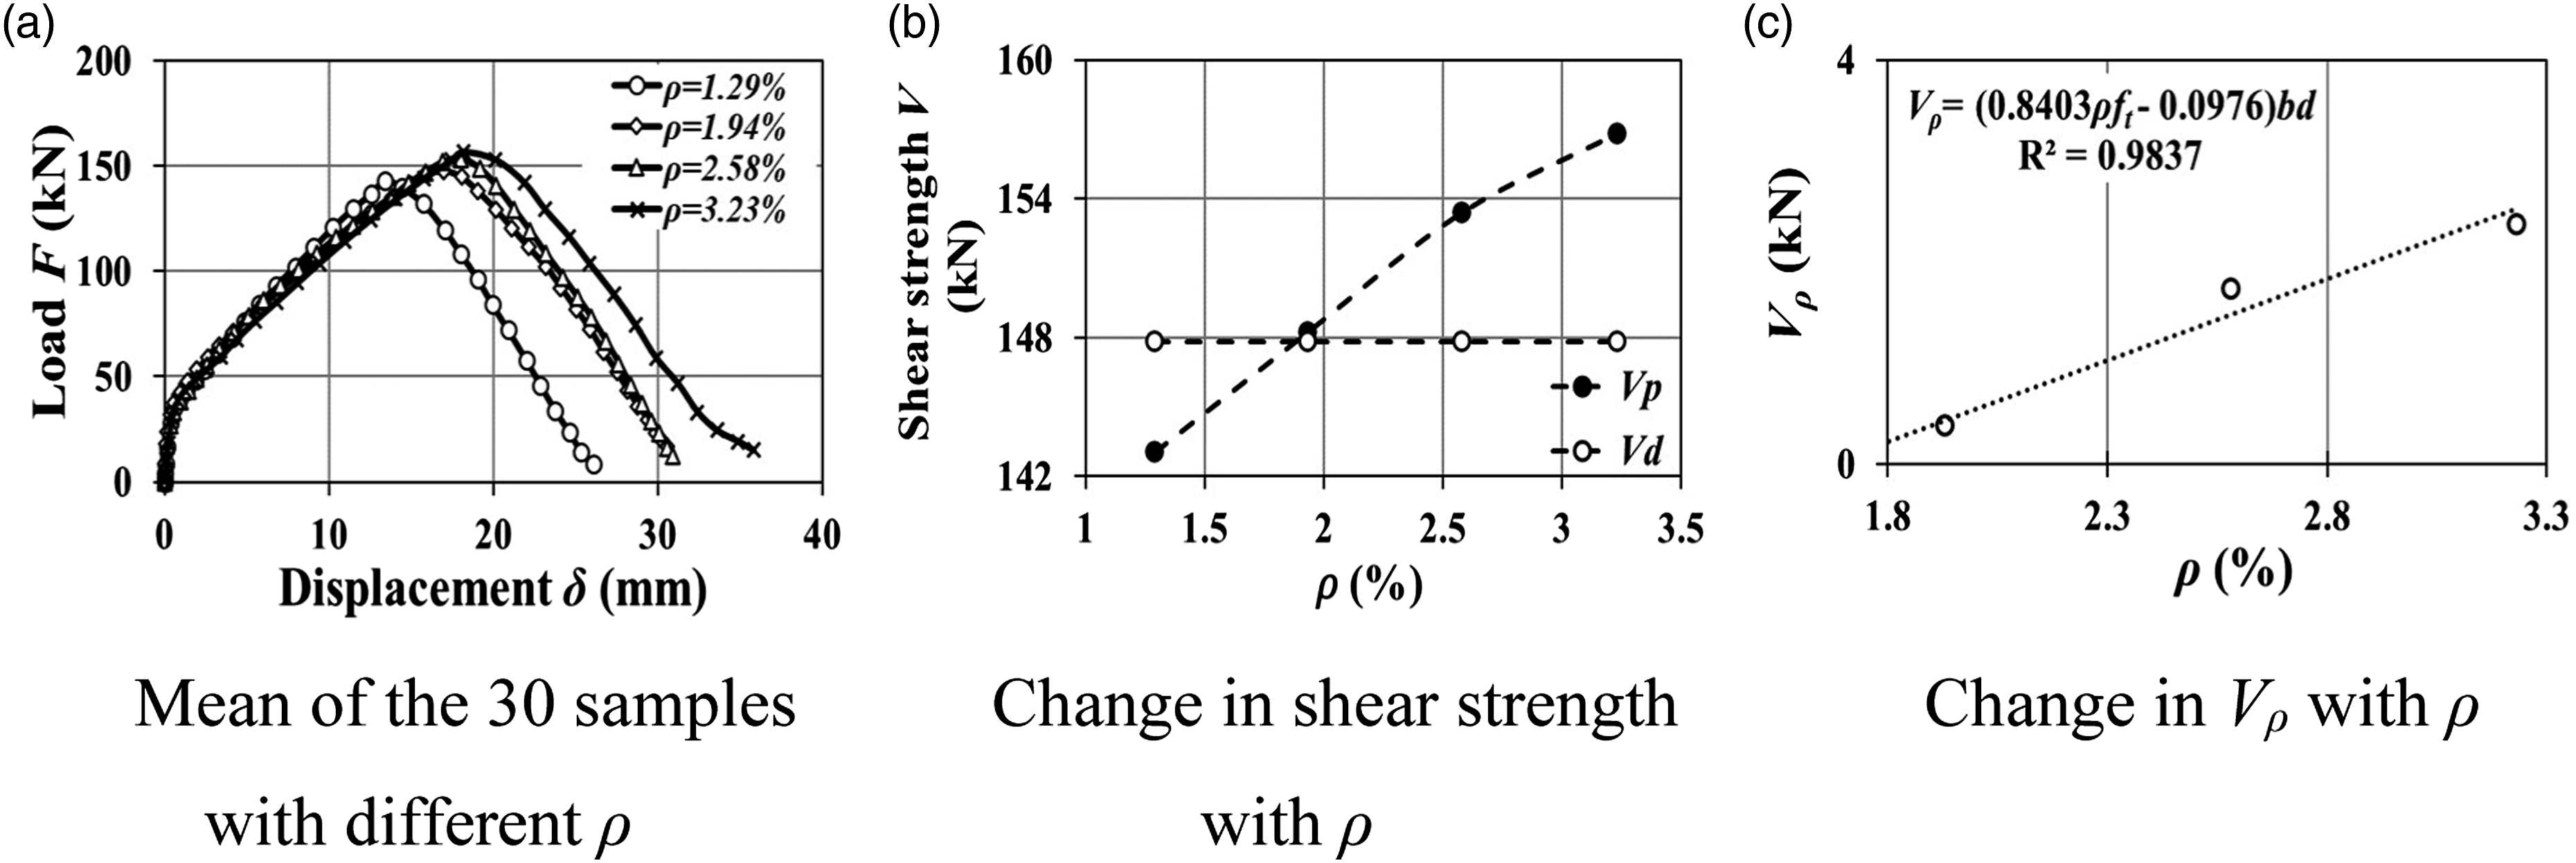
The dowel action in RC beams is usually calculated analytically using concrete tensile strength (Taylor, 1969), because the concrete cover would fail via splitting when the acting dowel force is large. Based on our simulations, we add a term V
ρ
calculated as follows to V
d
to account for the contribution of the dowel action.
The accuracy of equation (13) is shown in Figure 19(c) (R2 = 0.9837):
The improved design equation

Material properties of the 32 ultra high performance fibre reinforced concrete beams tested by different groups.
Conclusions
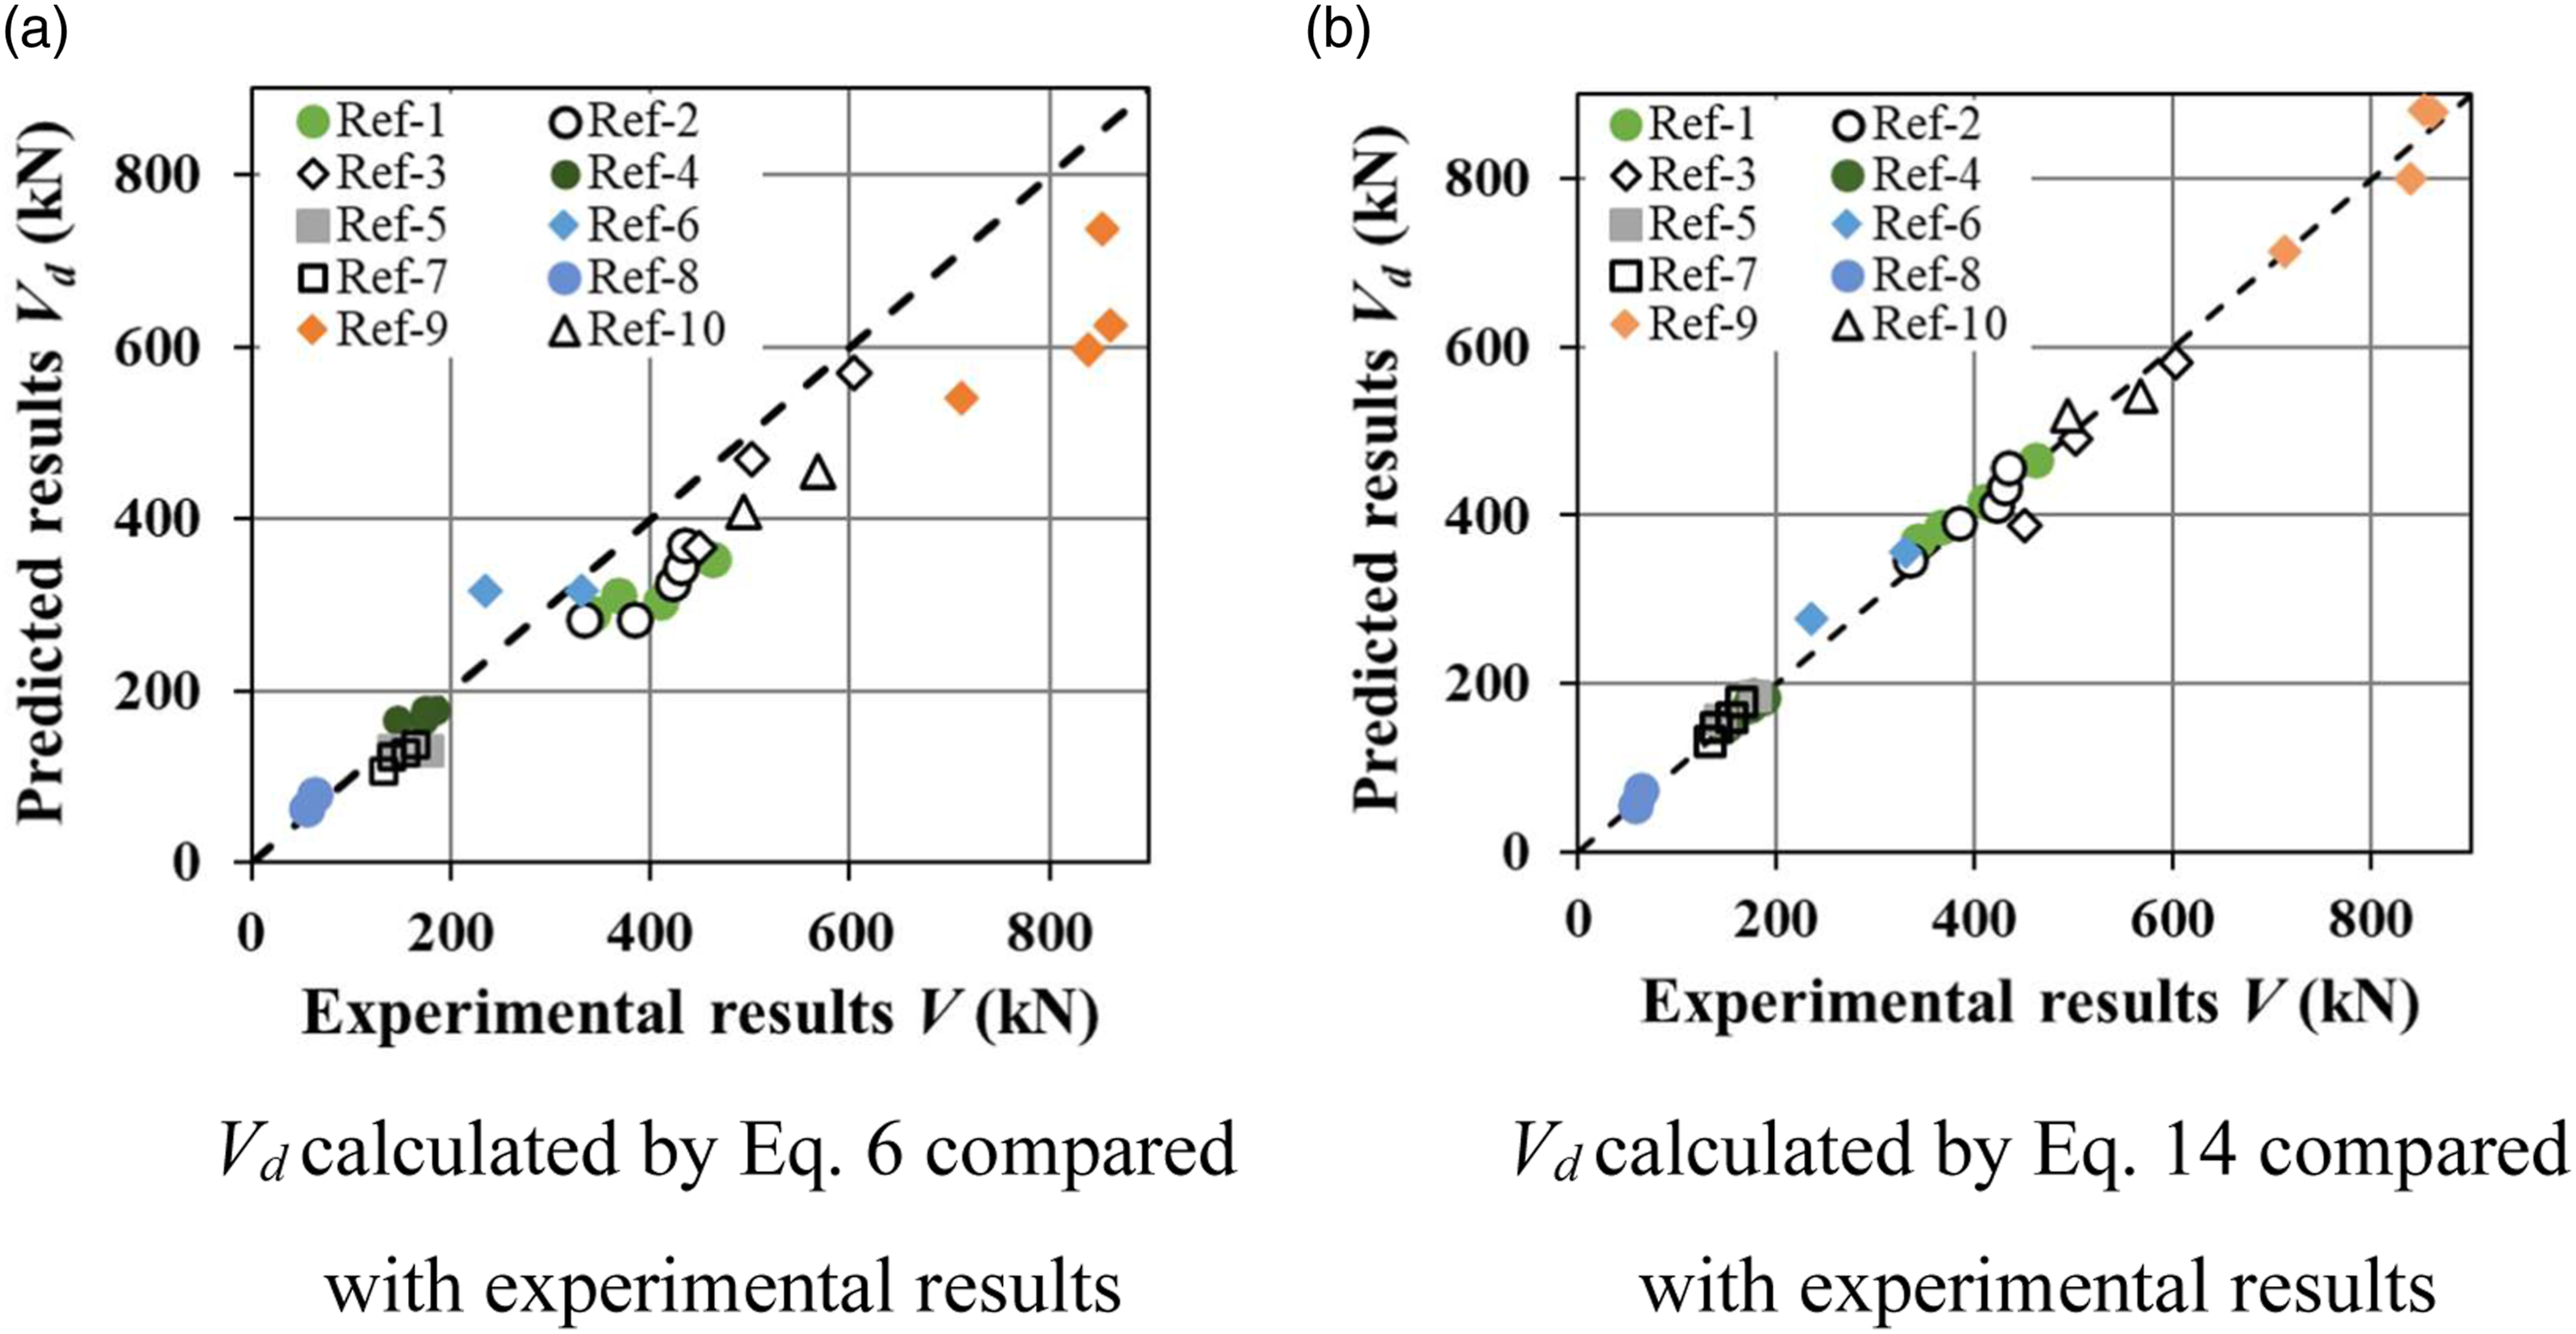
Two-dimensional nonlinear meso-scale FE models have been developed to simulate failing processes of bar-reinforced UHPFRC beams, with the steel fibres and bars, and fibres/bars-matrix interfaces explicitly resolved. The main conclusions are: (1) Validation against experimental data for two typical beams shows that the models accurately reproduce both failure patterns and load-displacement curves. The close agreement between them proves that the 2D models are efficient and adequate to analyse 3D beams, when the fibre area fraction in the 2D models is approximated by 63.1% of the fibre volume fraction in 3D and the out-of-plane thickness is at least 5 times the fibre length. (2) All simulations show that the shear strength of typical bar-reinforced UHPFRC beam increases with the increase in fibre content, shear and flexural reinforcement ratios, but decreases with the increase in shear span-to-depth ratio. (3) A new equation is proposed based on extensive mesoscale parametric simulations and quantitative analyses for designing the shear strength of bar-reinforced UHPFRC beams. The equation considers the contributions of fibre content, shear and flexural reinforcement ratios, and the shear span-to-depth ratio. Its improvement over the AFGC shear design equation is demonstrated based on experimental results of 32 beams with various design parameters. (4) It is shown that the meso-scale models are not only feasible for elucidating the mechanisms underlying beam failure at material scale, but also potential for improving structural designs of the UHPFRC beams.
Footnotes
Acknowledgment
Y Zhang would like to thank the financial support of a full PhD studentship from Coventry University, UK.
Declaration of conflicting interests
The author(s) declared no potential conflicts of interest with respect to the research, authorship, and/or publication of this article.
Funding
The author(s) disclosed receipt of the following financial support for the research, authorship, and/or publication of this article: This study is funded by National Natural Science Foundation of China (No. 52173300 and 51974202), Key Research and Development Programme of Hubei Province (No. 2020BAB052) and Sino-German Center for Research Promotion (Mobility Programme No. M-0172).