
Abstract
To study the blast resistance of reinforced concrete slabs under fire, the finite element software ABAQUS is used to simulate the static loading test of RC slabs under fire and the blast test of RC slabs at ambient temperature. After being validated, the FE model is employed to investigate the failure mechanism of RC slabs under the combined action of fire and blast using thermo-mechanical coupling technique. Moreover, the effects of fire exposure duration, scaled distance, and charge weight on the blast resistance of the RC slabs after fire are studied. The results show that blast results in the local shear failure in the center of the RC slab subjected to fire. Then, the whole floor slab undergoes flexural failure. With the increase of fire duration, the damage of RC slabs becomes more severe, and the plastic deformation gradually enables energy dissipation. The scaled distance and charge weight have the most significant influence on the failure mode and dynamic response of the RC slabs. The smaller the scaled distance, the more serious damage to the RC slabs. When the scaled distance is greater than 3 m/kg1/3, no damage occurs. The larger the charge weight, the more serious damage to the RC slabs.
Introduction
In recent years, fire accidents occur frequently. Moreover, the factories, warehouses and ports stacked with explosive goods can be accompanied by explosion accidents after firesuch as the fire and explosion accident occurred in Tianjin Port on August 12, 2015. It is a typical case of a fire followed by an explosion that killed 165 people and damage many buildings (Yin et al., 2021; Li et al., 2016; Corley et al., 1998). Explosion is a common secondary disaster after fire, and the explosion in high temperature environment will often cause more serious damage to the building structure. The effects of fire and explosion on the structure are quite different. The high temperature of fire deteriorates the strength and stiffness of constructional materials. The instantaneous effect of shock wave produced by explosion will lead to high strain rate effect. Actually, in some cases, the fire and explosion are mutually affected. Therefore, it is of great significance to deep understand the mechanical behavior and failure modes of reinforced concrete (RC) slabs under fire and blast loads.
At present, a series of experimental and numerical studies have been carried out on the behavior of RC slabs under fire. (Zhang et al., 2019) carried out high temperature pseudo-static tests of RC slabs and beam-column joints to study the influence of fire on the residual shear strength of RC slabs, and evaluated the effectiveness of shear reinforcements to improve the bearing capacity of RC slabs after punching. (Wang and Dong, 2010, 2013; Wang et al., 2011; Dong and Zhu, 2011) carried out fire tests on full-scale RC slab specimens with four sides simply supported, and studied the in plane and out-of-plane deformation of two-way slab under fire and the change of slab edge angle with temperature. The test results show that the failure mode of RC two-way slab is different from that at ambient temperature, and the cracks mainly appear in the middle of the long span of the slab top, 1/4 of the support from the short side and the corner. (Jin et al., 2021) conducted numerical simulation of RC slabs under fire, and compared the differences of the impact performance between RC slabs under fire and ambient temperature in terms of failure mode, overall deformation, energy dissipation capacity and acceleration. The results show that with the increase of fire duration, the residual bearing capacity and natural frequency of RC slabs decrease, but the deformation and energy dissipation capacities increase. (Jin et al., 2023a; 2023b) use the numerical models based on ABAQUS are employed to investigate the performance of RC beam-column assemblies during and after high temperature to resist progressive collapse. The numerical results show that in-fire assemblies could not develop catenary action due to severe degradation of rebar elongation and therefore, the load resistance of in-fire assemblies was determined by compressive arch action capacity.
Recently, scholars have carried out a series of experimental and numerical simulation studies on the blast performance of RC slabs at ambient temperature. (Wang et al.,2012, 2013, 2021) carried out near-field blast test on square RC slabs, and carried out numerical simulation of dynamic response of RC slabs by using finite element (FE) modeling. The results show that with the increase of explosive mass, the failure mode of square RC slabs gradually changes from overall flexural failure to local punching shear failure. (Shi et al., 2016; Hu et al., 2021; Zhang et al., 2015, 2021) used LS-DYNA to establish a numerical model of typical RC slabs under the action of blast load, and the simplified curve proposed can assess the failure of RC slabs under the action of any blast load. (Jin et al., 2019) proposed a new type of fence protection wall composed of steel rods, and studied the effectiveness of this new type of blast wall in reducing blast load through two-dimensional numerical simulation and field blasting test.
To sum up, although the fire and blast resistance of RC slabs has been revealed by previous studies to some extent, most of them studied the effect of fire and blast separately, the failure mechanism of the RC slab under the combined action of fire and blast was still unclear. Therefore, this paper adopted ABAQUS to conduct numerical simulation on the tests of (Wang and Dong, 2010) and (Wang et al., 2012) respectively to verify the effectiveness of the thermal analysis method, and blast simulation. On the basis of the verified FE models, the effects of coupling action of fire and explosion on RC slabs are revealed, and the effects of fire duration, scaled distance and charge weight on the blast resistance of RC slabs are studied.
FE modeling and verification of fire test
Brief of RC slab under fire experimental program
This section conducts numerical simulations replicating the test of (Wang and Dong, 2010) to verify the validity of the thermal analysis method and high-temperature degradation model adopted in this paper.
A four-edge simply supported slab (FESS slab) in (Wang and Dong, 2010) was selected for validation of FE models, and its dimension and reinforcement details are shown in Figure 1(a). The average compressive strength of the concrete cube used in the test was 32 MPa. The steel bar adopted HRB400. The average yield strength and tensile strength measured were 435 MPa and 580 MPa, respectively. The concrete cover was 15 mm thick. The layout of the slab support is shown in Figure 1(b). Steel balls and rollers were used to simulate the simply supported boundary of the slab. A uniformly distributed load was applied on the slab, and the load was divided into five stages, 0.4 kN/m2 for each stage, when the load is applied to 2.0 kN/m2, keep the load constant, and then use a heating device to heat the bottom of RC slab, and the heating curve referred to the standard of (ISO834, 1999). RC slab specimen details: (a) Geometry of the RC slab (in mm); (b) Slab support arrangement (in mm).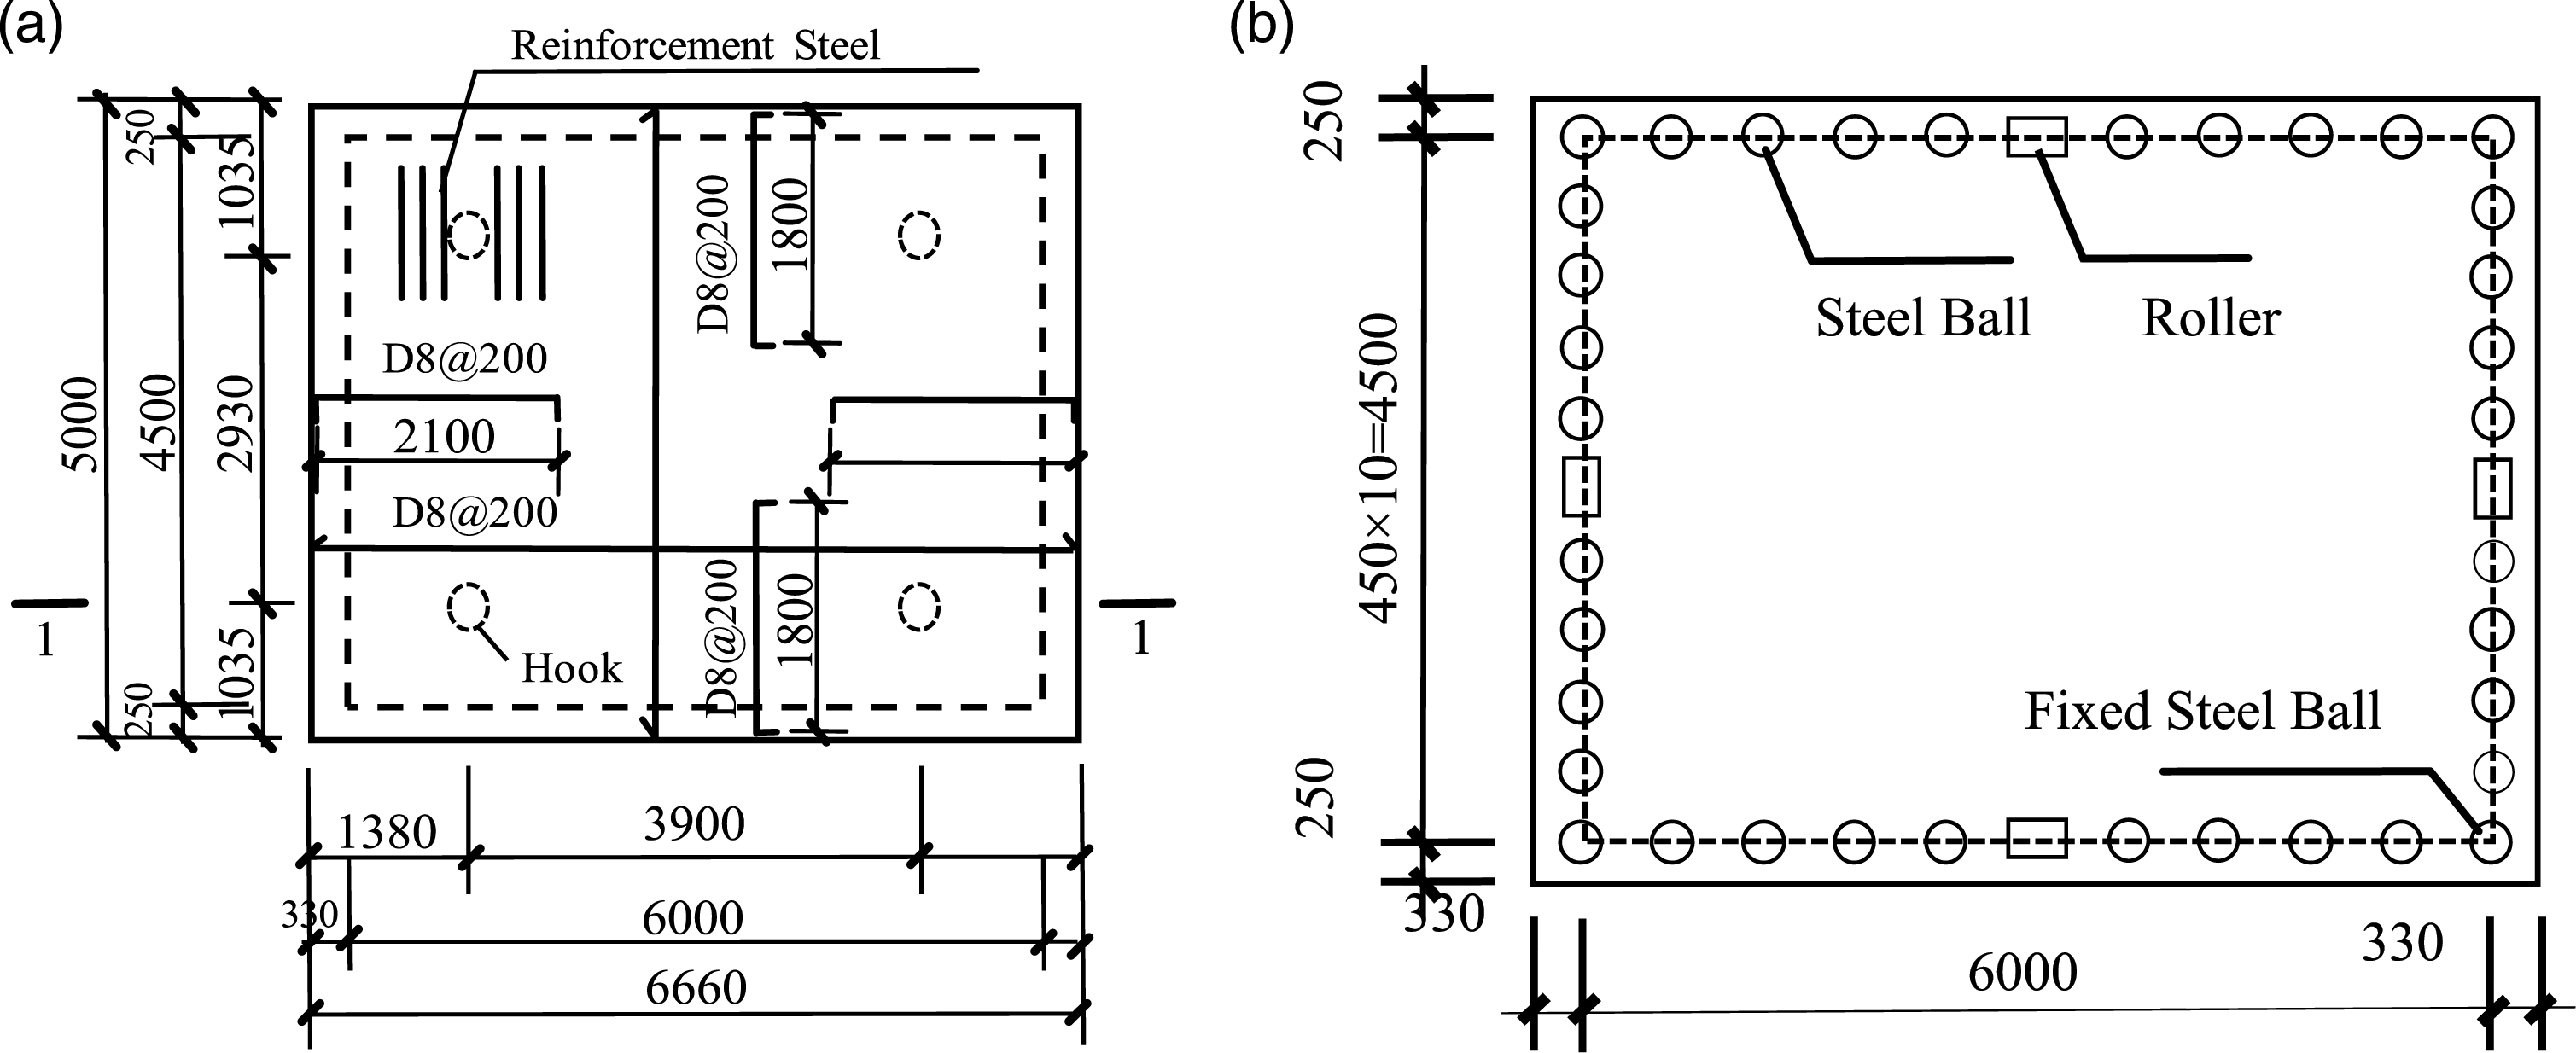
FE model setup of RC slabs under fire
Material model
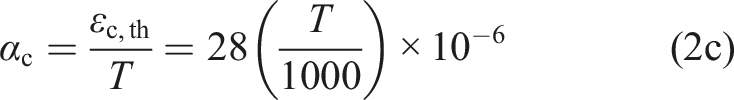
In the process modeling of concrete material behavior under both temperature and load effects, the (EC2, 2004) approach was adopted. In this approach, the compressive strength of concrete at elevated temperature was calculated by using a reduction factor. The ultimate strain of concrete, were also obtained at different temperature levels. The stress-strain relationship of concrete at high temperature was calculated by using equation:

The thermal parameters of the concrete are determined in accordance with European specification (EC2, 2004), and their expressions were derived using equation (2a) and (2d):
Heat conductivity coefficient of concrete:

Thermal expansion coefficient of concrete:

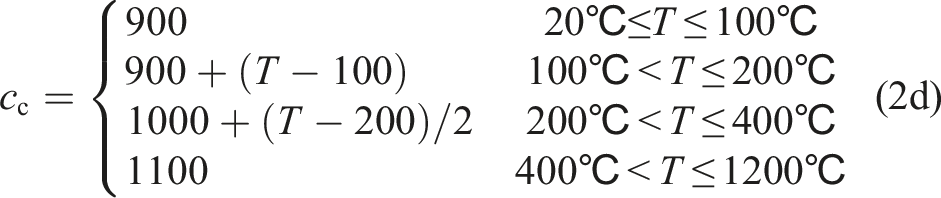
Specific heat capacity of concrete:
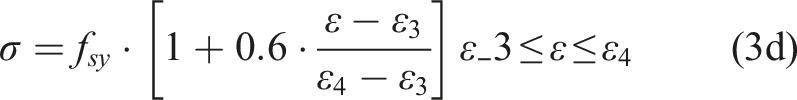
For steel, according to the five-stage elastoplastic constitutive model of Han et al. (2001), the stress-strain curve is shown in equation (3a) and equation (3e):


According to (EC3, 2005), the high temperature yield strength and elastic modulus reduction curve of reinforcement is simplified into a three broken line model, and the expression is as follows:
Expression of relationship between yield strength and temperature of reinforcement was derived using equation (4):
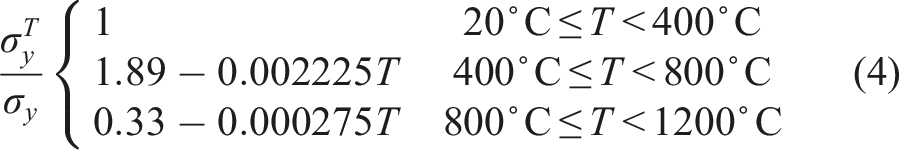
Expression of relationship between elastic modulus and temperature of reinforcement was derived using equation (5):
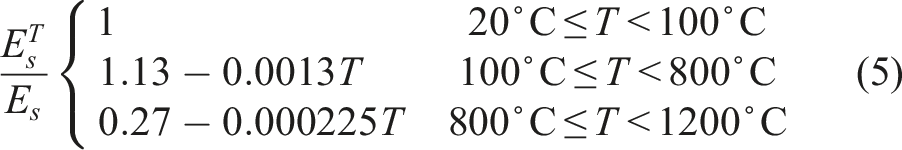
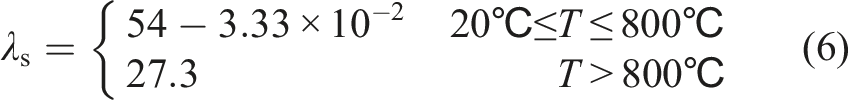
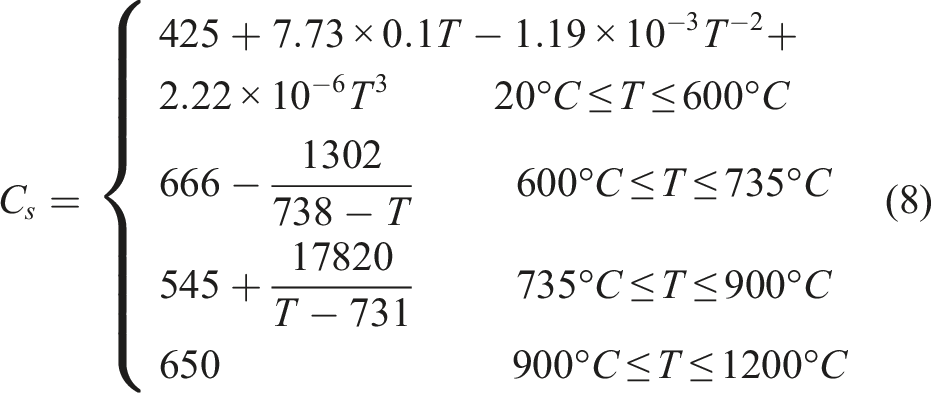
The thermal parameters of the steel bar are determined in accordance with European specification (EC1, 2006), and their expressions were derived using equations (6)–(8):
Heat conductivity coefficient of steel bar:
Thermal expansion coefficient of steel bar:

Specific heat capacity of steel bar:
Coupled thermo-mechanical model
Figure 2 shows the FE model of FESS specimen. Reference (Zhu et al., 2016) for Parameter Setting of ABAQUS Thermodynamic Coupling Analysis. In the thermodynamic coupling analysis of ABAQUS, three-dimensional eight-node heat transfer element DC3D8 was used to simulate concrete and two-node heat transfer element DC1D2 was used to simulate reinforcement and steel slab. The grid sensitivity analysis is conducted by trial calculation method. The trial calculation results show that further refining the grid size can only improve the calculation accuracy in a limited way, but the calculation time is multiplied. After comprehensive consideration, the grid size of concrete and reinforcement is set as 30 mm, which can save the calculation time while ensuring the calculation accuracy. slab In the thermal-mechanical coupling analysis of the ABAQUS, the normal direction of the contact relationship between the support and the concrete was defined as hard contact. Penalty friction was set at tangent direction, and the friction coefficient was 0.6. The embedded method was adopted between the concrete and the steel bar. the convective heat transfer coefficient exposed to fire surface was set at 25 W/(m2·°C) and the comprehensive emissivity was set at 0.5. Establish the boundary conditions for four-sided simply supported slab by using steel balls and rollers in ABQAQUS rigid body element simulation tests. The thermo-mechanical coupling modeling method of ABAQUS FE software was used to simulate the temperature rise of FESS specimen according to (ISO834, 1999). FE model of high temperature RC slab.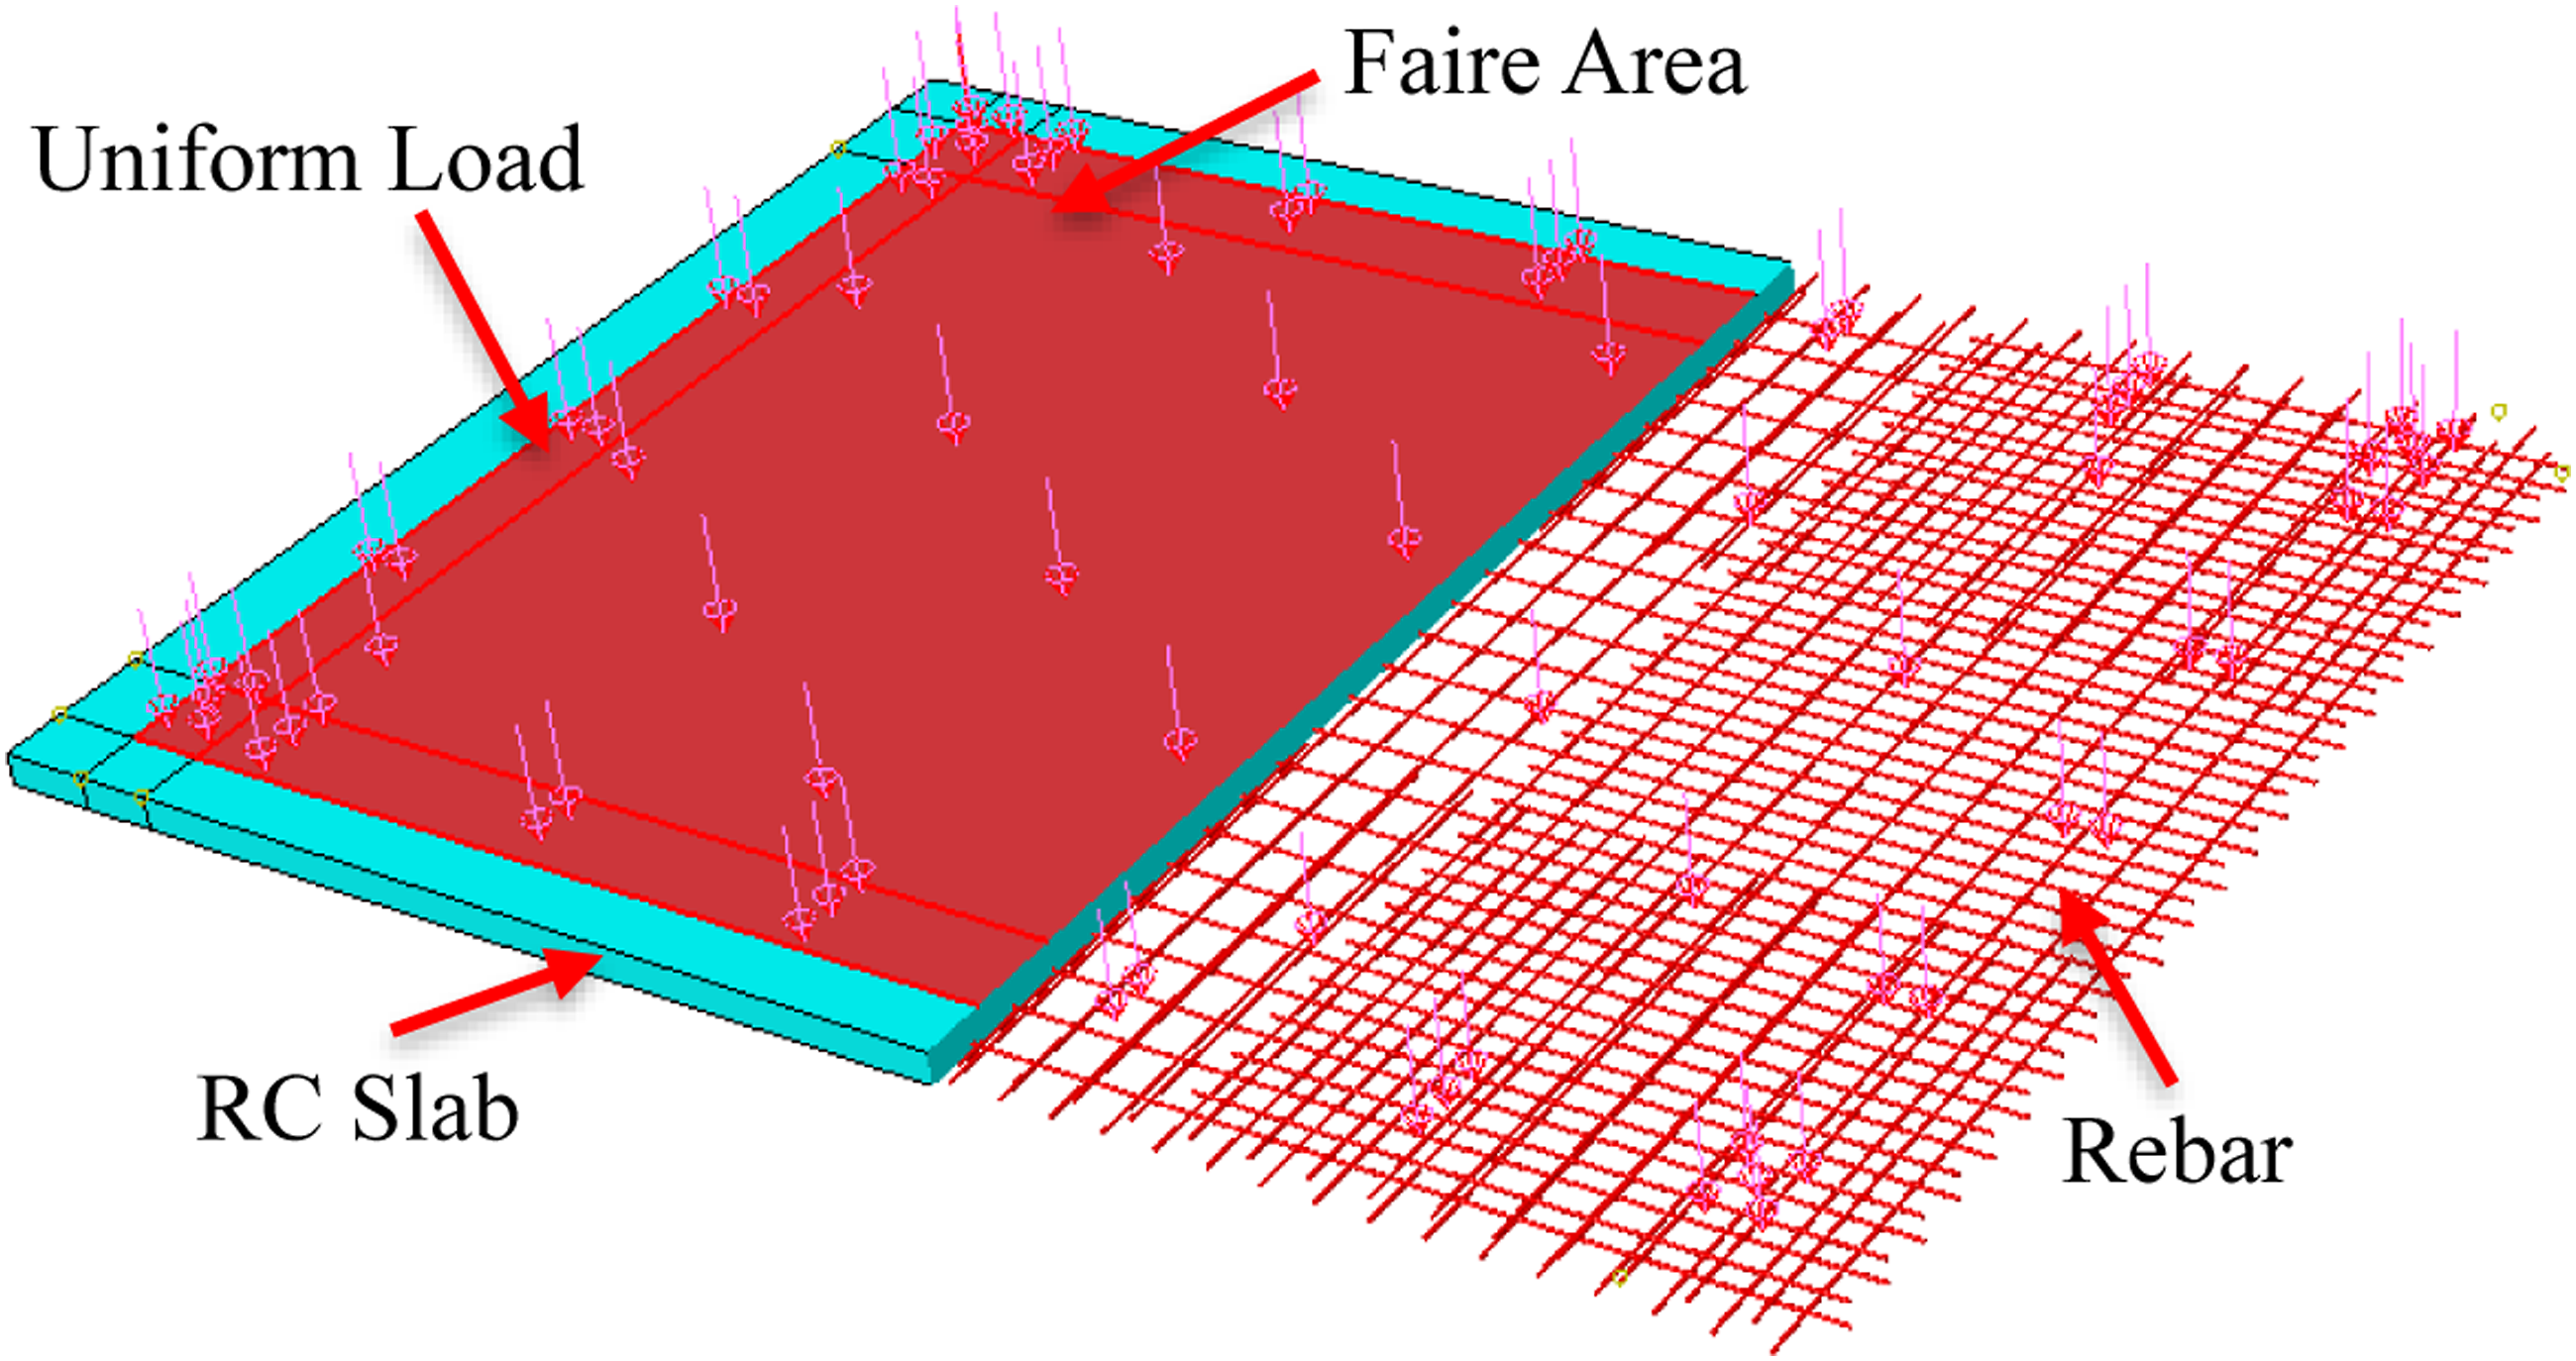
FE model of fire test verification
The FE model simulation results are shown in Figure 3. The in-slab heating curves Figure 3(a) were measured the point T1, T2, T3, S1 and S2. The deflection curves of the RC slab at high temperature Figure 3(b) were measured the point P1 and P2 of the RC slab. The comparison between the numerical simulation results and the experimental results shows that the error of the temperature time-history curve between the high temperature model and the experimental results is less than 8%, and the error of the column bottom deflection during the static loading process is less than 5%. It shows that the thermal-mechanical coupling simulation method adopted in this paper can accurately reflect the thermal conductivity and mechanical properties of RC slabs at high temperature. Comparison between numerical simulation and test for the specimen: (a) Temperature time-history curve; (b) Displacement time-history curve.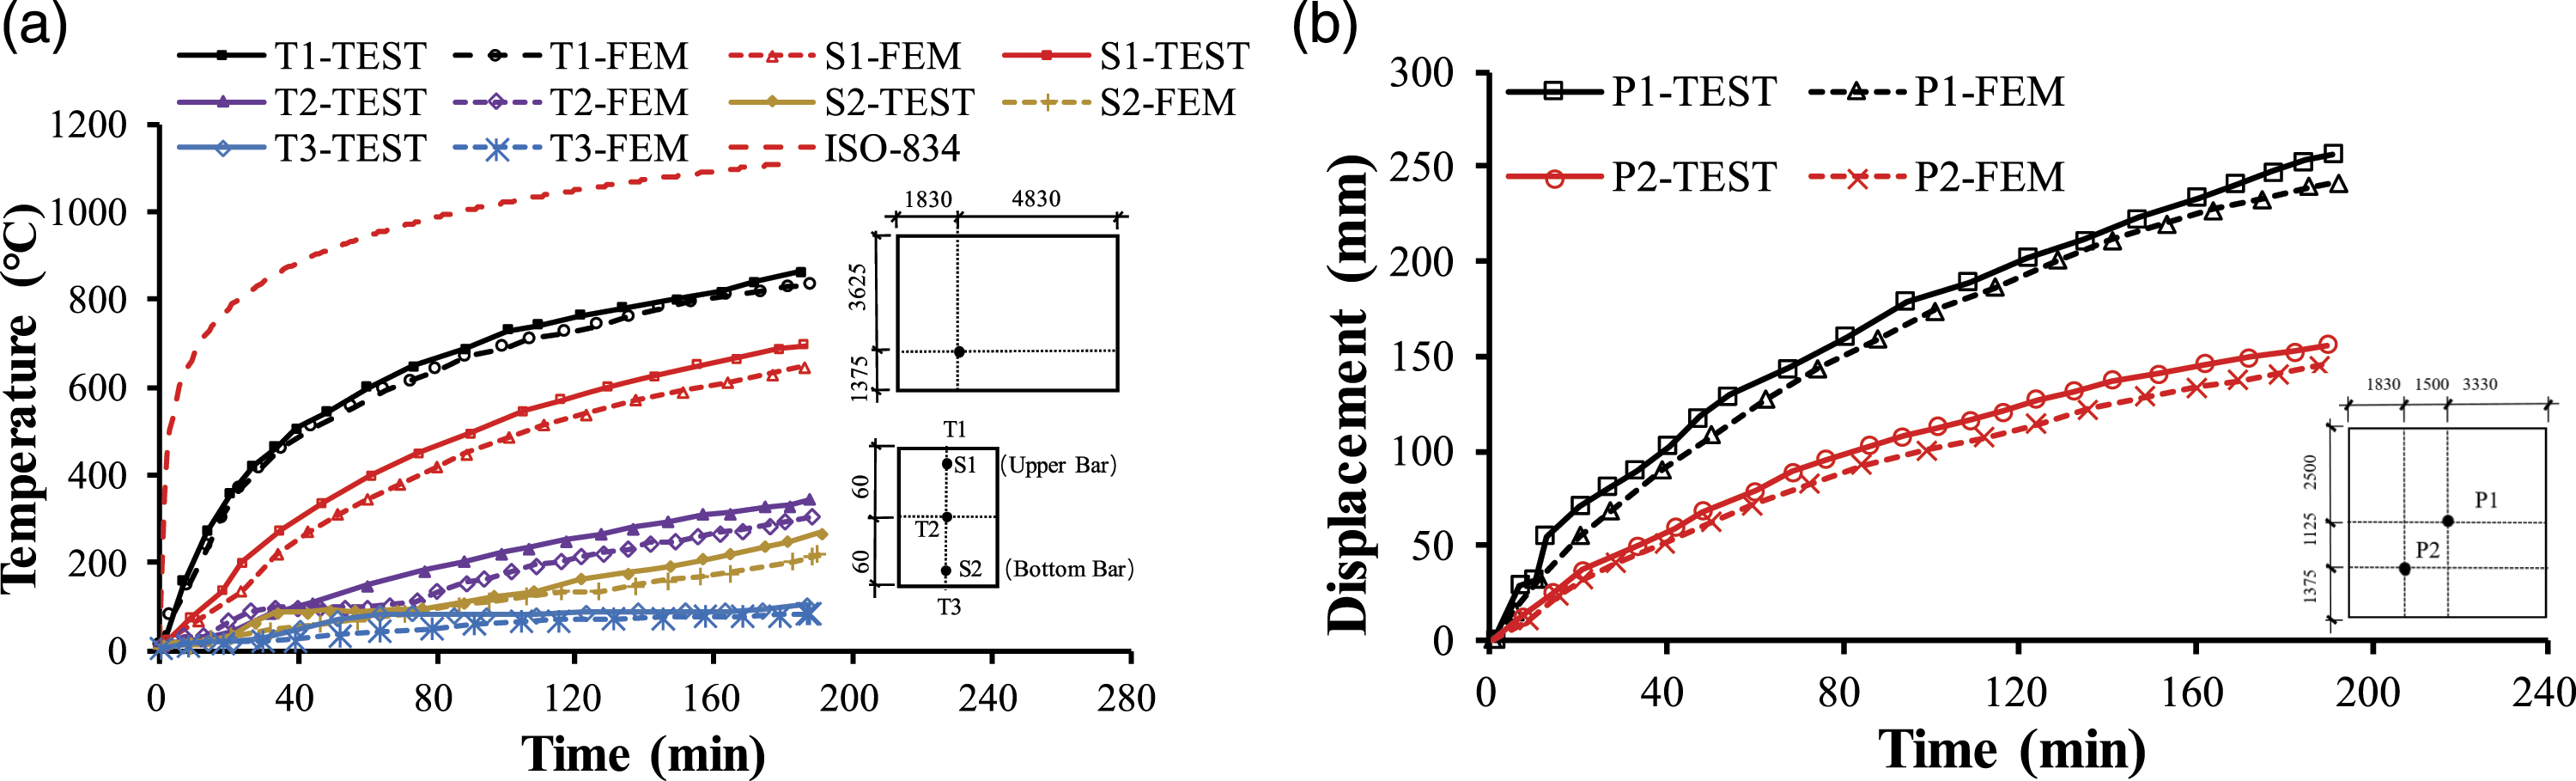
Figure 4 shows the comparison between the slabtest and numerical failure modes of RC slabs under fire. Figure 4(a) shows the cracks on the top of the slabslab. Vertical cracks first appear in the middle of the top of the slab in the heating area, because the cracks develop along the short side of the slab due to the temperature stress in the middle of the top of the slab in the heating area. Then under the action of temperature and vertical load, cracks appear at the four corners of the top of the slab. Figure 4(b) shows the crack diagram at the bottom of the slab. The vertical load and temperature stress at the bottom of the slab lead to the tension of the bottom concrete, and the cracks develop from the middle area to the four corners. It can be seen from the figure that the FE model established in this paper can more accurately predict the failure mode of the test specimen. Comparison of the numerical results and experimental results (FESS) (a) Experimental results and numerical results on the upper side; (b) Experimental results and numerical results on the bottom face.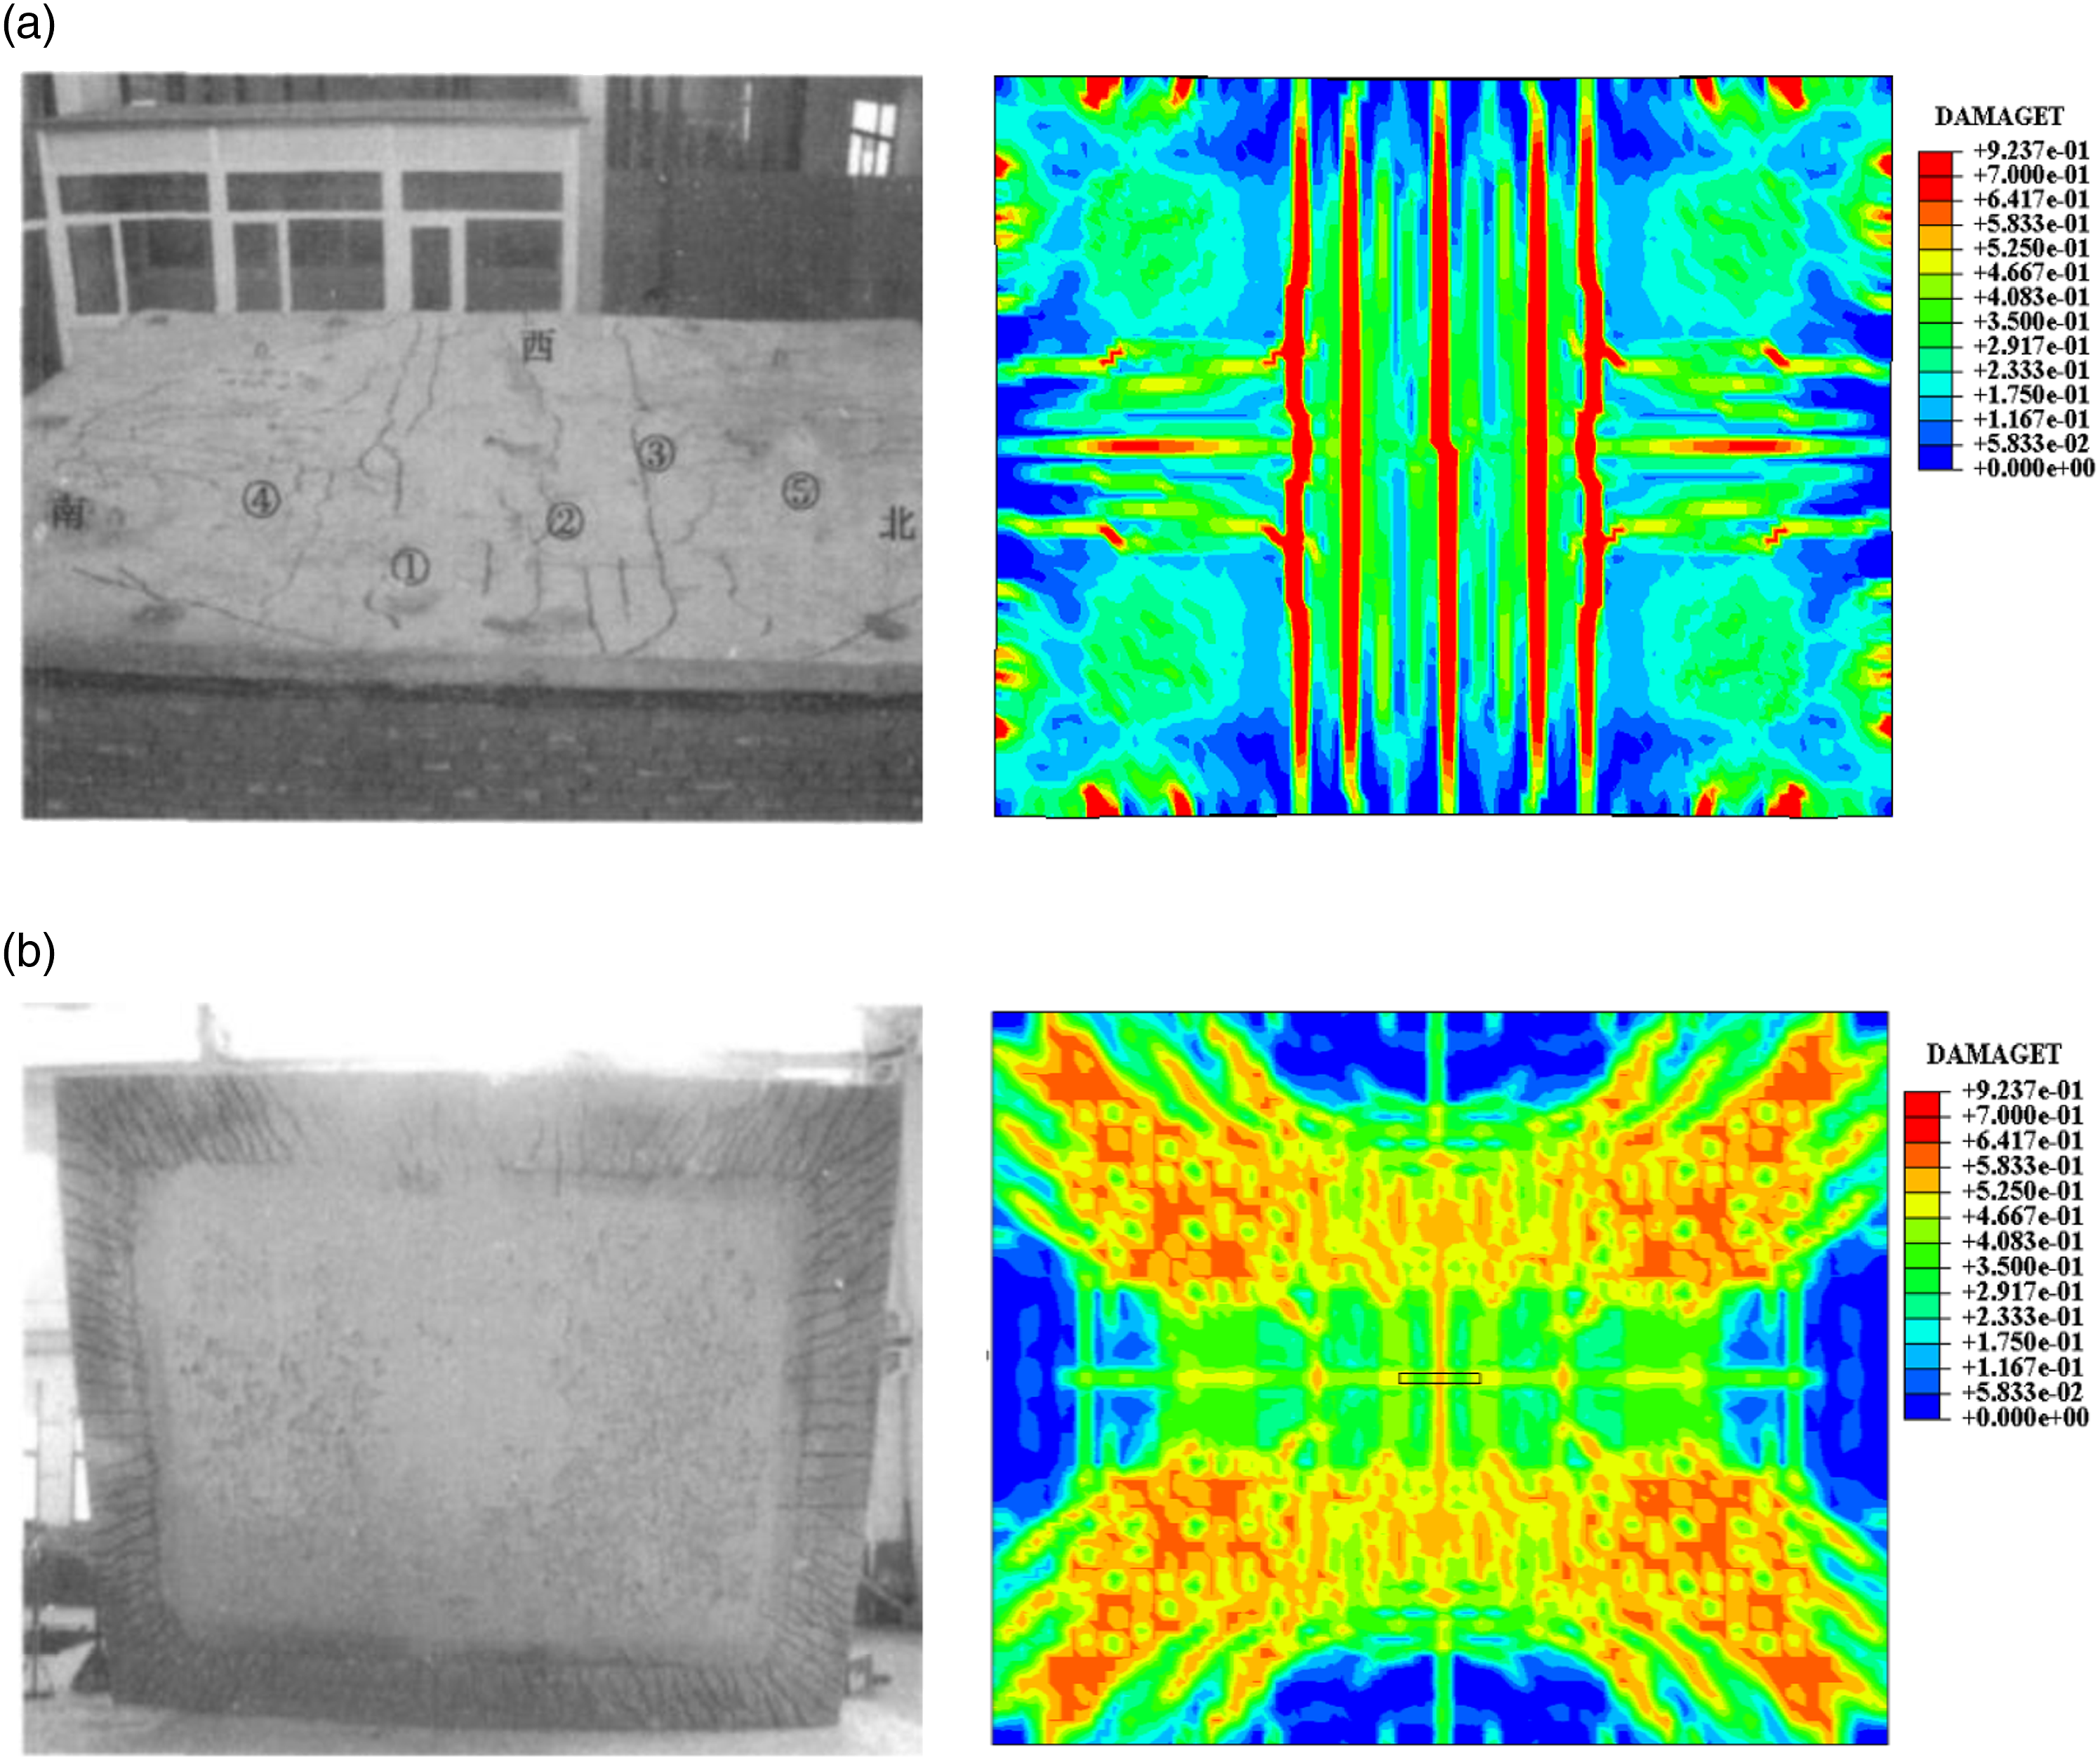
FE modeling and verification of blast test
Brief of RC slab blast experimental program
In this section, numerical simulation was conducted on the blast test of square RC slab carried out by (Wang et al., 2012) to verify the rationality and accuracy of ABAQUS built-in model CONWEP simulating blast test.
Sectional dimension and geometric shapes of slab C and slab D in the blast resistance test of square RC slab carried out by (Wang et al., 2012) are shown in Figure 5. The sectional dimension of RC slab was 1000 mm × 1000 mm, and the slab thickness was 40 mm. The tested uniaxial compressive strength, tensile strength and elastic modulus of concrete were 39.6 MPa, 8.2 MPa and 28.3 GPa respectively. The yield stress of steel bar was 501 MPa and the elastic modulus was 200 GPa. TNT with weights of 0.31 kg and 0.46 kg were placed at slab C and slab D 400 mm above the board surface for blast test. Geometry dimensions of RC slab.
FE model setup of RC slabs blast test
Material model of high strain rate
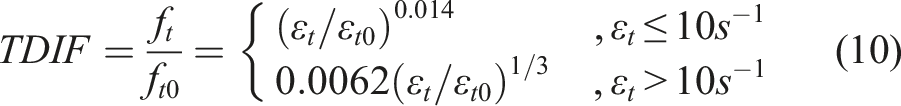
Under blast load, strain rate effects on concrete and reinforcement should be considered. The strain rate effect of concrete using equations (9)–(11) in this paper adopts the formula given in (CEB, 1991) to characterize the compression dynamic increase factor (CDIF) of concrete compressive strength and the tension dynamic increase factor (TDIF).

The strain rate effect of reinforcement is considered by (CEB, 1991), and the yield stress of reinforcement is:

CONWEP model
The CONWEP model is a commonly used FE analysis model of blast impact, which can be used for free air blast and close-range blast calculation by (Ostraich et al., 2011). Compared with the Arbitrary Lagrange-Euler (ALE) method, the advantages of CONWEP model are as follows: there is no need to consider the transmission process of blast shock wave in air, and there is no need to establish explosive and air element, which simplifies the research content and reduces the modeling work. The coupling effect of fluid and structure is not considered, which reduces the complexity of the model and improves the computational efficiency.
Figure 6 shows the FE model of RC slab blast test. In this paper, the CONWEP model built in ABAQUS was used for numerical simulation of blast. Blast load analysis step was set as explicit dynamic analysis step time was 0.2 s. Incident wave was set as air blast. In the blast analysis, C3D8R eight node linear hexahedral element is used for concrete, and T3D2 two node linear three-dimensional truss element is used for reinforcement. With reference to the analysis of grid sensitivity in Section of Coupled thermo-mechanical model, it is determined that the grid size of concrete and reinforcement elements is set as 30 mm. FE model of RC slab blast test.
FE model of blast test verification
The CONWEP blast module of ABAQUS was used to simulate the blast of the square RC slab. Figure 7 shows the numerical simulation results. The CONWEP simulation method adopted in this paper is verified from the curve trend. The maximum displacement of RC slab C in the middle of the span obtained from the test is 15.0 mm, and the maximum displacement obtained from the numerical simulation is 14.2 mm, the numerical simulation result is 6% less than the test results, the maximum displacement of RC slab D in the middle of the span obtained from the test is 35.0 mm, and the maximum displacement obtained from the numerical simulation is 32.6 mm, the numerical simulation result is 7% less than the test results. Because the support of the concrete slab may be loosened during the blast test, the bearing cannot provide complete fixation. However, the RC slab can be completely fixed in the process of numerical simulation. Therefore, the damage degree of the RC slab in the test is more serious than the result of the numerical simulation, so the deflection of the RC slab center obtained by the experiment was bigger than that in the numerical simulation. Numerical simulation results of displacement time-history curve of slab center point.
Figures 8 and 9 show the comparison between the failure modes of specimens after blast test and the failure modes of numerical simulation. As shown in Figure 8(a) and 9(a) the upper side of the RC slab is damaged by vertical and circular cracks, which is consistent with the test results. As shown in Figure 8(b) and 9(b) the bottom surface of the RC slab, the low tensile strength of the concrete leads to tensile peeling pits on the back of the concrete slab. It can be seen that the experimental results are in good agreement with the numerical simulation results, which can well simulate the cracking, crack propagation and bottom layer crack shedding process of RC slab under the action of blast load. Comparison of the numerical results and experimental results (RC slab C): (a) Experimental results and numerical results on the upper side; (b) Experimental results and numerical results on the bottom face. Comparison of the numerical results and experimental results (RC slab D): (a) Experimental results and numerical results on the upper side; (b) Experimental results and numerical results on the bottom face.
Numerical simulation of RC slabs under combined fire and blast loads
Based on the above verified RC slab fire resistance test and RC slab blast resistance test at ambient temperature, the verified FESS of (Wang and Dong, 2010) was taken as the research object. The size, material parameters and physical boundary conditions of the specimen were kept unchanged, and the static load in the test was changed to TNT blast load.
In this paper, numerical simulation method is used to calculate the dynamic response of RC slab under the coupling action of high temperature and blast. This process is divided into three steps:
(static loading stage): Set an initial uniform load on the RC slab. Simulate the normal working state of RC board. This step is calculated by static explicit method.
(temperature loading stage): Apply high temperature load to RC slab under different fire exposure conditions. This step adopts implicit method of transient heat transfer.
(explosive loading stage): after high temperature analysis, the results obtained calculated in step 2 can be used as the initial condition of step 3. Using the “restart” analysis method, import the OBD file of the results obtained in the first two steps into step 3. The grid cell type is consistent with the cell type used in step 1. The explicit analysis method is adopted in this step. The CONWEP model provided by ABAQUS software is adopted.
Effect of fire duration
To study the blast resistance of RC slabs under fire, according to (EC1, 2006), the convective heat transfer coefficient exposed to fire surface was set at 25 W/(m2·°C) and the comprehensive emissivity was set at 0.5. According to the international standard heating curve (ISO834, 1999), the specimen FESS was heated up for 0 min, 60 min, 90 min, 120 min and 180 min, respectively.
Referring to (Longinow, 2013), the CONWEP module built in the verified ABAQUS was used to simulate the blast. Blast model used dynamic explicit analysis step, and the analysis step time 0.2 s and Nlgeom were set. Incident wave was defined as air blast. TNT equivalent was set to 2 kg and 2.5 kg respectively, and blast load was set 2 m above the center of RC slab.
Figure 10 and 11 show the comparison of failure modes of RC slab tensile surface under different fire durations (0 min, 60 min, 90 min, 120 min and 180 min) with 2 kg and 2.5 kg TNT, respectively. The compressive stress wave generated by the blast shock wave propagated to the back blast surface of the slab and formed a strong tensile wave under the action of blast load, resulting in the crack and spalling of the concrete on the back blast surface. Under the fire condition less than 90 min, the damage of RC slab was not serious, and only a number of vertical bending cracks from the bottom of the beam appear in the four corners of the slab. When the fire lasted for more than 120 min, the concrete of back-burst surface was destroyed in a large area. Damage distribution of RC slab with 2 kg TNT blast under different fire durations: (a) 0 min; (b) 60 min; (c) 90 min; (d) 120 min; (e) 180 min. Damage distribution of RC slab with 2.5 kg TNT blast under different fire durations: (a) 0 min; (b) 60 min; (c) 90 min; (d) 120 min; (e) 180 min.
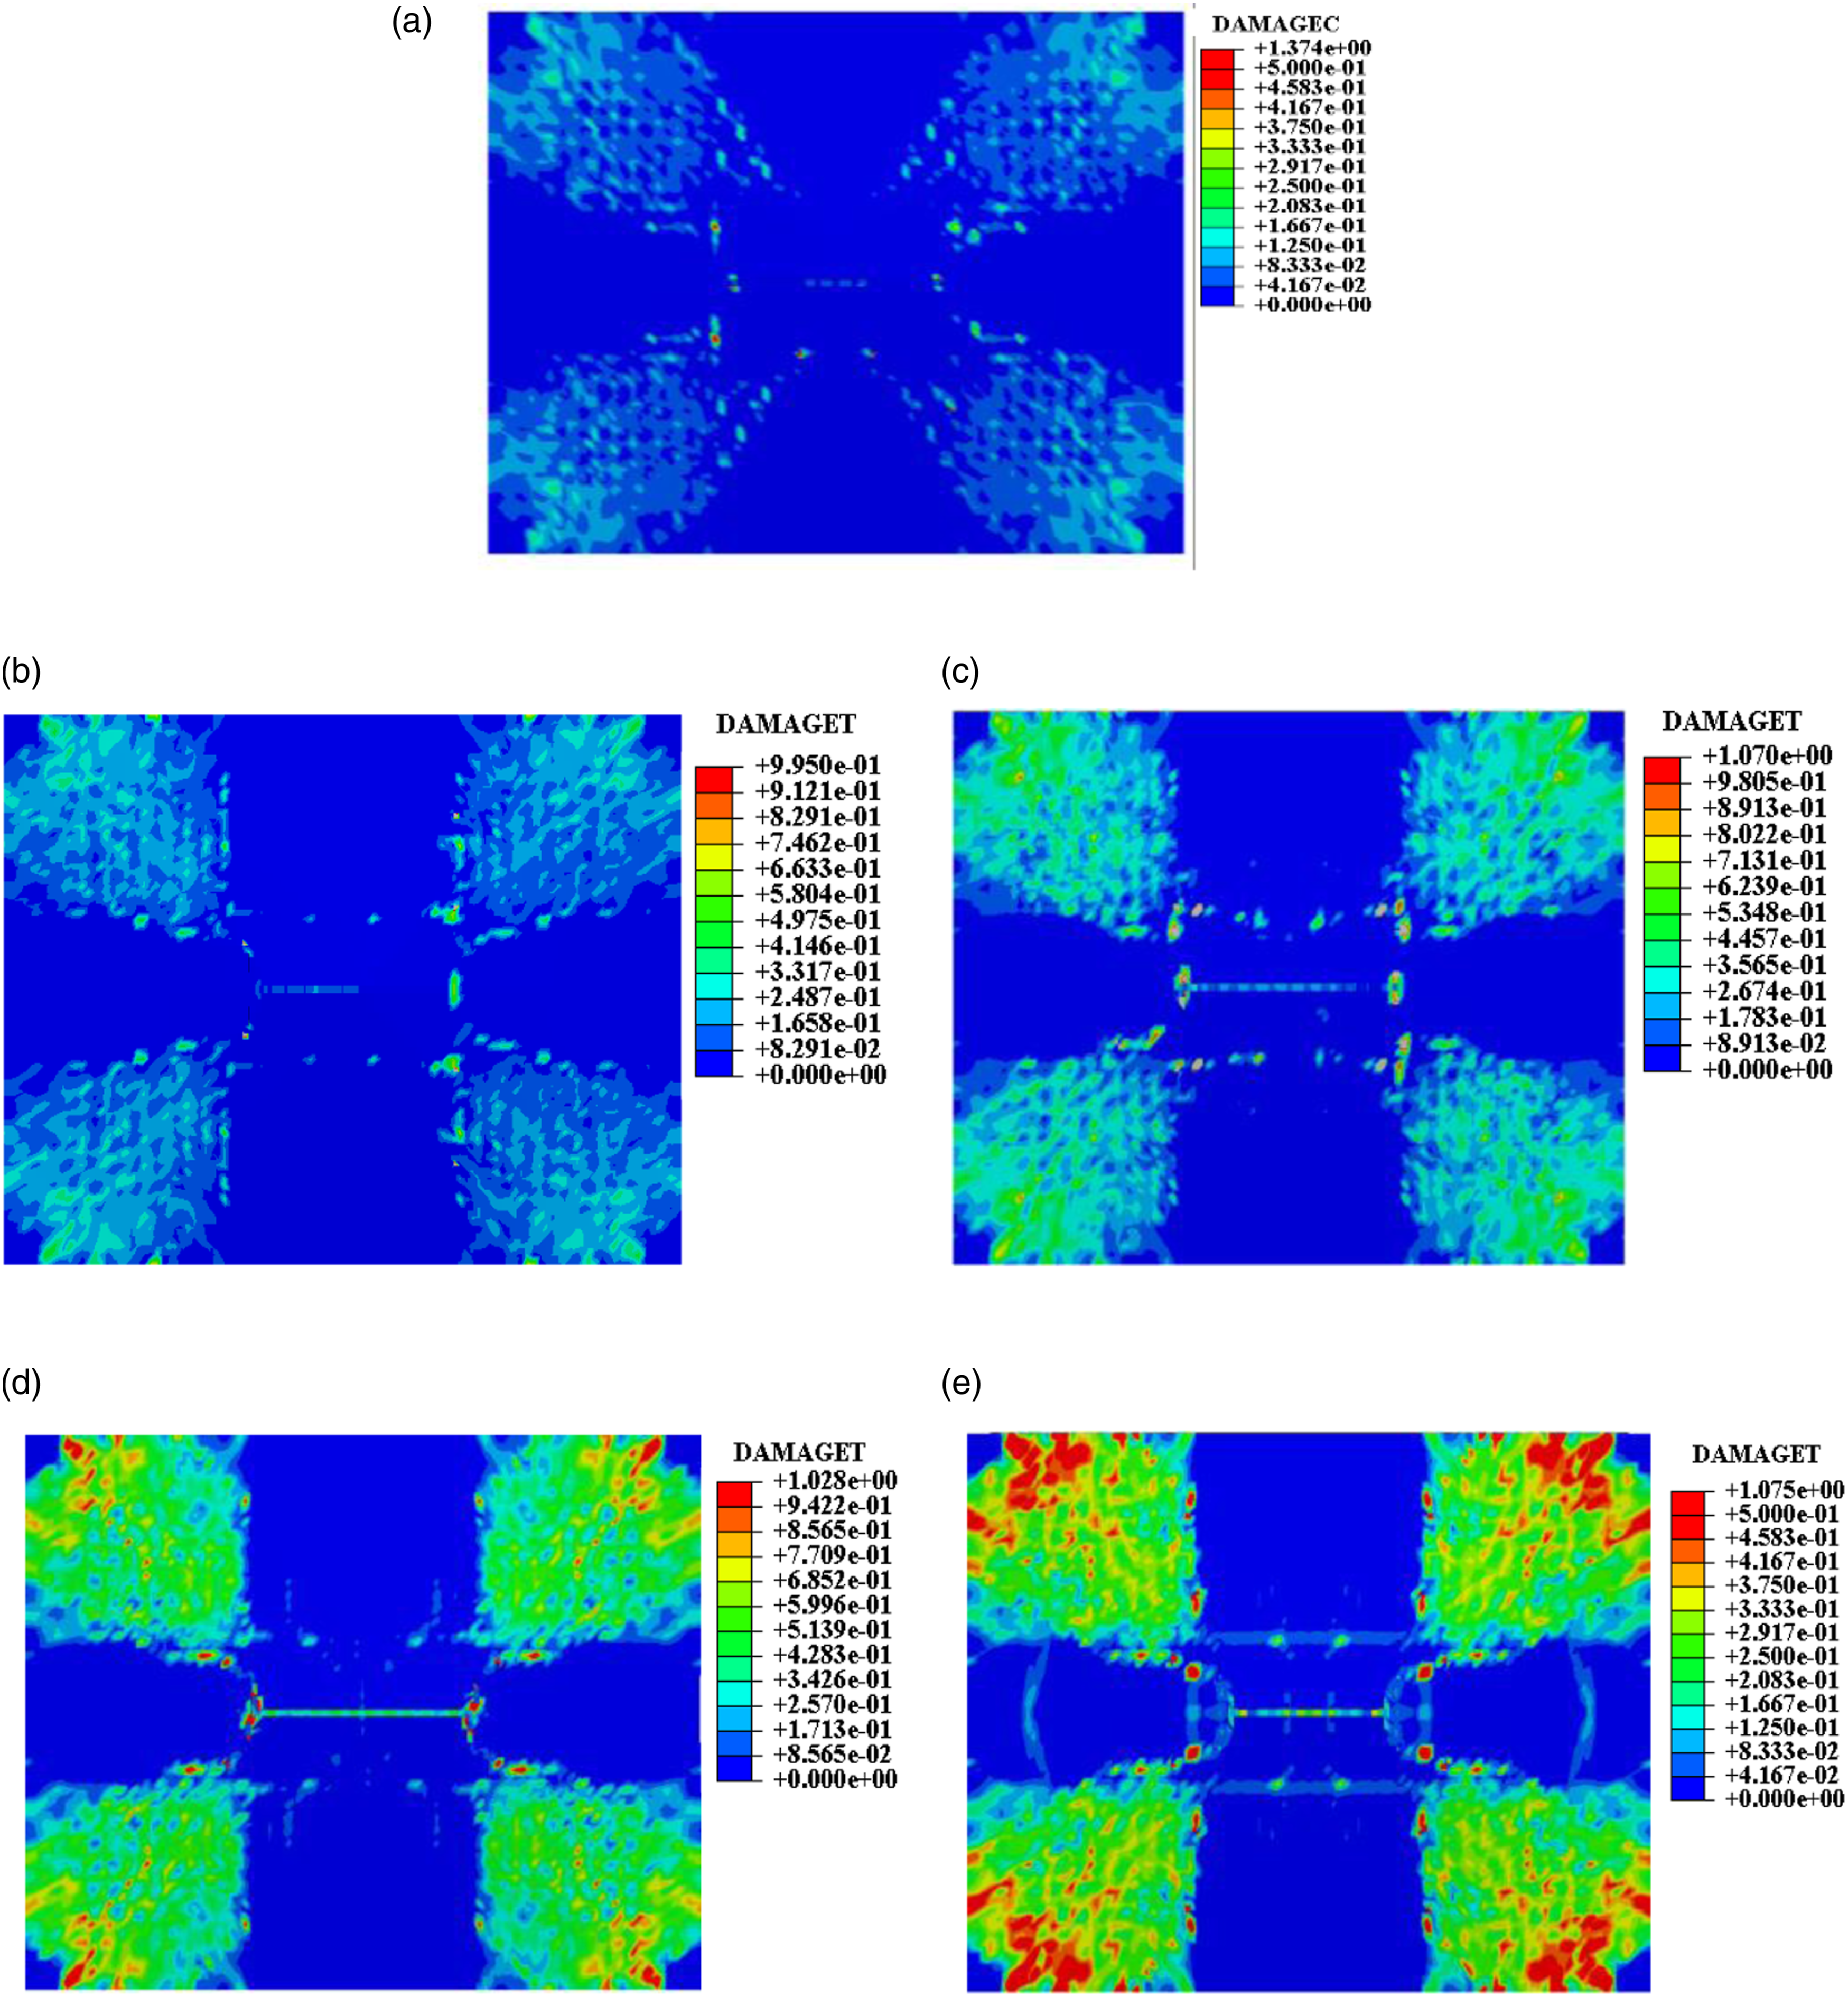
Figure 12 shows the time-history curves of RC slab displacement under different fire durations. When weight was 2 kg and fire durations were 0 min, 60 min, 90 min, 120 min and 180 min, the maximum mid-span displacement of RC slab was 45.6 mm, 53.6 mm, 60.1 mm, 65.4 mm and 71.8 mm, respectively. When TNT weight was 2.5 kg and fire durations were 0 min, 60 min, 90 min, 120 min and 180 min, the maximum mid-span displacement of RC slab was 61.8 mm, 70.7 mm, 78.9 mm, 87.4 mm and 101.6 mm, respectively. Time-history curve of mid-span displacement for different fire durations: (a) TNT equivalence 2 kg; (b) TNT equivalence 2.5 kg.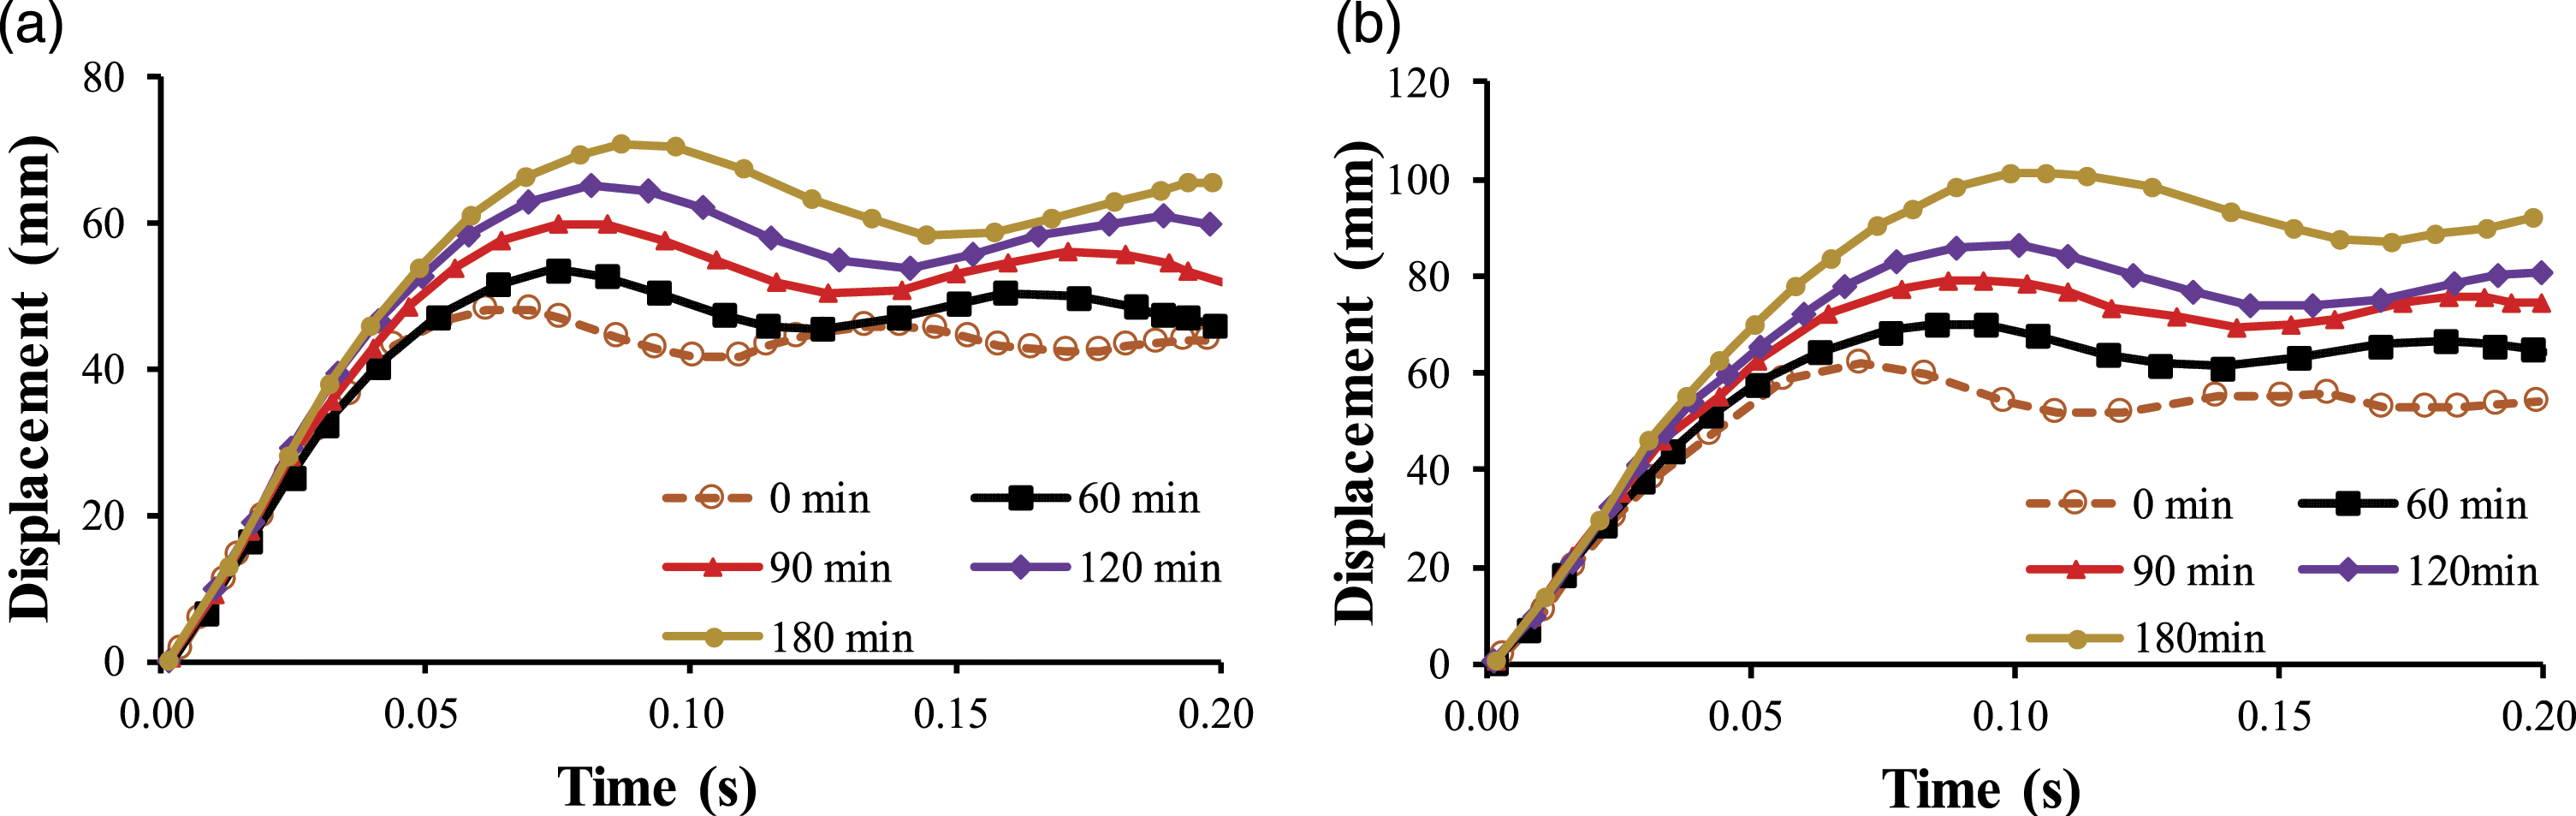
For the same weight of explosion but different durations of fire, when the weight of explosion was 2 kg and the durations of fire were 0 min, 60 min, 90 min, 120 min and 180 min, the maximum mid-span displacement of RC slab increased by 17.5%, 12.1%, 8.8% and 9.8%. When the weight of explosion was 2.5 kg and fire durations were 0 min, 60 min, 90 min, 120 min and 180 min, the maximum mid-span displacement of RC slab increased by 14.4%, 11.6%, 9.5% and 17.6%. For the same duration of fire but different weights of explosion, when the durations of fire were 0 min, 60 min, 90 min, 120 min and 180 min, respectively, the maximum mid-span displacement of RC slab with weight of explosion of 2.5 kg was 35.5%, 31.9%, 31.3%, 32.1% and 41.5% higher than that of RC slab with weight of explosion of 2 kg.
The maximum displacement in the middle span of RC slab increased with the increase of fire duration. The reasons are as follows. Under the influence of high temperature for a long time, the concrete degraded, the strength of steel bars decreased, and the overall stiffness of RC slab decreased. When subjected to the action of blast load, the damage was more serious.
It is very important to select appropriate damage assessment criteria when evaluating the damage degree of RC slabs under the fire and blast load. The main damage assessment criteria are as follows (Lawver et al., 2010; GB50010-2010. 2010): (a) the damage degree of the slab is usually related to its maximum dynamic response, so the support angle (θ) and peak displacement-span ratio (Δ/L) are selected as the damage assessment criteria, (b) after the blast load, the change of the bearing capacity of the member is the most concern, because the degradation degree of bearing capacity is directly related to the global properties of RC slabs, the damage index (D) of the slab is taken as the damage criterion.
Where,

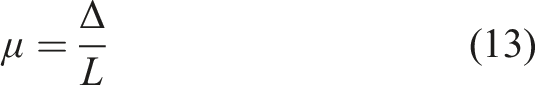
Peak displacement-span ratio μ (Δ/L) is the ratio of peak deflection to span lengthof member, and the calculation formula is as follows:
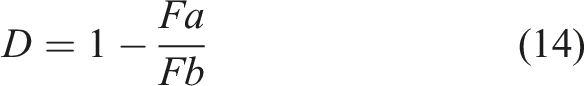
In order to evaluate the reduced blast-resistant capacity of RC slabs after fire, the damage index D is defined as:
The initial bearing capacity of RC is calculated by (GB50010-2010, 2010):


The damage grade of RC slab was evaluated by using support angle (θ) and peak displacement-span ratio (Δ/L) as damage criteria. The damage criterion of RC slab based on support angle (θ) and peak displacement-span ratio (Δ/L) proposed by (LaHoud, 1985) was referred. The damage criterion based on support angle can be divided into four damage degrees. (1) Low damage: only a small part of the slab had plastic deformation, no obvious permanent damage, and it can be reused, θ ≤ 2°. (2) Moderate damage: there was a certain range of plastic deformation on the slab, and it can be repaired can continue to use, 2° ≤θ ≤ 6°. (3) High damage: the slab was not completely collapsed and damaged, but it had produced significant plastic deformation and cannot be repaired, 6°≤ θ ≤ 12°. (4) Collapse damage: the slab had been largely destroyed and collapsed, θ ≥ 12°. Peak displacement-span ratio (Δ/L) can be divided into three types. (1) Moderate damage: peak displacement-span ratio (Δ/L) ranges from 0 to 4%. (2) Severe damage: peak displacement-span ratio (Δ/L) is 4–8%. (3) Collapse damage: peak displacement-span ratio (Δ/L) is 8–15%.
Numerical simulation results of RC slab blast resistance under different fire duration.
Note: θ is the ratio between the maximum deflection and the half-span length of the slab;Δ/L is the ratio of peak deflection to span of dynamic response of member; D is the damage index of dynamic response of member.
It can be seen from the data obtained from the numerical simulation of: (1) Under the blast condition of 2 kg TNT weight, the angle of support increases by 43%, 16%, 6% and 9% from room temperature to fire for 180 min. Under the blast condition of 2.5 kg TNT weight, the angle of support increases by 26%, 13%, 12% and 4%. (2) Under the blast condition of 2 kg TNT weight, the peak displacement-span ratio increases by 20%, 13%, 7% and 9% from room temperature to fire for 180 min. Under the blast condition of 2.5 kg TNT weight, the peak displacement-span ratio increases by 15%, 13%, 13% and 11% from room temperature to fire for 180 min (3) Under the blast condition of 2 kg TNT weight, the D increases by 35%, 24%, 13% and 8% from room temperature to fire for 180 min. Under the blast condition of 2.5 kg TNT weight, the damage index increases by 21%, 17%, 7% and 8% from room temperature to fire for 180 min.
Combined with the above displacement time-history curve and damage assessment curve, it can be inferred that the damage degree of RC slab increases the most under the coupling effect of high temperature and blast in the duration from room temperature to 90 min under fire. When the fire duration is more than 120 min, the displacement of RC slab increases the most while the damage increases little. The reason is that when the fire duration exceeds the fire resistance limit of RC slab, the flexural and shear properties of RC slab are greatly weakened.
Effect of different scaled distance
To study the influence of blast at different scaled distances on the failure mode, dynamic response mechanism and deformation characteristics of RC slabs under fire, this section was based on two different fire duration (120 min and 180 min), and 2.5 kg TNT was placed at different distances (0.5 m, 1 m, 2 m and 5 m) directly above the slabs to conduct numerical simulation of blast. The scaled distance was Z = R/W1/3 (m/kg1/3), where W was the weight of explosive and R was the distance from the blast point to the slab surface. According to (Longinow, 2013), a scaled distance less than 1.2 m/kg1/3 is defined as a short-distance explosion, and a scaled distance greater than 1.2 m/kg1/3 is defined as a long-distance explosion. In herein, both short- and long-distance explosion are considered, the selected Z include 0.36 m/kg1/3, 0.74 m/kg1/3, 1.47 m/kg1/3 and 3.68 m/kg1/3.
Figures 13 and 14 respectively compare the failure modes of RC slab with different blast distances under different fire durations. When the blast distance was 0.5 m, the central area of the slab collapsed, and the cracks develop in all directions. Multiple fissures at the blast pit develop in all directions, and the RC slab had been destroyed throughout. When the blast distance was 2 m and 5 m, the RC slab was less affected by the blast, and a few main cracks appeared in the slab and then developed towards the support edge. The longer the fire lasted, the more serious the damage of the RC slab would be. The reason for this phenomenon may be that blast overpressure with high peak value and short duration were generated in RC slab when the blast point was close to RC slab. Under the action of high temperature and blast load, the mechanical properties of RC slabs are greatly affected by TNT weight and fire duration. Damage distribution of the RC slab with different blast distances under the fire condition of 120 min: (a) 0.5 m; (b) 1 m; (c) 2 m; (d) 5 m. Damage distribution of the RC slab with different blast distances under the fire condition of 180 min: (a) 0.5 m; (b) 1 m; (c) 2 m; (d) 5 m.

Figure 15 shows the time-history curves of mid-span displacement of RC slab under blast conditions at different distances when the fire durations were 120 min and 180 min respectively. When the fire duration was 120 min and the scaled distance was 0.36 m/kg1/3, 0.74 m/kg1/3, 1.47 m/kg1/3 and 3.68 m/kg1/3, the maximum mid-span displacement of RC slab was 193.8 mm, 143.8 mm, 88.2 mm and 14.3 mm, respectively. When the fire duration was 180 min and the scaled distance was 0.36 m/kg1/3, the maximum displacement in the middle span of the RC slab cannot be measured because of the punching shear failures of the RC slab. When the fire duration was 180 min and the scaled distance was 0.74 m/kg1/3, 1.47 m/kg1/3 and 3.68 m/kg1/3, the maximum mid-span displacement of RC slab was 191.6 mm, 99.3 mm and 16.2 mm, respectively. Time-history curve of blast displacement at different blast distances: (a) Fire duration 120 min; (b) Fire duration 180 min.
When the fire duration is 120 min and the scaled distance is changed from 3.68 m/kg1/3 to 1.47 m/kg1/3, 0.74 m/kg1/3, and 0.36 m/kg1/3, the maximum displacement of RC slab in the middle of the span increases by 517%, 63%, and 35% respectively. When the fire duration is 180min and the scaled distance is 0.36 m/kg1/3, the concrete in the middle of the RC slab has fallen, so the displacement in the middle of the span will not be compared. When the scaled distance changes from 3.68 m/kg1/3 to 1.47 m/kg1/3 and 0.74 m/kg1/3, the maximum displacement in the middle of the RC slab increases by 509% and 93% respectively. It can be seen from the above data that the scaled distance of the RC slab in fire has changed from 3.68 m/kg1/3 to 1.47 m/kg1/3, that is, when the long-distance explosion changes to the short-distance explosion, the peak displacement in the middle of the span has the largest change range. When the scaled distance has changed from 0.74 m/kg1/3 to 0.36 m/kg1/3, the RC slab has been seriously damaged, and the peak displacement in the middle of the span has a small change range.
From the above data, it can be seen that with the increase of scaled distance Z, the damage of RC slab gradually decreased and the damage grade decreased successively. The maximum deflection of the front center of the slab decreased gradually, and no serious damage occurs in the RC slab after reaching a certain scaled distance (Z > 3). This was because after reaching a certain proportional distance, the peak overpressure and impulse acting on the RC slab were greatly attenuated, and the impact on the RC slab was greatly reduced.minsmins.
Numerical simulation results of RC slab blast resistance under different scaled distances.

It can be seen from the data obtained from the numerical simulation of:(1) when the fire duration is 120 min and 180 min, the scaled distance increases from 3.68 m/kg1/3 to 1.47 m/kg1/3, and the damage degree of RC slab increases the most under the coupling effect of high temperature and blast; (2) when the scaled distance is less than 0.74, the rate of increase of damage decreases. It is mainly because when the scaled distance is less than a certain degree, the main bearing capacity of RC slab is basically lost under the coupling action of high temperature and blast, and the influence of the scaled distance on the damage condition beyond a certain degree is small.
Effect of different TNT weight
To study the influence of weight blasts of different TNT weight on the blast resistance of RC slab under fire, according to (Longinow, 2013), different TNT weights (2.5 kg, 5 kg, 7.5 kg, 10 kg) were set 2 m above the center of the slab based on two different fire durations (120 min and 180 min).
Figures 16 and 17 respectively show the failure modes of RC slab back blast surface with different TNT weight (2.5 kg, 5 kg, 7.5 kg, 10 kg) under the conditions of 120 min and 180 min fire durations. When the blast yield was 2.5 kg, a few transverse cracks appeared in the center area of the RC slab due to the relatively small shock wave generated by the blast, and only a number of bending cracks from the center area of RC slab extended around. A few cracks appeared at the bottom of the RC slab, and the concrete at the bottom appeared slight laminsation. The surface of the concrete at the bottom was covered and some concrete laminsation fragments fell off. Under the condition of large weight (5 kg, 7.5 kg and 10 kg), several penetrating cracks appeared in the central area of the RC slab. The concrete in the middle of RC slab falls, the reinforcement breaks, and the bearing capacity is lost. Damage distribution of RC slab with different blast weights under fire for 120 min: (a) 2.5 kg; (b) 5 kg; (c) 7.5 kg; (d) 10 kg. Damage distribution of RC slab with different blast weights under fire for 180 min: (a) 2.5 kg; (b) 5 kg; (c) 7.5 kg; (d) 10 kg.
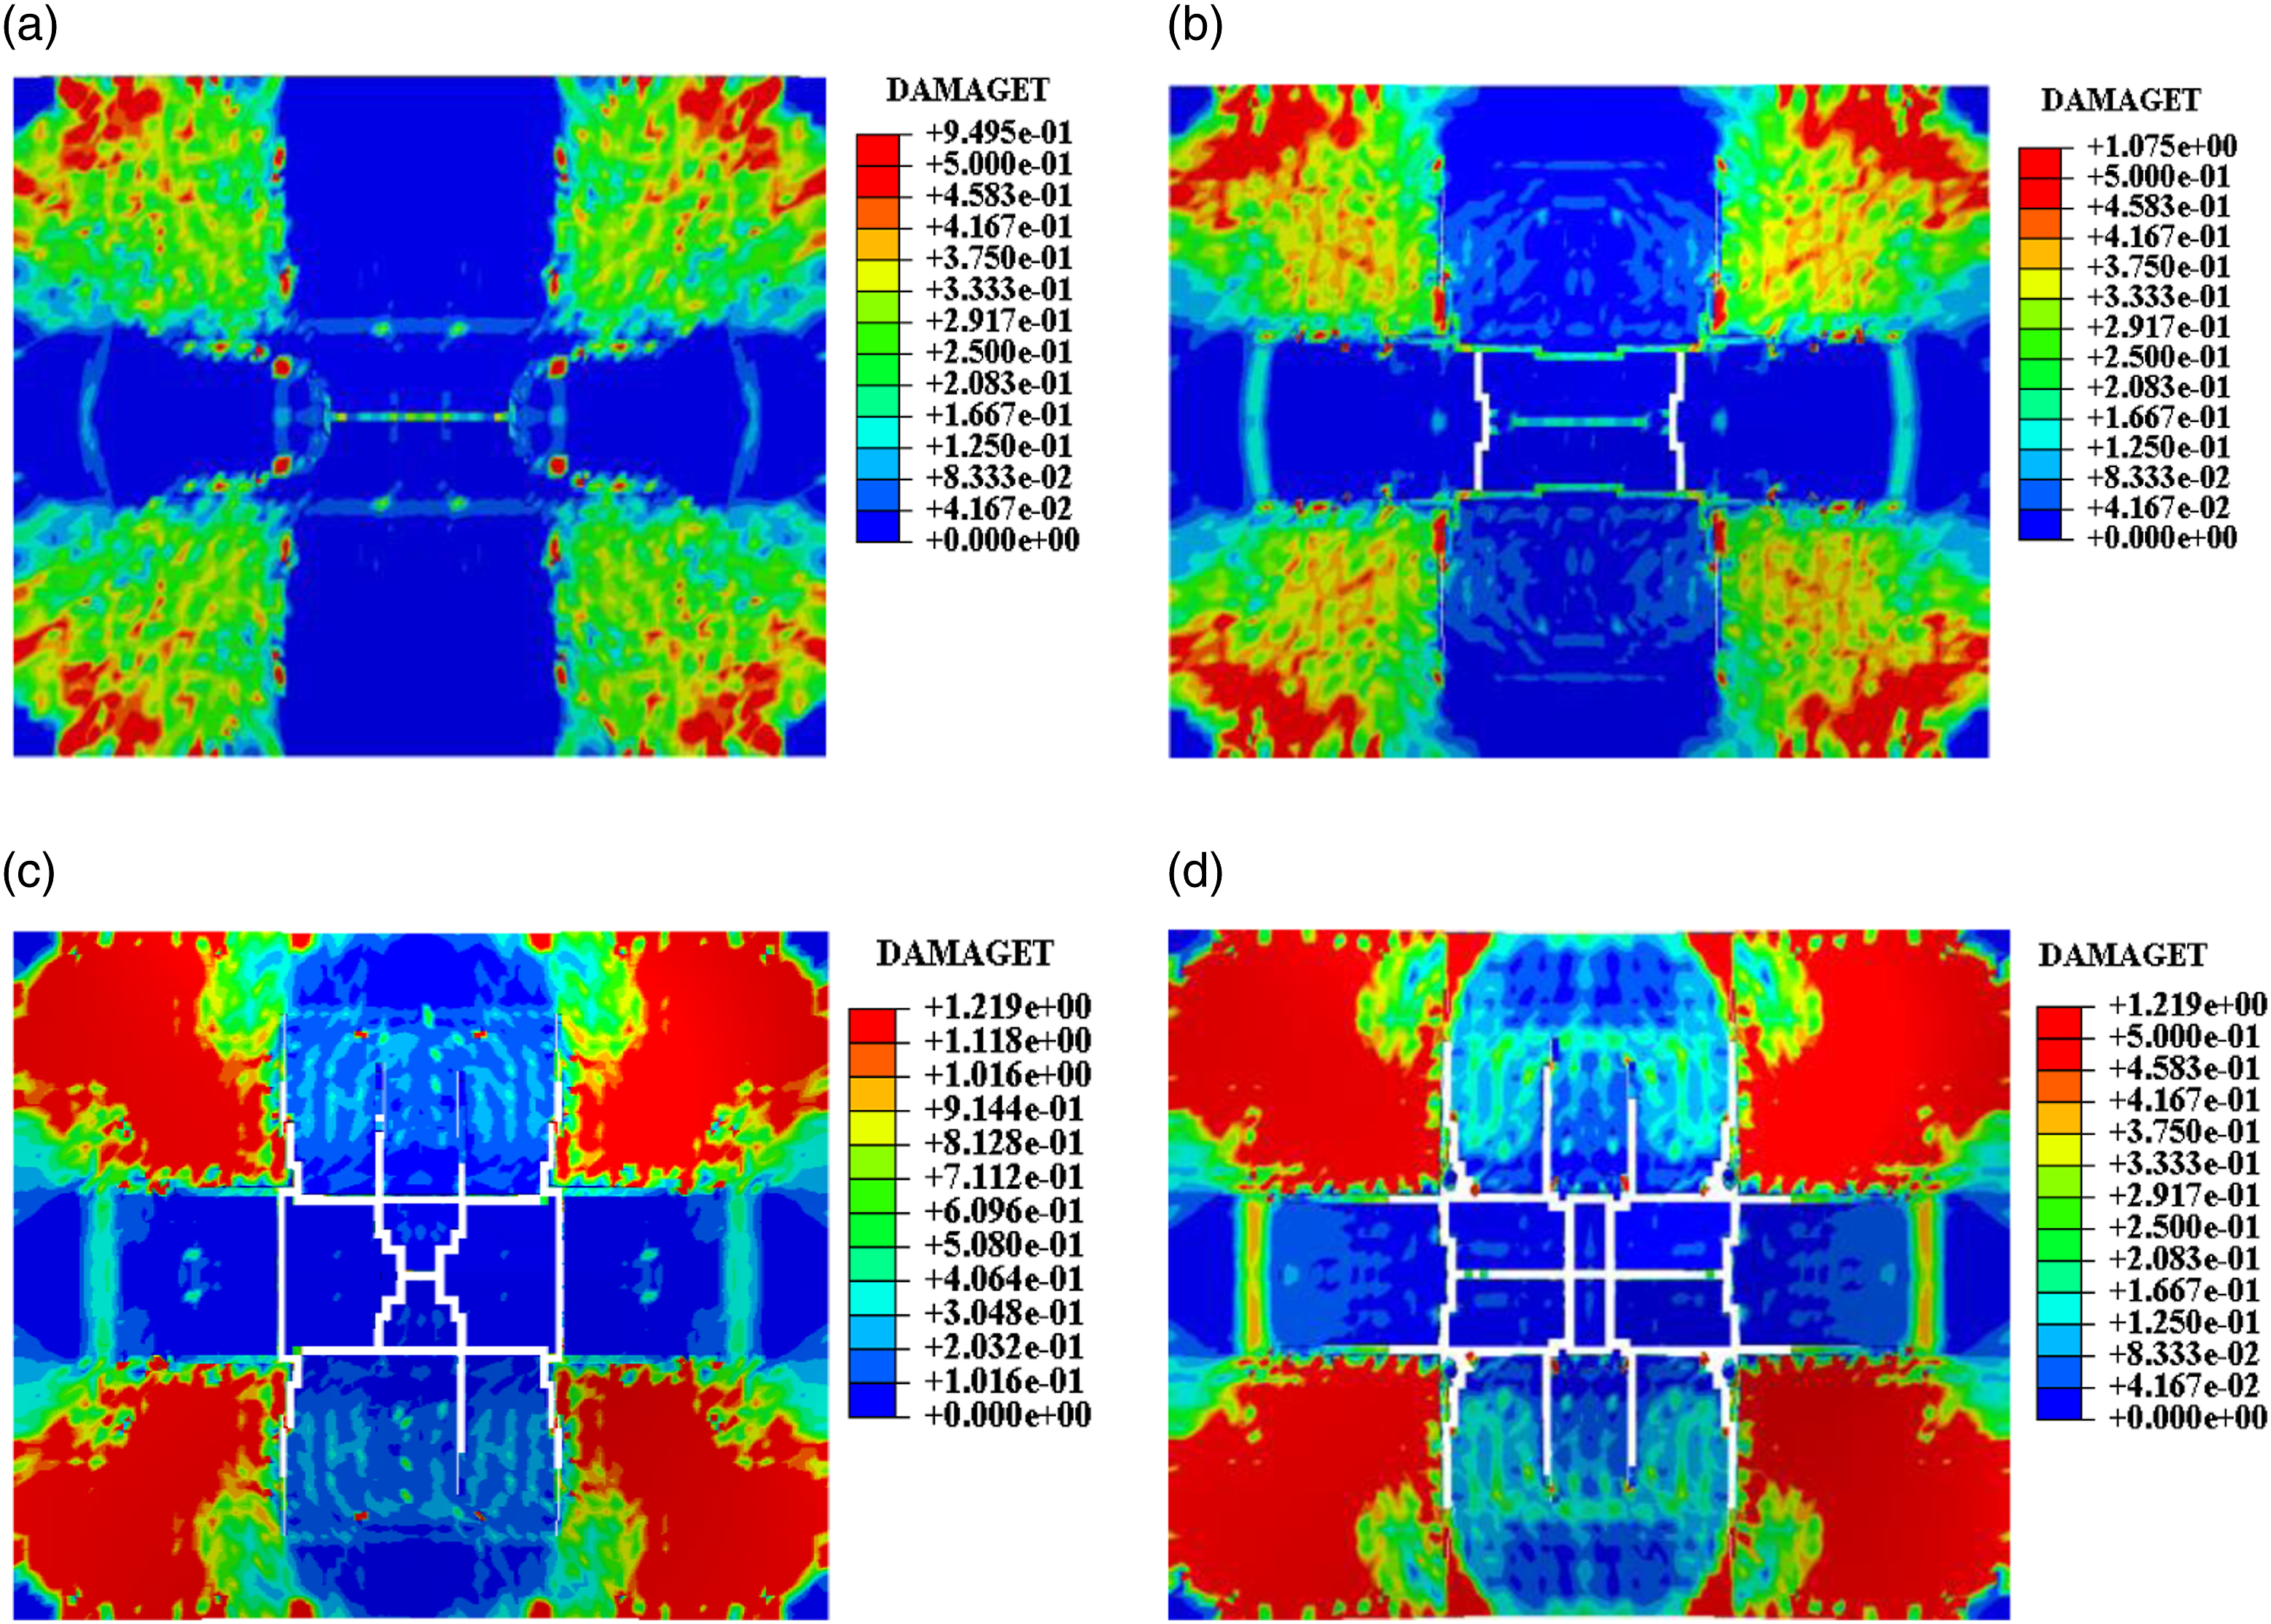
Figure 18 is the time-history curve of mid-span displacement of RC slab caused by blasts of different TNT weight under fire (120 min and 180 min). When the fire duration was 120 min and TNT weight was 2.5 kg, 5 kg, 7.5 kg and 10 kg, the maximum mid-span displacement of RC slab was 87.6 mm, 222.2 mm, 318.6 mm and 403.3 mm, respectively. When the fire duration was 180 min and TNT weight was 2.5 kg, 5 kg, 7.5 kg and 10 kg, the maximum mid-span displacement of RC slab was 101.6 mm, 260.9 mm, 401.1 mm and 513.8 mm, respectively. Time-history curves of mid-span displacement of different TNT weights: (a) Fire duration 120 min; (b) Fire duration 180 min.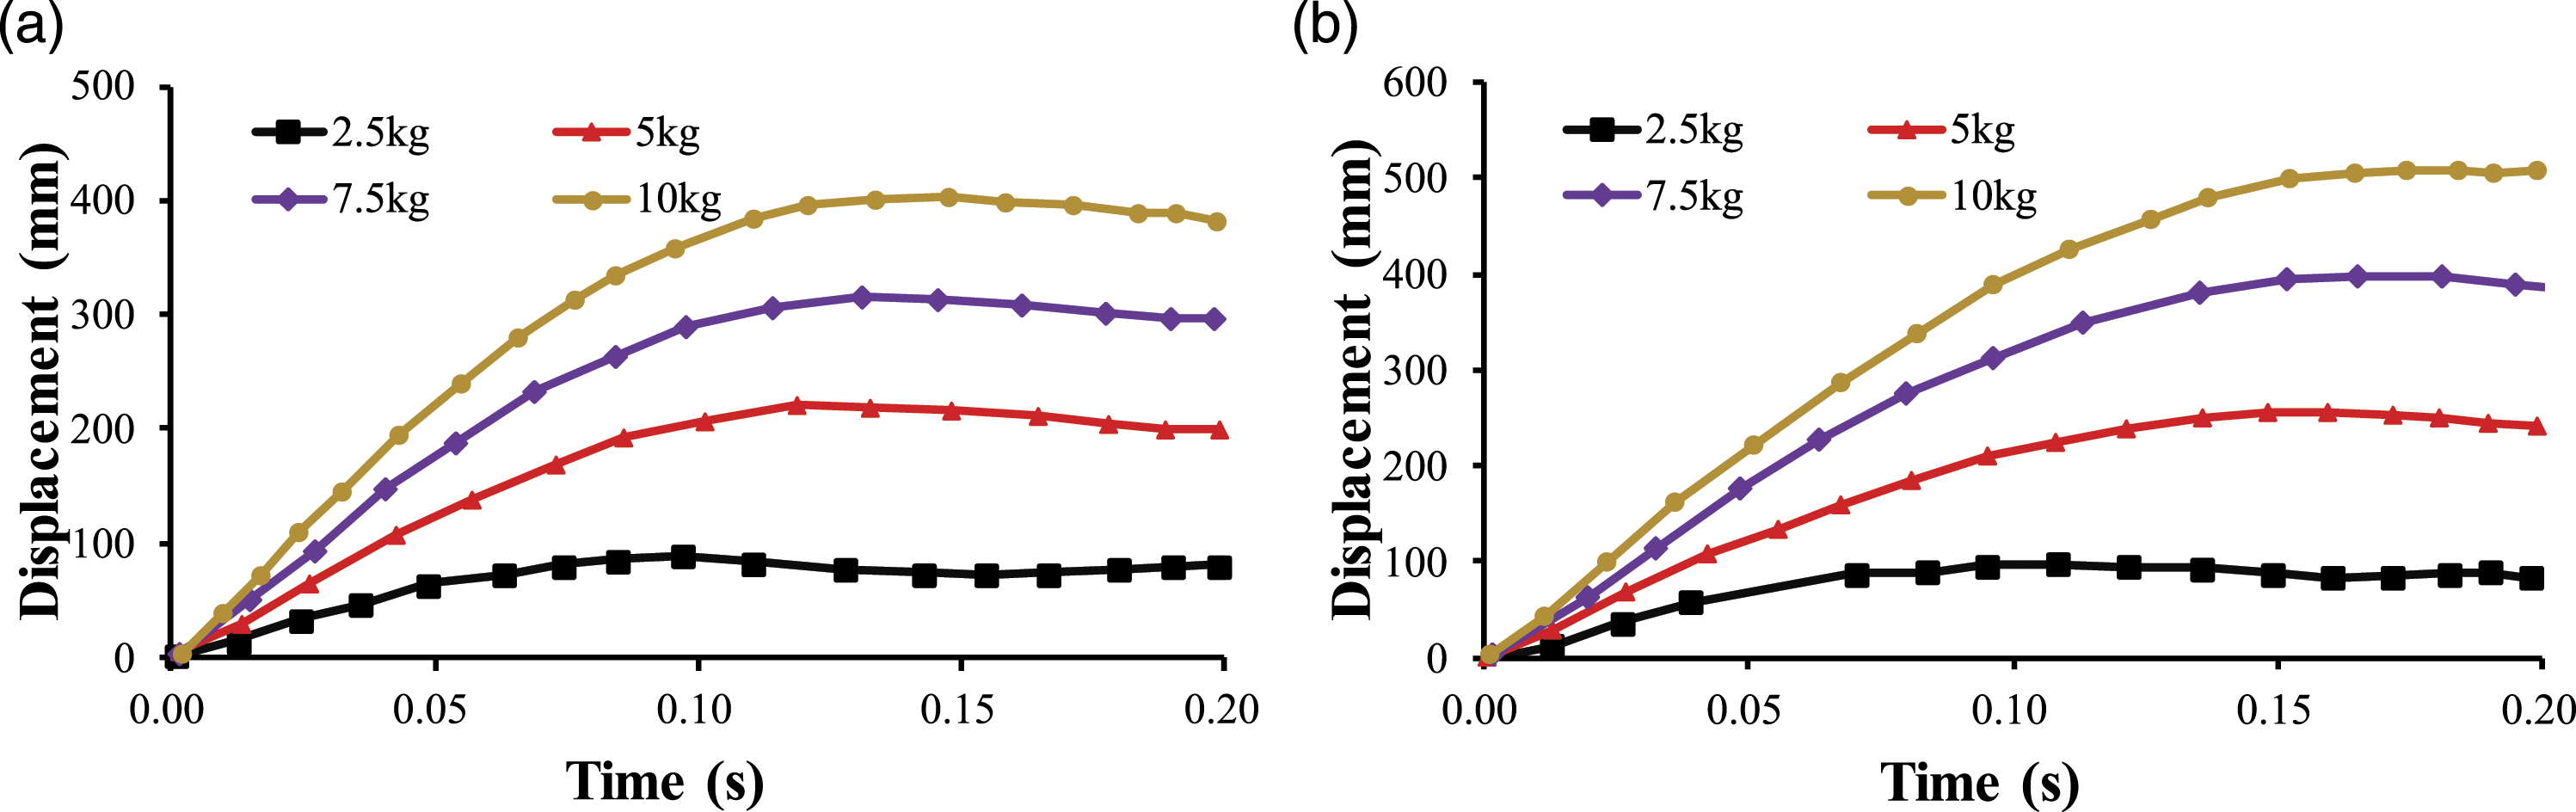
The results show that the maximum displacement of RC slab span increases with the increase of TNT weight. When the TNT weight increased from 2.5 kg to 5 kg, the average maximum displacement increased by 155.3%. When the TNT weight increased from 5 kg to 7.5 kg, the average maximum displacement increased by 48.6%. When the TNT weight increased from 7.5 kg to 10 kg, the average maximum displacement increased by 27.35%. When the TNT weight exceeded 5 kg, the increase of the maximum mid-span displacement decreased obviously. The reason for this phenomenon was that the RC slab had been damaged by punching shear after 5 kg TNT blast, and the subsequent increase of explosives had no obvious effect on the damage degree.
Numerical simulation results of RC slab blast resistance under different TNT weight.
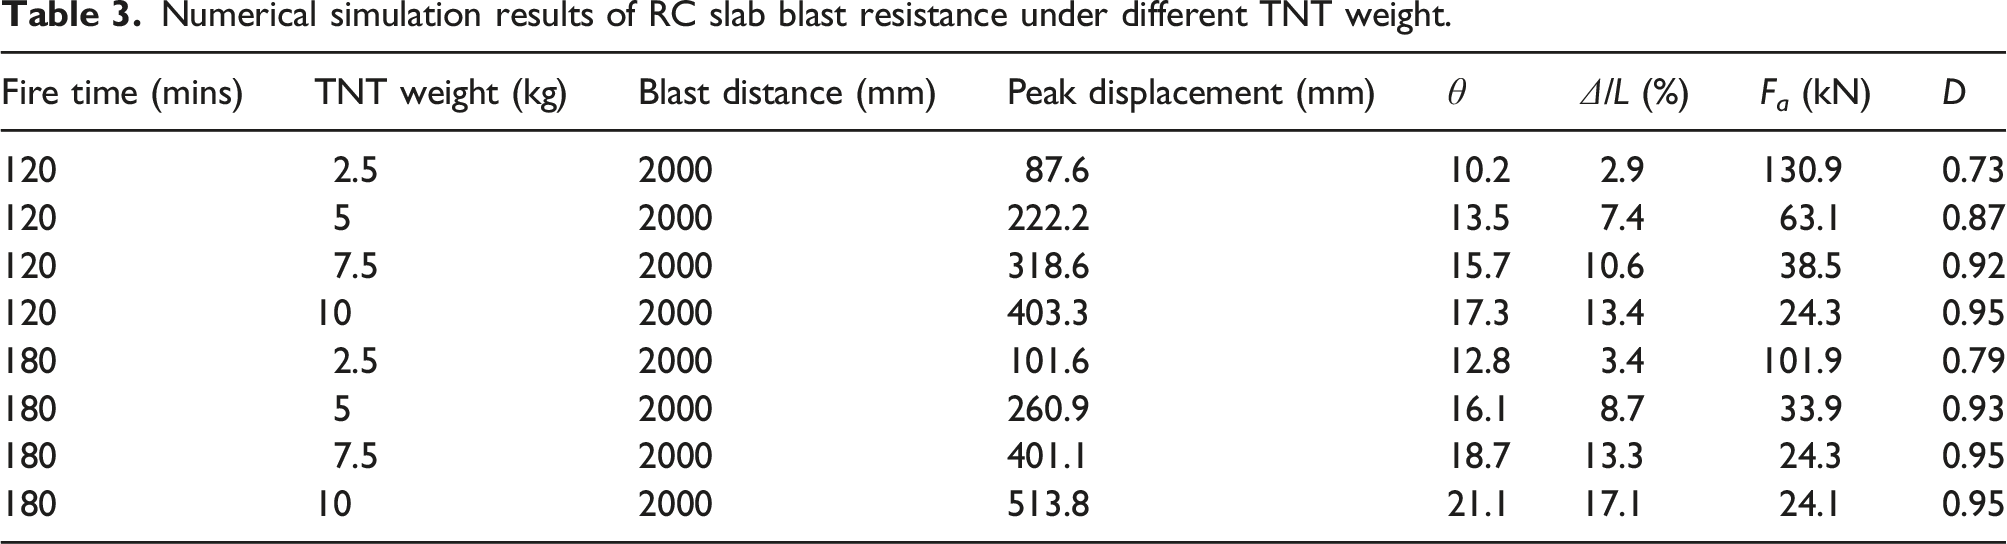
It can be seen from the above data that the increase of damage degree of RC slabs evaluated by support angle and the damage index (D) are less than the peak displacement-span ratio. However, when the TNT weight increases, the damage degree of RC slabs subjected to the coupling effect of high temperature and blast also increases. When the TNT weight increases from 2.5 kg to 7.5 kg, the support angle increases by more than 15%, the damage index increases by more than 18% and the peak displacement-span ratio increases by about 50%. In the process of TNT weight increasing from 7.5 kg to 10 kg, the increase of support angle is about 10%, the increase of damage index is about 5% and the increase of peak displacement-span ratio is about 25%.
From the perspectives of fire duration, scaled distance and TNT weight, the three different damage assessment methods are relatively close to the damage assessment of RC slab under the coupling effect of high temperature and blast. For moderate damage, the evaluation method of the support angle has higher numerical differentiation. However, when the support angle is more than 15°, the numerical differentiation of RC slab damage assessment by support angle is not obvious. When they are severely damaged or collapsed, the damage index can better reflect the degree of damage, the damage index (D) is more suitable of RC slabs. To sum up, different assessment methods should be used to evaluate the damage of RC slab under the coupling effect of high temperature and blast.
Conclusions
In this paper, numerical investigation is performed to analyze the blast-resistant performance of RC slabs after fire, and the failure modes and dynamic responses of RC slabs under different fire durations, scaled distances and TNT weights are discussed. The main conclusions are drawn below: 1. Under the same TNT weight, the maximum mid-span displacement of RC slabs increases with the increase of fire duration. The reason is that under the influence of high temperature for a long time, the internal structure of concrete deteriorates, the strength of reinforcement decreases, and the overall stiffness of RC slabs decreases. When subjected to the action of blast load, the damage is more serious. 2. Under the same fire duration, with the increase of the scaled distance Z, the damage level of RC slabs decreases gradually, and the maximum deflection of the front center of the slabs decreases gradually. When Z >3 m/kg1/3, the peak overpressure and impulse of the blast load on the RC slab attenuate greatly, which will not cause serious damage to the structure. 3. The maximum mid-span displacement of RC slabs increases with the increase of TNT weight. When the TNT weight increased from 2.5 kg to 5 kg and 7.5 kg, the upward trend is most obvious, with an average increase of 155.3% and 48.6%. When the TNT weight is greater than 7.5 kg, the punching shear failures of RC slabs has occurred, and the subsequent increase of explosive has no obvious effect on its damage degree. 4. It is accurate to evaluate the damage grade of RC slabs using the support angle, peak displacement span ratio and damage index as damage criteria. When RC slabs are subjected to slight or moderate damage, the support angle is suitable for evaluating the damage discriminsation. When RC slabs are severely damaged or collapsed, the damage assessment method of damage index is more suitable.
Footnotes
Declaration of conflicting interests
The author(s) declared no potential conflicts of interest with respect to the research, authorship, and/or publication of this article.
Funding
The author(s) disclosed receipt of the following financial support for the research, authorship, and/or publication of this article: This work was supported by the financial support provided by the National Natural Science Foundation of China (Nos.52168028, 52022024), Natural Science Foundation of Guangxi (No.2021GXNSFFA196001), Guangxi Science and Technology Base and Talent Project (2021AC19076), and Guangxi Key Laboratory Project of New Energy and Building Energy Saving (Gui Ke Neng22-J-21-3, Gui Ke Neng22-J-21-5, Gui Ke Neng22-J-21-27). Any opinions, findings and conclusions expressed in this paper do not necessarily reflect the view of Natural Science Foundation of China.