
Abstract
The assessment of the fatigue crack growth rate behavior of welded structural components made of ultra-high strength steels (UHHS) is very important to gain a comprehensive understanding of these materials under high-cycle fatigue loadings and to enhance their applications in the construction industry. The literature on the fatigue crack growth rates of welded ultra-high strength steel plates with nominal yield strengths higher than 690 MPa is very scarce and only very limited research has been done thus far to provide the Paris’ Law fatigue material constants for welded UHSS components in terms of the base metal (BM), the weld metal (WM), and the heat-affected zone (HAZ) regions, which are essential for fatigue life prediction. Hence, the fatigue crack growth rates of butt-welded UHSS plates with three grades (S700, S960, and S1100) are experimentally investigated in this study using Paris’ Law for these three different regions of the welded components. Gas metal arc welding (GMAW) and laser welding (LW) methods are adopted to analyze the influence of welding methods on each steel grade with respect to their static and fatigue strength, microstructural changes, and hardness. In the fatigue crack growth rate test, it was observed that the S700 base material shows the lowest fatigue crack propagation resistance amongst these three grades. In welded components, laser welding outperforms gas welding in terms of the fatigue crack growth resistance. Comparisons of fatigue crack growth behaviors are made among all three tested UHSSs as well as with those from the literature.
Keywords
Highlights
• Examined microstructure of ultra-high strength steel (UHSS) in base metal (BM), weld metal (WM) and the heat-affected zone (HAZ) • Measured hardness of welded UHSS in BM, WM, and HAZ • Determined fatigue material constants in Paris’ Law for welded UHSS in BM, WM, and HAZ • Studied the influence of welding method and yield strength on fatigue crack propagation
Introduction
Recent developments in metallurgy for steel manufacturing have created increasing demands for ultra-high strength steel materials for infrastructure applications and production of industrial components in various fields including civil, construction, automotive, maritime, aerospace, and mechanical engineering. The popularity of high-strength steels (HSS) with a yield strength σf ≥ 460 MPa has been growing over the past two decades to replace the use of conventional strength steels (CSS) with σf of 350 MPa in engineering design. Due to the advances in the steel manufacturing methods [Maity and Kawalla, 2011], ultra-high strength steels (UHSS) with σf ≥ 690 MPa can now be produced by using quenching and tempering (Q&T) method, and direct quenching (DQ) method [Kömi et al., 2016].
The availability of HSS and UHSS on the market in recent years has created a stir in engineering and construction industry and has caught great interest from researchers worldwide due to the higher strength and more lightweight performance compared to CSS. The use of both HSS and UHSS to replace CSS can reduce the carbon footprint from the manufacturing and transportation of heavy materials. Moreover, their applications in replacing CSS in heavily loaded structures like high-rise buildings and long-span bridges can minimise the structure weight by utilizing lighter, slenderer, and simpler components with higher structural resistance that leads to higher energy conservation and cost-effectiveness in fabrication, transportation, assembly, and maintenance [Ban and Shi, 2018]. Thus, the modern civil engineering and construction industries demand steels with higher yield strengths that encourage an investigation into the behavior of structural components made of HSS [Fukumoto, 1996, Ricles et al., 1998, Young, 2008, Pham and Hancock, 2010, W. Wang et al., 2017, Y.-B. Wang et al., 2014] and lately, more research works have been focused on the UHSS plates or tubes [Azhari et al., 2015; Javidan et al., 2016; Nassirnia et al., 2016; Rhodes et al., 2005; Javidan et al., 2016; Ban et al., 2013] to fully exploit these aforementioned advantages. Besides, UHSS has the potential to promote the use of the thin-walled structures due to the enabling less material usage and lower weight.
Although HSS and UHSS offer considerable benefits from the increased yield strength, fatigue resistance of these steels is still a major concern [De Jesus et al., 2012]. The higher steel grades trade-off their high yield strength with lower ductility and higher vulnerability to fatigue loadings [Hobbacher, 2016]. Fatigue is commonly known as a progressive degradation of strength under time variant stress. Recently, extensive research works have been focused on the characterization of fatigue properties in HSS and UHSS [De Jesus et al., 2012; Beretta et al., 2009; Björk et al., 2018; Lahtinen et al., 2019; Yin et al., 2018; Lipiäinen et al., 2021; Ahola et al., 2019; Ajaja et al., 2020; Cockings et al., 2020; Liu et al., 2019] since fatigue fracture is the most commonly failure mode observed at the welded joints of engineering components subjected to fluctuating loads. The most common welding methods for adjoining HSS an UHSS plates are gas metal arc welding (GMAW) [Guo et al., 2017; Amraei et al., 2017], and the laser welding (LW) [Farrokhi et al., 2015; Guo et al., 2015]; however, there is limited information on the effects of these welding processes on the fatigue properties. Some recent studies discovered the adverse effects of welding onto the mechanical properties of S690-QT steel welded joints under static loads. With the proper control on heat input energy, q during welding, the reduction in the mechanical properties of S690-QT joints can be minimized under tension [X. Liu et al., 2018, Cai et al., 2022, Chung et al., 2020 and Ho et al., 2020], compression and in-plane bending [Hu et al., 2021]. Moreover, microstructure evolution occurs within the HAZ of various temperatures during welding where the HAZ of low temperature possesses weak microstructures with reduced mechanical properties [Ho et al., 2020]. However, there is still limited information available in the literature about the effects of welding onto fatigue properties of welded UHSS plates.
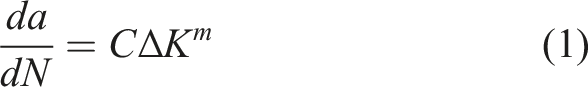
The fatigue life of a structure consists of two stages: crack initiation (dislocation movement, crack nucleation, micro-crack propagation) and crack propagation (macro crack propagation and final fracture). In 1961, Paris et al. (1961) developed a fatigue crack growth equation that relates the stress intensity factor (SIF) to the fatigue rack growth rate, which has been widely used to determine the fatigue crack growth for many different engineering materials. At present, very limited research works have been investigated material constants, C and m using Paris’ Law for welded joints made of CSS [De Jesus et al., 2012, Adedipe et al., 2017] and HSS [Chai et al., 2014; Zhao et al., 2018; Kurihara et al., 1986; Li et al., 2018; Sedmak et al., 2020; Čamagić et al., 2013; Miranda et al., 2013; Baptista et al., 2018] in terms of base metal (BM) region, weld metal (WM) region and heat-affected zone (HAZ) with only two available studies reported for UHSS [Xie et al., 2019; Lukács et al., 2018] to predict their fatigue crack growth rates. Thus, there is a further need for the determination of fatigue crack growth properties for welded UHSS joints, especially, in the HAZ since welding alters the microstructure and causes local softening in the HAZ [Amraei et al., 2019; Amraei et al., 2020; Afkhami et al., 2022]. Furthermore, the current design standards and specifications such as Eurocode3 [CEN, 2005], and AISC 360 [Committee, 2010], AS4100 [AS, 1998], and GB50017 [GB50017, 2017] do not cover fatigue design for UHSS, hindering their further applications. This highlights the urgent demand for further studies focused on the fatigue crack growth rate behavior of welded UHSS plates.
This research aims to study the fatigue crack growth rates of butt-welded UHSS plates of steel grades S700, S960, and S1100. GMAW and LW are adopted for joining the steel plates. Material constants, C and m, are determined using linear elastic fracture mechanics (LEFM) according to the Paris’s Law for three different regions of the welded joint in terms of BM, WM, and HAZ. Each condition is also studied to evaluate the quasi-static tensile properties, the Vickers micro-hardness distributions across the weldments and the microstructure changes in the HAZ. The results from this paper are compared with the reported results from existing literature for UHSS to observe the behavioral changes among different UHSS grades. The results of this paper contribute to fill the knowledge gap in the literature for understanding the fatigue crack growth rate behavior of welded UHSS plates through experimental investigations and aim to provide fatigue material properties, C and m, for each different region for future fracture mechanics calculation in fatigue propagation life assessment.
Materials
Material and tensile properties
Chemical composition of ultra-high strength structural steels (wt%).
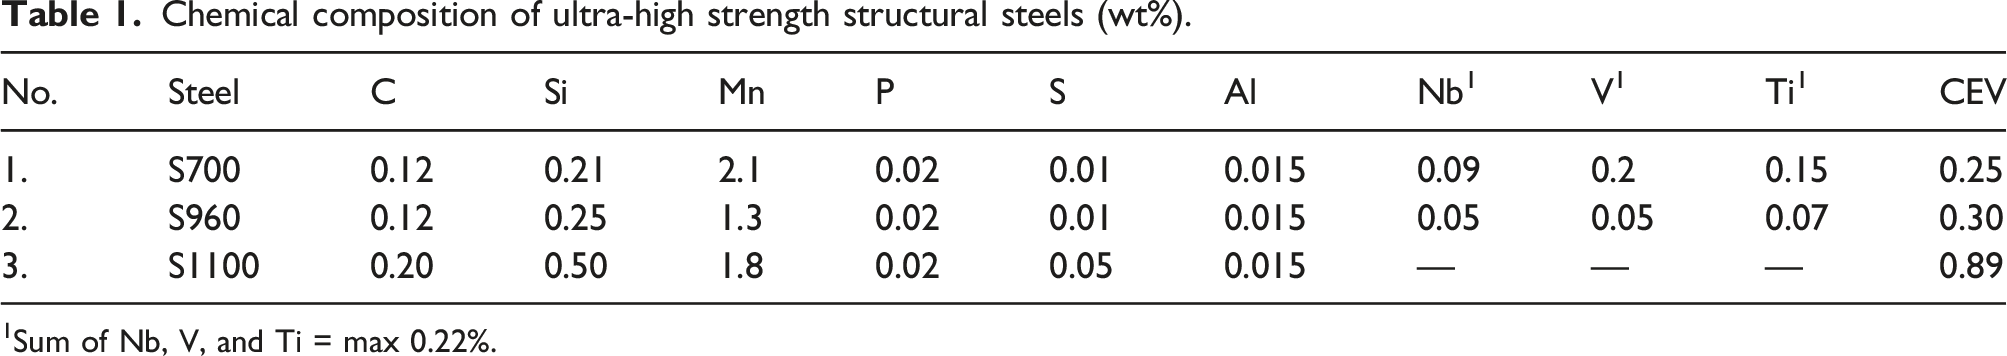
1Sum of Nb, V, and Ti = max 0.22%.
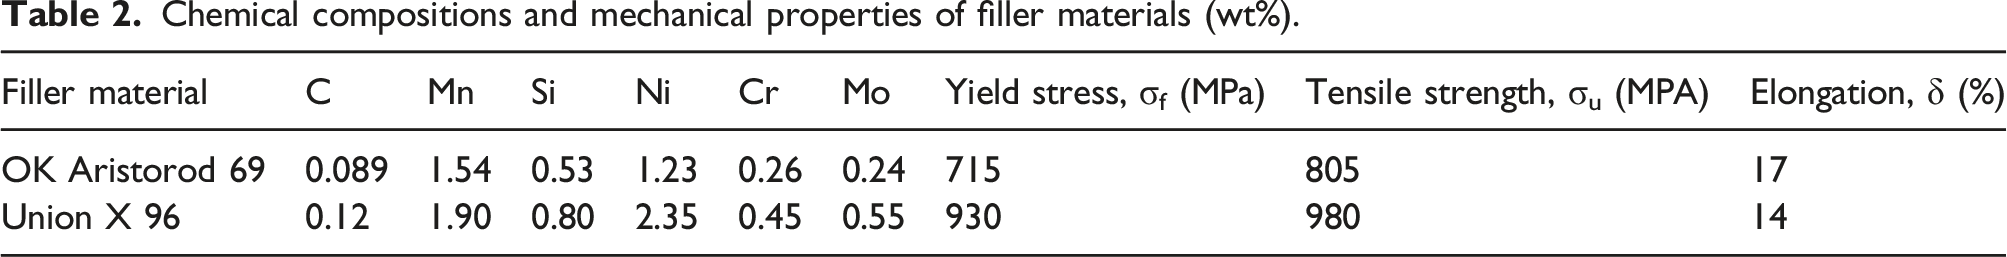
Chemical compositions and mechanical properties of filler materials (wt%).
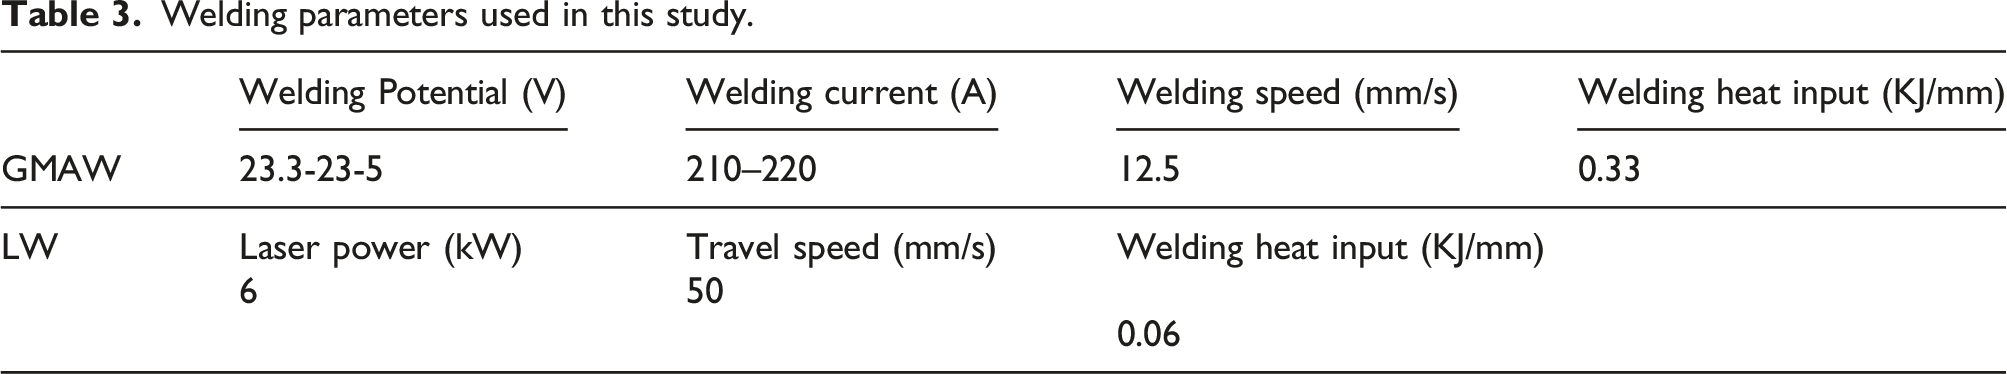
Welding parameters used in this study.
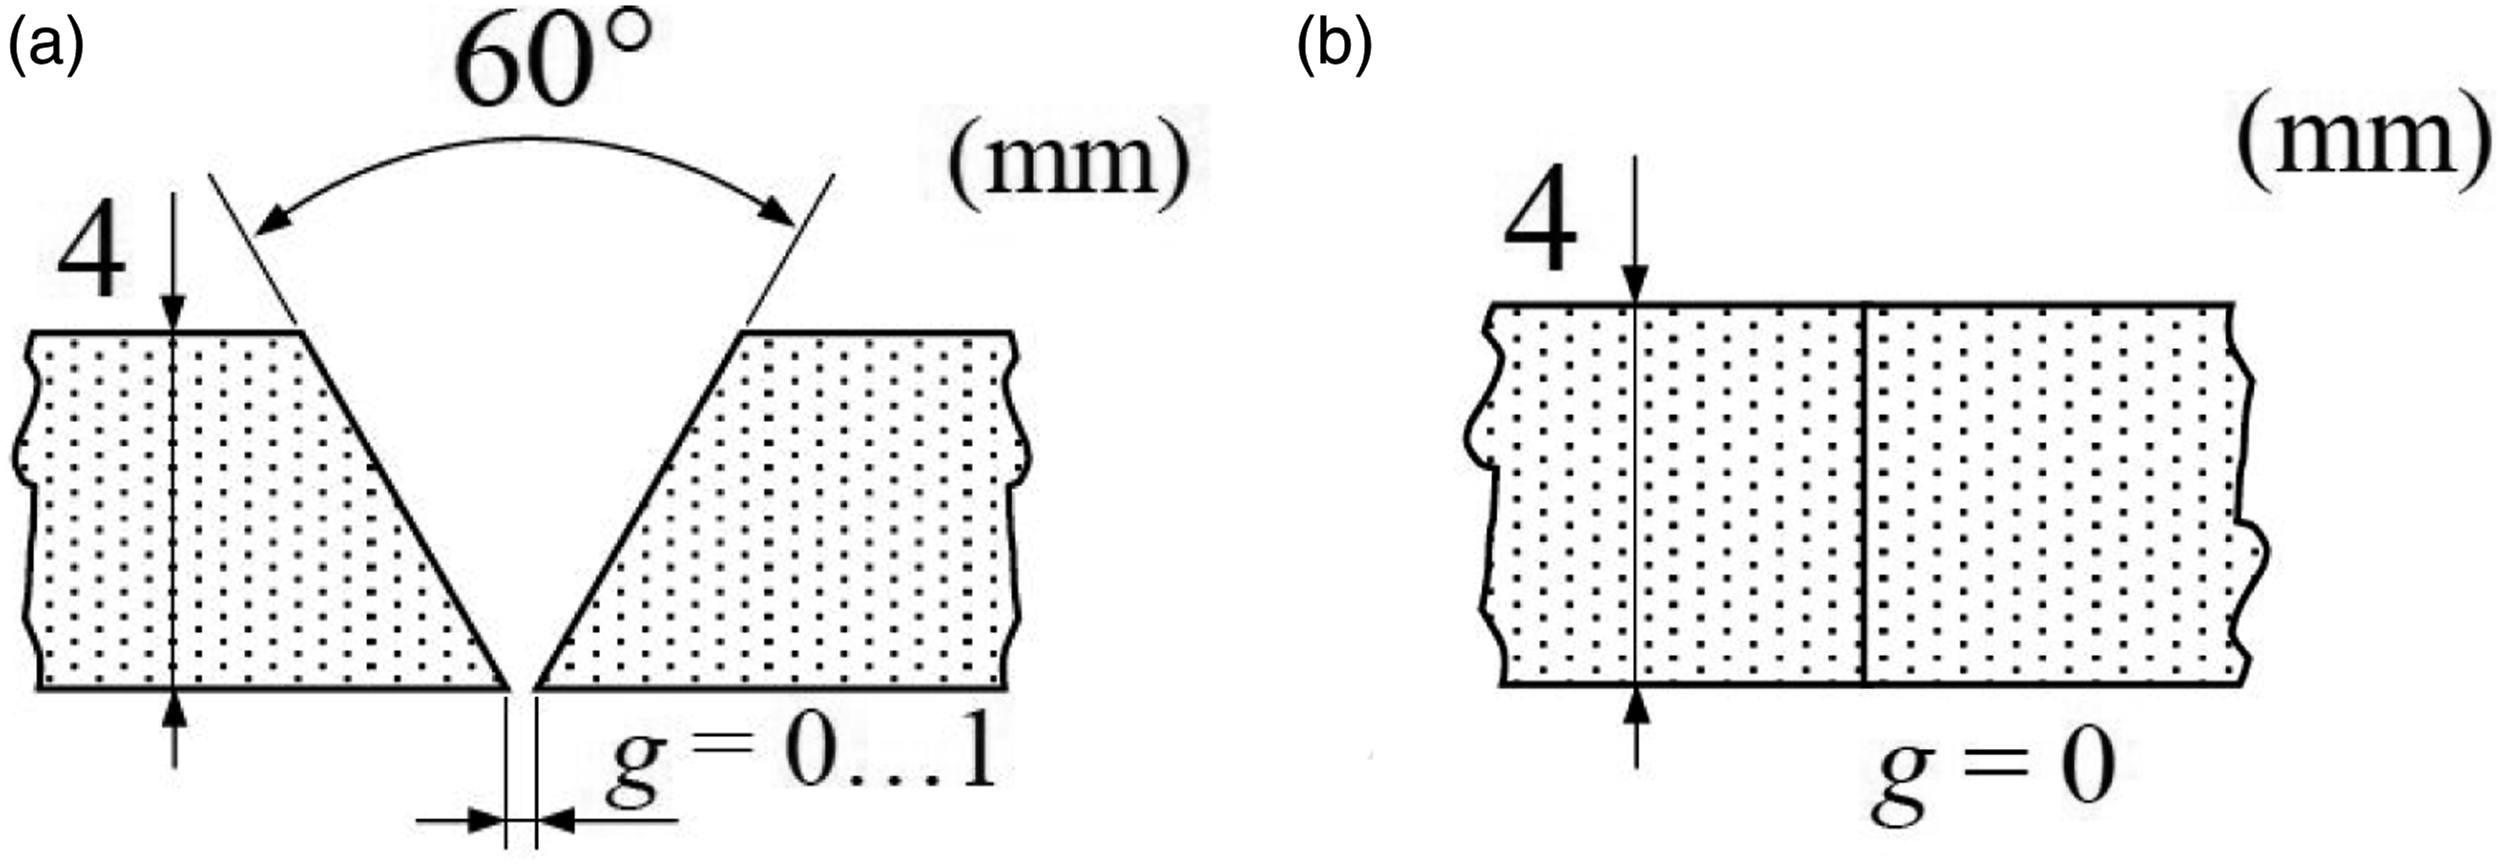
Geometry of weld groove, (a) GMAW and (b) LW.
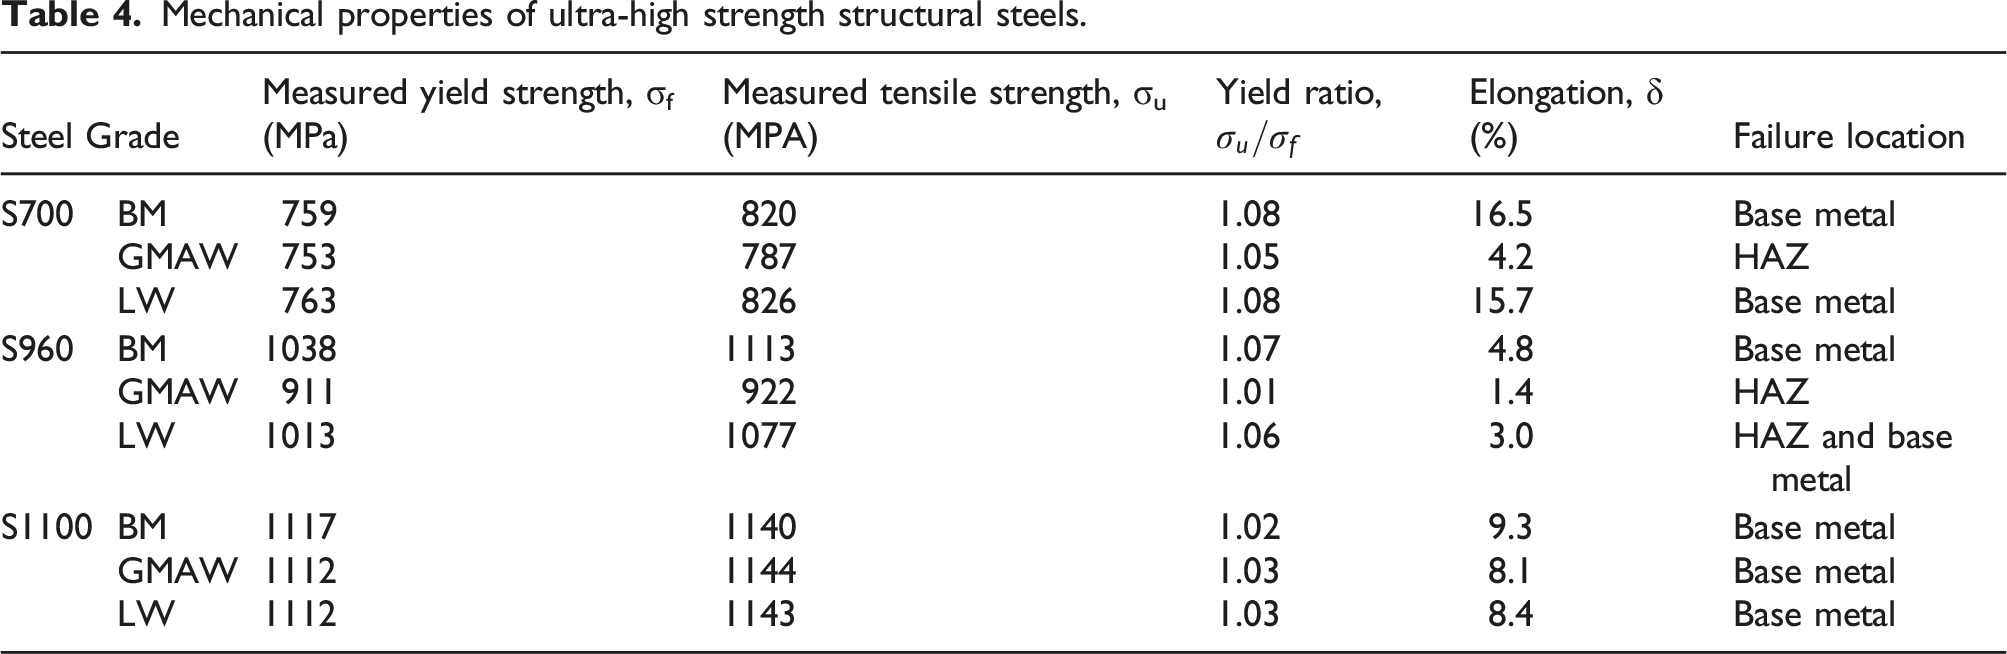
Mechanical properties of ultra-high strength structural steels.

Stress–strain curves of high and ultra-high strength steels and their failure locations.
BMs of S700 and S1100 show 16.5% and 9.3% elongation at fracture while S960 BM has a lower elongation of 4.8%. The significant reduction in plastic deformation for S960 would be the result of the different manufacturing method as it was the direct-quenched (DQ) steel. Overall, the results of BMs indicate that the higher steel grades tend to show a shorter plastic hardening relative to S700 to compensate for the higher yield strength.
For GMAW specimens, the failure location is HAZ for SG700 and SG960 resulting in a lower elongation and strength compared to their BM counterparts. The reduction in strength is minimal (less than 5%) for S700, whereas the reduction is more severe for S960 (around 17%). The failure location is BM for SG1100, which ends up similar elongation and strength as its BM counterpart.
For LW specimens, a similar behavior was observed among SL700 and SL1100 like their BM counterparts because the failure locations is in the BM. However, the failure locations for SL960 initiated in the HAZ before moving to the BM. This caused a reduction in elongation and slight reduction (about 4%) in strength compared to its BM counterpart.
The elongation percentages vary depending on failure locations, especially, in welded specimens due to mechanical heterogeneity which is the variation of strength and toughness in the local transition zone between weld metal and base metal owing to welding. Specimens with fracture locations featuring near the welded joints indicate the lower elongation compared to those with fracture locations away from the welded joints. Those welded specimens with failure locations in BM region show similar elongation with their BM counterparts.
Hardness
Surface grinding was carried out with 220 grit SiC grinding paper and then samples were polished with 9 μm and 3 μm diamond particles, respectively. Then, fine polishing was applied using 0.04 μm colloidal silica. Polished specimens were ultrasonically cleaned for 1 min to remove dirt and polishing compounds from the specimens. Afterward, 2% Nital etchant (i.e., 2% nitric acid in ethanol) was used for 30 s for S700 and S960 while 90 s was used for S1100. The Vickers hardness distributions across the weldments were then measured using a Vickers micro-hardness tester (Duramin-40) in accordance with Australian standard AS1817.1–2003. A 3 kg load was applied for indentation and dwell time was 15 s and 0.2 mm interval was applied between each indentation. Hardness measurement points were collected along three horizontal lines including the centerline of the weldment (middle line), and 1 mm above/below the middle line, respectively.
The hardness distributions at the weldments were measured for both GMAW and LW samples as shown in Figure 3. For S1100 steel, the hardness reduction in HAZ is minimal (about 4%) no matter which welding method is used. For S700 steel, the hardness reduction in HAZ is significant when GMAW is used, whereas the reduction is very small (less than 1.5%) when LW is used. For S960 steel, the hardness reduction in HAZ is significant, that is, about 30% for GMAW and 23% for LW. The reason behind the low hardness reduction in S1100 compared to the other two steels is the microstructure and manufacturing process of the base material which has been explained by [Amraei et al., 2019; Amraei et al., 2020]. Hardness measurement across the weldments.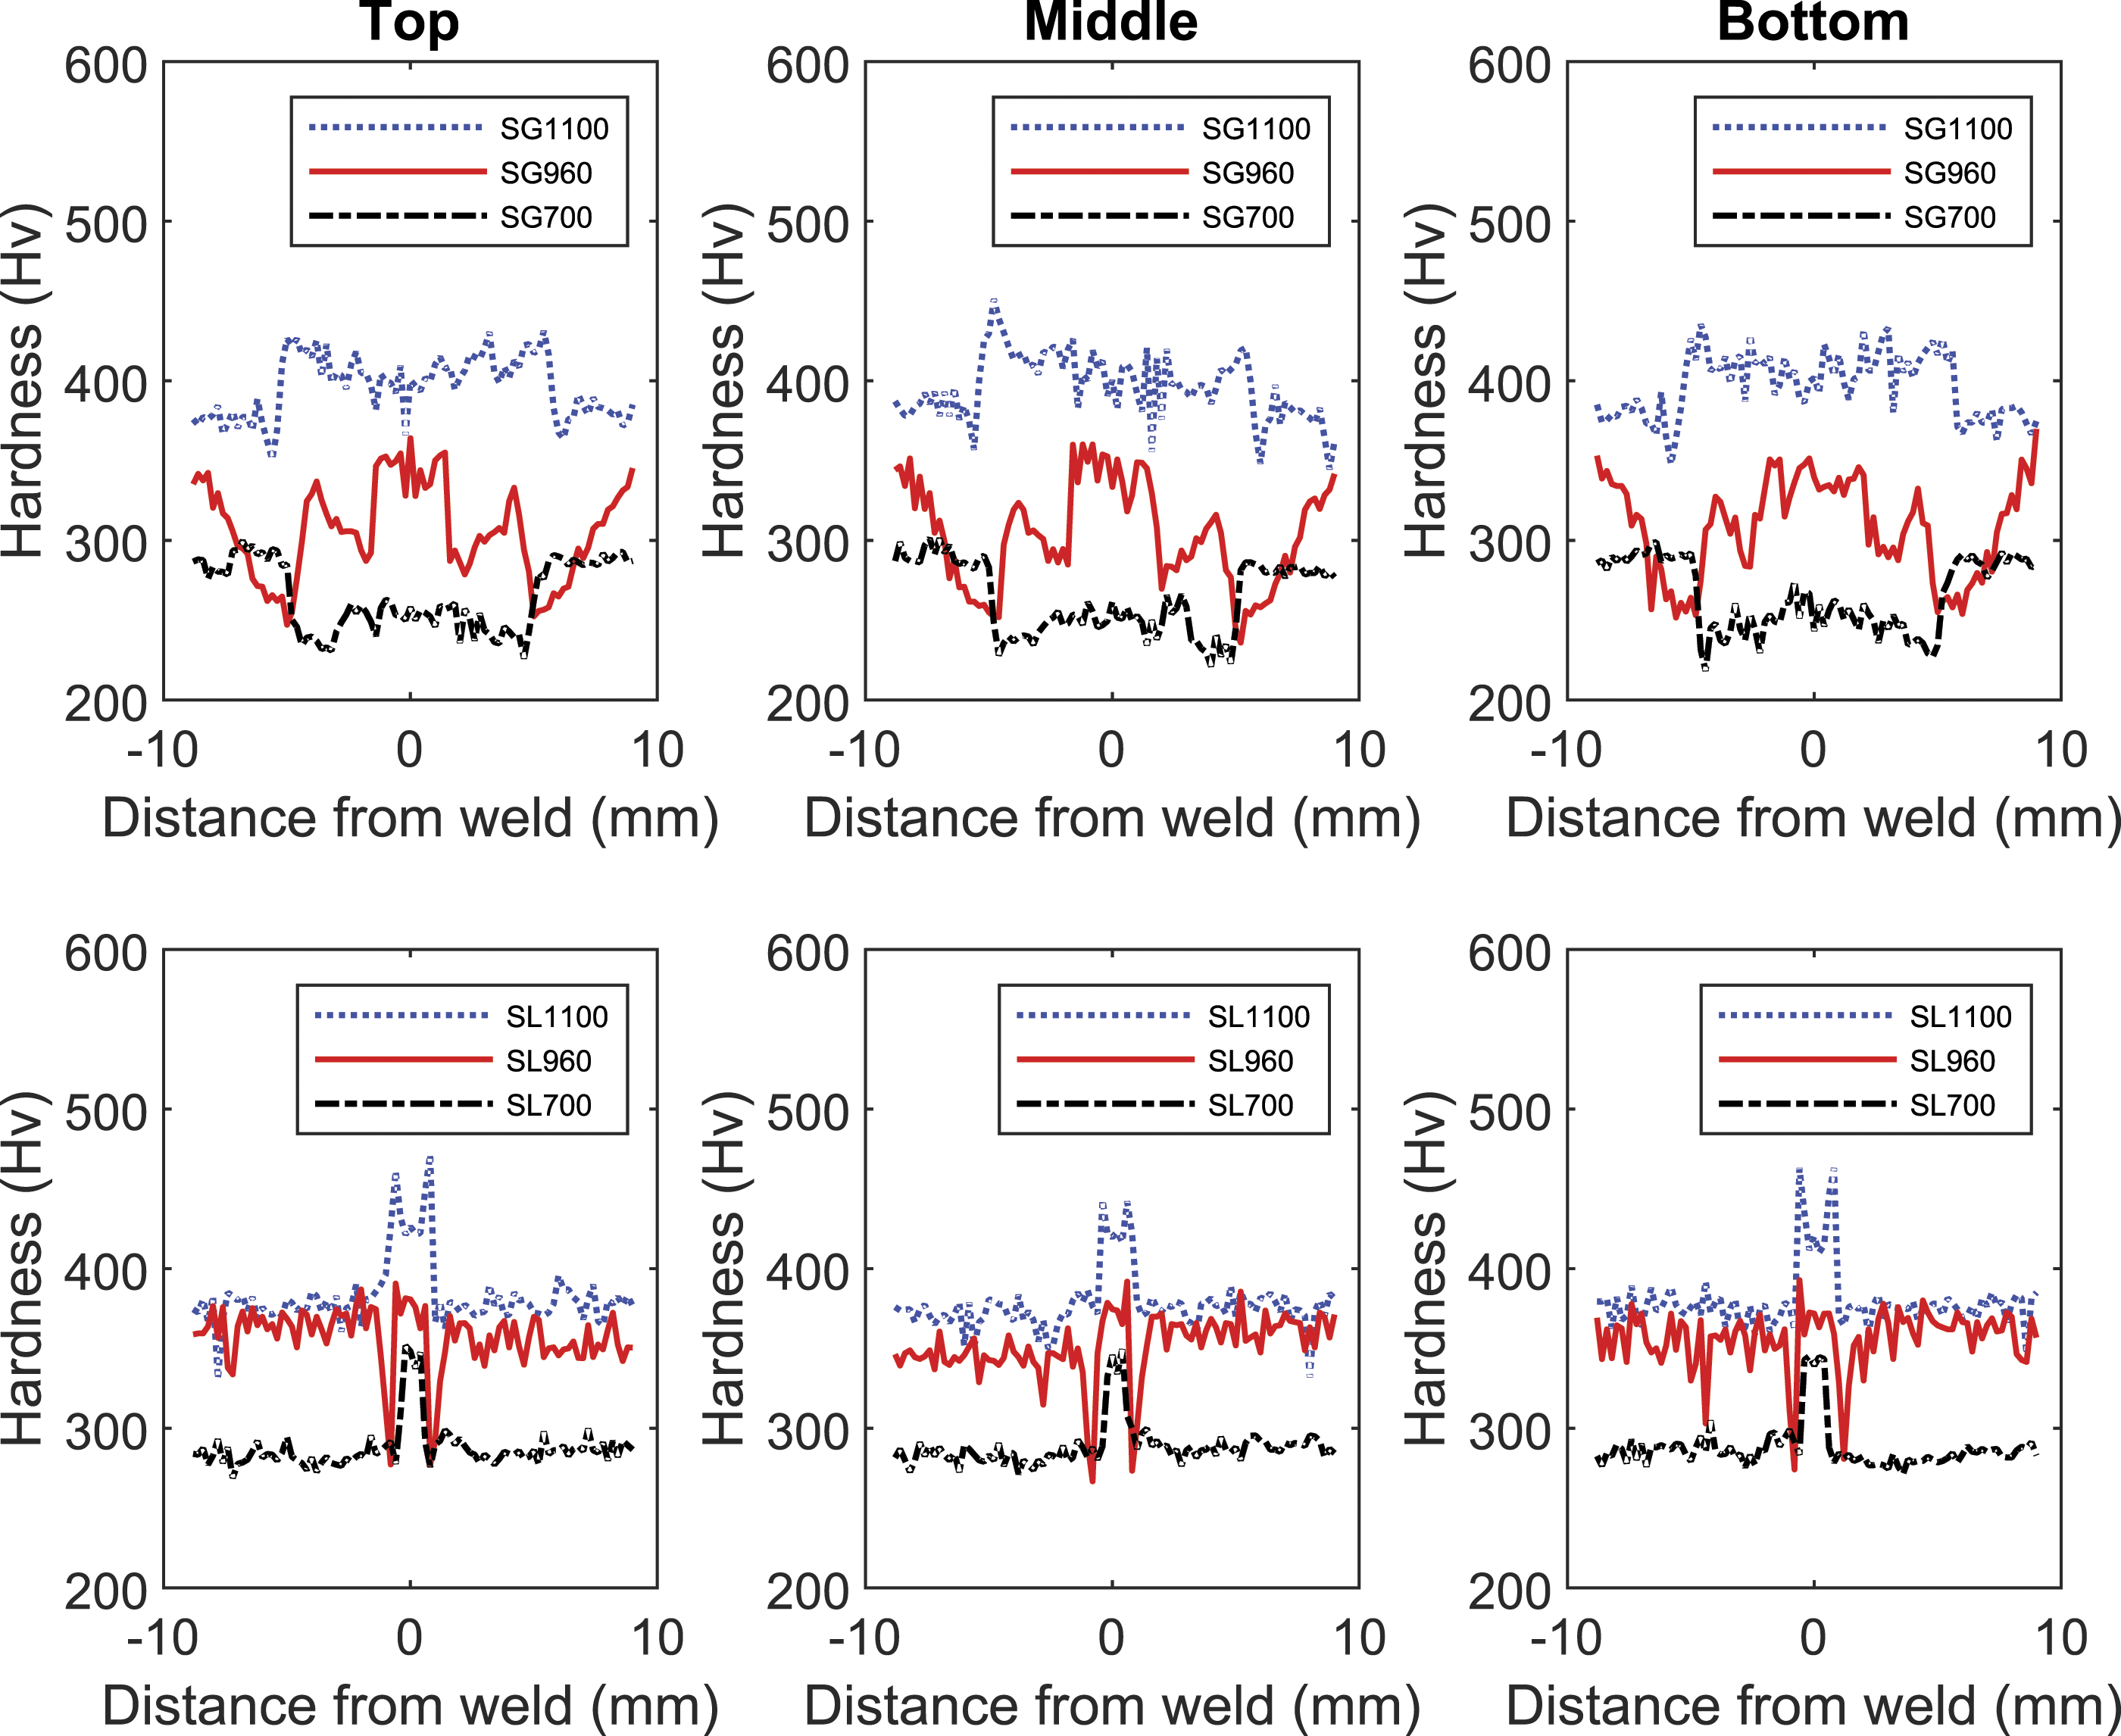
Microstructures
The cross-sections of the microstructure samples were prepared identically to the hardness samples to characterize the microstructures across the weldments using a Nikon Eclipse ME600 optical microscope.
There were four distinct microstructural features observed in GMA-welded specimens during the analysis. They were named after their featuring locations such as base metal (BM), weld metal (WM), softened HAZ, and HAZ. The softened HAZ microstructure lies between the end of the WM and after the margin line of HAZ and usually features a coarse microstructure. Similar features were also seen in the laser welded samples. Below, the microstructure of each zone of the specimens is explained briefly. The reader is referred to a deeper study about the microstructure of these steels after welding process using various welding heat inputs [Amraei et al., 2020, Amraei et al., 2019].
Figure 4 shows the different microstructures observed in SG700. BM and WM of S700 have totally distinct microstructures due to different materials used for parent and filler materials. Due to heat input from the welding process, a fusion line (FL) was notably seen on the etched specimen by the naked eyes. According to hardness test results from Section 2.2, the hardness values approaching the FL started to drop drastically from the existing hardness magnitude for BM. That margin was defined as the beginning of the HAZ. Then, the HAZ softening region is shown in Figure 4 (c) and a coarser microstructure was present. While the BM of this steel consists of a mixture of bainite, islands of martensite-austenite (M/A), the HAZ at the softened region shows a mixture of tempered martensite and granular bainite. Micrographs of SG700 at: (a) BM, (b) WM, (c) softened HAZ, and (d) HAZ.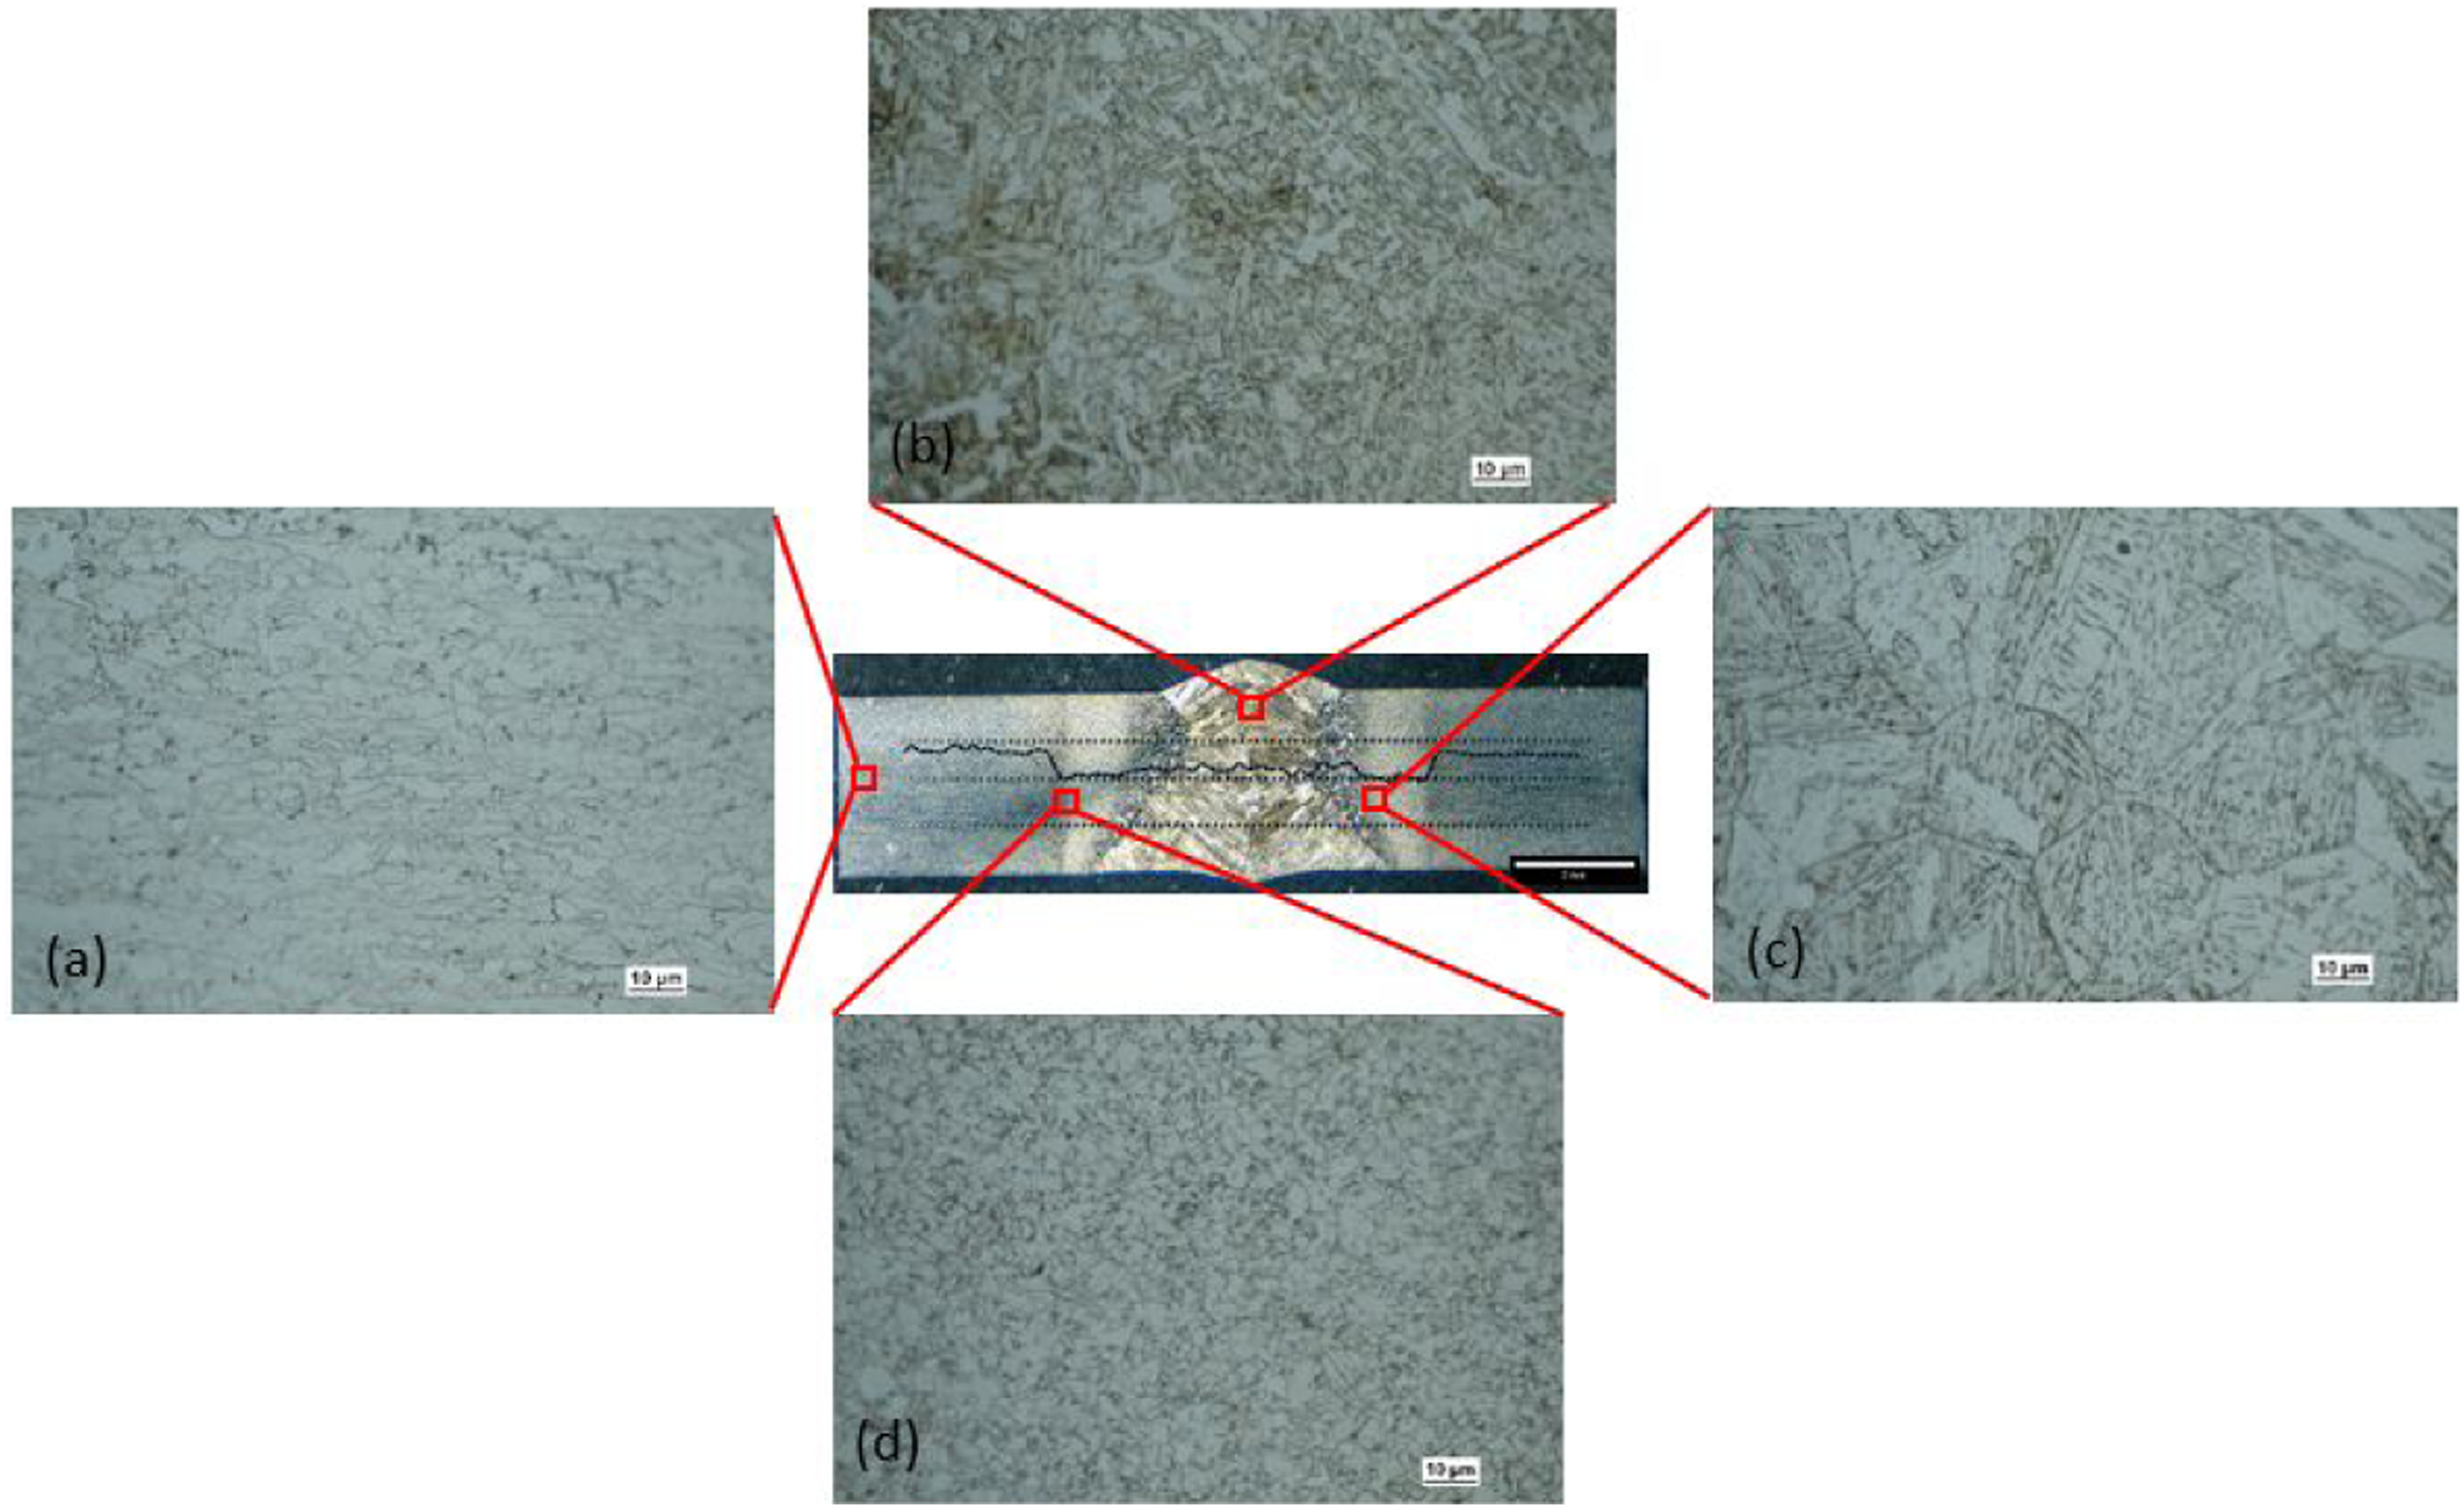
Figure 5 shows different microstructures for SL700. WM of SL700 that shows the highest hardness value has completely different features compared to WM of SG700 with filler material. The FL was also pronounced on the etched L-welded specimen and was visible to the naked. The softened HAZ was still present although it was smaller in size, and the microstructure was finer due to the higher cooling rate compared to SG700. The HAZ in SL700 reveals a finer texture of bainite and M/A at its softened HAZ compared to the GMAW specimens, which is associated to the higher cooling rate of the LW process. This is also the reason why the LW specimen resulted in less hardness reduction. Micrographs of SL700 at: (a) BM, (b) WM, (c) softened HAZ, and (d) HAZ.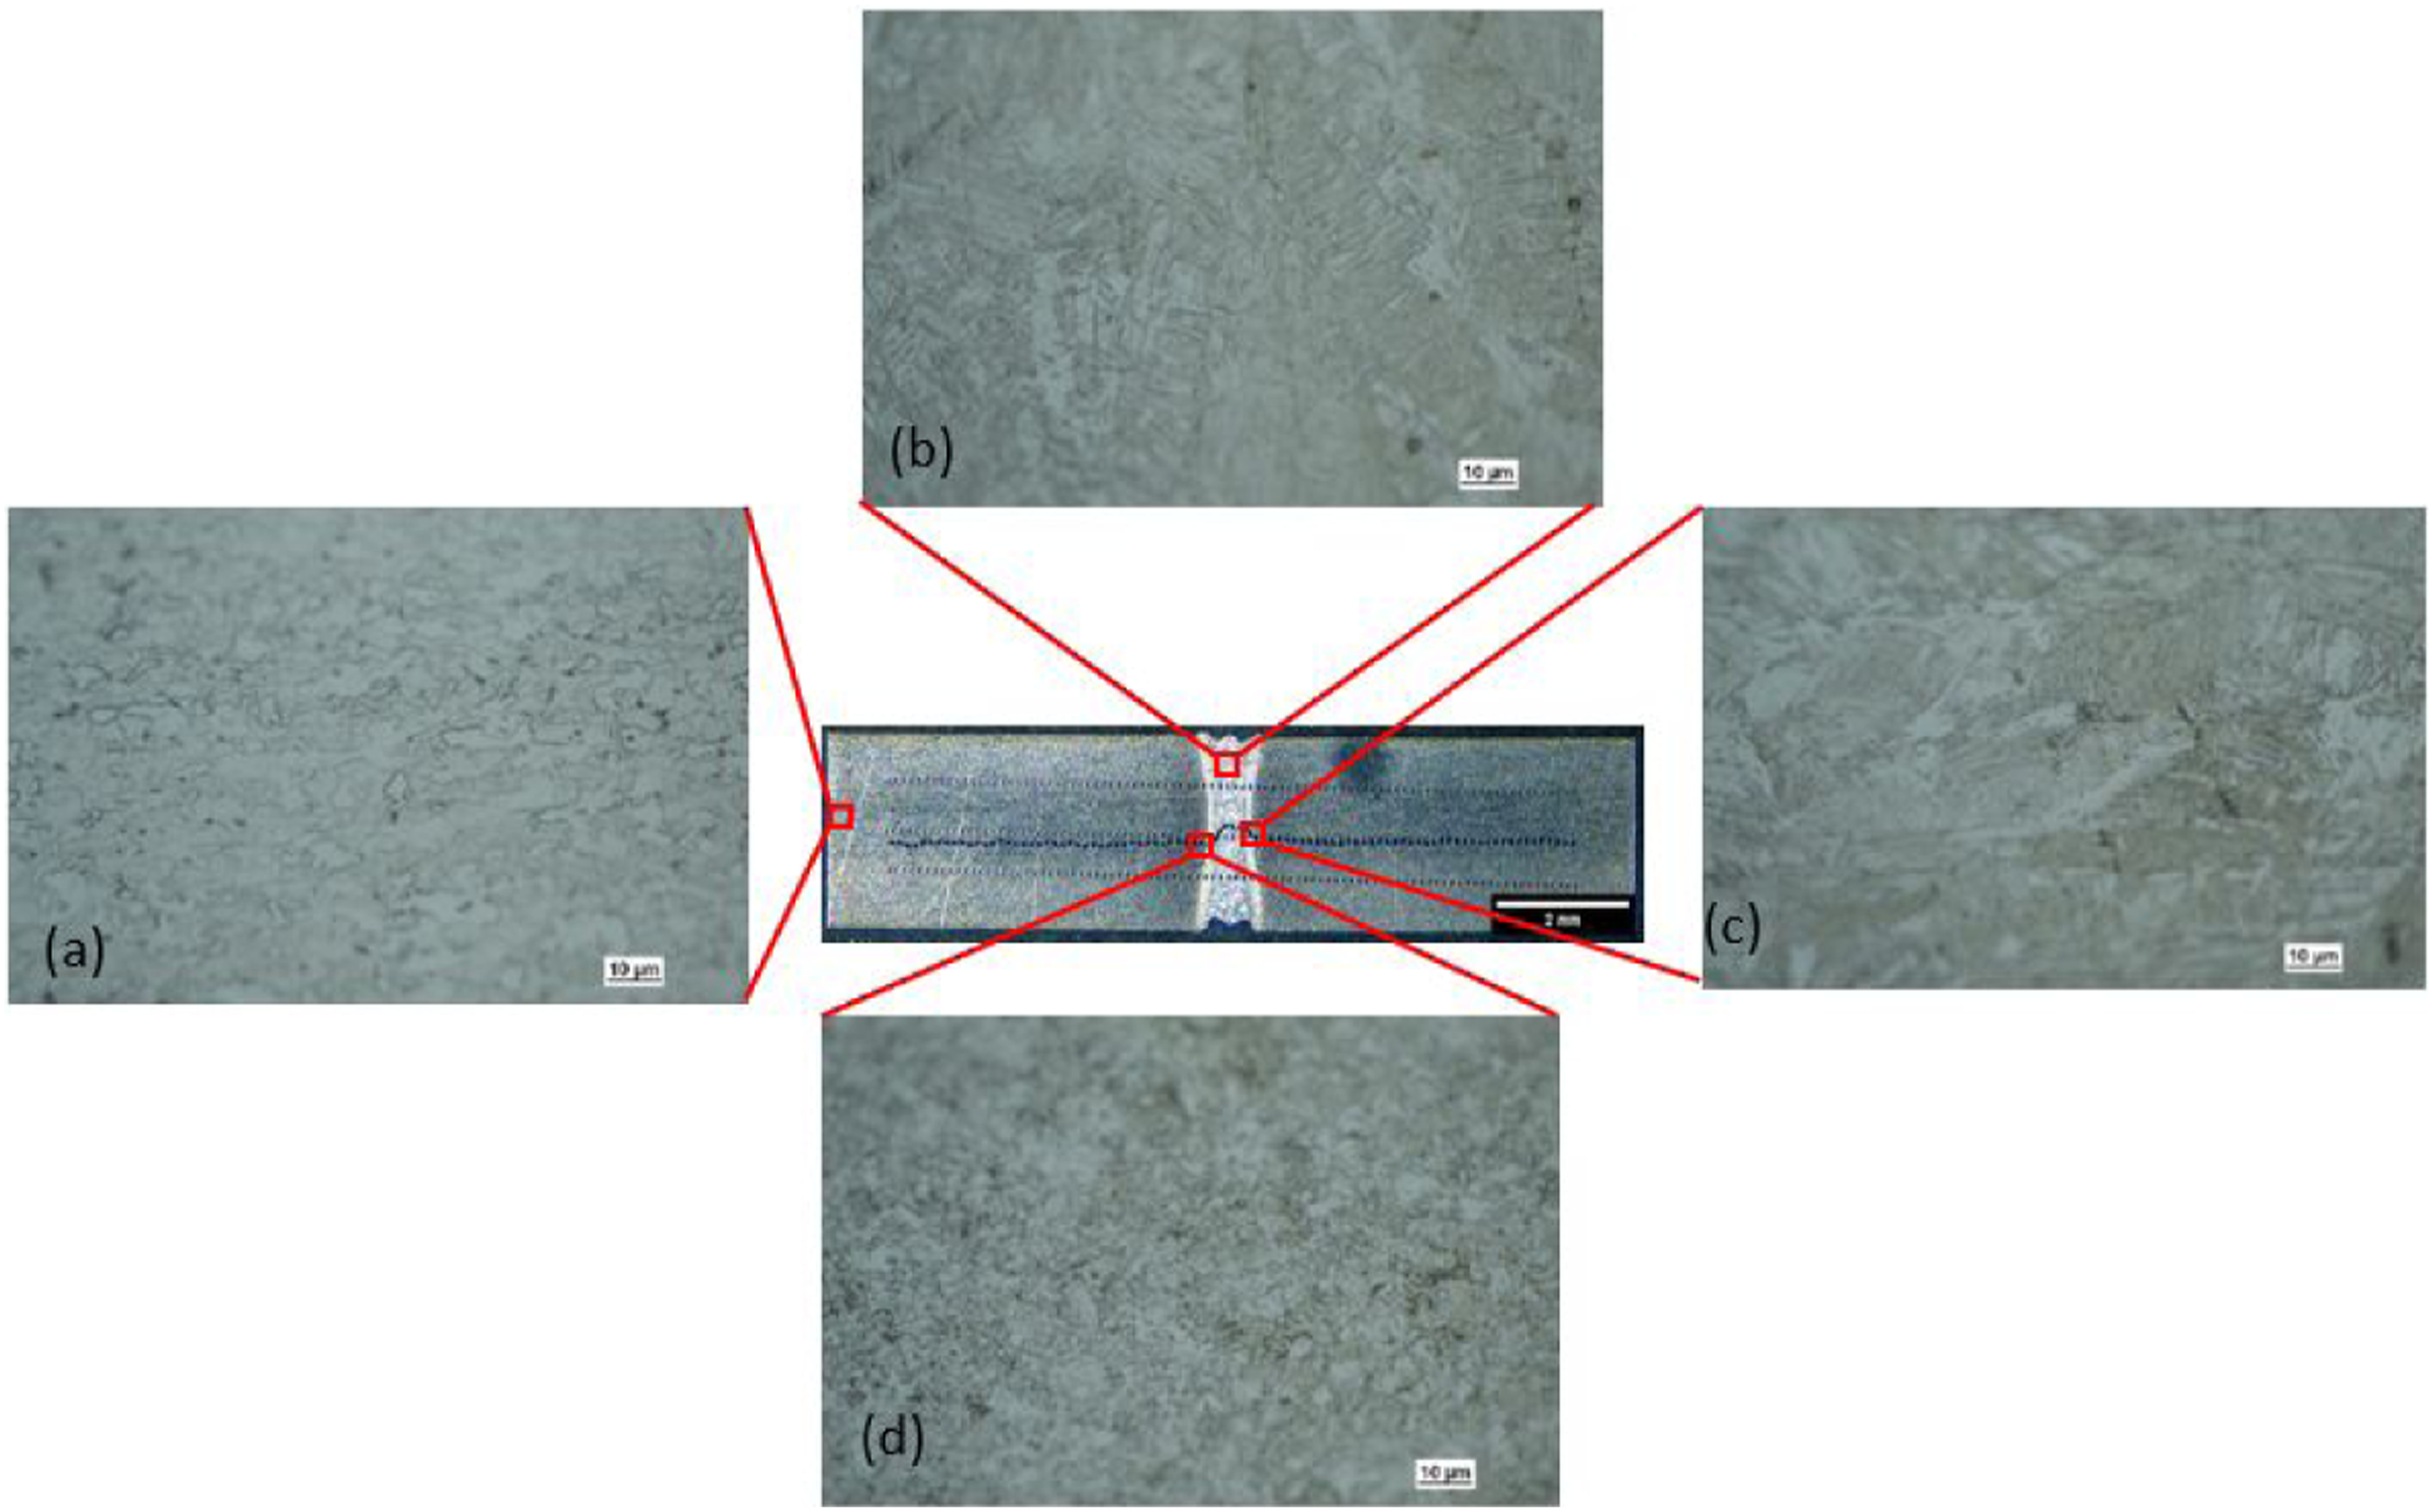
BM and WM of SG960 (see Figure 6) have different microstructure features due to different material usage. The HAZ was first observed after the hardness was dropped from the current BM hardness strength. The coarse microstructure of the softened HAZ was located near the FL. The BM of SG960 consists of bainite, islands of M/A, tempered martensite, and retained austenite. The HAZ of SG960 consists of granular bainite and bainite. Micrographs of SG960 at: (a) BM, (b) WM, (c) softened HAZ, and (d) HAZ.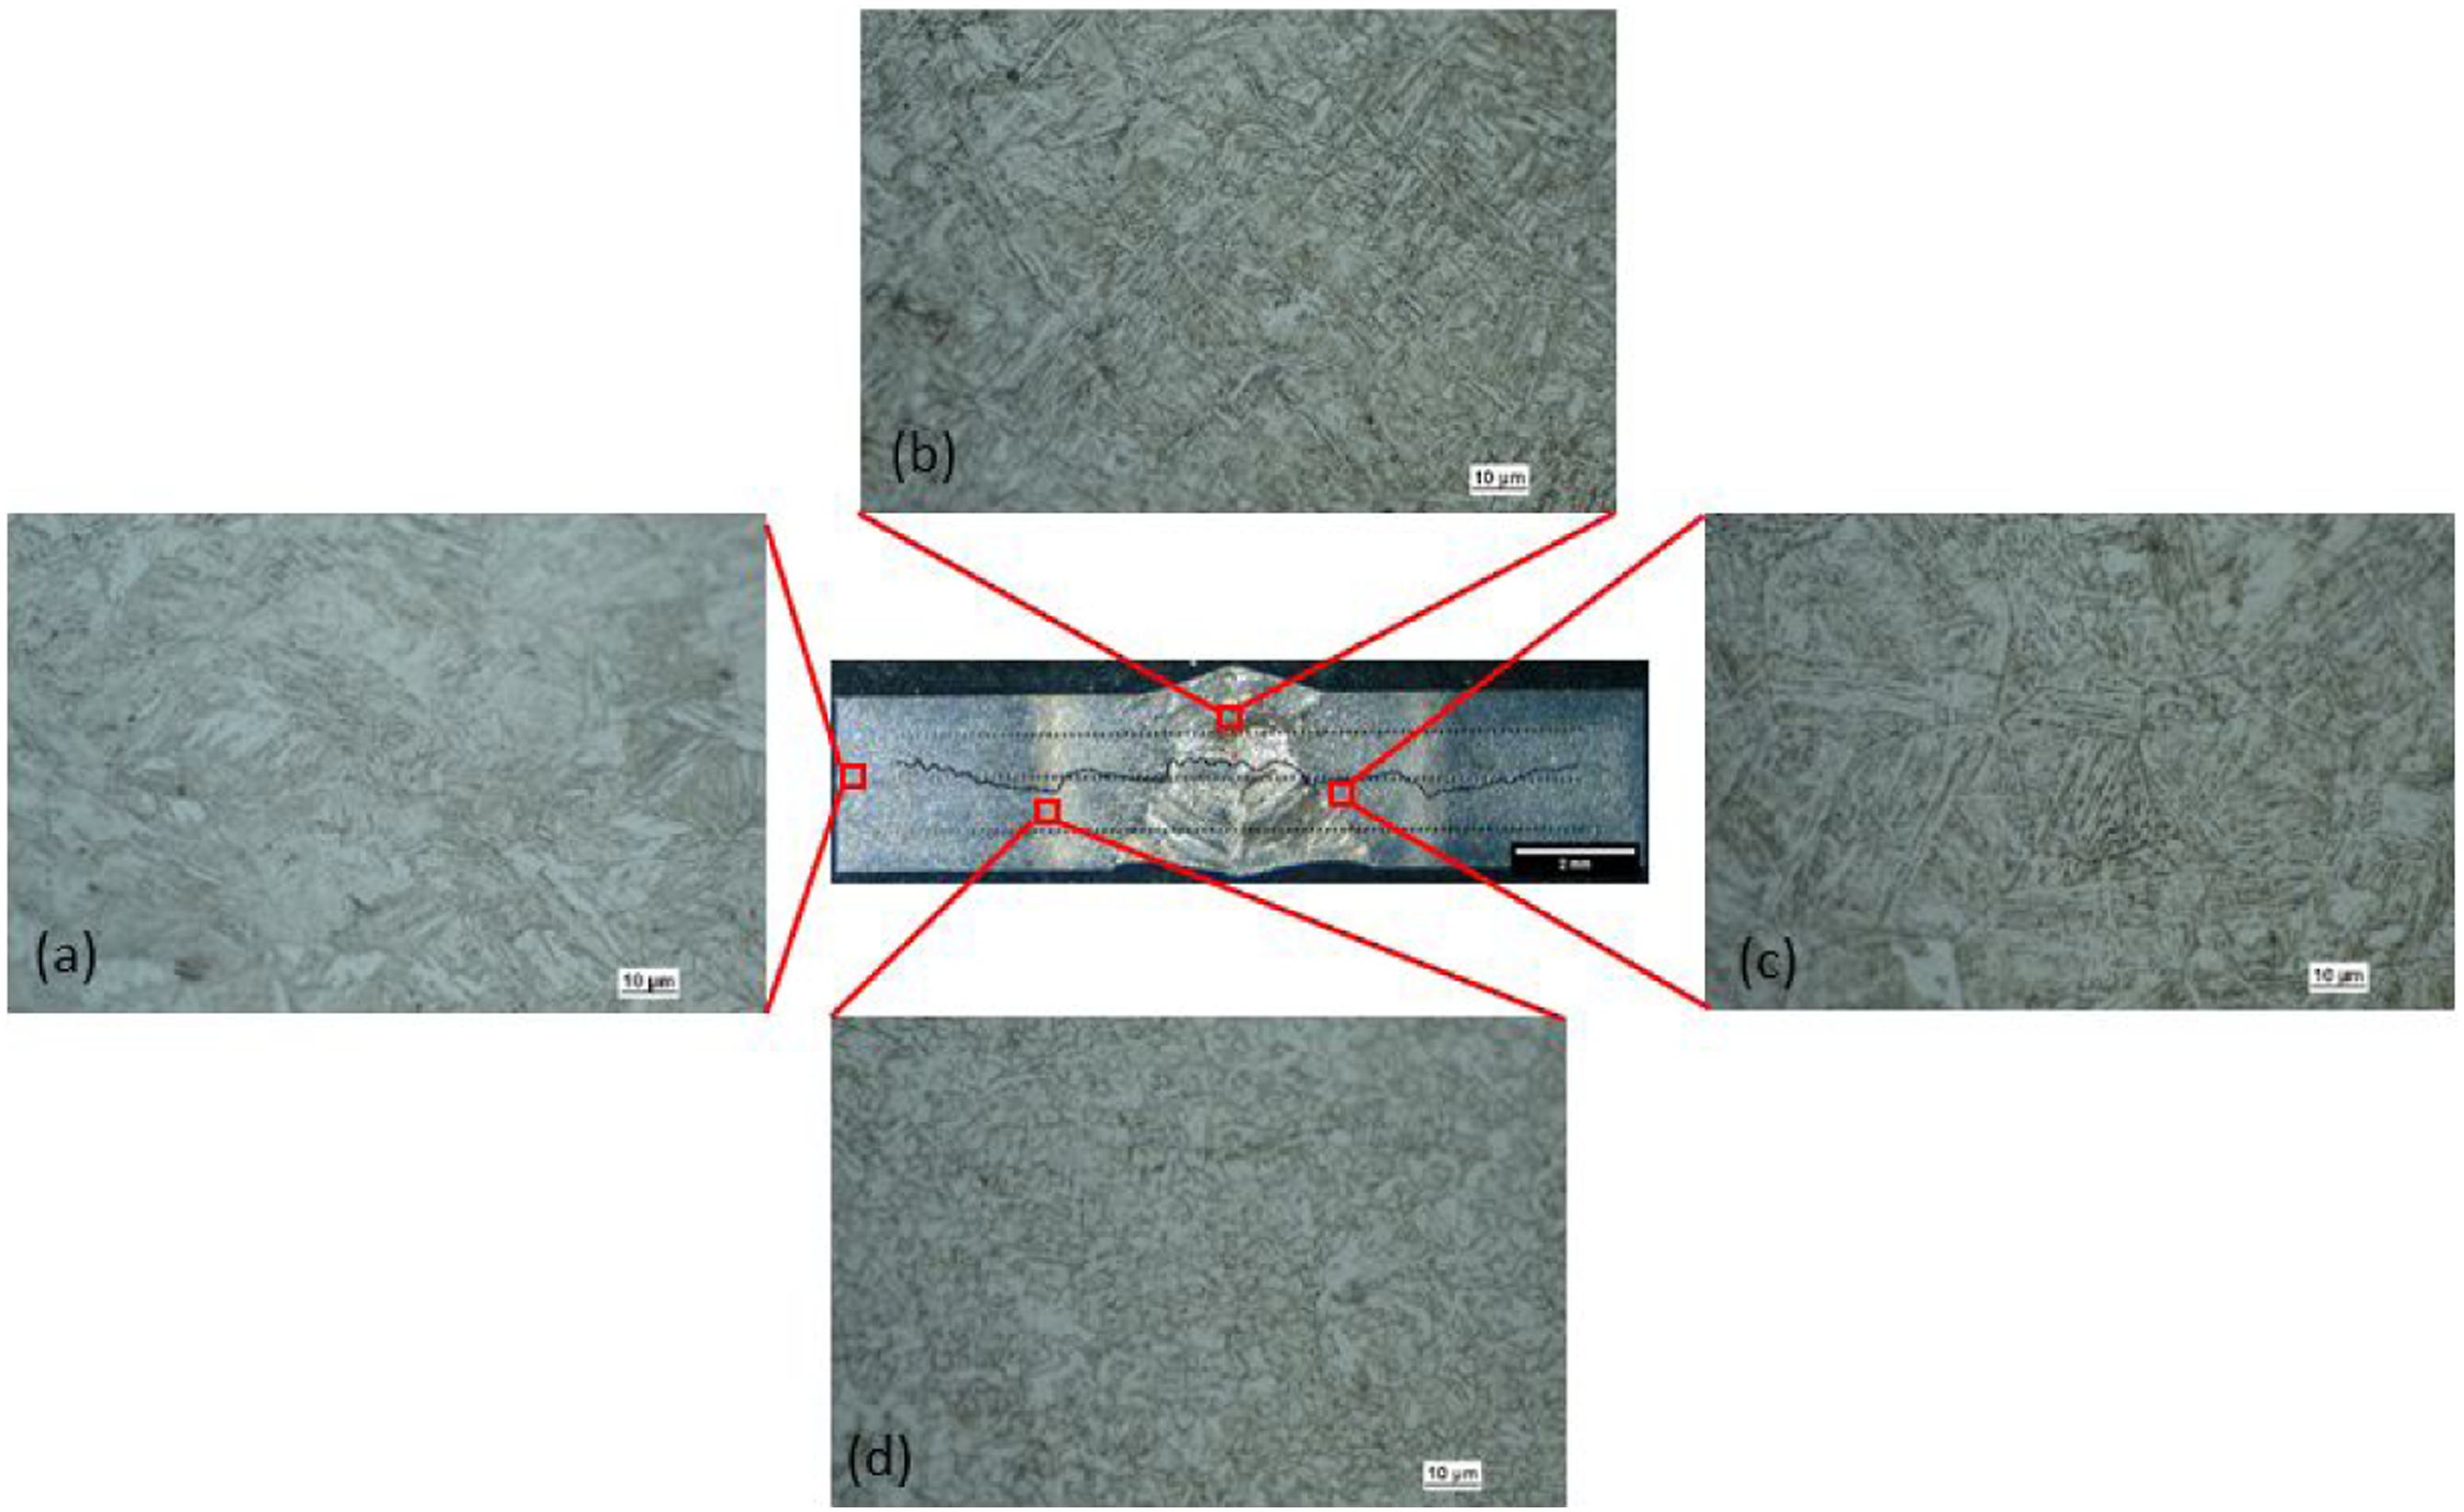
WM of SL960 shows the highest hardness value and its microstructure is different from BM (see Figure 7). The lowest hardness point was at the margin of the HAZ microstructure with a finer microstructure mixed with its BM. The softened HAZ has a slightly coarser microstructure compared to its WM. The softened HAZ in SL960 is a fine textured mixture of bainite and M/A which leads to a higher magnitude of hardness compared to the GMAW process. Micrographs of SL960 at: (a) BM, (b) WM, (c) softened HAZ, and (d) HAZ.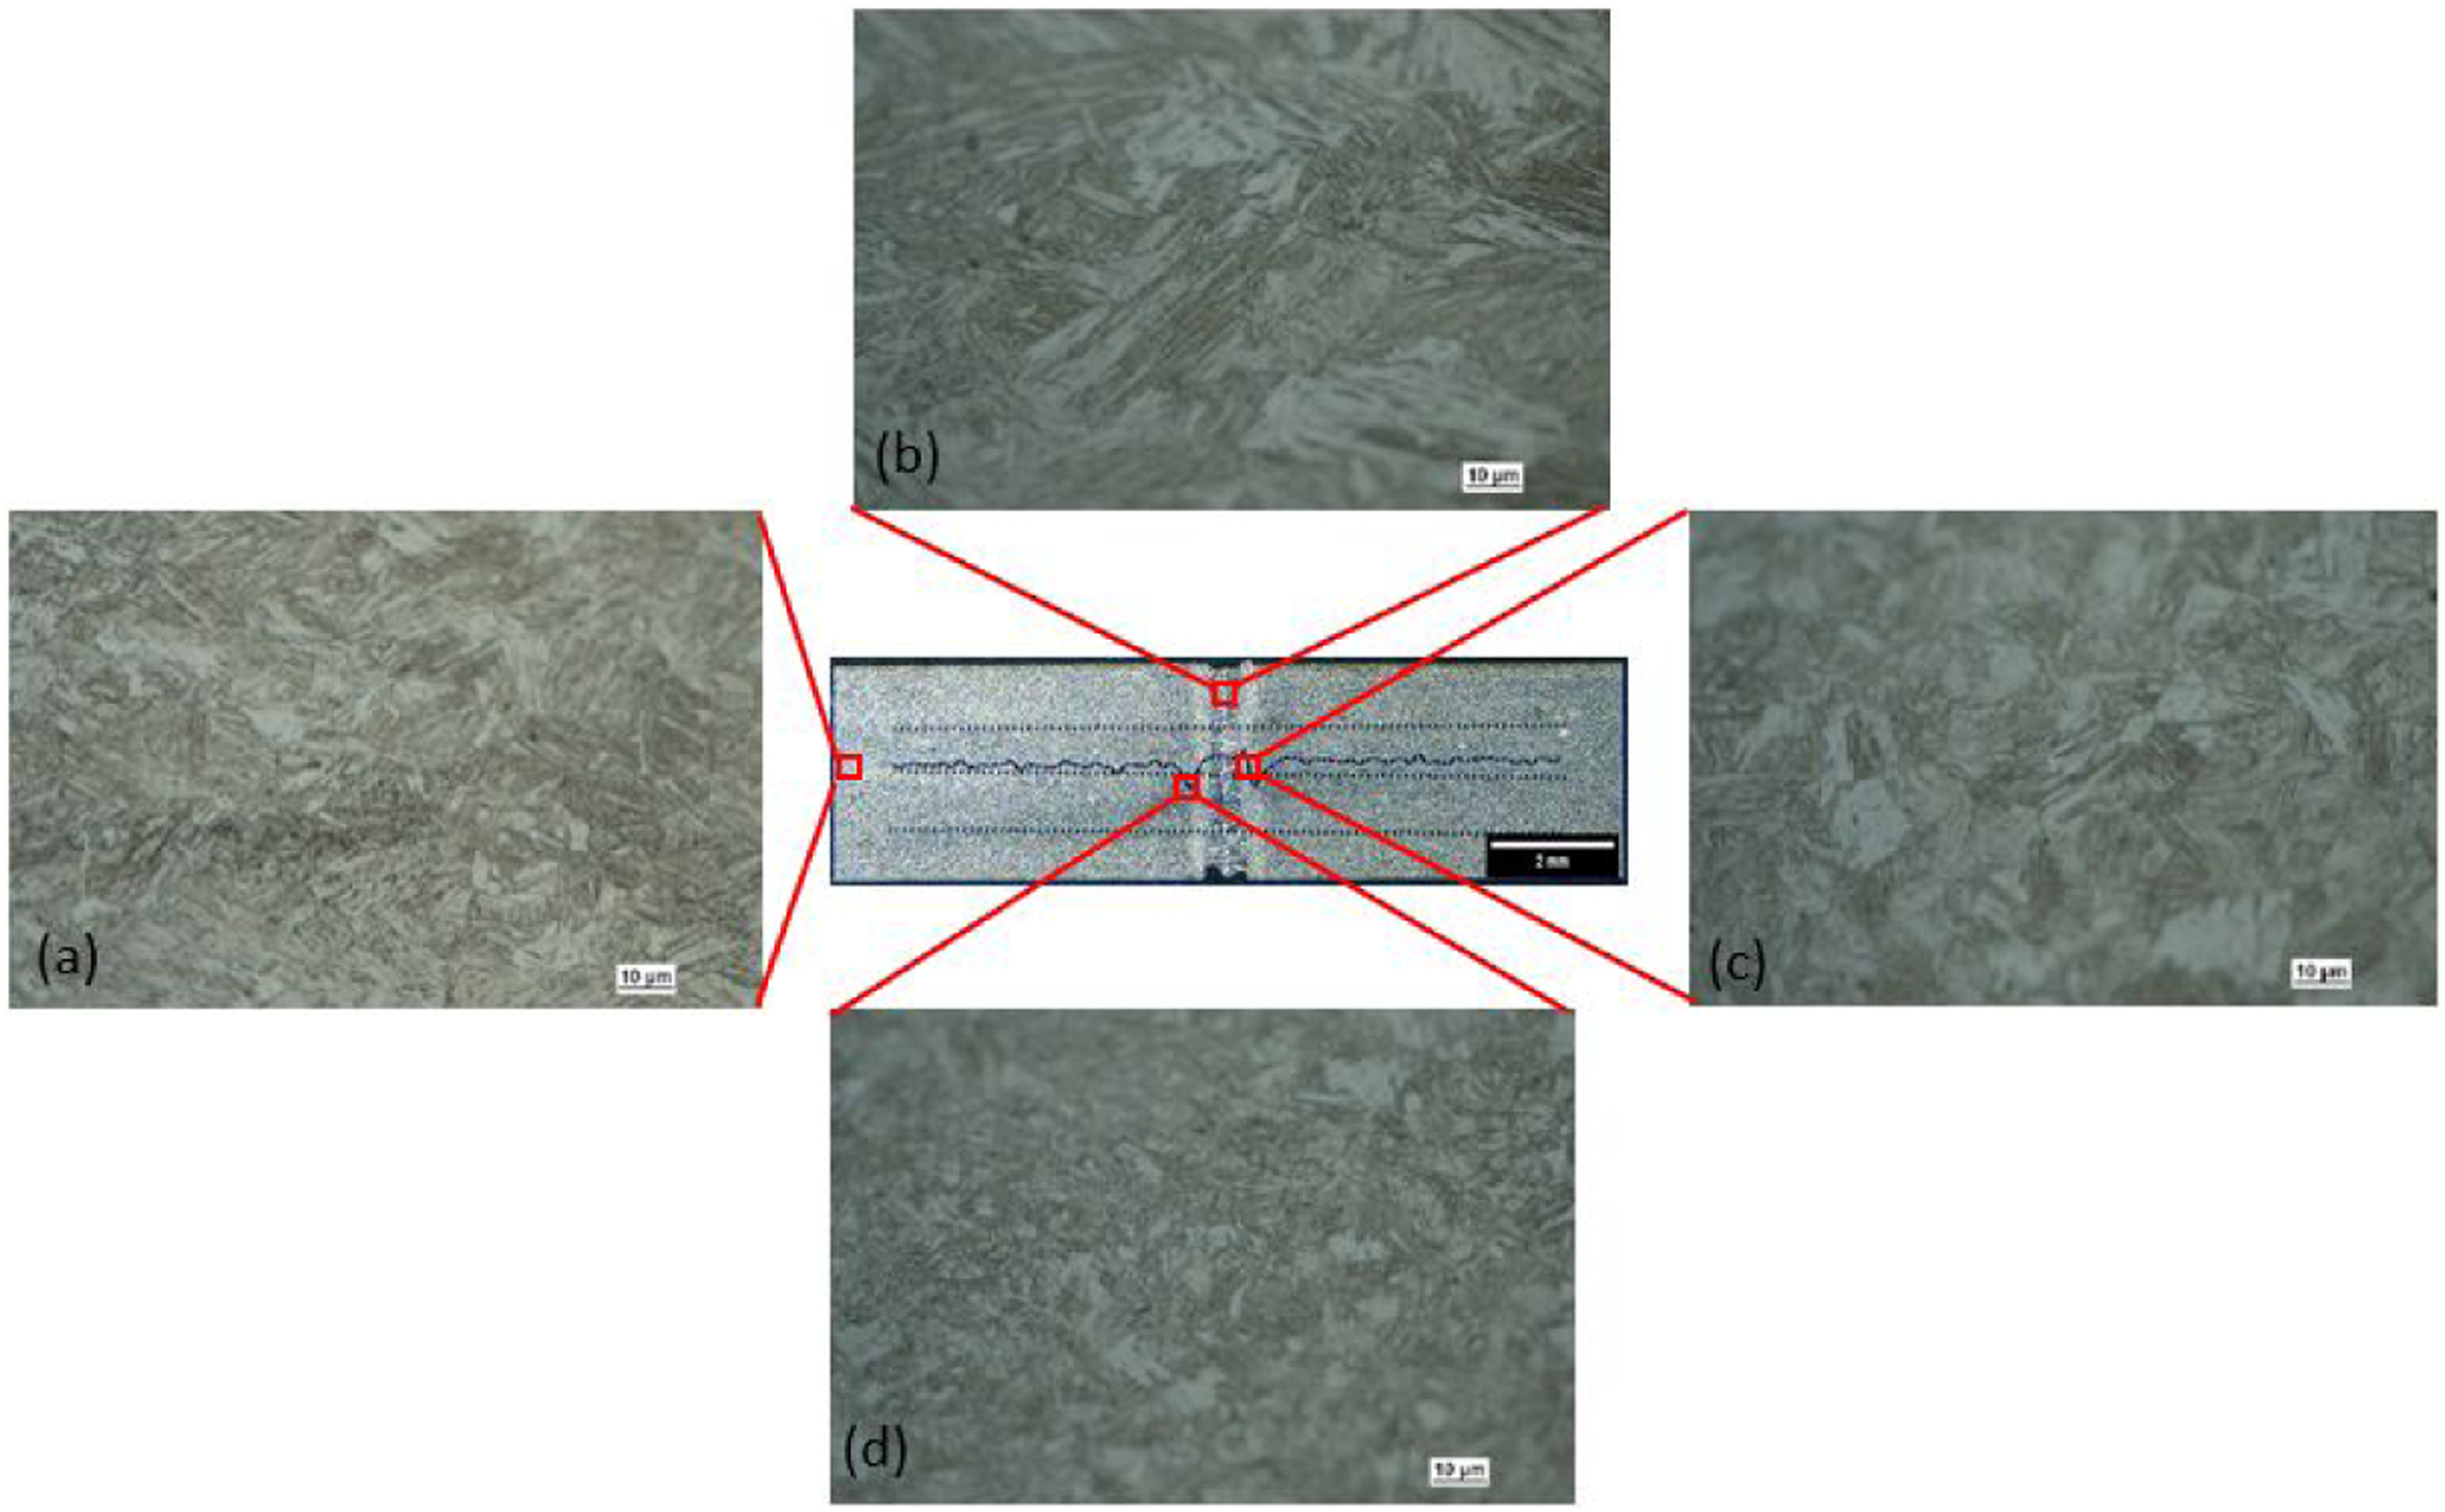
BM and WM of SG1100 (see Figure 8) have different microstructures due to different material usage. The HAZ was observed at the lowest hardness point before the hardness was increased when approaching towards the WM. The microstructure of the softened HAZ was very similar to its WM except coarser. The BM of SG1100 shows a mixture of bainite, islands of M/A, and small islands of retained austenite scattered along the high-angle grain boundaries. After welding, the HAZ in the GMAW is still a combination of bainite, M/A, and retained austenite. Hence, the hardness value remains rather similar to that of the BM. Micrographs of SG1100 at: (a) BM, (b) WM, (c) softened HAZ, and (d) HAZ.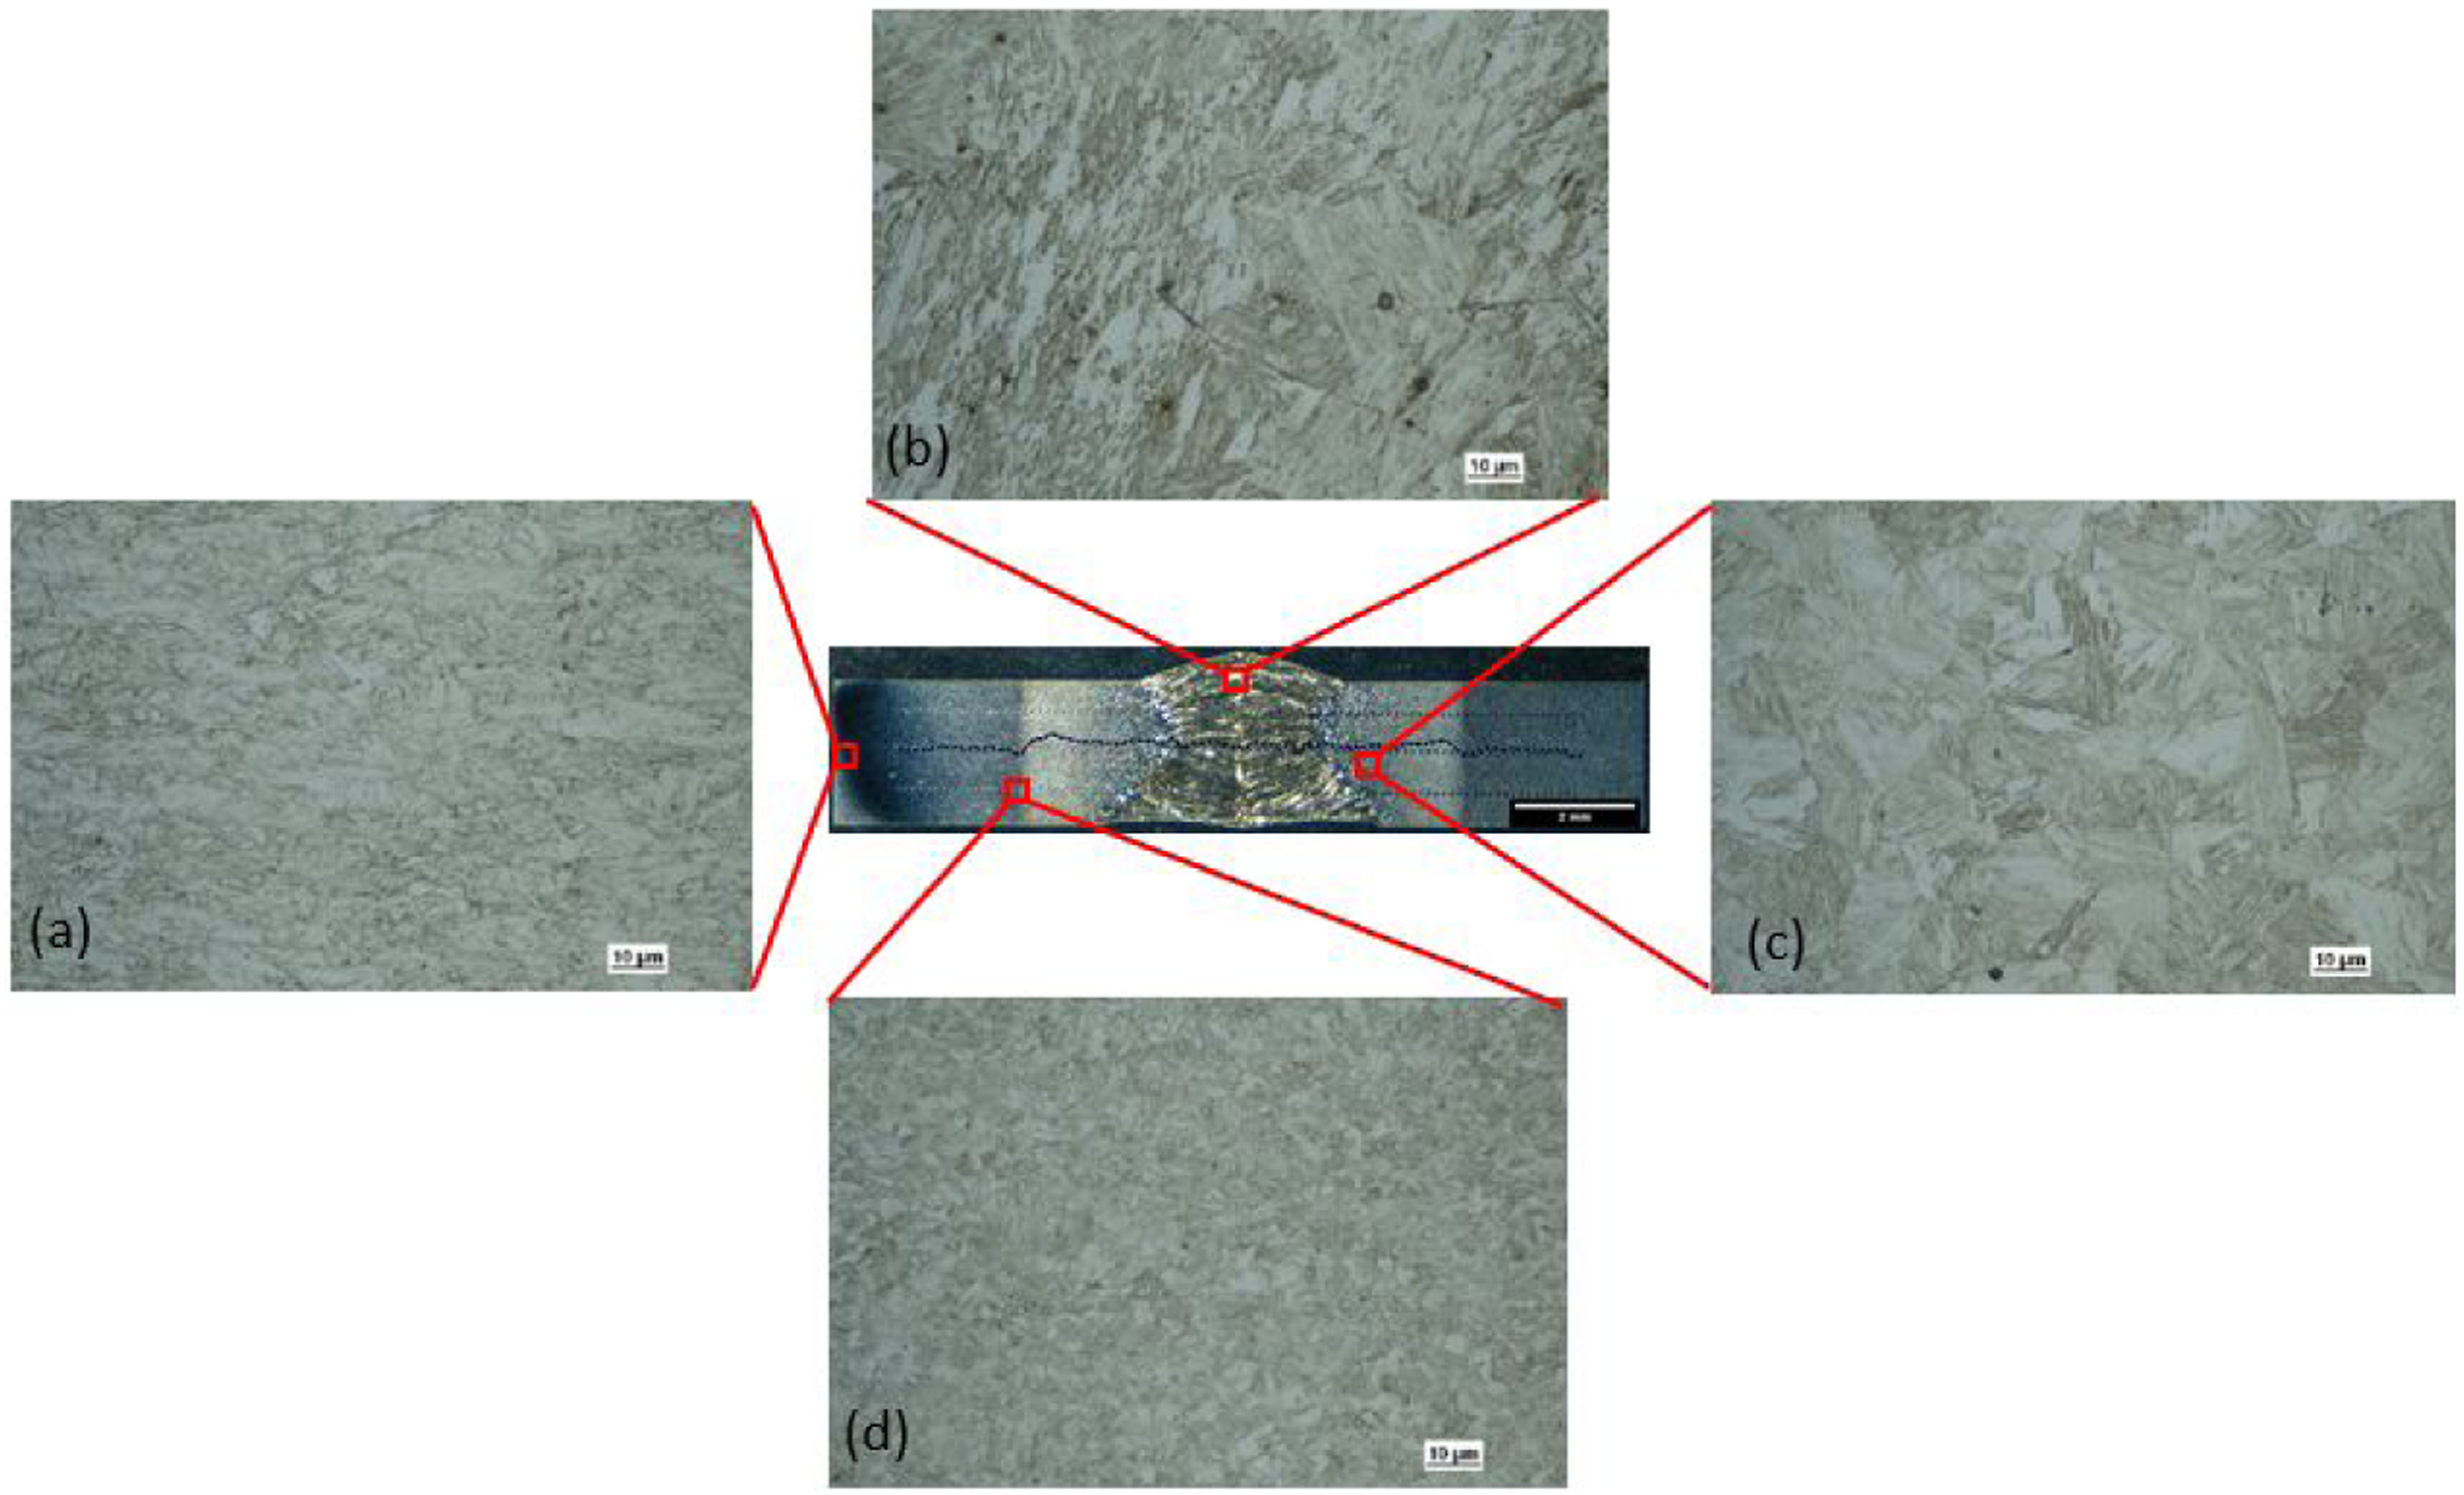
WM of SL1100 (Figure 9) having the highest hardness shows different microstructures with its BM of SL1100 although they both were made of the same parent material. The HAZ was observed with a finer microstructure. The microstructure of the softened HAZ was very similar to its WM as the HAZ width was very small unlike SG1100. The HAZ in SL1100 is still a mixture of bainite, M/A, and retained austenite, similar to the HAZ of SG1100. This reveals a microstructural stability of the weld HAZ in S1100, which leads to the least hardness drop compared to the other two studied steels. Micrographs of SL1100 at: (a) BM, (b) WM, (c) softened HAZ, and (d) HAZ.
FCGR specimens and testing procedures
FCGR Specimens
The full set of (N = 45) compact tension C(T) specimens were designed and prepared following ASTM E647 standard to determine fatigue crack growth rates of the welded ultra-high strength steel plates. Electro-discharge machining (EDM) was used to cut the hole and notch profiles of the C(T) specimens from three main different locations as shown in Figure 10. BM and WM of the C(T) specimens were produced from parent base materials and the center of the weldment, respectively. For HAZ specimens, the location of the notch of the C(T) specimens was determined from the center of the weldment based on their average HAZ sizes from the hardness test results from Section 2. Locations of FCGR test specimens fabricated from welded steel plate.
The naming convention for the C(T) sample starts with the steel grade, nominal 4 mm thickness, welding methods (G stands for GMAW and L stands for LW), notch region such as BM, WM, or HAZ and ends with fatigue crack growth rate (FCGR). The C(T) sample coupons were fabricated with dimensions 30.25 mm × 31.5 mm to provide a nominal C(T) specimen width of W = 25 which is the suggested minimum width as per ASTM E647 standard. The nominal sample thickness of B = 4 mm meets the standard requirement of
FCGR testing procedures
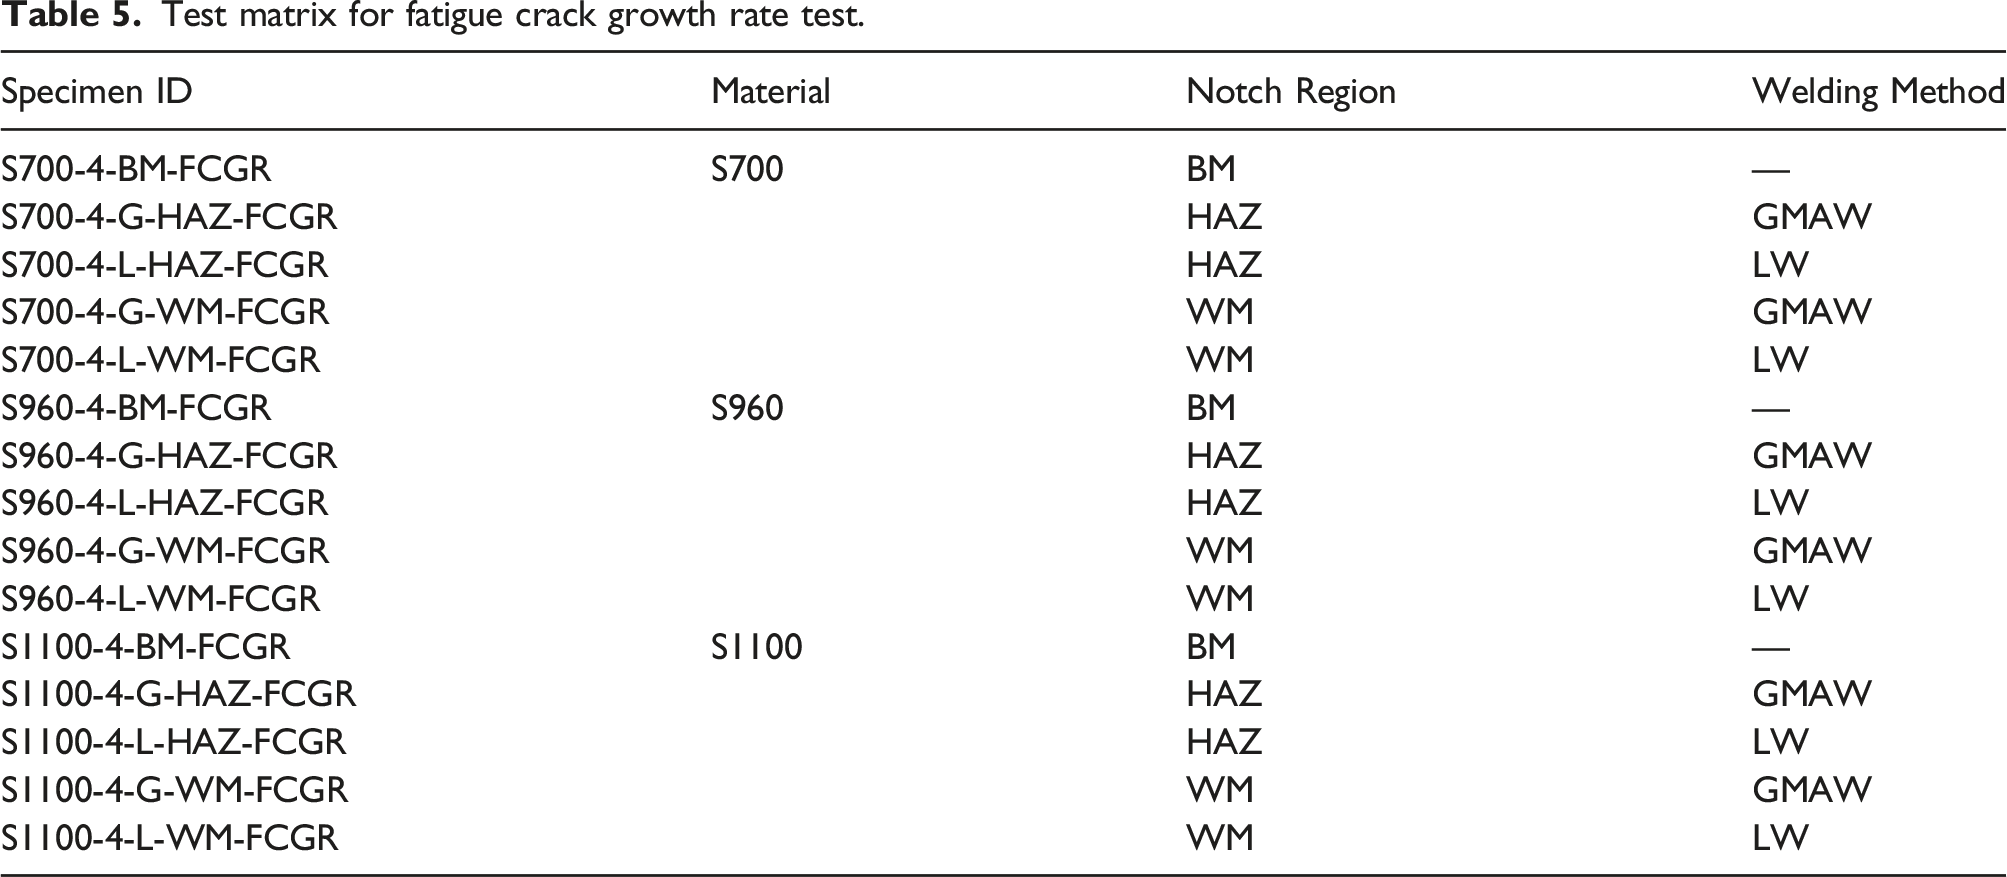
Test matrix for fatigue crack growth rate test.
The fatigue thresholds, Fracture surface of the fatigue sample showing different regions.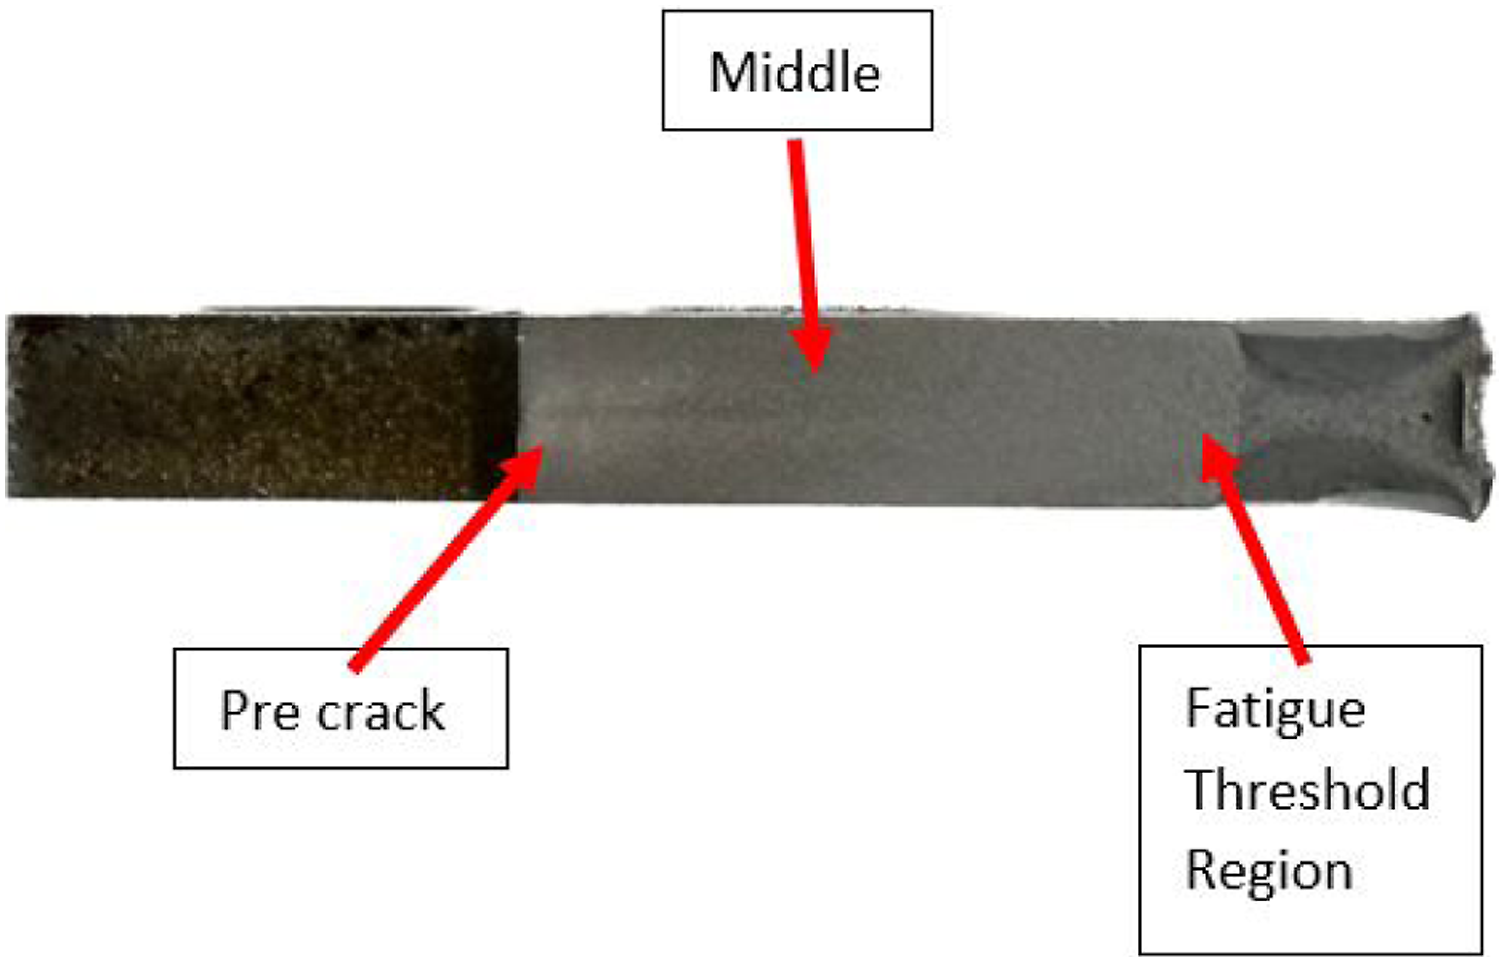
FCGR test results
Fatigue crack growth profiles
A typical crack profile from a Crack profiles using Crack angles deviations for HAZ: (a) SG700-HAZ; (b) SL700-HAZ; (c) SG960-HAZ; (d) SL960-HAZ; (e) SG1100-HAZ; (f) SL1100-HAZ.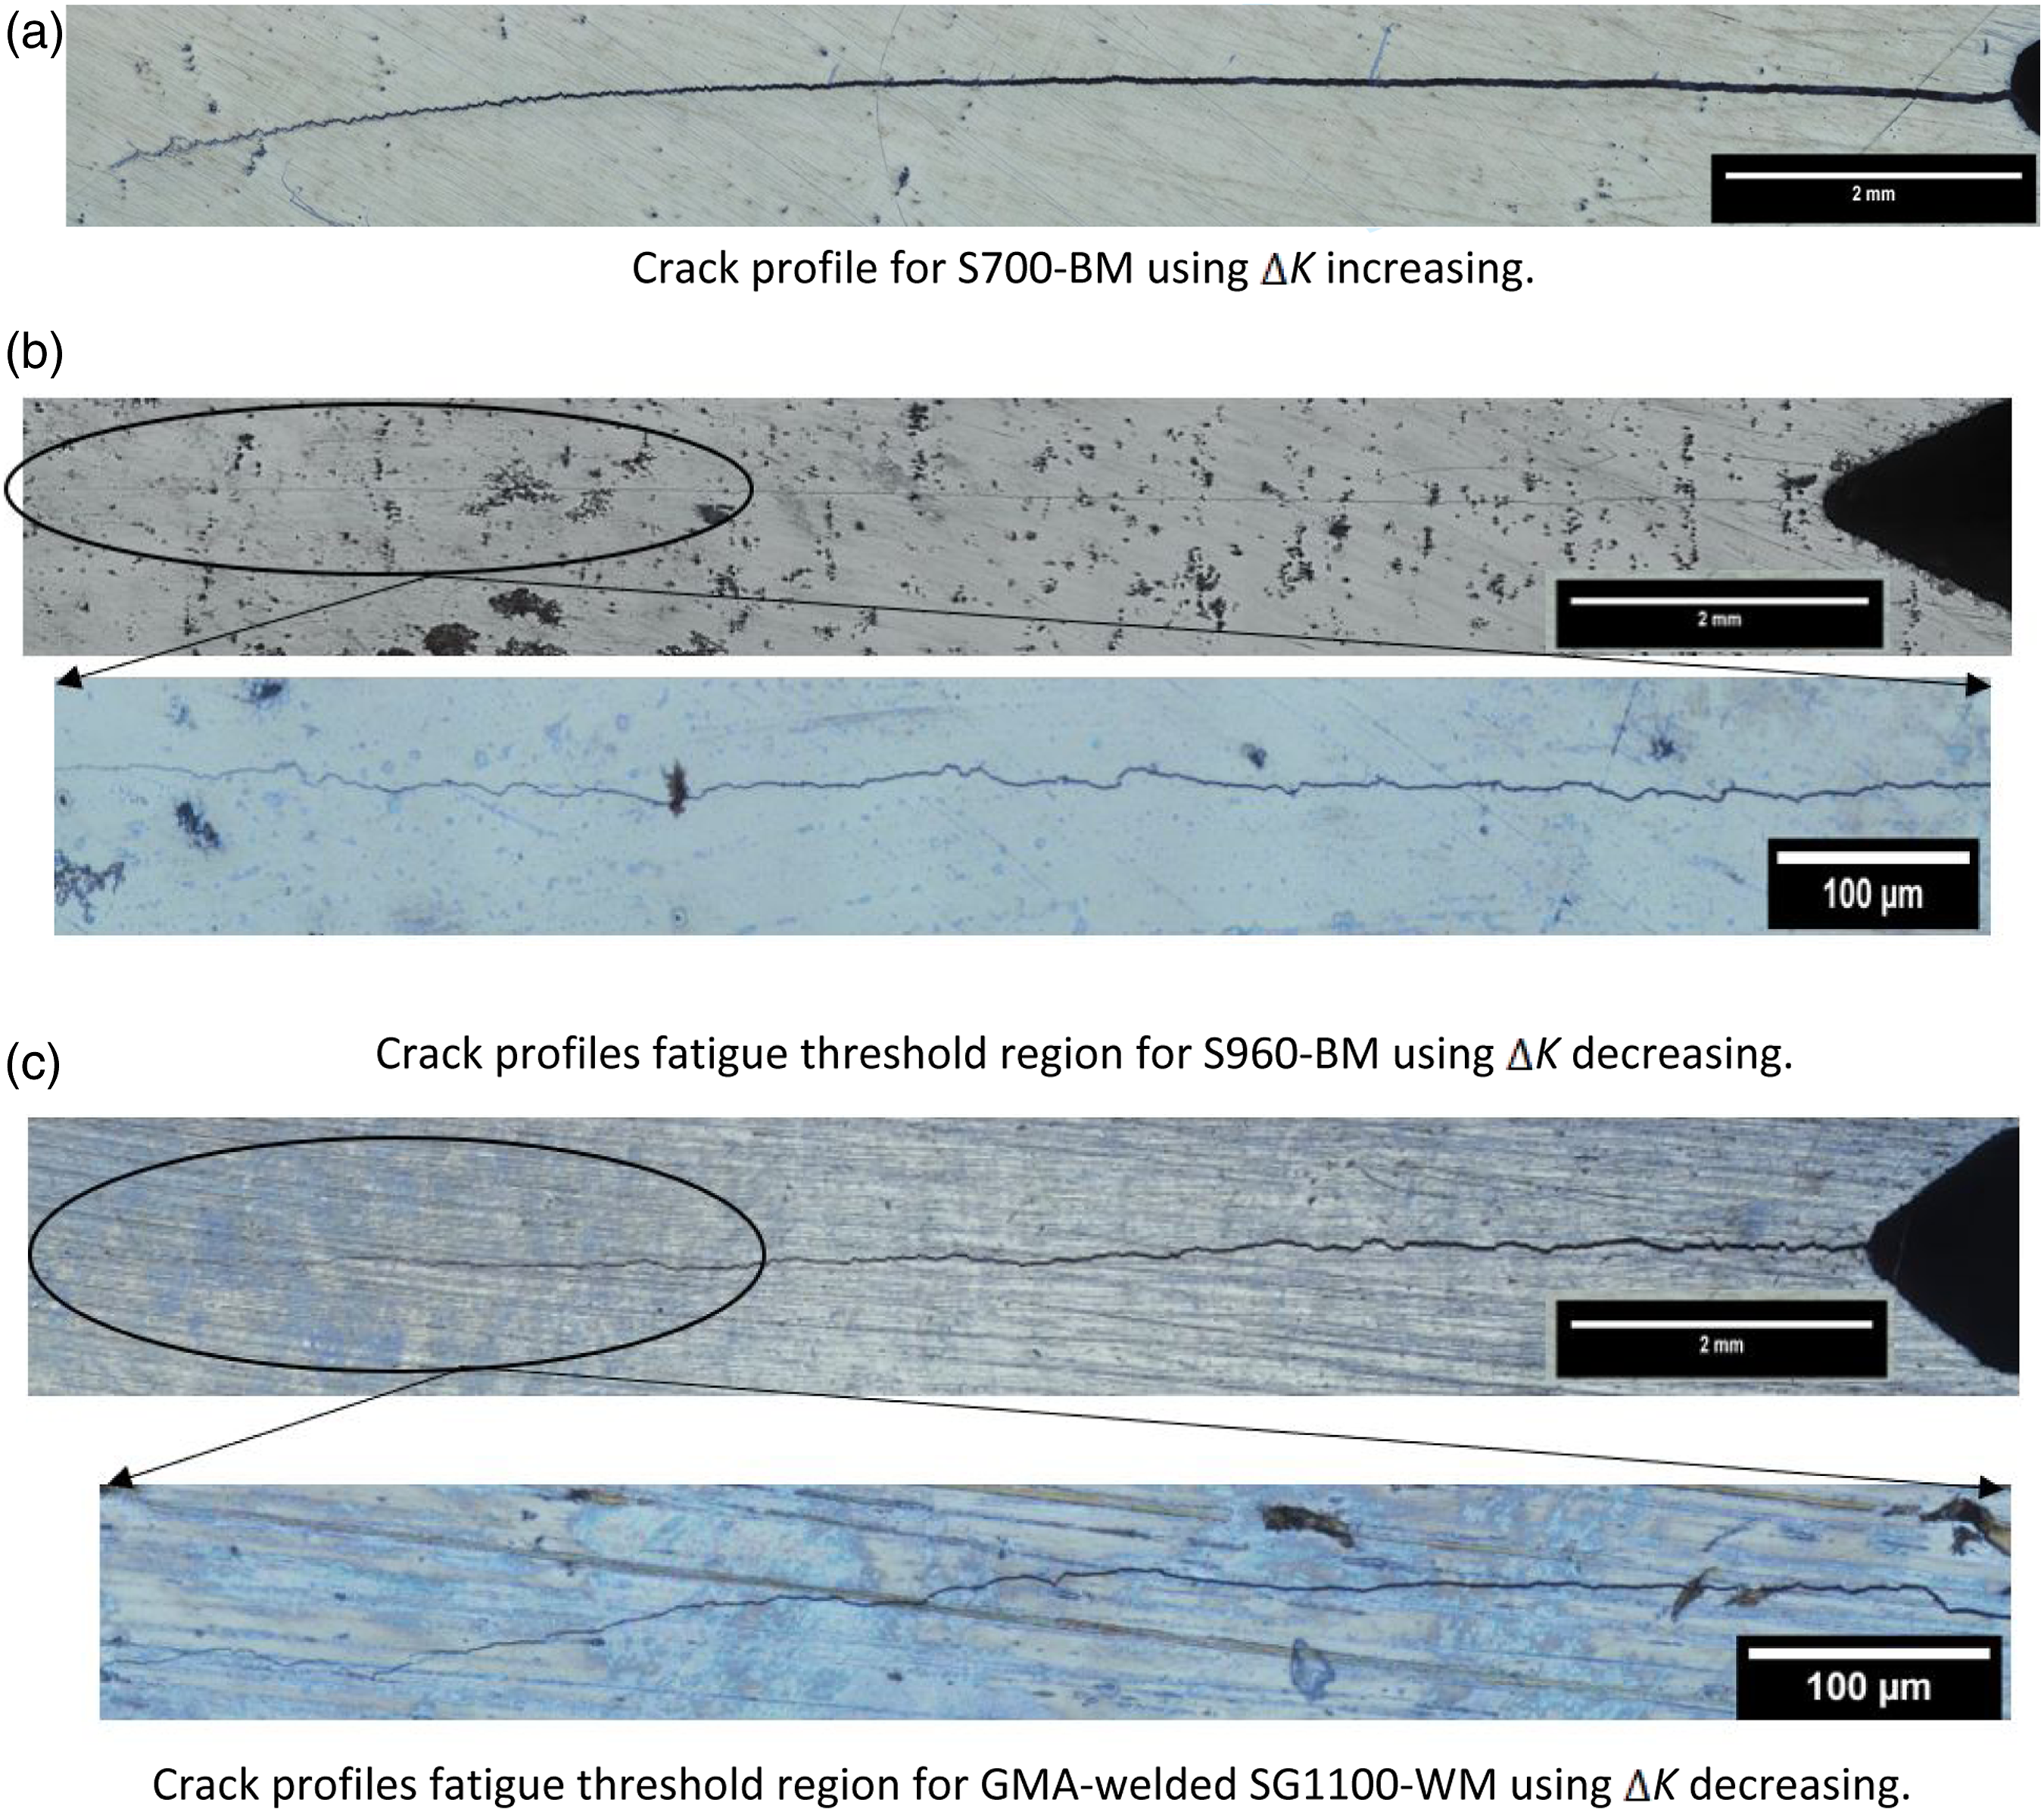
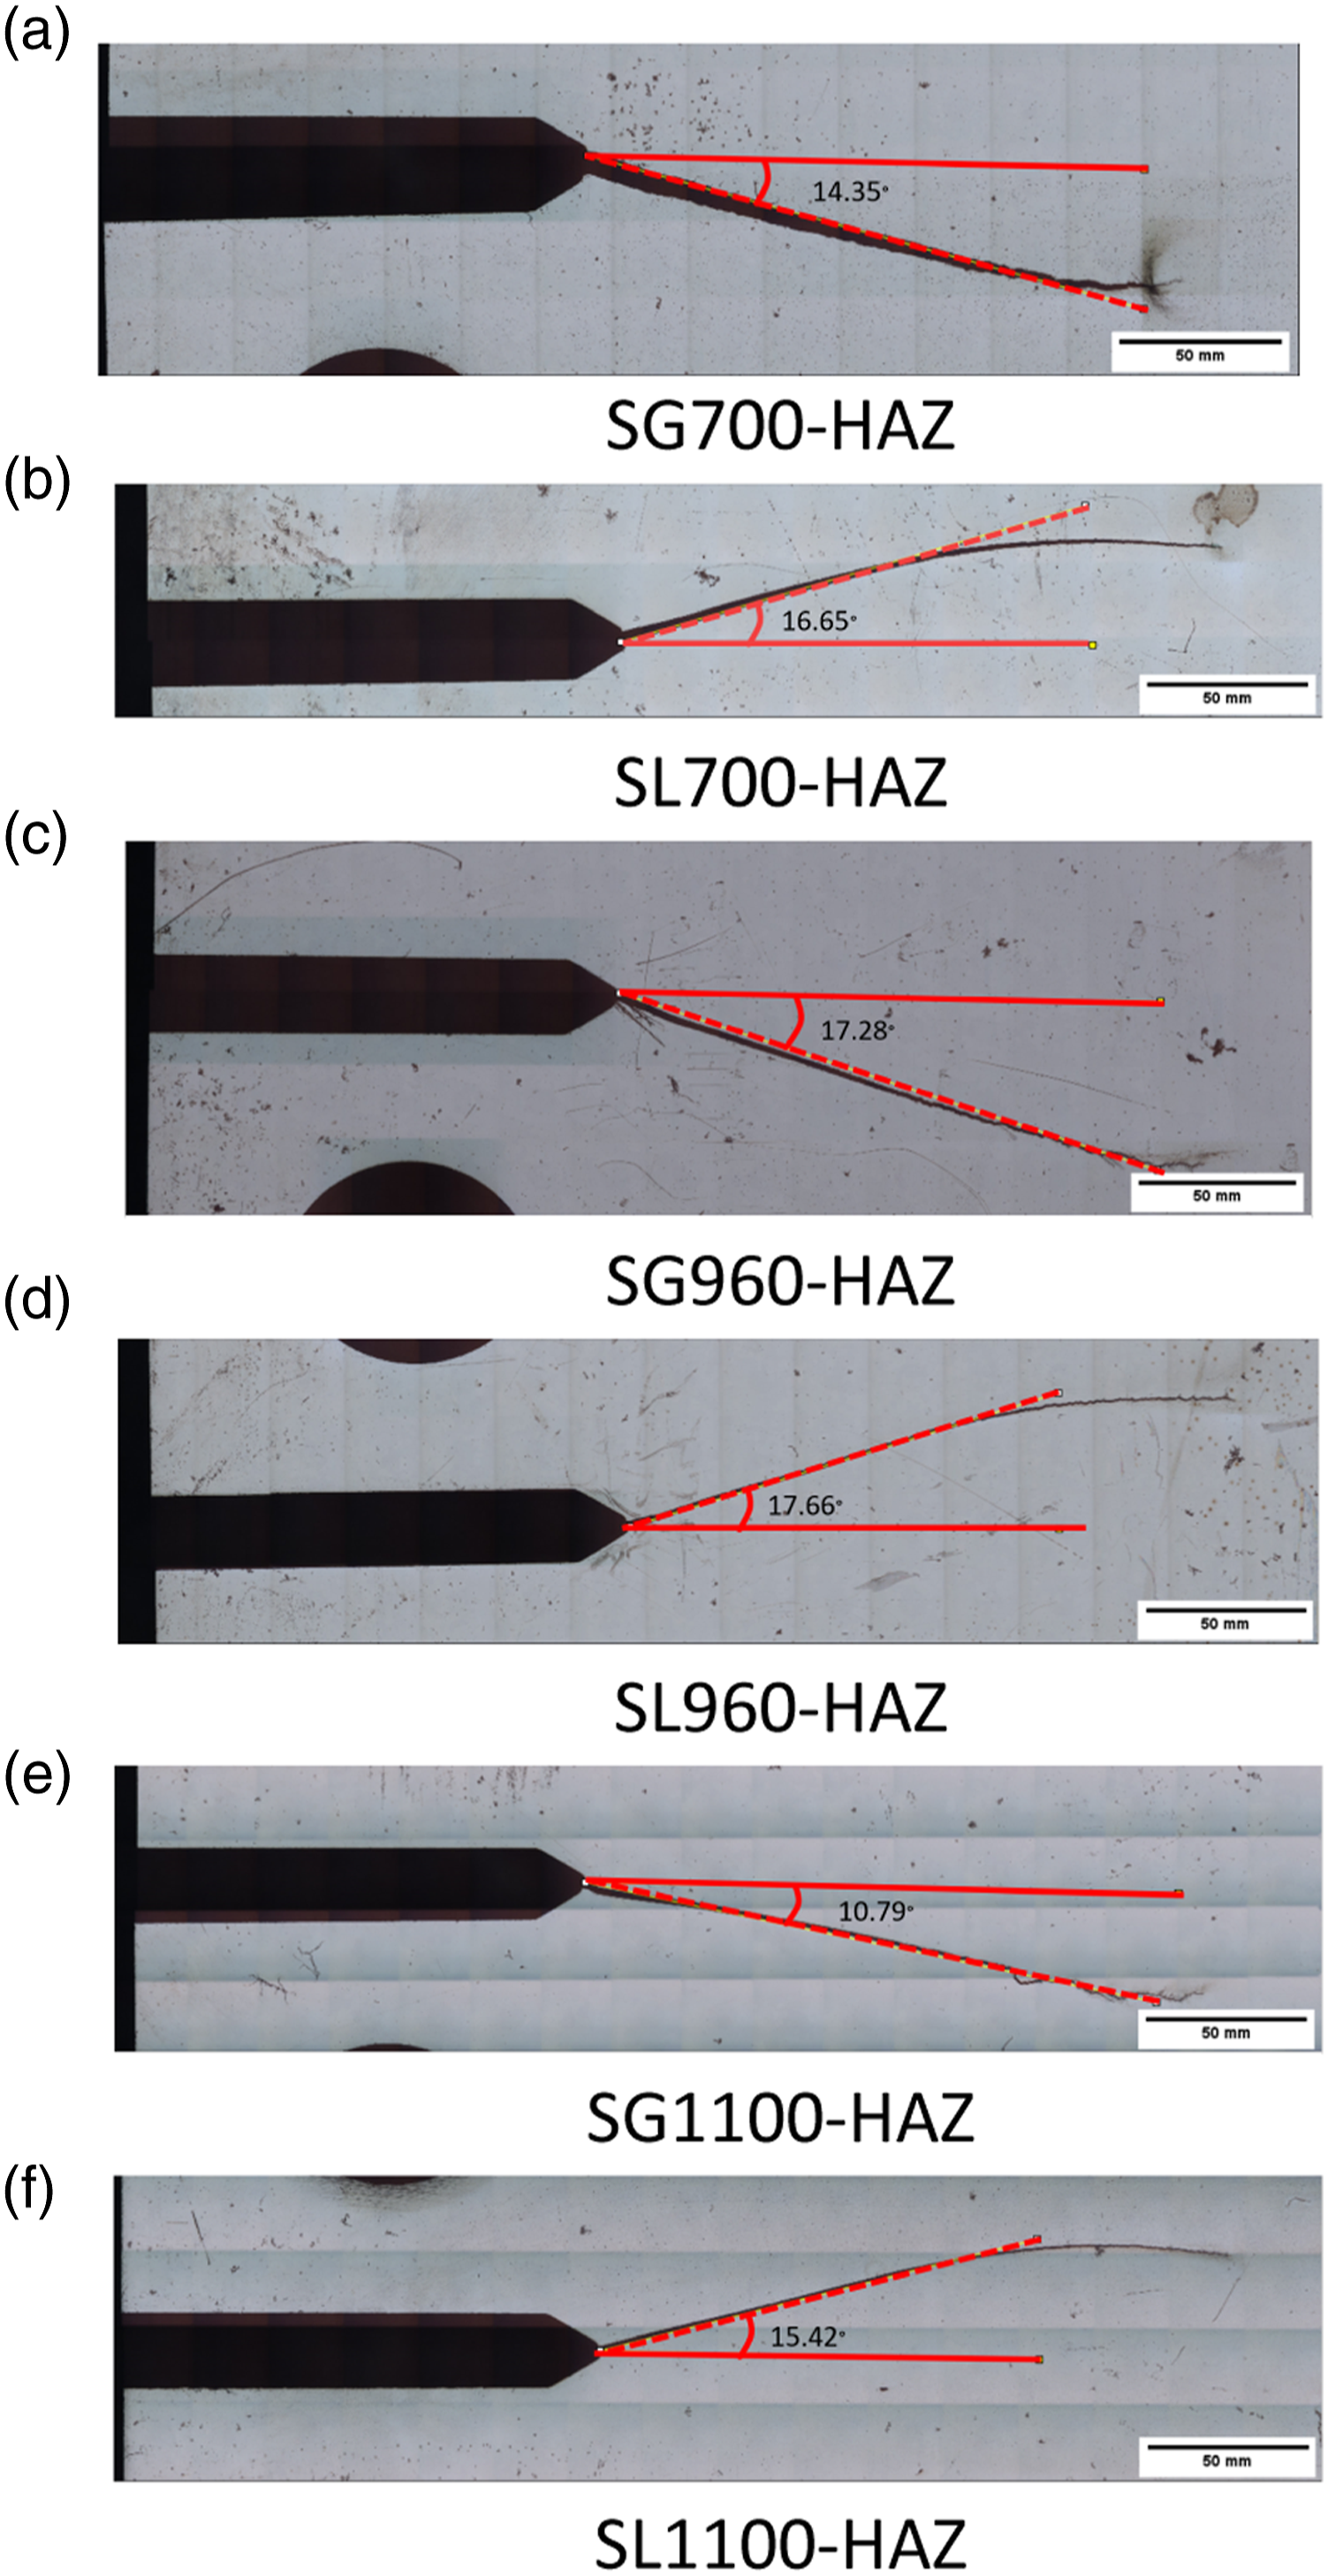
The crack angle deviations occur in all HAZ samples because of these following reasons based on existing literature. 1. Mechanical heterogeneity in the HAZ regions of the welded joints causes the effect of the asymmetric flow band and asymmetrical plastic blunting and sharpening at the crack tip that leads to the fatigue crack path deviation [Zhang et al., 2002]. 2. Crack deviation angle is also associated with biaxial residual stress, but it has more influence on mixed mode fatigue crack growth behavior than mode I behavior [Zhang et al., 2022]. 3. Fatigue crack growth rates in HAZs are reduced by constraining the size of the plastic zone at the crack tip as compared to fatigue crack growth rates in BMs. Hence, the plastic zone shape influences the fatigue crack propagation directions which are deflected towards regions of lower flow stresses of BM from the HAZ regions [Dowse and Richards, 1971]. 4. The effect of microstructure on fatigue crack growth rates is also significant since micro-cracks went through different microstructures and grain boundaries before the final fracture. The hard martensite microstructure restrains the plastic zone size and causes a tortuous crack path, thereby retarding fatigue crack propagation [Huang et al., 2022].
Fatigue crack growth rate graphs
The results of fatigue crack growth rate tests for the C(T) specimens are presented in Figure 14 where the fatigue crack growth rates, da/dN, for BM, WM, and HAZ samples were plotted as a function of the stress intensity factor range, Fatigue crack propagation rates, da/dN, versus the applied stress intensity range, 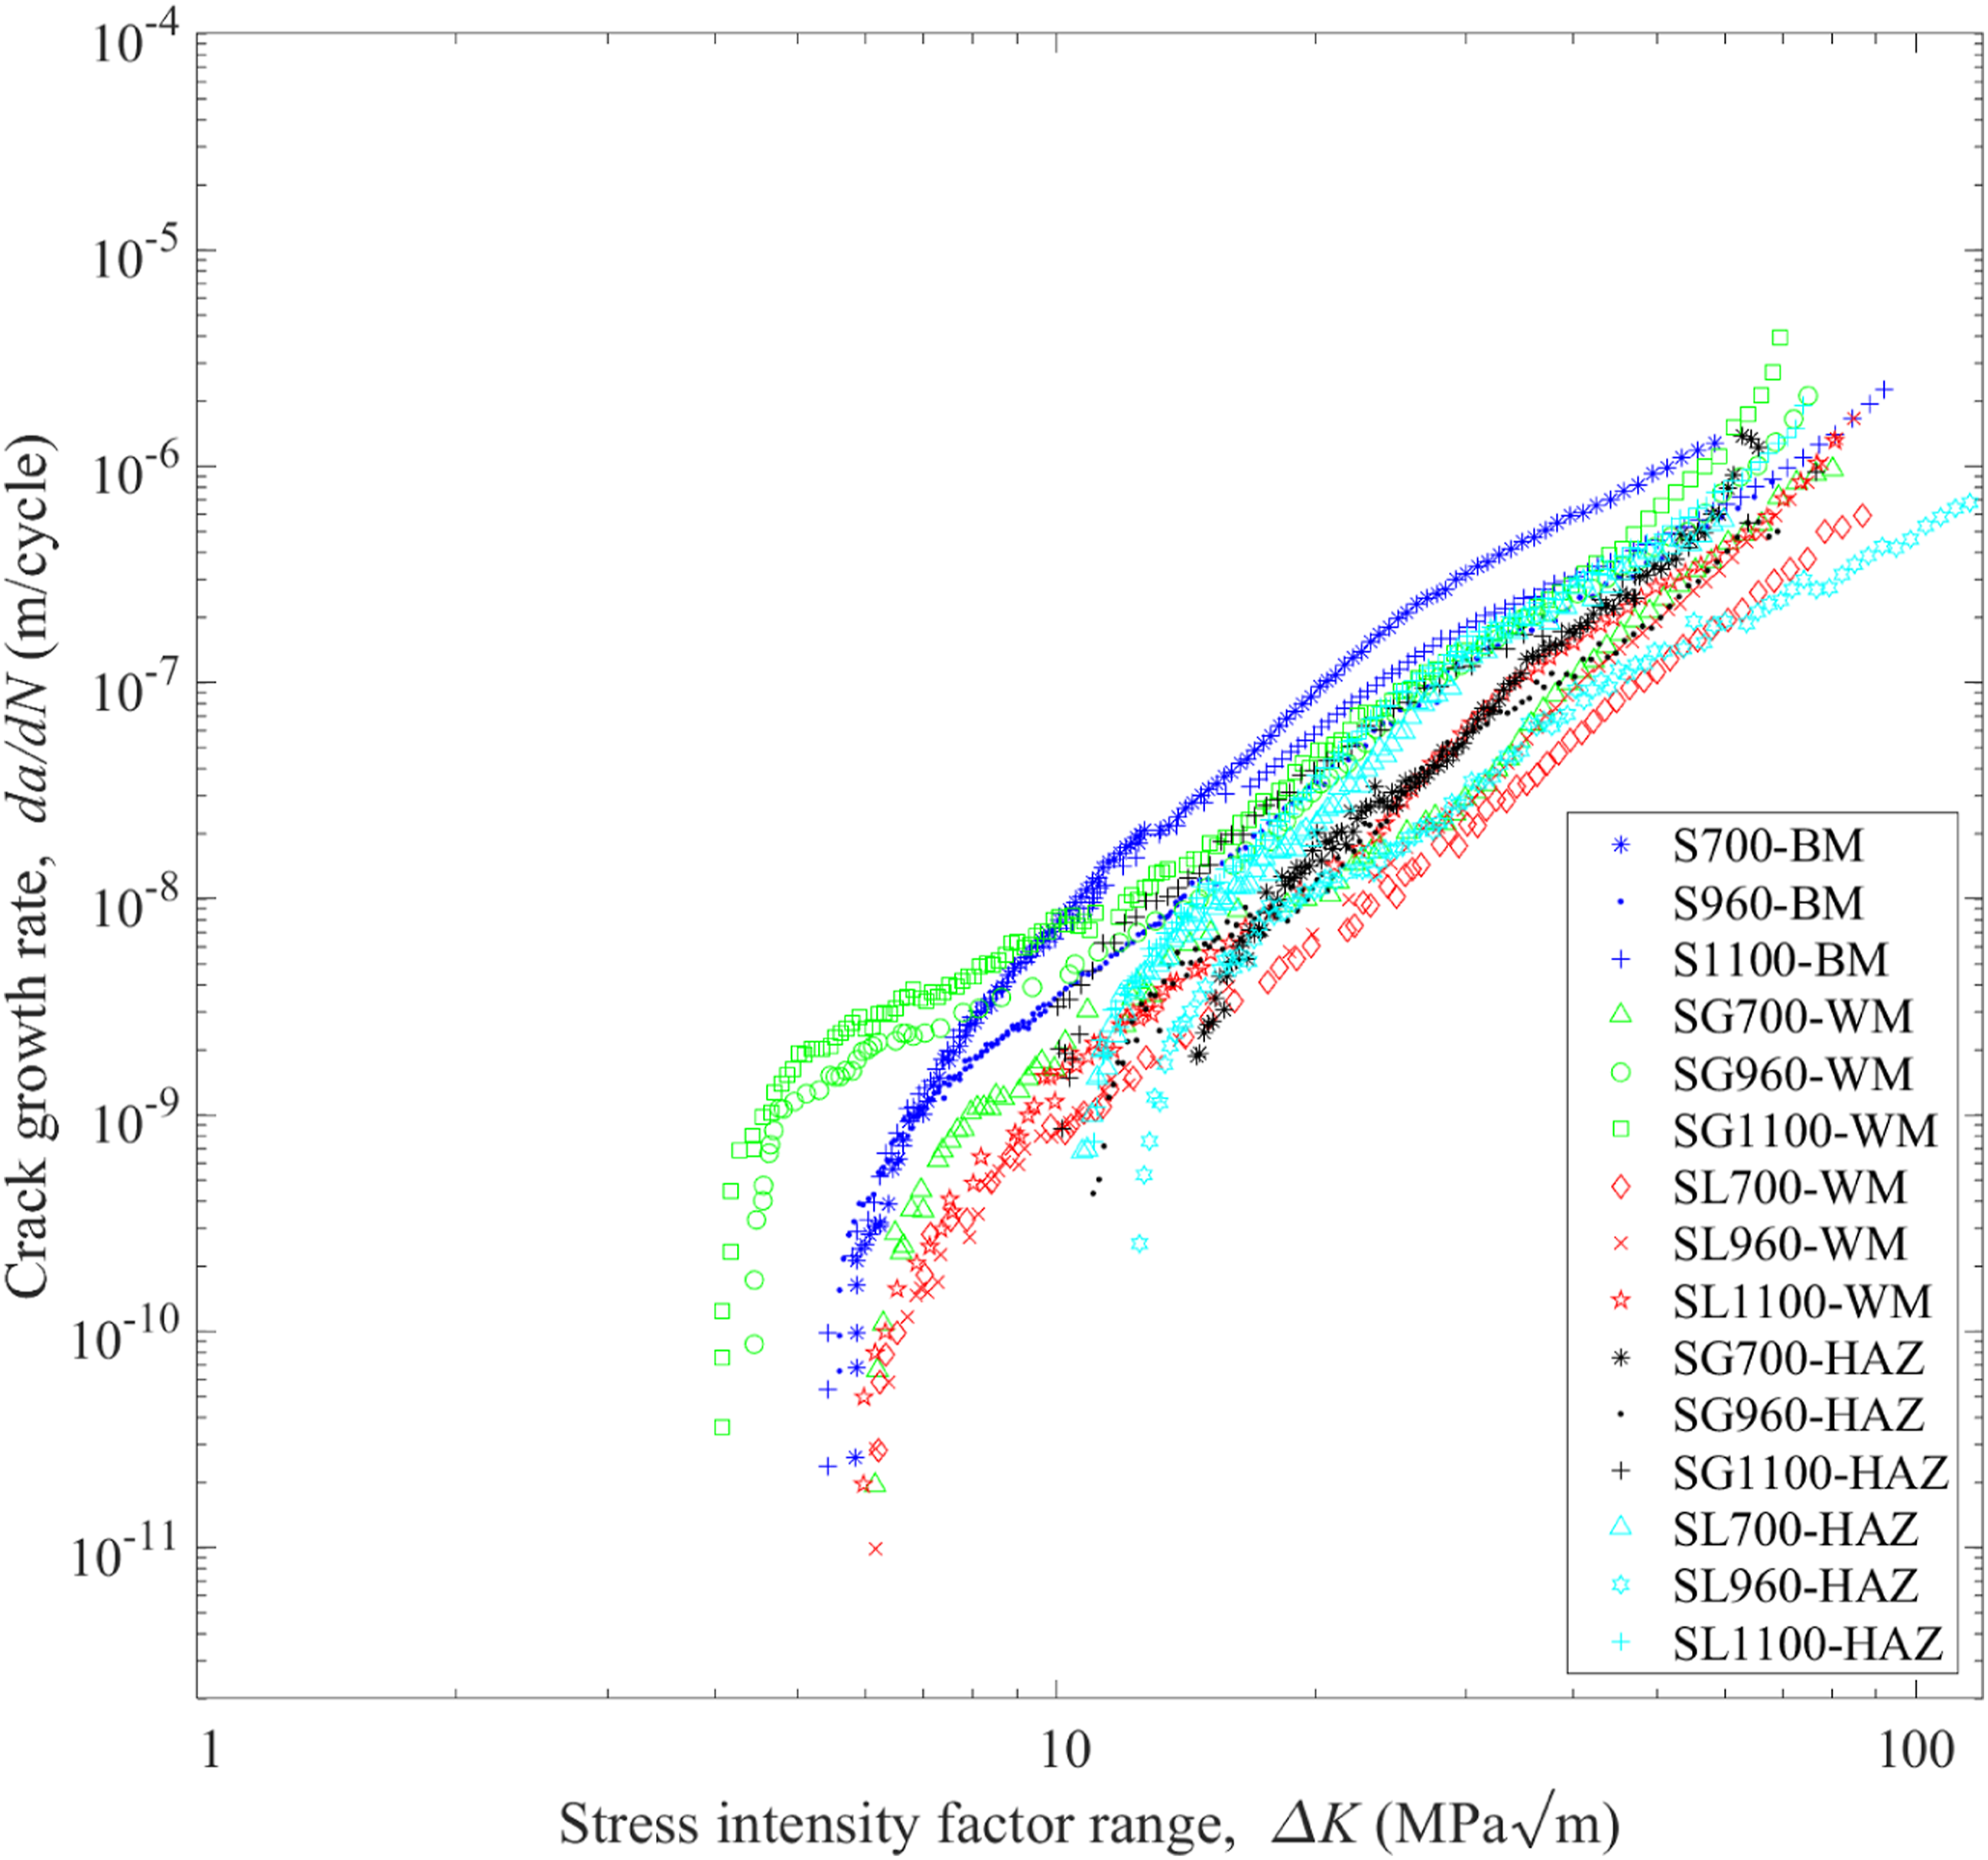
Paris’ law constants and fatigue thresholds
Paris’s law constants, C and m, and fatigue threshold,

Discussions
Comparisons among UHSS
The graphs of fatigue crack growth rate are grouped in several ways for easier comparison as shown in Figure 15. Comparison of fatigue crack growth rates: (a). Fatigue crack growth rates (FCGRs) of S700 for BM, WM, and HAZ regions; (b). FCGRs of S960 for BM, WM, and HAZ regions; (c). FCGRs of S1100 for BM, WM, and HAZ regions; (d). FCGRs of BM samples; (e). FCGRs of gas metal arc welded WM samples; (f). FCGRs of gas metal arc welded HAZ samples; (g). FCGRs of laser welded WM samples; (h). FCGRs of laser welded HAZ samples.
Figures 15 (a)–(c) compare the fatigue crack growth rates in different regions (BM, WM, and HAZ) of the same parent material. For all three steels, WM of laser welded samples displays the lowest propagation rate. For S700, BM shows the highest fatigue crack growth rate while da/dN of HAZ is between that of BM and WM. Crack growth rates of BM of S960 and WM of gas welded SG960 were found to be higher than any other regions made of S960. Both have nearly the same growth rates above
Figure 15 (d) illustrates the fatigue crack growth rates in the BM of different parent materials. It is clear that da/dN of S700 was found to be the highest despite of its slightly higher
Figures 15 (e)–(h) compare the fatigue crack growth rates in the same region (SG-WM, SG-HAZ, SL-WM, and SL-HAZ) of different parent materials. The fatigue threshold,
The crack growth behavior in both WMs of SG960 and SG1100 were nearly similar due to the use of the same filler material for creating the weldments. It can be seen from Figure 15 (f) that the crack growth rates in the HAZ material made of SG1100 were found to be higher than those of SG700-HAZ and SG960-HAZ, which were very similar. Figure 15 (g) reveals that the da/dN values of SL1100-WM were slightly higher, with those of SL700-WM being slightly lower than the SL960-WM. The crack growth behavior in the HAZ material made of SL960-HAZ shows a better fatigue performance compared to SL700-HAZ and SL1100-HAZ, as shown in Figure 15 (h). It should be notated that the same heat treatment method (Q + T) was used for S700 and S1100, whereas S960 was produced using DQ method.
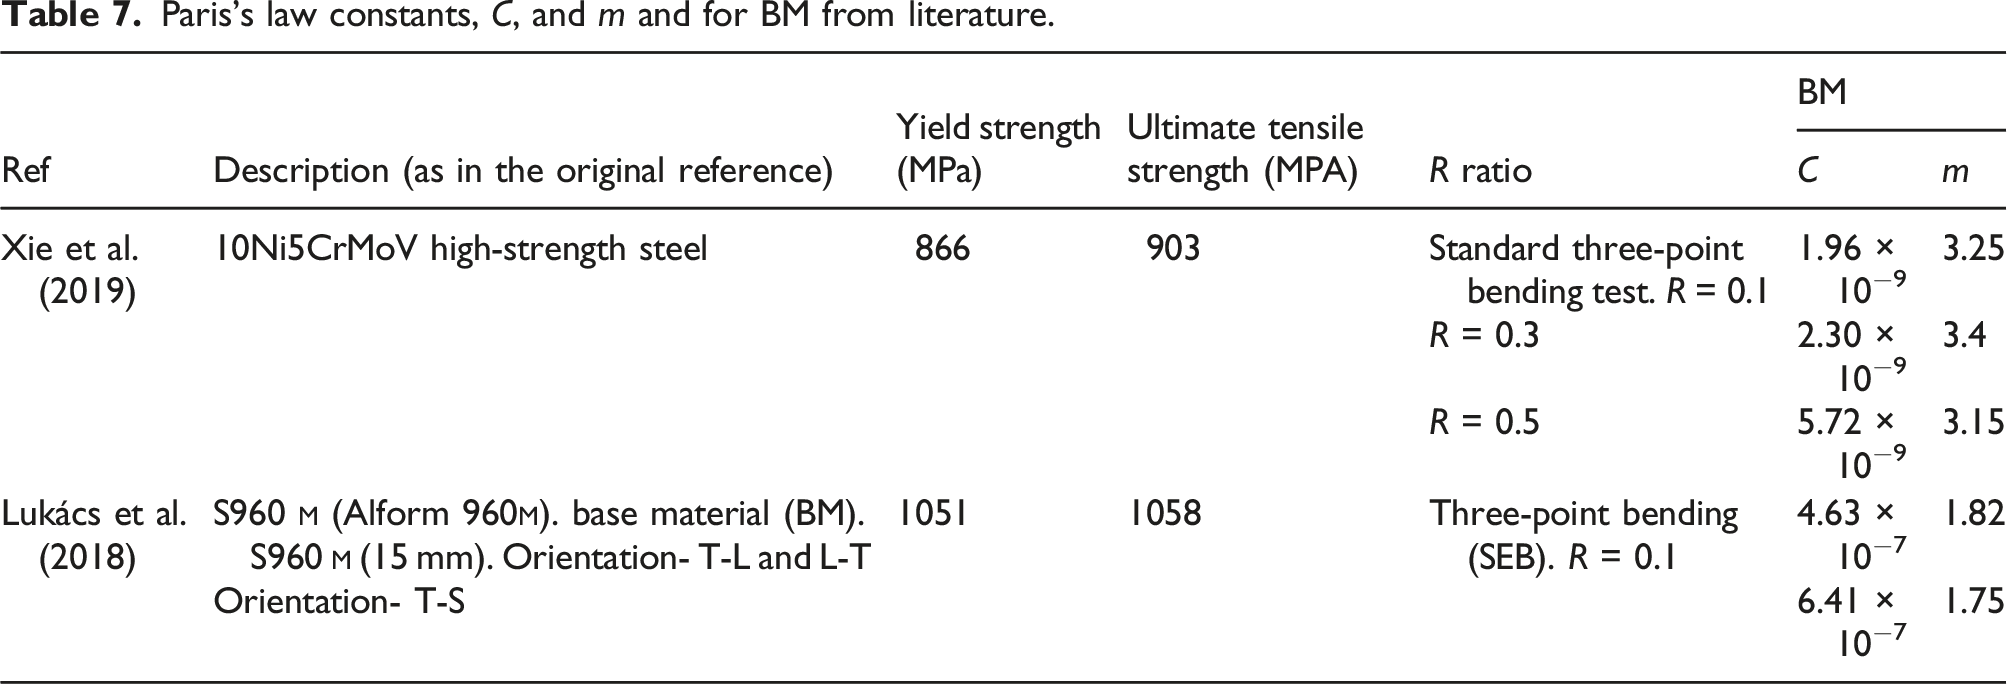
Comparisons with data in the literature
Paris’s law constants, C, and m and for BM from literature.
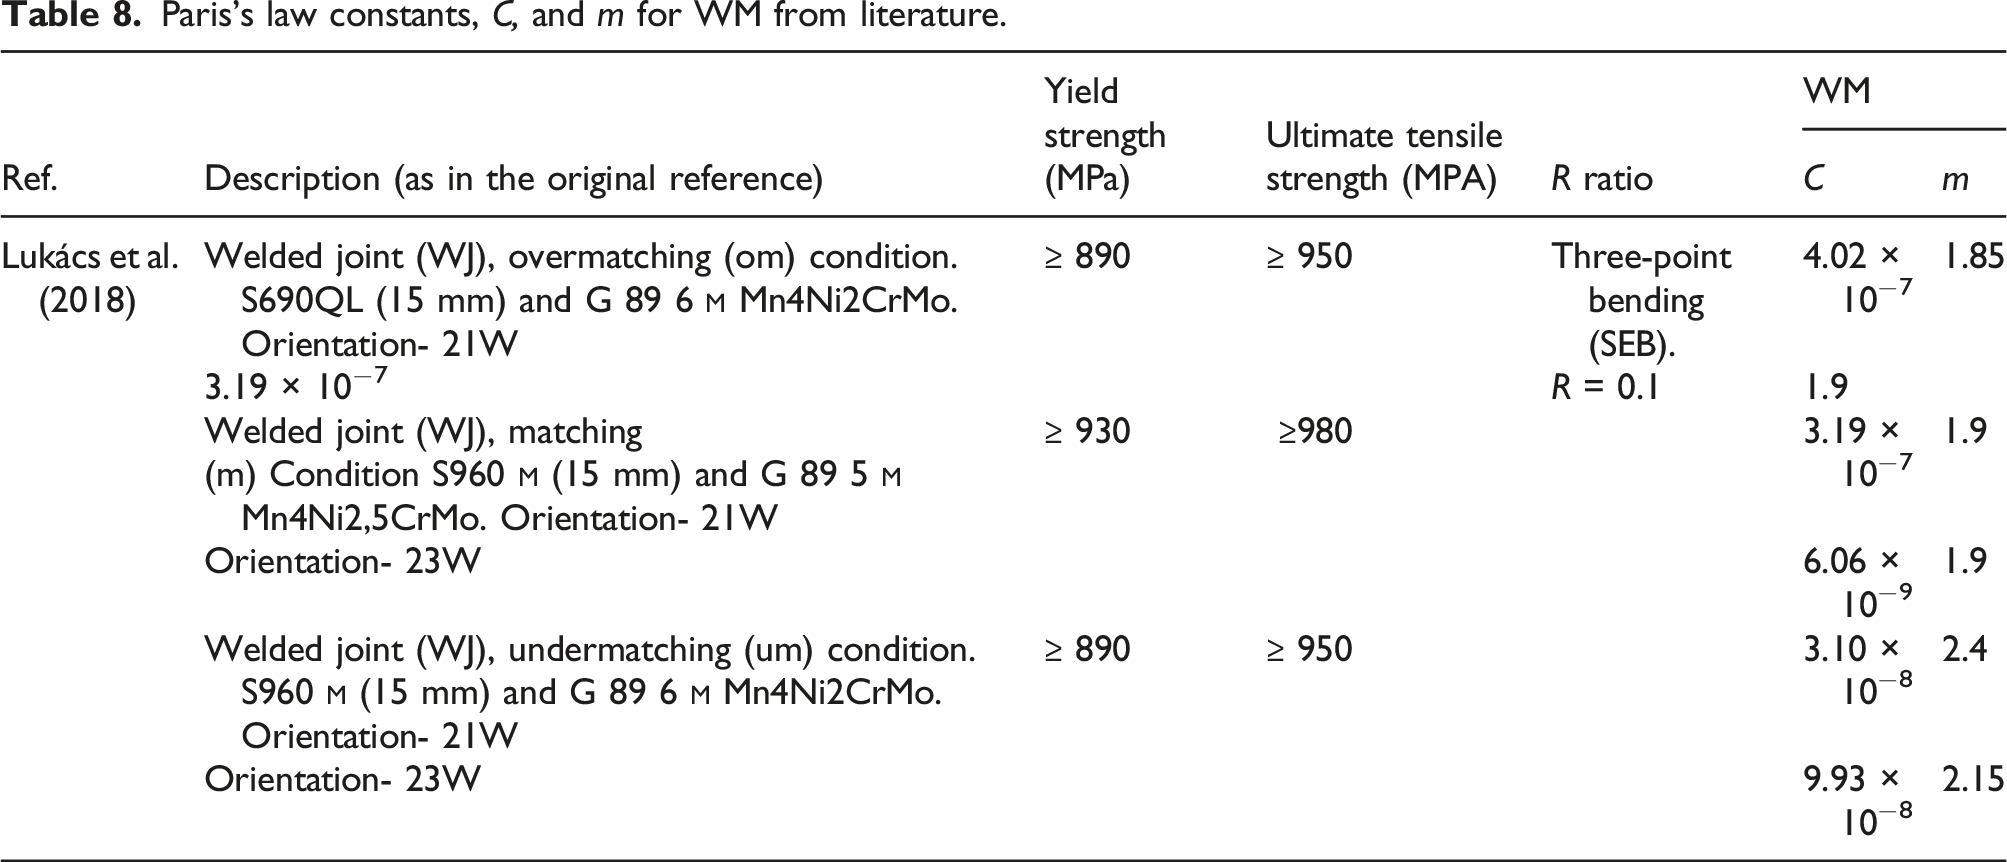
Paris’s law constants, C, and m for WM from literature.

Comparison of fatigue crack growth rate using simplified straight lines; (a) base metal; (b) weld metal.
Conclusions
The mechanical properties and fatigue crack growth rates of butt-welded ultra-high strength steel (UHSS) plates (i.e., S700, S960, and S1100) with a nominal thickness of 4 mm were experimentally investigated and compared among all the tested specimens and against the existing literature. The influence of welding methods was considered by adopting both GMAW and laser welding. Although these steels were manufactured via different methods, and had different alloying components which makes the direct comparison challenging, the focus has been on the steel grade since it is the main consideration in the design standards. Also, the adopted welding methods generate various heat inputs which is the nature of each adopted process. Using advanced steel manufacturing techniques and/or advanced welding techniques could reduce the material softening and ductility deterioration issues of the welding HAZ of ultra-high strength steels. With such considerations, the results can be summarized as follows. • The results of BMs indicated that the higher steel grades tend to show a shorter plastic hardening relative to S700 to compensate for the higher yield strength. For GMAW tensile coupon specimens, the failure location is HAZ for SG700 and SG960 resulting in lower elongation and strength compared to their BM counterparts. For LW tensile coupon specimens, a similar behavior was observed among SL700 and SL1100 like their BM counterparts because the failure location is in the BM. However, the failure location for SG960 and SL960 involved HAZ, which caused more reduction in elongation and strength. More reduction in hardness was also found in the HAZ of welded S960. • The hardness reduction in HAZ is minimal (about 4%) for S1100 steel, while the reduction is significant for S960, no matter which welding method is used. For S700 steel, the hardness reduction in HAZ is significant (about 20%) when GMAW with heat input of 0.33 KJ/mm is used, whereas the reduction is very small (less than 1.5%) when LW with heat input of 0.06 KJ/mm is used. • The fatigue crack growth resistance of S960 base material was found to be the highest amongst base materials. Since S960 was a DQ steel and S700 and S1100 were Q&T steels, a fair comparison in regard to their fatigue performance cannot be made under the same heat treatment method. Considering only the Q&T steels, S1100 has a higher fatigue crack growth resistance than S700. • The crack growth behavior in both WMs of SG960 and SG1100 were nearly similar due to the use of the same filler material for creating the weldments. The crack growth rates in the HAZ material made of SG1100 were found to be higher than those of SG700-HAZ and SG960-HAZ, which were very similar. • Although no filler material was used for laser welding, the fatigue crack growth rate of SL1100-WM was slightly higher than SL960-WM, with that of SL700-WM being the lowest. The crack growth behavior in the HAZ material made of SL960-HAZ shows a better fatigue performance compared to SL700-HAZ and SL1100-HAZ. • For all three steels, WM of laser welded samples displays the lowest propagation rate. For S700, BM shows the highest fatigue crack growth rate while da/dN of HAZ is between that of BM and WM. For S1100, apart from SL-WM, all the curves are close to each other in the range of 10–50 MPa√m. Laser welding was found to be more effective for maintaining higher fatigue thresholds than GMAW regardless of the parent material strength. • The fatigue crack propagation rate of S960 is found to be much less than those of two UHSS in the literature for both BM and WM. This is mainly due to the lower C value for S960 steel. Among the data for BM in Xie et al. (2019), the higher the R value, the higher the da/dN value. The orientation of BM in Lukács et al. (2018) does not affect da/dN, whereas the matching welding achieves the lowest da/dN values.
Footnotes
Acknowledgments
The authors would like to thank SSAB Europe Co for providing steel plates for this research and appreciate the technical support of the staff members from Civil and Environmental Engineering Laboratory, Mechanical and Manufacturing Engineering Laboratory, Material Science and Engineering Laboratory at UNSW, Sydney, Laboratory of Steel Structures, Laboratory of Welding Technology, and Laboratory of Laser Processing at LUT, Finland.
Declaration of conflicting interests
The author(s) declared no potential conflicts of interest with respect to the research, authorship, and/or publication of this article.
Funding
The author(s) received no financial support for the research, authorship, and/or publication of this article.