
Abstract
Although the interface performance of prefabricated NC and post-cast UHPC (abbreviated as NC-UHPC) has been well investigated, only few studies focus on the interface performance of prefabricated UHPC and post-NC (abbreviated as UHPC-NC). The UHPC-NC interface appears when UHPC was prefabricated offsite and transported to the construction site as a permanent formwork to cast composite members. The present study conducts Z-shaped direct shear tests on the UHPC-NC specimens to investigate their interfacial shear resistance. The main interface treatments include smooth, chiseling, grooving, planting rebars, and combined grooving and planting rebars, among which the latter is a relatively new interfacial treatment for the UHPC-NC interface. Three typical failure modes, namely, pure interface failure, combined interface and NC shear failure, and NC splitting failure are identified from the test results. The interface roughness dominates the interfacial cracking load. The planted rebars significantly improve nominal shear resistance and ductility and show synergistic effect with grooving when the rebars are in the grooves. In accordance with failure mechanisms and existing codes, comprehensive modified calculation formulas for nominal shear resistance of the UHPC-NC interfaces are proposed, and the calculation results agree with test results well with relative errors less than 10%.
Keywords
Introduction
Ultra-high performance concrete is a kind of fiber-reinforced cementitious composite with ultra-high strength (cracking strength more than 10 MPa, and high toughness (Bajaber and Hakeem, 2021; Xue et al., 2020). UHPC possesses extremely high cracking strength and high ductility as a result of its multi-element cracking performance, tensile strain hardening, and high energy consumption properties. (Naaman and Reinhardt, 2006; Park et al., 2012). For instance, crack width of UHPC is within 100 μm when ultimate tensile strain exceeds 3% (Li et al., 2009). In addition, low permeability and high durability of UHPC are associated with low fineness, high density. The hydration products on the surfaces of micro-cracks are able to glue the micro-cracks, leading to a superior self-healing ability for cracks (Beglarigale et al., 2021). Generally, the mechanical properties, and long-term durability of UHPC are significantly greater than NC.
The coastal and island bridges, especially those in splash zones, often suffer from complex ambient actions such as wave and Chloride ion erosion. The durability and safety are significantly influenced by concrete cracking and steel corrosion due to excessive wave and Chloride ion erosion (Cramer et al., 2002; Vu and Stewart, 2000). Hence, the UHPC-NC composite structure (Aaleti and Sritharan, 2019; Oesterlee et al., 2005) is proposed to improve the crack resistance and durability of coastal and island bridges based on the excellent performance of UHPC. In the UHPC-NC composite structure, the tensile part is a prefabricated thin UHPC slab, and the NC part is directly cast onto the UHPC slab. This composite structure can take full advantage of the material performance of the two materials (Hussein and Amleh, 2015) and ensure the safety and durability of the bridges in the splash zone, in addition to achieving accelerating structure construction (Tong et al., 2021; Yan et al., 2020).
In the UHPC-NC composite structures, the interface performance dominates the structural performance. Currently, the majority of interface studies focuses on the mechanical properties and durability of the interface between the prefabricated NC and post-cast UHPC (called as NC-UHPC to show difference) (Harris et al., 2011; Hussein et al., 2016). The push-out tests have been conducted by Jang et al. (2017), Semendary et al. (2020), Zhang et al. (2020b, 2020c), and Mohammed et al. (Al-Osta et al., 2022) to investigate the impact of UHPC shrinkage, curing method, humidity, interface treatment, and interface stress state on the shear resistance of the NC-UHPC interface. The test results show that the NC-UHPC interface exhibits excellent shear resistance with high integrity, and the interfacial slippage is limited before the failure. The failure mode of the NC-UHPC interface is characterized by the NC breaking near the interface along with slight interfacial debonding, indicating that the bonding strength of the NC-UHPC interface is higher than the shear strength of NC. The curing age of UHPC, NC strength, surface roughness of NC substrate, interface wettability, interface compressive stress, and grooving can enhance the UHPC-NC interface. Note that cured UHPC at 90°C causes high additional stresses and reduces the interfacial bonding strength to a certain extent. Planting rebar at the interface produces more uniform stress distribution in the UHPC and NC, and the interface compressive stress also improves structural ductility. Hussein et al. (2016) utilized the Mohr-Coulomb type of failure envelope to calculate friction coefficient μ of the interface. Du et al. (2021) proposed a more accurate neural network-based explicit expression of the interfacial bonding strength of the NC-UHPC interface. Zhang et al. (2020b, 2020c) proposed a calculation equation for the nominal shear resistance of the NC-UHPC interface with modifying adhesion factor c and friction coefficient μ. The impact of UHPC shrinkage, interface treatment, interfacial rebar, and interface stress were considered. The above studies provide insights into shear performance of the NC-UHPC interface. So far, the excellent bonding performance of the NC-UHPC interface is validated experimentally and analytically, and the calculation method is relatively mature.
The excellent bonding performance of the NC-UHPC interface may be explained in two views. In the microscopic view, lower water-cement ratio of UHPC (usually 0.16–0.18) leads to tiny water secretion, few micro-cracks and pores in the transition layer, resulting in the improvement of the interfacial bonding strength. In the macroscopic view, UHPC is self-compacted and densified, containing amount of cement and ultra-fine material components, which easily fills the voids on the rough surface of the NC substrate and reduces the pores near the interface. Moreover, the UHPC hydration products even disperse into the capillaries and micro-cracks on the surface of the NC substrate, enhancing the mechanical interlocking at the NC-UHPC interface. Also, the internal steel fibers considerably increase the strength of the transition layer at the interface, further improving the interfacial bonding strength. However, the merits of the NC-UHPC interface may not exist in the UHPC-NC interface due to the different construction sequences. It can be expected that the interfacial bonding strength of the UHPC-NC interface may be reduced due to contrary construction sequence.
The bonding performance of the prefabricated UHPC-post-cast NC interface requires more research. Only Liu et al. (2020), Jiang et al. (2021), and Jing et al. (Tian et al., 2022) have studied the impacts of bubble groove diameter, groove depth, groove density, post-cast NC strength, and shear reinforcement ratio on the UHPC-NC interface failure mode, load-displacement curve, and interfacial shear strength. The results show that the failure mode is described by the NC shearing failure. Increasing NC strength and grooving UHPC substrate effectively improve interfacial shear strength. The shear reinforcement yields at the ultimate state, and when the reinforcement ratio is increased, the shear strength of the interface also rises. In addition, the above studies proposed corrected equations for the grooved substrate by multiple regression analysis based on the existing specifications. In conclusion, the mechanical properties, failure mechanisms, and calculation methods of the UHPC-NC interface undergoing different interface treatments have been investigated in few studies. However, although planting rebar and grooving at the NC-UHPC interface has been demonstrated to increase the mechanical interlocking and nominal shear resistance at the interface, these two approaches have not been investigated at the UHPC-NC interface. To further study the shear resistance of the UHPC-NC interface with different interface treatments, a series of direct shear tests were conducted to experimentally investigate the failure mode, shear strength of the UHPC-NC interface. Based on the test results and existing codes, calculation equations of the shear strength of the UHPC-NC interface with different interface treatments were proposed.
Test setup
Materials
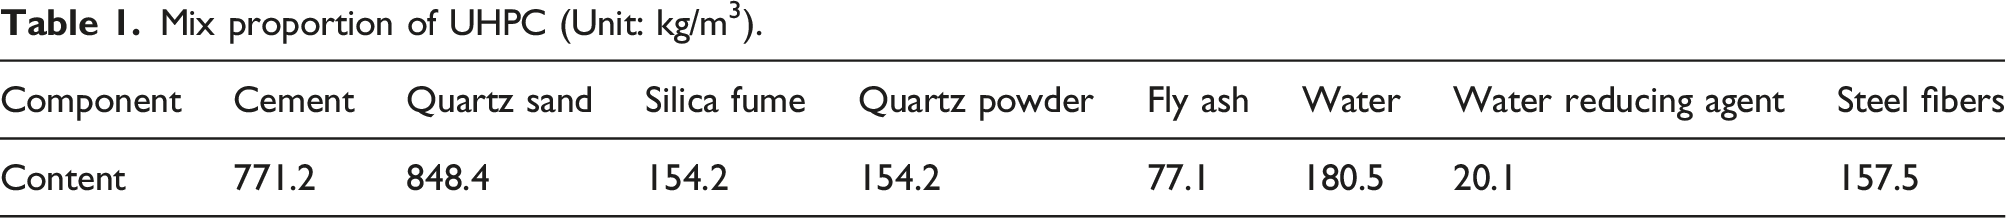
Mix proportion of UHPC (Unit: kg/m3).
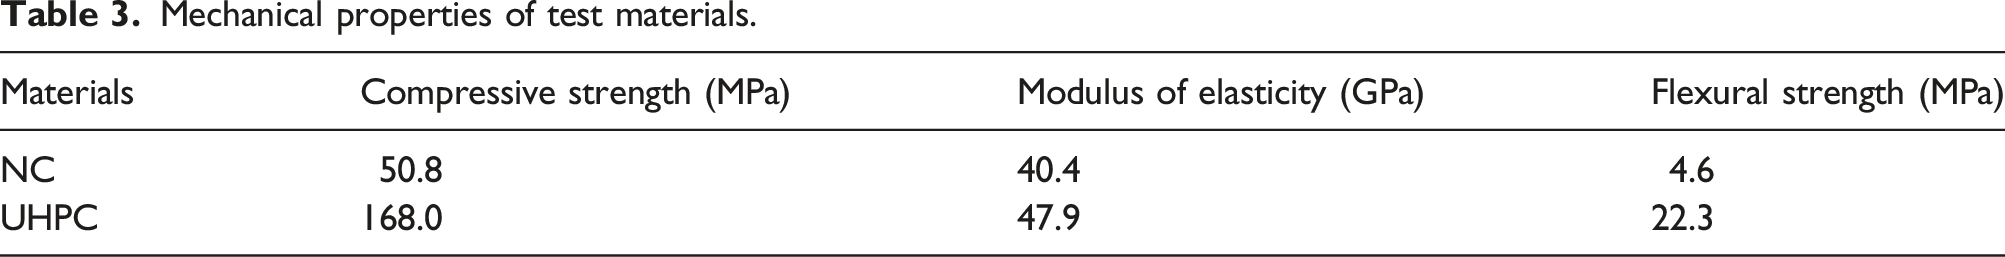
Referring to the codes of GB/T 50081-2002 (2003) and GB/T 31387-2015 (2015), the cube compressive strength, flexural strength, and modulus of elasticity of NC and UHPC were evaluated, respectively. The compressive strength specimens of NC and UHPC were 150 mm × 150 mm × 150 mm and 100 mm × 100 mm ×100 mm cubes, respectively; the flexural strength specimens were 150 mm × 150 mm × 300 mm and 100 mm × 100 mm × 300 mm prisms, respectively; the modulus specimens were 150 mm × 150 mm × 300 mm and 100 mm × 100 mm × 300 mm prisms, respectively. NC specimens were cast and demolded after 48-h followed by ambient curing for 28 days. UHPC specimens were cast and demolded after 48-h ambient curing, followed by high-temperature steam curing (80°C–90°C) for 72-h.
Tensile test results of rebar.


Test specimens: (a) cube compressive test; (b) bending test;(c) modulus of elasticity test; (d) uniaxial tensile property test of steel rebar.
Mechanical properties of test materials.
Experiment design
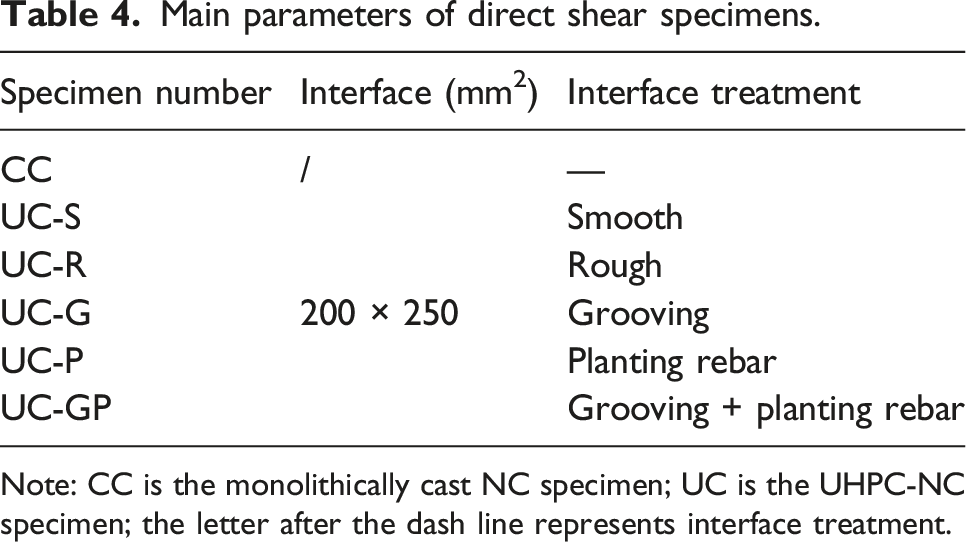
As shown in Figure 2, the Z-shaped specimen is selected to reduce the effect of additional bending moments at the interface. The overall dimension of the Z-shaped specimen is 200 mm × 200 mm × 500 mm. The size of shearing surface area is 250 mm × 200 mm. The specimens are reinforced with HRB400 rebar of 10 mm diameter. Six groups of Z-shaped specimens undergoing different interface treatments are prepared, and each group has two specimens. The interface treatments of prefabricated UHPC surface include smooth, chiseling belt(rough), grooving, planting rebar, and grooving and planting rebar. The number and interface treatment of each specimen are shown in Table 4. Dimension and configuration of specimen (Unit: mm): (a) dimension; (b) reinforcement layout. Main parameters of direct shear specimens. Note: CC is the monolithically cast NC specimen; UC is the UHPC-NC specimen; the letter after the dash line represents interface treatment.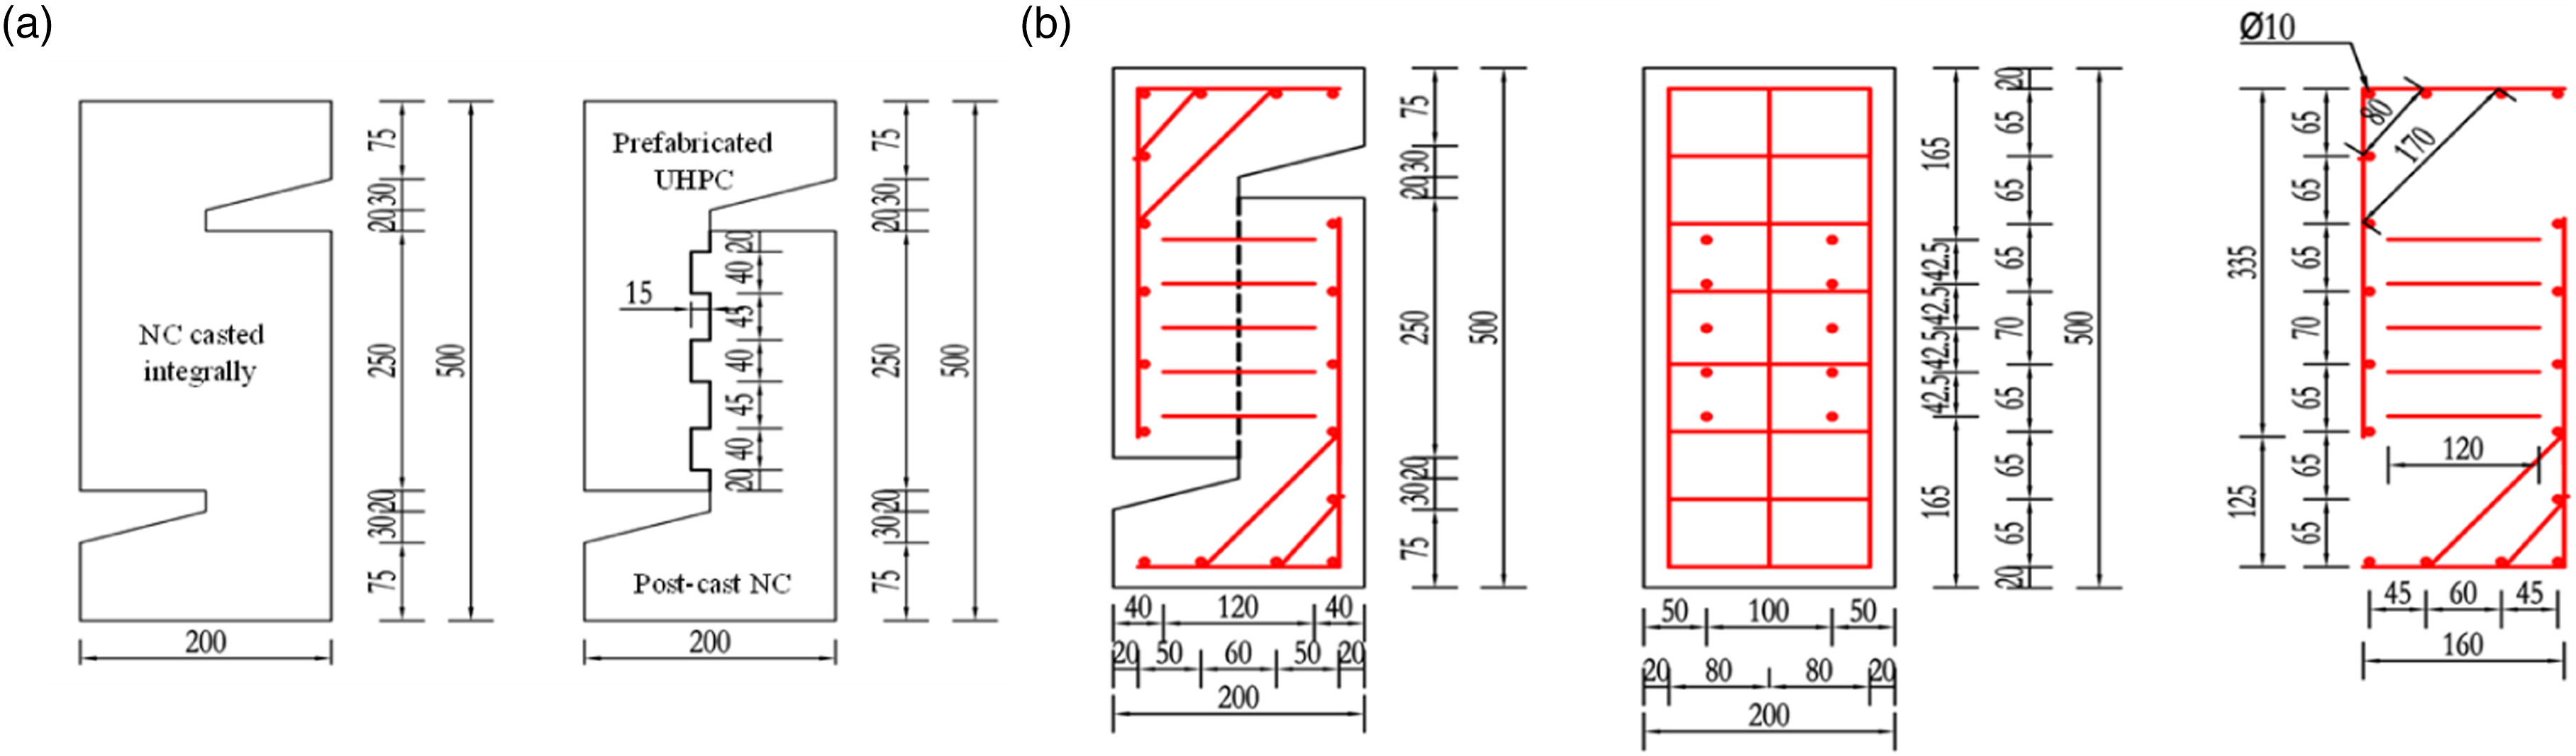
Specimen preparation
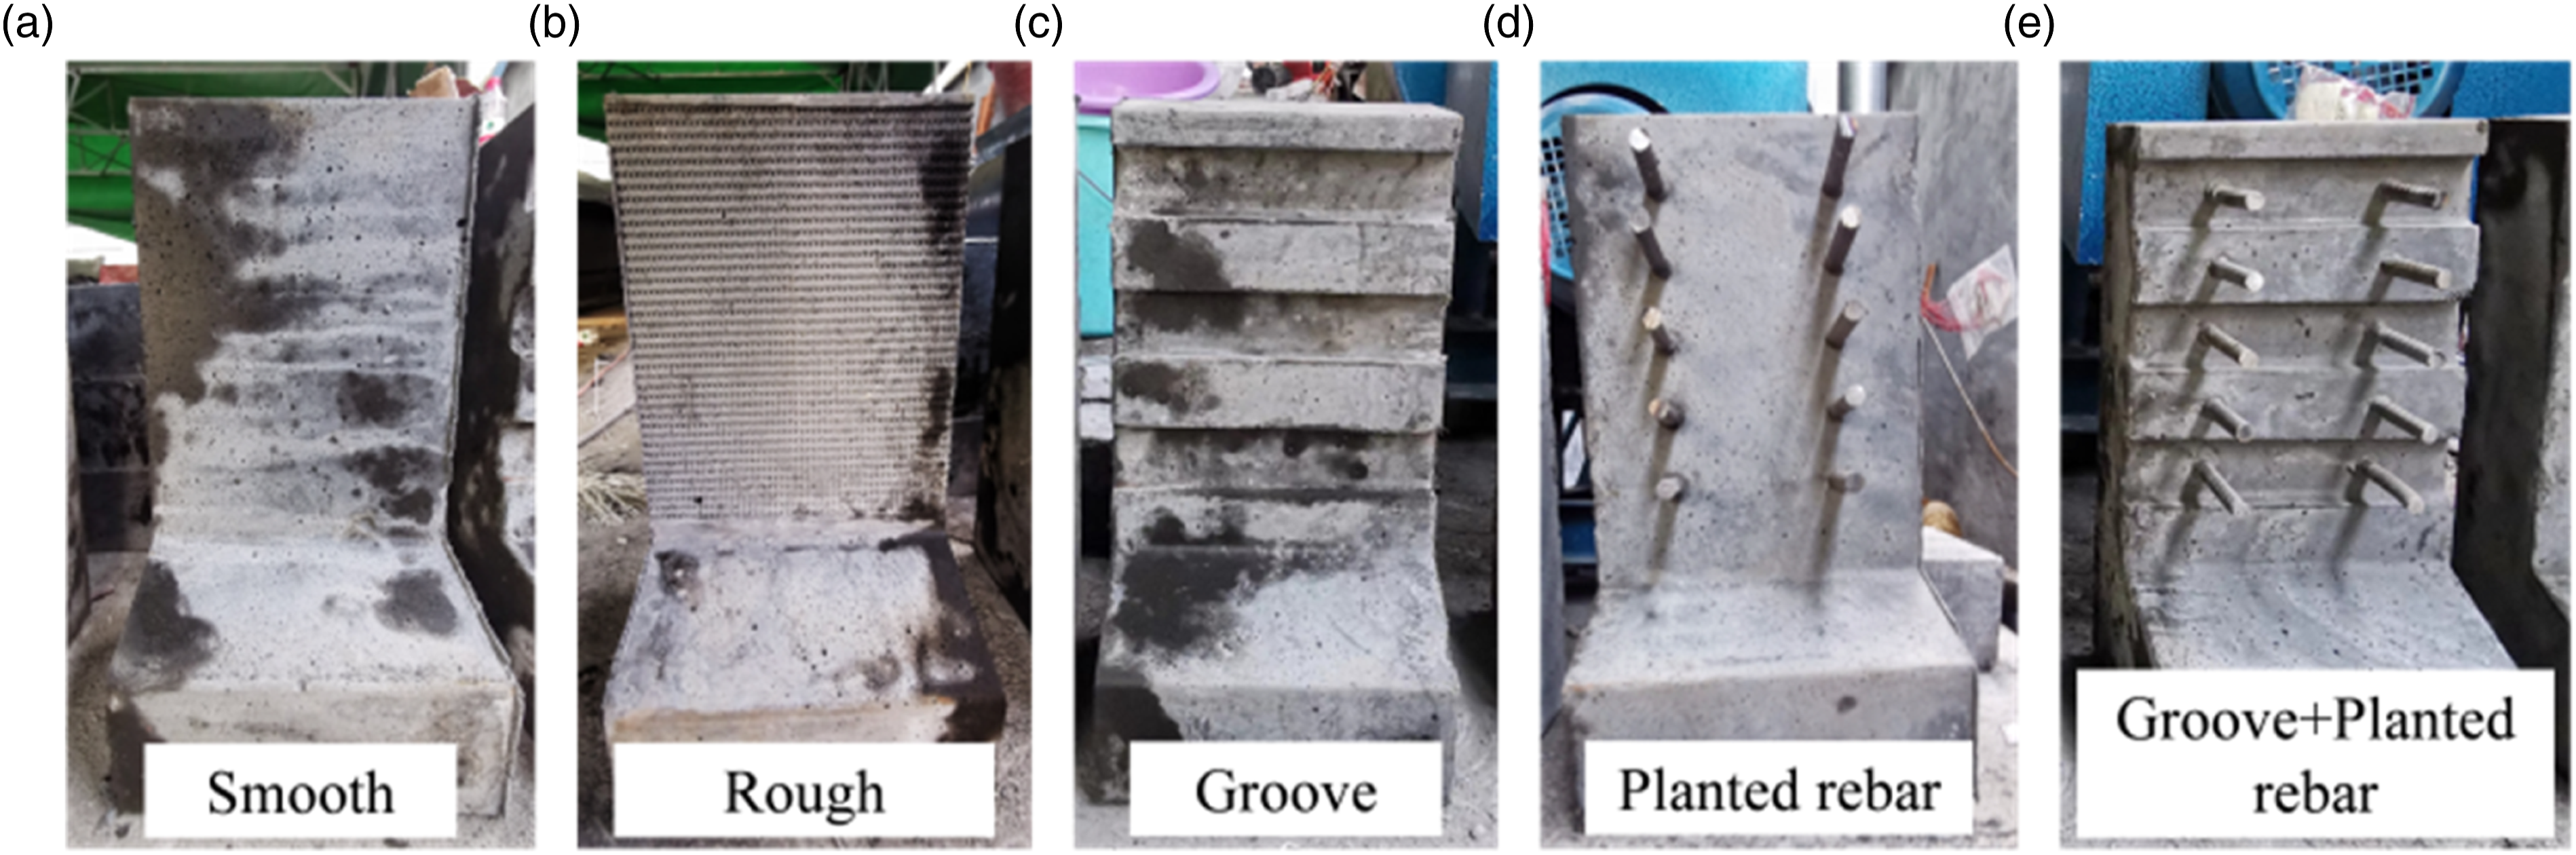
The specimen preparation procedures are shown in Figure 3. The inside surface of the steel formwork was treated as follows based on different substrate surface treatments: the smooth case did not have any treatment; the chiseling belt was glued to the inside surface of the steel formwork for the rough case, and the belt fell off naturally upon demolding. A 3D steel formwork shape with a width of 45 mm and a depth of 15 mm was assembled for the grooving case; the number of rebars were fixed at their design positions for the planting rebar case; the combination of the grooving and planting rebar cases was for the last interface treatment. All the structural reinforcements were placed inside the steel formworks before casting concrete. The treated UHPC interfaces after demolding are shown in Figure 4. Preparation of direct shear specimens (a) steel form and reinforcement (b) chiseling belt (c) mixing UHPC (d) casting UHPC (e) casting NC (f) natural curing. Interface treatment of specimens (a) UC-S (b) UC-R (c) UC-G (d) UC-P (e) UC-GP.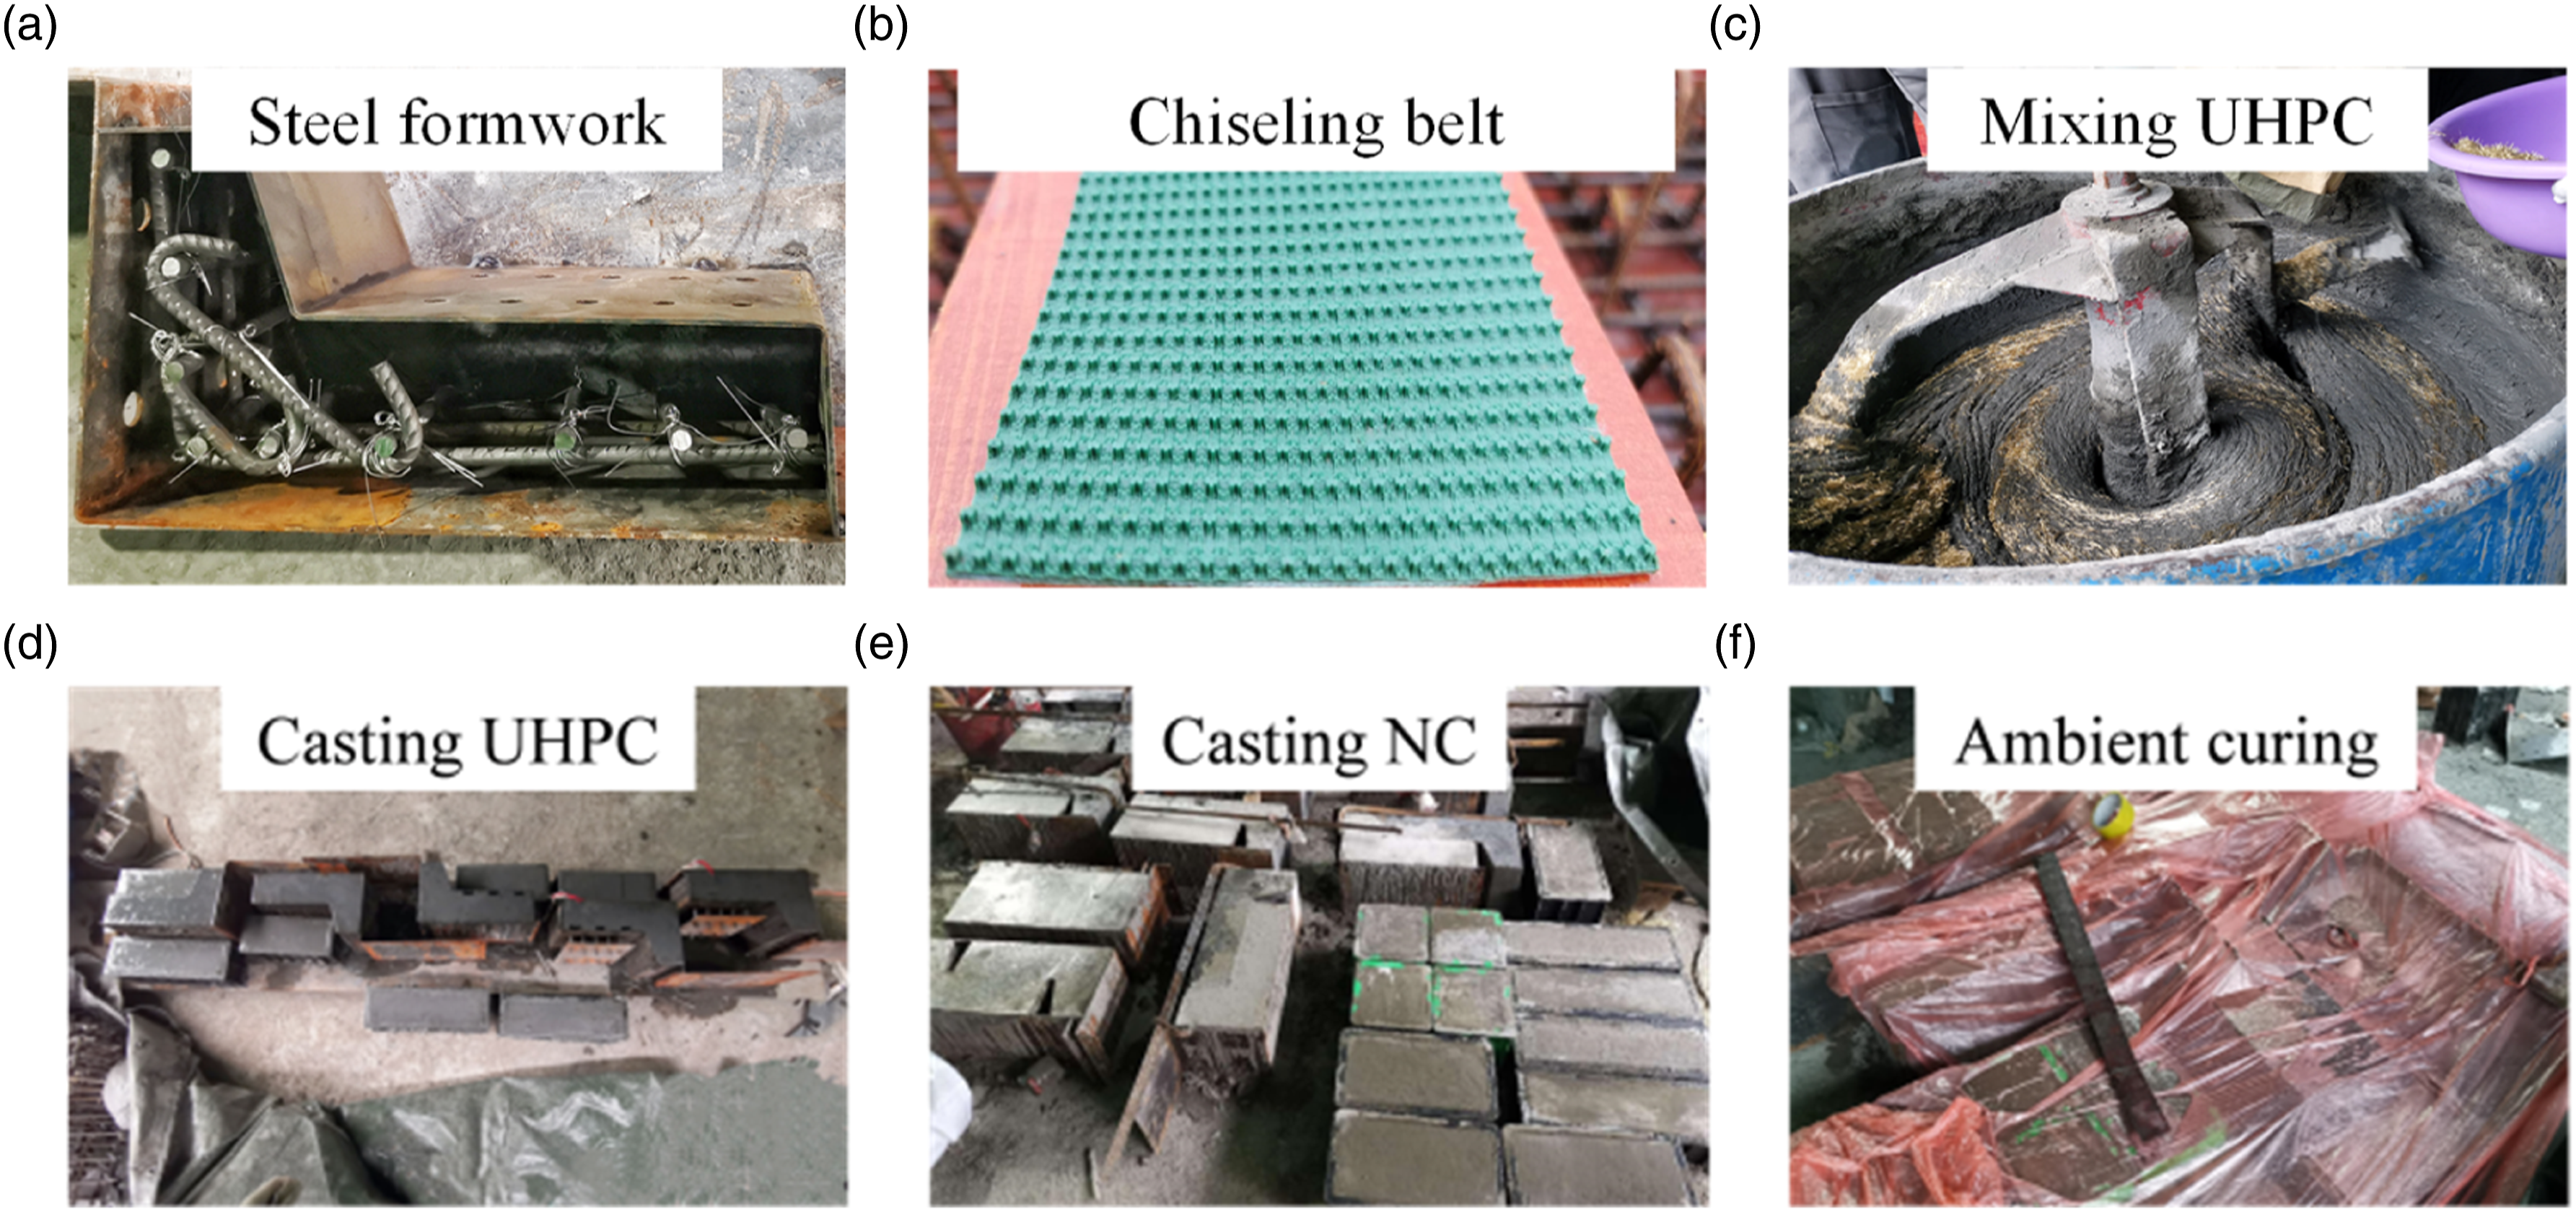
The UHPC portions were demolded after 48-h of ambient curing, and placed in the steam curing environment for 72-h at a temperature of 80°C–90°C. After that, the NC portions were cast and demolded after 48-h natural curing. Finally, the composite specimens were cured at room temperature for total 28 days before test. It should be noted that the specimens for material property test and direct shear test were cast at the same time to assure the same material properties.
Loading and measurement arrangement
In this study, both traditional measuring devices and the Digital Image Correlation (DIC) technology were used to record the displacement and strain. As shown in Figure 5, two dial gauges were arranged at the upper and lower ends of the interface to measure the interfacial slippage. The 60t universal testing machine was used for loading and record load values. Two 100 mm × 200 mm loading steel pads were placed at the top and bottom of the specimen to ensure even force transmission. Pre-loading of 5 kN was conducted to check functionality of the test instruments and loading devices and to eliminate inelastic deformation. A displacement controlled loading with a rate of 0.25 mm/min was applied. The load was held for 60 s to record data at each step. The tests for specimens without planting rebars were stopped when the interfaces debonded. The tests for specimens with planting rebars were stopped when the deformation was sufficiently developed. (a) Reinforced strain gauge position (b) measurement (c) loading test setup.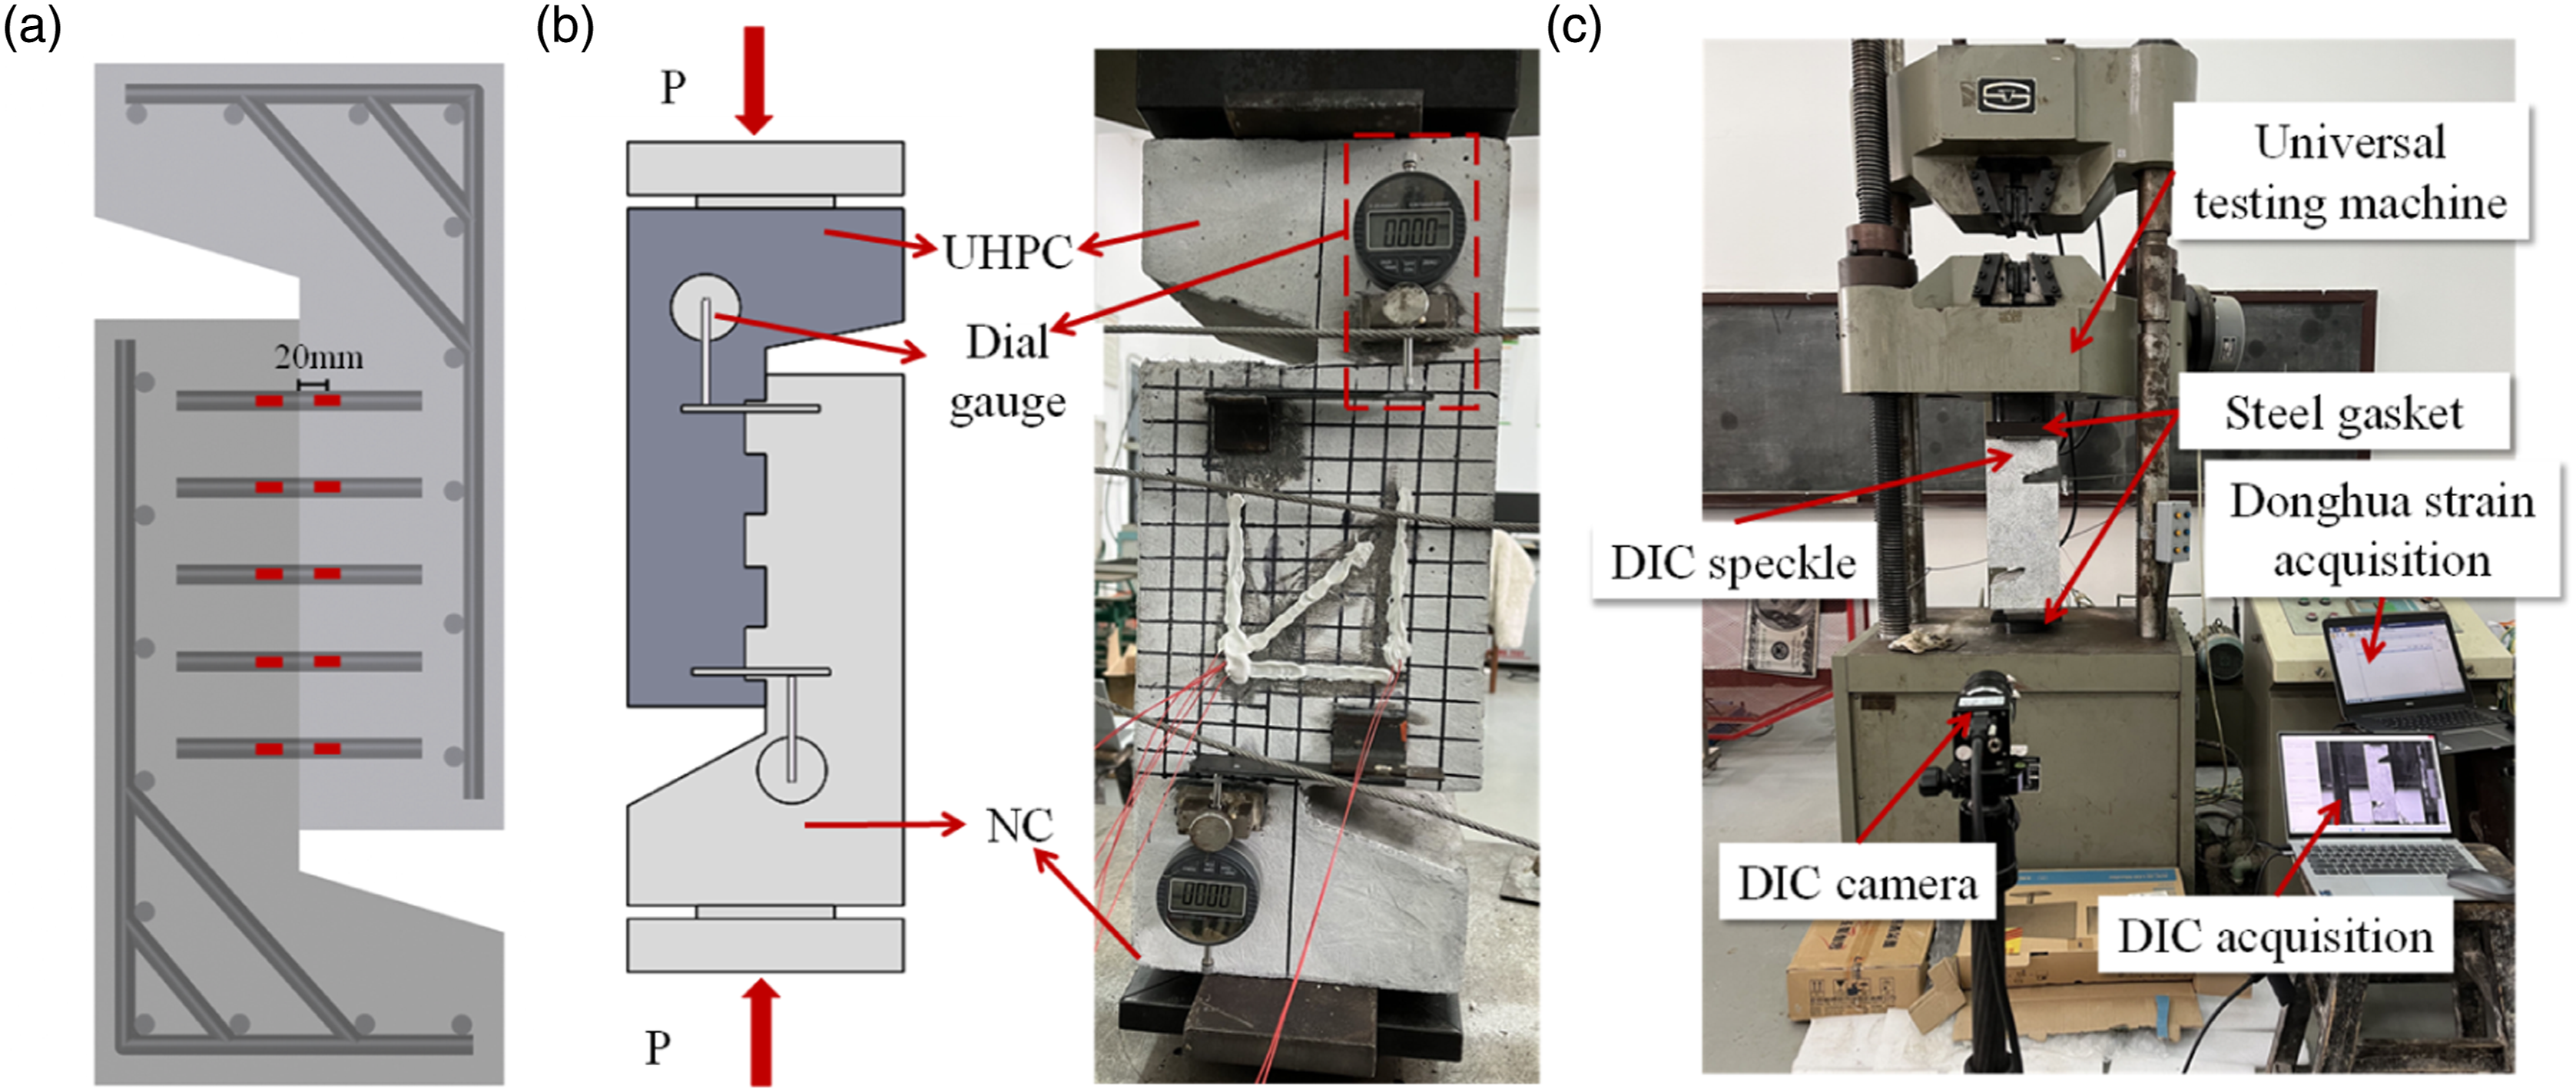
Test results and discussion
Failure mode
Three failure modes of the UHPC-NC interface are observed: (1) pure interface failure (Class A): the interfacial surface remained smooth for the failed specimens. The UHPC substrate and NC didn’t have damage basically, excluding some cracks and peeling at the NC surface; (2) combined interface failure and NC shear failure (Class B): the NC part near the interface was intensively cracked, and the crack developed along the interface of the damaged specimens. No other cracks form on the UHPC substrate and NC; (3) NC splitting failure (Class C): Class A or Class B failure first occurred to the interface. Despite considerable vertical cracks emerge at the interface, the specimens didn’t separate. As the load increased, the planted rebar squeezed the NC consecutively. Finally, the UHPC substrate was sound but the planted rebars yield.
Figure 6 shows the failure modes of all groups. For the CC group, the first transverse crack appeared on the NC surface at the beginning of the test. The transverse crack grew slowly as the load increased, and longitudinal cracks began to emerge at the interface. The interface experienced brittle shear failure with a loud sound when the nominal shear resistance was reached. After the failure, nearly half of NC was entirely spalled off, and the coarse aggregate was sheared off, leaving a rough NC surface. The UC-S and UC-R groups showed Class A failure. When the nominal shear resistance was reached, the UHPC-NC interface of UC-S and UC-R cracked and failed subsequently accompanied by slight NC peeling. The UC-G group showed Class B failure. The first transverse crack appeared on the NC side at the beginning of loading. When the load was increased to 48.6% of the peak load, the longitudinal cracks emerged at the interface. When the nominal shear resistance was reached, an average of 60% (i.e., groove area) of the NC at the interface failed in shear and the rest of 40% failed in interface debonding. The UC-P and UC-GP groups showed Class C failure. On the NC surface, small transverse cracks first appeared as the load was increased to 15 kN. Longitudinal cracks first occurred at the end of the interface after the load was increased to 155 kN and then gradually spread to the center. The NC grooves of the UC-GP group were sheared off for the load was increased to 215 kN, and a longitudinal crack appeared along the whole interface. The NC was crushed by the planting rebars once the nominal shear resistance had been reached. The highest strains of the planted rebars in the failed UC-P and UC-GP were 2919.2 and 4440.7, respectively. The UC-S, UC-R, and UC-G groups (without rebars) showed brittle failure, whereas UC-P and UC-GP groups (with rebars) showed ductile failure. Failure modes of specimens.
Shear strength of the UHPC-NC interface
The interfacial shear strength can be calculated as follows: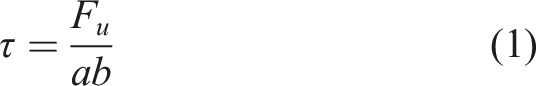
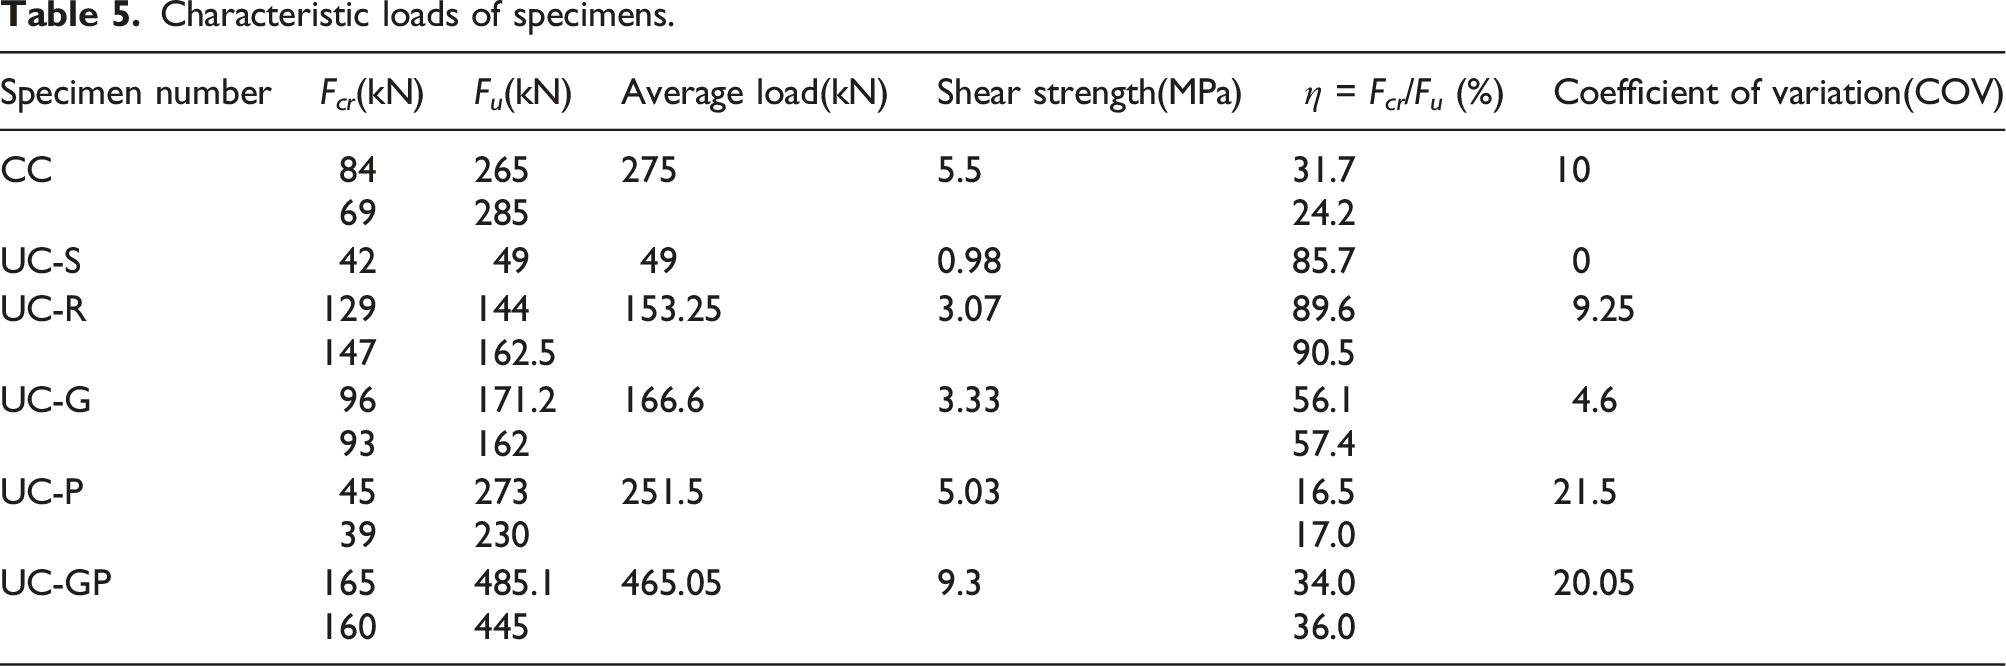
Characteristic loads of specimens.
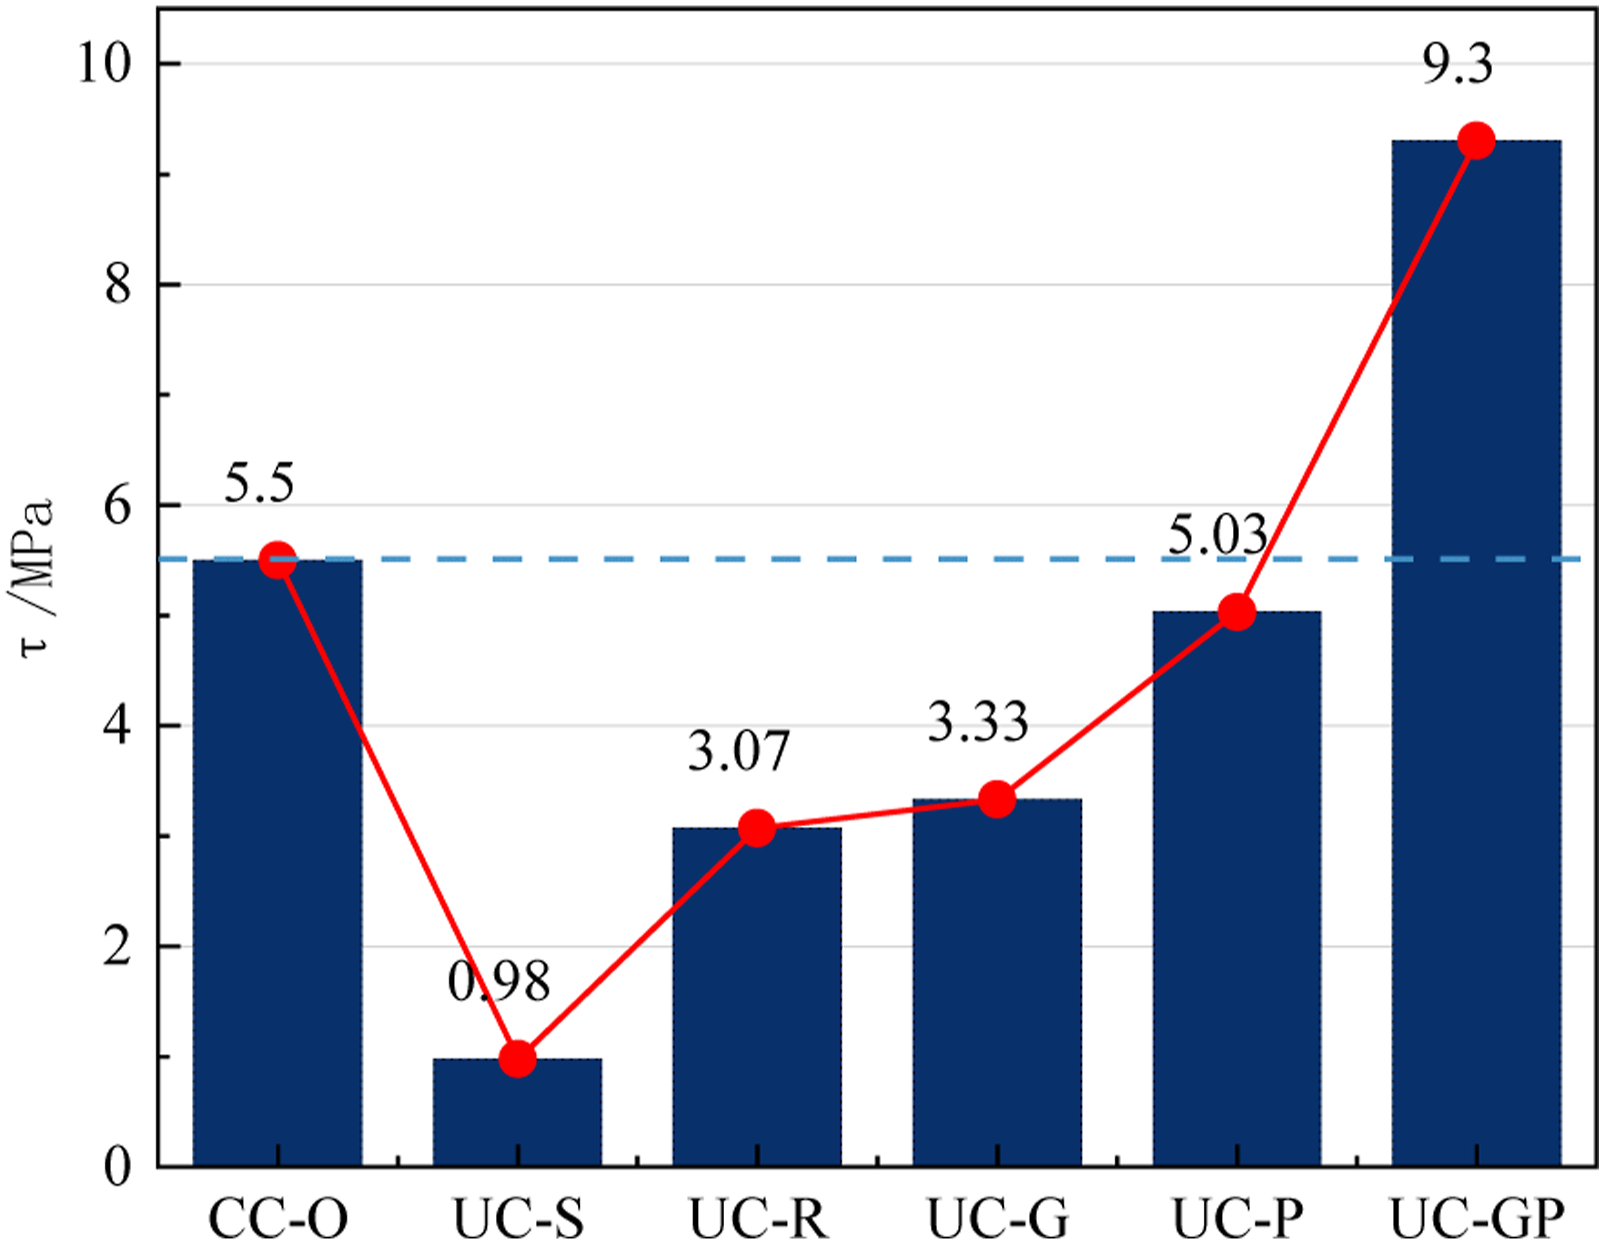
Interfacial shear strength of specimens.
As shown in Table 5, the interfacial cracking load
In terms of interfacial shear strength
The ratio of
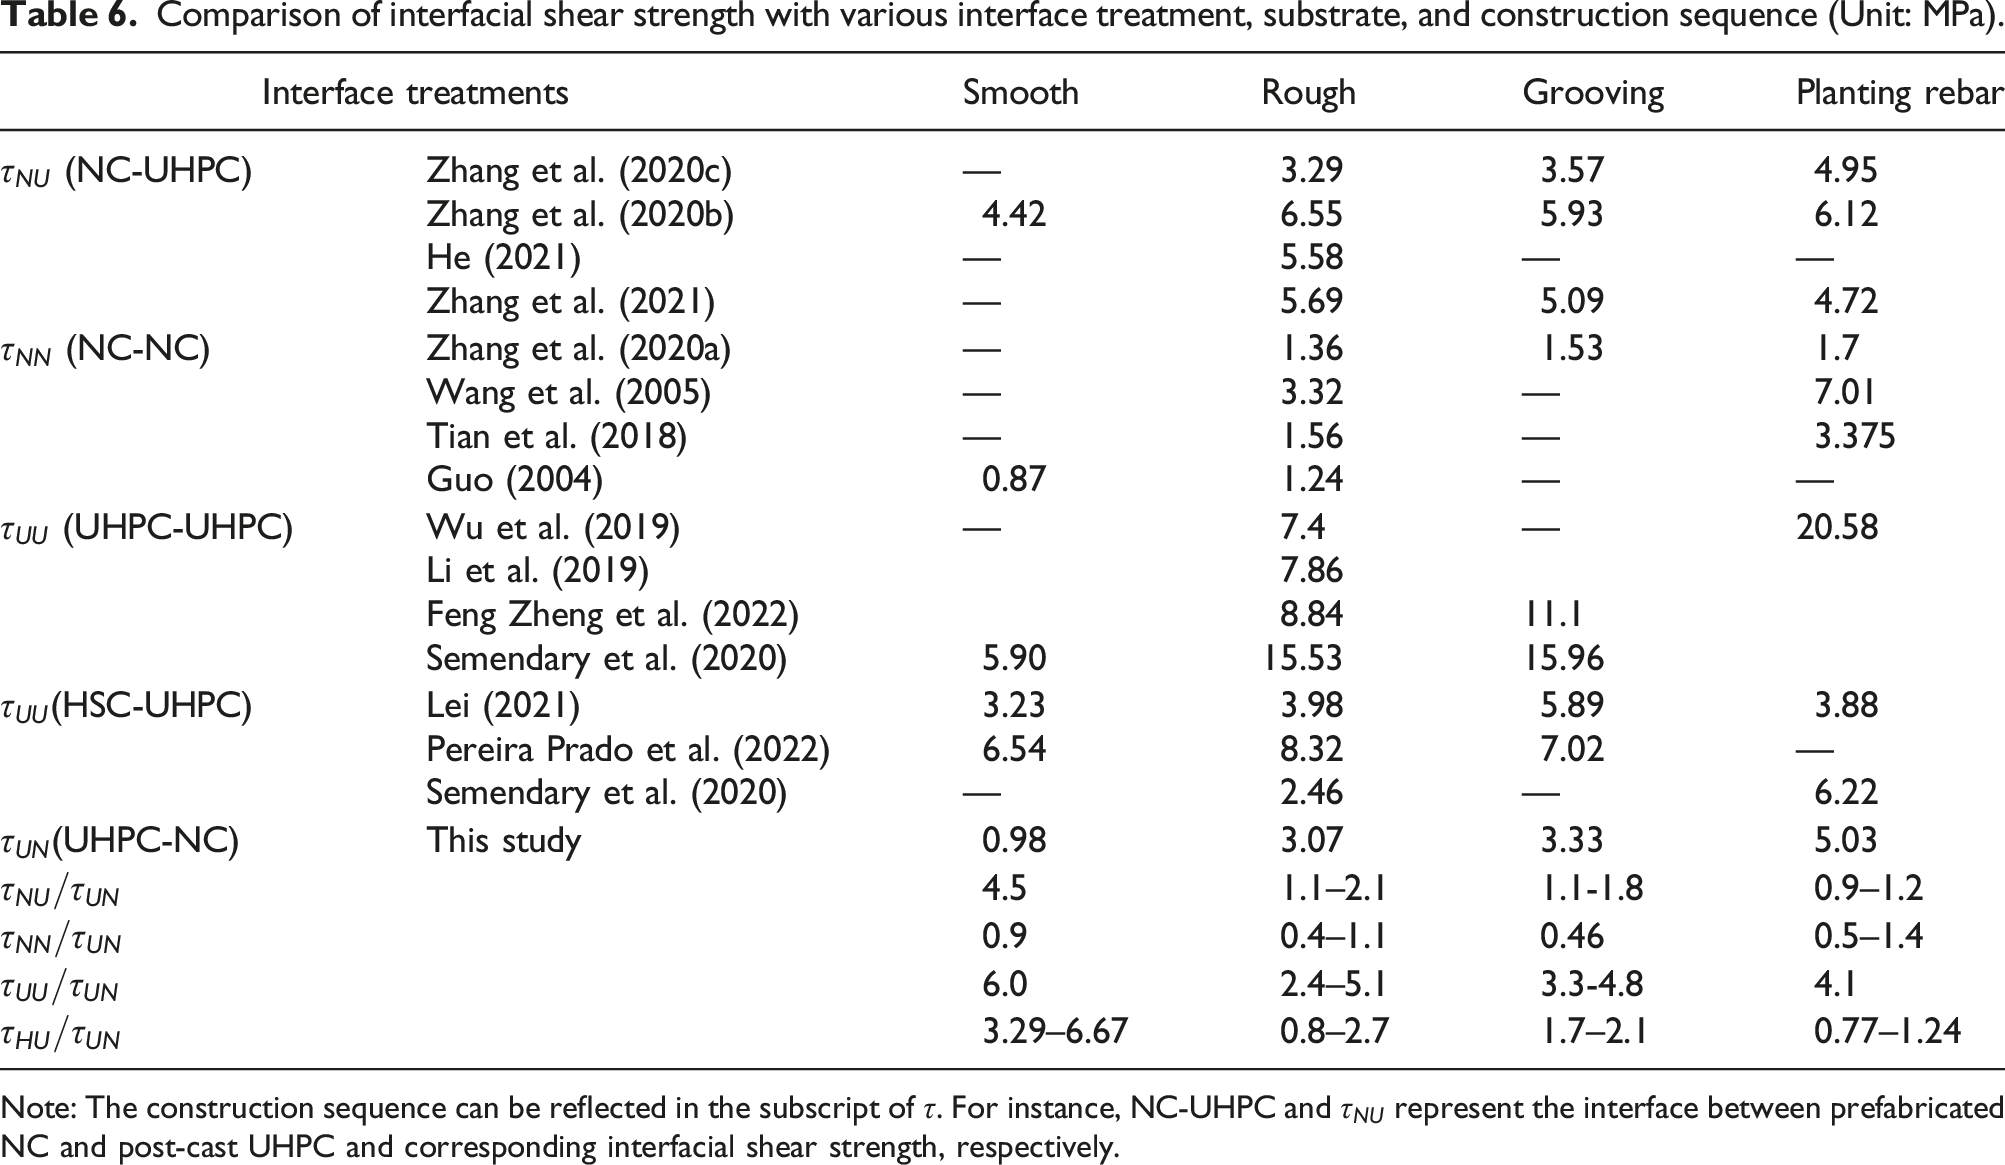
Comparison of interfacial shear strength with various interface treatment, substrate, and construction sequence (Unit: MPa).
Note: The construction sequence can be reflected in the subscript of
The shear strength test results of the UHPC-UHPC specimens, under various interfaces (smooth, roughened, grooved, and reinforced), show a significant increase compared to the UHPC-NC specimens. The UHPC-UHPC specimens exhibit shear strength values 6.0 times, 2.4–5.1 times, 3.3–4.8 times, and 4.1 times higher than the corresponding UHPC-NC specimens.
This increase in shear strength can be attributed to two factors. Firstly, it is related to the higher strength of UHPC (up to 150 MPa), three times higher than NC. Secondly, the UHPC-UHPC interface has a higher density of steel fibers, leading to a more pronounced bridging effect. Additionally, in the presence of micro-cracks, hydration products can penetrate the cracks effectively, exhibiting superior self-healing capabilities and enhancing the shear strength of the interface.
By comparing the shear strength of the interface under the four interface processing methods of HSC-UHPC, it can be found that the shear strength of the HSC-UHPC interface is between NC-UHPC and UHPC-UHPC.
From the standpoint of interface processing methods, the implant bar interface has a stronger interface shear strength than the grooved and chiseled interfaces, while the smooth interface has the weakest interface shear strength. In terms of interface types, the UHPC-UHPC interface has the largest shear strength ratio—nearly three times—compared to the UHPC-NC interface. The shear strength of the UHPC-UHPC interface is the best, and the shear strength of the NC-NC interface is the weakest, with the ratio of the NC-UHPC interface's shear strength to the UHPC-NC interface being greater than 1, and the ratio of the NC-NC interface's shear strength to the UHPC-NC interface being slightly less than 1.
Figure 8 shows the load-interface slippage curves of all specimens. For UC-S, UC-R and UC-G (without rebars), the slippage is almost linearly related to the load before brittle interface failure, and the maximum slippage is less than 0.25 mm without descending stage. Moreover, the ultimate nominal shear resistance was reached quickly after the interface cracking. Therefore, the interfacial shear strength is mainly provided by adhesive friction and mechanical interlocking. The mean peak loads of the UC-R and UC-G specimens are 153.3 kN and 166.6 kN, corresponding to mean slippages of 0.255 mm and 0.217 mm, respectively. It indicates that grooving cannot improve the shear resistance and ductility of the UHPC-NC interface efficiently. The maximum slippage of UC-P and UC-GP (with rebars) is around 1.2 mm larger than those without rebars. The interfacial shear strength of UC-P and UC-GP is mainly provided by the planted rebars and mechanical interlocking at the interface. Meanwhile, the rebars yield and continuously squeeze the NC at the interface, increasing the slippage. The above experimental phenomena show that compared to UC-R, grooving specimens fully consume the shear strength of NC. Planting rebars into the UHPC-NC interface improves the ductility and interfacial bonding performance, further enhancing the integrity of UHPC-NC composite structures. Load-interfacial slippage curve.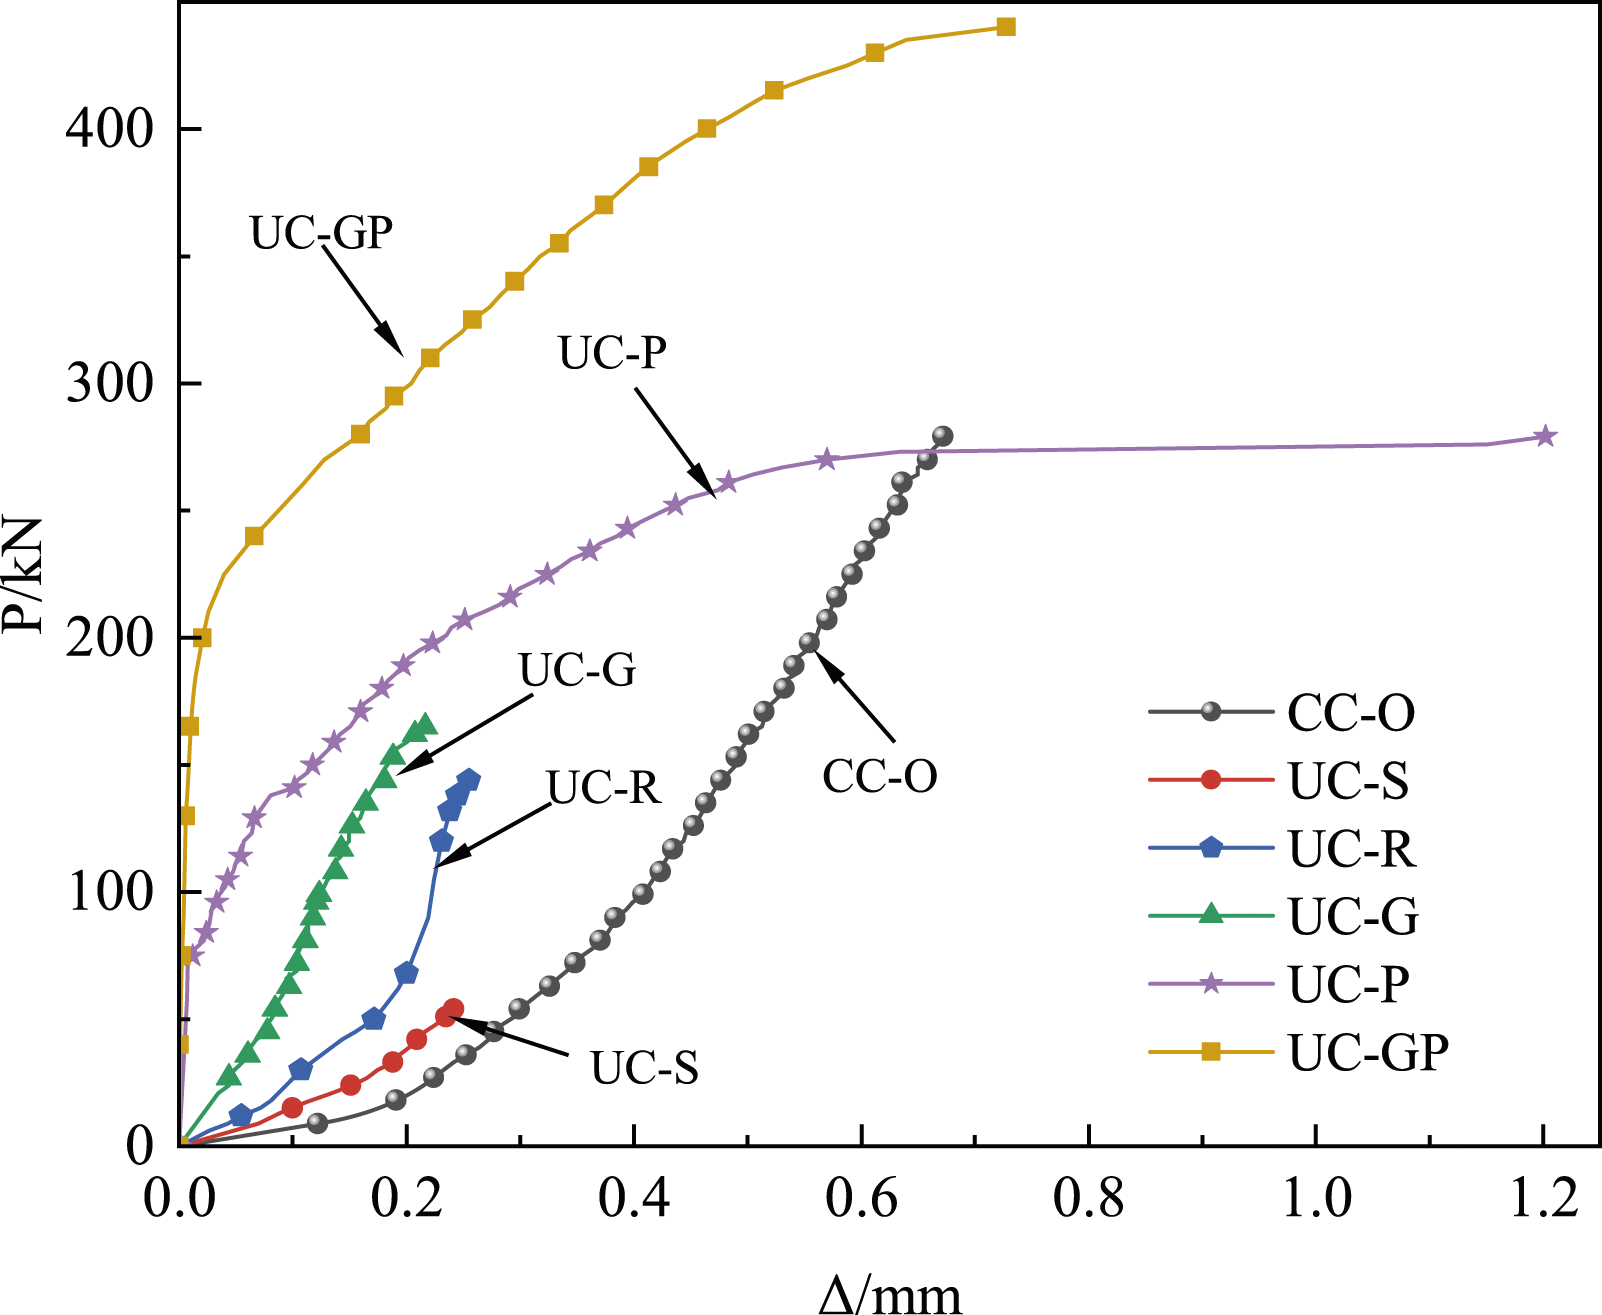
In conclusion, the UHPC-NC interface with planted rebars shows better shear ductility and relative larger ultimate interface slippage. The UHPC-NC interface without rebars shows brittle failure and small ultimate interfacial slippage.
Calculation of nominal shear resistance of the UHPC-NC interface
Existing codes
The existing calculation formulas for nominal shear resistance of NC-NC interface.
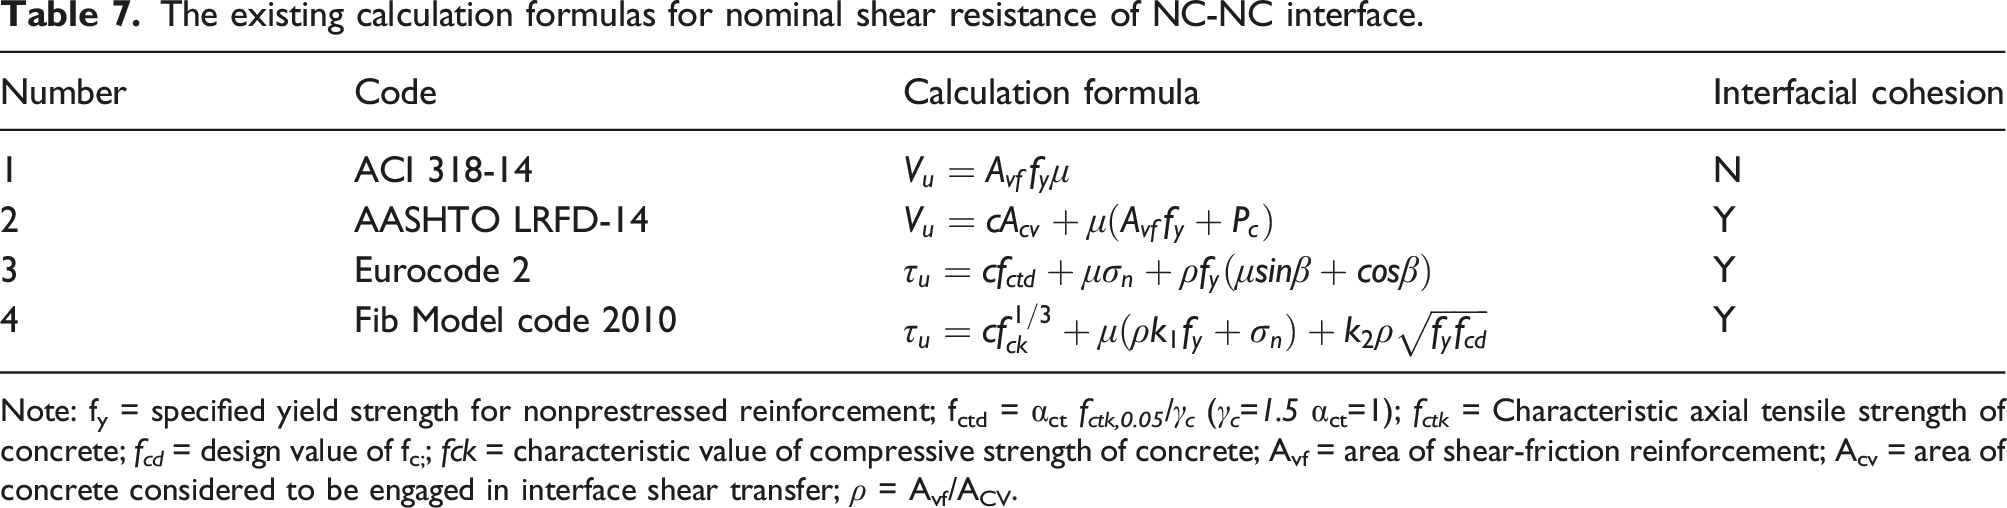
Note: fy = specified yield strength for nonprestressed reinforcement; fctd = αct f
ctk,0.05
/γ
c
(γ
c
=1.5 αct=1); f
ctk
= Characteristic axial tensile strength of concrete; f
cd
= design value of fc;; fck = characteristic value of compressive strength of concrete; Avf = area of shear-friction reinforcement; Acv = area of concrete considered to be engaged in interface shear transfer;
Coefficients of friction and cohesion factor specified.
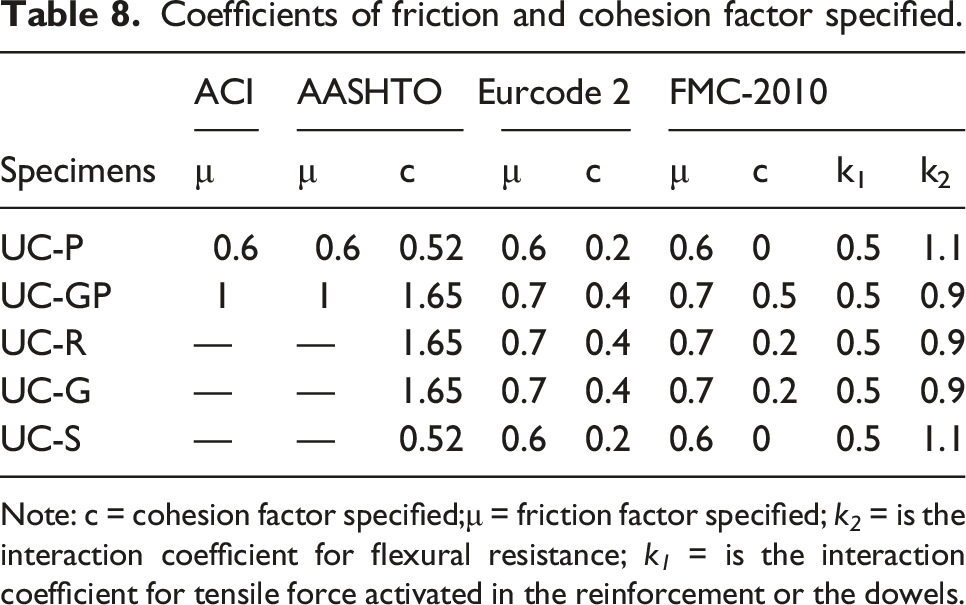
Note: c = cohesion factor specified;μ = friction factor specified; k 2 = is the interaction coefficient for flexural resistance; k 1 = is the interaction coefficient for tensile force activated in the reinforcement or the dowels.
Test results and calculation results of UHPC-NC interface.

Modified formula
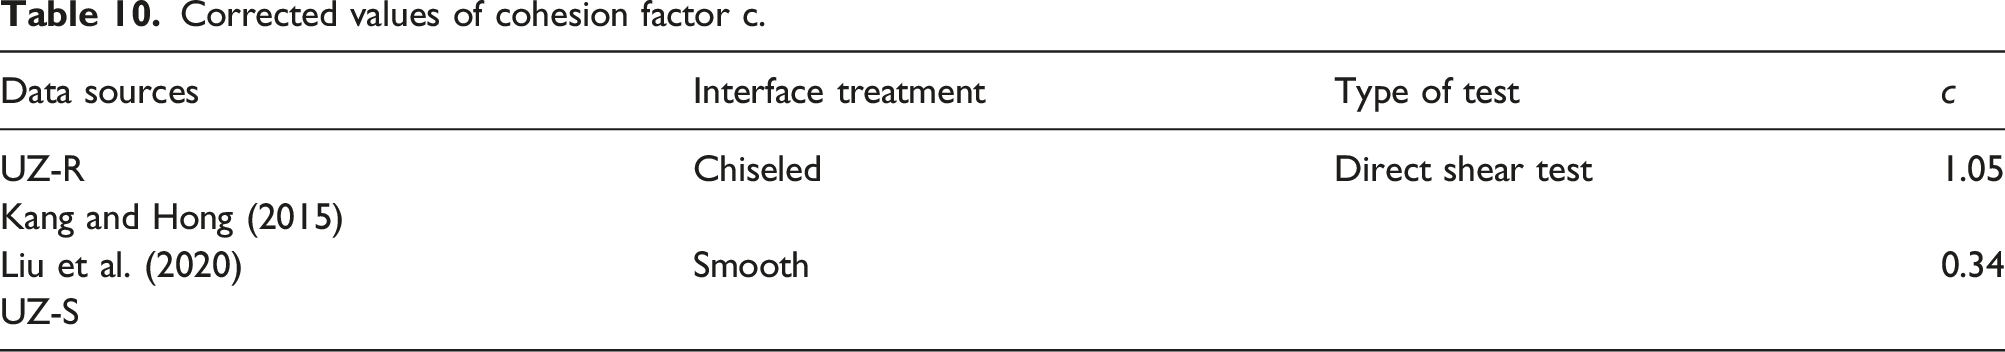
Shear-friction theory is the basis of most calculation formulas for nominal shear resistance of the UHPC-NC interface. According to the comparison of test results and calculation results of nominal shear resistance, the impact of different interface treatments on interface shear performance needs to be considered in detail. Based on the existing calculation formulas, the cohesion factor c is corrected accordingly, and the nominal shear resistance of the UHPC-NC interface is calculated.


Corrected values of cohesion factor c.
For the grooved interface, the NC grooves bear a large portion of the interfacial shear force. The nominal shear resistance of the NC grooves can be calculated with reference to the AASHTO (1999) reference. The nominal shear resistance 
The contribution of planted rebar can be divided into two parts, shear resistance and friction resistance. Referring to the Fib Model Code 2010 reference, the nominal shear resistance 
The calculation formulas for diversely treated interface.

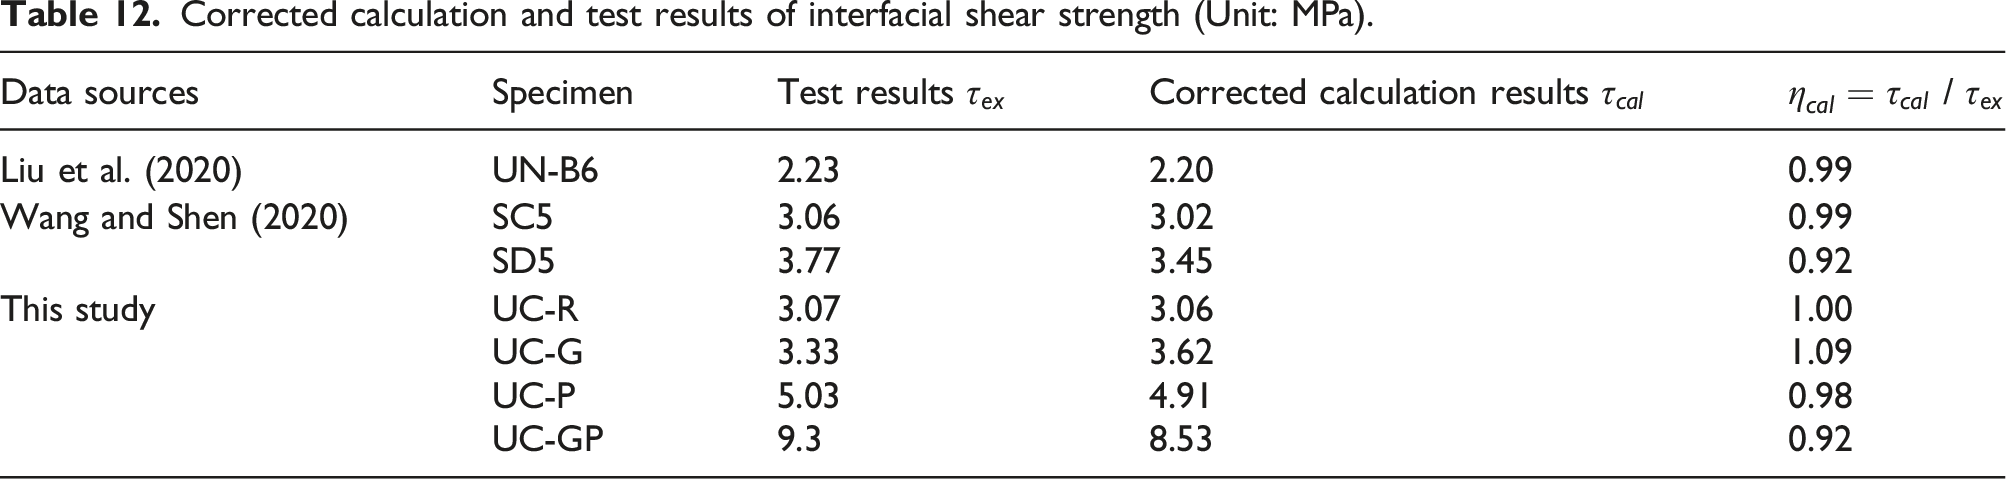
Corrected calculation and test results of interfacial shear strength (Unit: MPa).
Conclusions
Experimental and analytical study were carried out to study the shear performance of prefabricated UHPC-post-cast NC interface. The main conclusions are as follows: (1) The high water to cement ratio, high amount of coarse aggregate and low density of the post-cast NC leads to more micro-cracks and pores at the UHPC-NC interface. As a result, the nominal shear resistance of the smooth and chiseled UHPC-NC interface is significantly lower than the NC-UHPC interface with the same interface treatment. Therefore, interfacial reinforcement (i.e., planted rebar) of the UHPC-NC interface is necessary. (2) Three typical failure modes appeared during the tests, where UC-S and UC-R showed pure interface failure (Class A), UC-G showed combined interface failure and NC shear failure (Class B), and UC-P and UC-GP showed NC splitting failure (Class C). The NC failure was the main reason of the UHPC-NC interfacial failure. (3) The roughness of the interface determines the interfacial cracking load which can be significantly improved by chiseling and grooving. Interfacial reinforcement (i.e., planted rebar) can significantly increase the nominal shear resistance of the UHPC-NC interface, comparable with monolithically cast NC specimen. Planted rebar can further increase the cracking load and nominal shear resistance of the grooved UHPC-NC interface. (4) The load-interfacial slippage curves illustrate that the rebar reinforced UHPC-NC interfaces show excellent ductility and larger ultimate interfacial slippage. The non-reinforced interfaces show brittle failure and smaller interfacial slippage. (5) The interfacial shear resistance is comprised of UHPC-NC cohesion, shear resistance of grooves, and shear resistance and friction of planted rebar. The adhesion factor c was corrected to develop calculation formulas for nominal shear resistance of the UHPC-NC interfaces. The calculated results agree well with the test results, and the relative errors between them are less than 10%.
Footnotes
Author Contributions
Yang Zhang: Conceptualization, Methodology, Supervision, Writing - review. Yue Wu: Methodology, Data curation, Formal analysis, Writing - original draft. Yanyue Qin: Methodology, Writing - review & editing. Yanping Zhu: Methodology, Validation, Writing - review & editing. Junfeng Qiu: Resources, Funding acquisition, Writing - review. Wenhong Wang: Funding acquisition, Writing - review.
Declaration of Conflicting Interests
The author(s) declared no potential conflicts of interest with respect to the research, authorship, and/or publication of this article.
Funding
The author(s) disclosed receipt of the following financial support for the research, authorship, and/or publication of this article: This work was supported by National Natural Science Foundation of China (No. 52078200); Guided Project of Fujian Provincial Department of Science and Technology in 2021 (No. 2021H0033); Key project of Science and Technology Research Project of Educational Department of Hunan Province (No. 21A0019); Fujian Province Transportation Science and Technology Demonstration Project (No. 2021-2).