



Abstract
When empirical wavelet transform (EWT) is used to identify the modal parameters of civil engineering structures, the frequency band division is generally not accurate due to the noise effect on the Fourier spectrum. This phenomenon will lead to modal mixing and false modes in the analysis results. Therefore, this article establishes a signal frequency band division method by taking advantages of maximal spectrum technique and spectral skewness index. Combining the random decrement technique (RDT) and the least square method of single component modal parameter identification, an adaptive approach based on the improved EWT for operational modal parameter identification of civil engineering structures under stationary environmental excitations is proposed. The traditional frequency band division method based on EWT can not completely and effectively divide the meaningful frequency bands. While the proposed frequency band division technology based on the spectral skewness index can prevent the phenomenon of insufficient division and excessive division and realize adaptive frequency band division. The effectiveness of the proposed approach is validated by a numerical three-story frame and a field three-span concrete box girder bridge under ambient vibrations. The modal identification results from both numerical and experimental validations demonstrate that the proposed approach can effectively and accurately decompose the vibration responses and identify the structural modal parameters under operational conditions.
Keywords
Introduction
Modal identification technique is essential to identify accurately the structural vibration characteristics from measured dynamic responses for health monitoring of engineering structures. The identified vibration characteristics can be used for structural damage detection, condition assessment, and long-term monitoring (Beck et al., 2001; Nagarajaiah and Yang, 2017; Li et al., 2020; Sun et al., 2020; Hou et al., 2022). In terms of engineering applications, it is very difficult to measure the dynamic external excitations applied to the structures. An operational modal identification technique based on output responses becomes a desirable technique in civil engineering applications. Existing methods including peak picking from power spectral density spectrum, stochastic subspace identification (SSI) approach and natural excitation technique have been developed and widely used for modal identification of civil structures (Li et al., 2016, 2022; Chen et al., 2019, 2022; Cancelli et al., 2020). Nonetheless, the challenges associated with these methods still exist, which are to identify the modal information of structures with closely spaced modes, and to accommodate the significant noise effect in the vibration responses measured from the structures under the ambient vibrations.
In recent years, time-frequency analysis methods have received increasing attention for modal identification and damage detection of civil structures. Staszewski (1997) proposed three different procedures to identify the damping ratios of a multi-degree-of-freedom system based on the continuous wavelet transform (CWT). Ruzzene et al. (1997) developed using wavelet transform to identify the structural modal parameters, that is, natural frequencies and damping ratios. Kijewski-Correa and Kareem (2006) used CWT and empirical mode decomposition (EMD) to separate two closely spaced cosine waves, and the results demonstrated that the frequency resolution capacities of these two techniques can be problematic. HHT is an alternative time-frequency analysis method based on EMD which is to decompose adaptively a signal into a discrete number of intrinsic mode functions (IMFs). These IMFs represent natural oscillatory modes embedded in the signal and behave as basic functions, which are derived from the signal itself. EMD has been widely applied for modal identification and structural damage identification (He et al., 2011). To improve the performance of using EMD for response decomposition against the noise effect in measured responses, ensemble empirical mode decomposition (EEMD) (Wu and Huang, 2009) has been proposed. However, the structural response of the bridge is characterized by modes mixing and high noise intensity. The analysis results of existing time-frequency domain methods for bridge response are easy to mode mixing, which affects the accuracy of the final identification results.
To overcome this shortcoming, a novel adaptive filter method named empirical wavelet transform (EWT) was proposed, which is based on the Fourier spectrum of the signal for frequency band segmentation (Gilles, 2013; Li et al., 2023; Xin et al., 2019). Orthogonal wavelet filter banks are generated by Meyer wavelet basis to extract AM-FM components from the Fourier spectrum. By analyzing the AM-FM components, the corresponding modal parameters can be obtained. The method has a complete theoretical basis and high computational efficiency. Kedadouche et al. (2016) validated the effectiveness of EWT in bearing defect diagnosis using acoustic signals, which performed better than EEMD and EMD on mode estimation and computation time. Cao et al. (2016) utilized EWT to achieve a good performance in the detection of outer race faults, roller faults, and compound faults of wheel bearings using vibration signals.
The shape of the Fourier spectrum of structural vibration signals becomes complicated due to the interference of complex environmental factors. How to segment the Fourier spectrum under strong noise so as to extract the effective modes becomes the key of research (Amezquita-Sanchez and Adeli, 2015; Pan et al., 2016). Deng and Liu (2018) presented a self-adaptive frequency window EWT, where a sliding frequency domain window characterized by variable frequency bandwidth is introduced to segment the Fourier spectrum of fault signal of bearing. Dong et al. (2018) combined the local window maxima algorithm with EWT to process the acoustic emission data for structural health monitoring (SHM) of composite materials. The key ideas of the proposed method are to search all the local maxima of the Fourier spectrum in a proper window, and then to determine the segmentation boundaries. Wang et al. (2018) introduced a sparsity function to quantify the squared envelope of the signal, which further guided the band-pass filters of EWT. The sparsity-guided EWT proposed could automatically establish adaptive Fourier segments of EWT for diagnosing single or multiple faults in rolling element bearings. Kong et al. (2019) developed a meshing frequency modulation assisted empirical wavelet transform framework, which meshing frequency modulation assisted empirical wavelet transform framework. Hu et al. (2017) proposed an enhanced EWT method, which uses an order statistics filter (OSF) based on the envelope approach to find the frequency peaks and applies three practical criteria to segment the spectrum of the processed signal. It takes the spectrum shape of the signal into account for frequency boundaries detection so that the drawback of the EWT is ameliorated. Xin et al. (2019) employed the standardized autoregressive power spectrum to define the frequency boundaries of EWT. The improved EWT could more accurately decompose the vibration responses of frames and bridges and identify their modal parameters under operational conditions.
Based on the above: (a) The principles of the Locmax, Locmaxmin and Locmaxminf methods are relatively similar, and the spectrum is adaptively divided by searching the maximum and minimum value points in the Fourier spectrum of the signal. (b) The Adaptive and Adaptivereg methods are basically the same. The segmentation object of this method is the regularized spectrum or the original spectrum. Before the operation, an artificially drawn initial boundary needs to be input. (c) Based on the Scalespace method, the Gaussian plane scale space conversion is performed on the regular frequency spectrum to obtain the scale space curve, and a certain threshold is selected to obtain the segmentation boundary. In practical application, this method is prone to the “over-segmentation” phenomenon when the number of sampling length of the signal is large, and the calculation speed is slow, so it is necessary to control the number of Fourier transform points. Finally, many improvements have been made to the EWT spectrum segmentation method, but most of them are related to the research on mechanical structures. Different structures have different signal characteristics. The spectrum segmentation method applicable to mechanical structure signal analysis may not be applicable to bridge structure signal analysis. That is, the applicability is yet to be verified.
This study proposes an improved EWT approach based on maximal spectrum technique and spectral skewness to perform the signal decomposition and conduct the structural operational modal identification from the measured responses of structures under stationary ambient excitations. The background of the original EWT method and the improvement of segmentation of the Fourier spectrum are introduced. The proposed improved EWT approach for structural operational modal identification is described and verified on the finite element model. A three-span concrete box girder bridge under ambient vibrations is conducted to further verify the capability of the proposed approach. Finally, the conclusions are summarized.
Theoretical background and development
The traditional EWT
The basic process of EWT is as follows: in the frequency domain of the signal
The Fourier spectrum of the signal can be divided into N segments, which includes an individual IMF.


The empirical scaling function

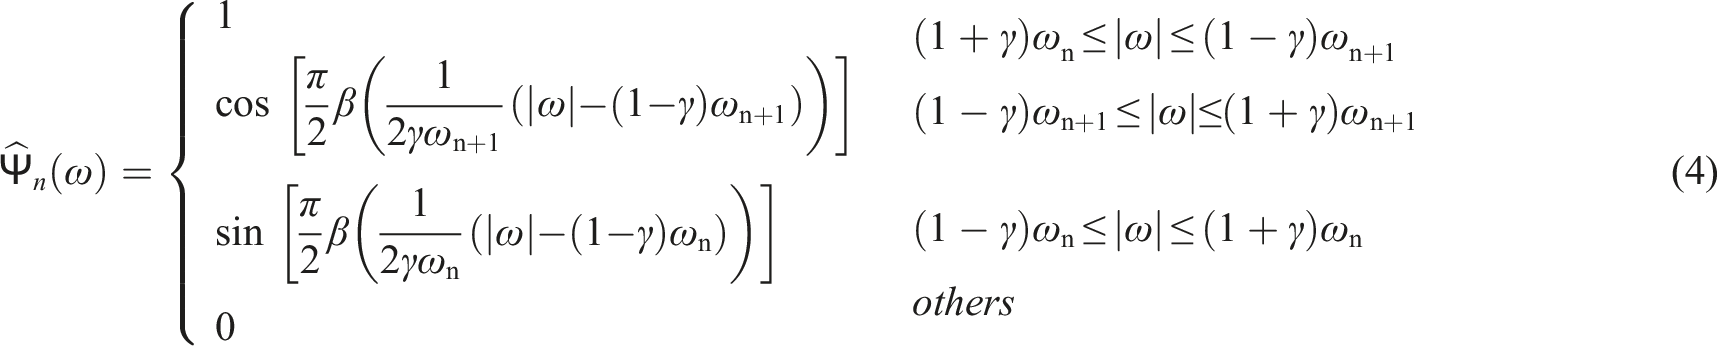
where

The most used function

By adopting Fourier spectrum segment information into Equations (3) and (4), the empirical wavelet is constructed according to the construction method of classical wavelet transform.

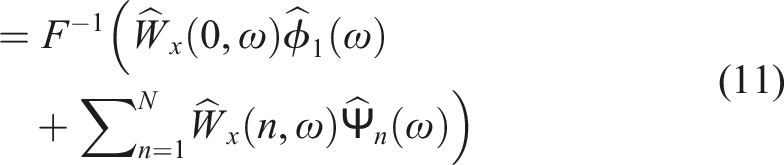
The approximation coefficients are given as




The improved EWT
The strategy of improved EWT
The strategy of improved EWT approach based on maximal spectrum technique and spectral skewnes is shown in Figure 1. Firstly, the structural response obtained from each location of measuring points contains different frequency components in the process of structural modal parameter identification. For example, there is no second-order frequency component in the theoretical response to the measuring point in the mid-span of a simply supported beam. The traditional frequency band division technology does not take into account the frequency band characteristics of all test points, resulting in modal misjudgment or loss. Therefore, this study takes the maximum value of whole frequencies after the Fourier transform of all test points as the bandwidth boundary to partition the input, rather than the Fourier transform of a single measurement point.
Then, due to the influence of environmental noise and other factors, the frequency band segmentation of traditional EWT is too subdivided, which can not be completely effective and accurate to divide meaningful frequency bands. Furthermore, an adaptive Fourier spectrum segmentation technique based on statistical characteristics of the spectral skewness index is proposed.
Finally, the proposed segmentation technique replans the segmentation boundary according to the statistical characteristics of the Fourier spectrum, so as to make it more suitable for the physical characteristics of structural vibration signals. Hilbert transform and random decrement technique (RDT) (Bedrosian, 1963; Ibrahim, 1977; Zhi et al., 2021) will be employed to identify structural modal parameters. Flow chart of the proposed improved EWT approach.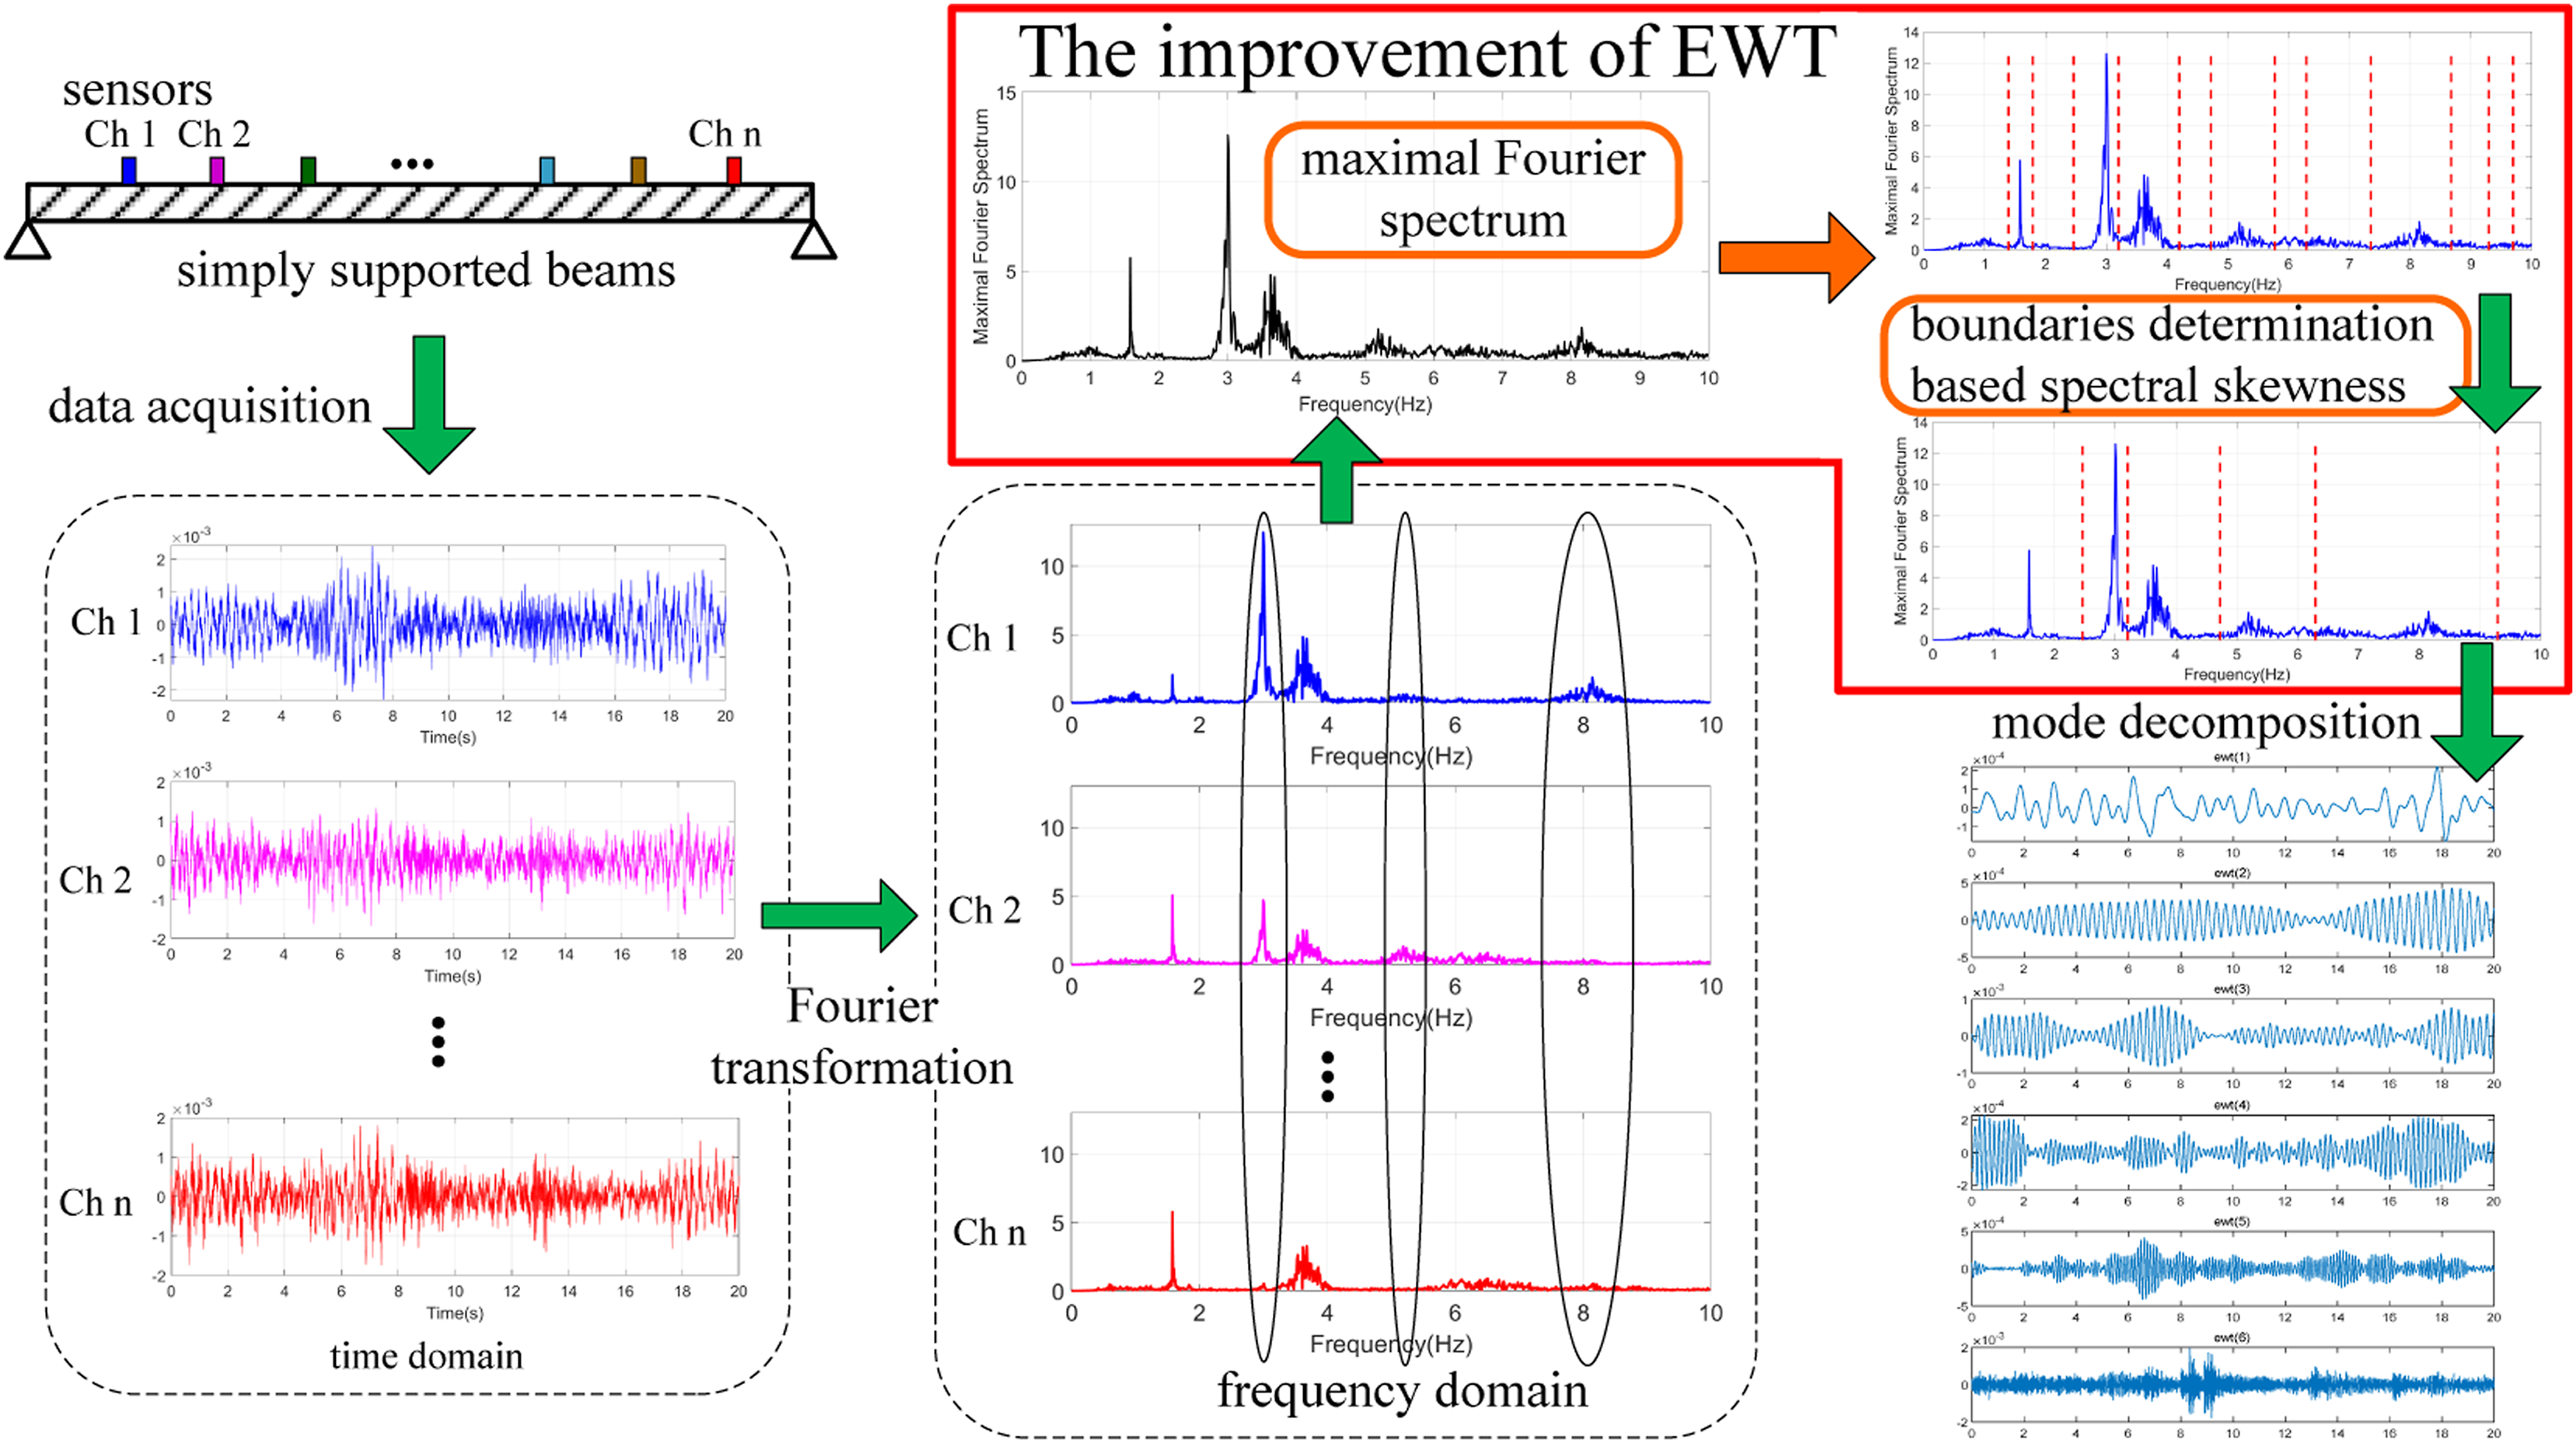
Improvement of segmentation of the fourier spectrum
The purpose of mode decomposition is to extract signals from different frequency segments separately. The difficulty lies in how to select the frequency range of interest. In the EWT method, the adaptive division of the Fourier spectrum is a very important step. The original EWT is a division of the Fourier spectrum of a specified input signal. In the structural modal test analysis, it is not necessarily possible to obtain all the modal frequency information effectively from the Fourier spectrum in one measuring point. However, all the signals arranged in different positions according to the test can generally contain the more important modal frequency information in the structure. Therefore, the information of the whole measuring points needs to be considered. In this study, the maximum value of the Fourier spectrum of these measuring points is taken as the basis for determining the boundary of the EWT spectrum division. The EWT calculation of any measurement point adopts a unified Fourier spectrum to divide the boundary, which is convenient for subsequent random decrement for modal analysis.
Assuming that there are m measuring points in a structural modal test, the time series data acquired by the data acquisition system are respectively

It can be obtained that the N points Fourier transform of each measuring data is

Due to the noise in the experiment, the spectrum division of traditional EWT may have many invalid components, or the same component may be divided into two parts, Gilles etc. (Gilles, 2013; Deng and Liu, 2018) changed the Fourier spectrum into a function in the scale space representation, and proposed three methods based on probability, Otsu's, and k-Means to obtain meaningful patterns from the scale space function. The first method needs to manually define the number of components; the second method needs to manually set the initial boundary, and there are more human interventions; the third method does not require any parameters and is adaptive. The spectrum segmentation method based on the scale space function increases the adaptability of the empirical wavelet transform, but also increases the number of boundaries, which means that the invalid components will increase.
The Fourier spectrum of the noise signal is chaotic and has no obvious rules, and the occurrence probability of its spectrum amplitude generally presents a normal distribution. If the signal contains a sinusoidal signal, the probability of occurrence of the spectrum amplitude will be biased to one side. Therefore, this study uses spectral skewness as a digital feature index reflecting the asymmetry of the amplitude statistical distribution to judge whether there is real frequency information in any frequency band. The spectral skewness is the 3rd statistical value and measures the symmetry of the spectrum around its arithmetic mean. Peeters et al. (2011) took spectral skewness as a descriptor of musical signals. Lerch (2012) used spectral skewness to characterize the ear signals perceptual attributes. The feature will be zero for silent segments and high for voiced speech where substantial energy is present around the fundamental frequency. Garima et al. (2020) summarized the spectral skewness was used in mood detection and music genre classification, fault detection in motor bearings and Parkinson’s disease detection from speech.
Given a random variable, its skewness calculation formula is, Skewness calculation. (a) Spectrum of a sinusoidal signal with noise, (b) Histogram and skewness, (c) Spectrum of a noise signal and (d) Histogram and skewness.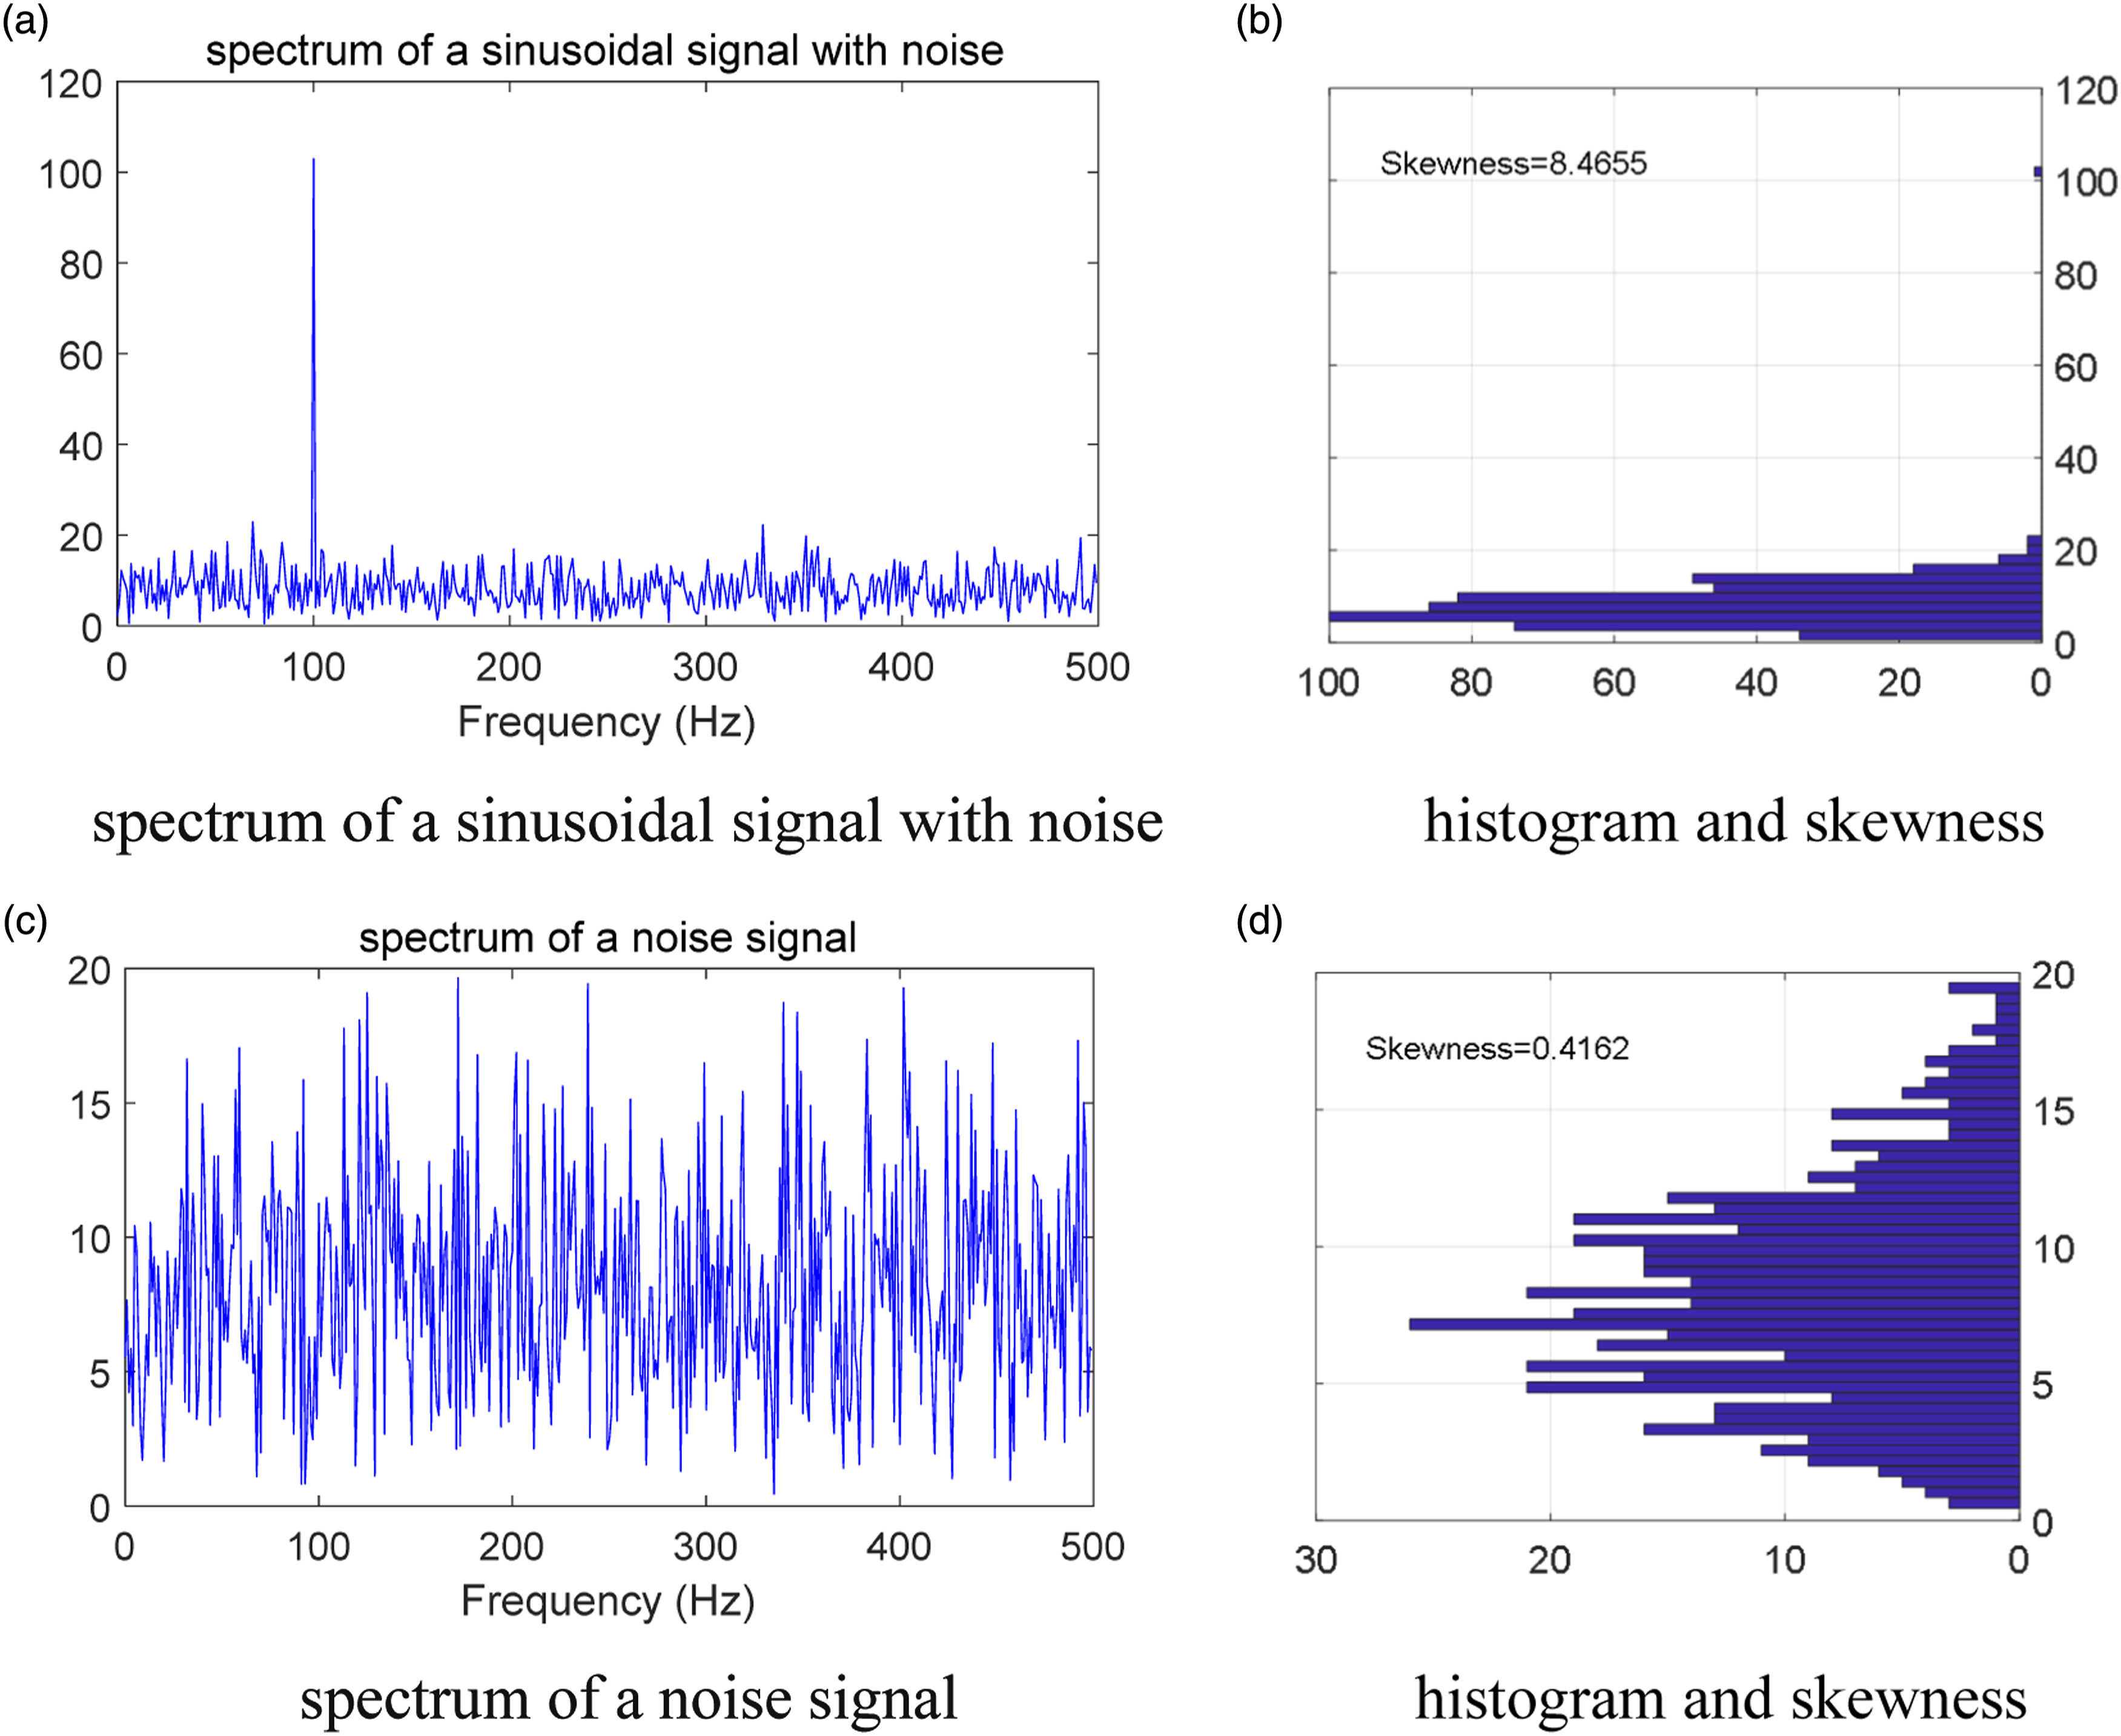

In modal analysis, the frequency spectrum of test data usually can clearly reflect the frequency characteristics of each order mode, that is, there is a peak near the natural frequency, and the frequency spectrum has narrow-band characteristics. If each order frequency component is divided on the frequency spectrum, then each divided part will be skewed in a certain direction relative to the histogram distribution on the spectrum amplitude. Generally, useful information exists in the frequency band with large skewness. Small ones can be regarded as noise components. Therefore, on the basis of traditional EWT spectrum adaptive division, the skewness index is used to judge whether there is actual physical frequency information in the divided components. Therefore, the spectral skewness of each division is calculated based on the existing frequency boundaries in original EWT method. If the skewness is larger than a threshold, the corresponding component is considered to have structural physical information, and its boundary is recorded. The new boundary takes the middle value of two adjacent record boundaries, so that the entire spectrum can be divided according to meaningful information, avoiding the separated components as noise signals. The specific algorithm flowchart is given in Figure 3: Flowchart of the improved EWT band division based on spectral skewness index.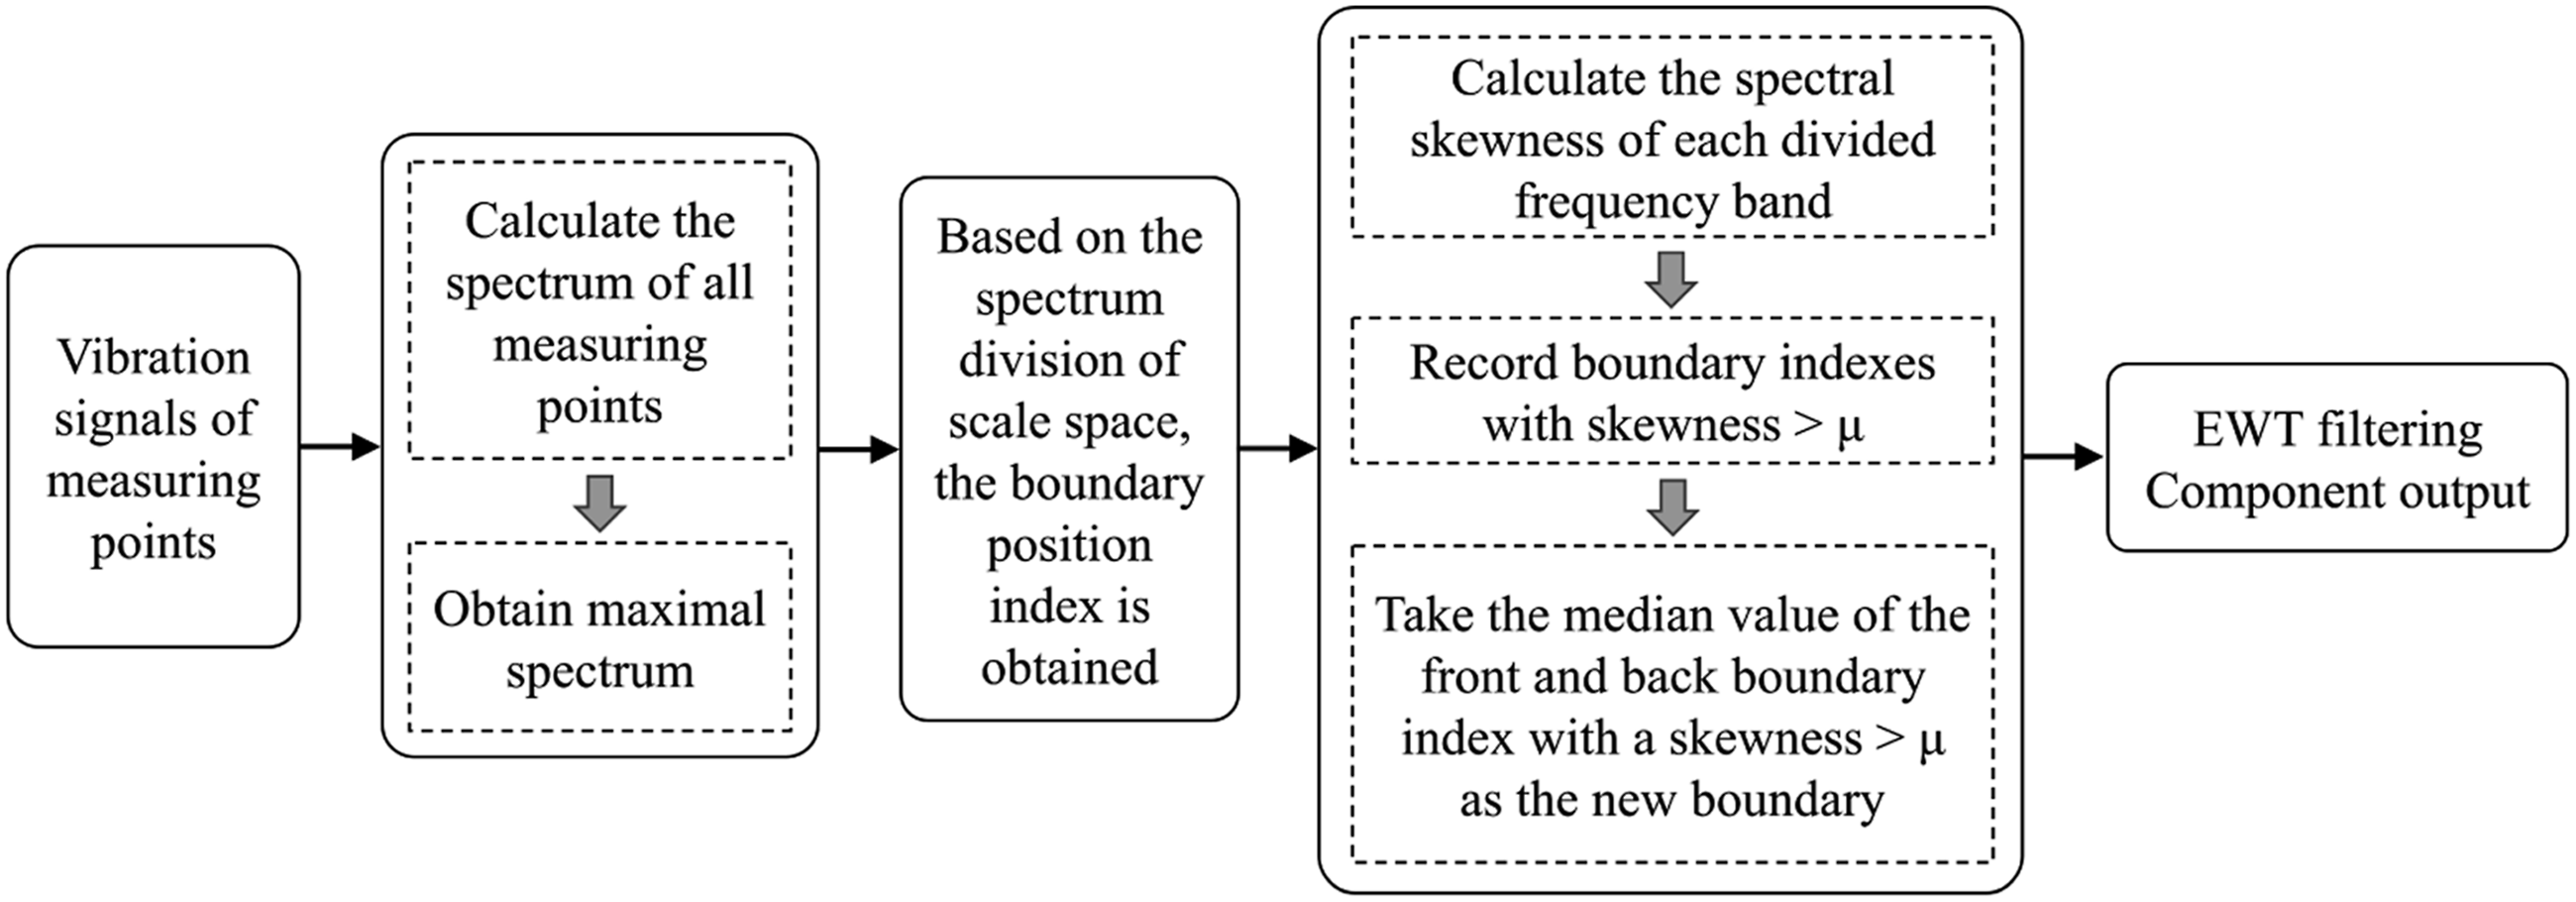
Operational modal identification
For a linear system with n degrees-of-freedom, the equation of motion can be described as follows,


The vibration function of a single-degree-of-freedom system can be expressed as


Numerical study
A three-layer frame with a linear time-invariant structure is regarded as a system with three degrees of freedom, as shown in Figure 4(a). White noise is used to excite the bottom of the structure. The sampling rate is set to 200 Hz and the duration is 20 s. Taking the acceleration response Dynamic time history analysis of a three-layer frame. (a) A three-layer frame structure and (b) The acceleration response The traditional spectrum division methods. (a) Spectrum division based on the local maxima and minima and (b) Spectrum division based on the Otsu algorithm.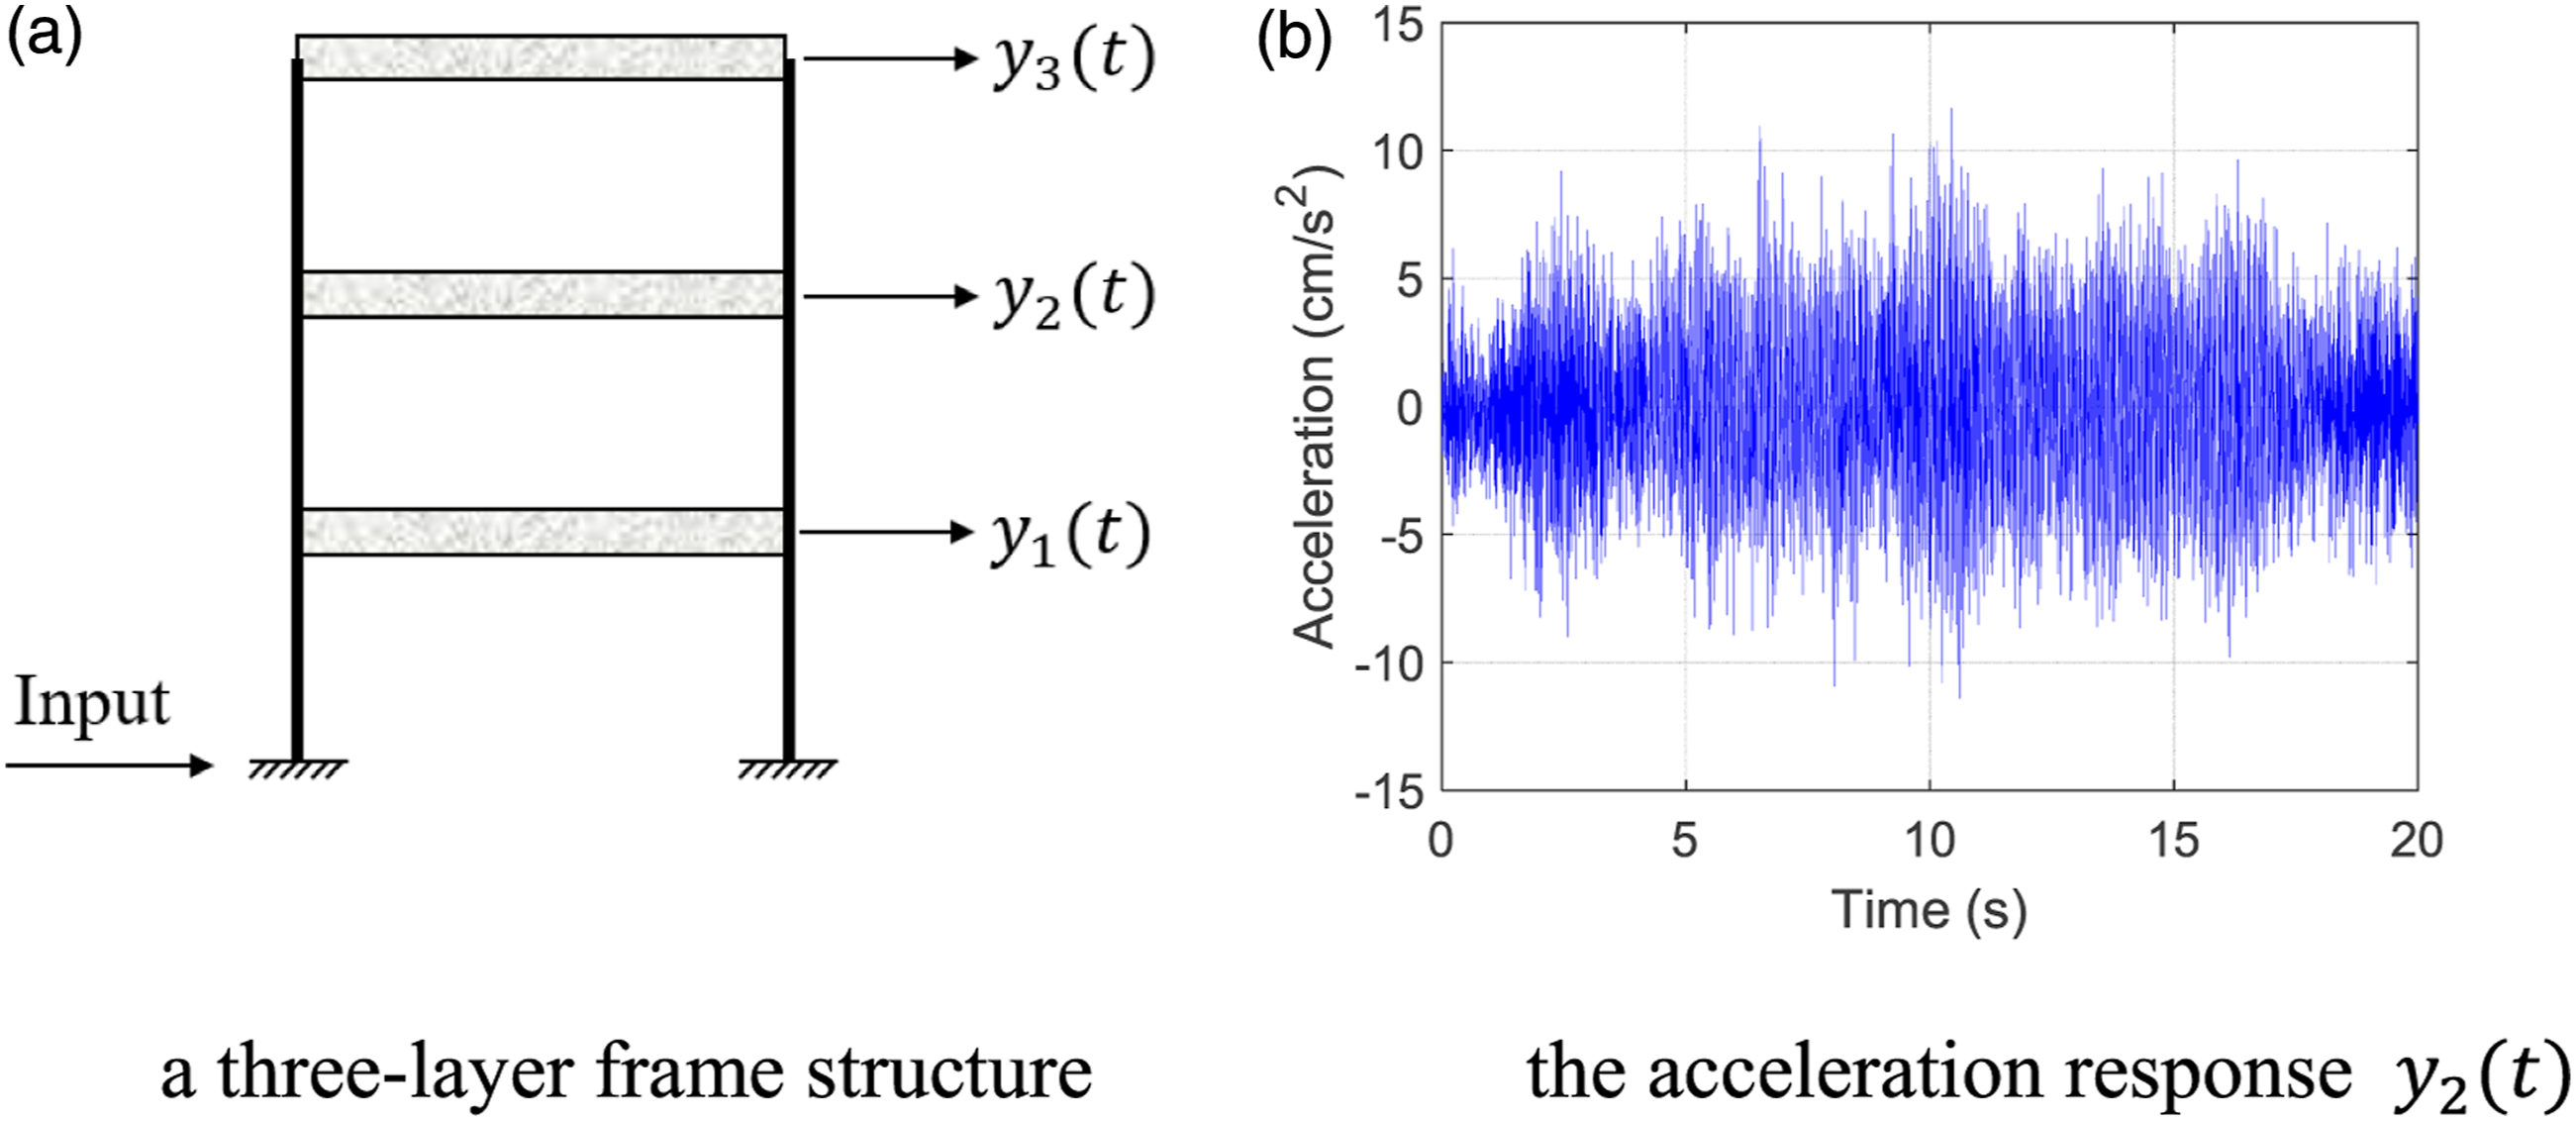
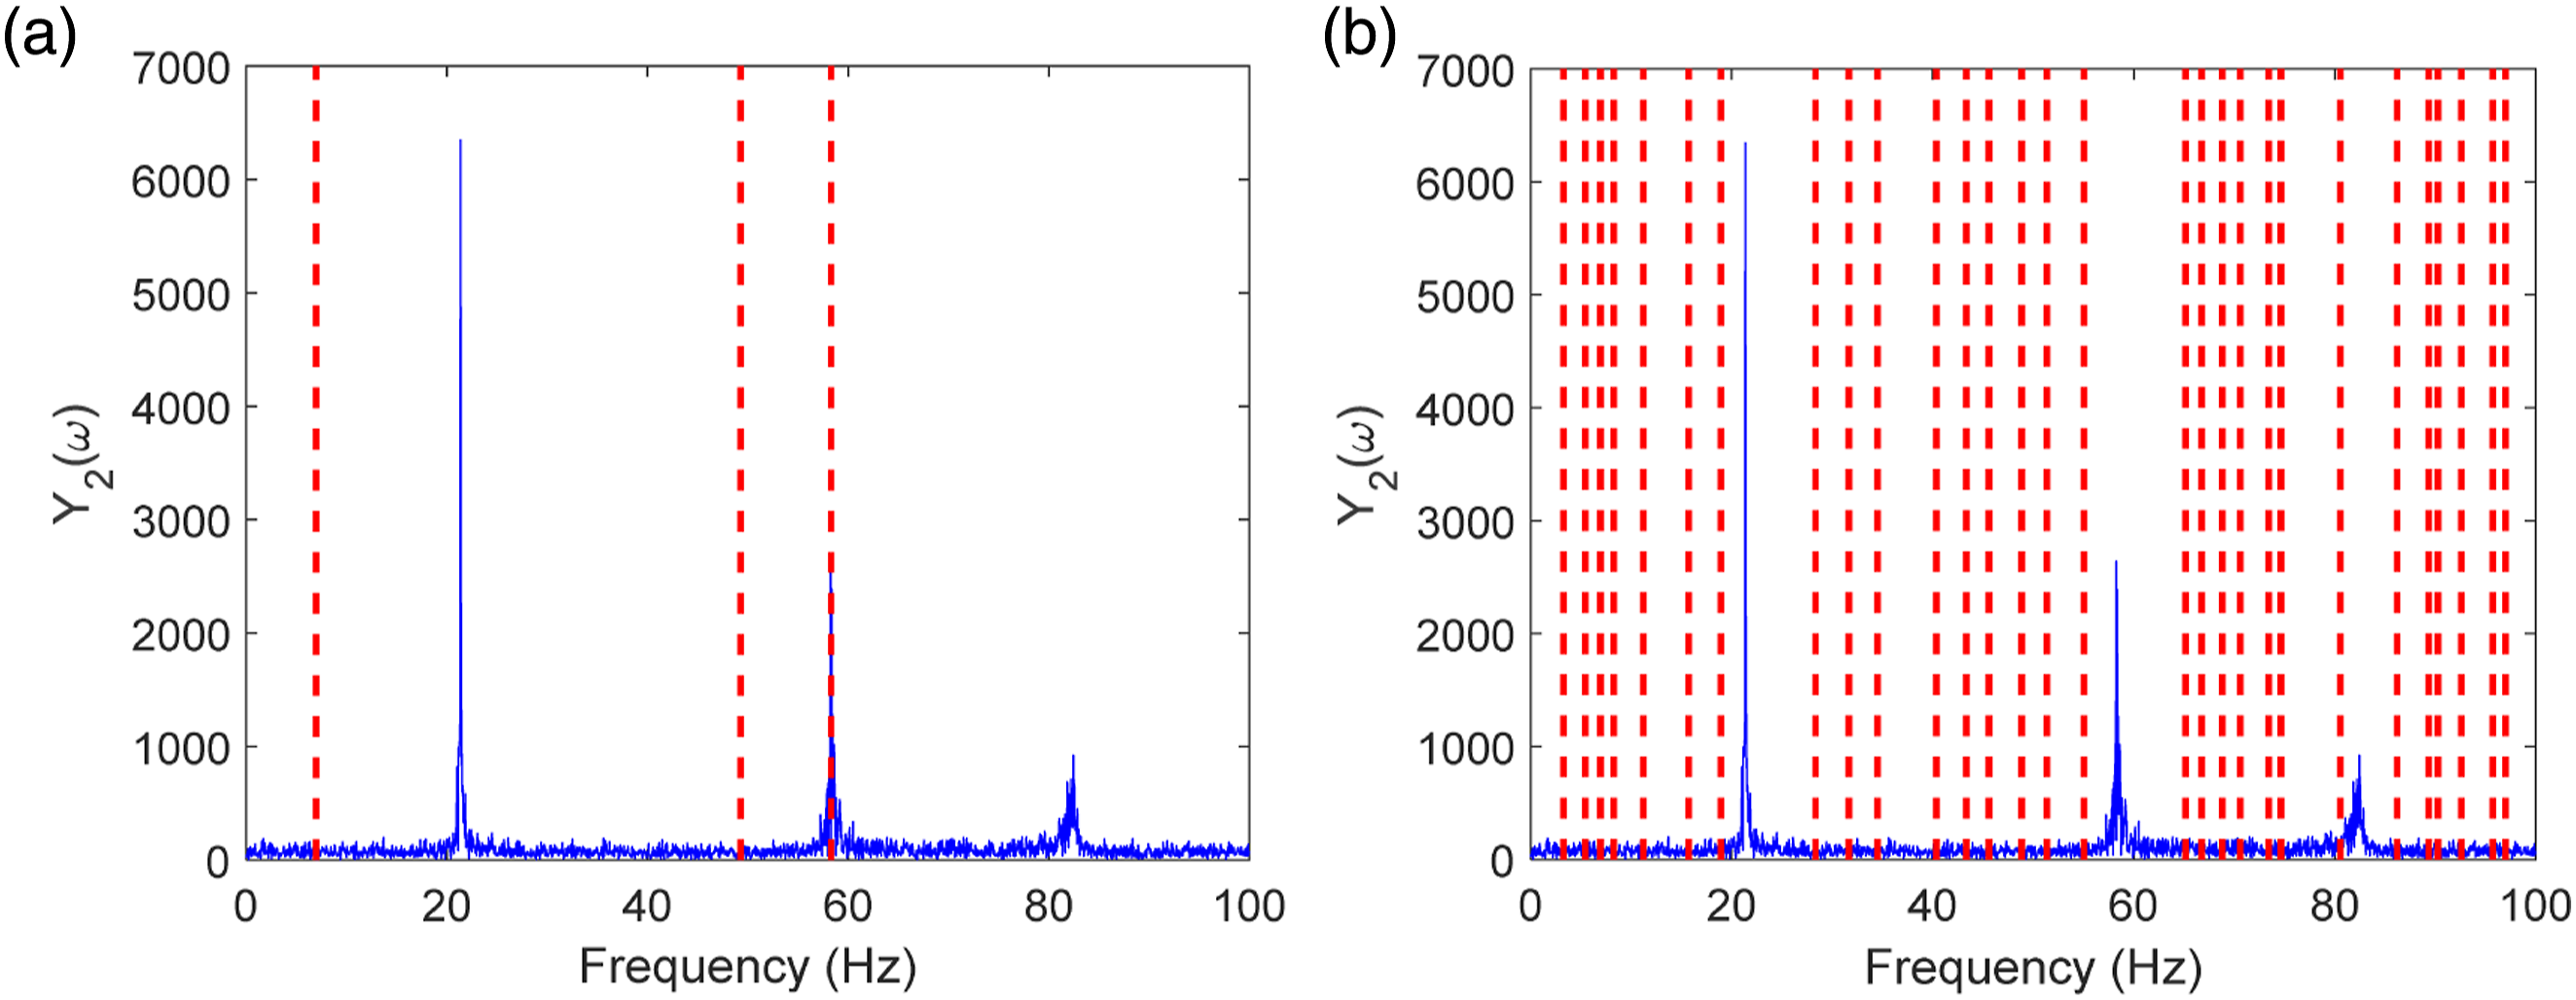
The Fourier spectrum of the signal is transformed into the scale space, and then the frequency band segmentation result of based on the Otsu algorithm with the scale space function is shown in Figure 5(b). The adaptive frequency band division of the signal spectrum can select the optimal threshold by maximizing the inter-class variance
If the three signals Frequency band division based on traditional EWT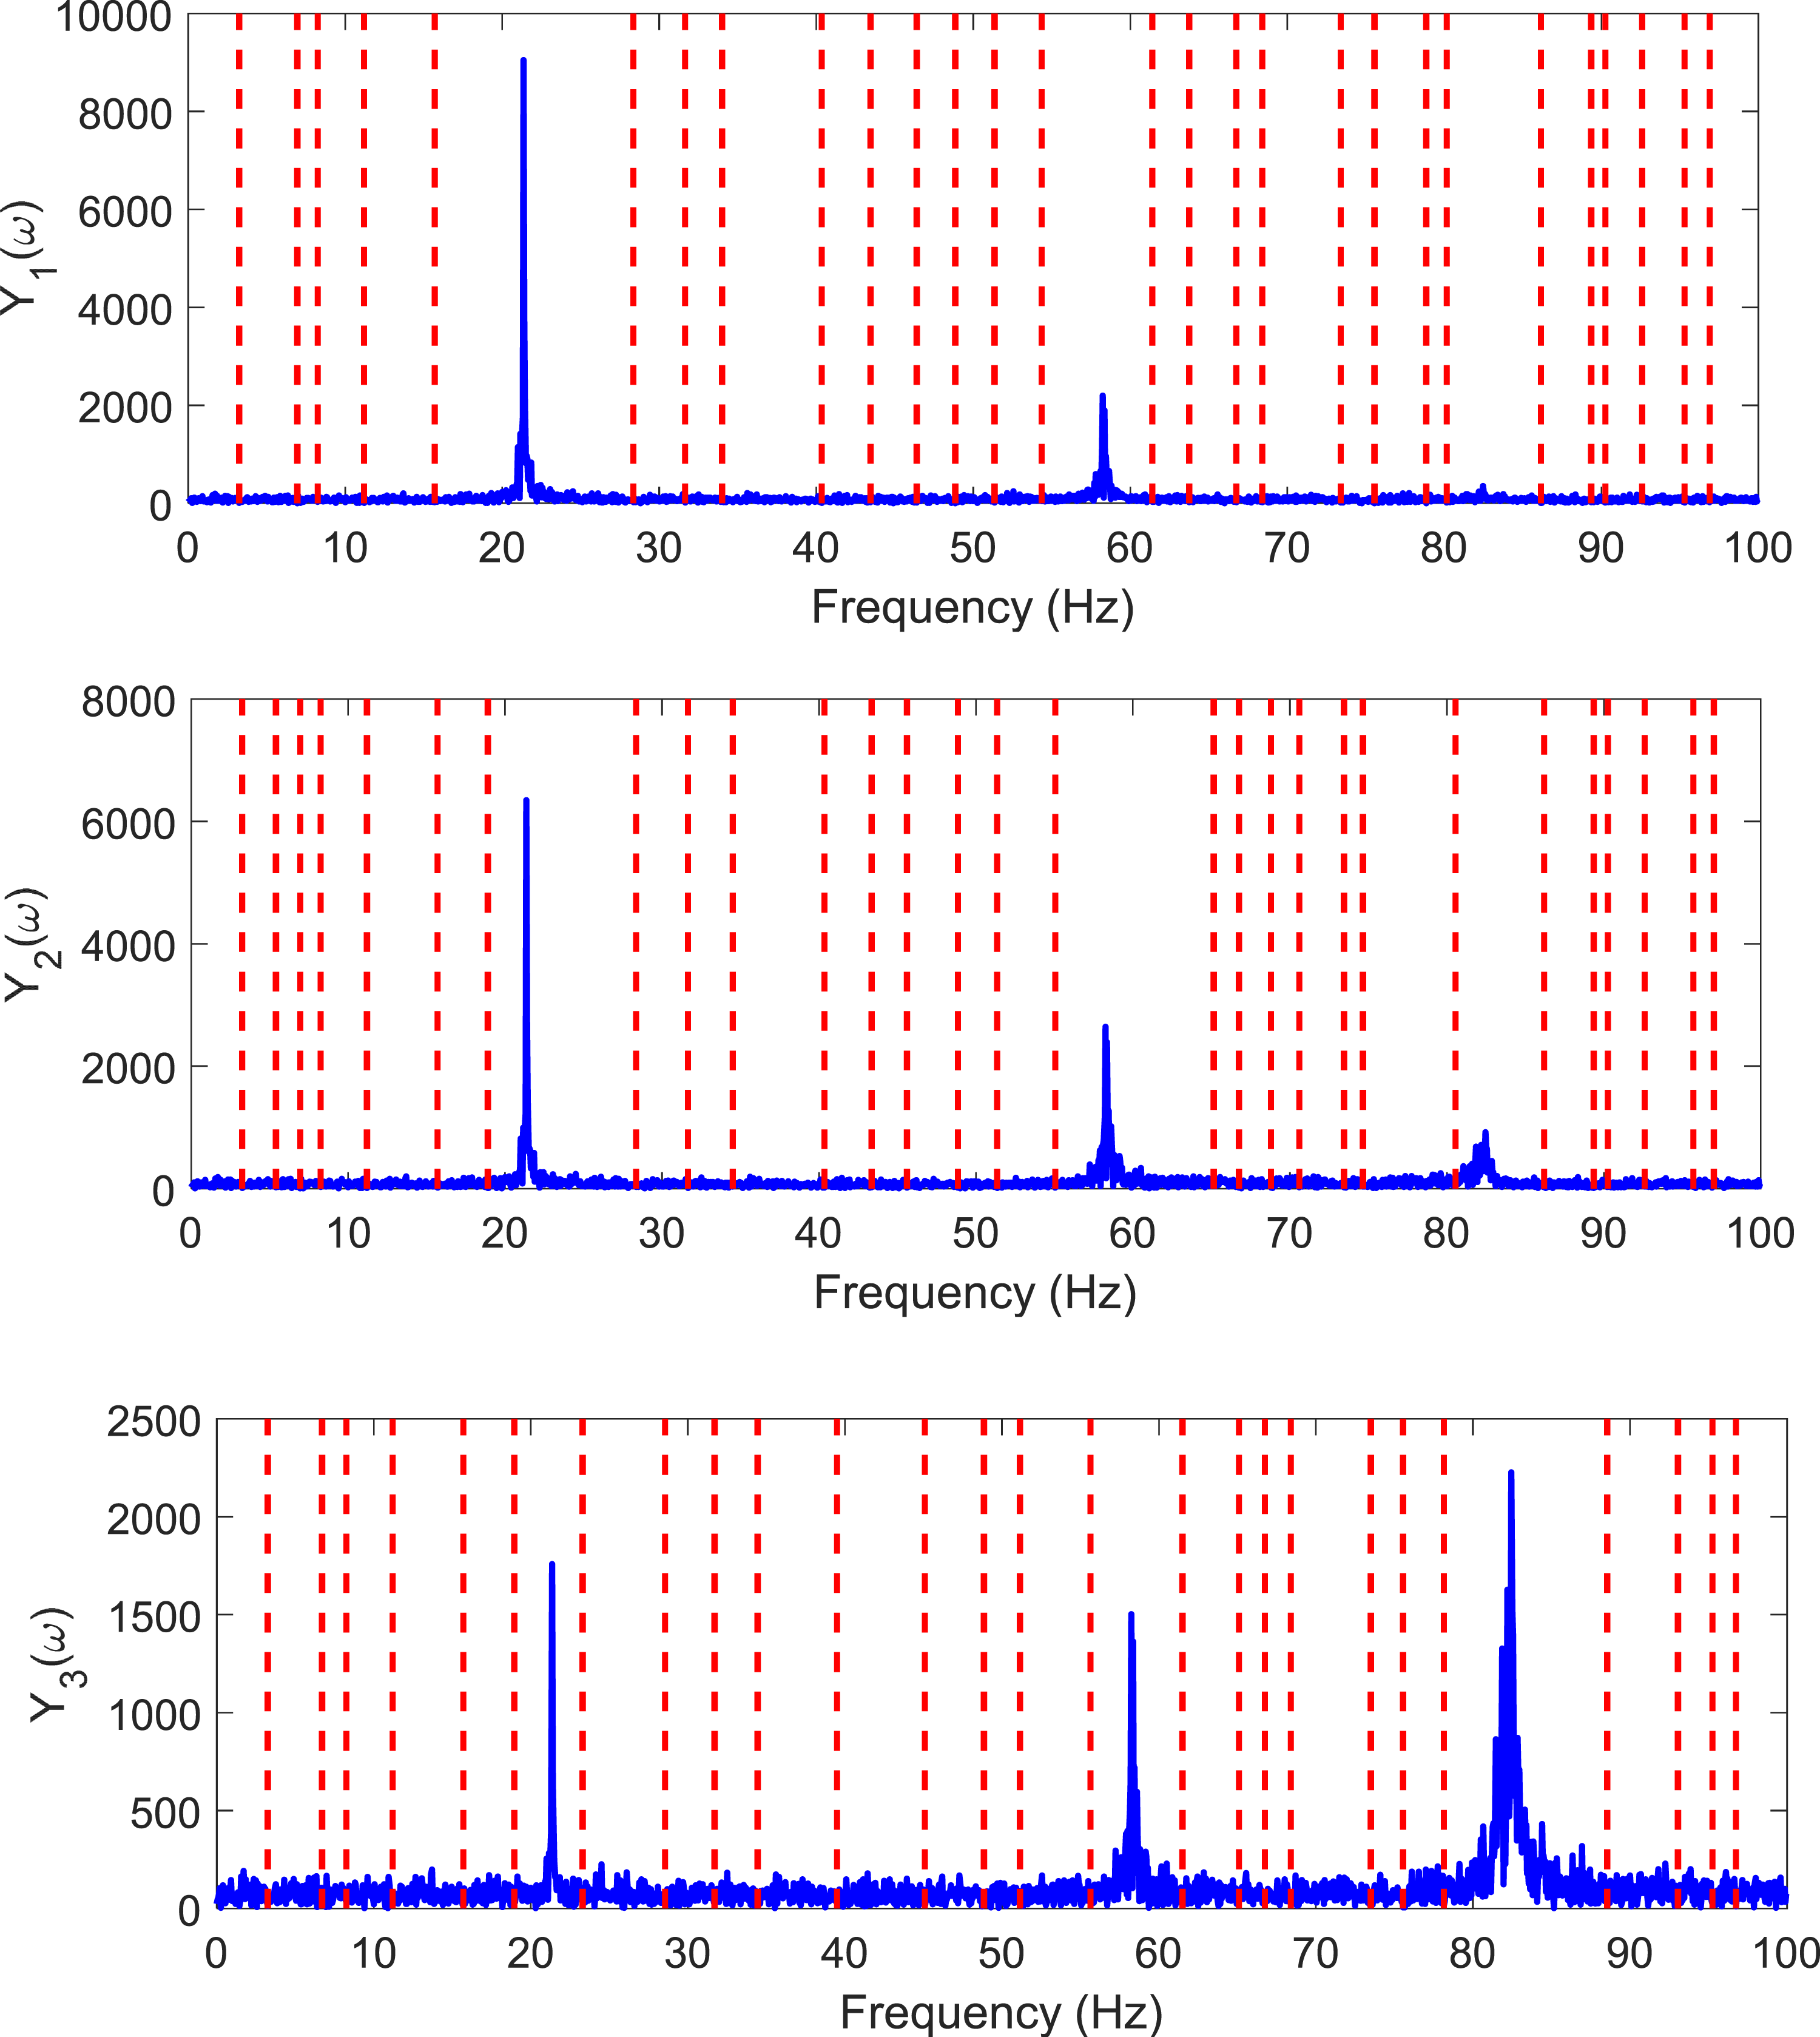
According to the improved frequency band segmentation method mentioned above: First, the maximum value is taken from the Fourier spectrum of the signals of the three measuring points, which is used as the basis for determining the boundary of the EWT spectrum division. Then, the skewness index (set to 1.3) is used to eliminate the boundary of invalid components, and obtain the unified boundary of all measuring points, and obtain the result in Figure 7(a). Using this unified boundary, the time-history signals of each component of the third-order frequency separated by EWT are shown in Figure 7(b). It can be seen that the improved frequency band division fully conforms to the physical characteristics of the third-order frequency of the three-layer frame structure, and also realizes the adaptive decomposition of vibration signals, which provides strong support for automatic extraction of structural information. The proposed spectrum division methods. (a) frequency band division result and (b) EWT components.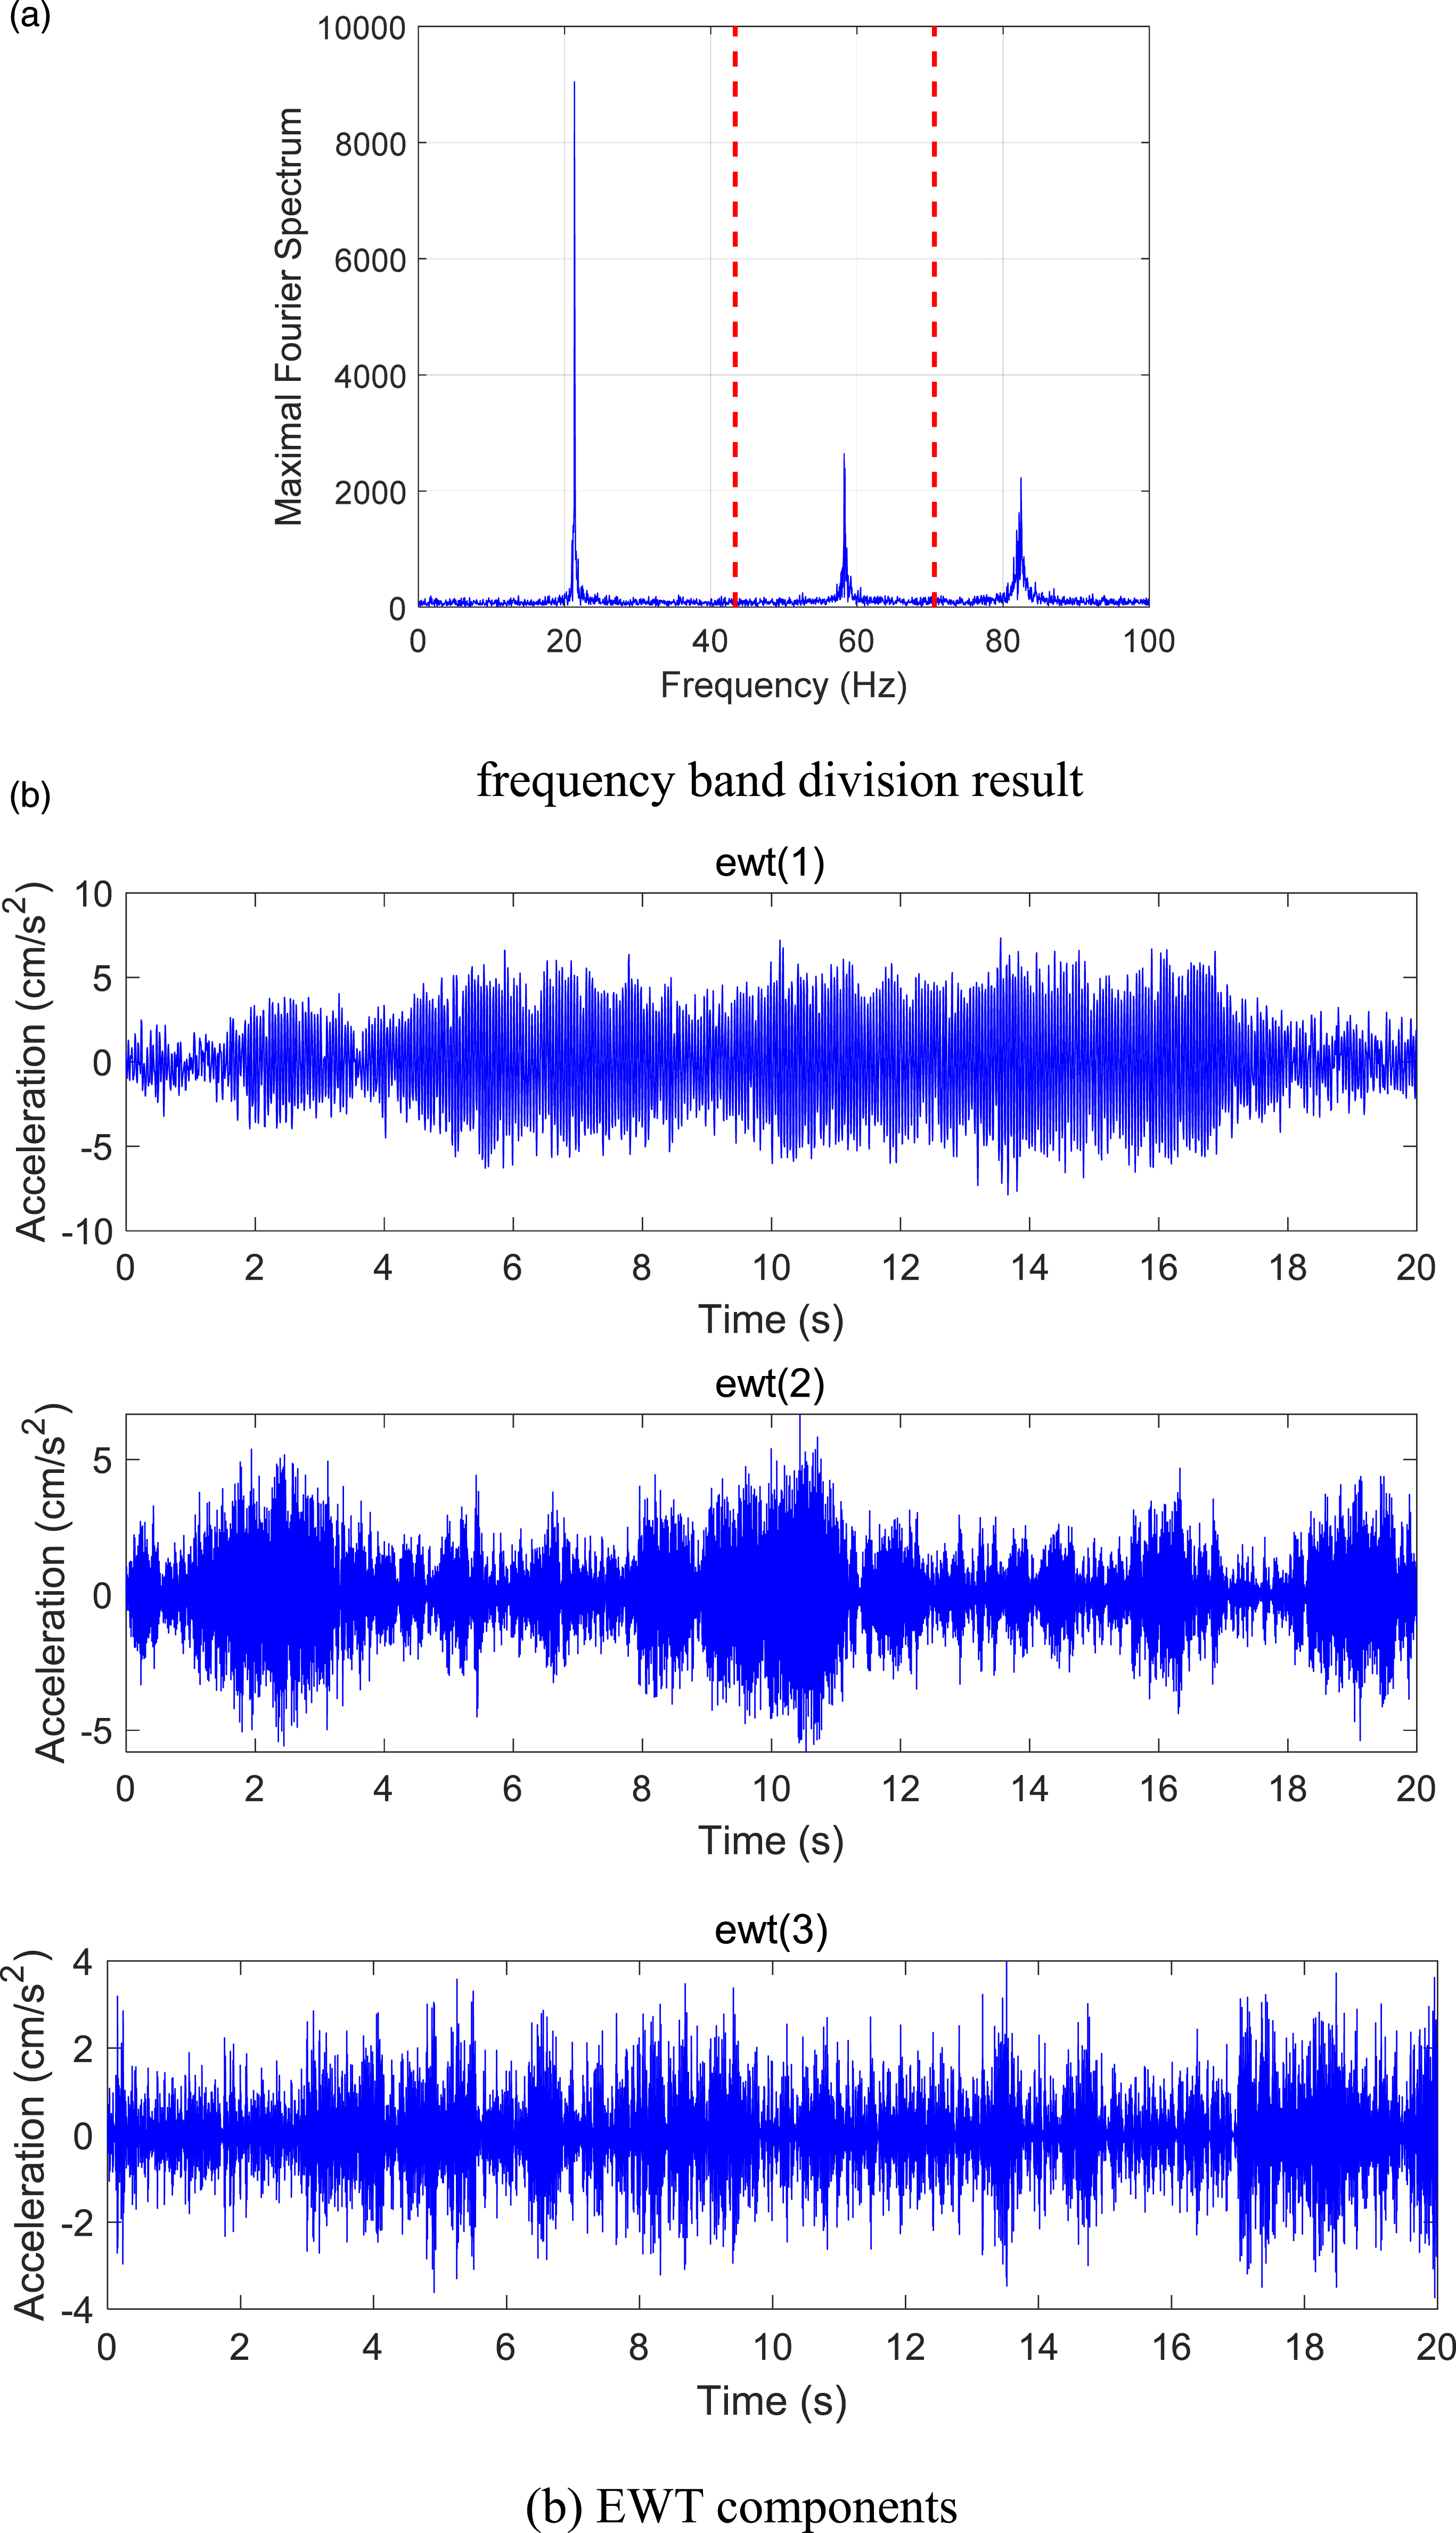
Verification on a three-span concrete box girder bridge
Description of the studied bridge and its field test
The investigated structure is a post-tensioned concrete box girder bridge with a main span of 85 m and two side spans of 53 m, as shown in Figure 8. It is continuous from one abutment to the other and the total length of the bridge is 191 m. The height of its main span box girder ranges from 2.4 m of mid-span to 5 m of central pier according to a second-order parabolic law. The cross-section of the girder is the single box and single chamber, and the width of the upper and bottom plate are 17.25 m and 8.75 m respectively. Main span piers are rectangular, solid reinforced concrete piers of 7.25 m long and 2.5 m wide. The piers between the main and ramp bridges are double-column piers with a diameter of 1.7 m. The studied bridge (Unit: cm). (a) Elevation view, (b) Bridge photo and (c) Cross-section.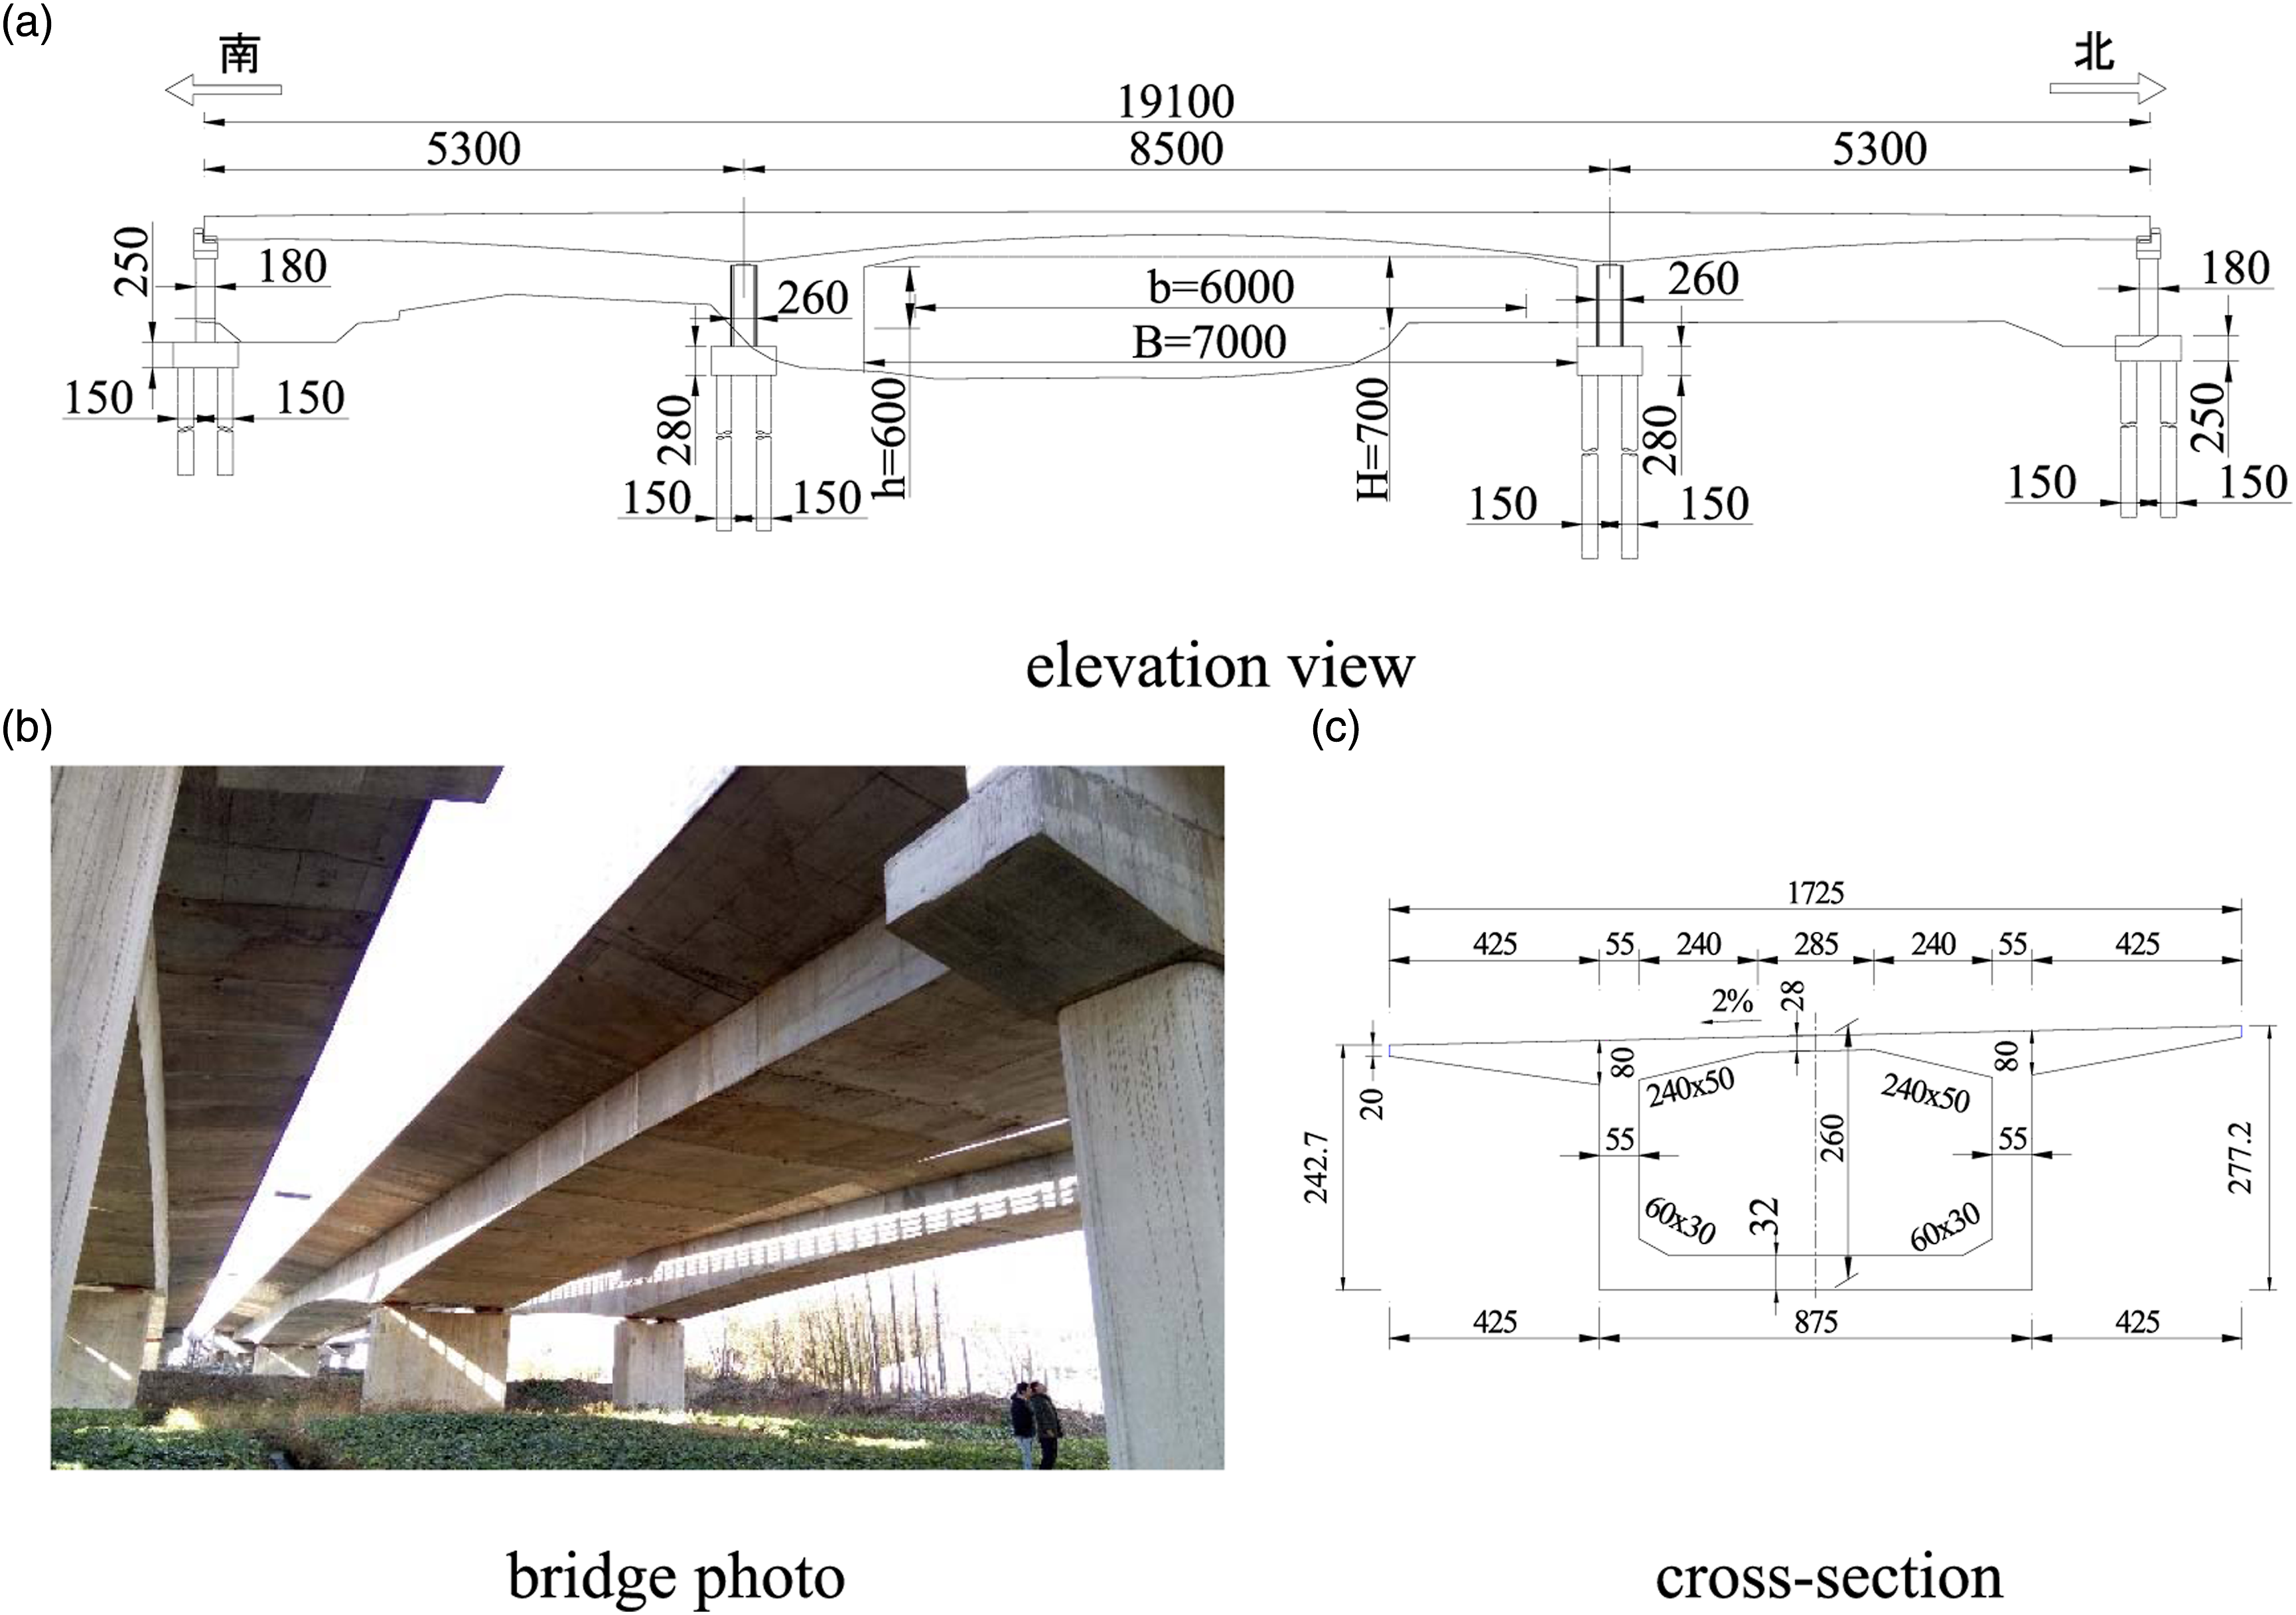
25 unidirectional PCB 393B04 accelerometers (ACC 01 ∼ 25) were placed on the bridge for vibration measurements as shown in Figure 9. An NI PXIe-1082 data acquisition instrument was used to collect the acceleration data. The sampling frequency for the entire field test was 1000 Hz. Ambient vibration test. (a) Sensor layout (unit: m) and (b) Field test.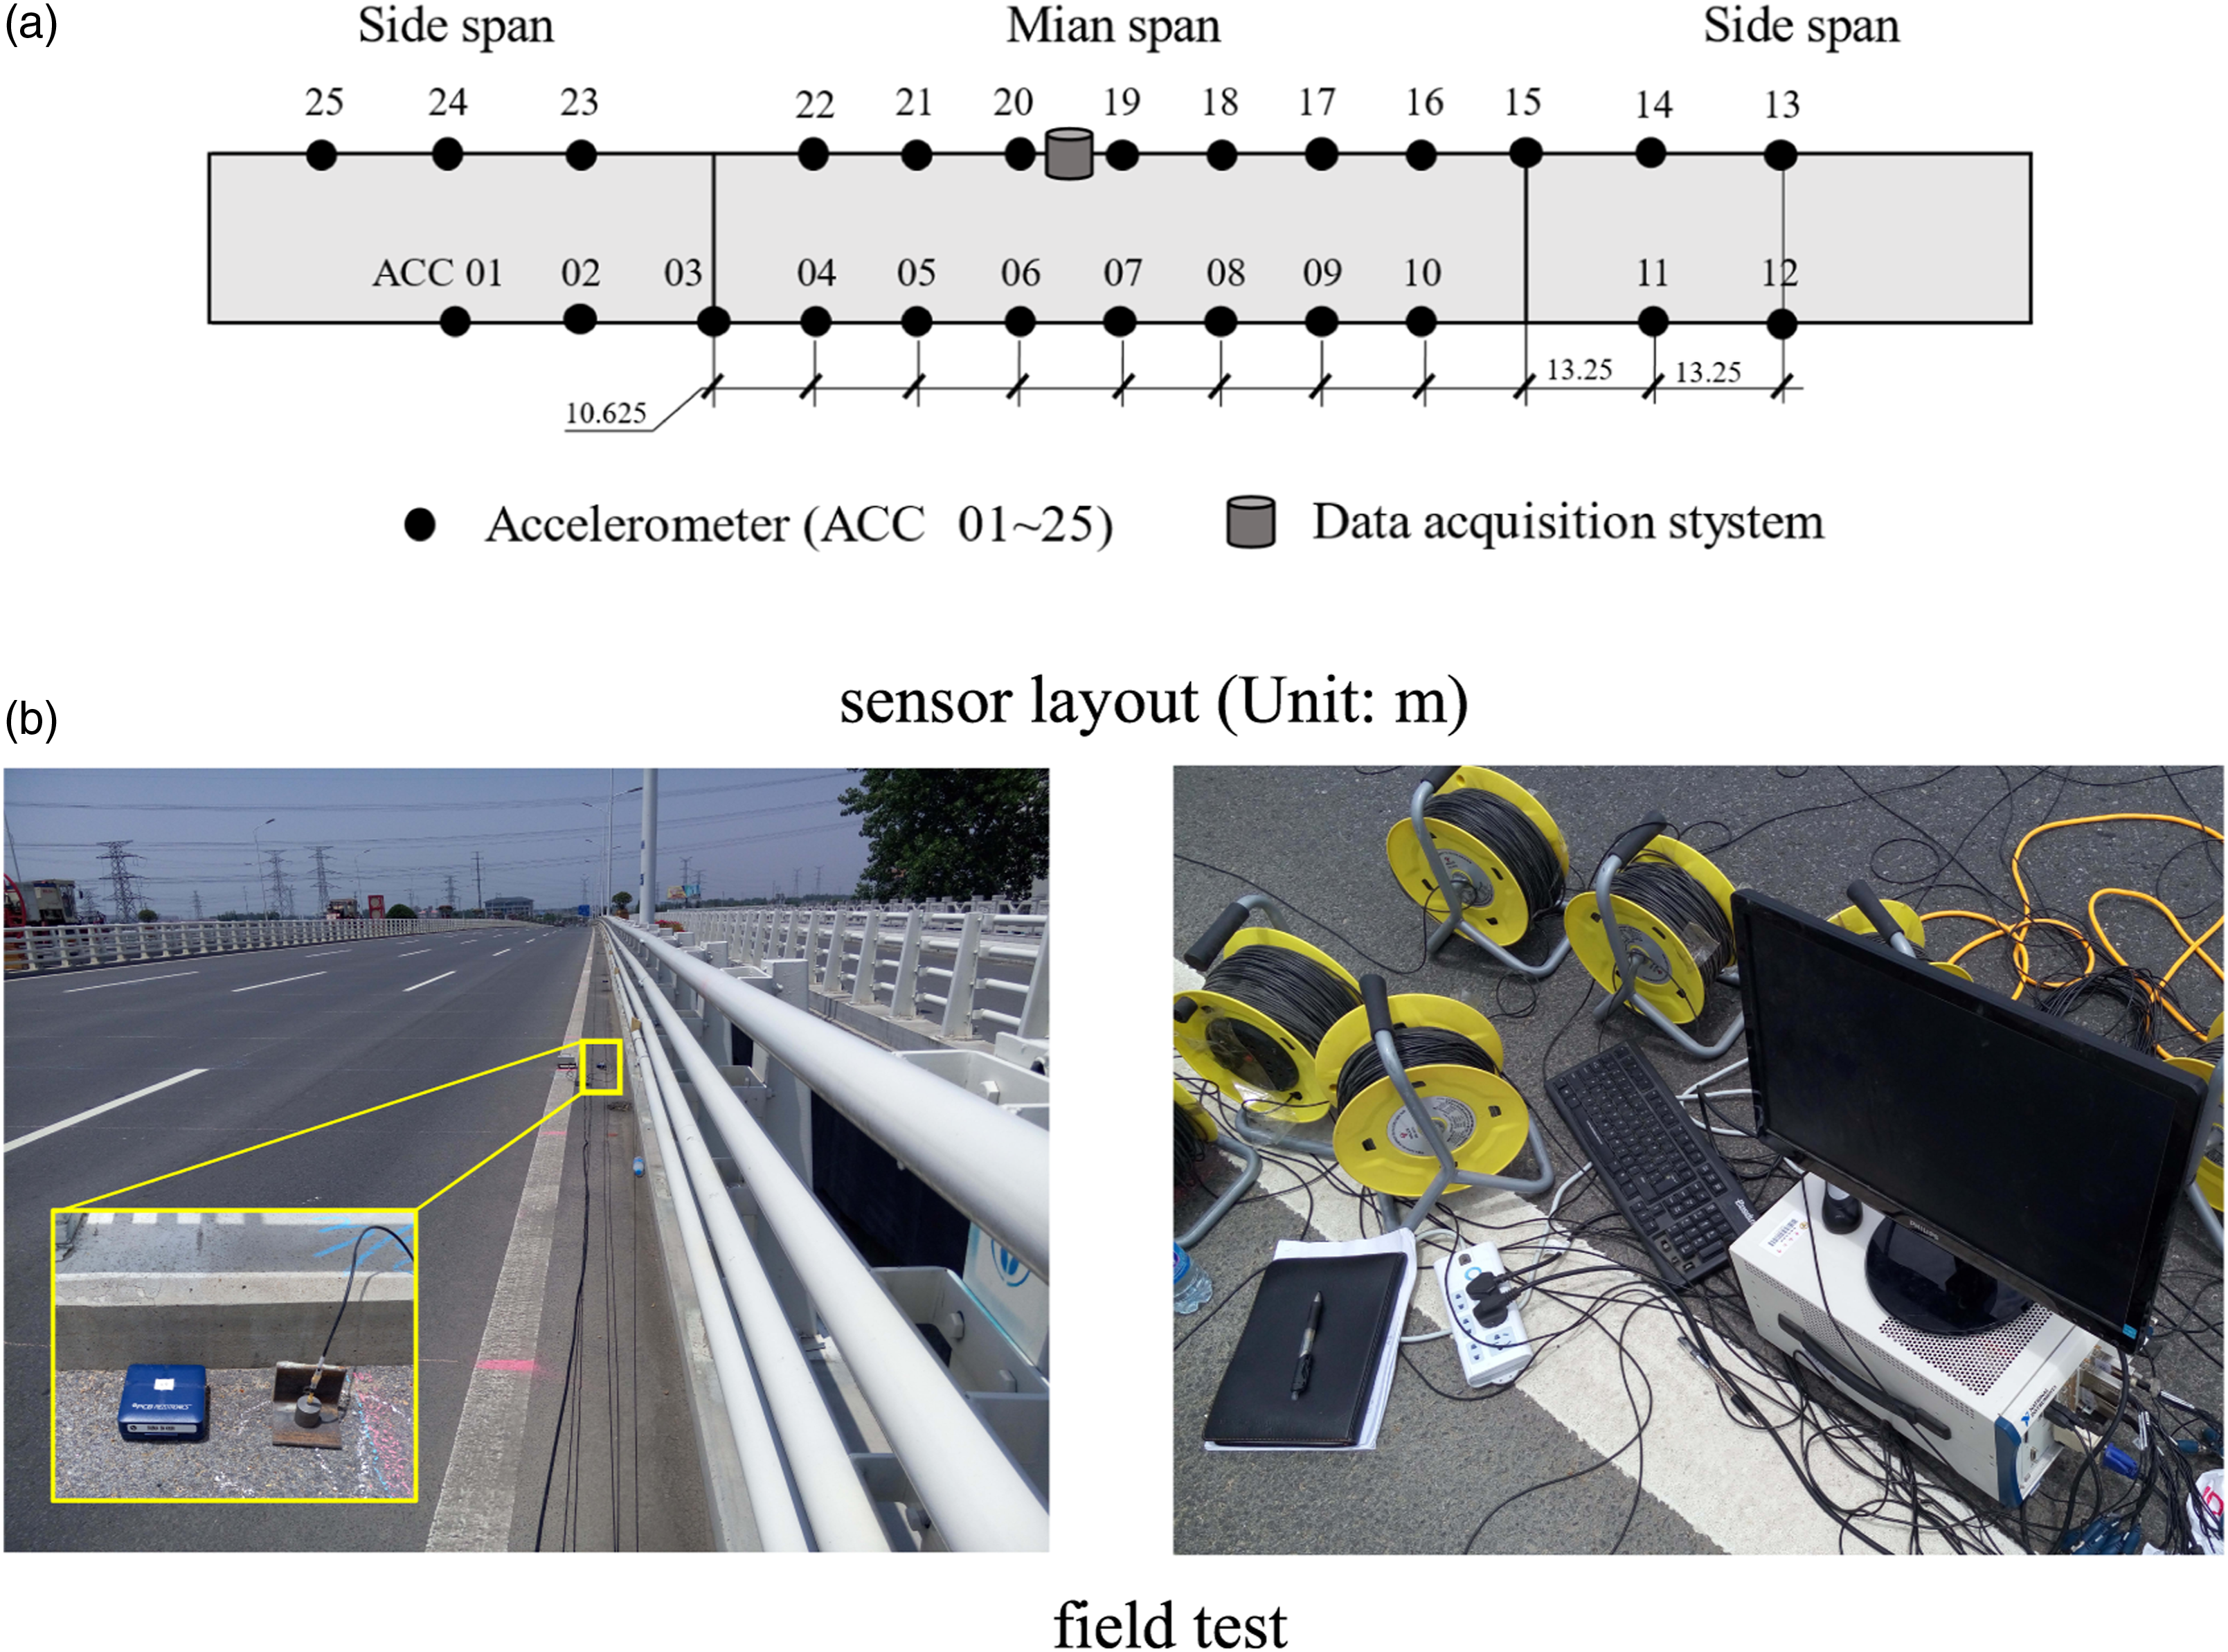
Spectrum division
The acceleration of the bridge deck under environmental excitation was collected on the morning of June 4, 2015, and the data recording time was about 20 min. Taking the ACC 20 measuring point as an example, the acceleration data collected by it is shown in Figure 10(a), and its corresponding magnitude spectrum under 40 Hz is shown in Figure 10(b). Acceleration and spectrum for ACC 20 sensor. (a) The acceleration response and (b) Frequency spectrum.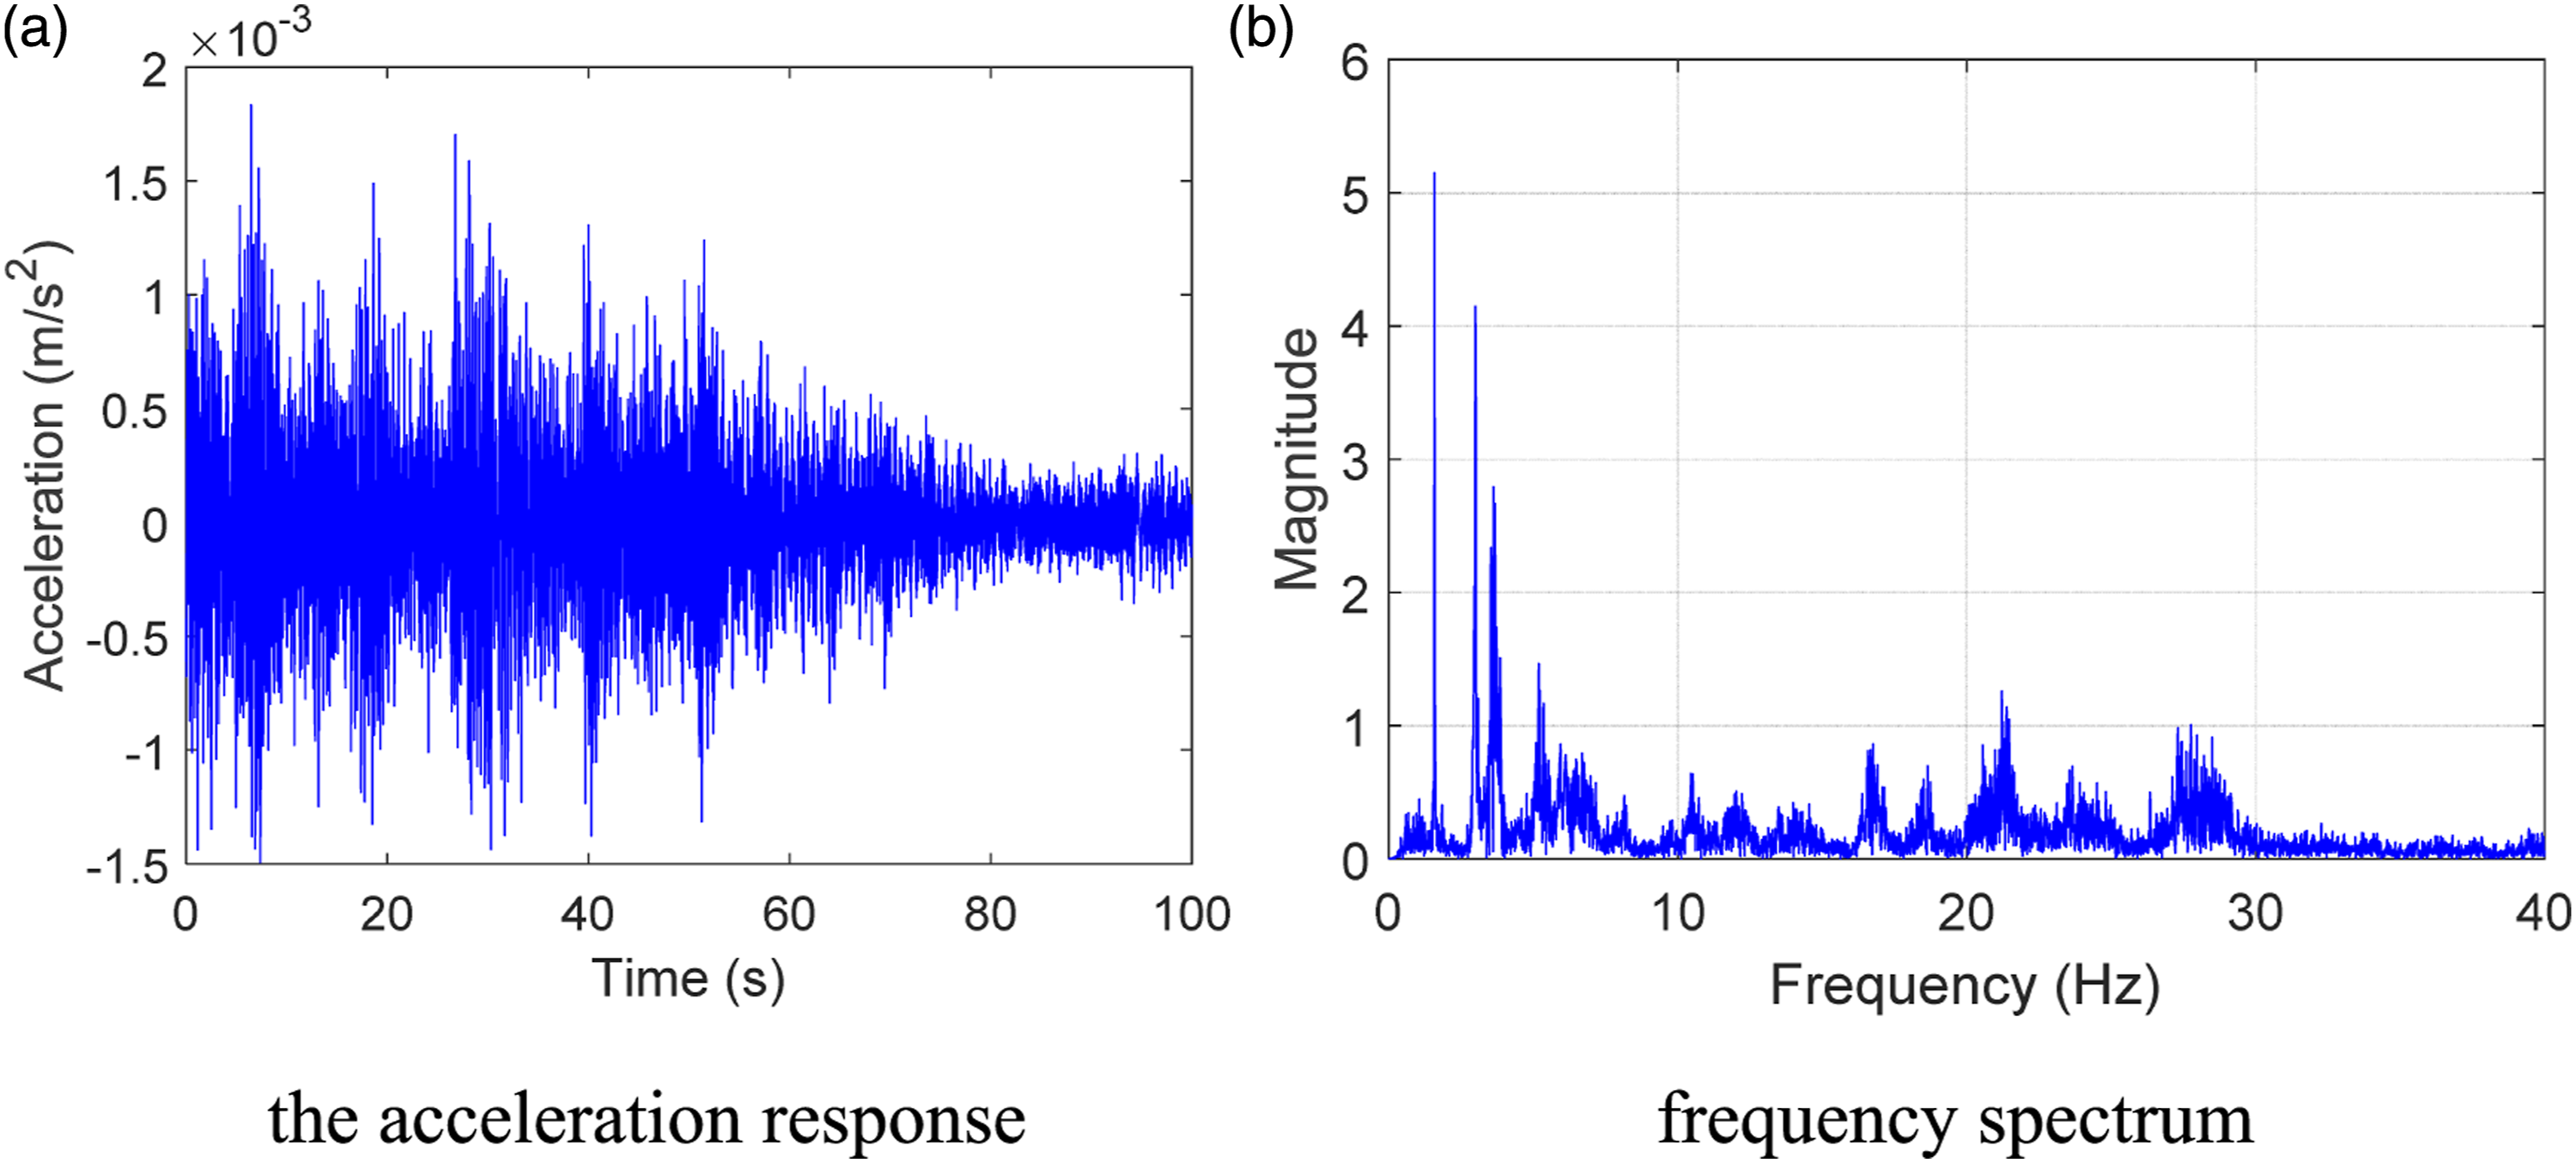
The proposed method is used to detect and divide the spectrum boundary, and focus on the information within 10 Hz. The maximal spectrum obtained from the spectra of 25 measurement points using equation (13) is divided into 11 frequency bands in the range of 0 to 10 Hz based on the general spectrum division method, as shown in Figure 11. Obviously, several frequency bands are only noise. Skewness is calculated for each frequency band. The frequency bands A, B, and C will be described as examples. Skewness calculation is performed after extracting the frequency band, and the result is shown in Figure 11. It can be seen that the skewness values of frequency bands A and B are larger, while the skewness value of frequency band C is smaller. Considering the presence of non-stationary noise in the engineering measurement data, a skewness threshold of 1.3 is set here. When the skewness value exceeds 1.3, it is considered as a meaningful signal; when it is less than 1.3, it is treated as a noise component and merged. Therefore, it can be judged that frequency bands A and B are structural modes, but frequency band C is not. Skewness calculation is performed on the remaining divided frequency bands, and then the frequency bands of the spectrum are re-divided, as shown in Figure 11. Spectrum segmentation in 100s.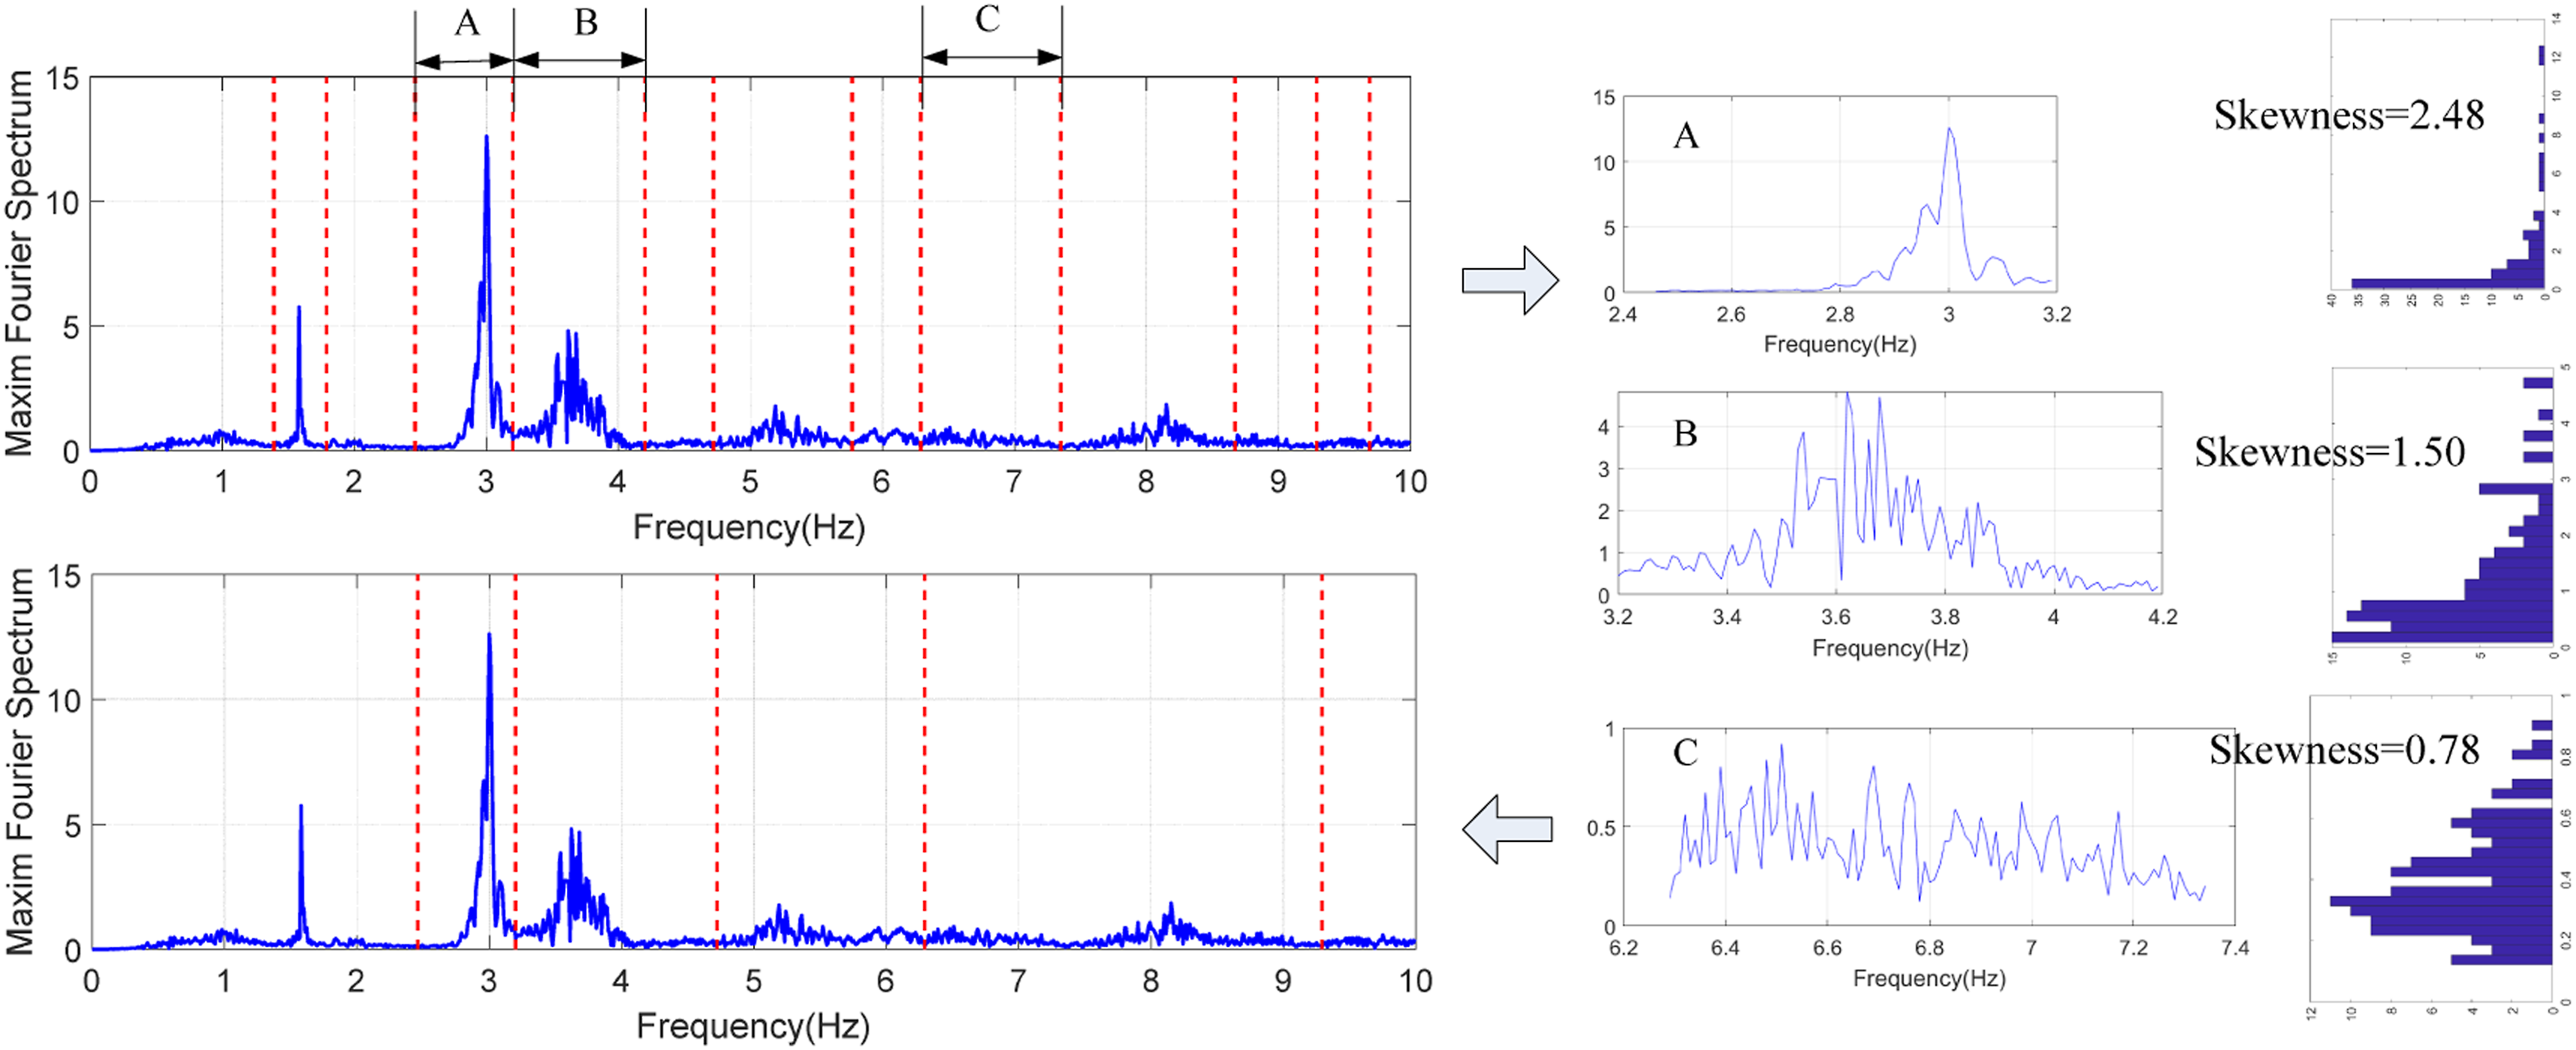
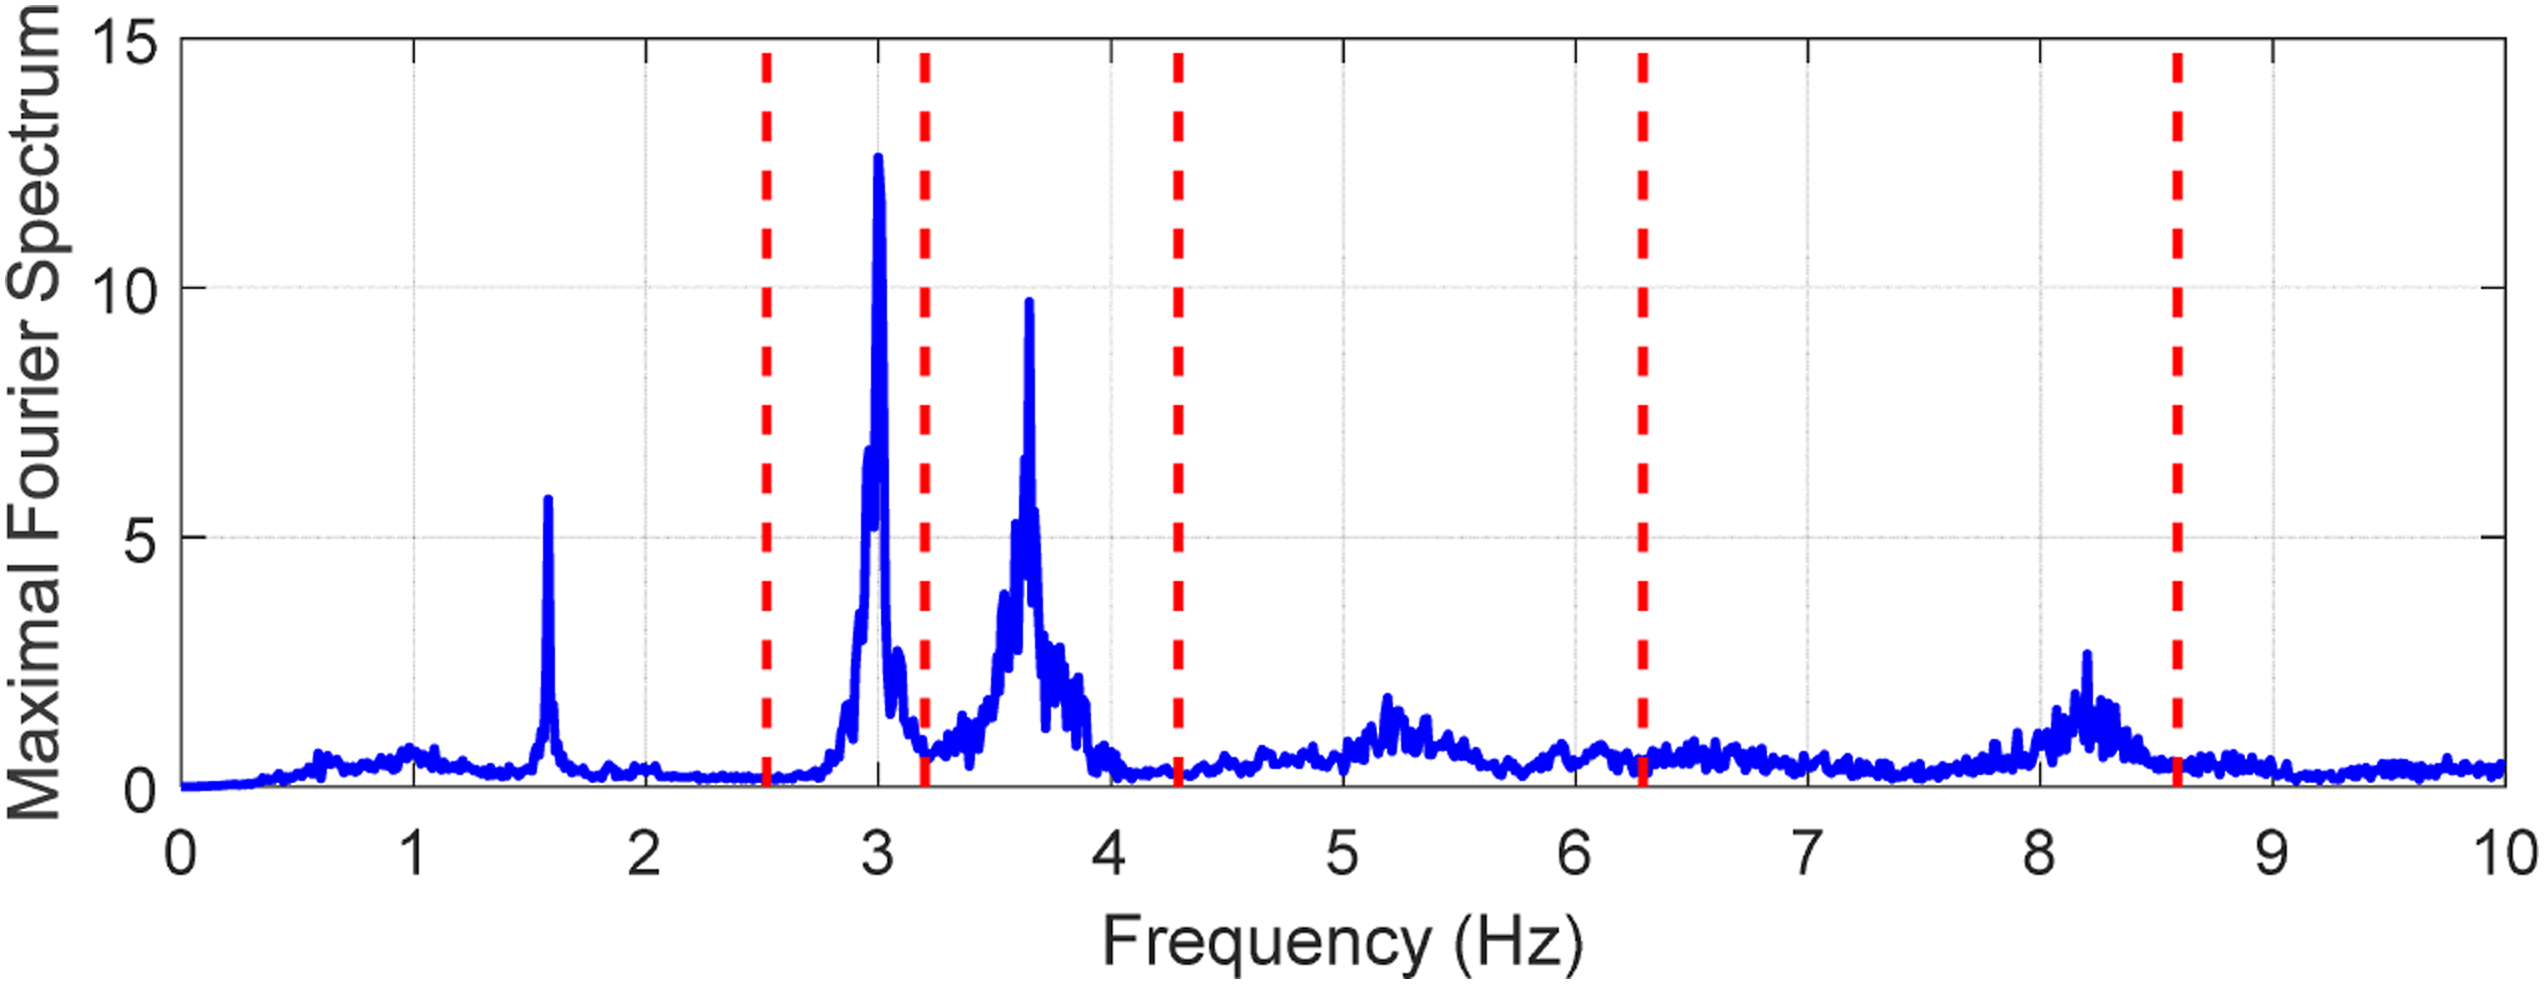
This study adopts maximal spectrum technique and spectral skewness to detect and divide the spectrum boundary. The impact of different data lengths is discussed as follows: The data with 300 s is selected to demonstrate the effectiveness of this method as shown in Figure 12. The same frequency resolution consistent with the analysis of the previous 100 s is adopted to perform on all measurement points based on the Discrete Fourier Transform. The maximum of frequency spectrum was taken as the object of the EWT boundary partition. At the same time, skewness threshold still takes 1.3 as the index to determine the boundary. The result of boundary segmentation is shown in Figure 13. It can be seen that the spectrum dividing line is slightly different from the 100s data analysis results in Figure 11, and the 5 mode frequencies can be identified and segmented. In addition, the maximal spectrum of the 300s data is different from that of the 100 s data mainly at the 3rd order frequency, because the data collected in the field test may contain some form of non-stationarity. If the data is too short, the environmental excitation may not be able to activate all the structural modes of interest. If the data is too long, the computation cost is too large to conduct real-time online automatic identification. It is important to notice that (1) this study is mainly aimed at the linear time-invariant (LTI) system under stationary ambient excitation; (2) reasonable data length will be analyzed based on pre-processing. Acceleration for ACC 20 sensor in 300s. Spectrum segmentation in 300s.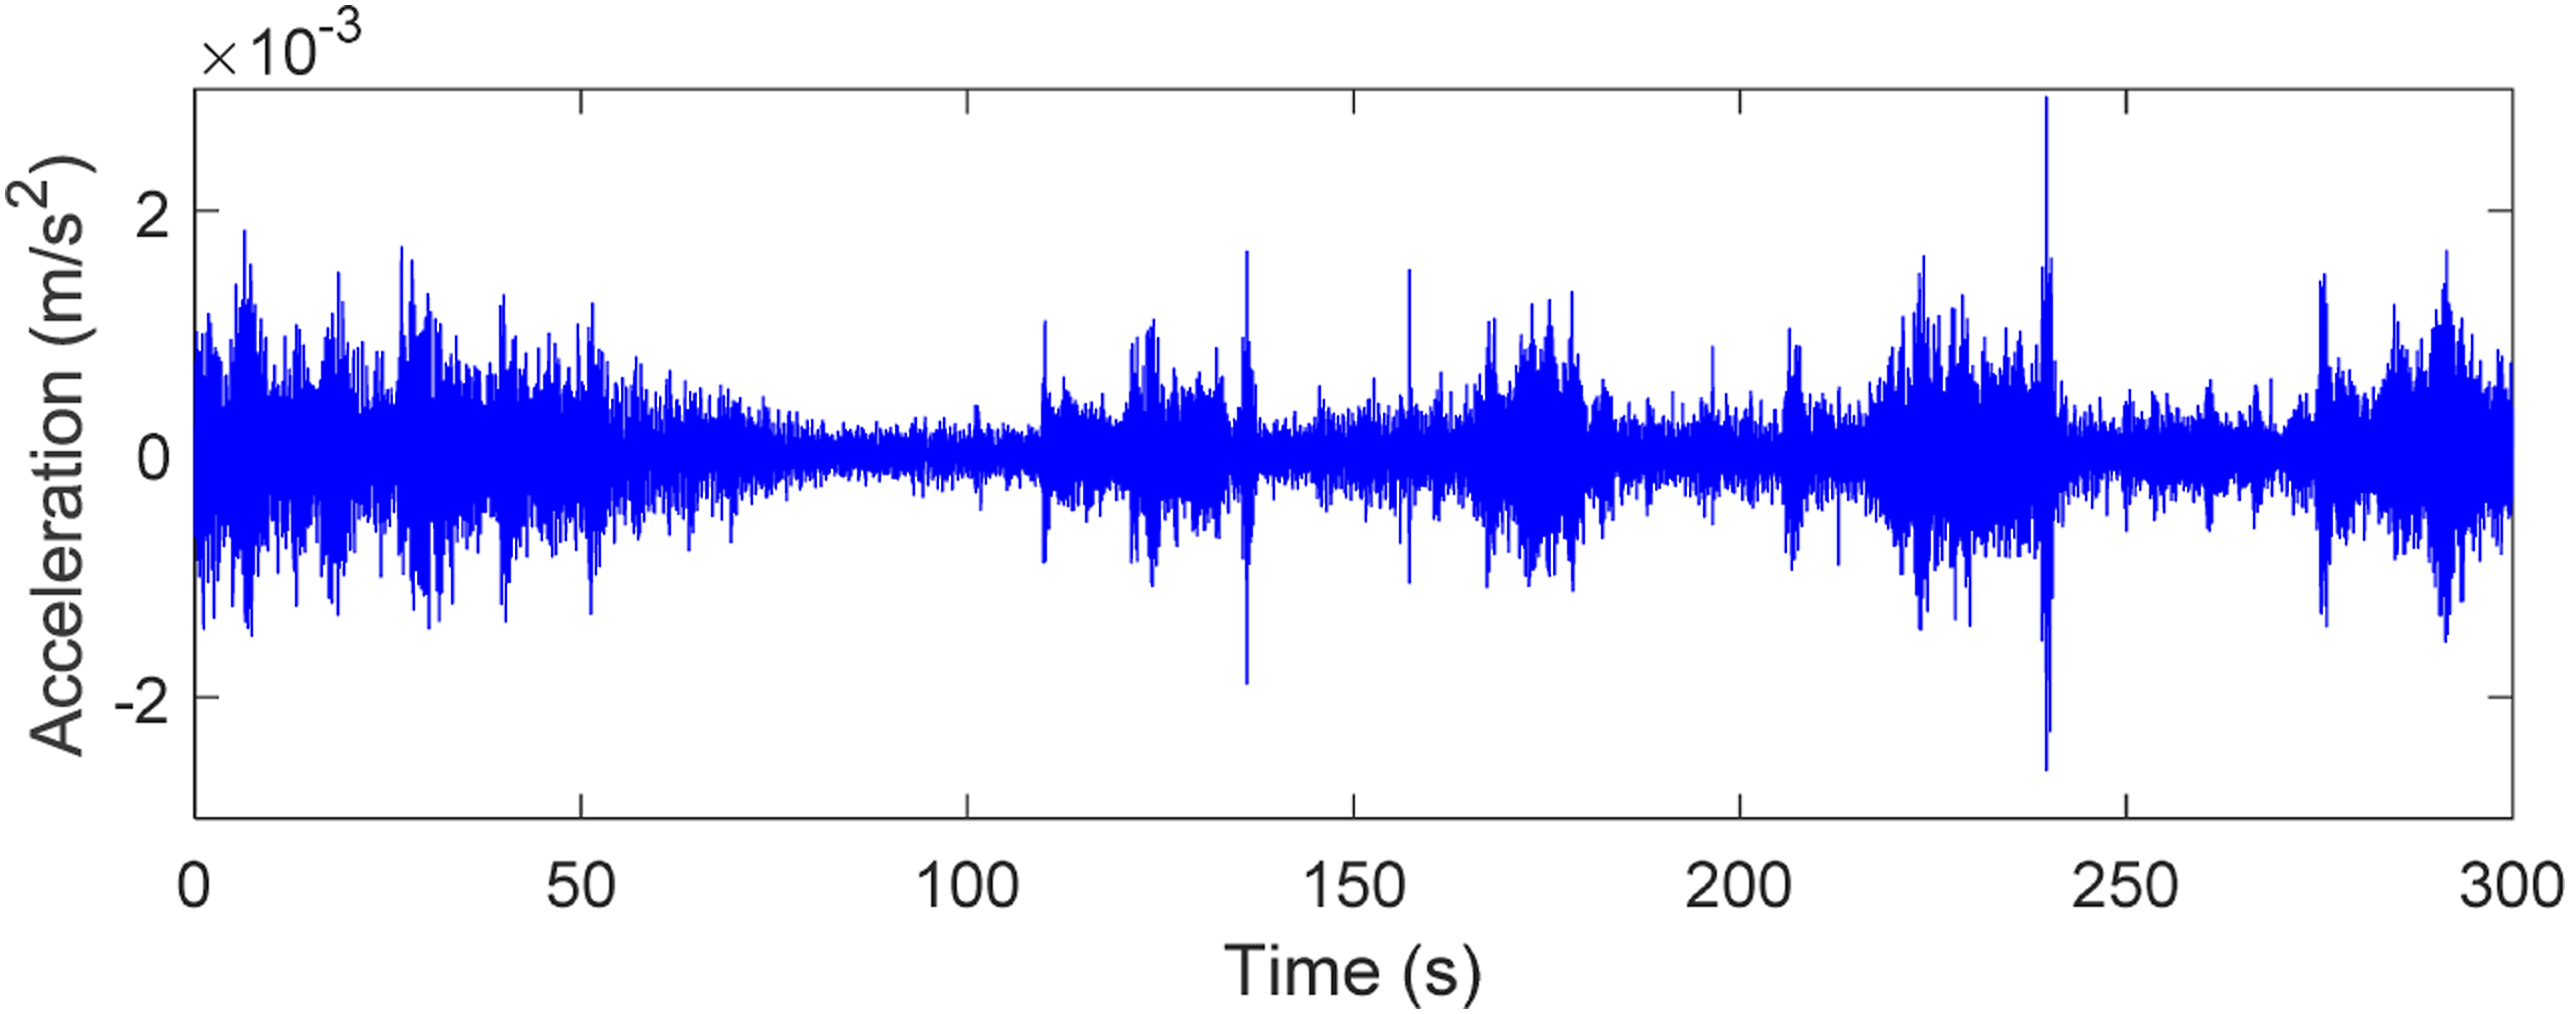
Modal parameter identification
According to the segmentation results in Figure 11, the acceleration signal is decomposed into 6 IMF components in the range of 0 to 10 Hz. The acceleration classification of ACC 20 measuring points is divided into 6 IMF components, as shown in Figure 14. Among them, the IMF6 contains all frequency components with frequencies greater than the last boundary line. The decomposed intrinsic mode functions of the acceleration response from ACC 20.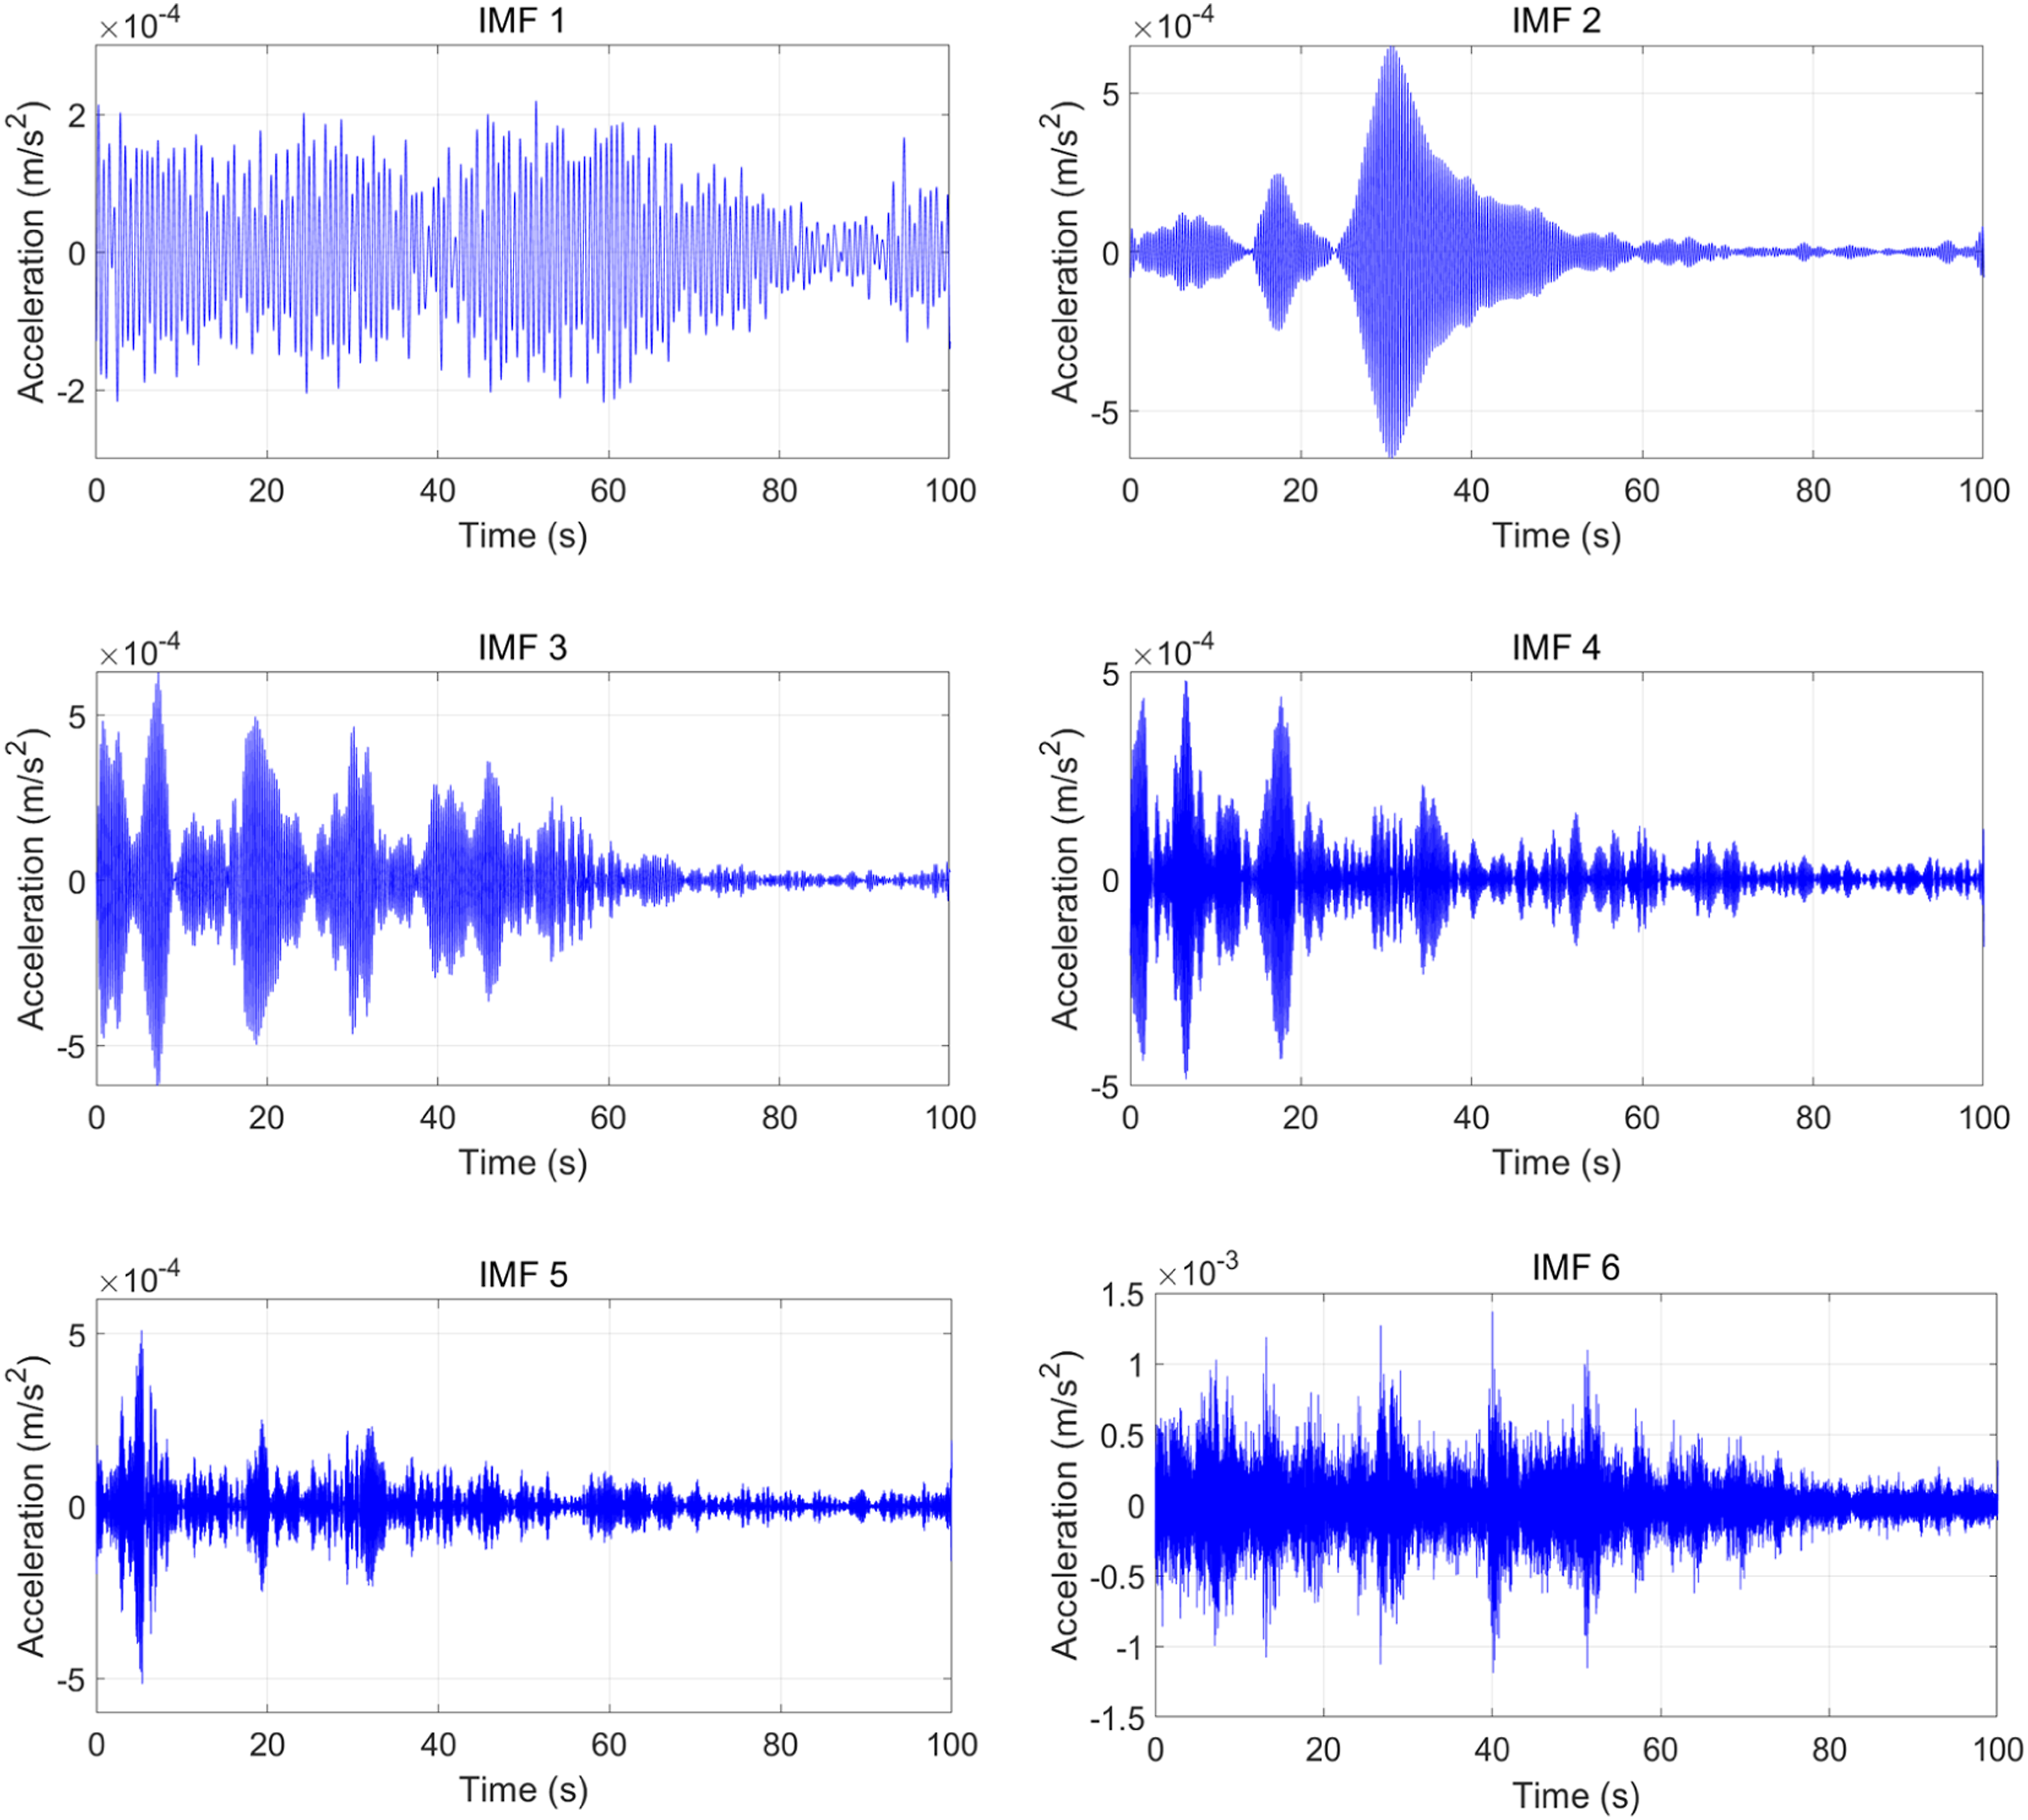
In the process of modal parameter identification, the factors that affect the identification result are: (1) the value of the constant Estimated free vibration responses of individual modes of the acceleration response from ACC 20.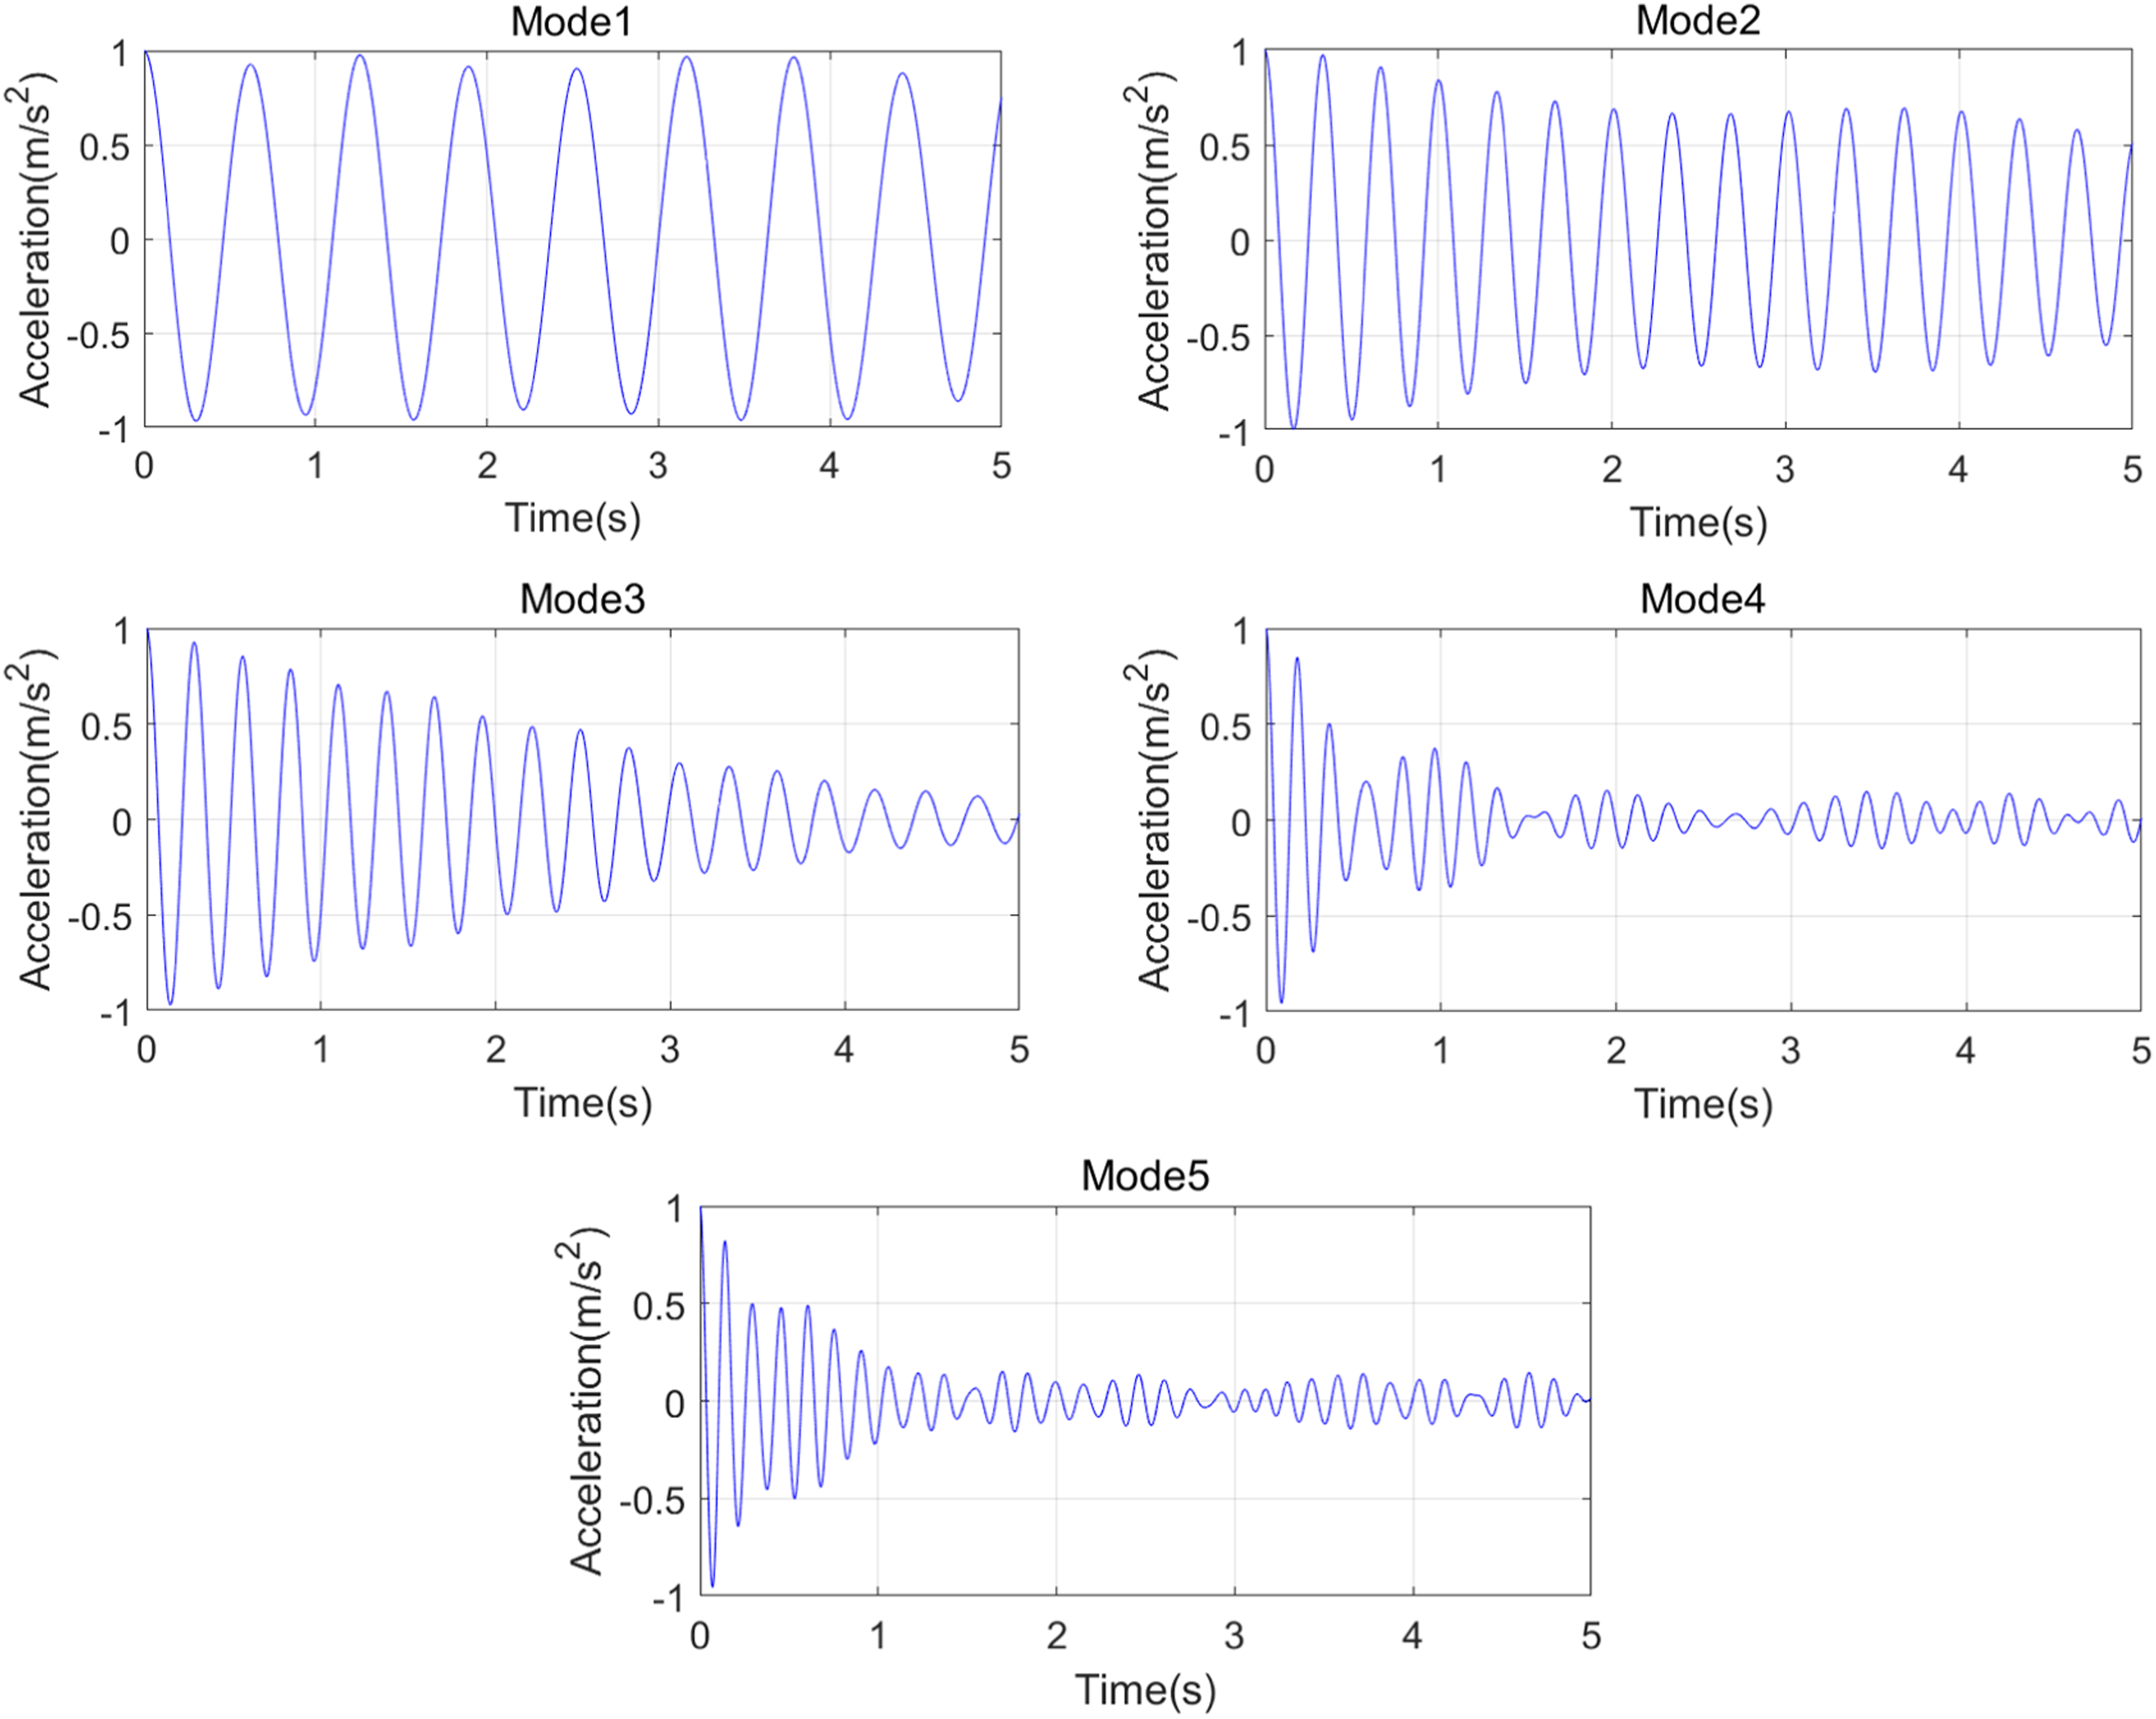
Finally, the least squares method is used to identify the mode according to the single degree of freedom damping vibration theory. Figure 16 shows the identified five mode shapes of this post-tensioned concrete box girder bridge. Identified five mode shapes of a real footbridge: (a) mode 1; (b) mode 2; (c) mode 3; (d) mode 4; (e) mode 5.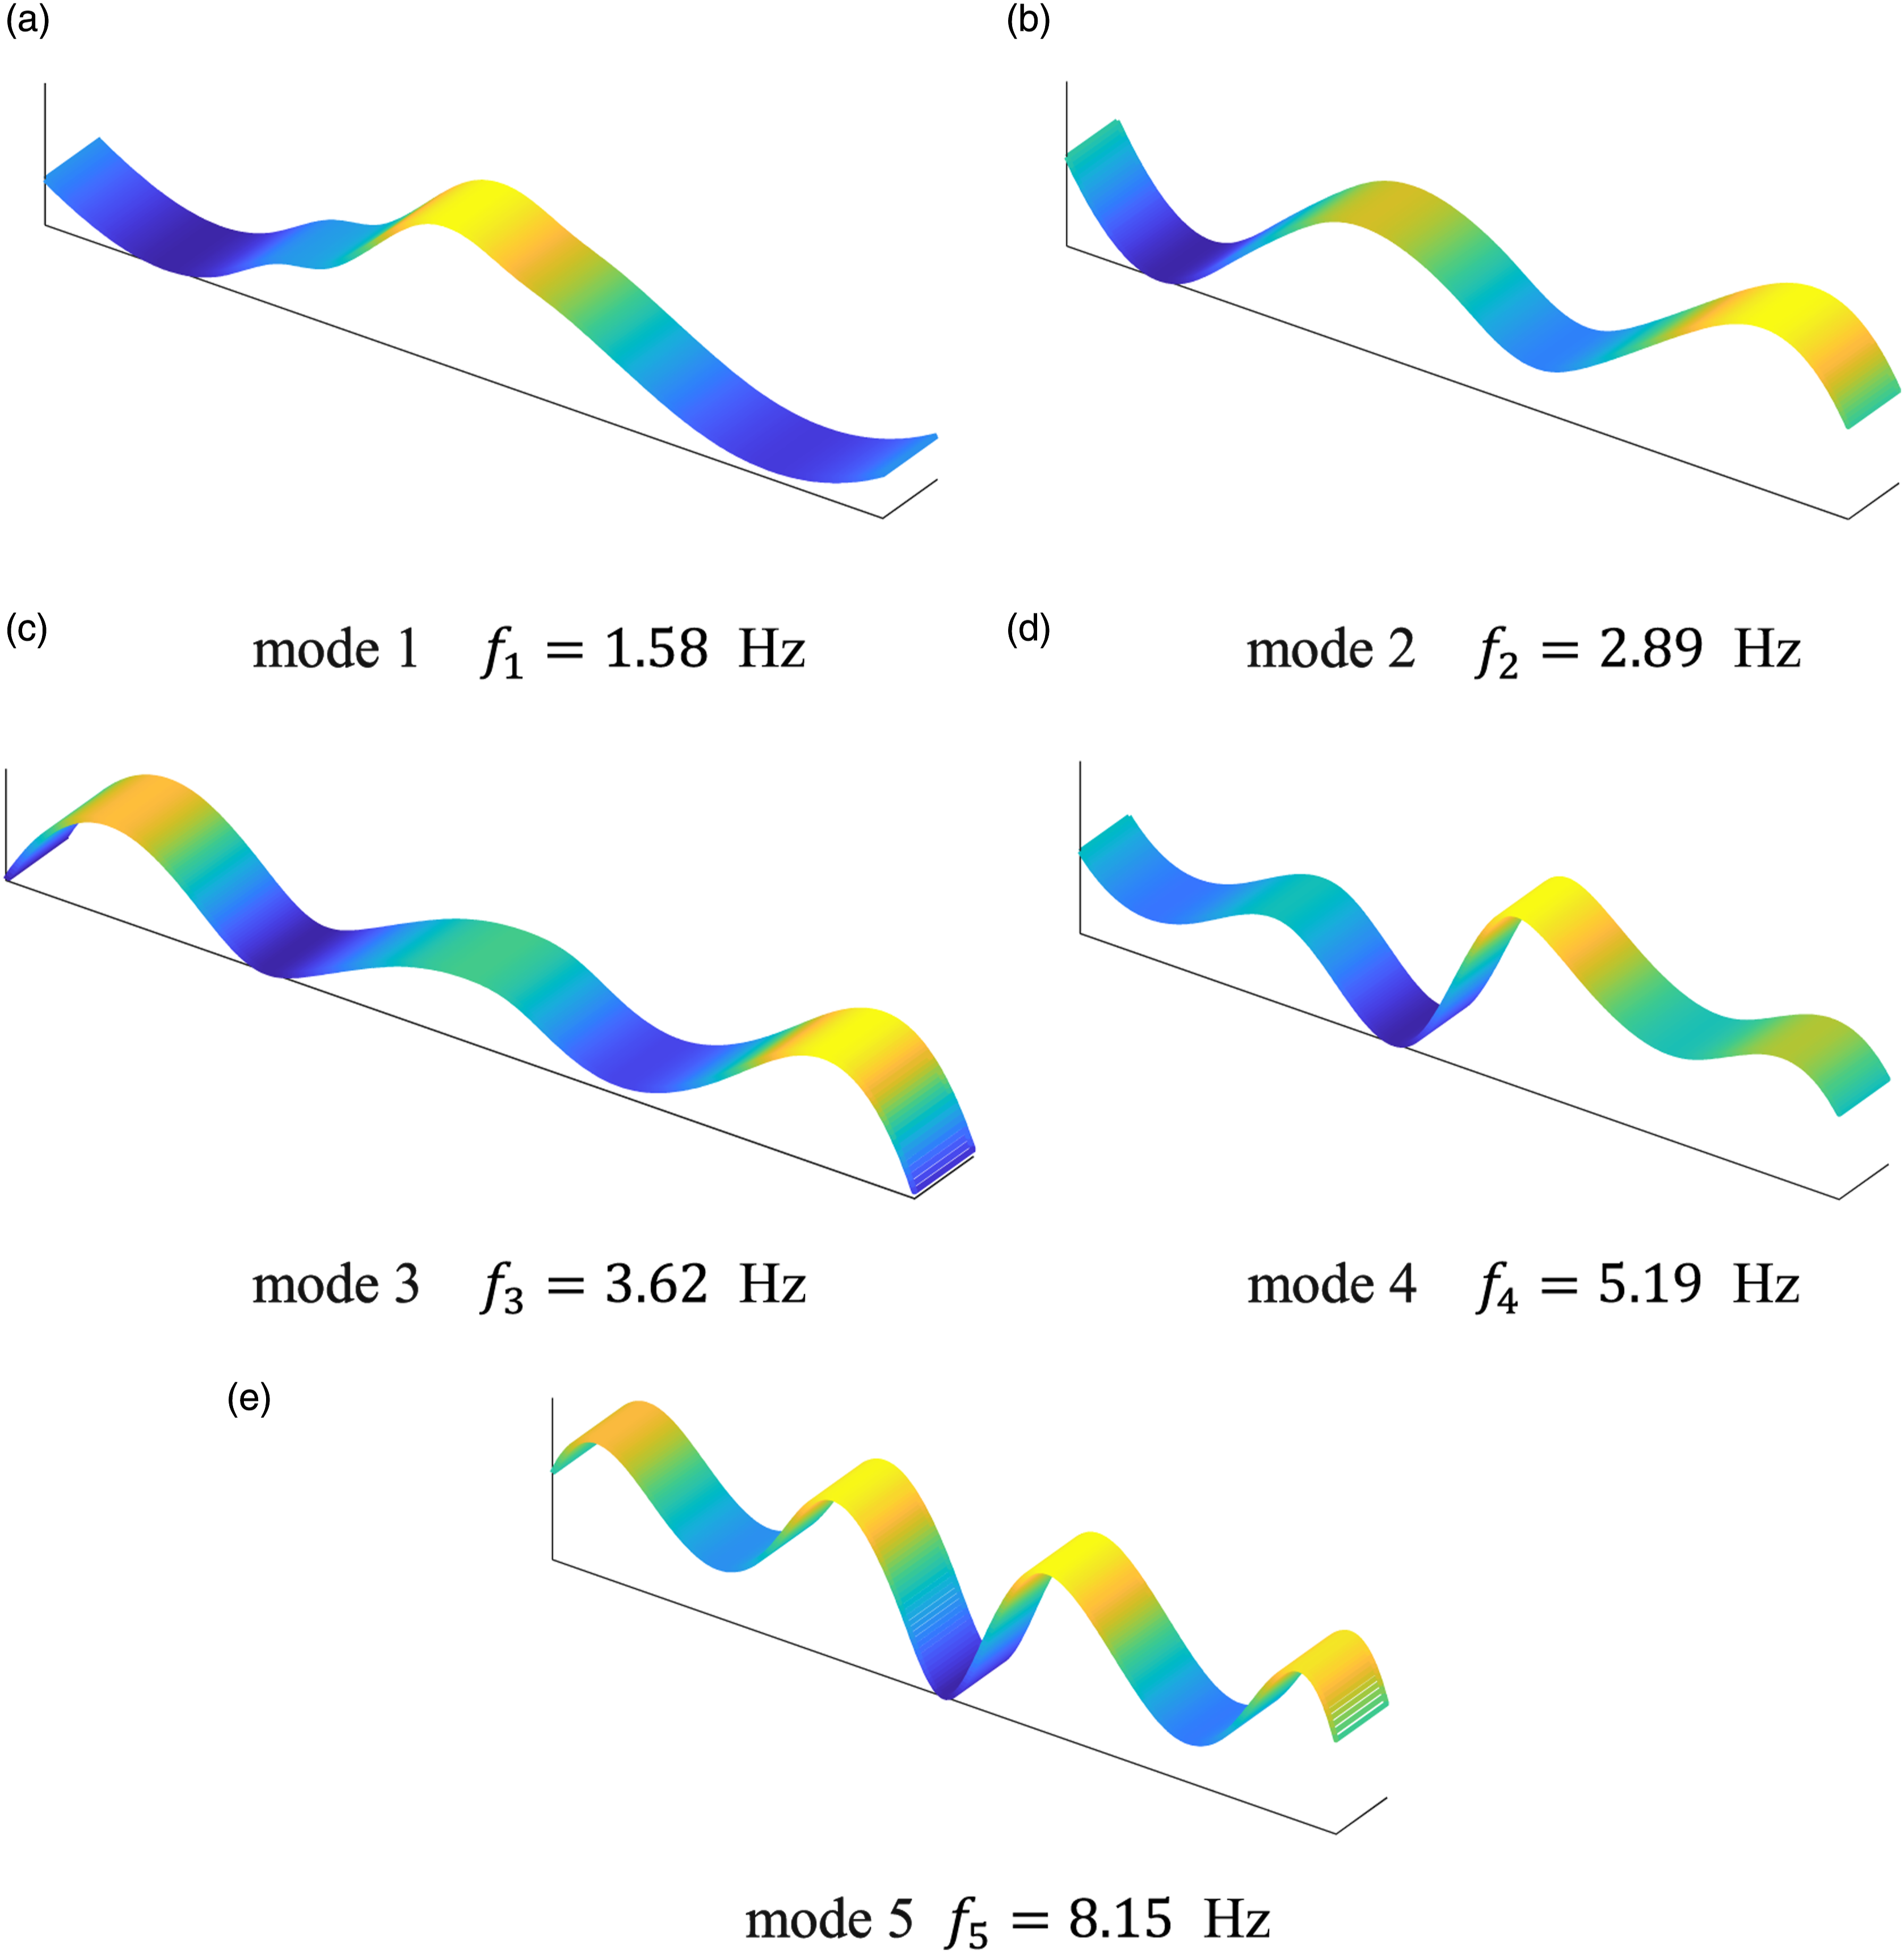
Conclusions
The traditional frequency band division method based on the EWT can not completely and effectively divide the meaningful bands. This study proposes an improved EWT approach based on maximal spectrum technique and spectral skewness to perform the operational modal identification of civil engineering structures. It provides a new way for the automatic identification of the structural modal parameters.
The maximal spectrum technique takes the maximum value of whole frequencies after the Fourier transform of all test points as the bandwidth boundary to partition the input, rather than the Fourier transform of a single measurement point. This has the advantage of not missing the mode of the node. At the same time, the choice of data length is related to the field test environment and the frequency resolution. A signal frequency band division technique based on the spectral skewness algorithm is first established. The proposed frequency band division technology based on the skewness index can prevent the phenomenon of insufficient division and excessive division of the frequency band, and realize the adaptive frequency band division. Finally, the studies on a three-story steel frame and a three-span concrete box girder bridge under ambient excitation are further conducted to verify the accuracy and performance of the proposed approach.
Footnotes
Declaration of conflicting interests
The author(s) declared no potential conflicts of interest with respect to the research, authorship, and/or publication of this article.
Funding
The author(s) disclosed receipt of the following financial support for the research, authorship, and/or publication of this article: This work was supported by the This research was supported by the Natural Science Foundation of China (Grant No. 52208305), the Natural Science Foundation of Jiangsu Province (Grant No. BK20220852), the Natural Science Foundation of Guangdong Province (Grant No. 2018A030313314), the Jiangsu Provincial Double Innovation Doctoral Program (Grant No. JSSCBS20210129), and the Fundamental Research Funds for the Central Universities (Grant No. 3205002208A1, 2242021R10069).
