




Abstract
This paper explores the performance of the reinforced concrete column and steel beam (RCS) structural system at the frame-level, with a focus on evaluating the seismic design coefficients (R-factor, Ω0, and C d ) using the FEMA-P695 methodology. The RCS system offers a more efficient and cost-effective solution compared to conventional steel and RC moment-resisting frames, with higher damping and lateral stiffness of RC columns and greater energy dissipation capacity of steel beams. Although several experimental and numerical studies have evaluated the performance of the RCS system, most of them have focused on the connection-level. In this study, 32 archetypes are designed with varying building height, span length, concrete strength, gravity load level, seismic load level, and column-beam strength ratio. Nonlinear analytical models are developed for the selected archetypes, and the modeling assumptions are validated through five distinct experimental tests. The models are then subjected to both static pushover and response history analyses, and the seismic design coefficients of the archetypes are evaluated and discussed based on the FEMA-P695 methodology. The results indicate that the design requirements of the RCS system are efficient, providing a high safety margin. However, the level of conservatism is found to be excessively high. Thus, it is possible to use a larger R-factor in the design process or make some relaxations in the design requirements related to this structural system. While further research should be carried out to validate the results, this study shows that as long as the R-factor is less than R = 10, the building can be deemed sufficiently safe for seismic loadings.
Keywords
Introduction
The reinforced concrete (RC) column and steel beam (RCS) structural system has gained popularity among researchers and designers since the 1990s due to its efficient structural performance. This hybrid frame combines the inherent advantages of conventional steel and RC moment-resisting frames (MRFs) to form an efficient structural system. The use of RC columns offers higher damping and lateral stiffness at a lower material cost compared to steel columns, while steel beams provide higher energy dissipation capacity and lateral ductility than RC beams. Moreover, this hybrid system has a shorter construction time than RC MRFs and a lower construction cost than steel MRFs (Griffis, 1986).
To evaluate the performance of the RCS system, several experimental studies were conducted in the 1980s and 1990s. These studies include those by Sheikh (1987), Deierlein (1989), and Kanno (1993) in the United States and those by Morota et al. (1988), Izaki et al. (1988), and Sakaguchi (1991) in Japan. Based on findings of these studies, suggestions were made for improving the structural details, estimating the strength of components, and recommendations for seismic design of the RCS connection joint panel. The results were incorporated into the design guidelines of the ASCE (1994) and Architectural Institute of Japan (AIJ, 2001) with some modifications. Further studies (Kanno and Deierlein, 1996, 2002; Kuramoto and Nishiyama, 2004; Parra-Montesinos et al., 2003; Parra-Montesinos and Wight, 2001) were conducted in this field, resulting in the improvement of the 1994 ASCE guideline (Cordova and Deierlein, 2005; Kathuria et al., 2015). A study by Li et al. (2011) provides an overview of studies conducted up to 2011. More recent experimental studies (Alizadeh et al., 2015; Chen et al., 2023; Eghbali and Mirghaderi, 2017; Lee et al., 2019; Li et al., 2022b; Ou et al., 2023; Zhang et al., 2018, 2022; Yang et al., 2022) propose new details to improve RCS connection behavior, mainly through minor modifications.
In addition to experimental research, several studies focused on the numerical simulation of RCS connection behavior using the finite element method and platforms such as ABAQUS (2013) and ANSYS (2013), for example, Refs: (Azad et al., 2021; Jafari et al., 2020; Li et al., 2020; Noguchi and Uchida, 2004; Tao et al., 2021). After developing a finite element model of the RCS connection and validating the model with the results of experimental tests, these studies proposed new connection details, evaluated the performance of new connections, and provided suggestions to enhance seismic performance (Alizadeh et al., 2013; Bakhtiari Doost et al., 2022; Li et al., 2022a; Madandoust et al., 2018; Nguyen et al., 2019; Zibasokhan et al., 2016). Moreover, Cordova and Deierlein (2005) conducted a comprehensive numerical study by developing a finite element numerical model in OpenSees (Mazzoni et al., 2005) based on previous experimental tests. Similar simulations in OpenSees were performed by other studies (Alizadeh et al., 2015; Jafari et al., 2020). Despite numerous experimental and numerical studies have evaluated the performance characteristics of the RCS system, the majority of these studies have only evaluated the system performance on the connection scale. Only a limited number of studies have conducted an evaluation of the performance of the RCS connection at the system level (Farahmand Azar et al., 2013; Mehanny et al., 2002; Singh Oinam and Ningthoukhongjam, 2021).
The current study focuses on evaluating the performance of RCS MRFs at the system level, specifically investigating the seismic design coefficients (i.e., R-factor, Ω0, and C d ) of the RCS frames using the FEMA-P695 methodology (2009). The seismic design codes classify the RCS system as a composite seismic-resisting system, which is a combination of pure steel and pure concrete systems (ASCE/SEI, 2022). As a result, the code suggests using the median values of the seismic design coefficients of these two systems for composite seismic-resisting systems (Denavit et al., 2016).
Limited research has been conducted to assess the seismic design coefficients of composite MRFs. Denavit et al. (2016) examined the design coefficients of composite MRFs featuring concrete-filled steel tubes (CFT) and steel-reinforced concrete (SRC) columns and steel beams. Furthermore, Judd and Pakwan (2018) investigated a dual lateral-force resisting system comprising a primary lateral-force resisting system and secondary CFT columns. Both studies incorporated composite concrete-steel columns in the MRFs. However, to the best of the authors’ knowledge, no study has evaluated the seismic design coefficients of the RCS MRFs. The RCS MRF integrates typical reinforced concrete (RC) columns, not composite columns, with steel beams to operate as a hybrid or composite MRF.
To accomplish the aim of this study, 32 archetypes are designed with varying building height, span length, concrete strength, gravity load level, seismic load level, and column-beam strength ratio. Among them, 24 archetypes adhere to the default R-factor for composite MRFs (R = 8) as prescribed in ASCE/SEI 7 (2022), while the remaining eight archetypes are designed with higher R-factor values (R = 10 and 12). For all archetypes, the RCS joints details are in accordance with the pre-standard for the design of moment connections between steel beams and concrete columns (Kathuria et al., 2015), which is an updated version of the ASCE, 1994 design guideline (1994). Nonlinear analytical models are developed for the selected archetypes using OpenSees (Mazzoni et al., 2005). The modeling assumptions are validated through five distinct experimental tests (Alizadeh et al., 2015; Bursi and Gramola, 2000; Cordova and Deierlein, 2005; Kanno, 1993; Tanaka, 1990). The models are then subjected to both static pushover and dynamic response history analyses, with a set of 44 far-field ground motions used for the dynamic analysis. Finally, the seismic design coefficients of the archetypes are evaluated and discussed based on the FEMA-P695 methodology.
Design of archetypes
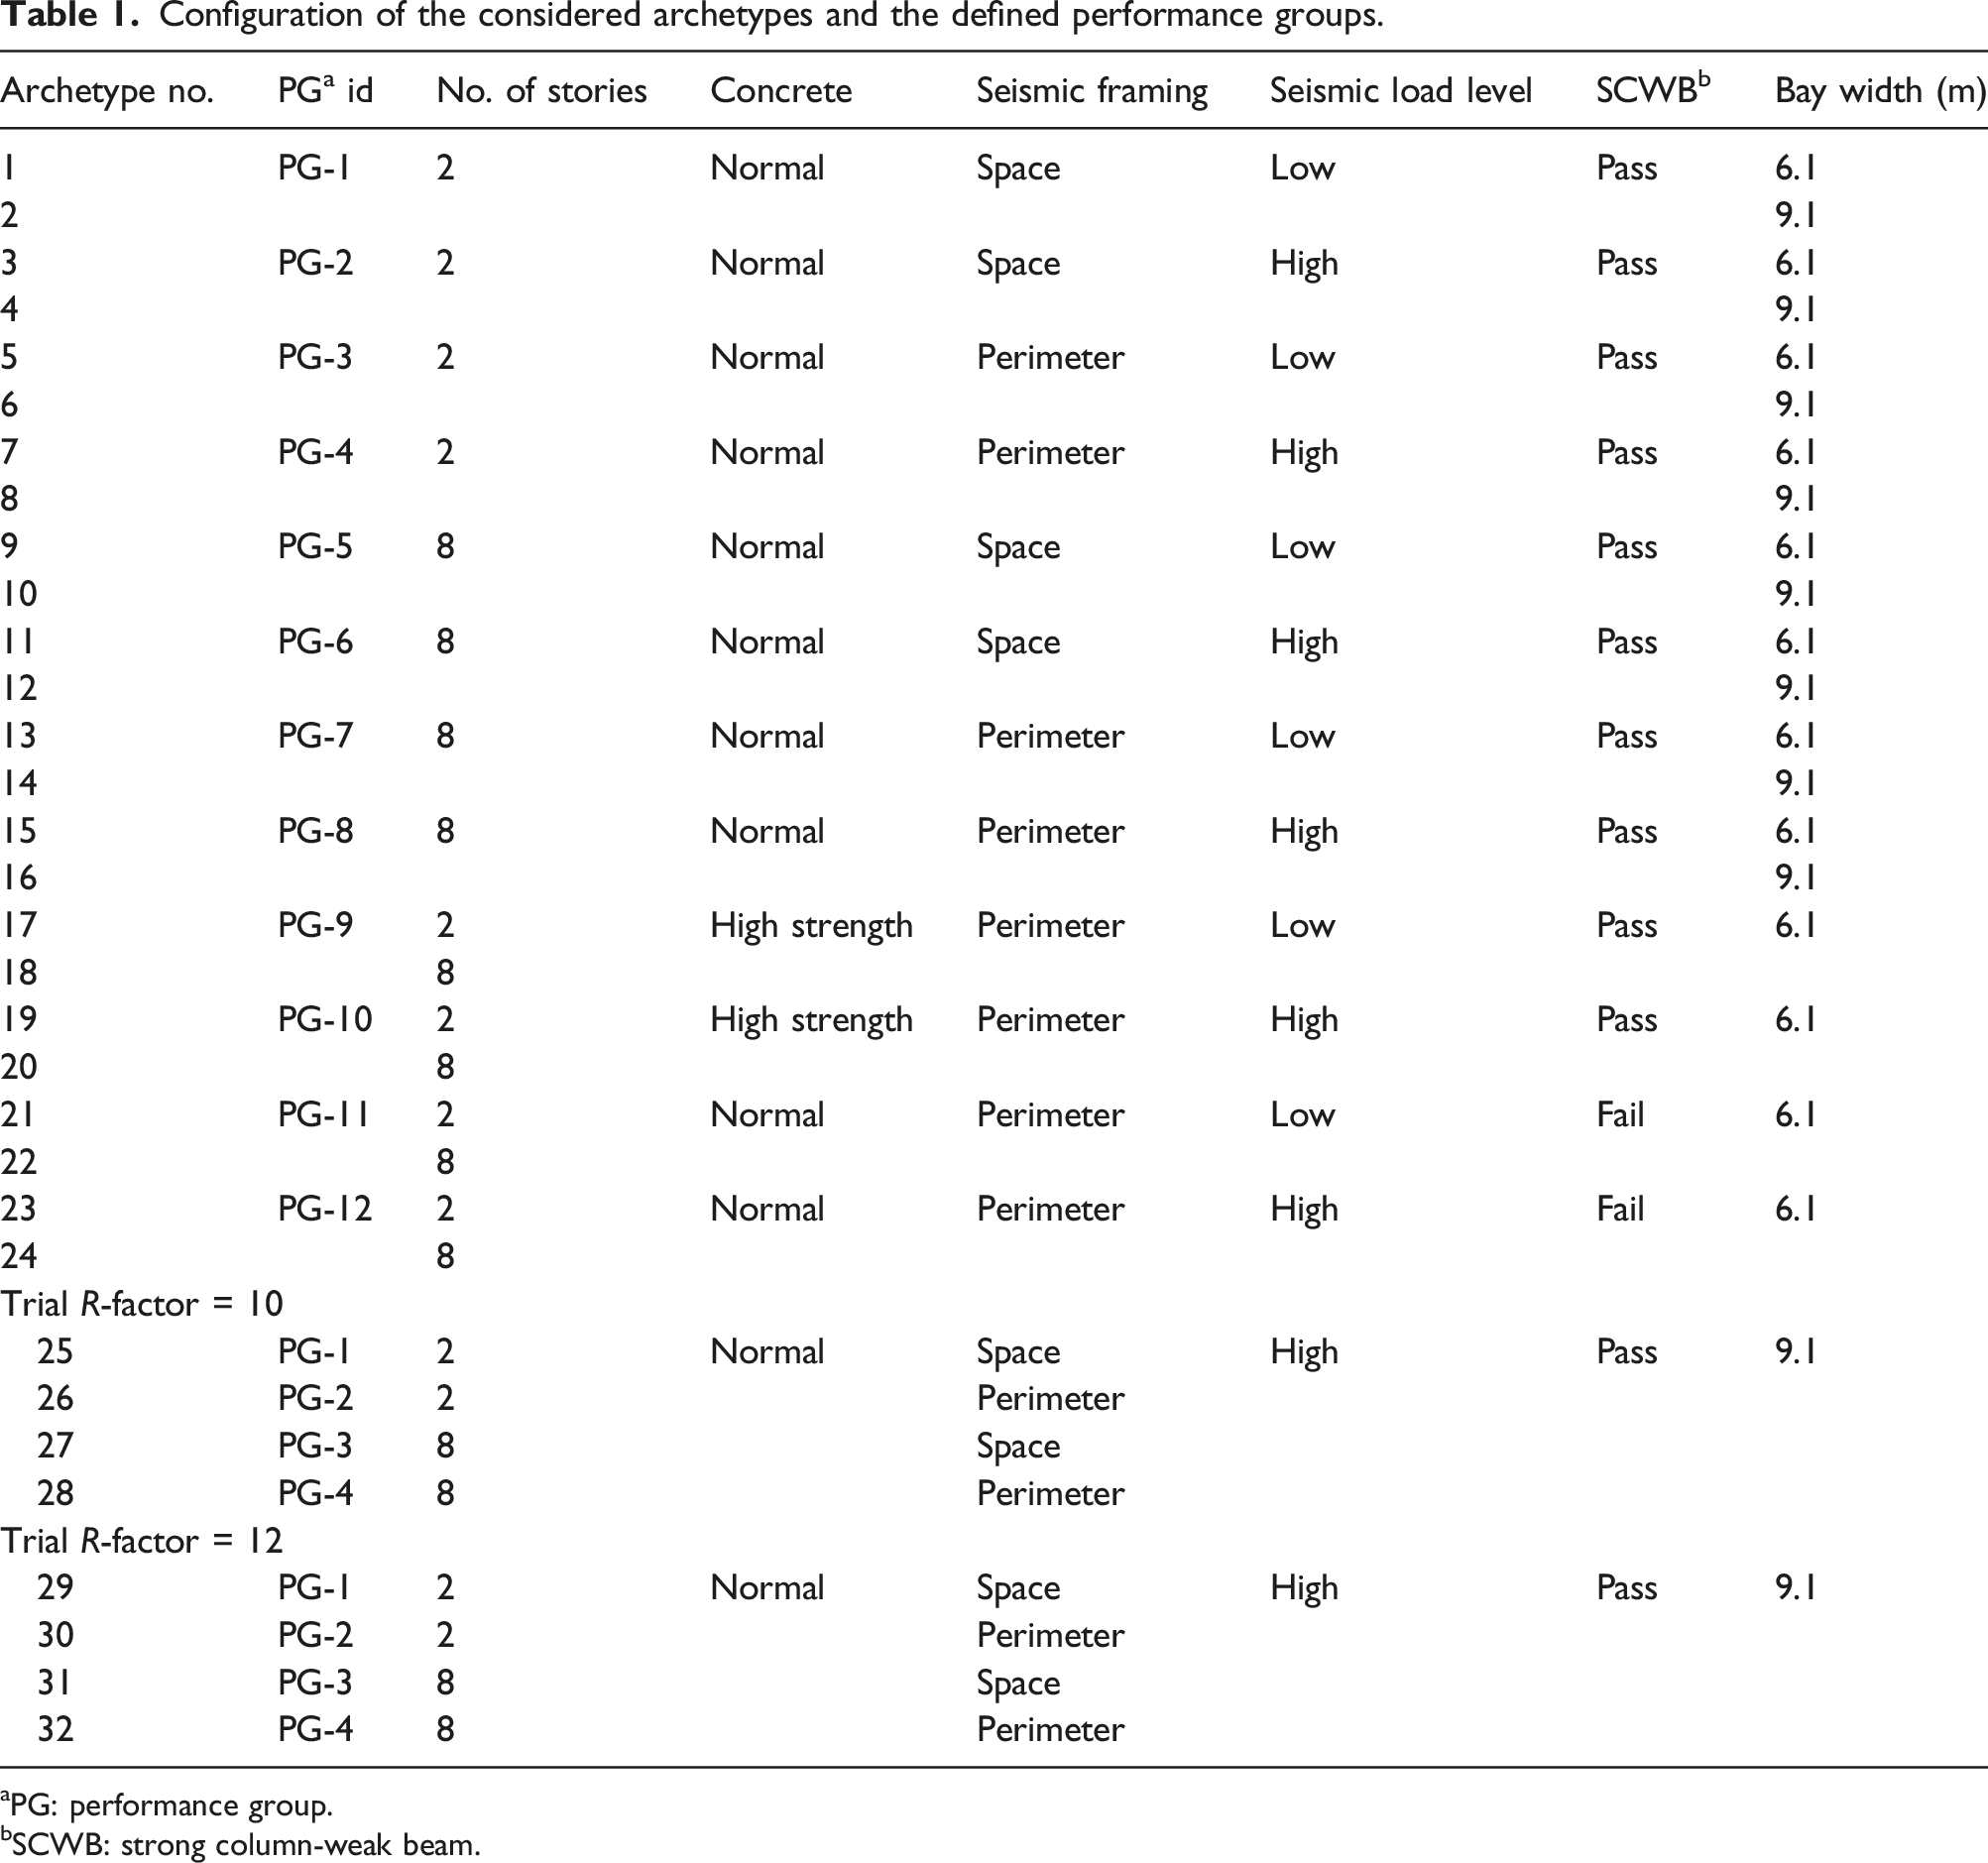
Configuration of the considered archetypes and the defined performance groups.
aPG: performance group.
bSCWB: strong column-weak beam.
The set of selected archetypes includes 24 frames designed with an R-factor of 8, which is the default R-factor prescribed by the code for composite MRFs. Additionally, there are four frames with an R-factor of 10 and four frames with an R-factor of 12. The rationale behind designing archetypes with larger R-factors is that, after evaluating the adequacy of the first 24 archetypes, it was determined that an R-factor of eight is sufficient for the RCS system. However, the level of conservatism is found to be excessively high. Therefore, the possibility of using a larger R-factor in the design process is being investigated.
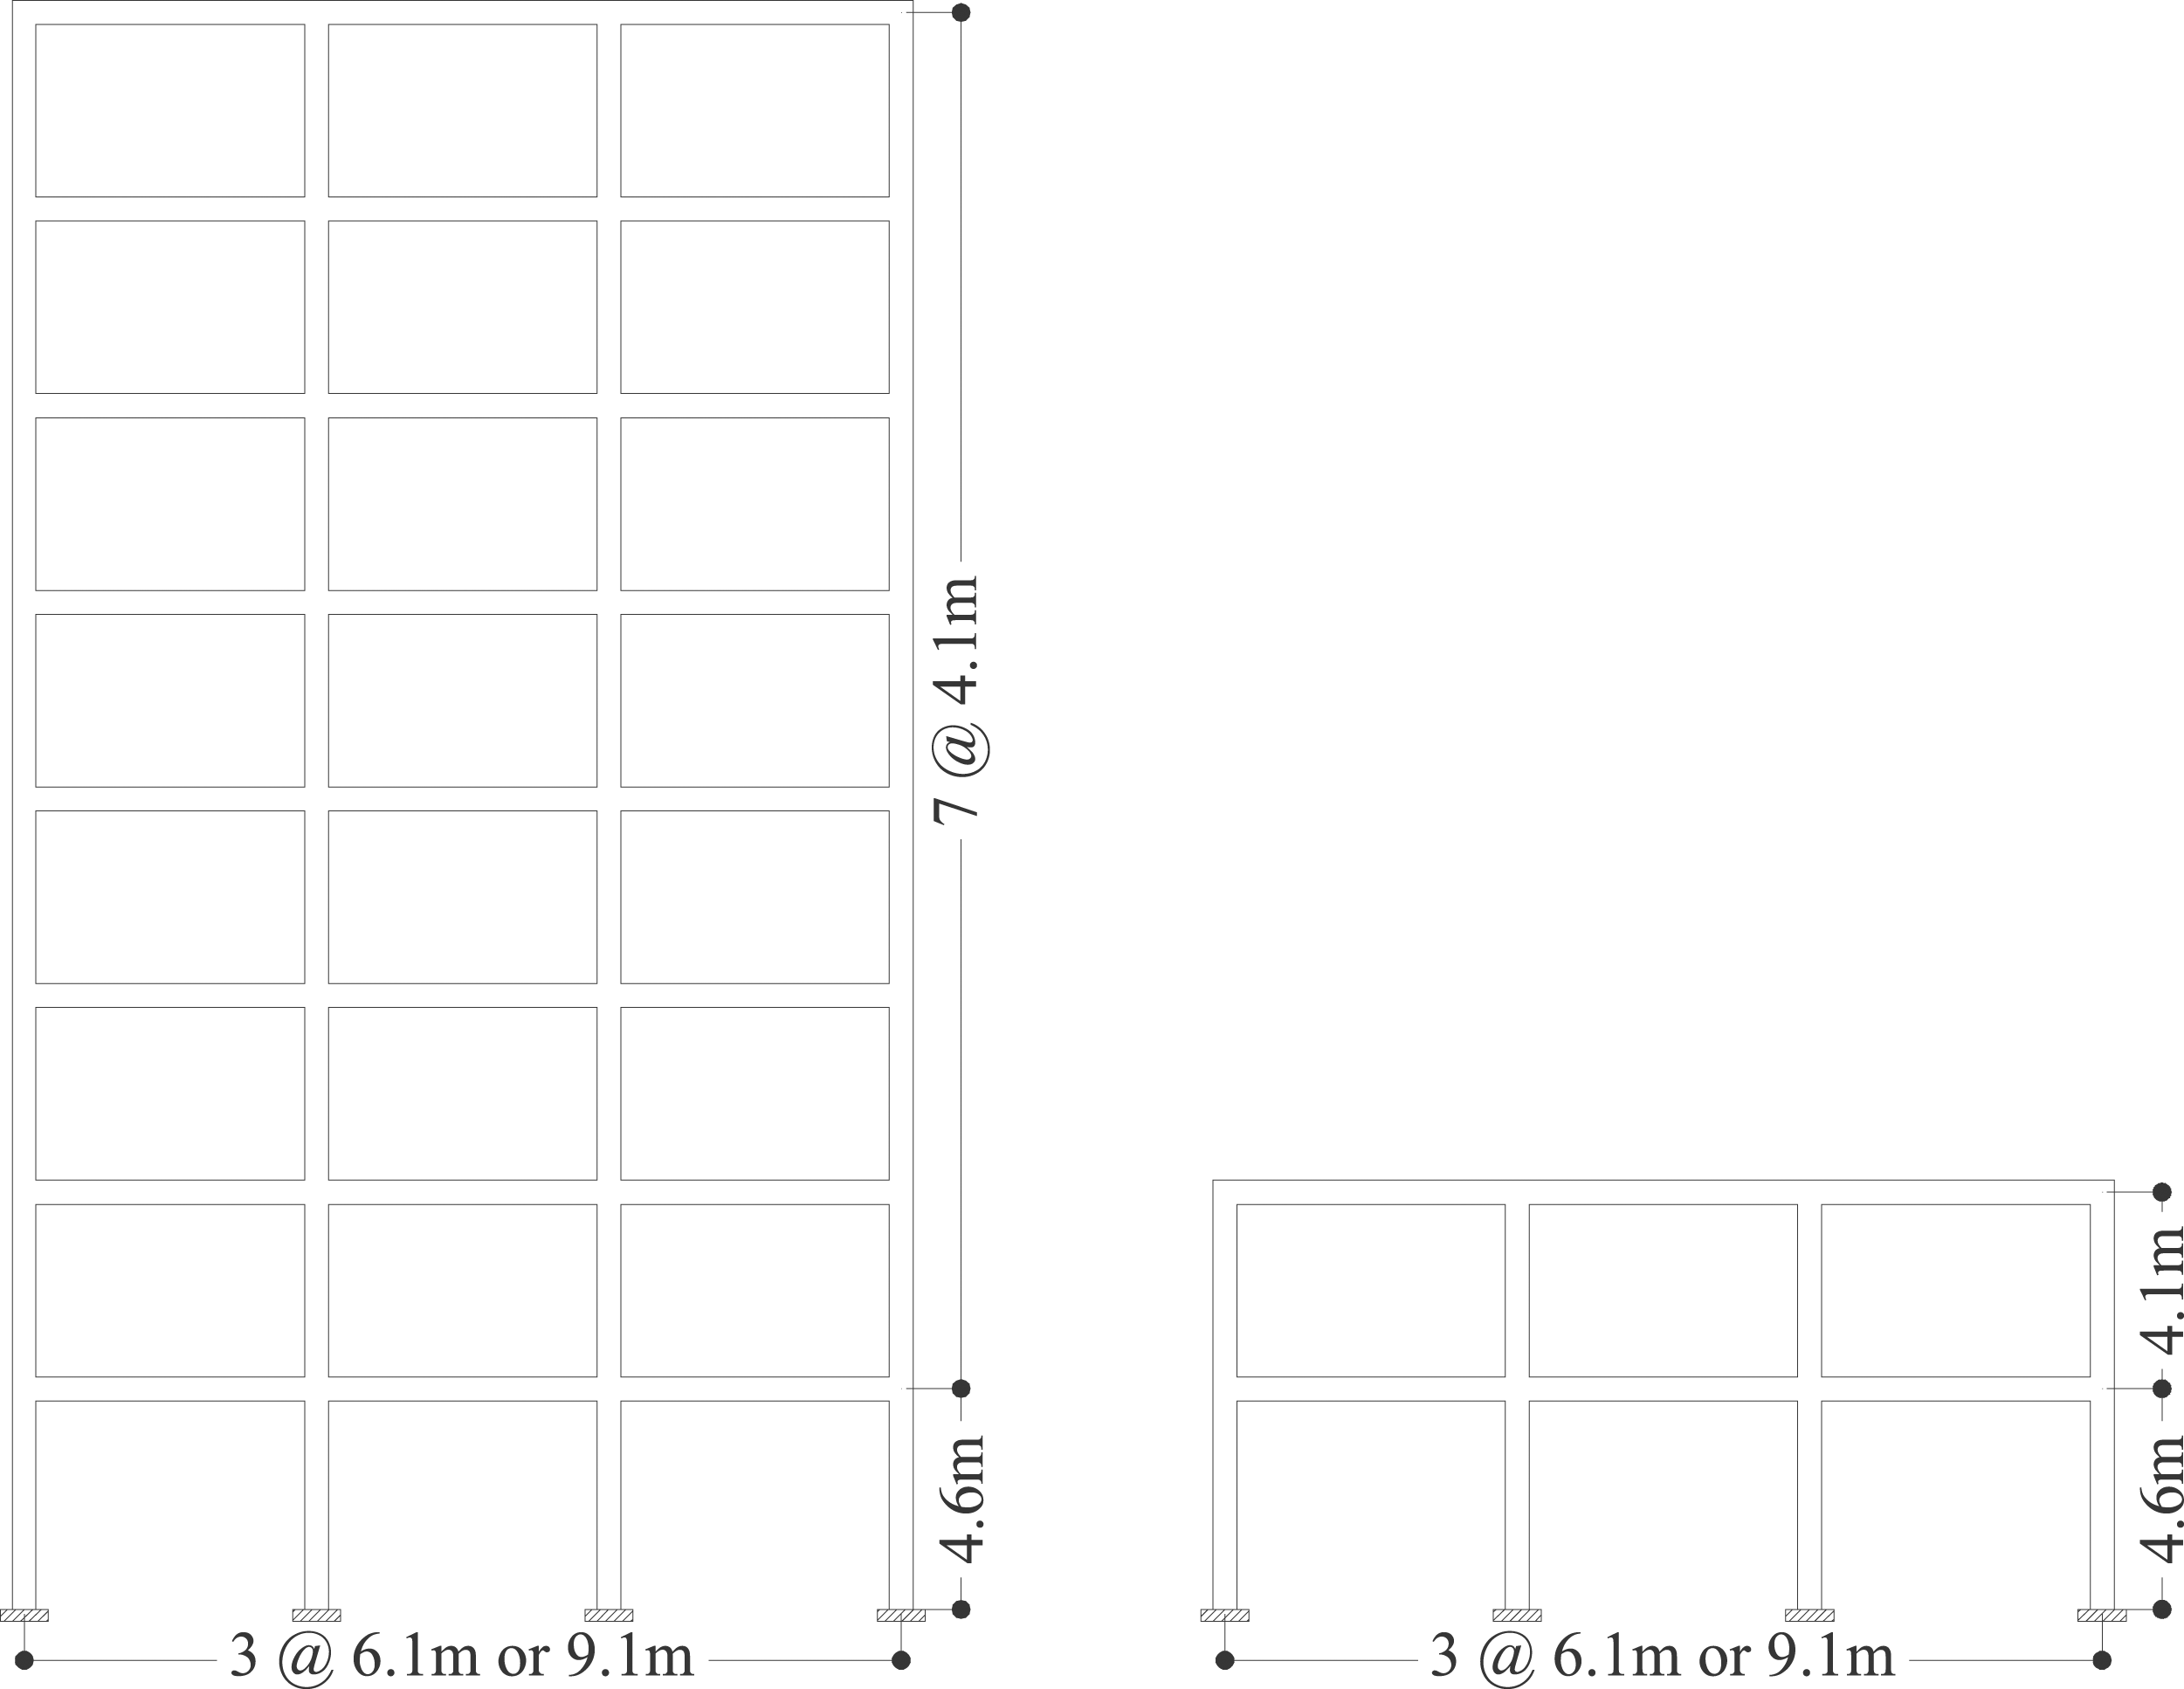
Two building heights are considered: two- and eight-story, representing buildings with short and long natural periods, respectively. The first story has a height of 4.6 m in all buildings, while the remaining stories have a typical height of 4.1 m. Two different bay lengths (6.1 m and 9.1 m) are selected for the seismic load-resisting frames in the studied archetypes. Two concrete compressive strengths are considered: f ’ c = 34.5 MPa and 82.7 MPa, representing regular and high strengths of concrete material, respectively. The ASTM A615 grade-75, ASTM A615 grade-60, and ASTM A572 grade-50 are assumed for the longitudinal reinforcements, transverse reinforcements, and steel beams, respectively.
Two types of lateral load-resisting systems are used in this investigation: space and perimeter framing systems. In space frames, all frames take part in seismic load-bearing, while in perimeter frames, only the frames surrounding the structure withstand the lateral seismic loads, and the rest of the frames only take part in gravity load-bearing. The main difference between these two types of framing is the gravity load intensity acting on the seismic load-bearing frames. In space frames, the ratio of the gravity tributary area to its lateral tributary area is one, while in perimeter frames, this ratio is smaller due to the main part of the gravity loads being resisted by the gravity frames. Therefore, space and perimeter frames can represent buildings with high and low gravity load levels, respectively. Figure 1 shows the plan geometry of the two frame types. One of the seismic load-bearing frames in the east-west direction of the plan is selected for assessment. The elevation view of the selected frame for the two- and eight-story archetypes is depicted in Figure 2. Typical plan layout of the archetypes: (a) space frame and (b) perimeter frame. The elevation view of the selected MRF of the two- and eight-story archetypes.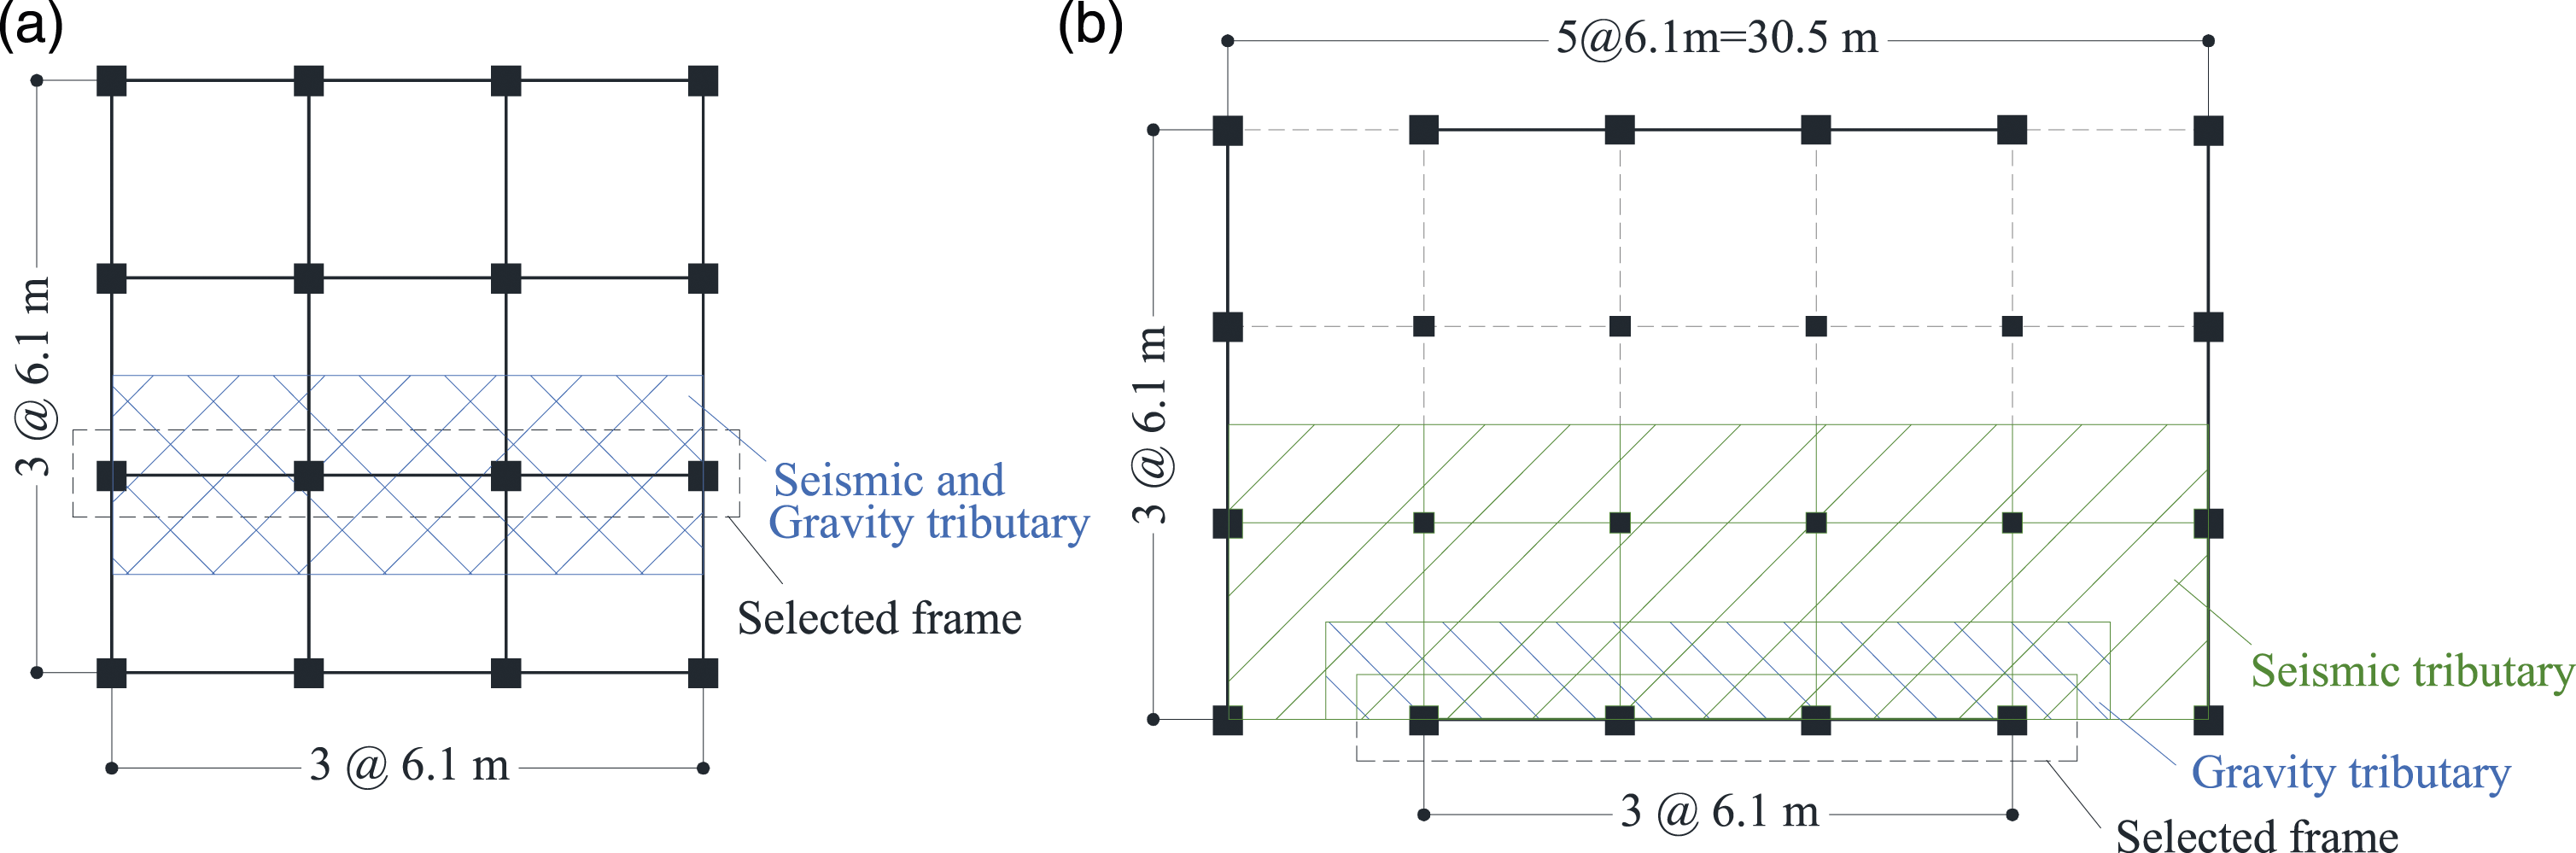
Gravity and seismic loads are applied based on ASCE 7-22 (2022) standard. The RCS joints are designed according to the ASCE pre-standard (Kathuria et al., 2015). Additionally; the steel beams should meet AISC 341-16 (2016a) and AISC 360-16 (2016b), while the concrete columns should meet the requirements of ACI 318-19 (2019). The joints of the MRFs should meet the strong column-weak beam (SCWB) requirement. However, four additional archetypes that do not meet the SCWB requirement are also designed and investigated (i.e., Archetypes No. 21-24).
Seismicity parameters for the selected sites as per ASCE 7-22 (2022).

The RCS joints can be divided into two main groups: “through-beam” and “through-column.” In through-beam joint, the steel beam passes continuously through the RC column, while in through-column connections, the beam flanges are cut out at the face of the column to facilitate longitudinal rebar placement (Farahmand Azar et al., 2013). This paper uses the through-beam type of RCS joints as recommended by ASCE pre-standard (Kathuria et al., 2015). Through-beam joints have a significant advantage of avoiding the interruption of beam flanges where the flexural moment is maximum (Kathuria et al., 2015). Figure 3 shows the details for the through-beam RCS joint, including face bearing plates, steel band plates, steel doubler plates, and ties. As a minimum requirement, the face bearing plates should be equal in width to the beam flange for all connections since experimental studies have shown their effectiveness in significantly improving joint performance through concrete confinement in the panel zone. Additionally, the steel band plates play a similar role in concrete confinement below and above the panel zone. Considered details for the through-beam RCS joint.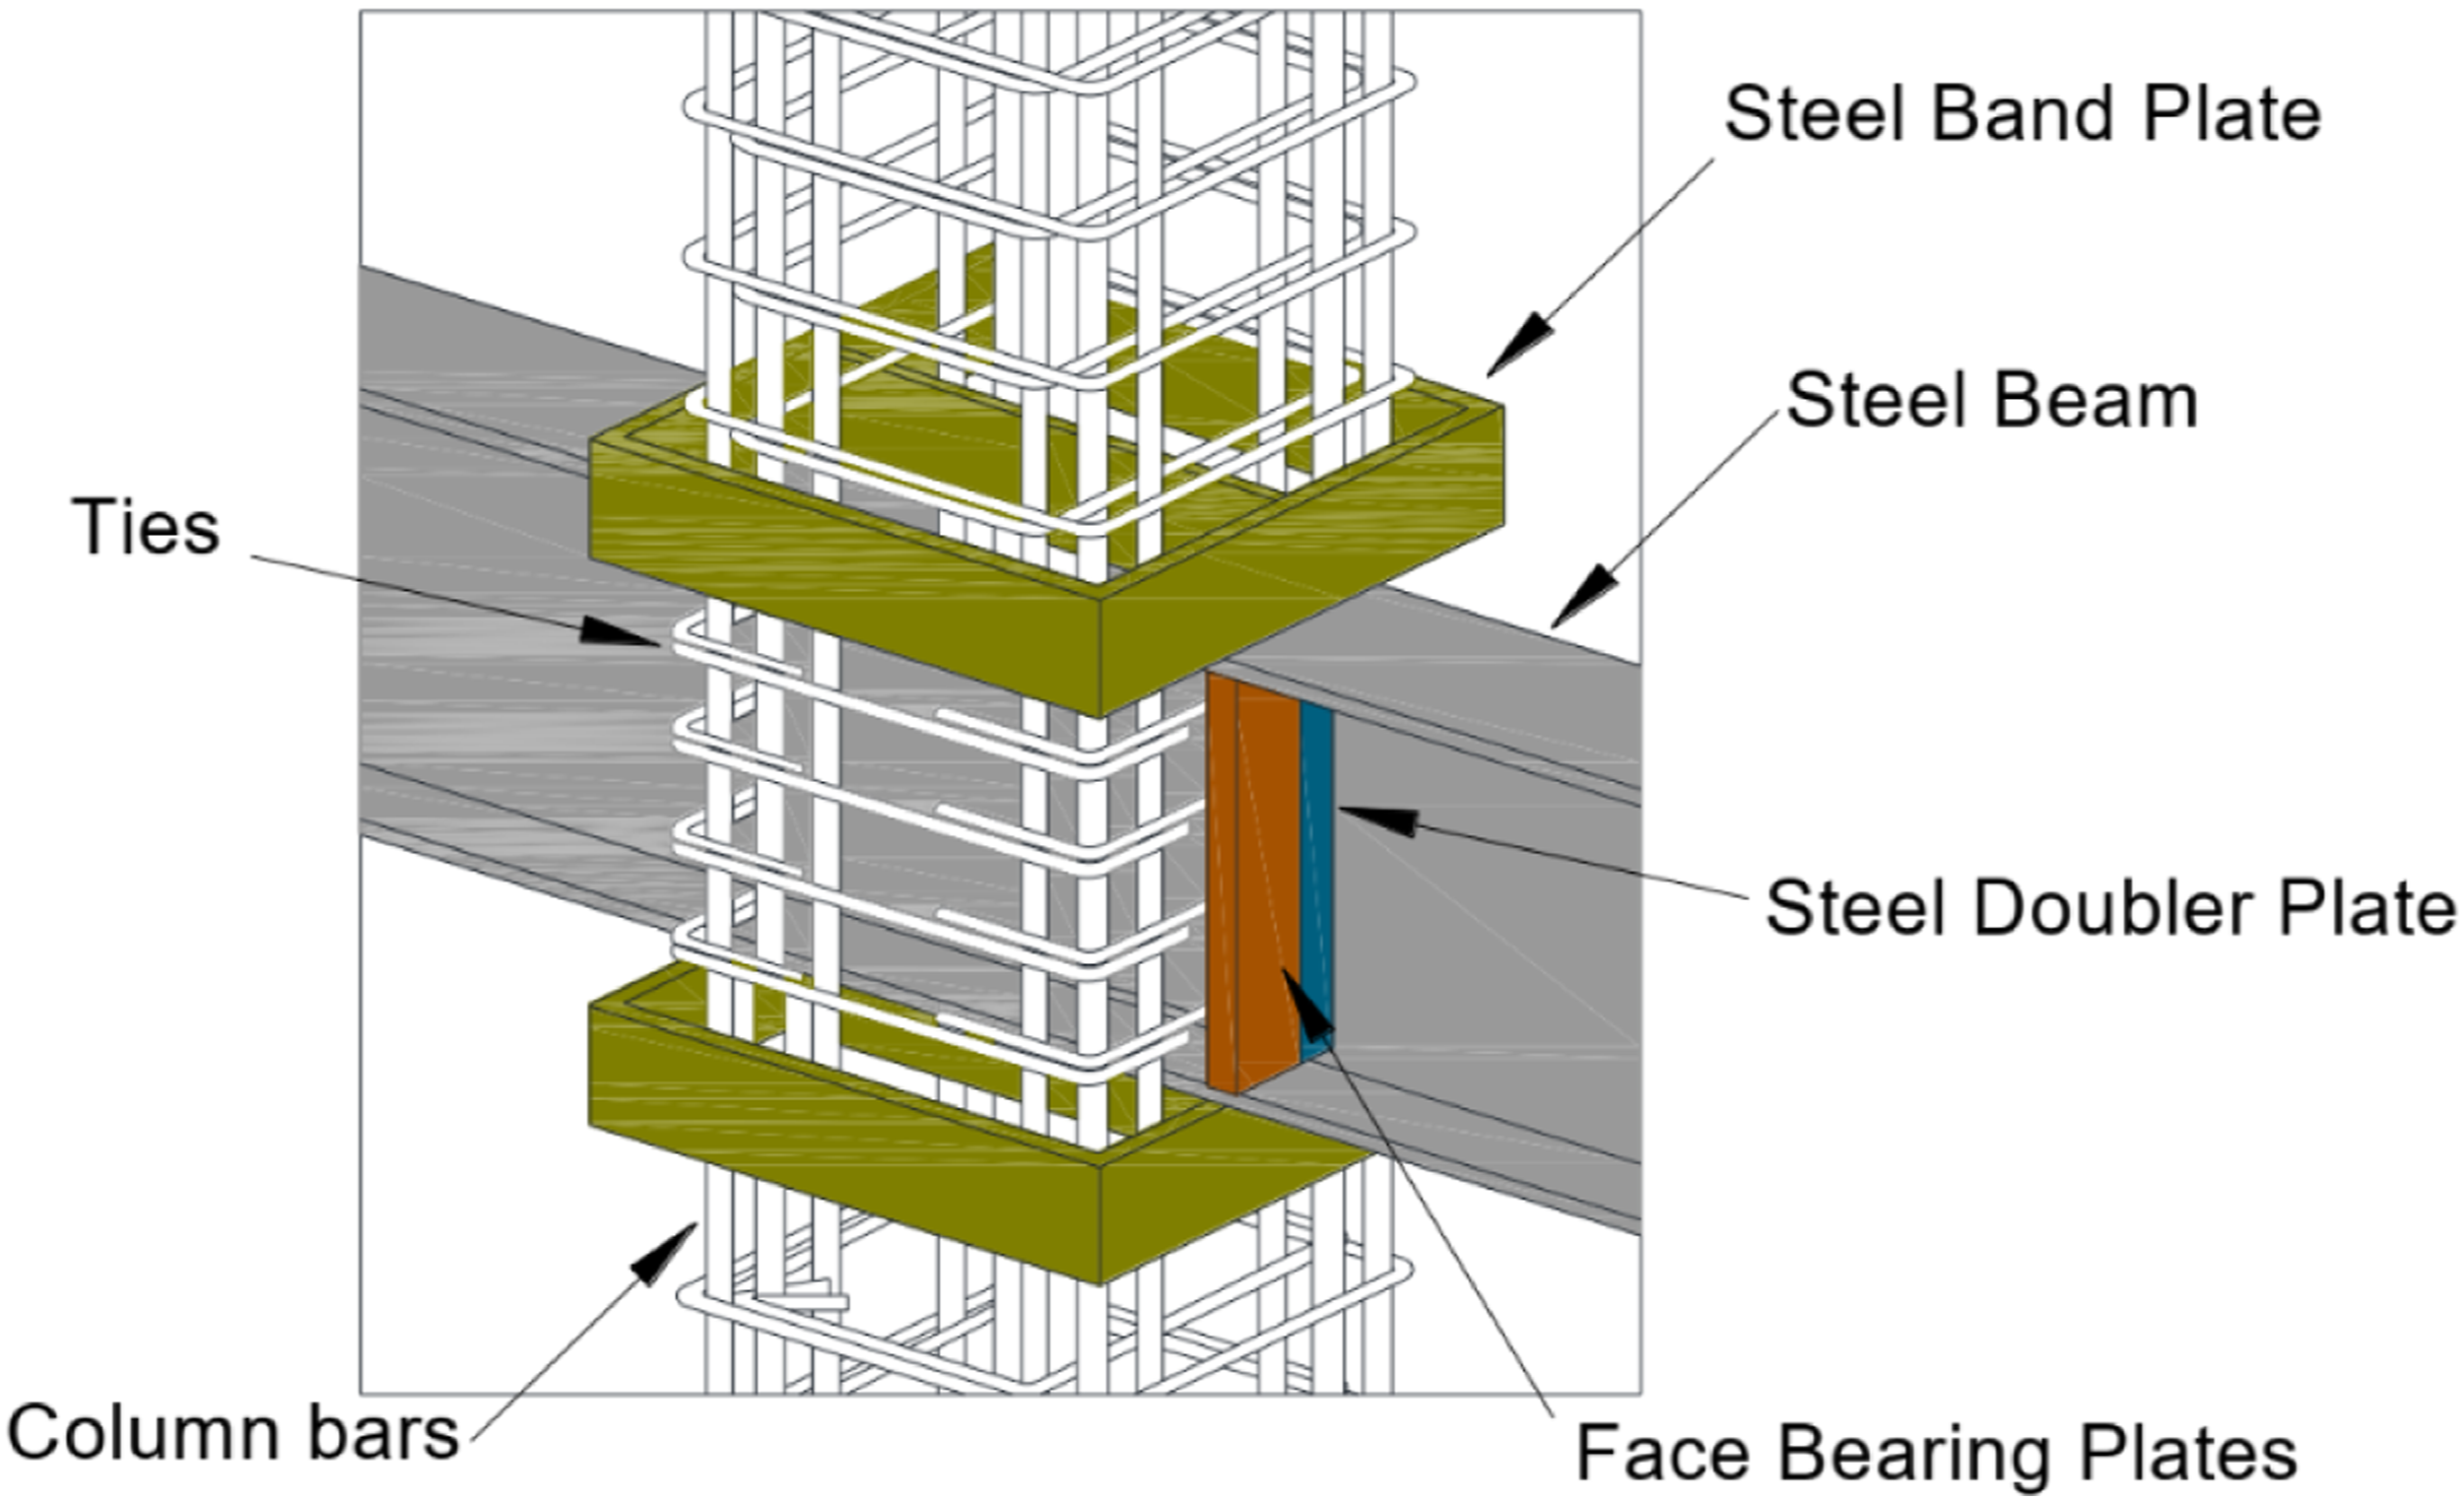
Nonlinear analytical model
The main structural components of the RCS MRFs include RC column, steel beam, and composite beam-column joint. In this study, the assumptions proposed by Cordova and Deierlein (2005) are employed to model the RCS components using OpenSees software (Mazzoni et al., 2005). They conducted a comprehensive experimental and numerical study to develop a reliable numerical model for the RCS system. The behavior of the RCS components was calibrated based on numerous experimental tests in the literature, and the proposed model was validated through tests on a full-scale three-story RCS frame. The beam-column joints are simulated using the concentrated plasticity approach and nonlinear rotational springs, while the beam and column components are modeled using the distributed plasticity approach and fiber-based elements. It should be noted that the adopted model captures shear deformation in joints, relying on the yielding of the steel web panel and the development of diagonal concrete struts. The two distinct deformation mechanisms of the joints–panel shear deformation and vertical bearing–are represented by two nonlinear springs in series. However, for the purpose of facilitating the model validation process, shear deformations in composite beams and RC columns are not considered in this study. In typical beam-column elements of MRFs, shear deformations are often negligible compared to flexural deformations. Nevertheless, these shear deformations could be incorporated into the analytical model by introducing inelastic shear springs in series with the fiber element models. The following sub-sections provide detailed assumptions regarding the nonlinear modeling of the structural components mentioned above. These assumptions are validated by the results of several experimental tests presented in Section 4.
Reinforced concrete column
The RC column is typically modeled using three types of material: confined concrete, unconfined concrete, and steel reinforcement bars. The core part of the column cross-section is assumed to be confined concrete, surrounded by longitudinal and transverse reinforcement bars, and exhibits a high ductility behavior. On the other hand, the cover concrete is assumed to be unconfined, with a high potential for crushing under seismic loading. The confined and unconfined concrete parts of the column are modeled using the modified Kent and Park material model (Scott et al., 1982), also known as the “Concrete02” uniaxial material model in OpenSees. Additionally, the longitudinal reinforcements are simulated using the “Steel02” material model.
The compression backbone curve of Concrete02 material model is defined by the concrete compressive strength (

The compressive strength of concrete in frames with normal concrete is considered to be 34.5 MPa, while in frames with high-strength concrete, it is 82.7 MPa. For instance, for archetypes with normal concrete, the effective compressive strength of core and cover concrete in the RC columns is calculated as 1.2 × 0.85 × 34.5 = 35.2 MPa and 0.85 × 34.5 = 29.3 MPa, respectively. Additionally, ASTM A615 grade-75 and ASTM A615 grade-60 steels are utilized for longitudinal and transverse reinforcements, respectively. The nominal yield strength of the longitudinal and transverse reinforcements is 517 MPa and 414 MPa, respectively. The expected yield strength, obtained by multiplying R y = 1.25 to the nominal yield strengths, is employed in the models.
When modeling the beam-column components using the fiber element, it is not possible to accurately capture the additional deformations caused by the slip of reinforcement bars in the plastic hinge zone. In special MRFs, the potential for slip of reinforcement bars is often observed in the base of columns connected to the foundation. This phenomenon can increase deformations and reduce the overall frame stiffness, as well as decrease damage accumulation in the plastic hinges. Three approaches can be followed to incorporate the bond-slip effects in fiber beam-column elements. The first method involves introducing slip springs at critical regions, resembling a spring-based fiber element (Lowes et al., 2003; Mergos and Kappos, 2012; Zhao and Sritharan, 2007). The second method treats bar slip as an additional degree of freedom, employing a multi-field mixed variation principle to solve slip, stress, and strain fields, but it may become complex and iterative (Limkatanyu and Spacone, 2002; Lee and Filippou, 2015; Monti and Spacone, 2000). The third approach, which is more recent, derives the bar stress-slip relation based on an assumed bond stress distribution, modifying the stress-strain relation of reinforcement bars in the formulation of a fiber element (Feng and Xu, 2018; Kwak and Kim, 2006; Pan et al., 2017).
To address this issue, as suggested by Cordova and Deierlein (2005), the first simplified technique is adopted here as a relatively accurate and practical way to capture the additional flexibility introduced by bond slip into RC columns. This model relies on literature findings indicating that bond slip contributes to as much as 50% of flexural deformations observed in experiments conducted on fixed-fixed RC columns (Saatcioglu and Ozcebe, 1989; Saatcioglu and Grira, 1999).
The rotational stiffness of the base springs, K
rot
, is defined as follows:

The longitudinal rebars are modeled using the Steel02 material model, in which the steel yield strength is assumed to be either the expected strength value,
Composite steel beam
A composite steel beam is formed by connecting a steel beam and a concrete slab together to create a single unit. The concrete slab acts as a compression member, while the steel beam serves as a tension member. To simulate the behavior of the steel beam, the model employs the Steel02 material model. The R
y
coefficient is set at 1.1, following the AISC recommendation for standard steel beams. The steel beams are assumed to be made of ASTM A572 grade-50, characterized by a nominal yield strength of 345 MPa. For the concrete slab, Concrete02 and Steel02 material models are employed to simulate the nonlinear behavior of concrete slab and steel bars, respectively. Cordova and Deierlein (2005) suggested that for an appropriate behavior modeling of the composite beam, the effective width of the composite slab can be taken as the width of the underlying column of the considered joint. The concrete compressive strength is then adjusted to
Composite beam-column joint
The behavior of composite joints is described by two failure modes: panel shear and vertical bearing mechanisms, which are illustrated in Figure 4. Panel shear failure resembles the failure mode commonly observed in structural steel or reinforced concrete joints, but in composite joints, both steel and reinforced concrete elements are involved. On the other hand, bearing failure occurs at locations where the compressive stresses are high and may be related to the rigid body rotation of the steel beam inside the concrete column. These two behaviors act in series, and the smallest capacity resulting from them controls the shear strength of the panel zone. To model the joint panel of RCS system, the “Joint2D” element of OpenSees is suggested (Cordova and Deierlein, 2005), which has been widely used in the joint panel modeling of the RC MRFs (Altoontash, 2004; Haselton et al., 2011). The Joint2D element consists of a concentrated rotational spring and a set of rigid elements, as shown in Figure 5, which should model both the joint panel shear deformation and the vertical bearing deformation. The failure mechanisms of the RCS joint panel (ASCE Task Committee, 1994). (a) Panel shear. (b) Vertical bearing. Schematic of Joint2D element utilized to model the RCS joint behavior (Altoontash, 2004).

The shear deformation of the joint panel exhibits a nonlinear behavior similar to the uniaxial behavior of the typical steel material (Cordova and Deierlein, 2005). Therefore, the Steel02 material can be used to model the joint panel shear deformation. The force-deformation constitutive relationship of the Steel02 material model and its calibrated parameters are presented in Figure 6(a). On the other hand, the vertical bearing deformation follows a hysteretic behavior with pinching, which caused by the local crushing of the concrete and the formation of gaps between the concrete and the top and bottom flanges of the steel beam in successive cycles. To properly capture this behavior, the “Hysteretic” material model of OpenSees is recommended (Cordova and Deierlein, 2005). The force-deformation constitutive relationship of the Hysteretic material model is depicted in Figure 6(b). The concentrated rotational spring of the Joint2D element should model both the behavior mechanisms of the panel zone. Since the two behavior mechanisms act in series, each of them is modeled separately by a rotational spring, and then the springs are connected in series. Hysteretic material model of joint panel failure modes (Cordova and Deierlein, 2005). (a) Panel shear. (b) Vertical bearing.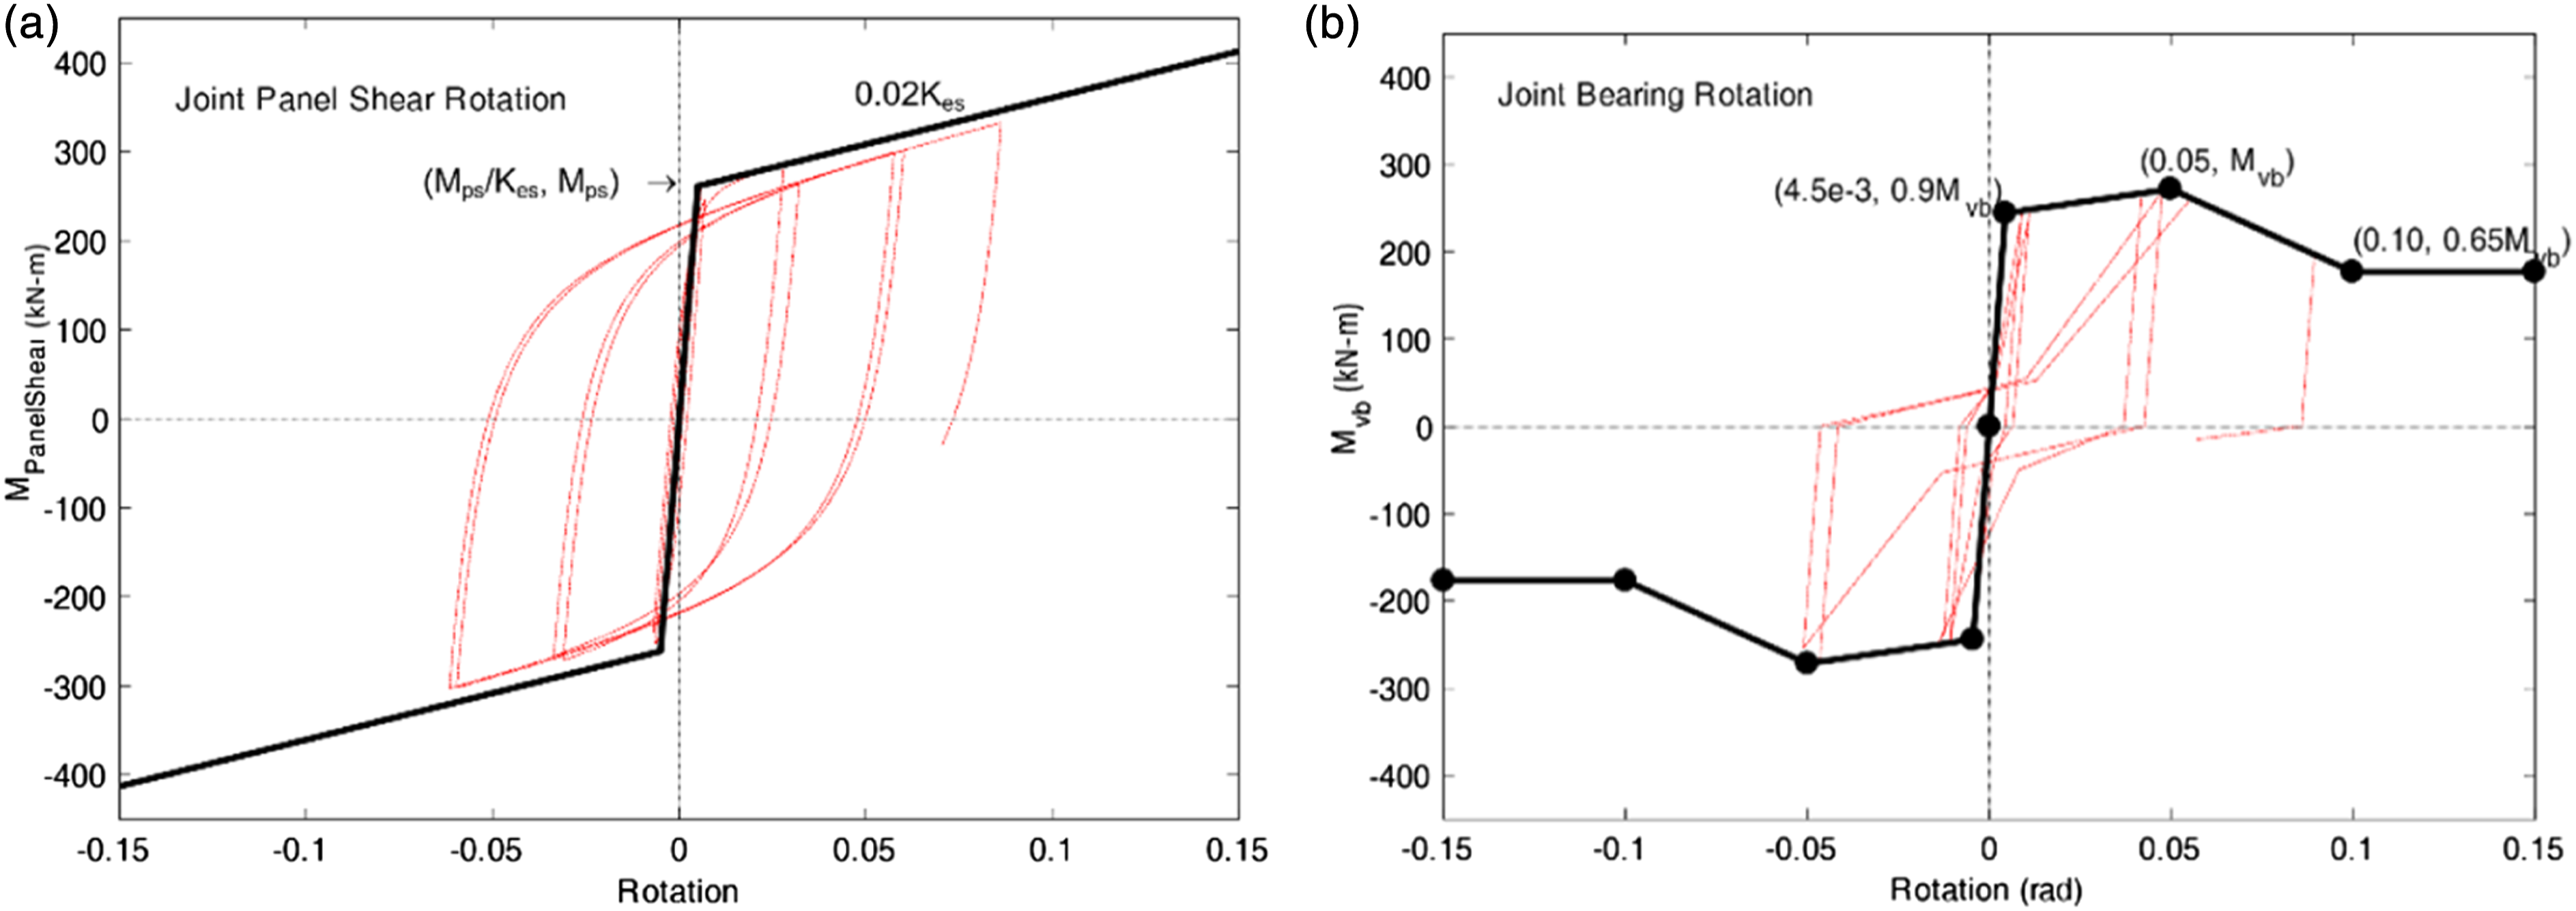
A constitutive relationship should be defined for each behavior mechanism. To model the panel shear deformation, the panel shear strength and the initial stiffness of the monotonic backbone curve are required. The panel shear strength, 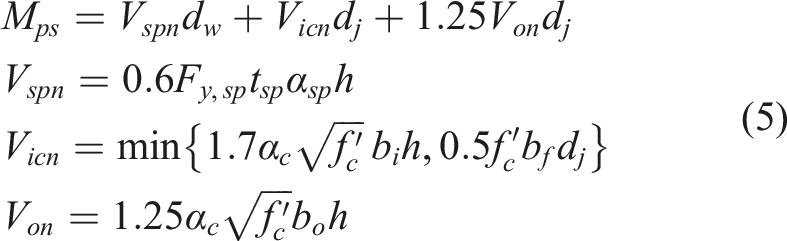
The panel shear initial stiffness, 
Regarding the vertical bearing deformation, the hysteretic constitutive model is calibrated by the results of the experimental tests. The vertical bearing capacity of the RCS joint panel, 

Validation of the analytical model
To ensure that the analytical model properly predicts the behavior of the RCS MRF system, it is necessary to conduct a validation study. For this purpose, the results of five separate experimental tests are chosen for the validation. The selected tests are categorized into three groups: (1) component-level (Bursi and Gramola, 2000; Tanaka, 1990), (2) joint-level (Alizadeh et al., 2015; Kanno, 1993), and (3) frame-level (Cordova and Deierlein, 2005).
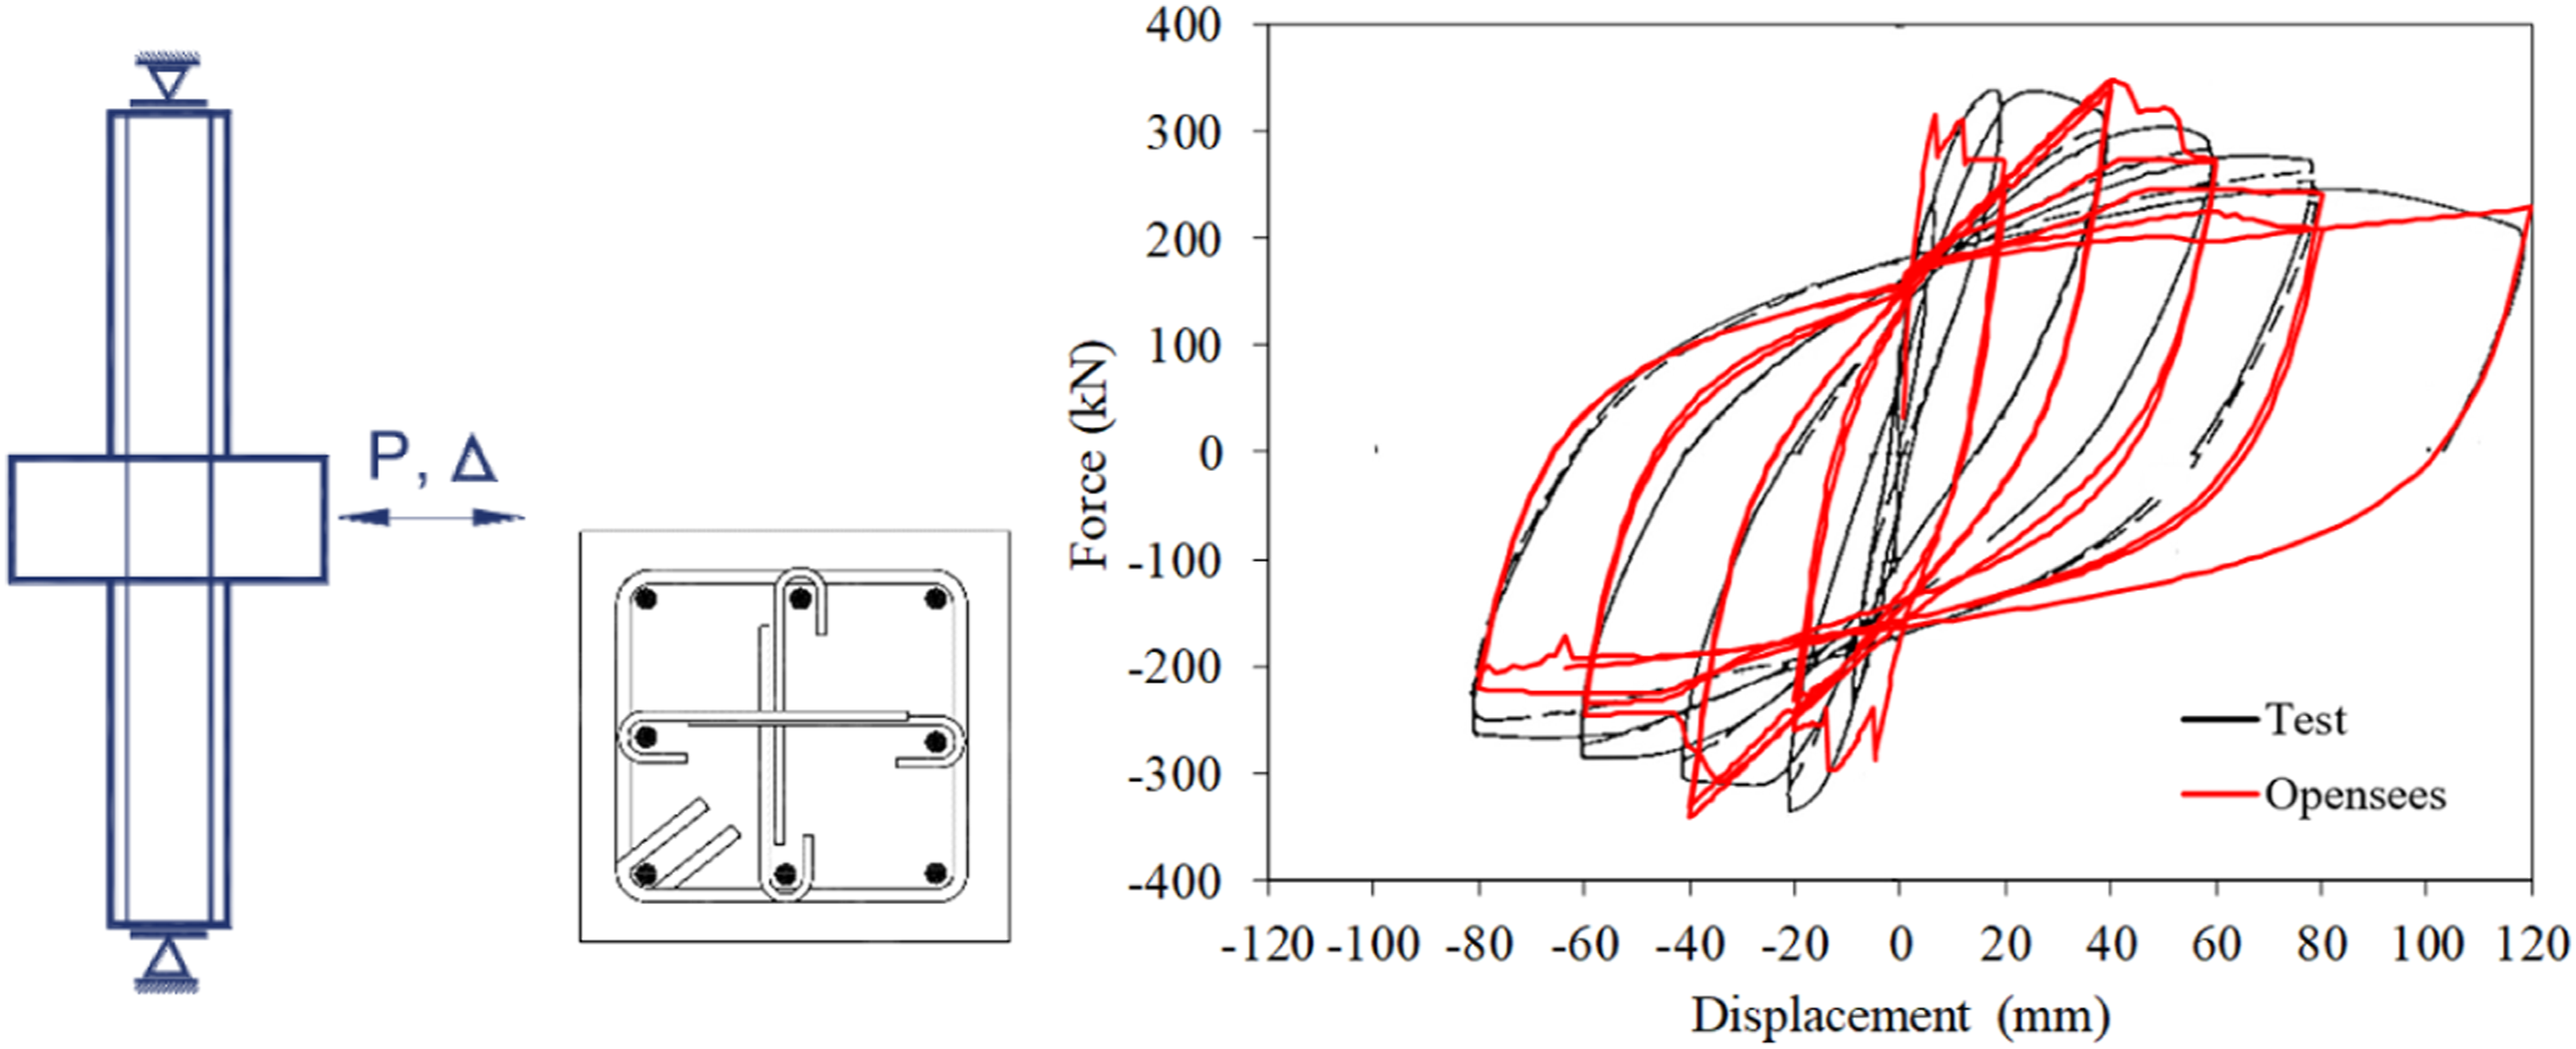
The first set of experimental tests includes a composite beam test performed by Bursi and Gramola (2000: F.C. specimen) and an RC column test done by Tanaka (1990: specimen #4). Both tests were conducted under quasi-static cyclic loads. The test setup schematics for the composite beam and RC column specimens are shown in Figures 7 and 8, respectively. Nonlinear analytical models are created for the selected specimens based on the assumptions described earlier. These models are analyzed under the same loading protocol as that of the experimental tests. Figures 7 and 8 compare the force-displacement curves obtained from the tests and the prepared numerical models under the cyclic loading. As seen, the composite beam model shows a high degree of consistency. The numerical model accurately predicts the linear and nonlinear behaviors and simulates the cyclic degradation in stiffness and strength with adequate accuracy. Similarly, the column model also shows a high degree of consistency, although the numerical model slightly overpredicts the unloading stiffness. Validation of nonlinear analytical model at the component level: composite steel beam (Bursi and Gramola, 2000: F.C. specimen). Validation of nonlinear analytical model at the component level: RC column (Tanaka, 1990: specimen #4).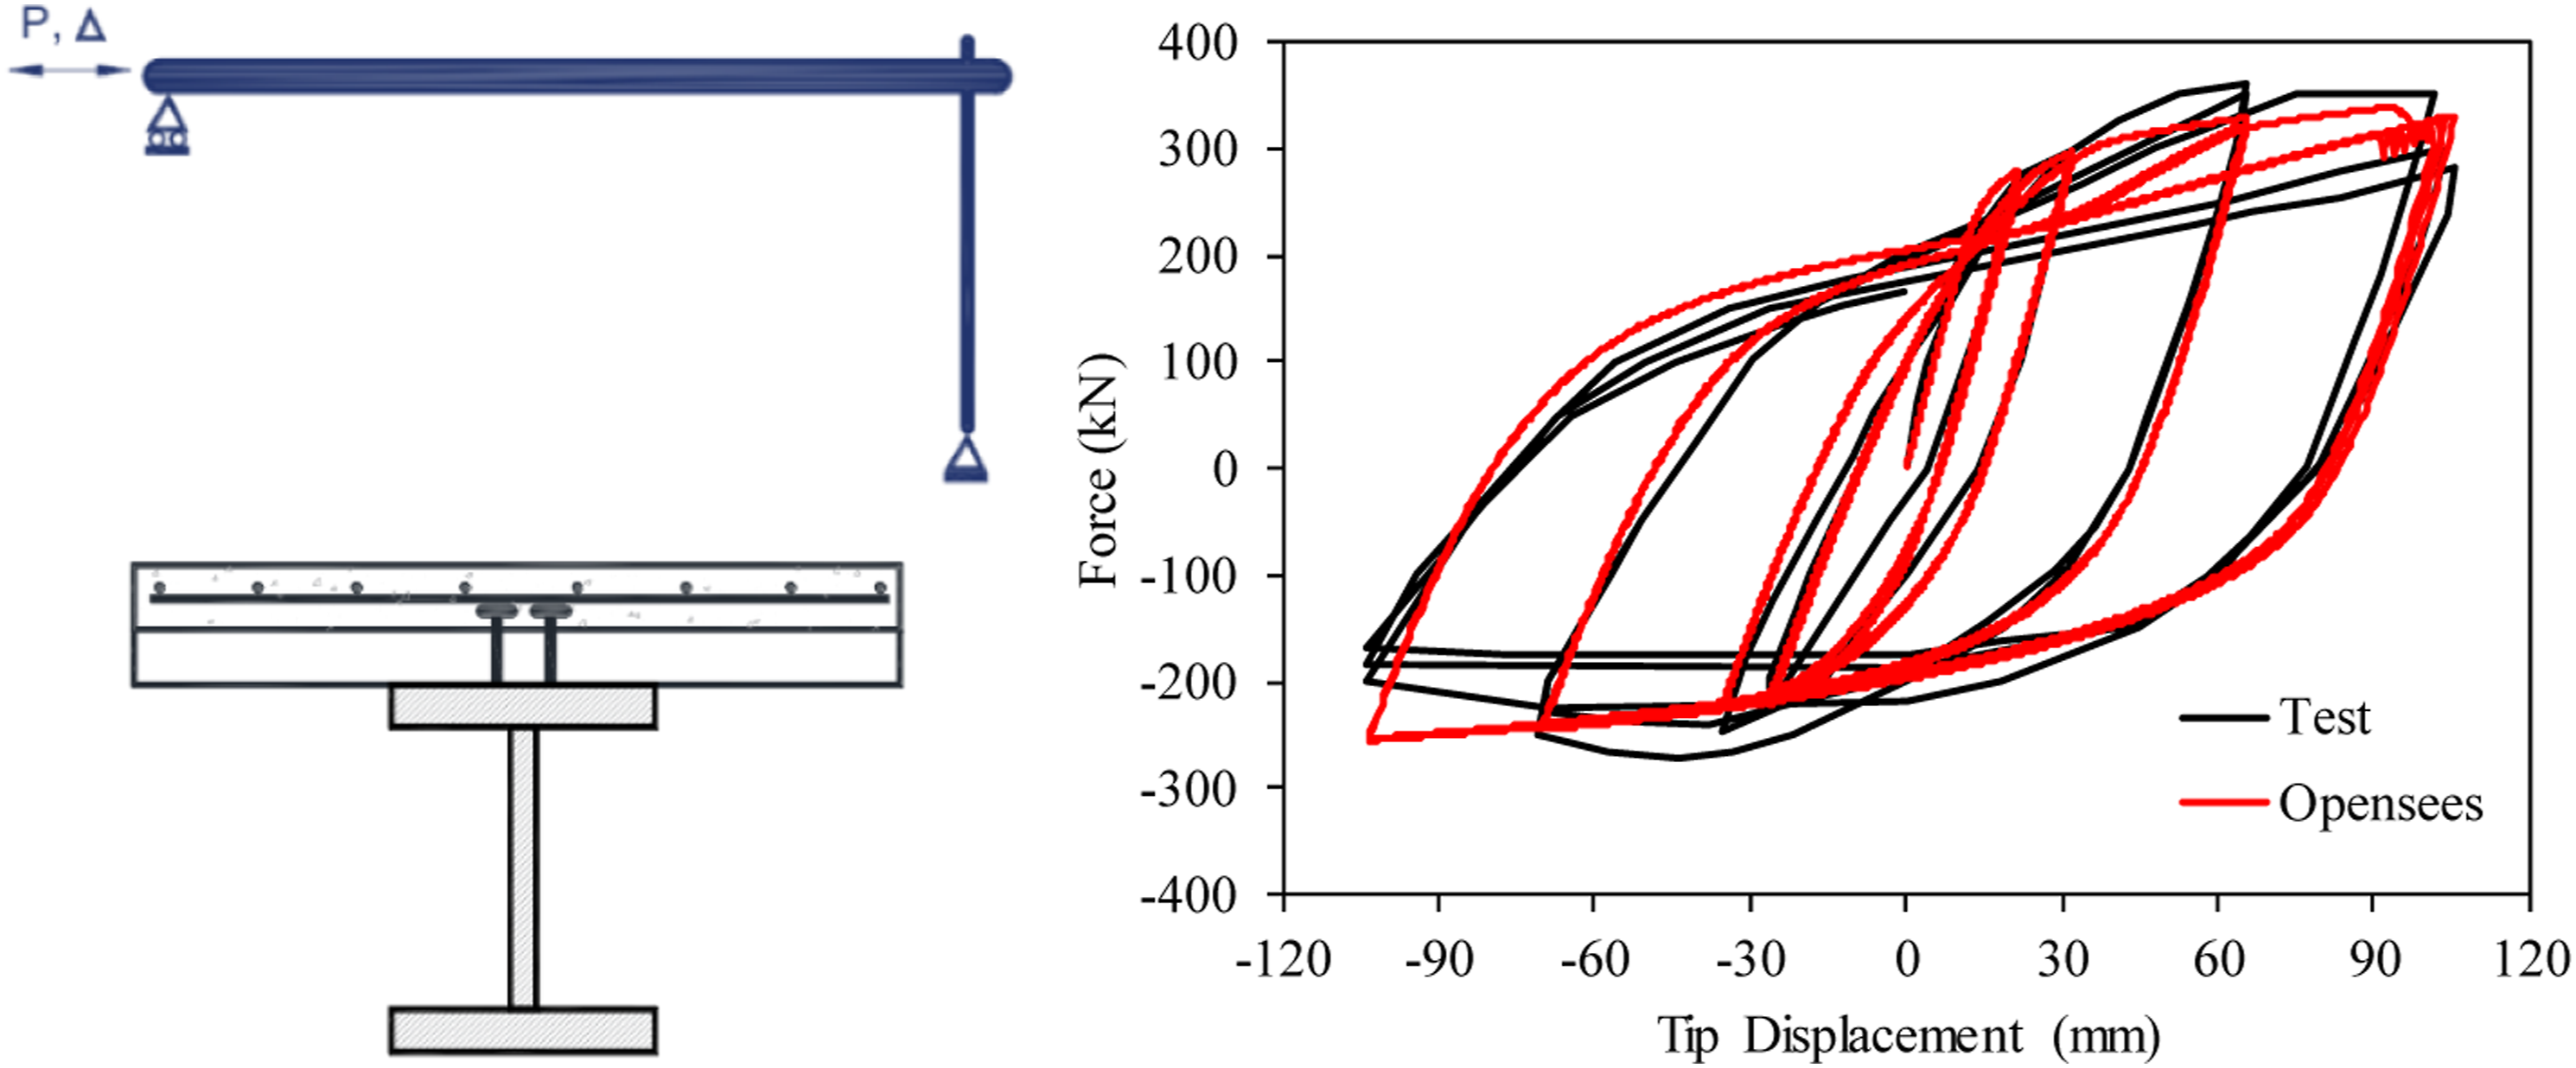
The second set of experimental tests includes joint-level tests where the specimens are an assembly of beam, column and beam-column joint. For the validation study, three specimens with different failure modes are selected from the literature, in which the joint failure occurs due to: (1) joint panel shear mechanism, (2) vertical bearing mechanism, and (3) beam failure. The first two specimens were tested by Kanno (1993: JS3-0 and OJB1-0 specimens), and the third specimen was tested by Alizadeh et al. (2015: specimen #1). Figure 9 compares the response curves obtained from the proposed analytical models and the results of the experimental tests. The schematic of each test setup is also shown in the figure. As can be seen, a high compatibility has been achieved. The created numerical models well predict the linear and nonlinear cyclic behaviors, including the initial stiffness, peak strength, unloading stiffness, as well as the cyclic degradation in stiffness and strength and the pinching behavior. Validation of nonlinear analytical model at the joint level. (a) Joint panel shear mechanism (Kanno, 1993: JS3-0 specimen). (b) Vertical bearing mechanism (Kanno, 1993: OJB1-0 specimen). (c) Beam failure (Alizadeh et al., 2015: specimen #1).
The third experimental test selected for the validation study is a full-scale three-story MRF with three spans that has been subjected to various static and dynamic load patterns by Cordova and Deierlein (2005). The test results were used to evaluate the performance of the RCS connection and to calibrate the assumptions regarding the analytical model. The full-scale model developed by Cordova was sequentially excited under several real ground motions at different seismic hazard levels. First, the model was excited under the ChiChi 1999 record with a hazard level of 50% in 50 years (75 years return period). Next, it was excited under the time window of t = 0–7 s of the Loma Prieta 1989 record with a hazard level of 10% in 50 years (475 years return period). In this study, the experimental results of Loma Prieta 1989 (Cordova and Deierlein, 2005) are used to validate the modeling assumptions utilized. Figure 10 compares the response curves obtained from the experimental test, and the analytical models prepared in the present study and (Cordova and Deierlein, 2005). The results indicate a high level of consistency between the response curves, supporting the suitability of the modeling assumptions used in the present study. Validation of nonlinear analytical model at the frame level: a full-scale three-story RCS MRF subject to Loma Prieta 1989 (10% in 50 years; 0–7 s) (Cordova and Deierlein, 2005).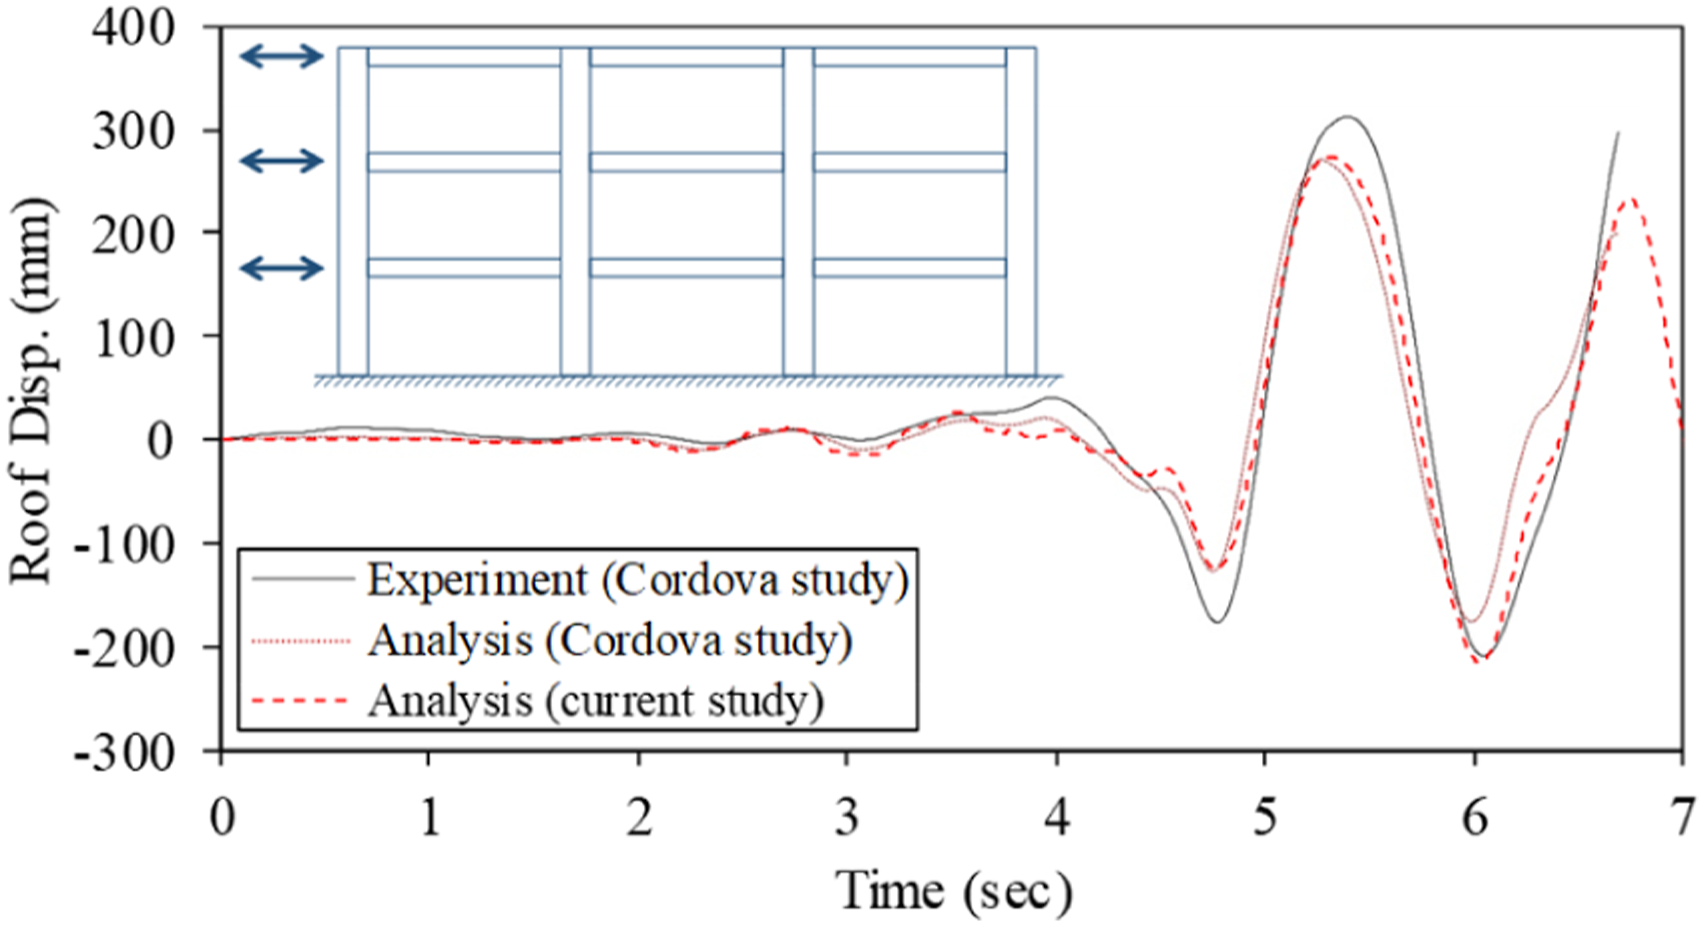
Methodology
Overall procedure
According to the FEMA P-695 methodology, the process of evaluating the seismic design coefficients requires assuming a trial value for response modification factor, R, and designing the archetypes using the assumed R. Next, the pushover and response history analyses should be conducted on the analytical model of the archetypes. The results of the pushover analysis are used to evaluate the system overstrength factor, Ω0, while the results of the response history analyses are employed to assess the acceptability of the assumed R. Finally, the deflection amplification factor, C d , is calculated based on the accepted R and the effective damping of the archetypes studied.
This study utilizes a trial response modification factor of R = 8, which is the default value suggested by ASCE 7-22 (2022). for steel and concrete composite special MRFs. The procedure for evaluating seismic design coefficients can be summarized in the following steps: 1. Calculating the system overstrength, Ω, period-based ductility, μ
T
, and the collapse margin ratio (CMR), for each archetype based on the results of the pushover and response history analyses, 2. Assessing the system overstrength factor, Ω0, 3. Determining the adjusted collapse margin ratio (ACMR) for each archetype using the spectral shape factor (SSF) based on the building fundamental period and μ
T
, 4. Determining the total system collapse uncertainty, β
tot
, based on the quality ratings of design requirements, test data, and analytical models, 5. Determining the allowable ACMRs (i.e., ACMR10% and ACMR20%) based on β
tot
, 6. Assessing the acceptability of R by comparing the evaluated ACMR values and the allowable ones, 7. Assessing the deflection amplification factor, C
d
.
Pushover analysis
A pushover analysis should be conducted to evaluate the system overstrength, Ω, and period-based ductility, μ
T
, for each archetype. The pushover curve can be used to directly evaluate Ω and μ
T
using equations (1) and (2) (FEMA, 2009).


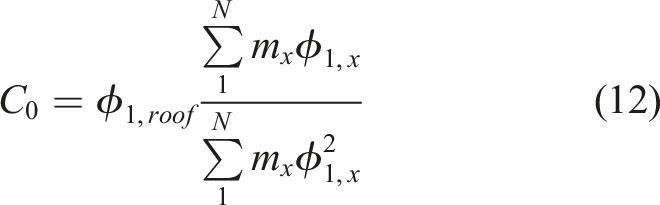
The pushover analysis is carried out for all selected archetypes. As an example, Figure 11 illustrates the pushover response curve for Building No. 6 (as defined in Table 1) with the base shear presented in terms of roof drift ratio. The figure highlights key parameters such as the maximum base shear capacity, design base shear, effective yield roof drift ratio, and ultimate roof drift ratio. Additionally, the figure displays Ω and μ
T
, which are evaluated using equations (9) and (10), respectively. Pushover analysis results of the building no. 6 model.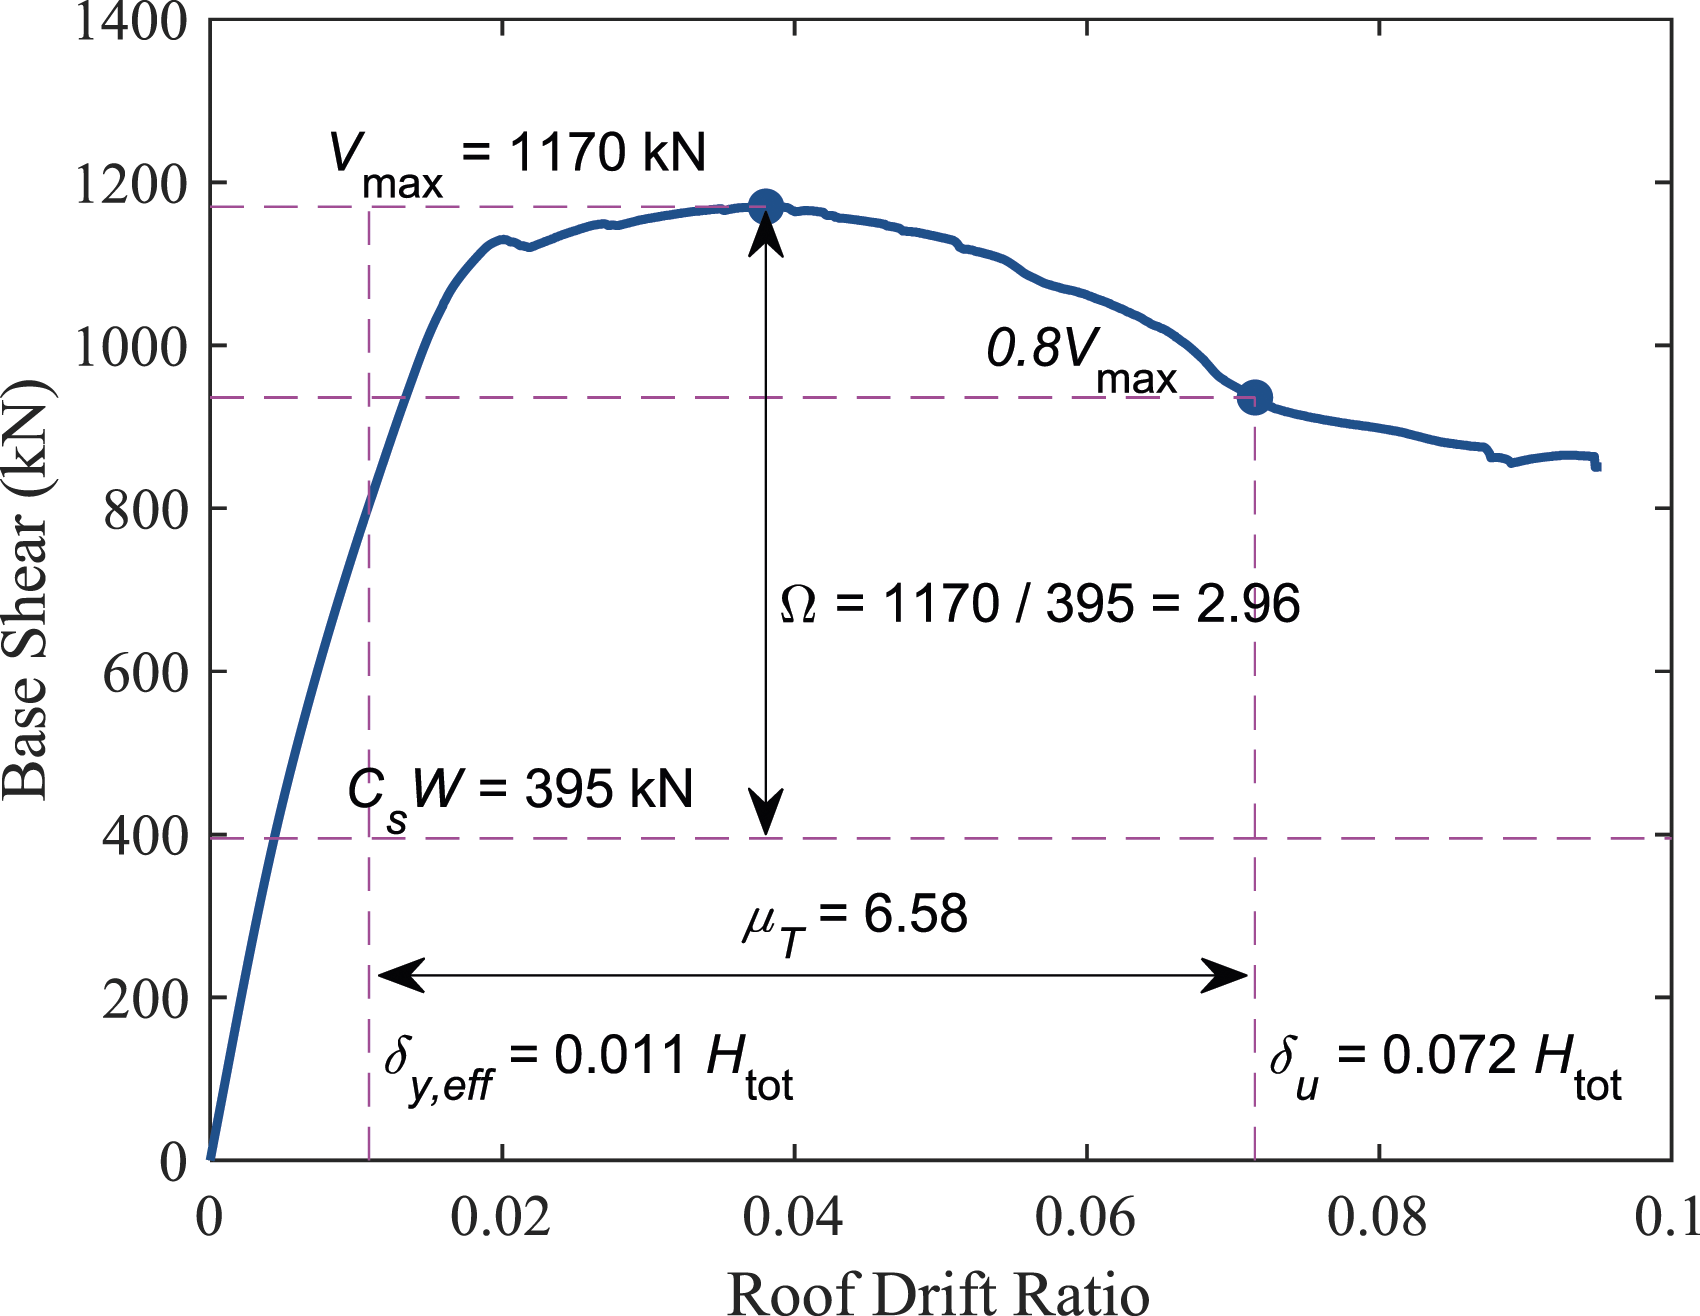
Nonlinear dynamic analysis

The set of 44 far-field ground motions (22 pairs) of FEMA P-695 (2009: Table A–4A).

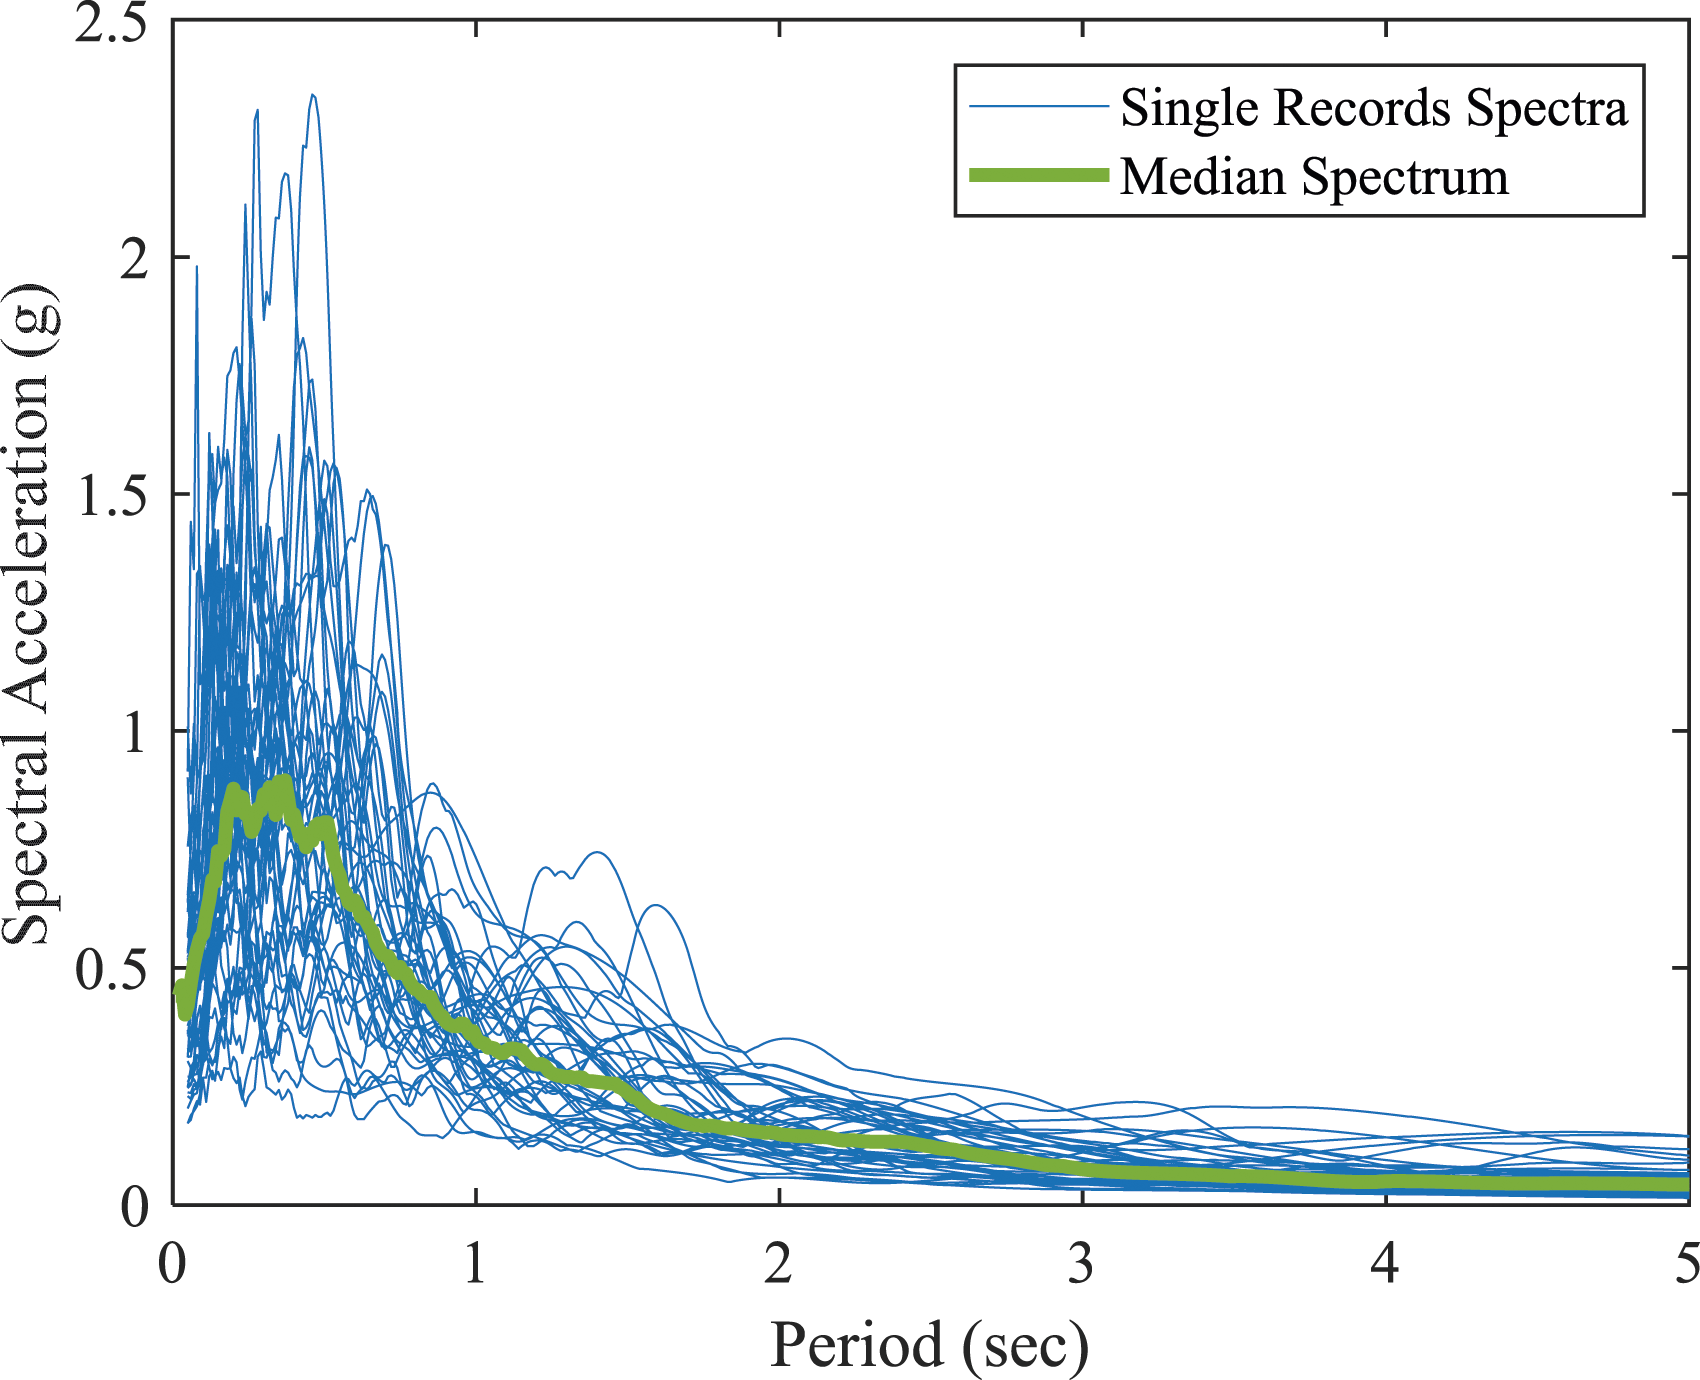
The normalized acceleration spectra of the set of 44 selected ground motions and their median acceleration spectrum.
The CMR is defined as the ratio of the median collapse intensity, 
As an example, Figure 13 shows the response history analysis results for the building No. 6. The differences between the curves are due to the record-to-record variability. The dashed lines in the figure represent the median collapse intensity and MCE intensity. For this structure, the collapse margin ratio is obtained as 5.02. Response history dynamic analysis results of the building no. 6 model.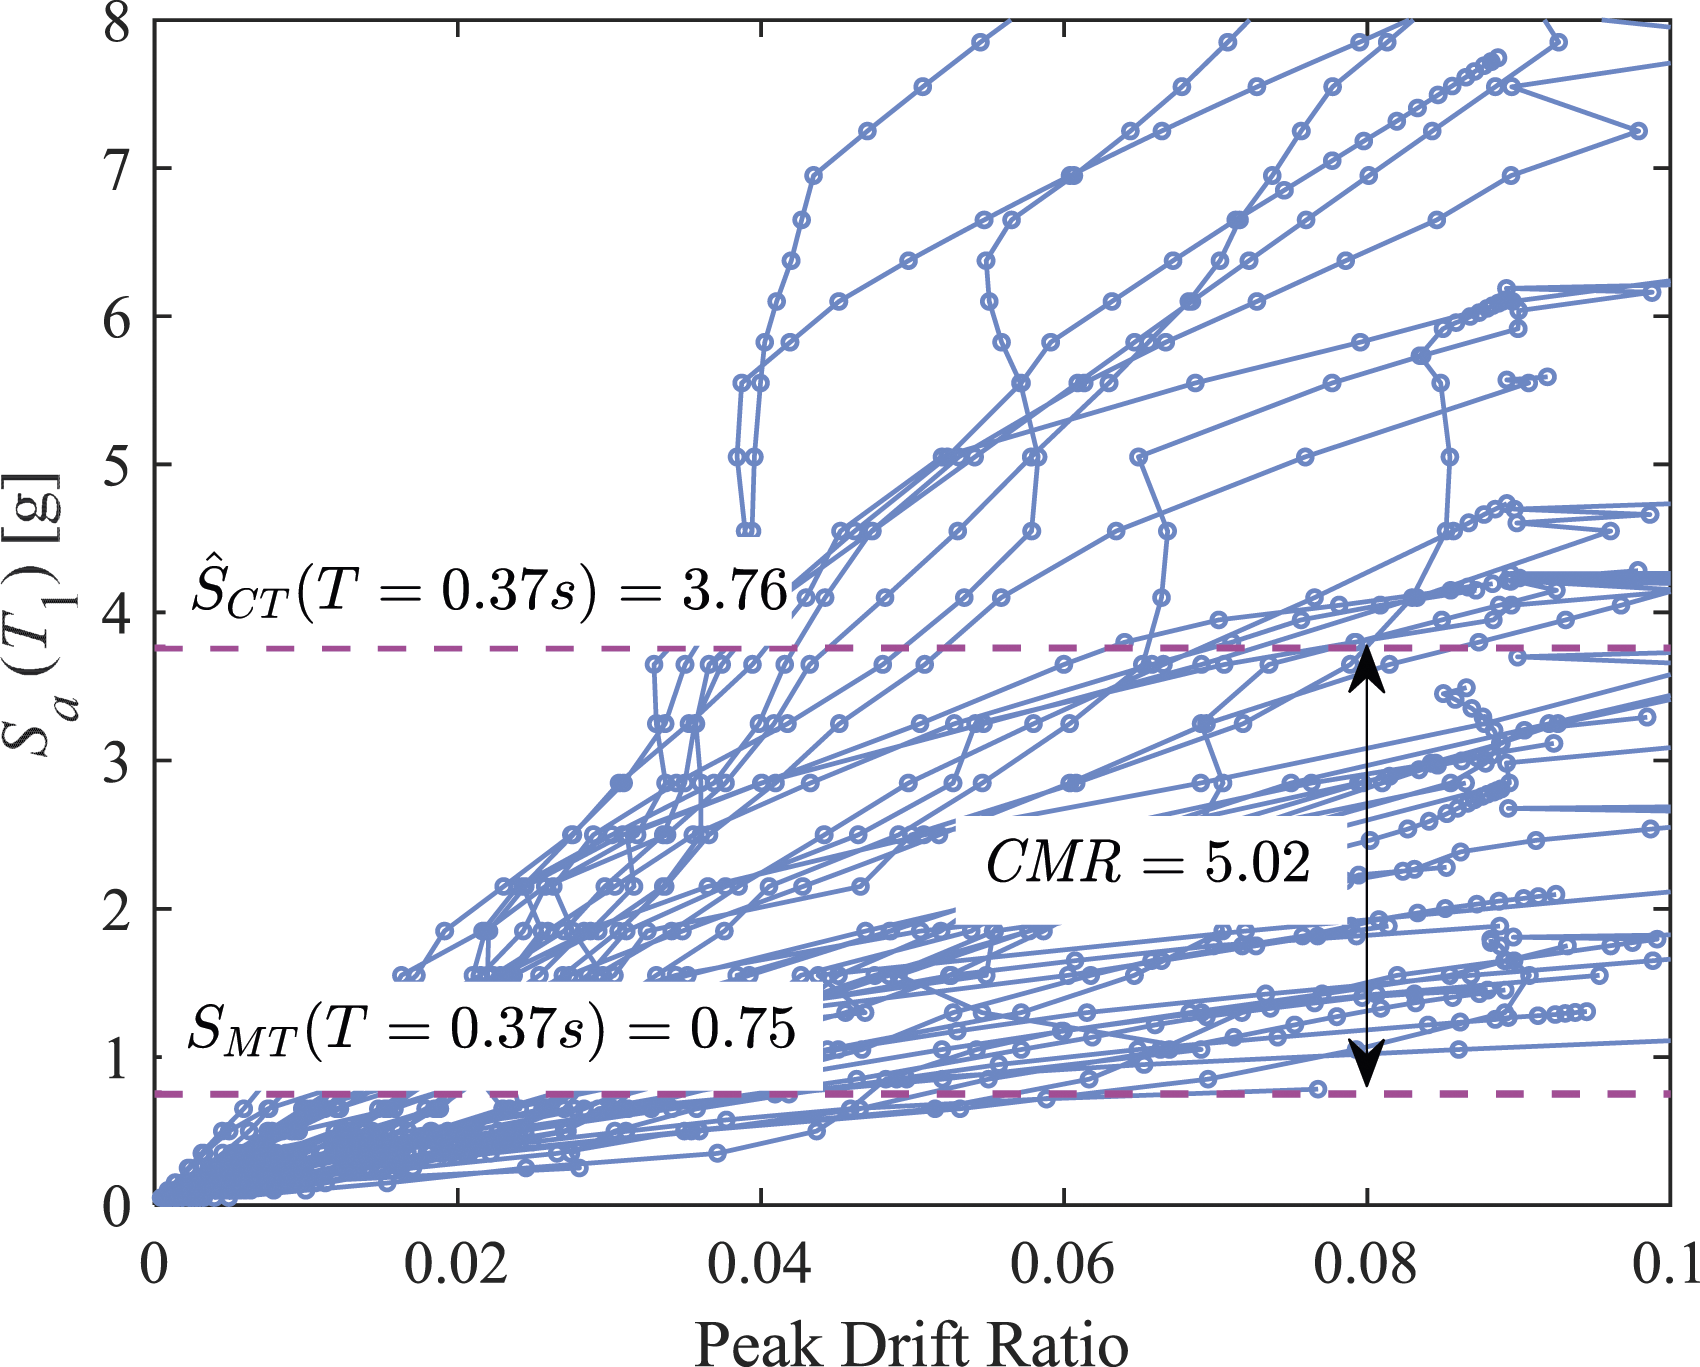
The collapse capacity and the calculated CMR are significantly affected by the frequency content or spectral shape of the ground motions. Therefore, the methodology proposes adjusting the CMR by a factor that considers the effect of the spectral shape of the ground motions. Accordingly, for each archetype, the adjusted collapse margin ratio, ACMR
i
, is evaluated using equation (15) (FEMA, 2009).
Performance evaluation
System overstrength factor (Ω0)
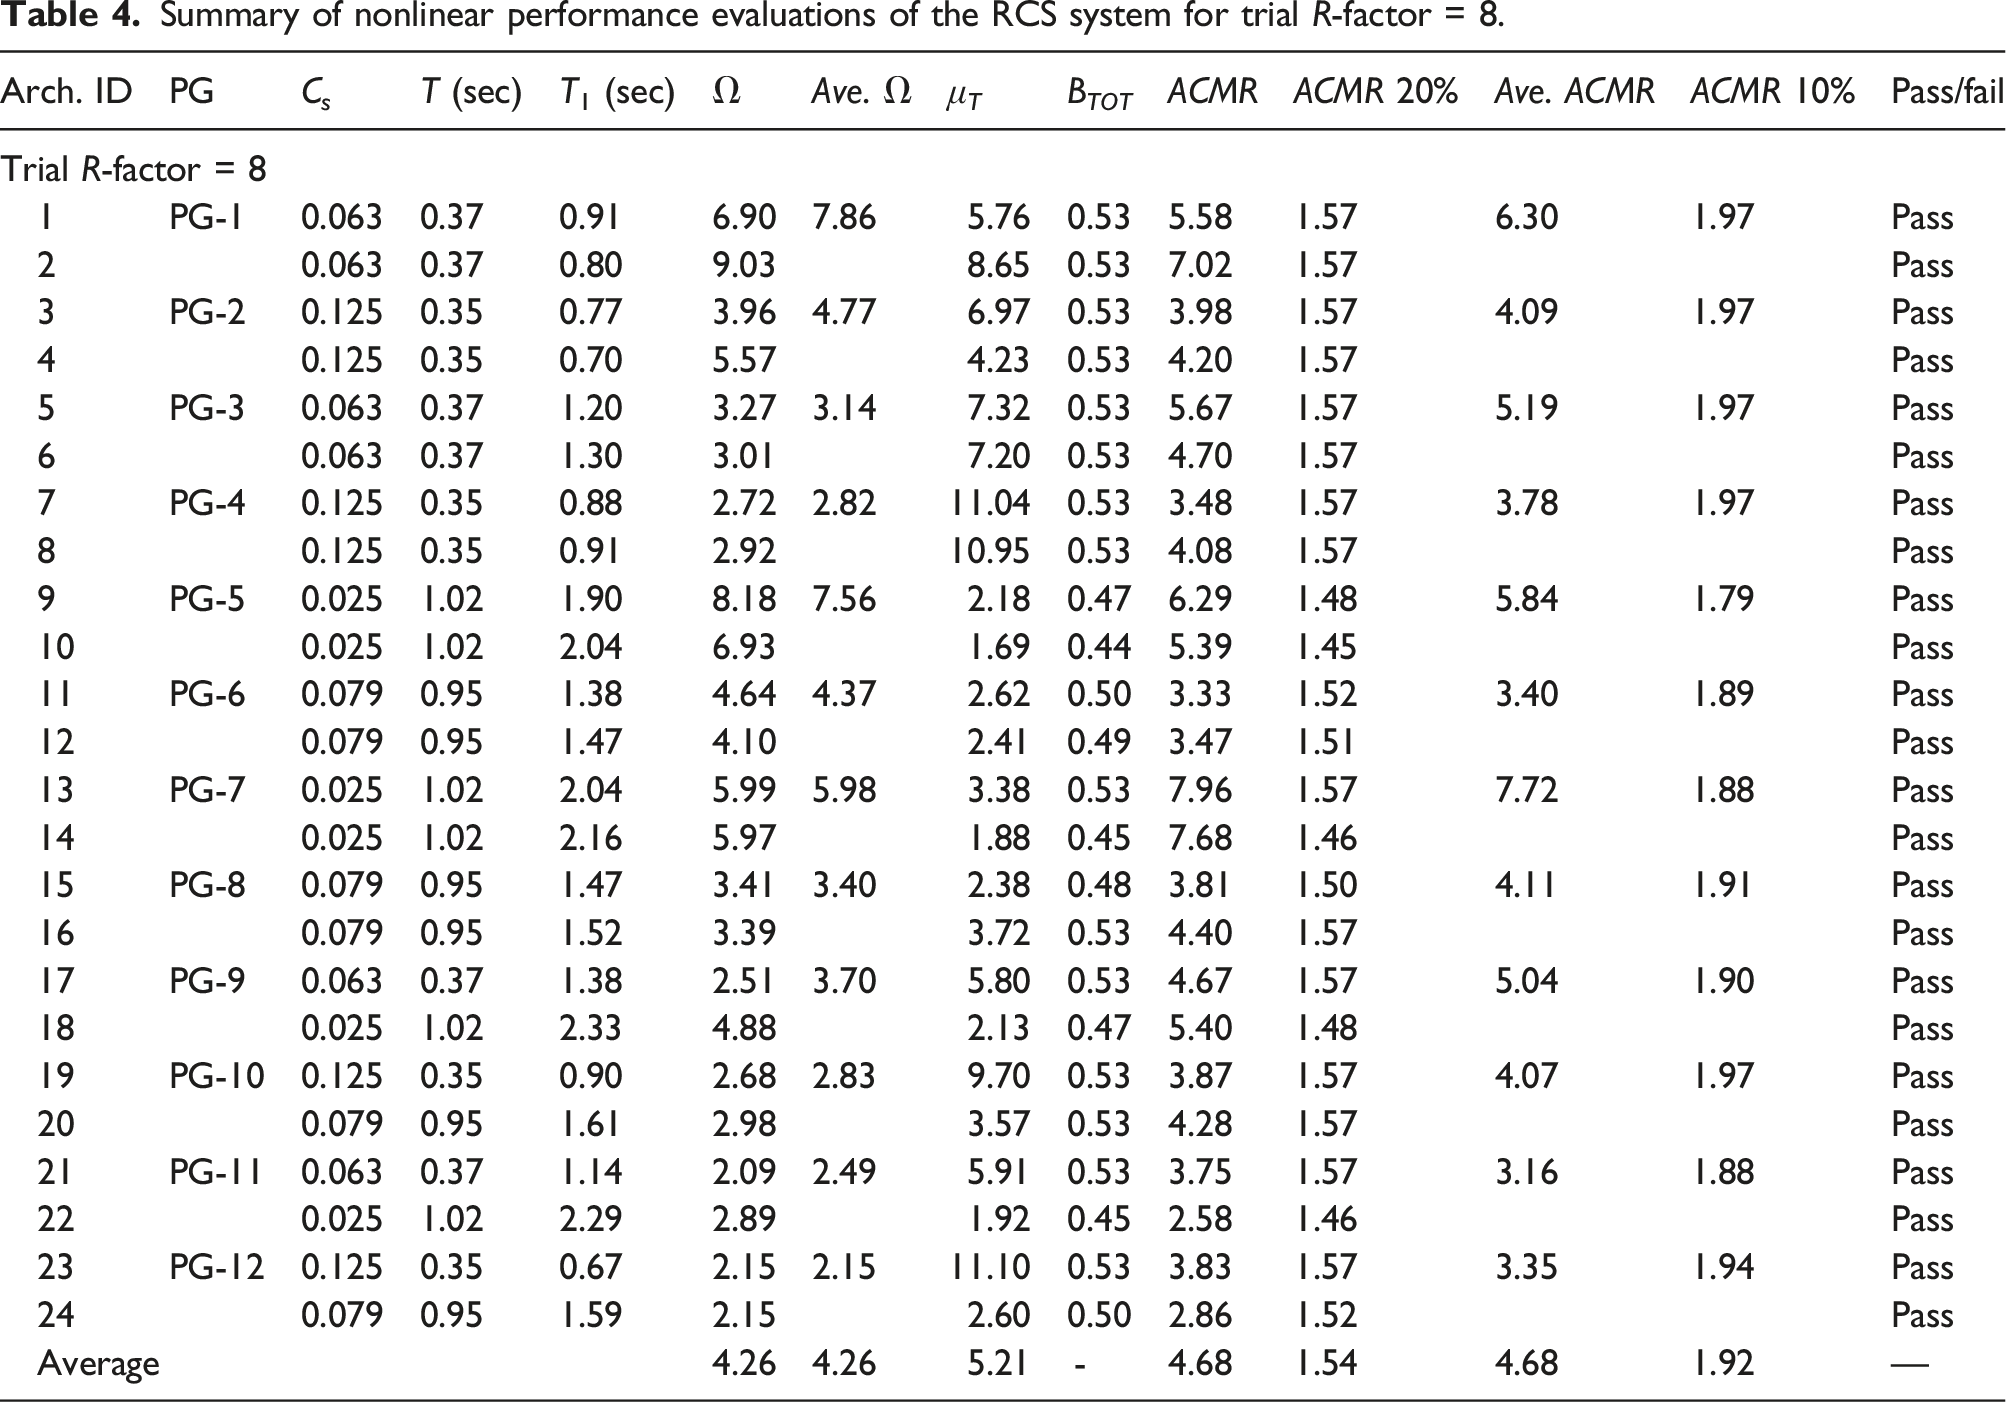
Summary of nonlinear performance evaluations of the RCS system for trial R-factor = 8.
Response modification factor (R)
According to the methodology, the trial R will be considered acceptable when the two following criteria are satisfied simultaneously: • The average ACMR of the archetypes within each performance group should exceed the acceptable collapse margin ratio corresponding to a 10% collapse probability (ACMR10%): • The ACMR of all archetypes should exceed the acceptable collapse margin ratio corresponding to a 20% collapse probability (ACMR20%):


ACMR10% and ACMR20% are determined as a function of the total system uncertainty, as suggested by the methodology (FEMA, 2009: Table 7-3). The total system uncertainty is influenced by four independent sources of uncertainty, including record-to-record uncertainty (
In the methodology, the record-to-record uncertainty is estimated as a function of the structure ductility, using equation (18) (FEMA, 2009). However, if the number of records used in the nonlinear dynamic analysis is sufficient (over 60 ground motions), the probability distribution of the structural response becomes reliable, and the record-to-record uncertainty can be directly extracted from the analysis results.
The methodology recommends suggested values for
The total dispersion parameter (
Table 4 evaluates the adequacy of the trial R-factor = 8 by comparing the ACMR values to the allowable limits (i.e., ACMR10% and ACMR20%). It can be seen that the variations of Ω and ACMR are minor within the performance groups for almost all cases. In other words, the seismic behavior of the archetypes designed within each performance group is similar. This confirms the suitability of the grouping of archetypes = in the present study. The results indicate that all individual archetypes and all performance groups (PGs) meet acceptance criteria with a high safety margin. The ACMR values range from 3.16 to 7.72, while the acceptable limits for ACMR10% and ACMR20% are around 1.92 and 1.54, respectively. Denavit et al. (2016) also showed that the ACMR values of a composite MRF system using RCFT columns can be considerably higher than the acceptance limits. Therefore, these results confirm the acceptability of the R-factor suggested by the code (ASCE/SEI, 2022) and demonstrate the high efficiency of the RCS system design requirements (Kathuria et al., 2015).
The superior seismic performance of the RCS system can be attributed to the high lateral stiffness of the RC columns and RCS joint panels, as well as to the high energy dissipation capacity of the steel beams. On the other hand, as suggested by the methodology, the design process of the archetypes assumes C d = R = 8, while the code suggests C d = 5.5 for this system. This design assumption has made the drift requirement the controlling criteria in most archetypes. As a result, the higher required lateral stiffness due to this assumption has also increased the values of Ω and ACMR. In summary, the R-factor suggested by the code is sufficient for the RCS system, but the authors suggest considering the possibility of using a larger R-factor in the design process due to the significant margin of ACMR values with the allowable limits.
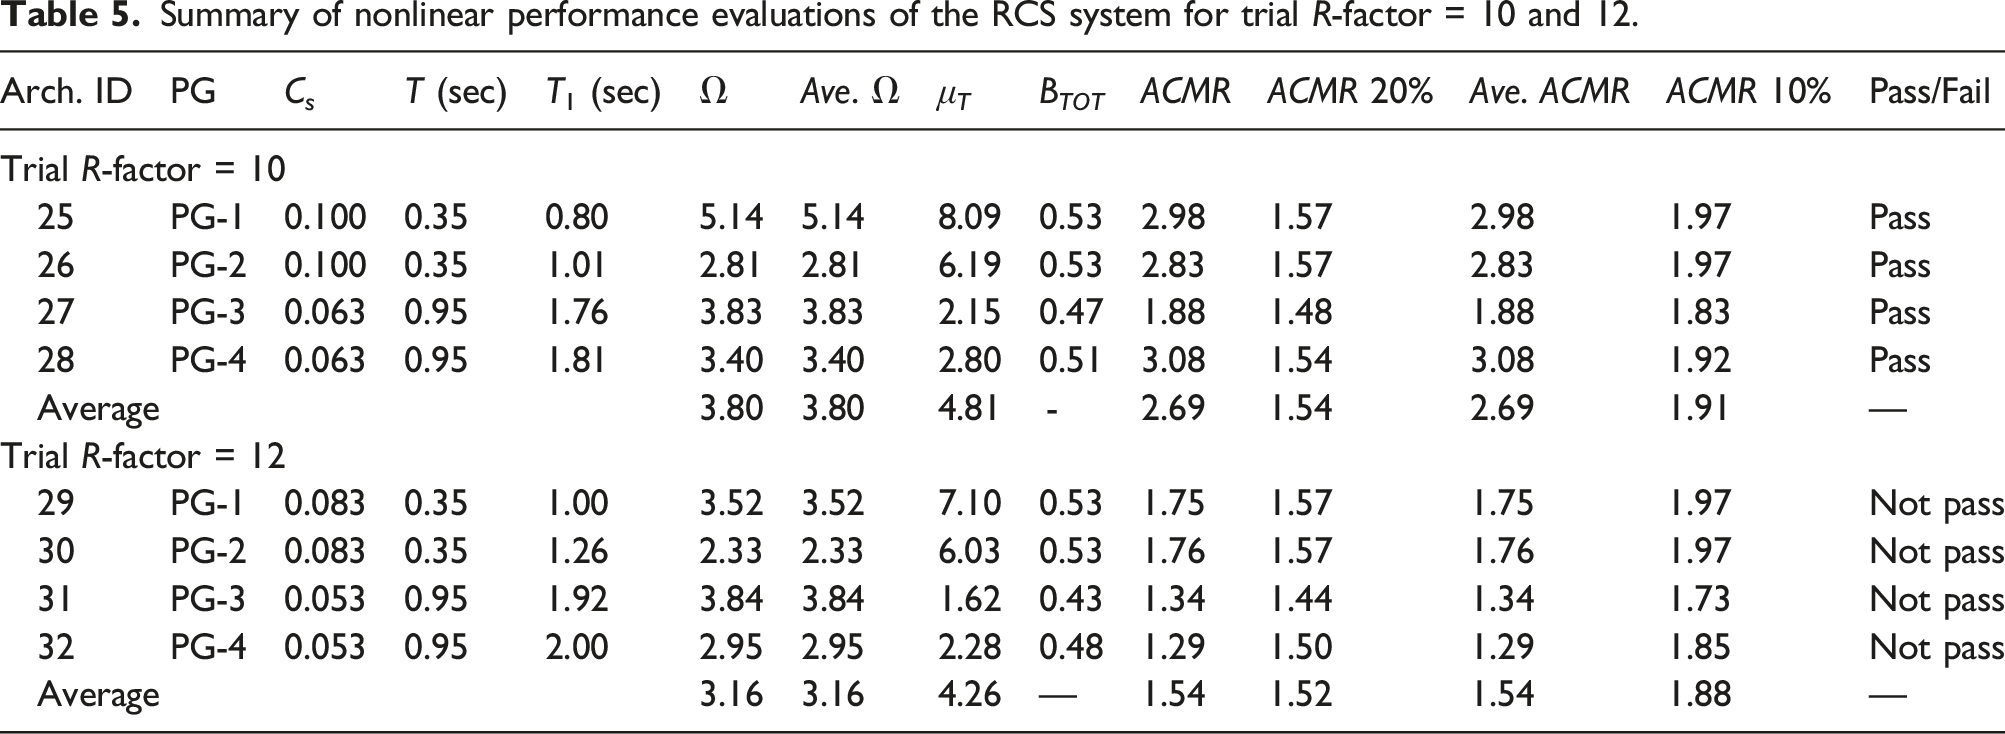
Summary of nonlinear performance evaluations of the RCS system for trial R-factor = 10 and 12.
In Figure 14, a scatter plot illustrates the relationship between ACMR and Ω values for all archetypes. The plot reveals a high correlation between ACMR and Ω values for archetypes within the same performance group or with similar characteristics, validating the appropriate grouping of archetypes. Furthermore, the values of ACMR and Ω change in almost the same direction and are strongly correlated. This implies that the factors leading to high ACMR values are the same as those that contribute to high Ω values. This observation has also been found in the results of Denavit et al. (2016) study. Scatter plot between ACMR and Ω values for all archetypes.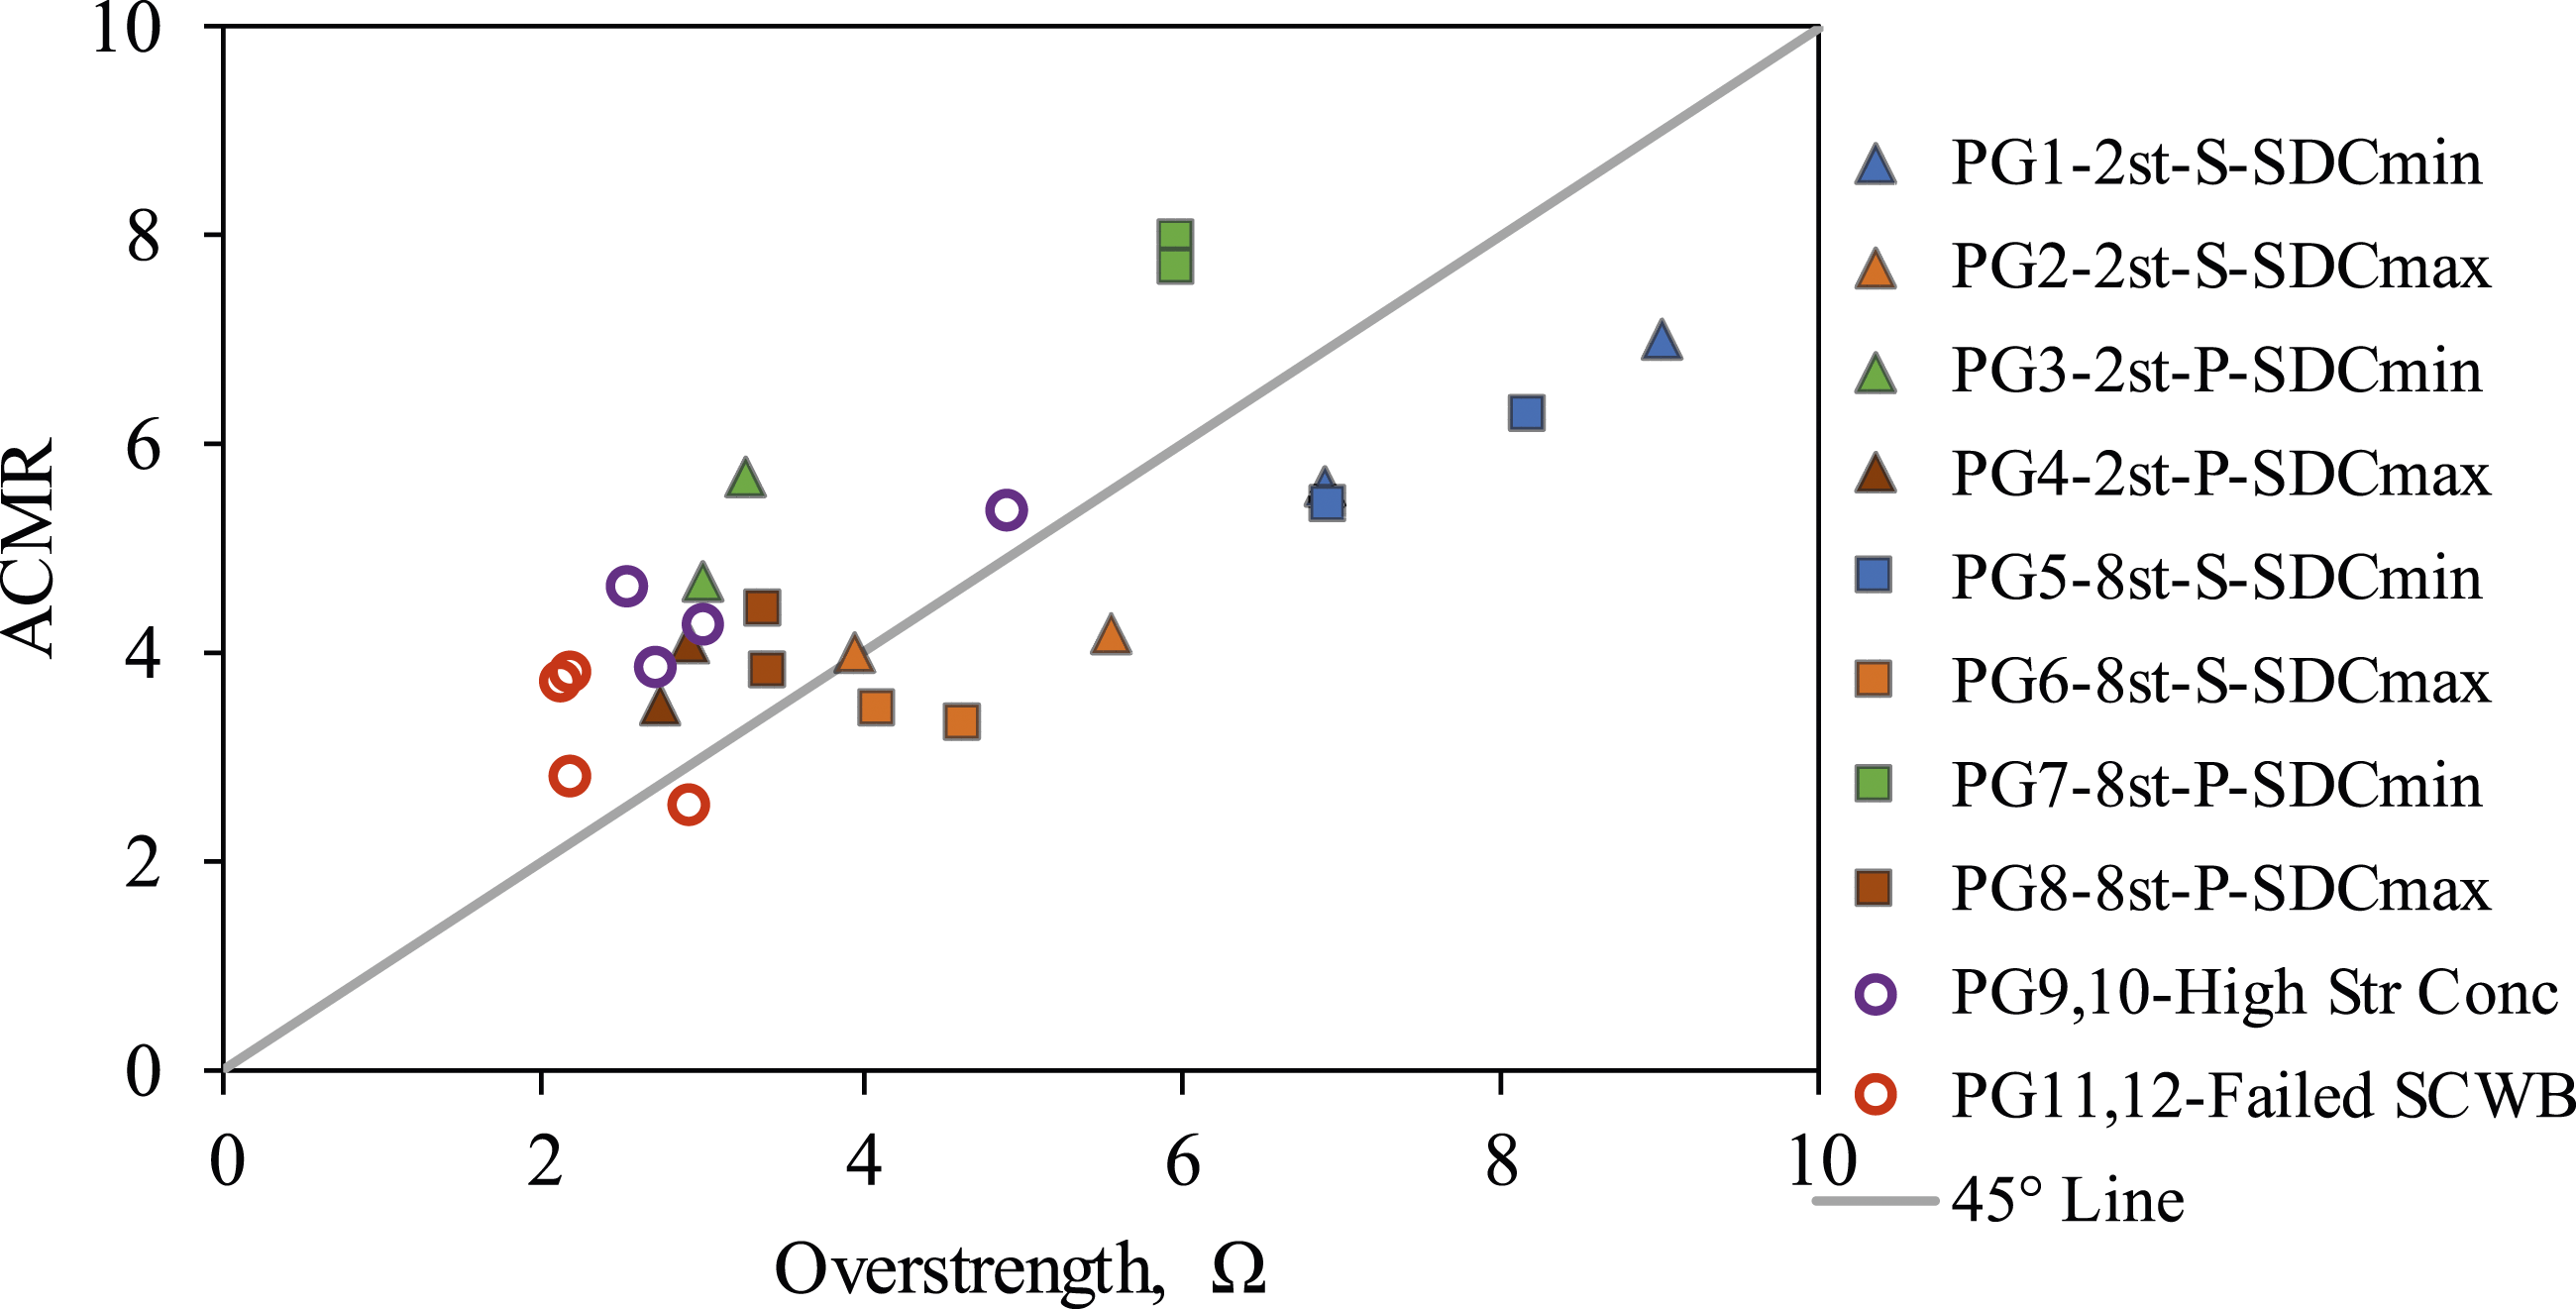
The scatter plot in Figure 14 shows that both the ACMR and Ω values decrease as the level of seismic intensity increases. Moreover, perimeter frames, which have lower gravity intensity than space frames, exhibit lower Ω values than space frames while the values of ACMR remain almost constant. This reduction in ACMR and Ω values can be attributed to the increase in the P-Delta effect under higher lateral loads, which reduces the lateral bearing capacity of the frame. However, in the case of perimeter frames, the ratio of axial force to capacity of the concrete column is much smaller than that of space frames, which results in more stable behavior of the columns under dynamic cyclic loading. This leads to less severe deterioration of stiffness and strength in successive cycles and less intensification of pinching behavior in concrete columns (Haselton et al., 2008). As a result, the lower cyclic stiffness and strength deterioration and higher P-Delta effect in the perimeter frames compared to space frames neutralize each other, leading to almost constant dynamic collapse capacity of the perimeter frames.
It can be seen that archetypes in PGs 9 and 10, which use high-strength concrete, perform similarly to those with normal concrete, albeit with slightly lower Ω values. On the other hand, archetypes in PGs 11 and 12, which fail to meet the SCWB requirement, exhibit the lowest Ω and ACMR values, indicating poor performance. However, Table 4 shows that even frames that do not meet the SCWB requirement still satisfy the collapse capacity acceptance criteria (ACMR10% and ACMR20%).
Deflection amplification factor
According to the methodology, deflection amplification factor, C
d
, can be evaluated as a function of the R-factor and the system damping using equation (20) (FEMA, 2009).
Conclusion
This study quantified the seismic design coefficients of the RCS system using the FEMA P-695 methodology. To achieve this, a set of 32 archetype buildings with a different combination of building height, beam span length, gravity load level, seismic load level, concrete strength, and column-beam strength ratio, were selected and designed. Nonlinear analytical models were developed for all archetypes using the OpenSees software. The results of five separate experimental tests were chosen to validate the assumptions utilized in developing the analytical model. The selected experimental studies include component-level, joint-level, and frame-level test specimens. Pushover and response history dynamic analyses were then conducted to evaluate the necessary data. The methodology was used to evaluate and discuss the seismic design coefficients.
Based on the results presented in the paper, it can be concluded that the design requirements of RCS system are efficient and provide a high safety margin. The superior seismic performance of the RCS system is attributed to the high lateral stiffness of the RC columns and RCS joint panels, as well as the high energy dissipation capacity of the steel beams. It has been shown that the design coefficients suggested by the code (i.e., R = 8, Ω0 = 3.0, and C d = 5.5) are adequate for the RCS system. However, the level of conservatism in the system overstrength factor and collapse margin ratio is found to be excessively high. Therefore, the feasibility of using a larger R-factor, specifically R = 10 and 12, is being investigated. The results show that with the increase in the R-factor, the ductility coefficient, system overstrength, and collapse margin ratio decrease. All archetypes designed with R = 10 complied with the allowable limits, while those designed with R = 12 did not meet the criteria. In other words, as long as the R-factor is less than R = 10, the building can be deemed sufficiently safe for seismic loadings.
The authors suggest considering the possibility of using a larger R-factor in the design process or making some relaxations in the design requirements of the RCS system due to the significant margin of ACMR values with the allowable limits. The results additionally led to the following observations: • Certain patterns are observed in the performance data of the archetypes with similar configurations, confirming the suitability of grouping the archetypes in the study, • A high correlation is found between the overstrength factor and collapse margin ratio for almost all archetypes, • All frames, even those that do not meet the SCWB requirement, still satisfy the collapse capacity acceptance criteria (ACMR10% and ACMR20%), • The archetypes that fail to meet the SCWB requirement exhibit the lowest Ω and ACMR values, indicating poor performance, • The archetypes using high-strength concrete perform similarly to those with normal concrete, albeit with slightly lower Ω values.
While further research should be carried out to validate the results and suggest further improvements in the code requirements, this study provides valuable insights into the performance of the RCS system at the system level. These findings can improve future design practices.
Footnotes
Acknowledgements
The authors are thankful to the High-Performance Computing (HPC) center of Sharif University of Technology for providing a platform to perform required analyses of this research.
Declaration of conflicting interests
The author(s) declared no potential conflicts of interest with respect to the research, authorship, and/or publication of this article.
Funding
The author(s) received no financial support for the research, authorship, and/or publication of this article.
