



Abstract
The unique structural design of an arch ring featuring varying inclination angles for individual segments causes variations in the longitudinal distribution of the temperature field d along the arch axis. This study aims to enhance the understanding of temperature fields in reinforced concrete (RC) arch bridges with diverse arch ring structural configurations during their construction phases. A comprehensive investigation into the three-dimensional distribution pattern of solar-induced temperature fields within arch ribs during the construction of RC ribbed arch bridges was conducted. A field test specifically measuring the temperature distribution across arch rib cross-sections was conducted on-site, involving an RC arch bridge constructed using the cable-stayed cantilever cast in situ method. Analyzing the monitored on-site temperature data revealed the distribution characteristics of temperature fields at the arch foot cross-section under solar radiation. By comparing these findings with international standards, a vertical temperature gradient fitting model for arch rib cross-sections under solar radiation was formulated. Drawing upon meteorological records and solar radiation principles, an adaptive numerical simulation finite element model was developed to depict the temperature field within an arch rib section. This model was rigorously verified. Subsequently, a comprehensive analysis of the three-dimensional temperature field of the arch rib under solar radiation was performed. Additionally, a three-dimensional temperature gradient fitting model was proposed, accounting for the longitudinal inclination of the bridge.
Keywords
Introduction
The investigation into temperature field distribution patterns within long-span bridge structures and the understanding of the impact of temperature effects on these structures have consistently captivated the attention of numerous scholars. A plethora of research findings exist for various bridge types. Li et al. (2023) conducted a comprehensive review, examining the temperature distribution and effects on different bridge types—girder, arch, cable-stayed, and suspension bridges—employing theoretical analysis, numerical simulations, experimental tests, and field monitoring. In a study by (Lee, 2016a; Lee et al., 2016), design-effective temperatures for steel box girders were estimated and evaluated using temperature field monitoring data gathered from both full-size steel box girder specimens and operational bridges. Investigating the Qingma suspension bridge spanning 2132 meters, Xia et al. (2013) combined numerical analysis with field monitoring to study temperature distribution and response. Shan et al. (2023a, 2023b) analyzed the global temperature field of a long-span cable-stayed bridge across different seasons, integrating heat transfer analysis and field monitoring data. They proposed a method for uniformly calculating temperature responses, highlighting the significant impact of temperature changes in tension cables, where the temperature stress ratio to the constant load stress of the main girder reached 96%. Summarizing transverse and vertical gradient laws influenced by ambient temperature, Lee (2012) conducted experimental monitoring of prestressed concrete girder segment cross-sectional temperature fields. They proposed and verified a method to calculate maximum transverse and vertical temperature differences based on daily climate information. Furthermore, Song et al. (2012) investigated temperature gradients in high-performance concrete box girders with unconventional cross-sections under solar radiation effects. They introduced a new method, employing a smooth binomial probabilistic model for stochastic processes, to determine the impact of solar radiation temperatures.
Contemporary investigations into the temperature dynamics of arch bridges primarily focus on steel or concrete-filled steel tube (CFST) arch bridges. Wang and Zhu et al. (Zhu et al., 2020, 2021, 2022a, 2022b; Wang et al., 2020) analyzed extreme temperature variations and temperature-induced responses by utilizing field monitoring data from long-span steel truss arch bridges. They examined the correlation between temperature-induced stresses and standard temperature action, cross-verifying these correlations with measurements from bars exhibiting diverse structural forms. Their findings proposed and confirmed that the relationship between temperature increment and response increment serves as a viable index for evaluating bridge performance. Zhou et al. (2022a, 2022b), focusing on large-diameter CFST full-size temperature field components experiencing intense radiation and substantial daily ambient temperature fluctuations, introduced a calculation method for CFST temperature fields. They established associations between the temperature field and parameters such as solar radiation, wind speed, and ambient temperature. Additionally, they proposed an optimization technique for transverse filling sequences and filling time intervals, considering the temperature’s impact. Drawing from CFST component tests, Liu et al. (2019, 2020) investigated a temperature gradient model for CFST bridges. They formulated and validated a predictive formula for the temperature gradient of steel pipe components with arbitrary inclination angles. Yang et al. (2020) studied the thermal characteristics of large-diameter CFST components under solar irradiation.
The advancement of reinforced concrete (RC) arch bridges in mountainous bridge construction has been swift owing to their aesthetic appeal, structural robustness, and economical maintenance during operational periods (Tian et al., 2022). The construction process for the arch rings of RC arch bridges is protracted, often leaving the arch rings exposed throughout. The unique structural configuration of the arch ring, with longitudinal segments featuring varying inclination angles, results in disparate levels of solar radiation across each segment. Hence, the longitudinal solar temperature differences along the arch axis of the arch ring warrant careful consideration. However, limited scholarly attention has been directed toward studying temperature fields and their impacts on long-span RC arch bridges. Following extensive monitoring of concrete arch bridge construction, Inaudi et al. (2002) concluded that temperature-induced deformation is comparable in magnitude to that caused by dead loads. Nevertheless, Inaudi solely examined the influence of temperature effects on deformation based on prolonged monitoring data, without delving into the distribution patterns of the temperature field within the arch cross-section. Examining the thermal behavior of a concrete box girder arch bridge under convection and solar radiation, Wang et al. (2016) conducted on-site temperature field tests, incorporating meteorological parameters. They analyzed temperature-induced stress and deformation using a finite element model (FEM). However, Wang’s study pertained to the Melan arch, featuring a built-in CFST in its arch cross-section, leading to variations in cross-sectional heat transfer compared to traditional RC arch bridges. RC arch bridges with separated arch ribs typically feature a substantial aspect ratio in their arch rib section, whereas Wang’s research focused on a single-box multi-chamber cross-section with a smaller aspect ratio. Consequently, the applicability of the research findings to large aspect ratios of single-box single-compartment arch rib sections remains uncertain. Currently, the study of three-dimensional temperature fields in the arch ribs of RC arch bridges with separated arch ribs remains an underexplored area of research.
This study aims to investigate the three-dimensional distribution pattern of solar-induced temperatures in a high-aspect-ratio arch rib during the construction phase of an RC arch bridge. The research centers on an RC arch bridge, featuring a span of 335 m, constructed using the cable-stayed cantilever cast-in-situ method. A temperature field test is conducted on the arch rib cross-section during the construction phase. The study summarizes the temperature field distribution pattern of the arch rib’s foot section and proposes a vertical temperature gradient fitting model for the concrete box arch rib section, aligning with international specifications. Utilizing meteorological data and solar radiation theory, an adaptive numerical simulation of the temperature field within the arch rib section is executed through the finite element method. This simulation is cross-referenced with field monitoring data to validate its accuracy. Additionally, a three-dimensional temperature gradient fitting model for the arch rib section is proposed, considering longitudinal variations in solar radiation temperature differences across the bridge.
Arch rib temperature field test
Introduction to temperature field test
Engineering background
The study site chosen for examination is the Shuiluo River Bridge, an RC arch bridge currently under construction in Sichuan Province. This bridge was erected using the cable-stayed cantilever cast in situ method. Its arch axis exhibits a catenary shape with an arch axis coefficient of 1.8, spanning 335 m effectively, and maintaining a rise-span ratio of 1/4.2. Featuring two separated octagonal equal-height section single-box single-compartment arch ribs, the arch ribs interconnect via intermediate diaphragms. Notably, the arch ribs boast a cross-section height of 6.5 meters and a width of 4 meters, constructed using C80 steel fiber high-performance concrete. For visual reference, please refer to Figure 1(a) for the elevation and Figure 1(b) for the cross-sectional layouts of the Shuiluo River Bridge. The layout of the Shuiluo River Bridge (Unit: cm): (a) Elevation layout; (b) Cross-sectional layout.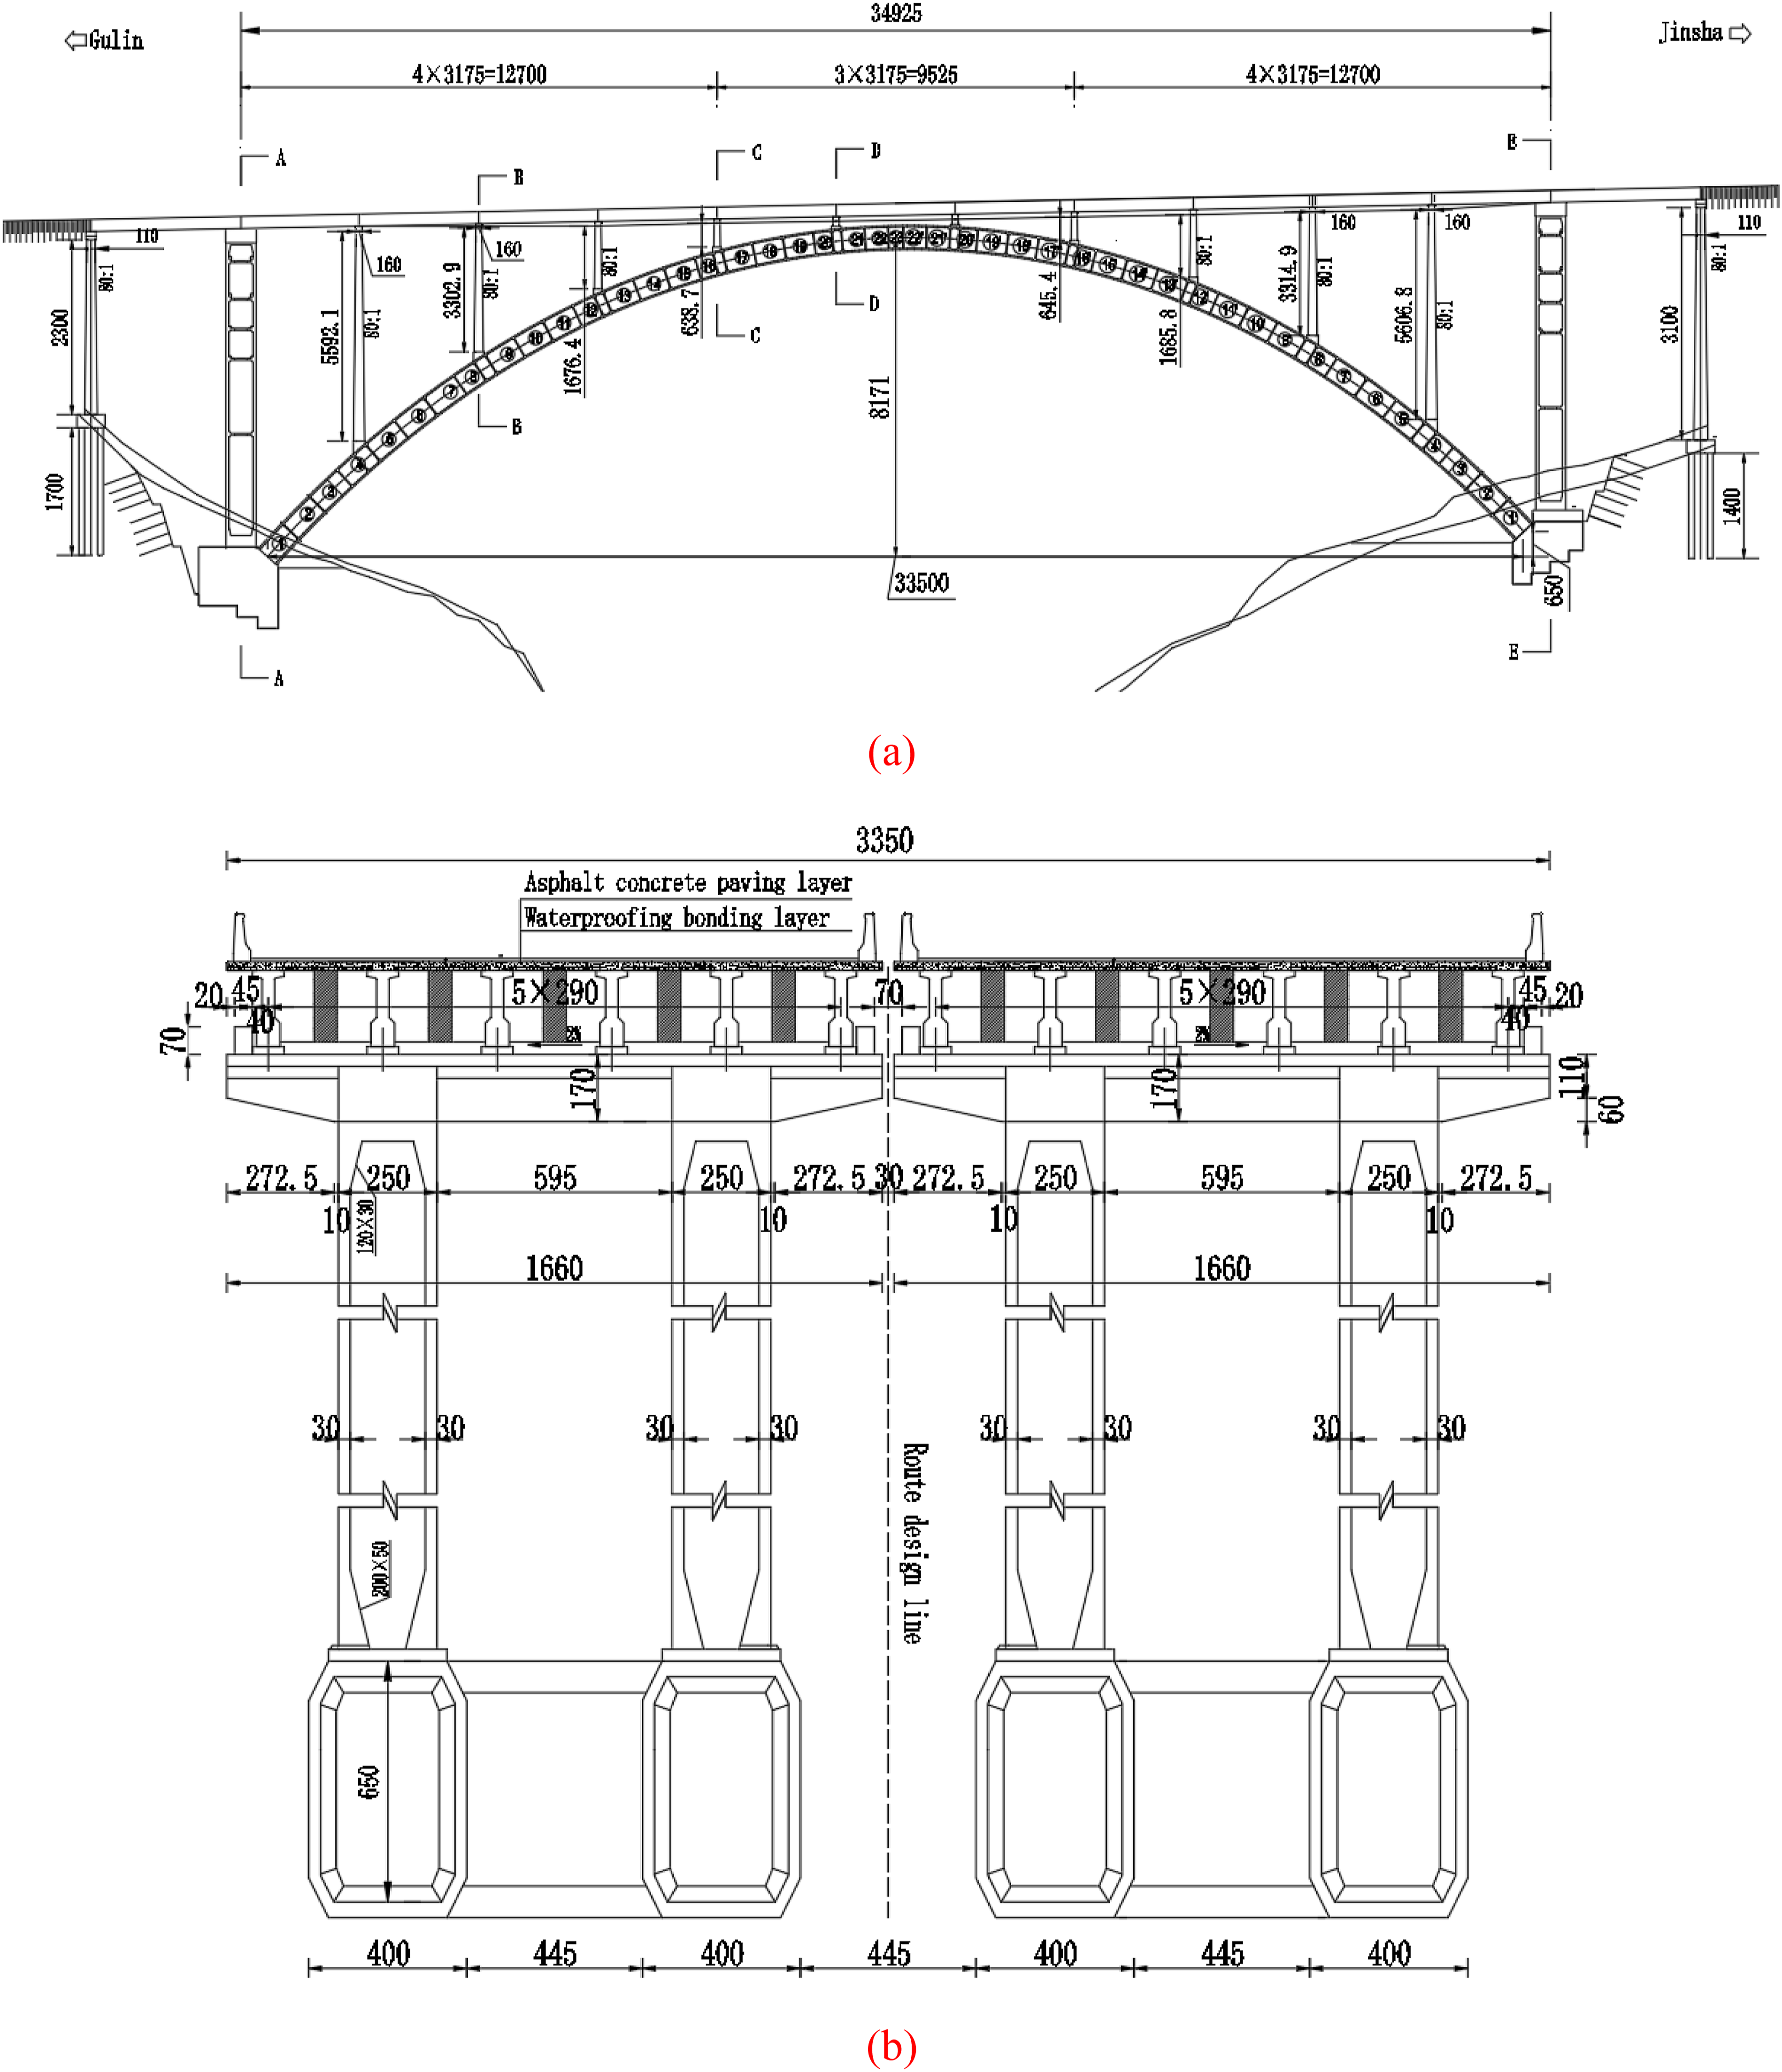
Selection of temperature test equipment
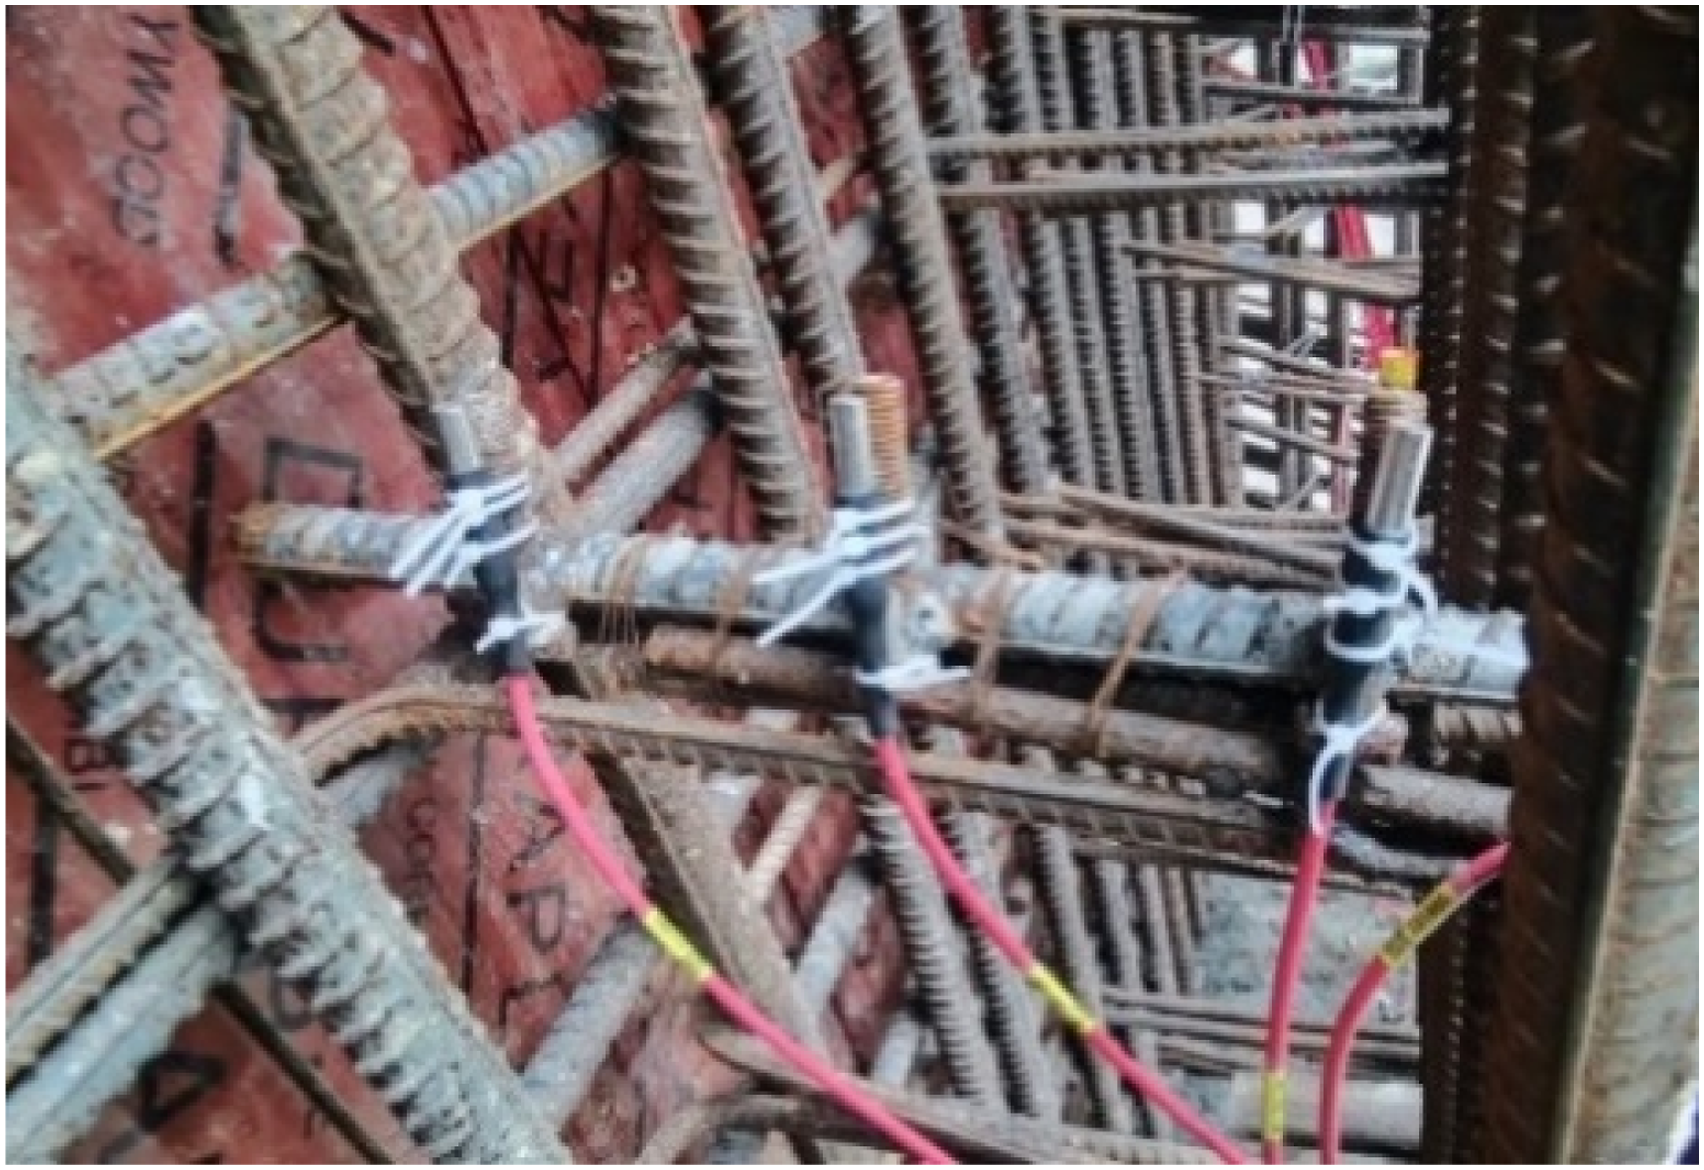
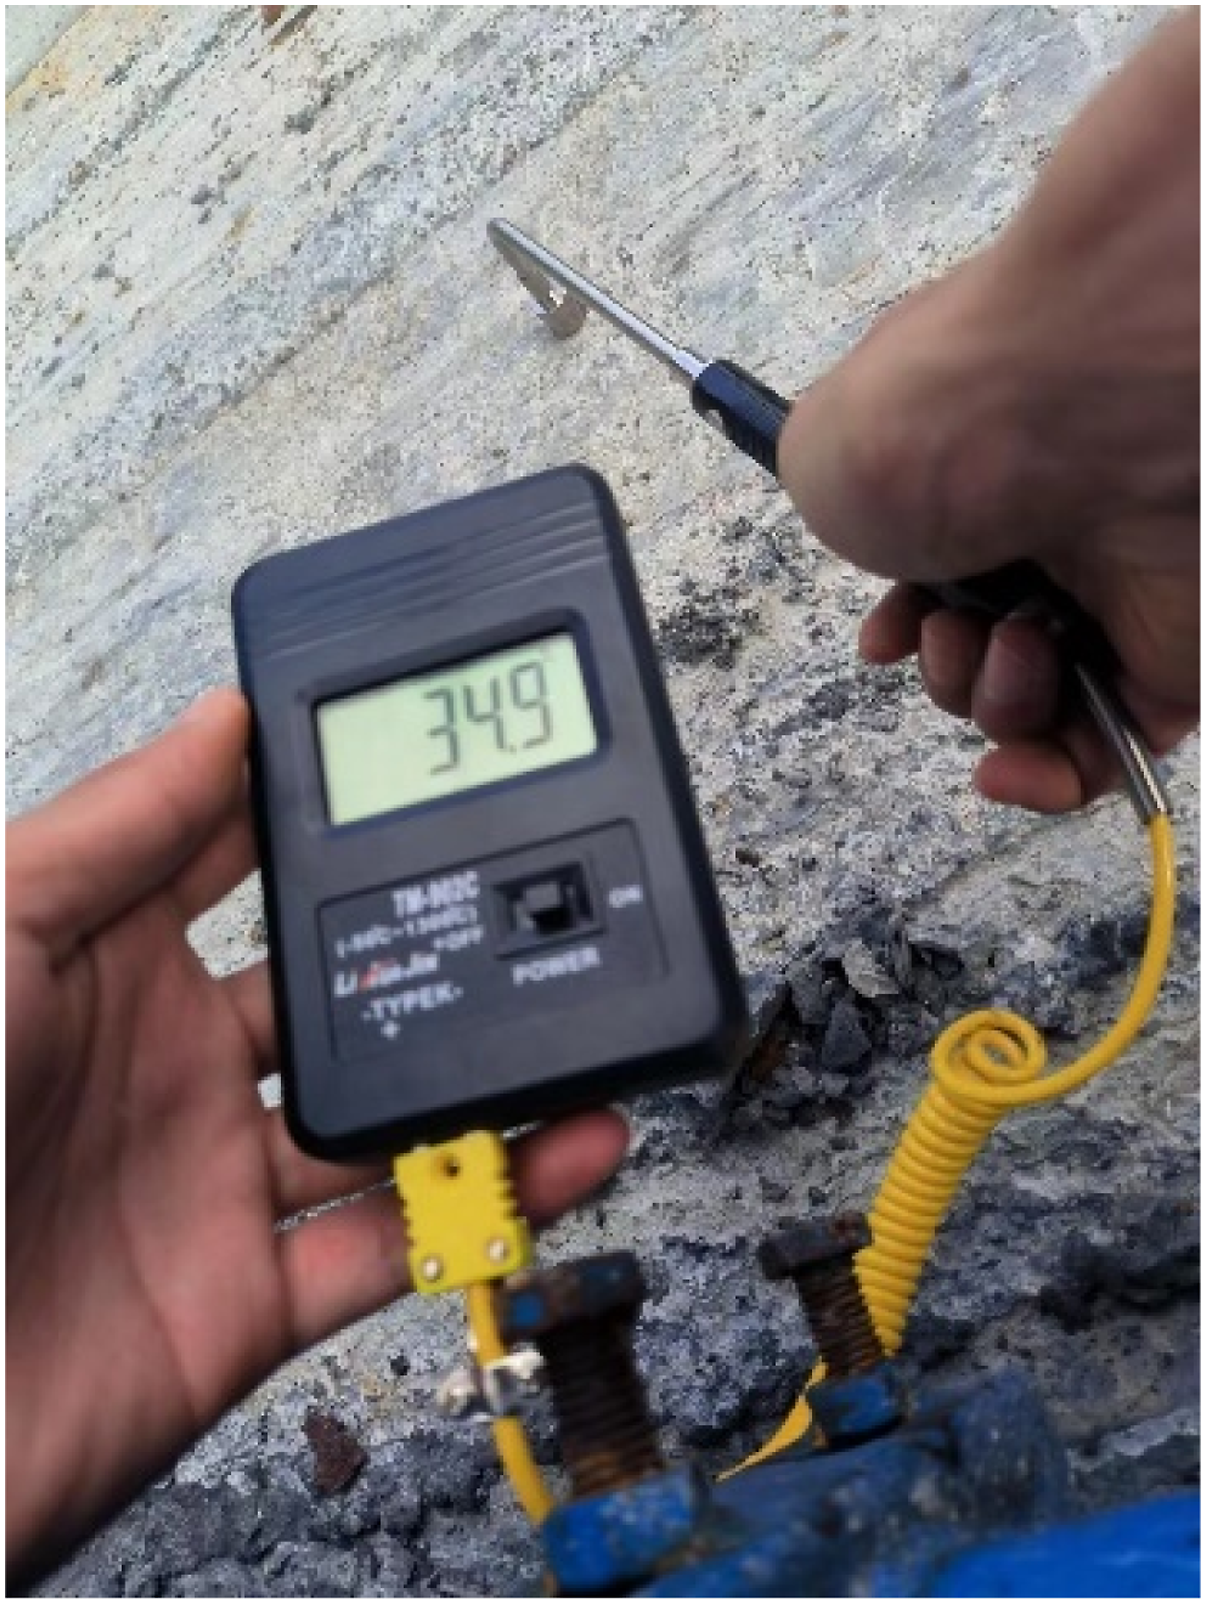
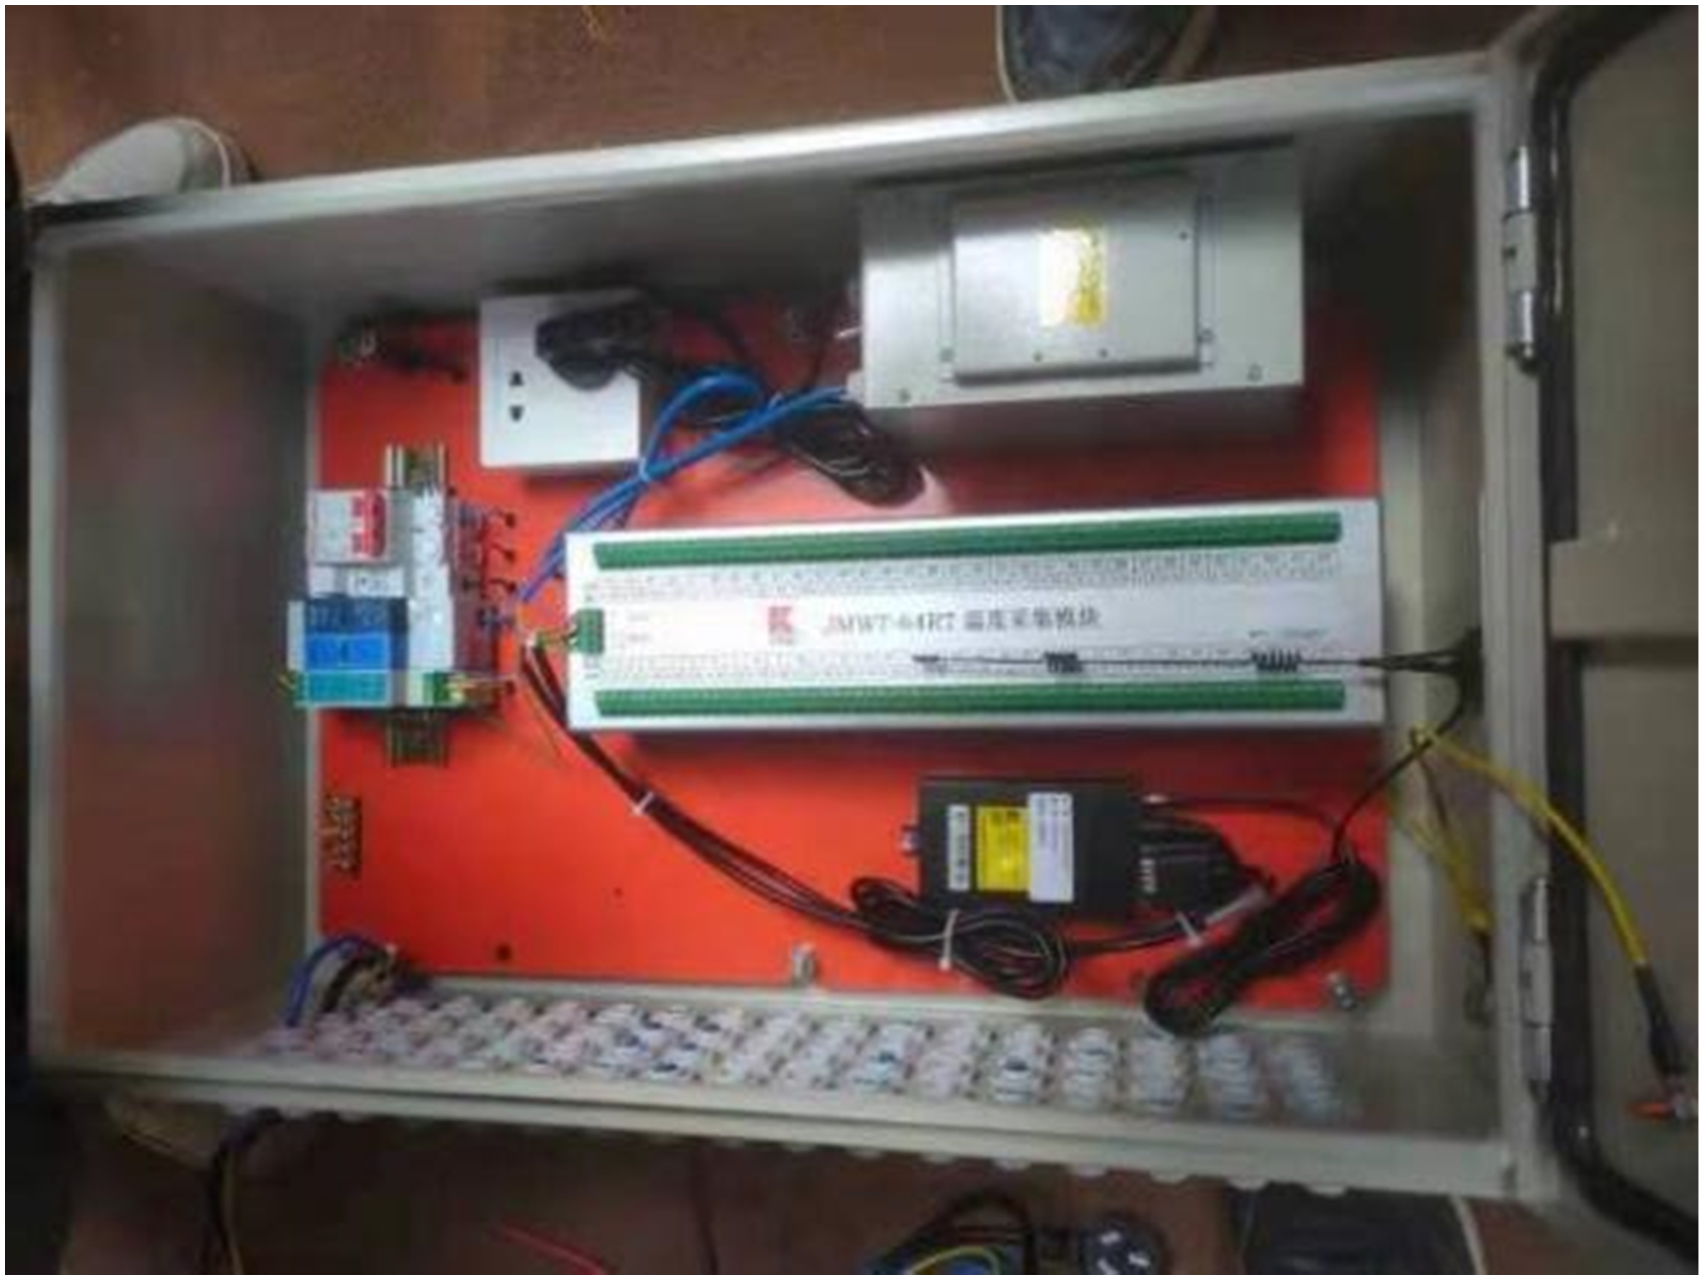
The testing procedure involved the selection of the JMT-36C type resistance temperature sensor, utilizing the thermistor’s resistance values to measure temperatures within the range of −30°C to 120°C. Refer to Figure 2 for the temperature sensor diagram. These sensors were affixed to steel bars to accurately gauge the temperatures across various segments of the arch rib. Figure 3 displays the deployment sites for these temperature sensors. Additionally, the Apuhua TM-902C contact thermometer was employed to measure the temperature of the structure’s outer surface. Figure 4 showcases the handheld contact thermometer, Apuhua TM-902C. For automated temperature data acquisition, the test utilized the JMWT-64RT automated temperature acquisition module. This module boasts a fully sealed design, ensuring waterproof, moisture-proof, and lightning protection capabilities, suitable for diverse settings in automated engineering monitoring. Refer to Figure 5 for a visual representation of the JMWT-64RT automated temperature acquisition module. (Table 1). JMT-36 C temperature sensor. Temperature sensor deployment site map. Apuhua TM-902C contact thermometer. JMWT-64RT automated temperature acquisition module. Main performance parameters of temperature sensors.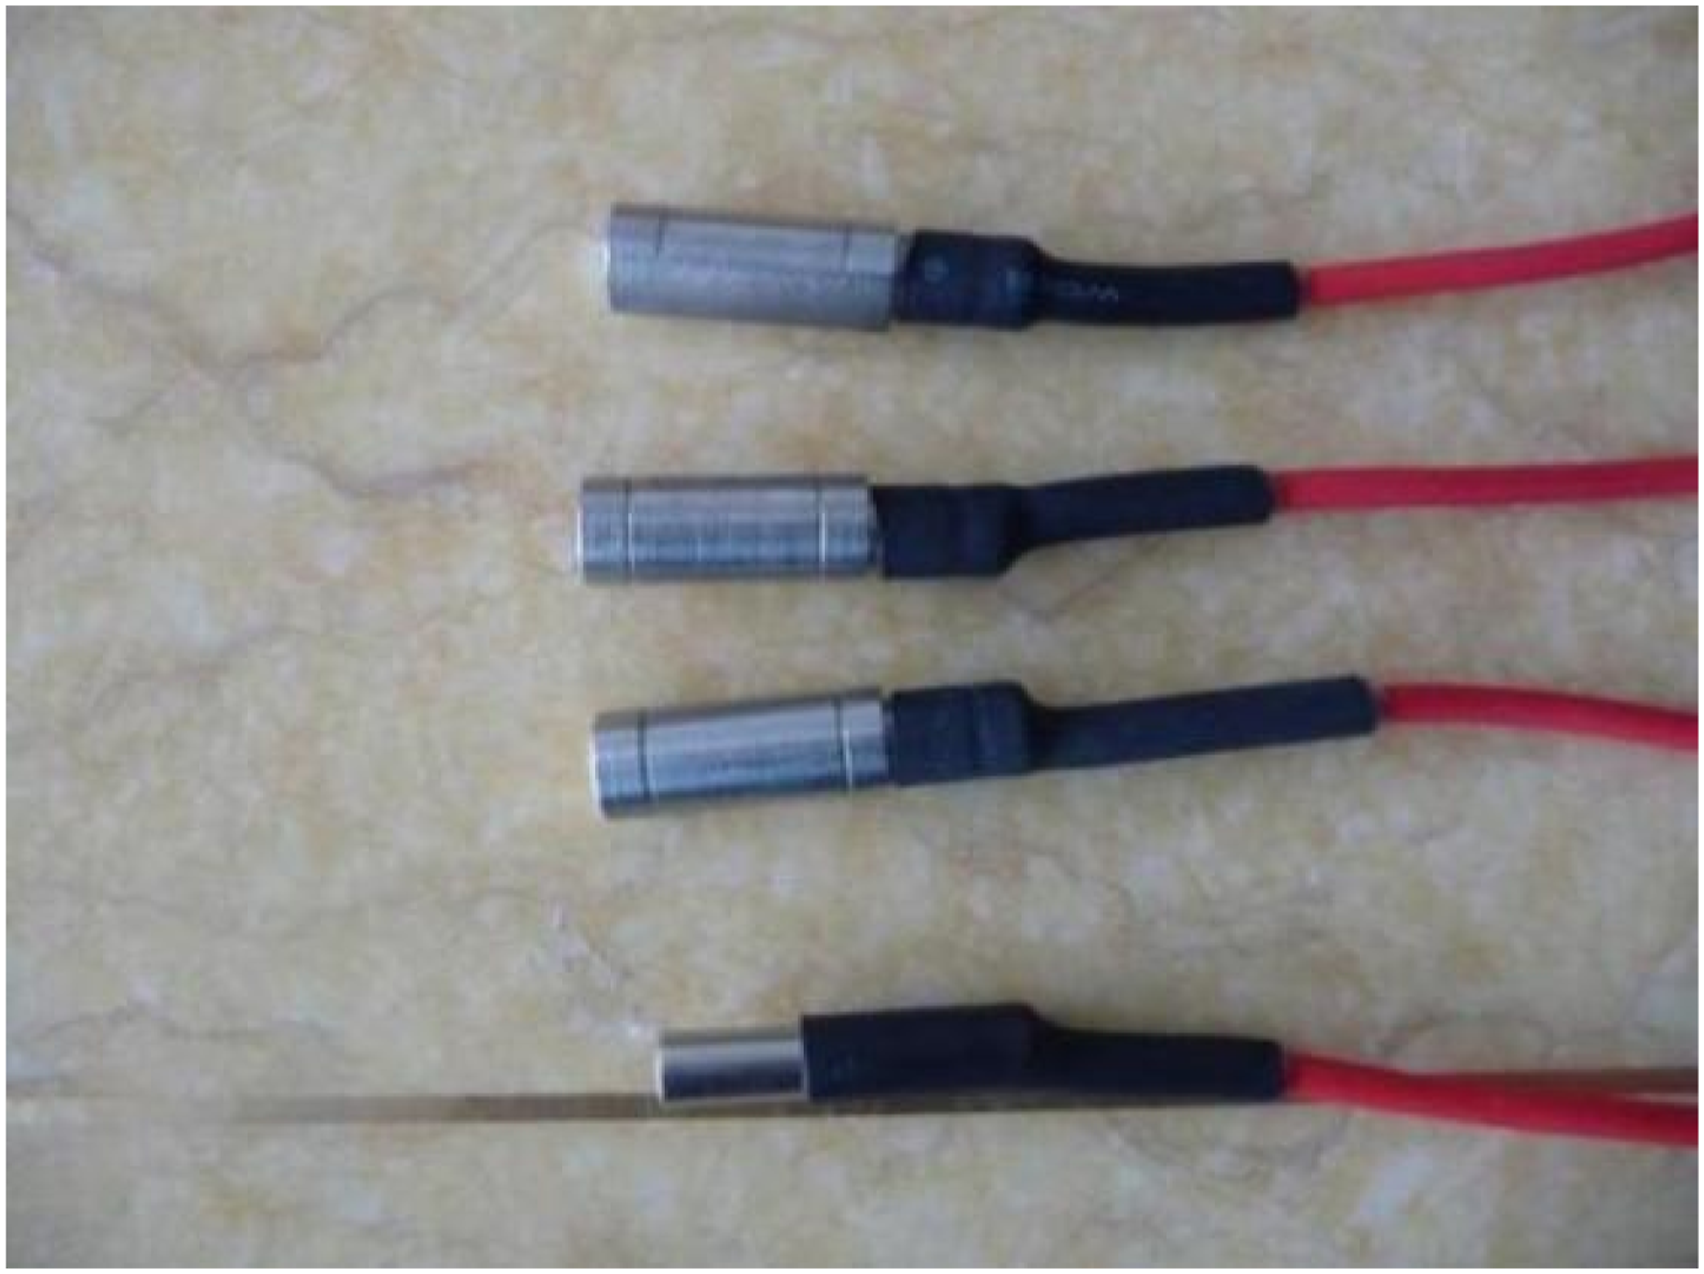

Measurement point distribution
In this study, the research focused on a specific section situated 30 cm from the arch foot, characterized by an octagonal shape. The section’s top and bottom plates had a thickness of 50 cm, while the web plate measured 40 cm in thickness. Measurement points were spaced 5 cm apart in the thickness direction of the top, bottom, and web plates, aiming to assess the temperature gradient across the plate’s thickness. For horizontal temperature measurement points on the top and bottom plates, the spacing was set at 65 cm. Additionally, vertical measurement points on the web plate were spaced 105 cm apart, resulting in a total of 88 temperature measurement points across the section. Real-time temperature data collection employed the JMWT-64RT automated wireless acquisition system, complemented by the Apuhua TM-902C handheld contact thermometer to gauge the outer surface temperature of the cross-section. Refer to Figure 6 for a depiction of the temperature measurement point layout. Data collection was conducted at hourly intervals throughout the test. Cross-sectional layout of measurement points (Unit: cm).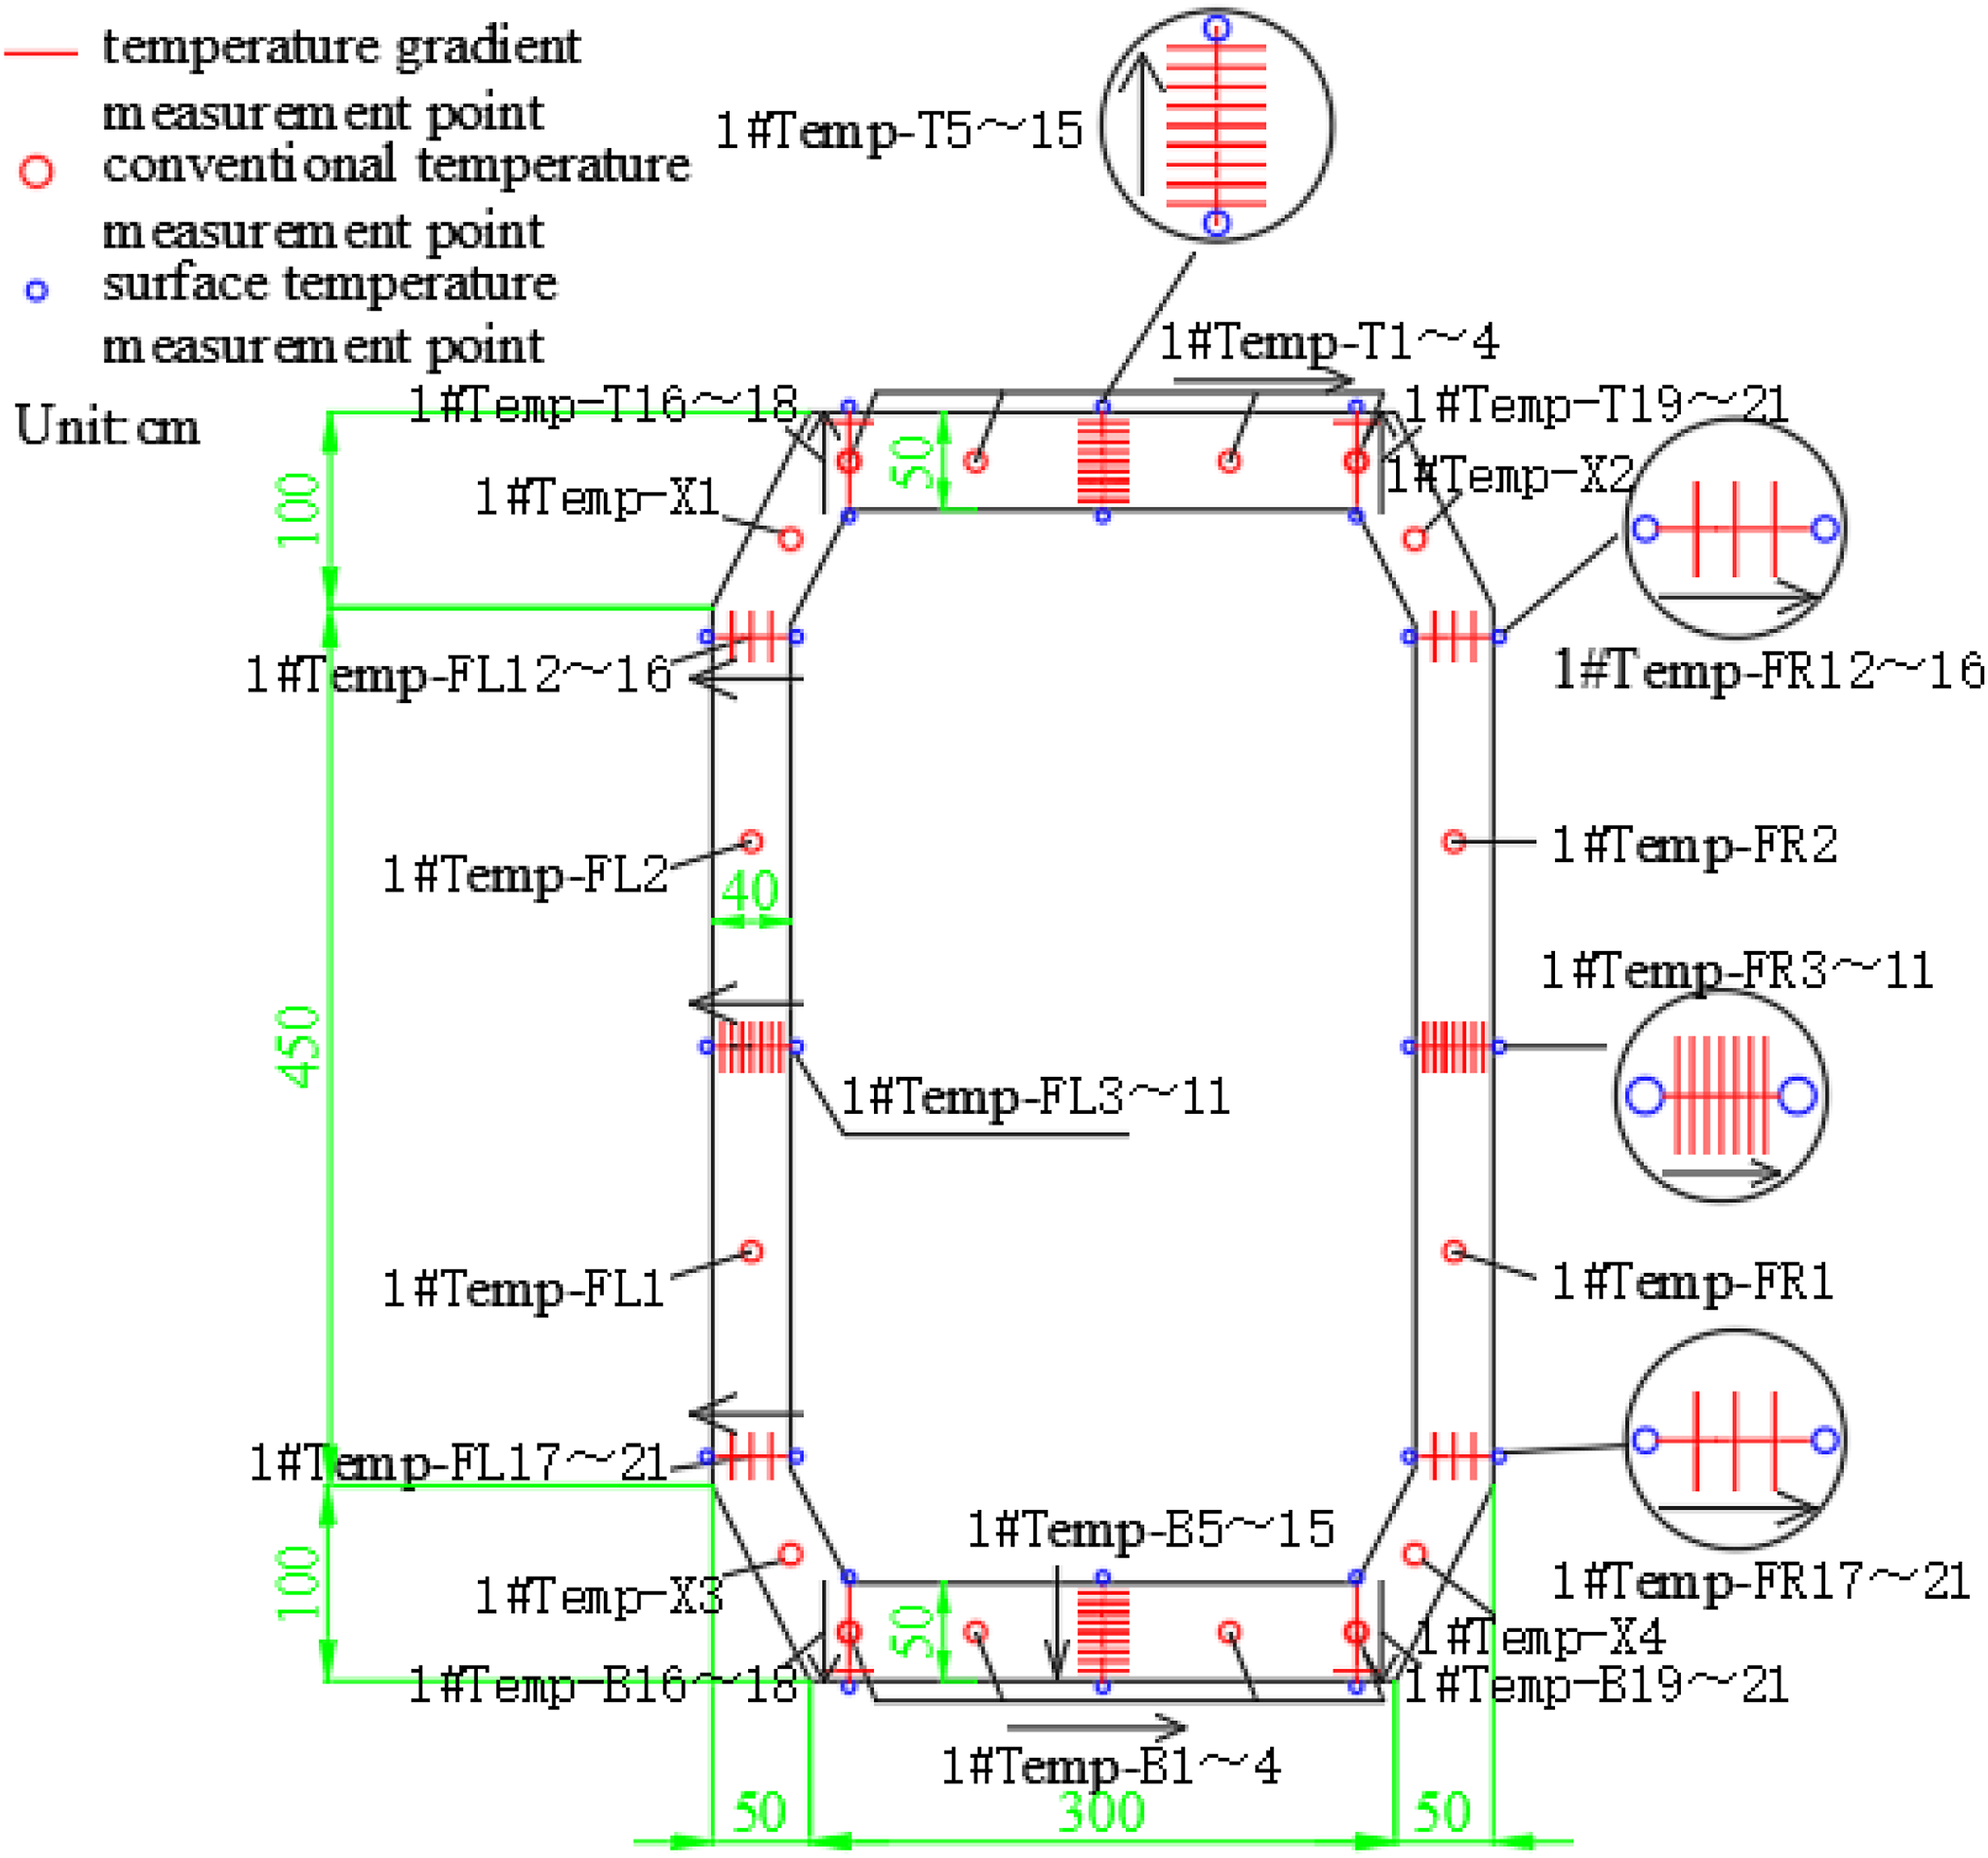
Analysis of test results of temperature field of arch rib
The impact of solar radiation on concrete bridges is noticeable during hot summer weather with clear skies and minimal cloud cover. For research and analysis, the temperature field of concrete box girders was examined over a 24-hour period in August 2022, specifically focusing on the high-temperature conditions. Temperature measurements were recorded at hourly intervals for this analysis.
Temperature distribution of the top plate of the arch rib
Throughout the construction phase, the outer surface of the top plate consistently faced solar radiation exposure. In contrast, the interior of the concrete box girder remained shielded from solar radiation throughout the day, maintaining a relatively stable temperature within the entire box chamber. The combination of high-temperature radiation affecting the outer surface of the top plate and the static, windless environment within the enclosed box chamber led to an observable temperature disparity. This discrepancy resulted in a temperature gradient along the vertical direction of the concrete box girder. Figure 7 illustrates the temperature fluctuations at key measurement points on the top plate of the arch rib on a specific day in August, while Figure 8 displays the time-history curve depicting variations in the maximum temperature difference between the inner and outer measuring points of the top plate. Temperature time history curve of the top plate measurement point. Maximum temperature difference variation curve of the vertical measurement point of the top plate.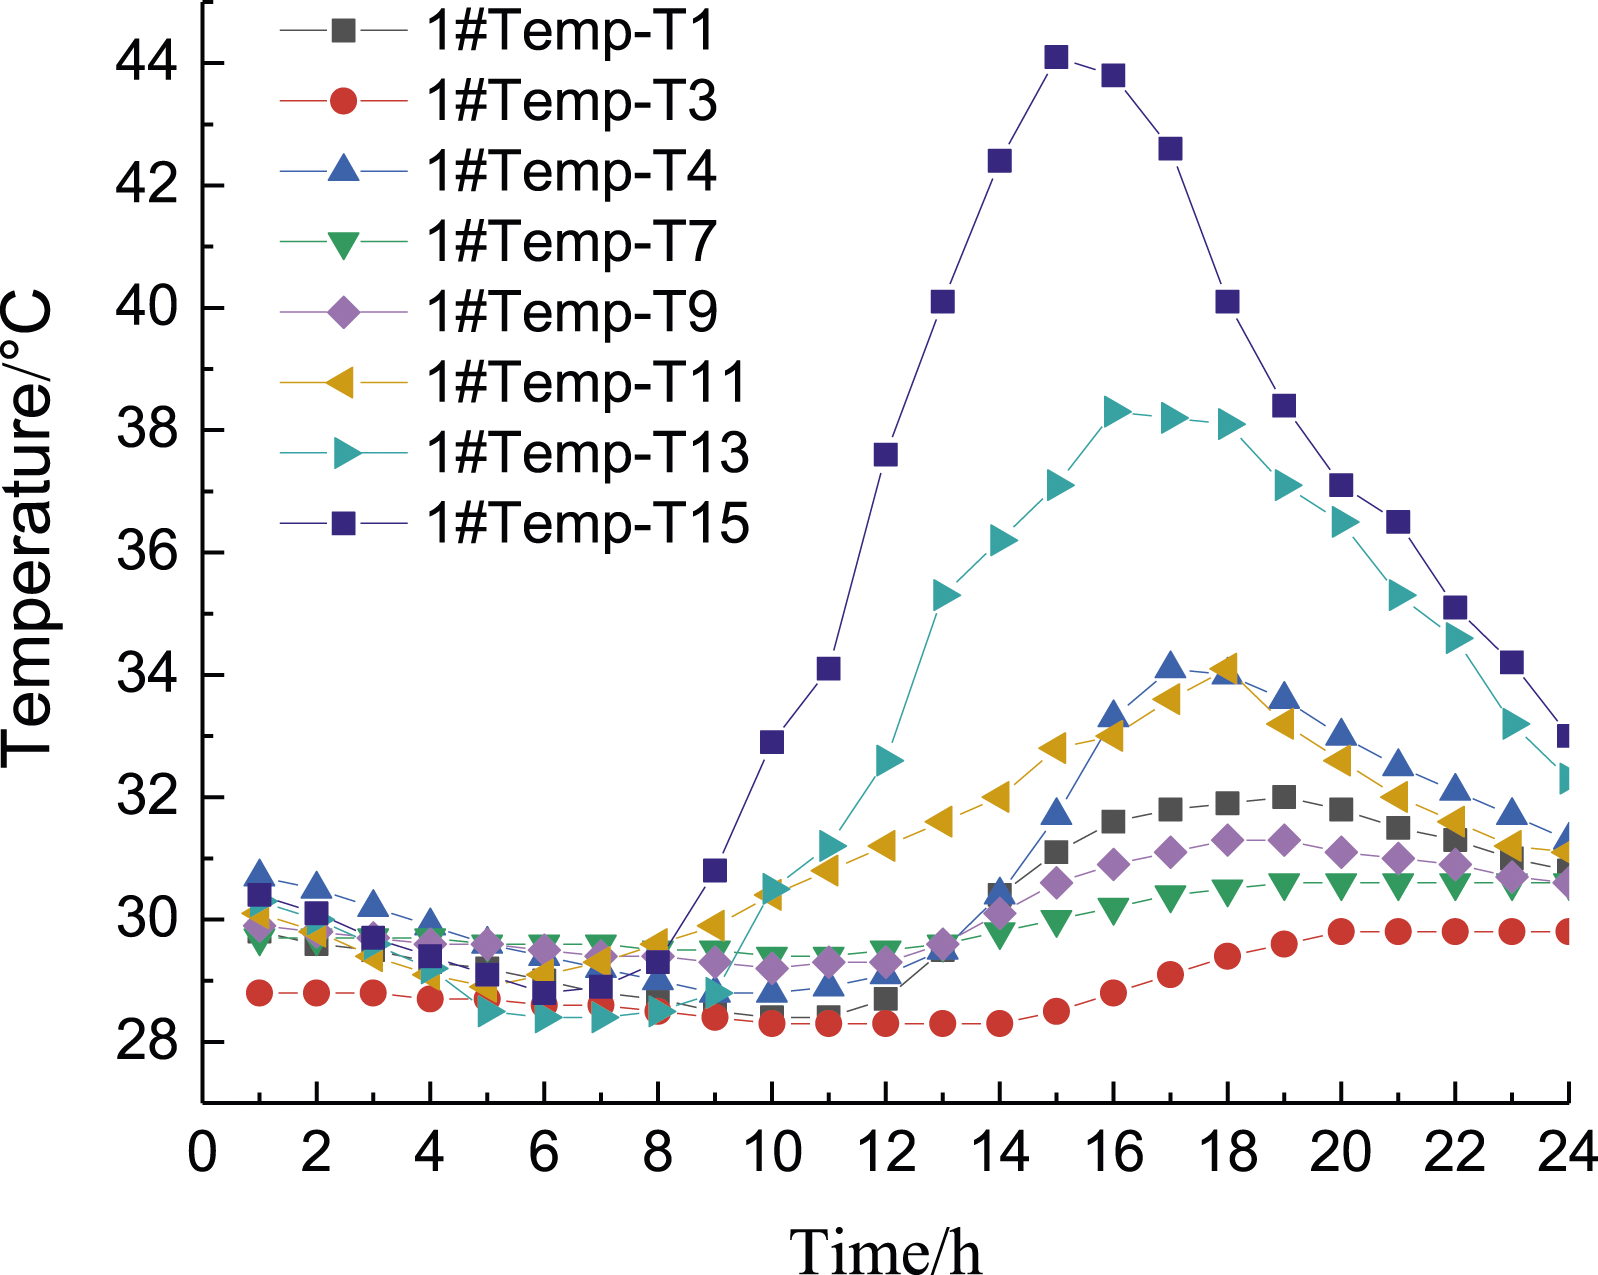
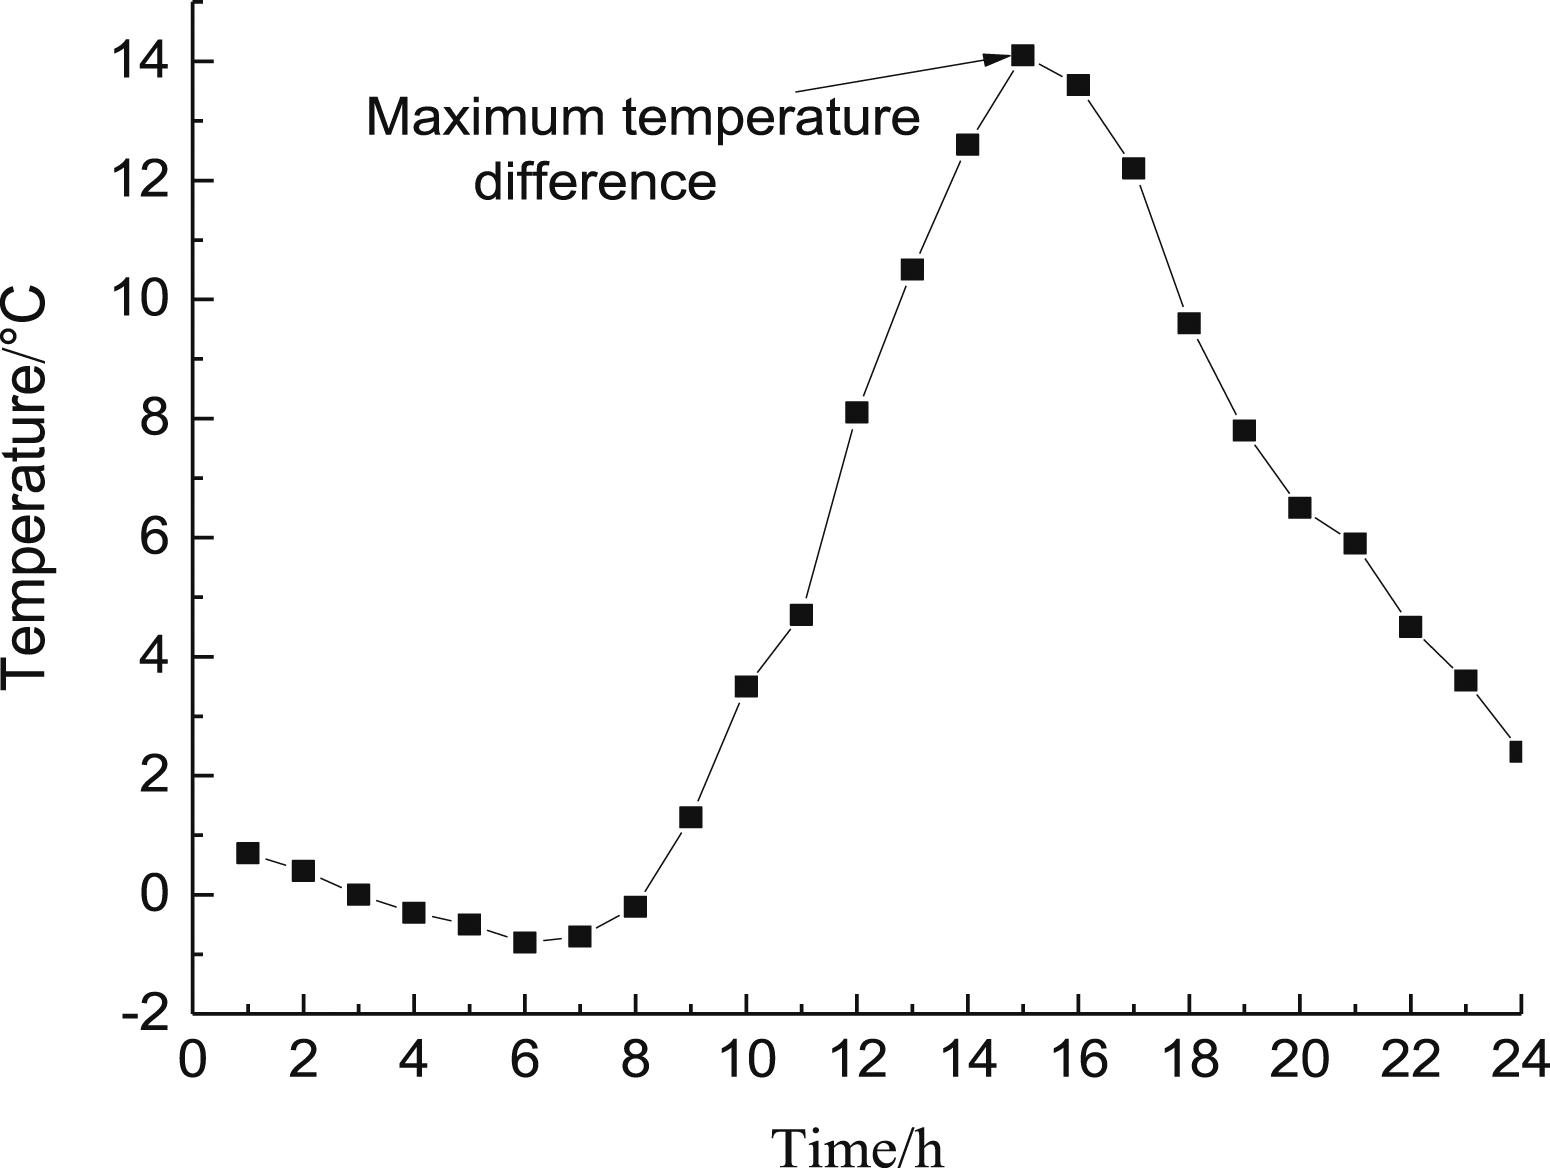
Figure 7 indicates a gradual cooling trend observed at each measurement point on the top plate during the early morning hours, followed by a continuous rise in temperature until reaching the peak. Specifically, at the measurement point 1#Temp-T15 located on the top flanges, the highest peak temperature was recorded at 3:00 p.m., reaching 44.1°C.
Furthermore, measurement points situated nearer to the top flanges exhibit higher temperatures and display more higher temperature fluctuations, contrasting with measurement points positioned farther away, which register lower temperatures, smaller fluctuations, and later peaks. This discrepancy arises from the concrete’s relatively low heat transfer efficiency, leading to a delayed transfer of heat from the exterior to the interior. Consequently, this results in temperature non-uniformity across various locations within the concrete. Figure 8 demonstrates that the vertical temperature disparity within the top plate of the arch rib is notably distinct, with the maximum temperature difference of 14.1°C occurring around 3:00 p.m.
Temperature distribution across the arch rib webs
The solar radiation received by the web of a concrete box girder typically remains lower than that received by the top plate throughout the day. Variances in bridge orientation and geographical location result in shaded periods for the webs due to their generally perpendicular alignment to the ground. Consequently, the angle formed between the sun’s rays and the plane normal to the webs is larger, leading to reduced solar radiation exposure. However, unlike the top plate, the webs are subject to ground reflection, enhancing the heat absorbed by their outer surfaces. Figure 9 depicts the temperature-time history curve for key measurement points on the web plate. As shown, the temperature change trends of each measurement point on the web plate resemble those observed on the top plate, displaying higher external temperatures and lower internal temperatures. Notably, measurement point 1#Temp-RW9 records a maximum peak temperature of 38.0°C, and measurement point 1#Temp-LW9 records a maximum peak temperature of 36.3°C. The surface temperature of the left web is higher in the forenoon, and the surface temperature of the right web is higher in the afternoon. This is because the trend of the bridge is southeast, while the left web is located on the east side. In the forenoon, the radiation intensity of the left web is greater than that of the right web, and the temperature rises faster. However, in the afternoon, the radiation intensity of the right web is longer and the total radiation is more than that of the left web. Therefore, longer exposure time of the right web to solar radiation induces higher total radiation than that of the left web. This variation results in a visibly non-uniform temperature distribution across the width of the arch rib cross-section. Temperature time history at the main measurement points on the webs.
Temperature distribution across the bottom plate of the arch rib
The bottom plate of the concrete box girder consistently remains in the shaded area, receiving minimal direct sunlight exposure. Nonetheless, factors such as ground radiation, solar reflection, ambient temperature, among others, contribute to fluctuations in the temperature of the concrete near the outer surface of the bottom plate. Figure 10 illustrates the temperature-time history curve for key measurement points on the bottom plate. It becomes evident from Figure 10 that the temperature at each measurement point on the bottom plate is notably lower compared to the temperature recorded at the measurement points on the webs and top plate. The temperature fluctuations within a single day are minimal, particularly evident in the gentle temperature change curve of the measurement point situated closer to the inner side of the box. Notably, the temperature peaked at 6:00 p.m. near the outer side of the bottom plate, with the maximum peak temperature recorded at 33.4°C. Temperature time history at the main measurement points on the bottom plate.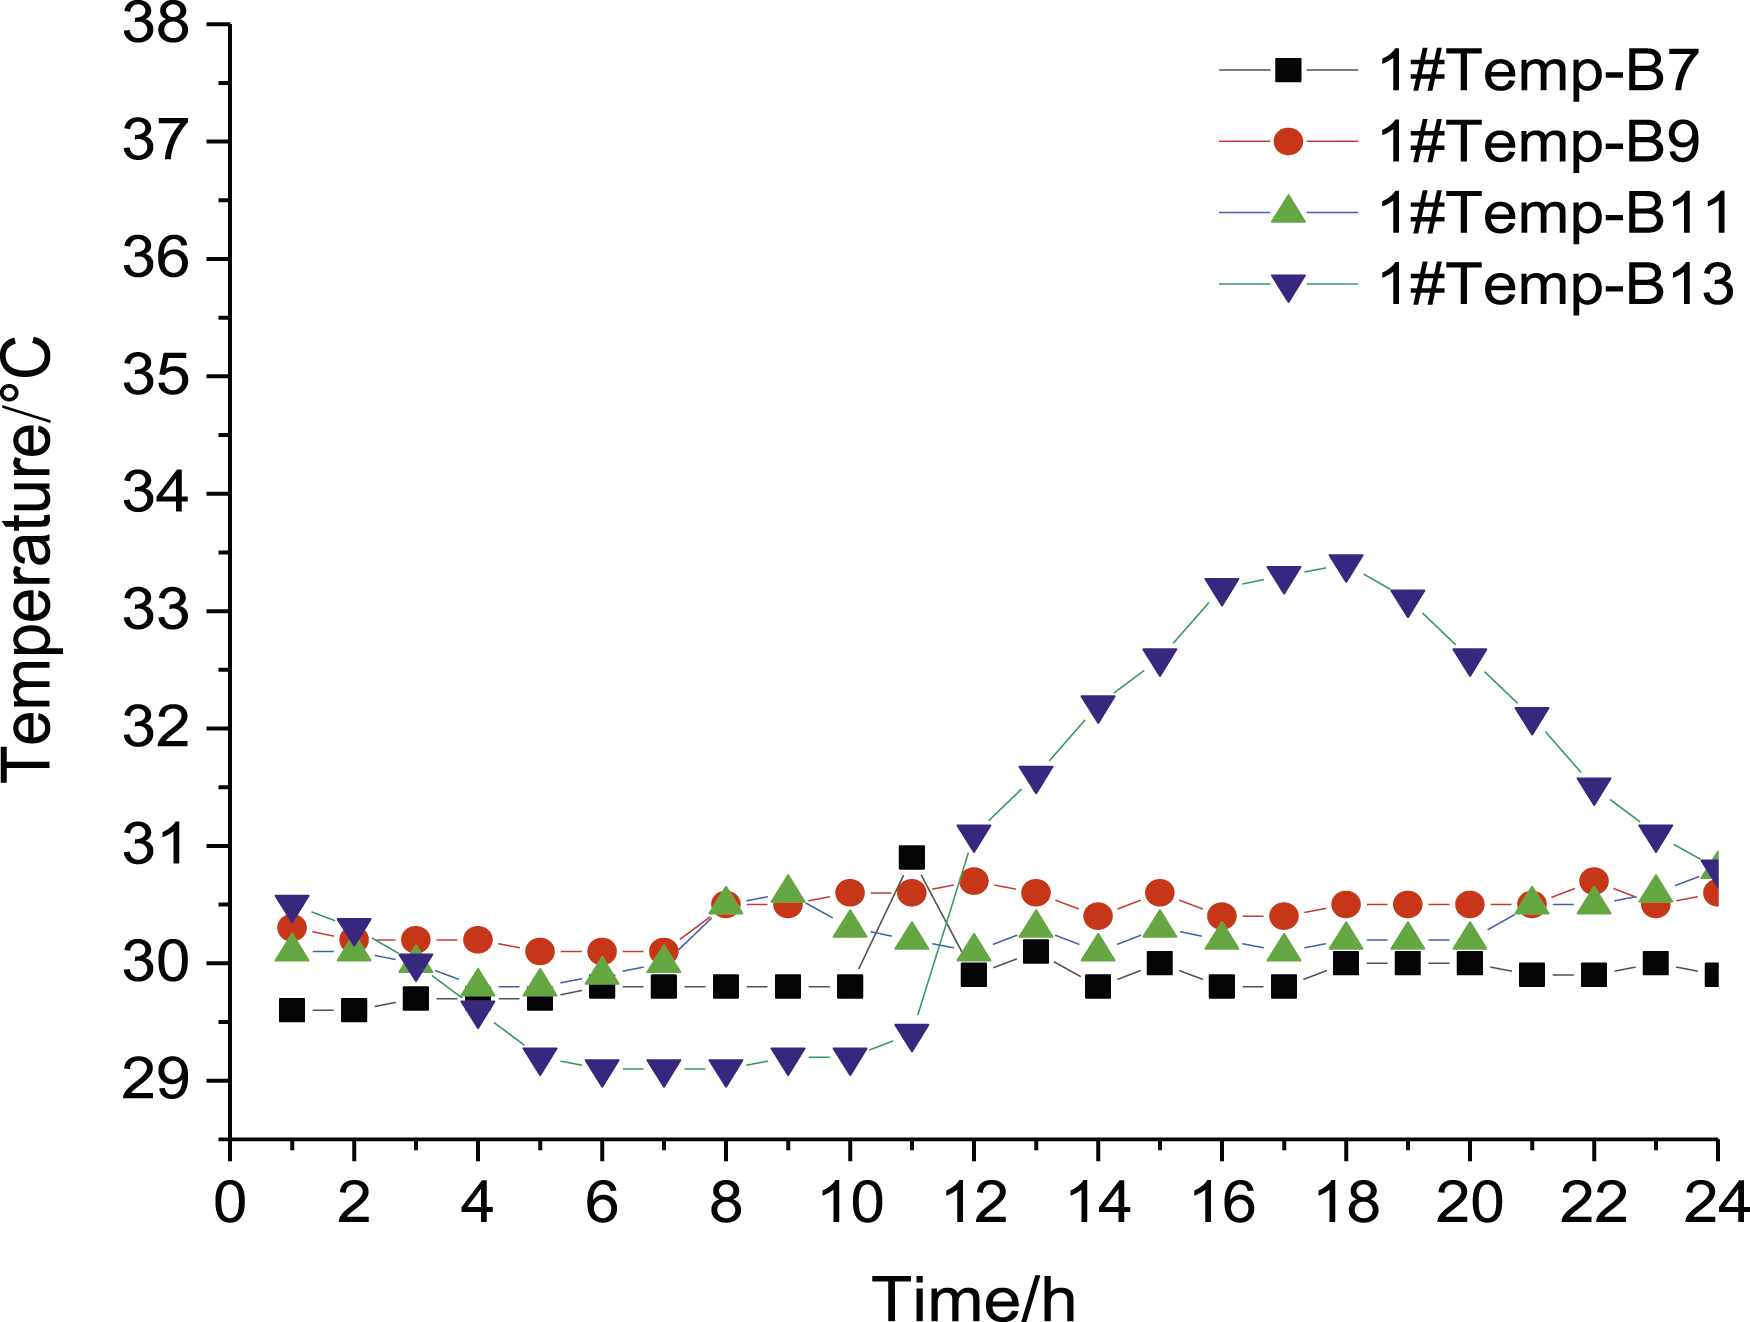
Vertical temperature gradient model for a concrete box arch with octagonal section
Upon analyzing the gathered temperature data, it becomes evident that the arch rib cross-section exhibits significant temperature gradients in various segments. Specifically, the top plate of the box girder displays a noticeable temperature gradient along the cross-section’s height, whereas the bottom plate experiences minimal temperature changes in the same direction.
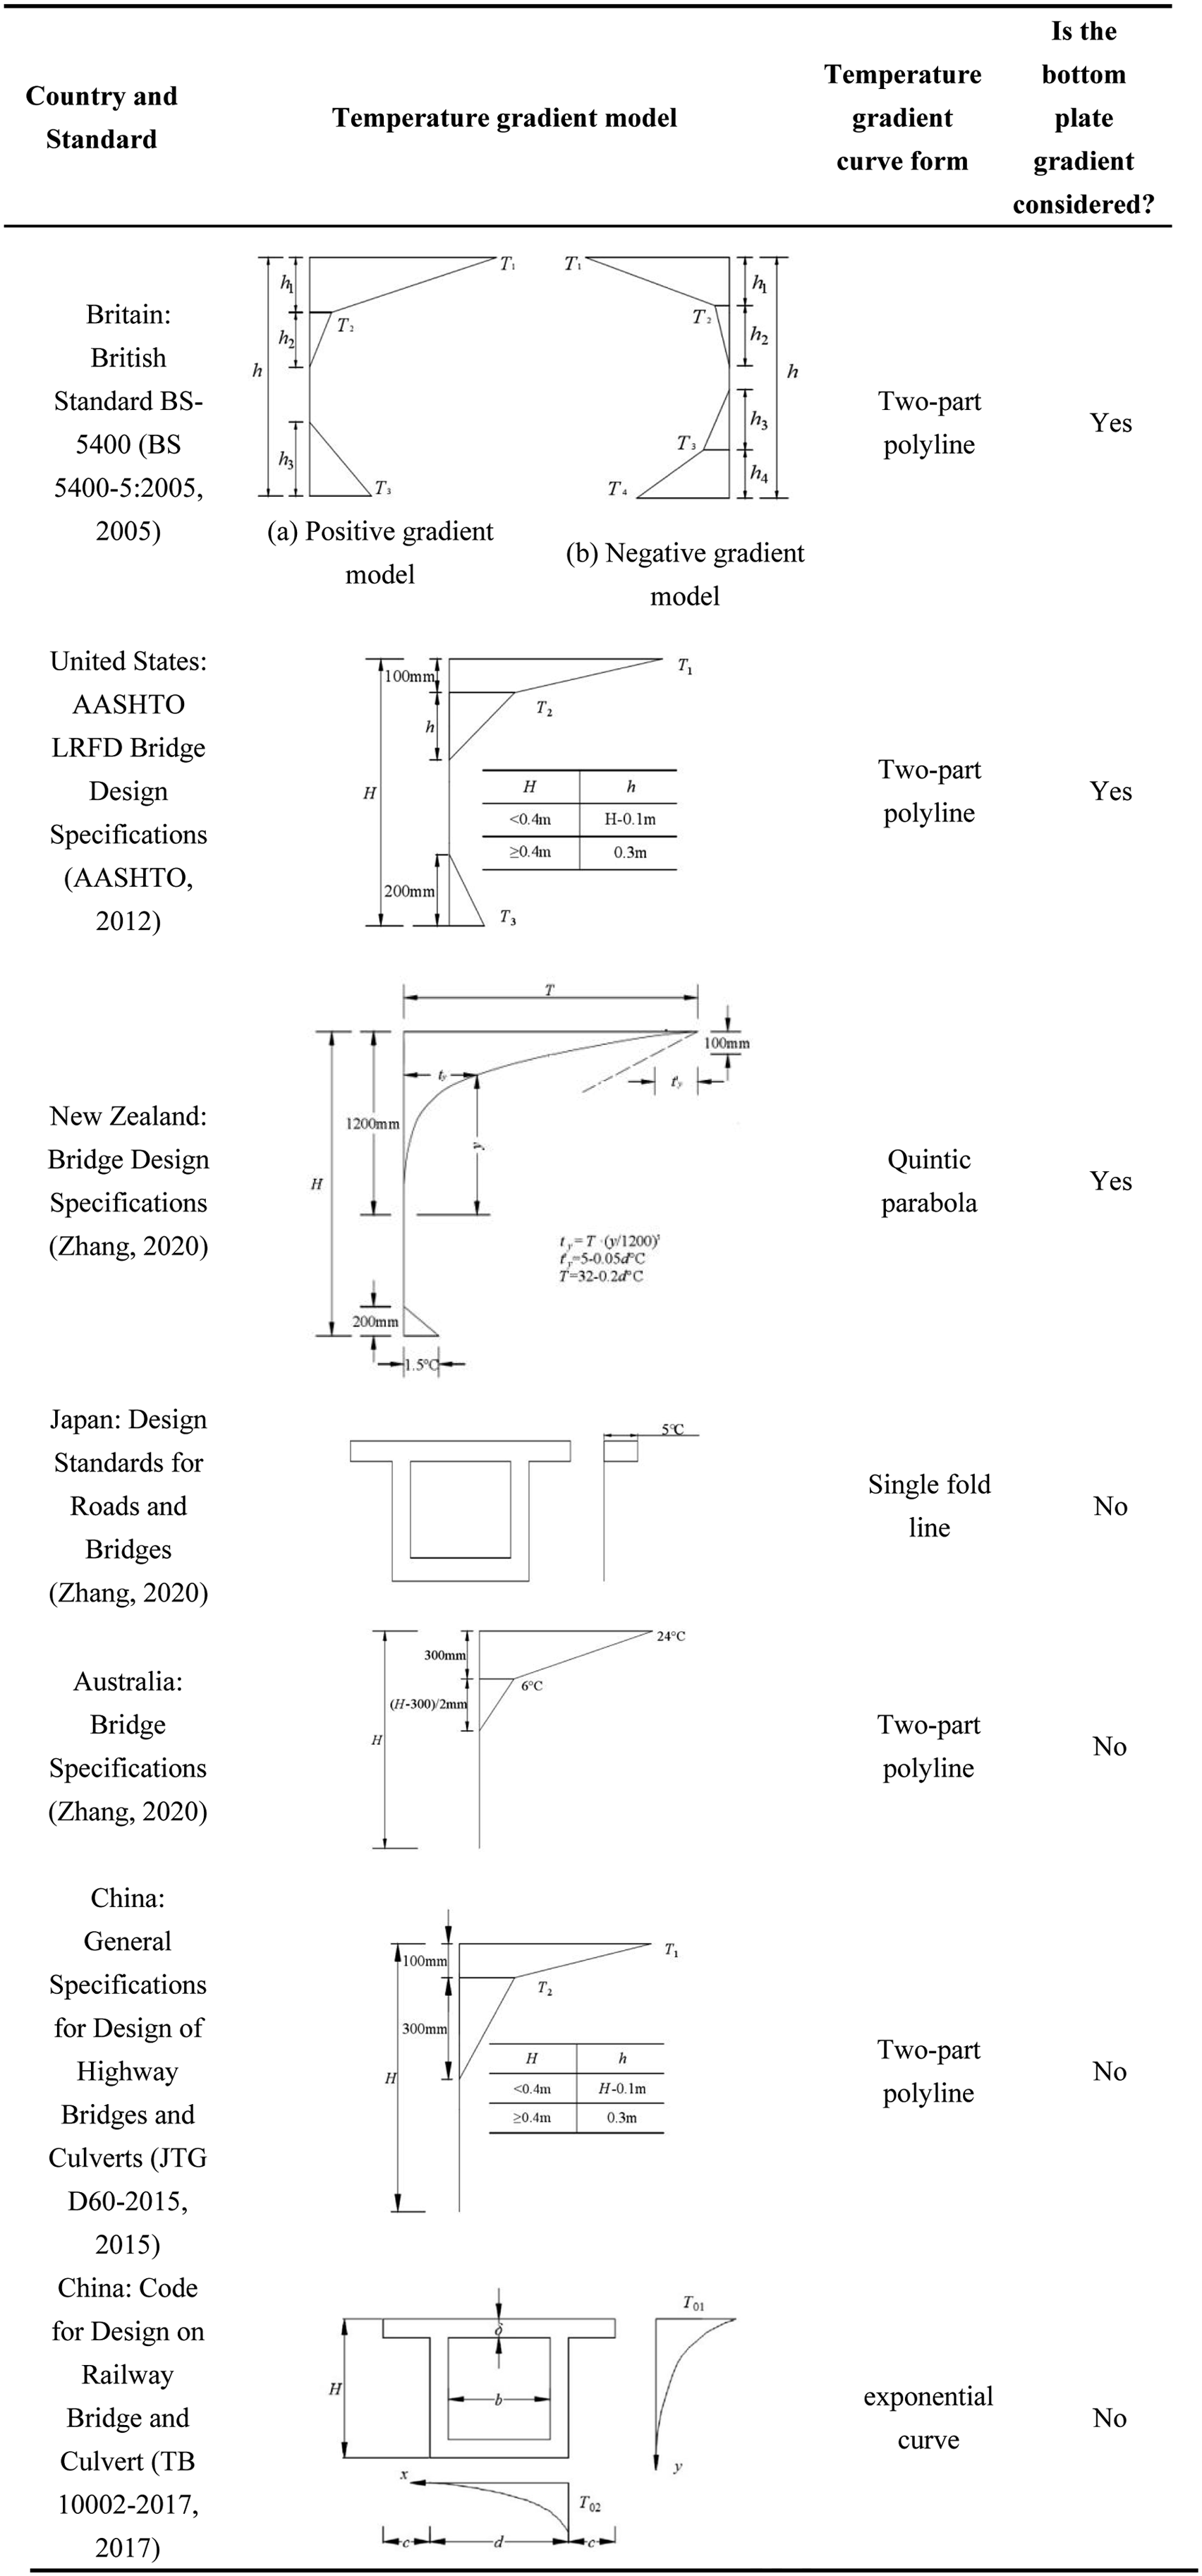
Temperature gradient model of concrete box section in some specifications.

Fitting the vertical temperature gradient model for an octagon arch rib section
As observed in Table 2, the temperature gradient models outlined in each country’s specifications predominantly utilize folded lines and curves as primary modes for illustrating the temperature gradient curves. For this investigation, the temperature gradient model for the top plate of the arch foot section was developed with reference to the Code for Design on Railway Bridges and Culverts (TB 10002-2017, 2017). The temperature gradient model depicting the solar radiation temperature difference is presented in Figure 11. Temperature gradient model specified in TB 10,002-2017.
The specifications state that the vertical solar radiation temperature difference across the box girder shown in the figure can be fitted using equation (1).
Temperature difference at different heights along the section’s vertical direction.

The temperature gradient along the top plate box height can be expressed using equation (2).
Following the determination of the target fitting curve, the ordinary least squares method was employed to minimize the sum of squares of the disparities between measured and fitted values. Subsequently, equation (3) was utilized to derive the fitted equation for the temperature gradient along the top plate of the arch foot cross-section.
A temperature gradient was also identified within a certain range along the bottom plate, with the maximum temperature difference on the bottom plate registering at approximately 3.4°C. Considering the low temperature differences on the bottom plate, a linear vertical temperature difference of 3.4°C within the lower 200 mm of the bottom plate was adopted, referencing the New Zealand Bridge Design Code (Zhang, 2020). Figure 12 illustrates the fitted model depicting the vertical temperature gradient at the foot section of the octagonal arch rib of the Shuiluo River Bridge. Schematic diagram of vertical cross sectional temperature gradient model.
Three-dimensional temperature field in arch ribs under solar radiation during the construction of RC arch bridges
The analysis of the measured temperature field reveals nonlinear temperature distribution characteristics within the box girder section, highlighting varying internal temperature fields over time. Due to the distinctive nature of the arch ring structure in arch bridges, the distribution of the temperature field along the arch axis remains unexplored. To address this gap, ANSYS finite element software was utilized for transient thermal analysis of the arch rib segments. This simulation aimed to portray temperature field changes in the arch foot segments over a day. The simulation results were compared against measured data to validate the accuracy of the FEM. Subsequently, the temperature field of the segments where each key section of the arch rib is located is analyzed with the help of the model, and the three-dimensional temperature field distribution law of the arch rib of the reinforced concrete arch bridge is summarized. Finally, the temperature field distribution of the key sections calculated based on the finite element model is fitted to the temperature gradient of the whole arch of the reinforced concrete arch bridge during the construction period.
Theory of calculation of insolation temperature field
Thermal boundary condition
The boundary conditions of the RC arch rib, involving convective heat exchange with the external environment and radiation reception in its natural setting, are expressed as demonstrated in equation (4).
Shortwave radiation
The empirical formula for direct solar radiation can be expressed as in equation (5).

Where the empirical formula for 
The solar radiation intensity 
When the sun’s rays pass through the Earth’s atmosphere, part of the solar radiation is scattered by atmospheric gases, dust, etc. and from all directions to the Earth’s surface, the phenomenon is known as the diffuse solar radiation, the diffuse solar radiation from any plane can be expressed in the following equation (9).
Ground reflected radiation means that when the sun’s rays pass through the earth’s atmosphere and arrive at the ground they will be reflected, and radiated on the surface of the bridge structure, and is calculated using equation (10).
In summary, the comprehensive density of shortwave radiation heat flow for the surface of a bridge structure can be expressed as equation (11).
Longwave radiation
The atmosphere absorbs longwave radiation from the ground while radiating energy outward in a radiative manner, and this way of radiating energy outward from the atmosphere is called atmospheric radiation. Since the atmosphere itself has a low temperature, the wavelength of the radiated energy is long, so it is also called atmospheric longwave radiation.
Longwave radiation at the ground surface is mainly divided into longwave radiation emitted by the ground and longwave radiation emitted by the Earth’s atmosphere that is reflected by the ground, and is expressed in equation (13).
The concrete box girder absorbs long and short wave radiation and also emits longwave radiation to the outside, which can be expressed as equation (14).
In summary, the comprehensive density of longwave radiation heat flow for the surface of a bridge structure can be expressed as equation (15).
Convective heat transfer
Convective heat transfer refers to the phenomenon of heat transfer between the fluid and the solid surface when the fluid flows through the solid, and the formula of convective heat transfer between the concrete structure and the external environment is shown in equation (16).
The convective heat transfer of the arch rib mainly refers to the heat transfer process between the outside air and the concrete surface, so the convective heat transfer coefficient adopts the widely used Kehlbeck’s formula (Zhou et al., 2023), as shown in equation (17).
Numerical simulation of cross-sectional temperature field
Numerical simulation parameters
Environmental conditions at shuiluo river bridge.

material parameter list of arch rib concrete for shuiluo river bridge.

Comprehensive heat transfer coefficients at different positions on the concrete arch (kJ·m−2·h−1·°C−1).

Solar radiation model
The calculation of radiation for each segment of the arch rib initially requires clarifying the positional information of the arch rib itself. The horizontal inclination of the axes for each segment of the arch rib can be determined using equations (18)–(20).


Solar radiation within the designated plane was computed following the approach outlined in the literature (Zhou, 2020). Utilizing a parametric geometrical model established in ANSYS, an adaptive calculation of radiation from individual structural components was conducted, followed by a transient thermal analysis performed in the subsequent steps: (1) Development of a geometric model representing the arch rib. (2) Inputting the relative positions of the arch ribs, arch axis coefficient (3) Calculation of positional data, such as azimuth and inclination, for a geometrically modeled surface based on the coordinate information of any three points on that surface. (4) Determination of solar azimuth, altitude angle, and related information at each time frame, coupled with the corresponding solar radiation based on the positional data of each surface. (5) Meshing the geometric model and application of temperature loads and boundary conditions to each surface in preparation for the transient thermal analysis.
Introduction of the FEM model
Using ANSYS, the model underwent automatic rotation to the designated inclination and azimuth angles based on computed input parameters and meshing processes. Figure 13 illustrates a diagram depicting the FEM. The model employed the 3D thermal analysis unit SOLID70, segmented into 19,800 nodes and 18,000 elements. Temperature loads were imposed on the outer surface of the arch rib, while convective boundary conditions were established on each surface. The time step was set at one hour, enabling temperature field calculations at hourly intervals, resulting in a total of 24 load steps. FEM of solar radiation.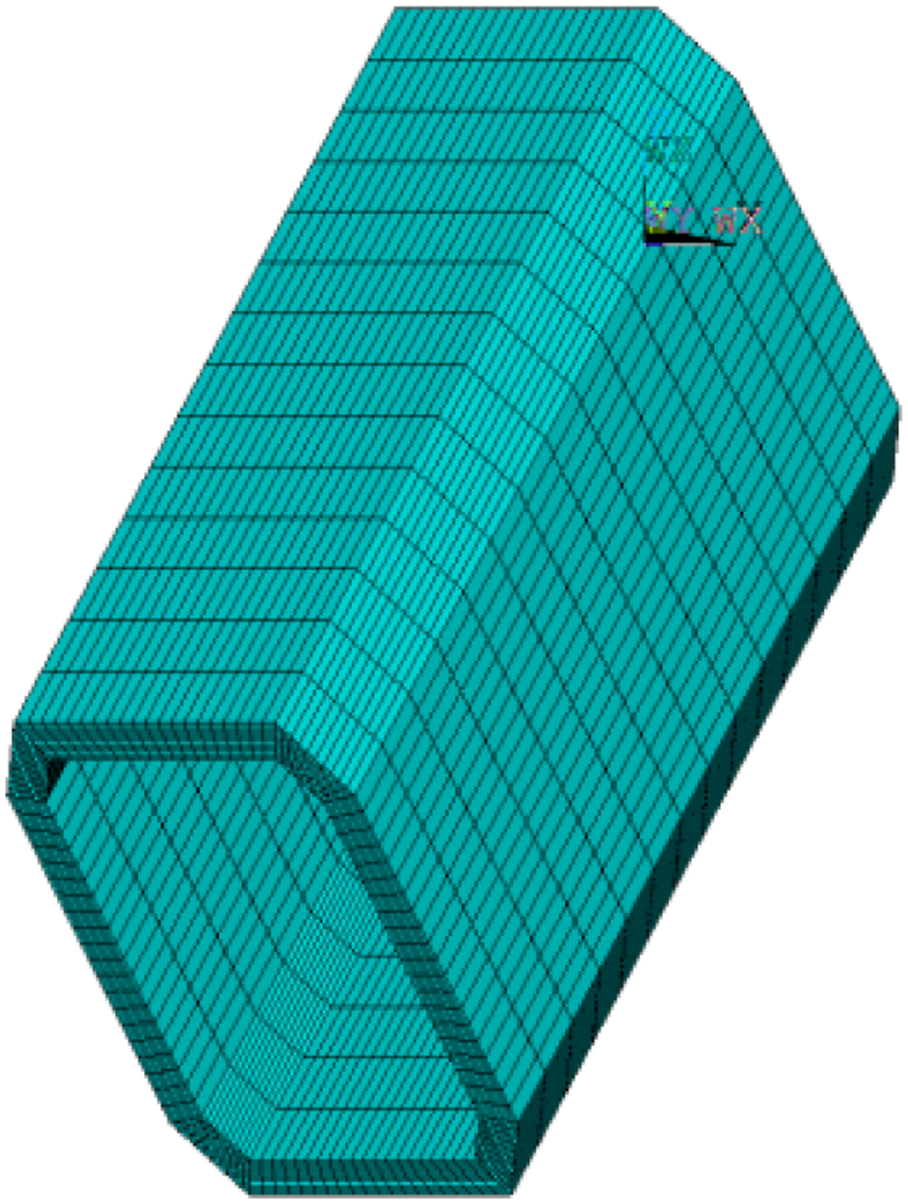
Analysis of numerical simulation results
Due to the numerous measurement points, the primary ones in the top plate, bottom plate, and webs of the box girder were chosen for comparing the numerical simulation against the measured temperature field, specifically focusing on the arch rib arch foot section. Figures 14–17 depict the time history comparison curves between the numerical simulation values and measured values for four key measurement points: 1#Temp-T13 at the top plate, 1#Temp-LW9 at the left web, 1#Temp-RW9 at the right web, and 1#Temp-B13 at the bottom plate of the section. Comparison between measured and simulated temperatures at the top plate measurement point 1#Temp-T13. Comparison between measured and simulated temperatures at the left web measurement point 1#Temp-LW9. Comparison between measured and simulated temperatures at the right web measurement point 1#Temp-RW9. Comparison between measured and simulated temperatures at the bottom plate measurement point 1#Temp-B13.
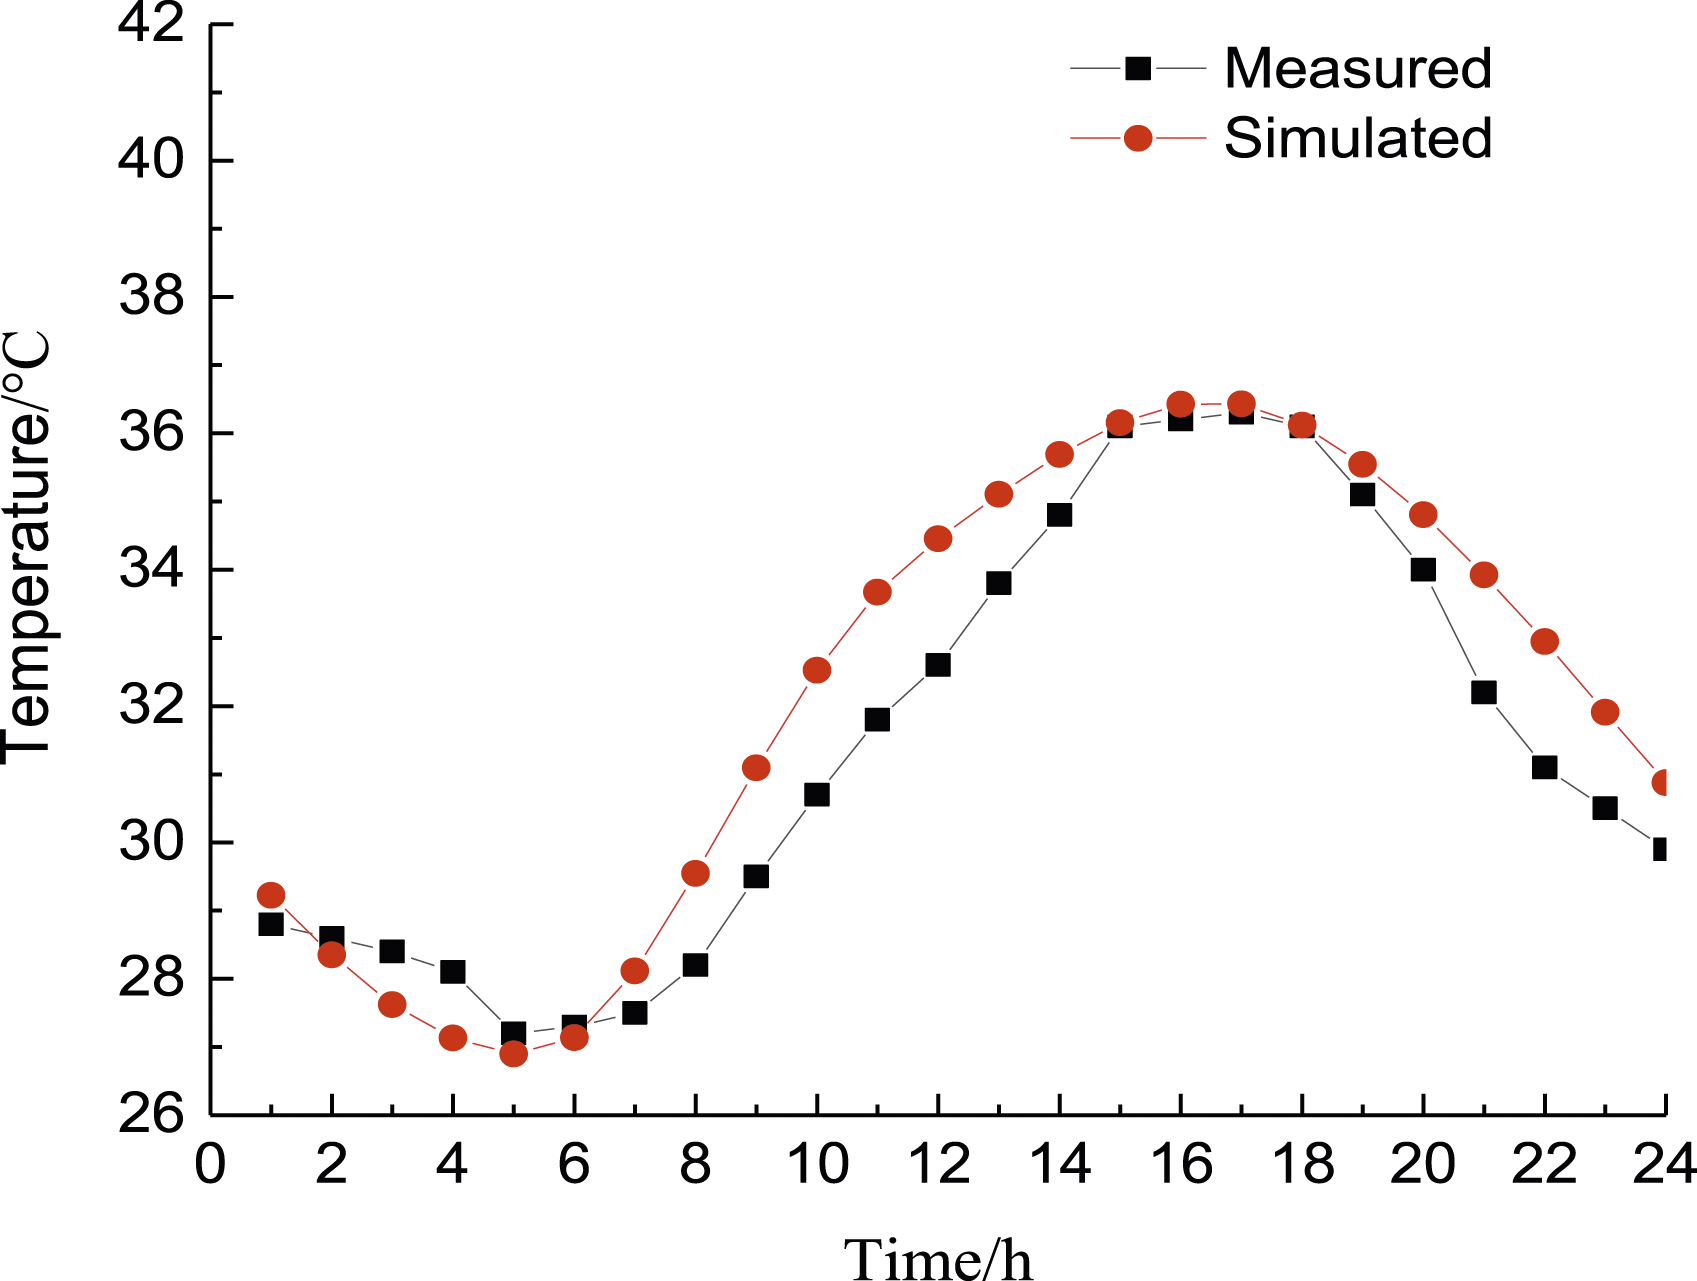


Figures 14∼17 show that the root-mean-square error (RSME) of the top plate measurement points is 1.0°C, and the maximum error is 2.1°C. The RMSE of the left web measurement points is 1.1°C, and the maximum error is 1.9°C. The RSME of the right web measurement points is 0.9°C, and the maximum error is 1.7°C. The RSME of the bottom plate measurement points is 1.3°C, and the maximum error is 1.9°C. When subjected to solar radiation, the measurement point 1#Temp-T13, situated near the exterior of the top plate, exhibits rapid warming followed by gradual cooling at sunset. Conversely, the bottom plate, receiving no direct sunlight, demonstrates relatively gradual temperature changes.
The discrepancy between the FEM-calculated temperature outcomes and the measured temperature results is minimal. This alignment serves as verification that the numerical model, based on astrophysics, meteorology, and other theories, utilized within ANSYS, accurately simulates the arch rib temperature field.
Three-dimensional temperature field across ribs of RC arch bridges under solar radiation during construction
Temperature field law of arch rib section
The established FEM model was utilized to compute the cross-sectional temperature field, focusing on nodes situated along the centerline of the top plate, webs, and bottom plate within the arch rib cross-section. Figures 18∼21 illustrate the temperature variation curves at these nodes along the thickness direction of the respective components: top plate, bottom plate, and both web plates in the cross-section. In these figures, T N represents the node N meters from the outer surface of the top plate, while LW N and RW N denote the nodes N meters from the outer surface of the left and right web plates, respectively. Additionally, B N represents the node N meters from the outer surface of the bottom plate. Node temperature variation across the thickness of the top plate. Node temperature variation across the thickness of the bottom plate.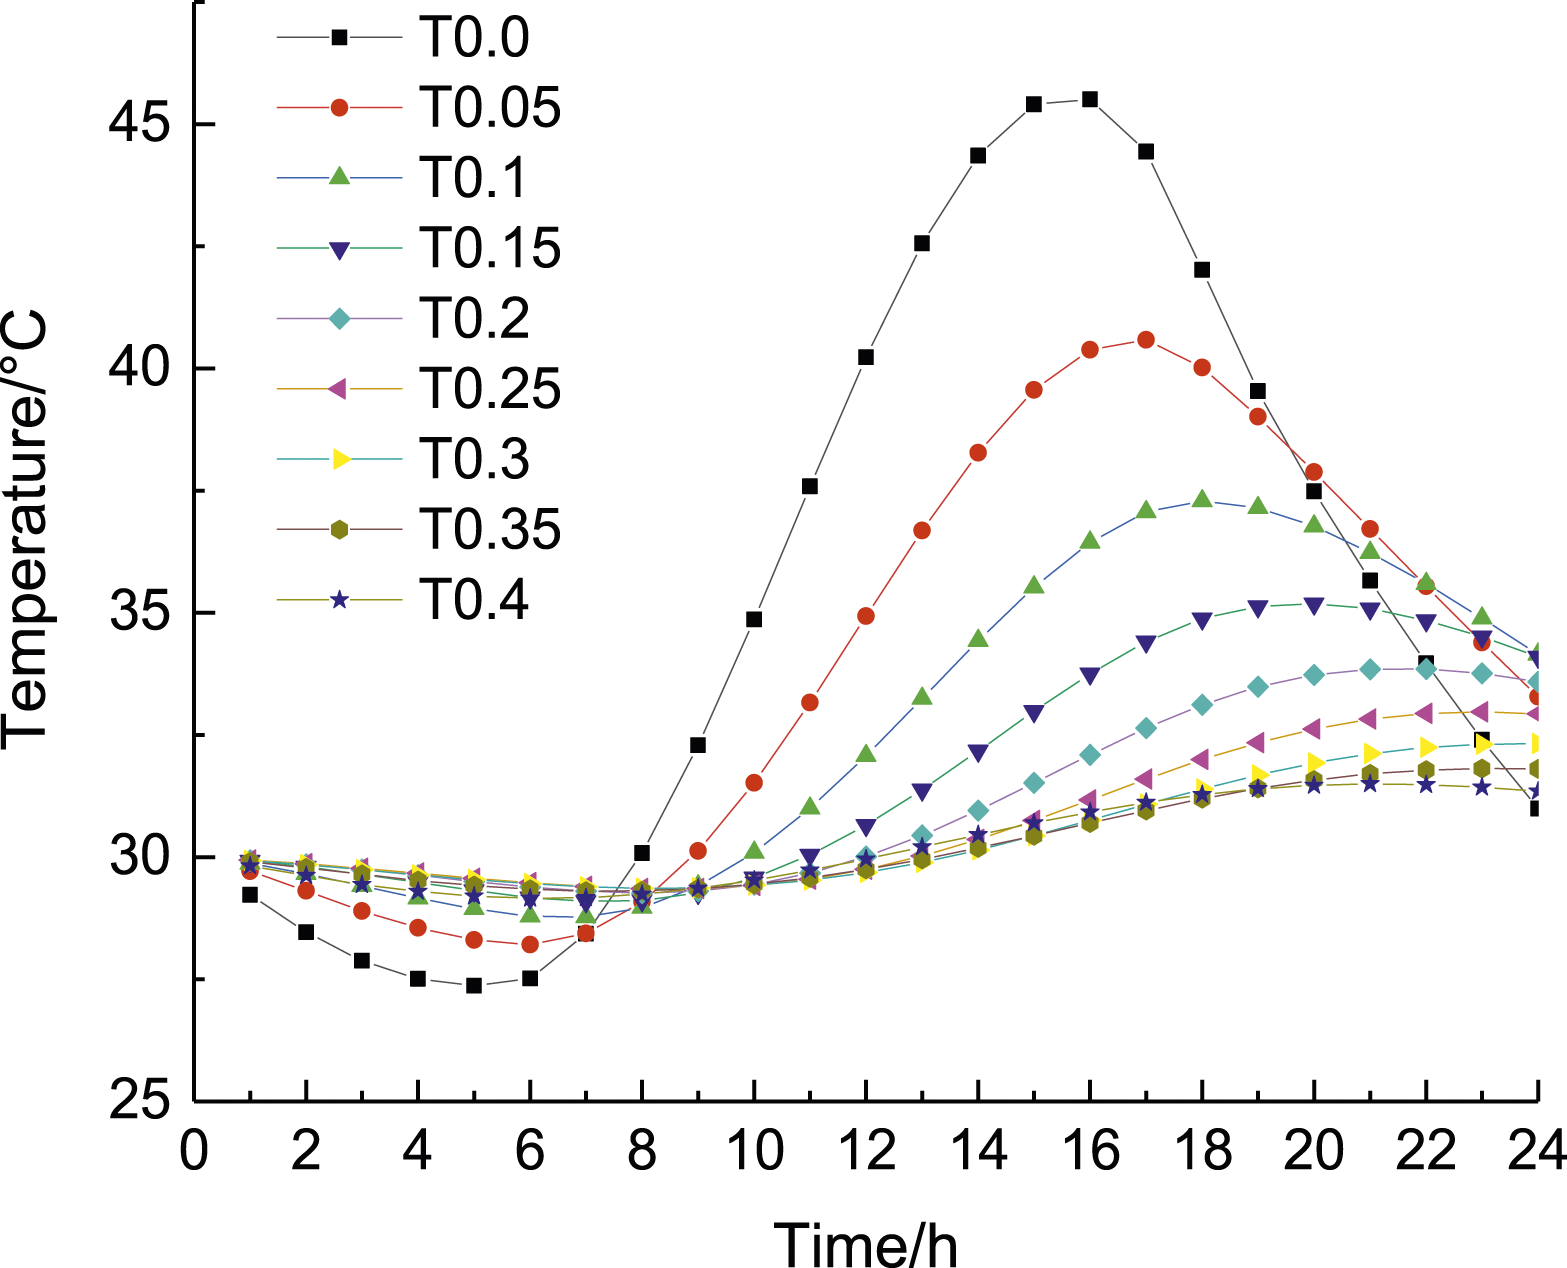

Figure 18 demonstrates that nodes closer to the outer surface of the arch rib exhibit a shorter time frame to reach their temperature change peak, implying internal heat transfer within concrete with hysteresis. The observed temperature change pattern aligns with the characteristics of the temperature field, as confirmed by the measured data.
A comparison between Figures 20 and 21 reveals that there is a difference in the temperature variation curves of the two sides of the webs. The left web peaked temperature at 39.6°C, while the right web peaked at 41.6°C. The left web reached the peak temperature earlier than the right web, and the left web reached the peak temperature at 14:00, while the right web reached the peak temperature at 16:00, with the left web warming up at a faster rate. This discrepancy arises because the left web, exposed to direct sunlight in the forenoon, experiences rapid heating and remains on the sunny side, conversely, the right web, situated in an environment influenced by lower heat transfer and ground reflection due to being in the shaded area, warms up at a comparatively slower rate. As the sun’s azimuth changes over time, direct sunlight falls on the right web, causing it to remain on the sunny side, while the left web, without direct sun exposure, exhibits a gentler warming curve. Node temperature variation across the thickness of the left web. Node temperature variation across the thickness of the right web.

Similarly, comparing Figures 18 to 21 shows that temperatures along the thickness direction of the top plate nodes generally surpass those of the web nodes. The bottom plate, which receives no direct sunlight, displays a more gradual temperature variation, resulting in lower peak values.
Figure 22 presents the vertical temperature distribution along the centerline of the arch rib section. It is evident from the graph that there is a temperature difference of 14.8°C between the outer surface of the top plate and the location situated 0.3 meters away from the outer surface of the top plate. In contrast, the temperature gradient of the bottom plate measures 5.2°C. Vertical temperature distribution along the centerline of the arch rib section.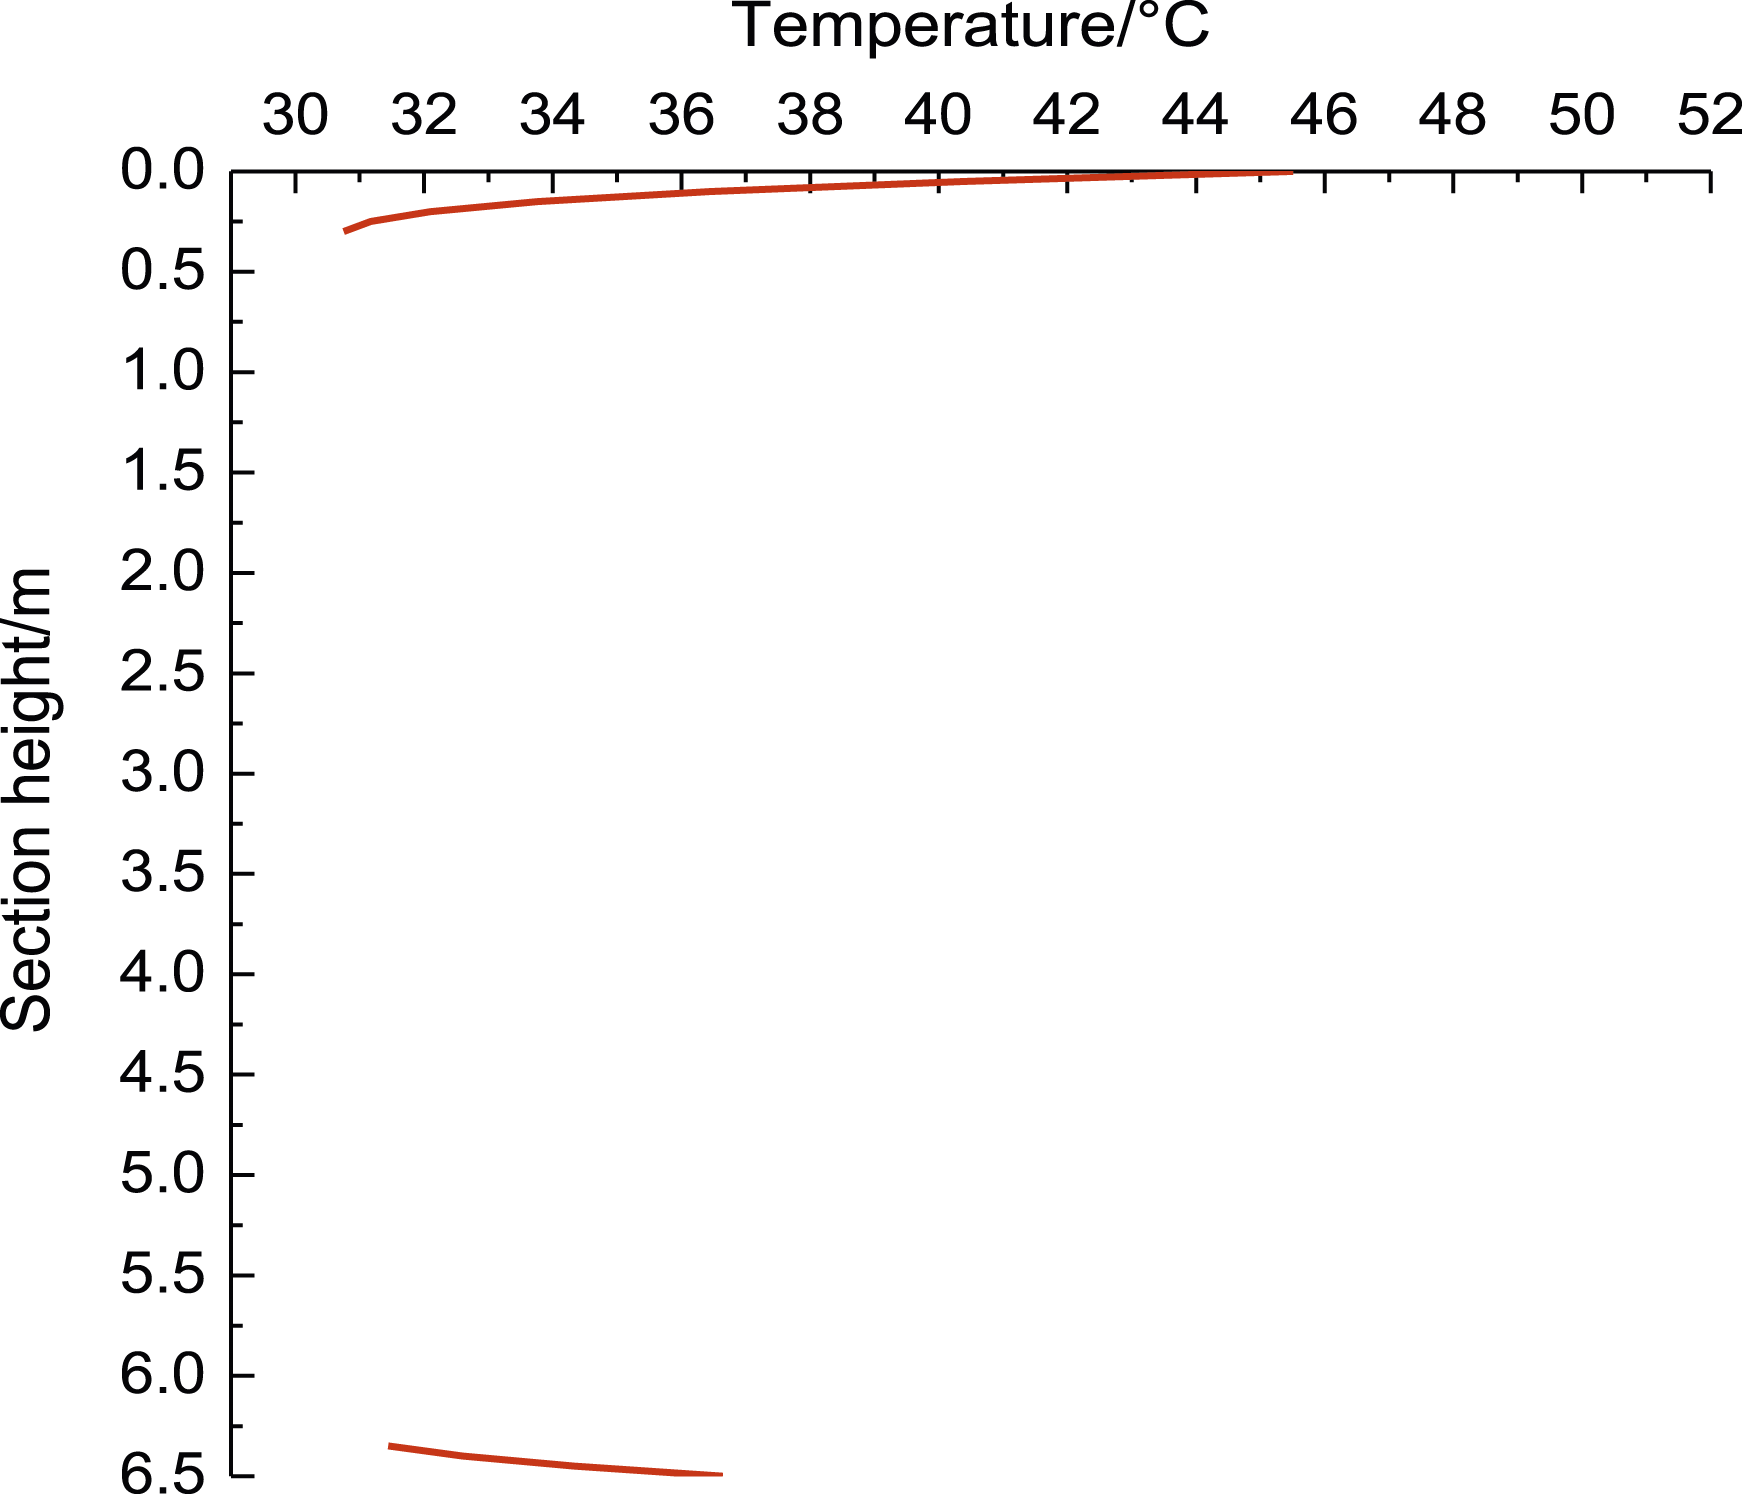
Figure 23 depicts the temperature field distribution contour of the arch foot cross-section at various time points. The illustration shows distinct temperature changes over time. From 7:00 to 9:00 a.m., the left web’s outer surface experienced notable warming. This occurrence is attributed to the relatively low solar altitude angle during the sunrise phase, causing a larger solar incidence angle on the left web’s surface compared to the top plate. Consequently, the left web receives more direct solar radiation during this period. Temperature distribution across the arch foot section at different moments of the day: (a) 7:00 a.m.; (b) 9:00 a.m.; (c) 11:00 a.m.; (d) 13:00 p.m.; (e) 15:00 p.m.; (f) 17:00 p.m.; (g) 19:00 p.m.; (h) 21:00 p.m.; (i) 23:00 p.m.; and (j) 24:00 p.m.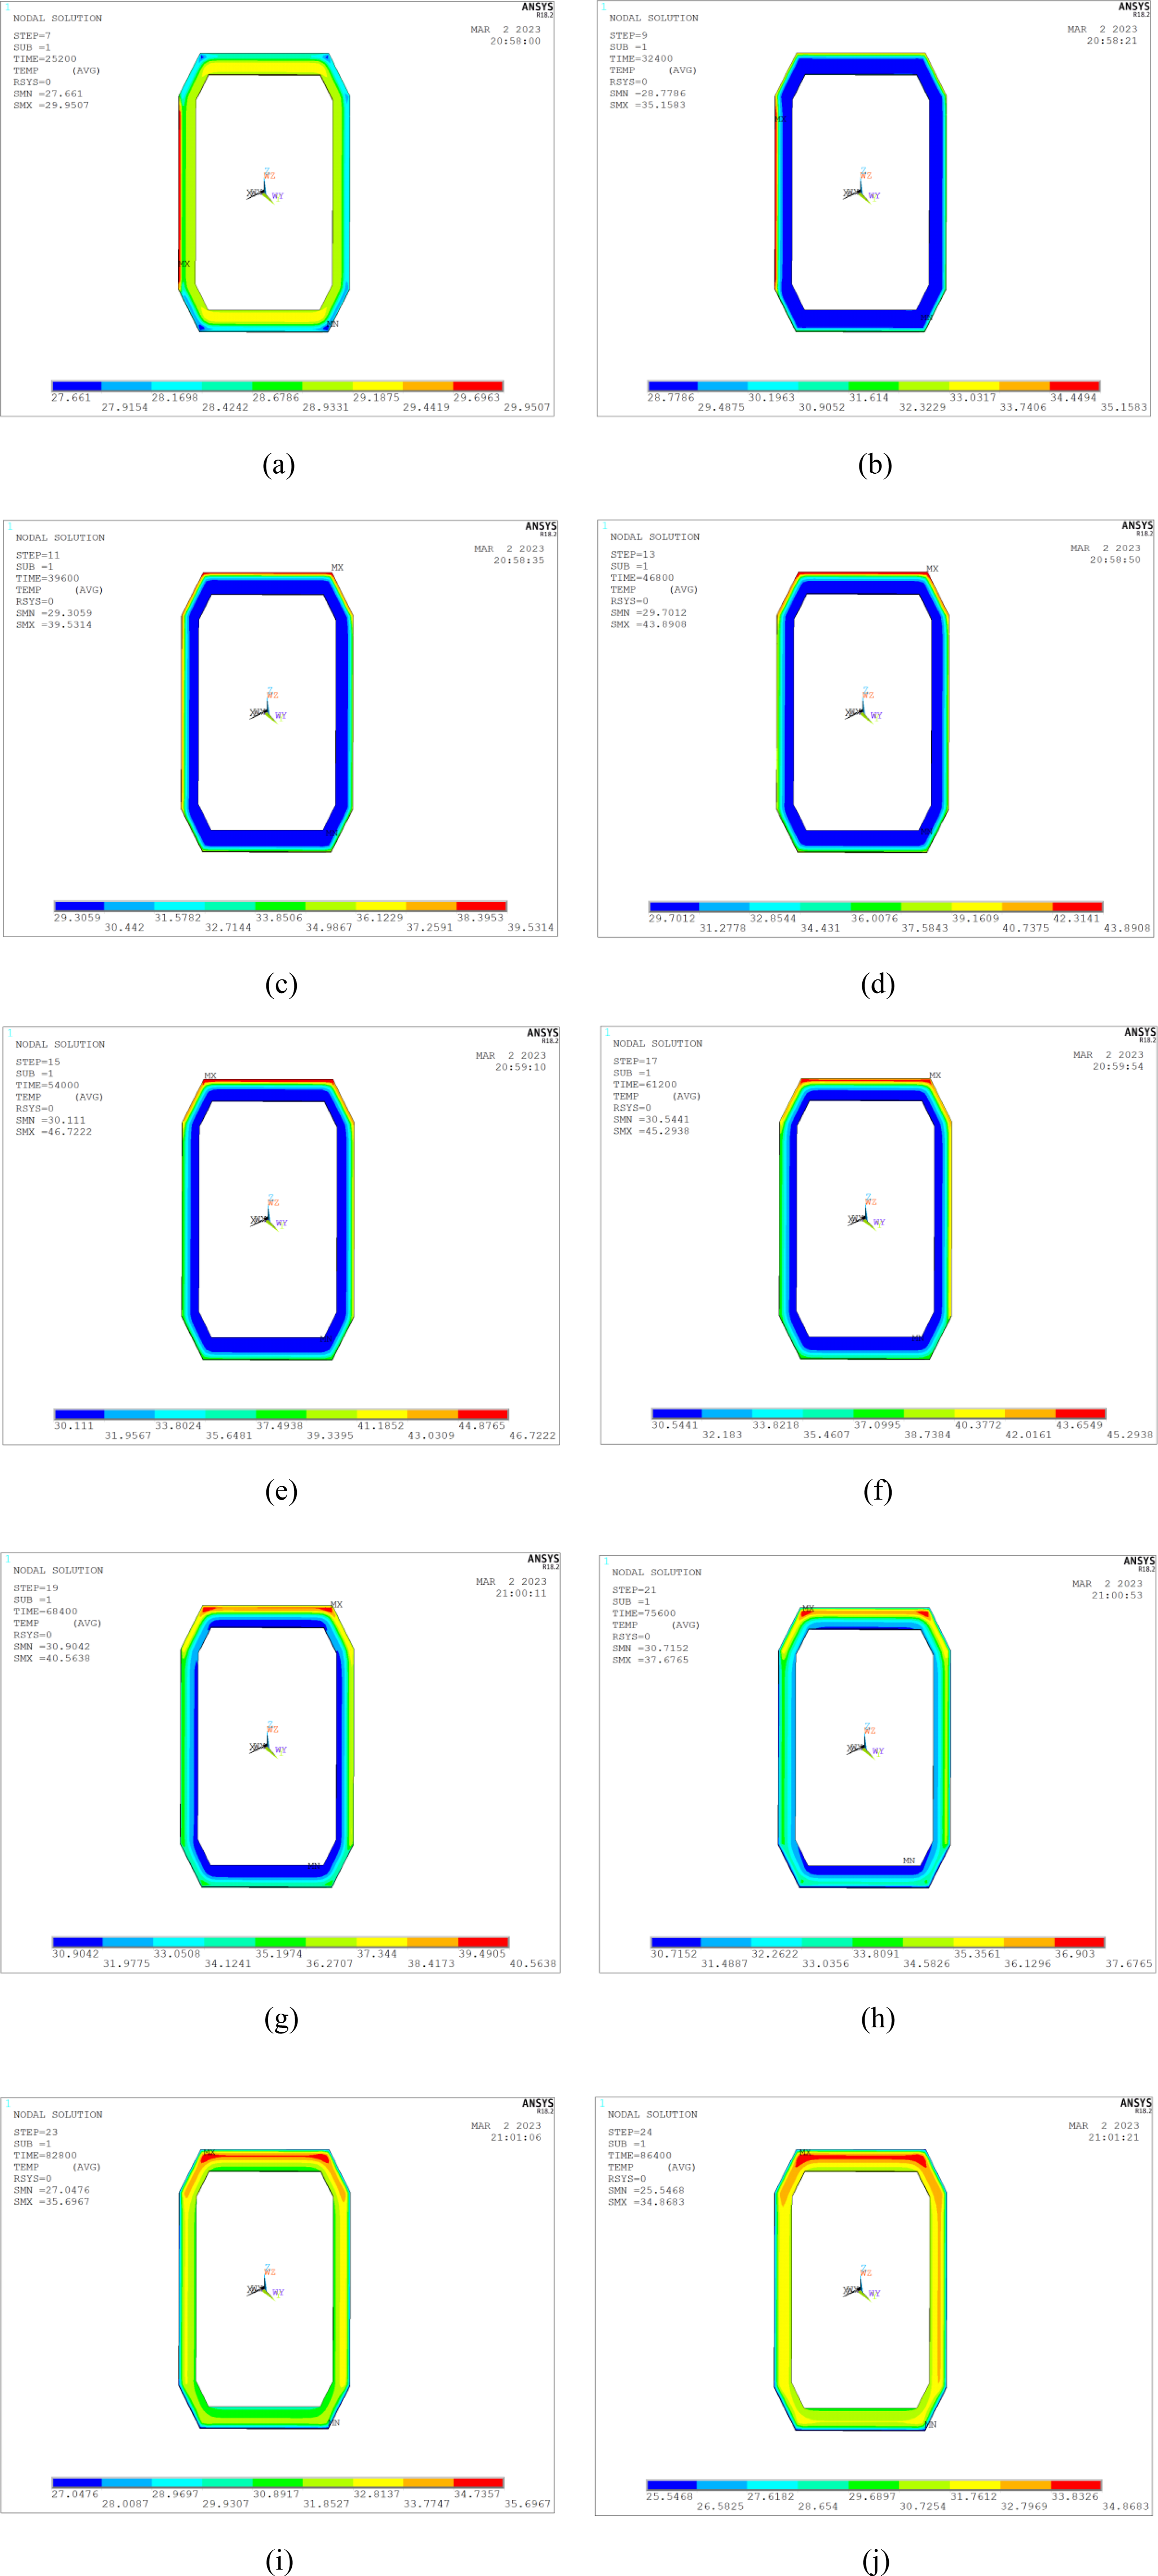
As time progresses, the solar altitude angle ascends. By noon, the sun’s rays nearly vertically irradiate the outer surface of the top plate, leading to a rapid increase in temperature, peaking at 3:00 p.m. The maximum temperature occurs at the junction of the top plate and the web’s transition zone due to the larger radiation area in this region. As the sun begins to set after 5:00 p.m., the cross-sectional temperature starts decreasing, albeit at a slower rate, gradually converging toward the ambient temperature.
After 9:00 p.m., the outer surface of the arch rib section displays lower temperatures compared to the concrete interior, a result of the concrete’s heat transfer hysteresis. During the early morning hours, the section’s temperature becomes more uniform, with most areas registering temperatures within the range of 29.0°C to 32.0°C.
Three-dimensional distribution of temperature field across the arch rib
The inclination of the RC arch bridge arch ring segment gradually decreases from the arch crown to the arch foot. Consequently, each segment receives different total radiation throughout the day, causing varying temperature field behaviors across various parts of the arch rib. Illustrated in Figure 24, both banks of the top plate of the arch rib face distinct directions, resulting in differing angles between the surface normal of the top plate and the incident sun rays. Consequently, this dissimilarity leads to varying amounts of solar radiation received by the top plate of each bank at any given moment. In contrast to the two-dimensional temperature field of linear girder bridges, the analysis of RC arch bridges requires comprehensive consideration of the three-dimensional temperature field. This assessment encompasses the transverse and vertical directions, along with the direction of the arch rib axis. Schematic diagram of solar radiation on both banks of the arch rib.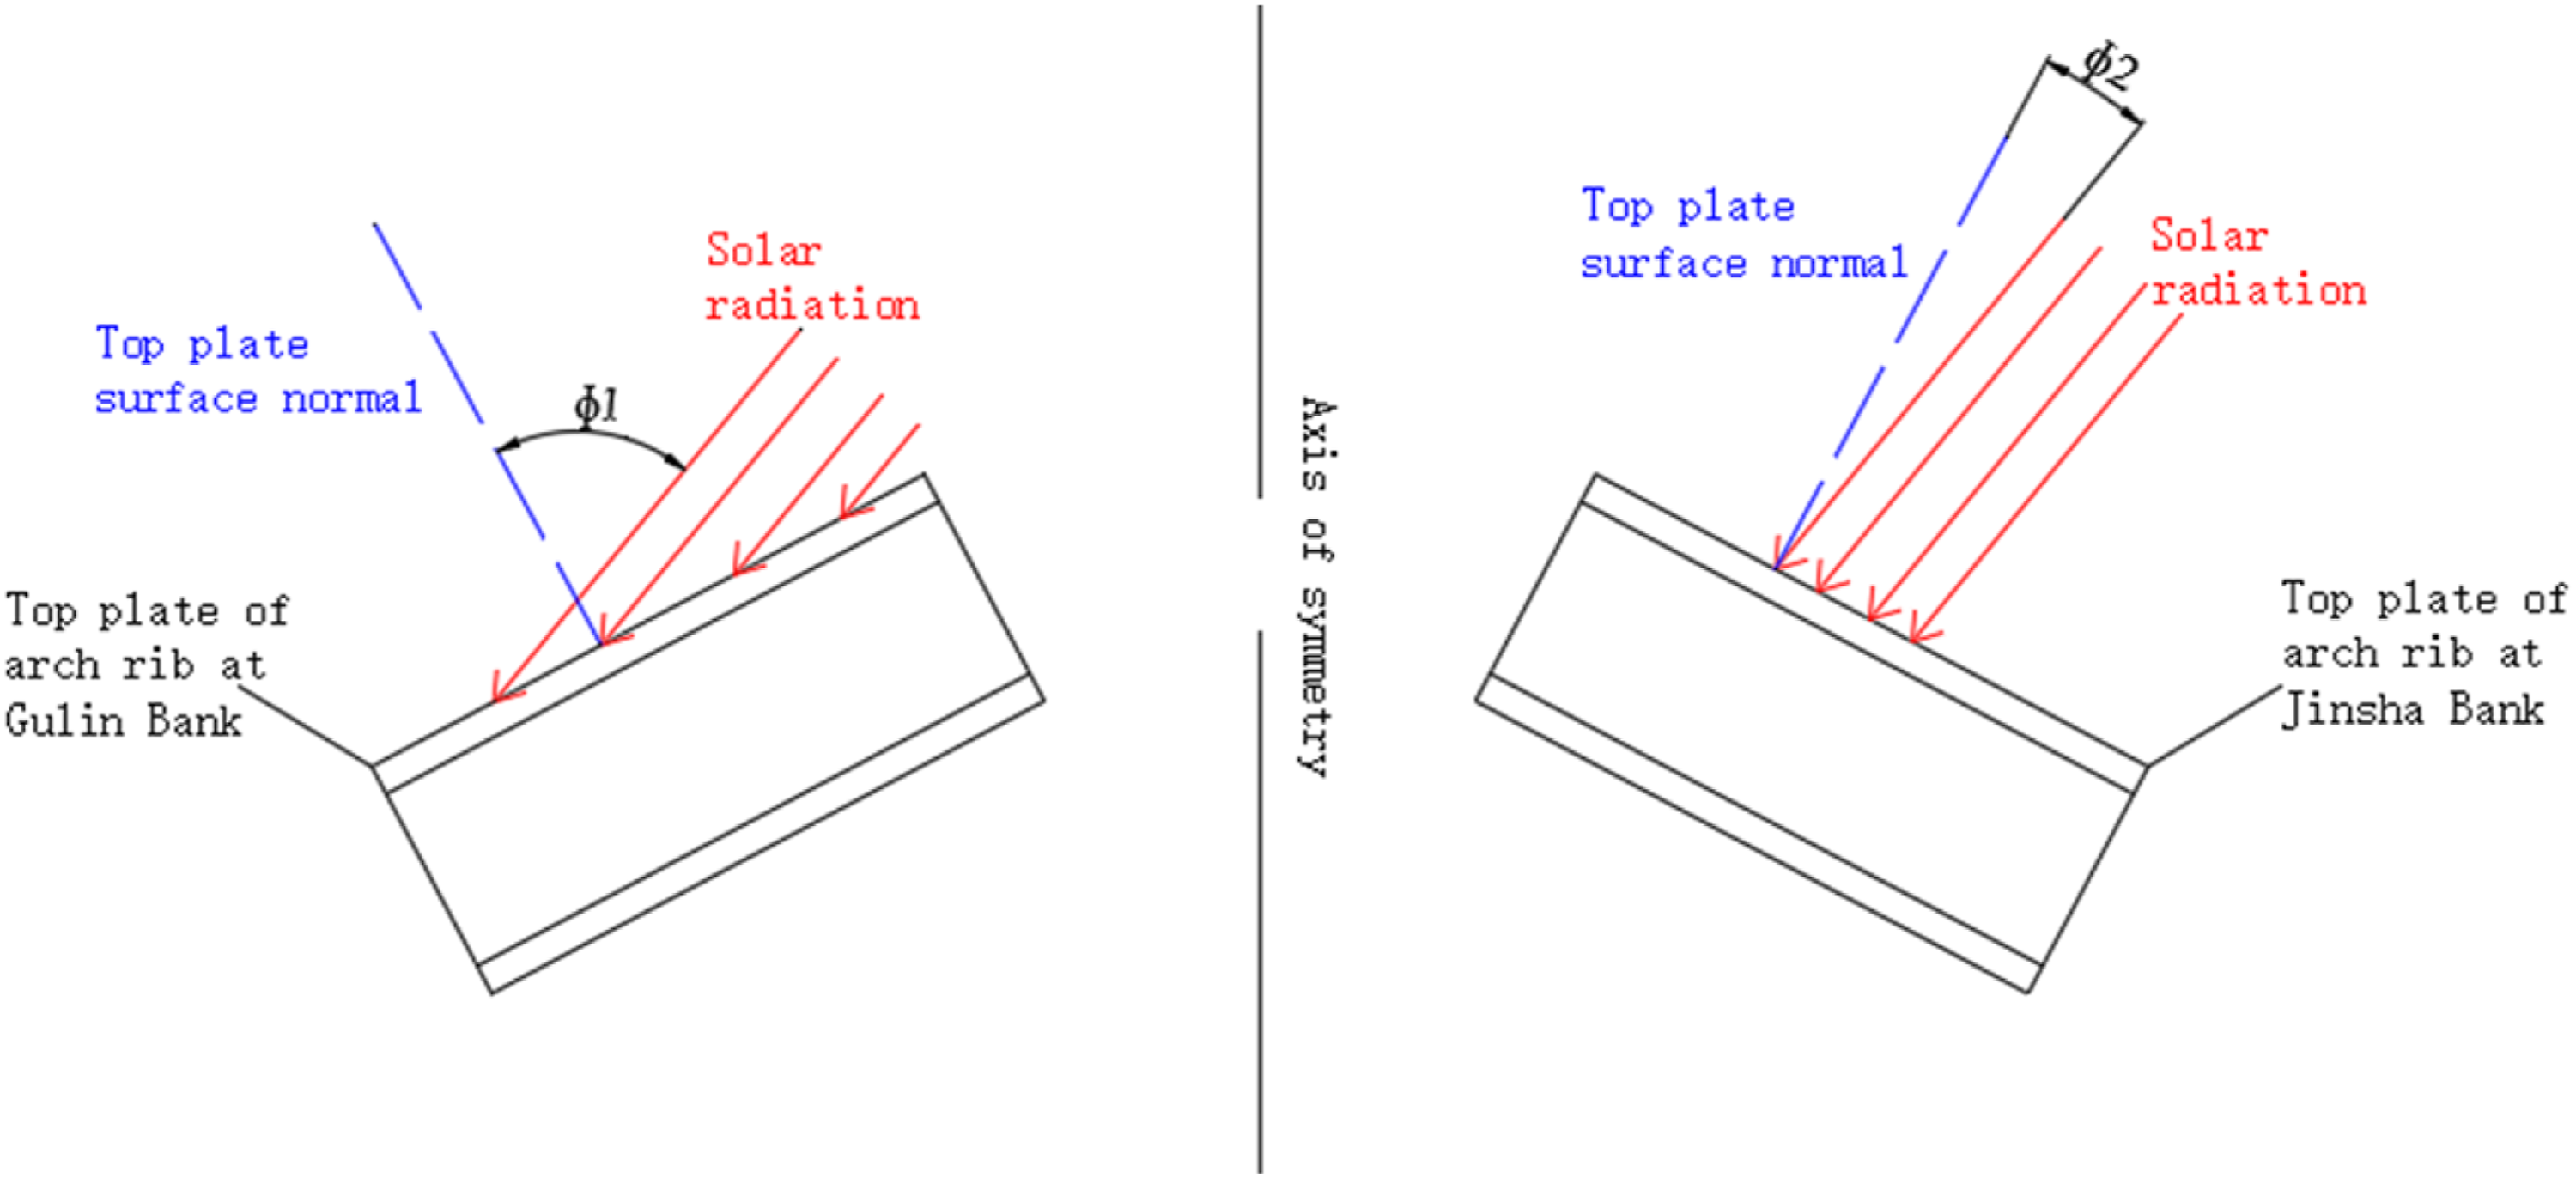
Three methods were applied to streamline the numerical simulation of the three-dimensional temperature field and enhance computational efficiency when constructing a three-dimensional FEM model of the arch rib: (1) Individual modeling of each arch rib segment was conducted. Establishing a complete 3D solid model of the entire arch necessitates simulating a considerable number of units, resulting in decreased computational efficiency. (2) The analysis disregarded the impact of curved segments in favor of straight segments on the temperature field within the section. Thus, the arch rib axis was simplified as a straight line. (3) Parametric modeling involved setting the azimuth and inclination of each arch rib segment as variable factors. This method generated temperature field models for different segments by modifying these variable parameters. ANSYS analyzed the model’s coordinate data to identify whether each model’s outer surface received direct sunlight. For surfaces directly irradiated, the software calculated the corresponding solar radiation and applied the relevant temperature load. Additionally, uniform meshing of each segment’s model ensured identical node numbers and relative node positions. Consequently, extracting temperature data from specific nodes and positions via ANSYS Apdl became straightforward.
As depicted in Figure 25, it is evident that the arch foot on each side of the Shuiluo River Bridge is dissimilar in height, resulting in an asymmetrical arch rib with a sloped structure. The horizontal inclination angle at any given point along the arch axis is determined through calculations utilizing equation (5). To complement these data, Table 8 gives the inclination and section parameters of different arch rib segments, sourced from additional information available in the project profile. Schematic diagram of a rib of the Shuiluo River Bridge (Unit: m). Inclination and section parameters of different arch rib segments.

Figure 26 presents the partial FEMs created by defining the geometric and positional parameters of each segment. FEM of each segment: (a) Gulin bank arch foot; (b) at 1/4L; (c) vault; (d) at 3/4L; (e) Jinsha bank arch foot.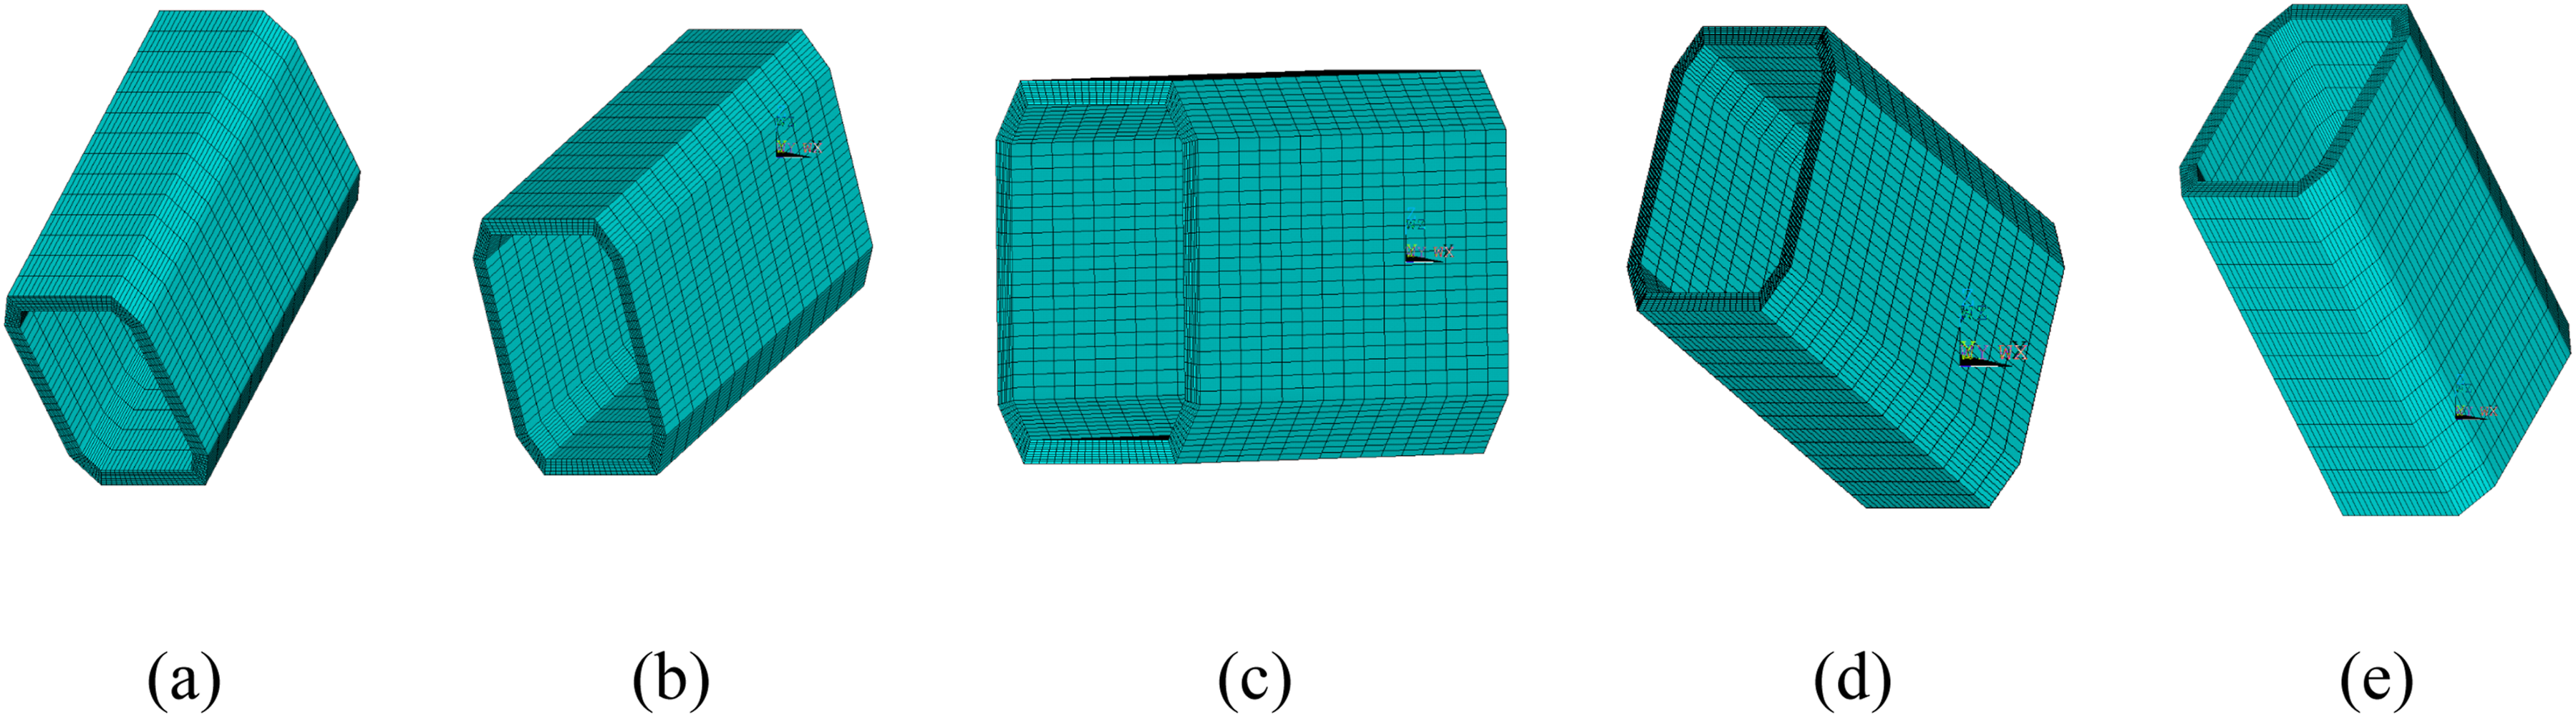
Due to the web orientation being consistently perpendicular to the ground across all sections of the arch rib, there are no alterations in inclination or azimuth. Consequently, the temperature fluctuations along the arch axis direction are minimal. The bottom plate, shielded from direct solar irradiation and experiencing negligible effects from changes in inclination, displays relatively minor temperature variations. Thus, the ensuing discussion pertains solely to the distribution of the three-dimensional temperature field regarding the top plate of the arch rib.
In Figure 27, a comparison of the maximum peak temperatures of the top plate is illustrated for each segment of the arch rib. The figure highlights that the peak temperatures of the top plate for each section of the arch rib follow a pattern of being highest at the arch crown and lowest at the arch foot on both banks. Specifically, the maximum peak temperature recorded on the top plate reaches 49.0°C, whereas at the arch foot of the Jinsha Bank, it registers at 44.9°C, marking a difference of 4.1°C. Comparison of maximum peak temperature at the top plate of each segment of the arch rib.
Figures 28 and 29 depict the temperature change curves of the external surface at the centerline of the top plate for each segment of the arch rib in the Gulin Bank and Jinsha Bank, respectively. The greater solar radiation received by the arch rib results in a higher peak temperature on the outer surface of the top plate, reaching a maximum of 47.8°C. In contrast, the arch foot of the Jinsha bank, receiving comparatively less radiation, registers a peak temperature of 43.8°C, yielding a difference of 4.0°C between the two. Variation of outer surface temperature along the centerline of the top plate of each section of the half-arch of the Gulin bank. Variation of outer surface temperature along the centerline of the top plate of each section of the half-arch of the Jinsha bank.
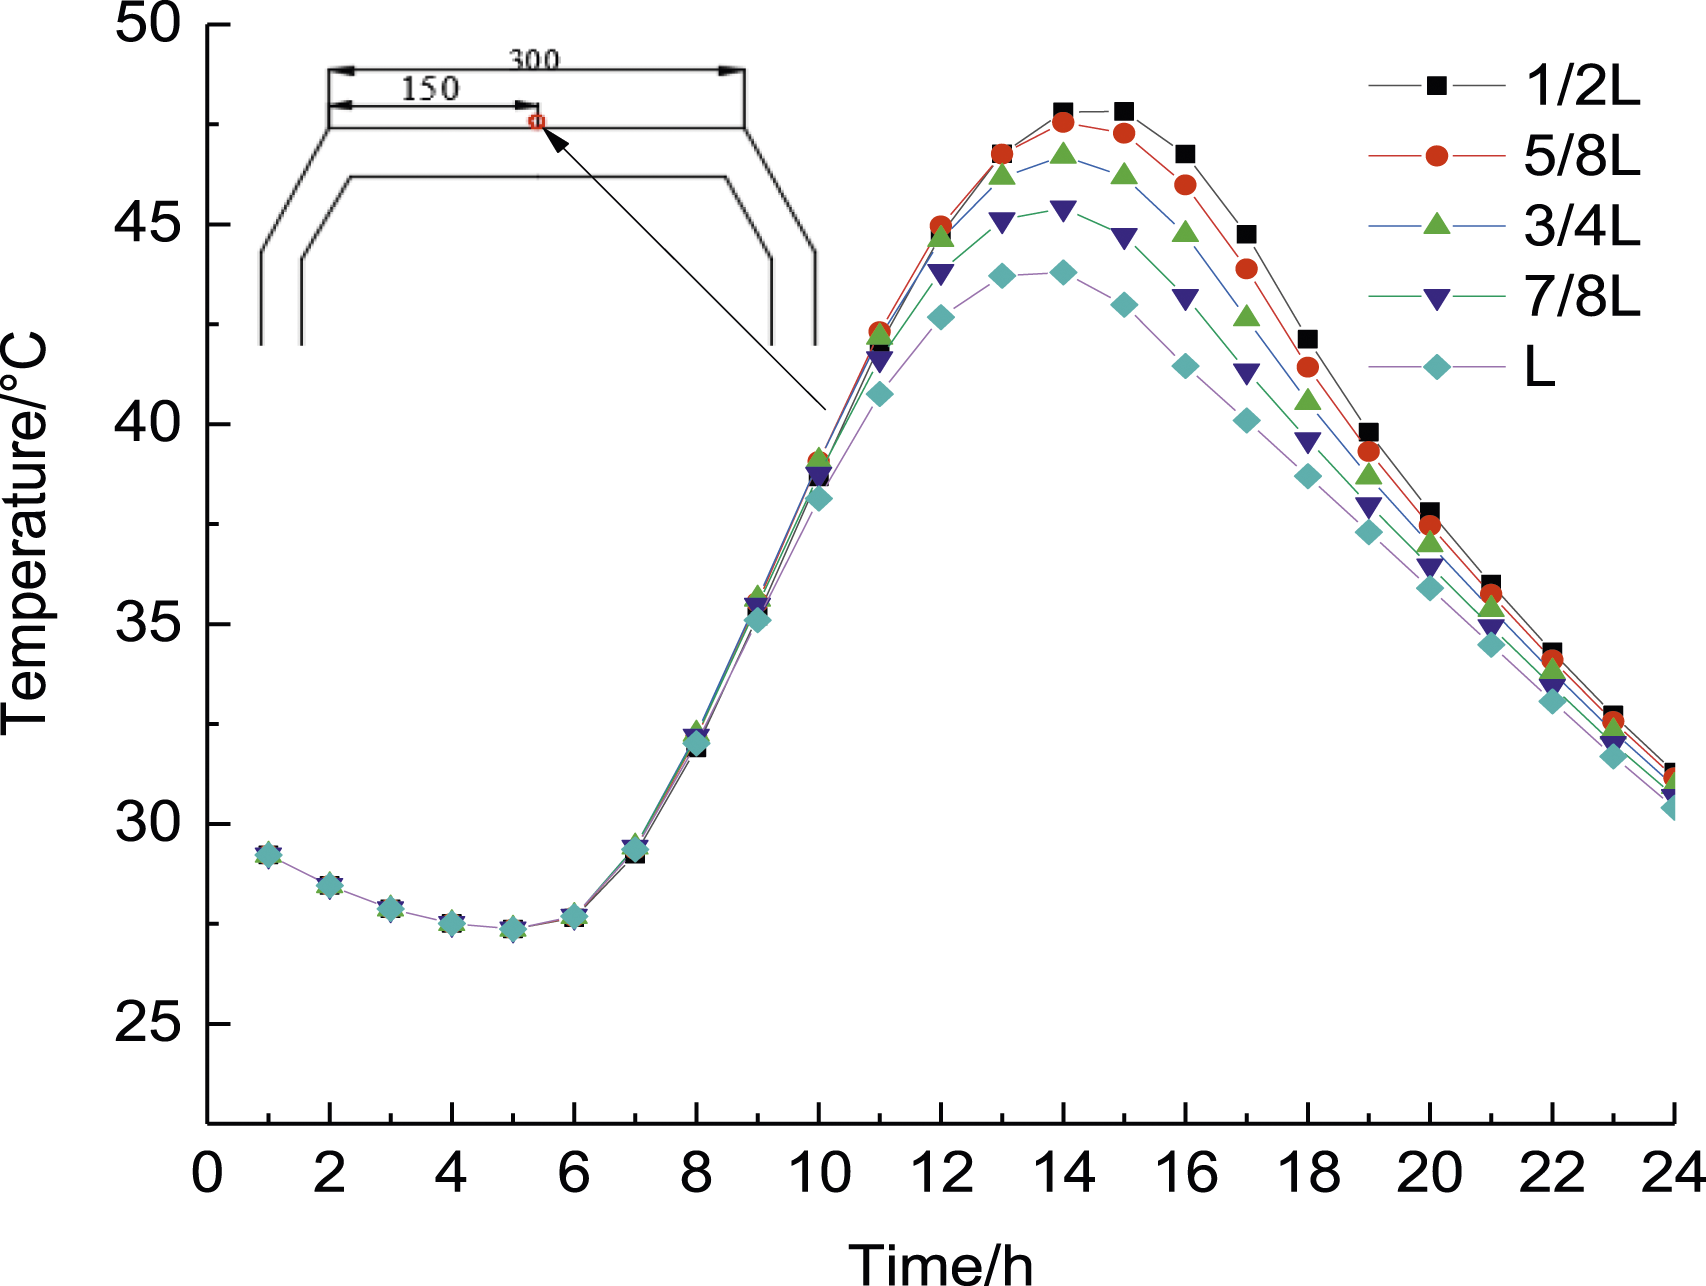
Upon comparing Figures 28 and 29, it becomes evident that the time taken to reach the peak temperature from the outer surface of the top plate at the Gulin Bank, closer to the arch crown, is longer than that at the Jinsha Bank, where it is shorter. Specifically, the arch foot of the Gulin Bank reaches its peak temperature at 16:00, whereas the arch foot of the Jinsha Bank reaches it at 14:00.
This discrepancy arises due to the positive and negative inclination angles of both banks’ arch-ribs. At noon, when one bank receives less direct sunlight and has a smaller angle between the sun’s rays and the normal angle of the top plate’s outer surface, the other bank tends to receive stronger sunlight with a larger angle. This variation leads to slightly different solar radiation levels between the two banks, resulting in one bank reaching its temperature peak earlier, while the other experiences a delayed peak, albeit with a relatively minor difference.
Figure 30 presents a comparison of the maximum temperature difference observed on the outer surface along the centerline of the top plate in the direction of the arch-rib axis. As depicted in Figure 30, the maximum temperature difference along the arch rib axis peaks at 16:00. At this point, there is a recorded maximum temperature difference of 5.3°C between the outer surface of the top plate at the arch crown and that at the arch foot of Jinsha Bank. It is verified that, throughout the day, the top plate of the arch crown receives more solar radiation compared to the top plate of the arch foot on both banks. Maximum temperature difference on the outer surface along the centerline of the top plate in the direction of the arch rib axis.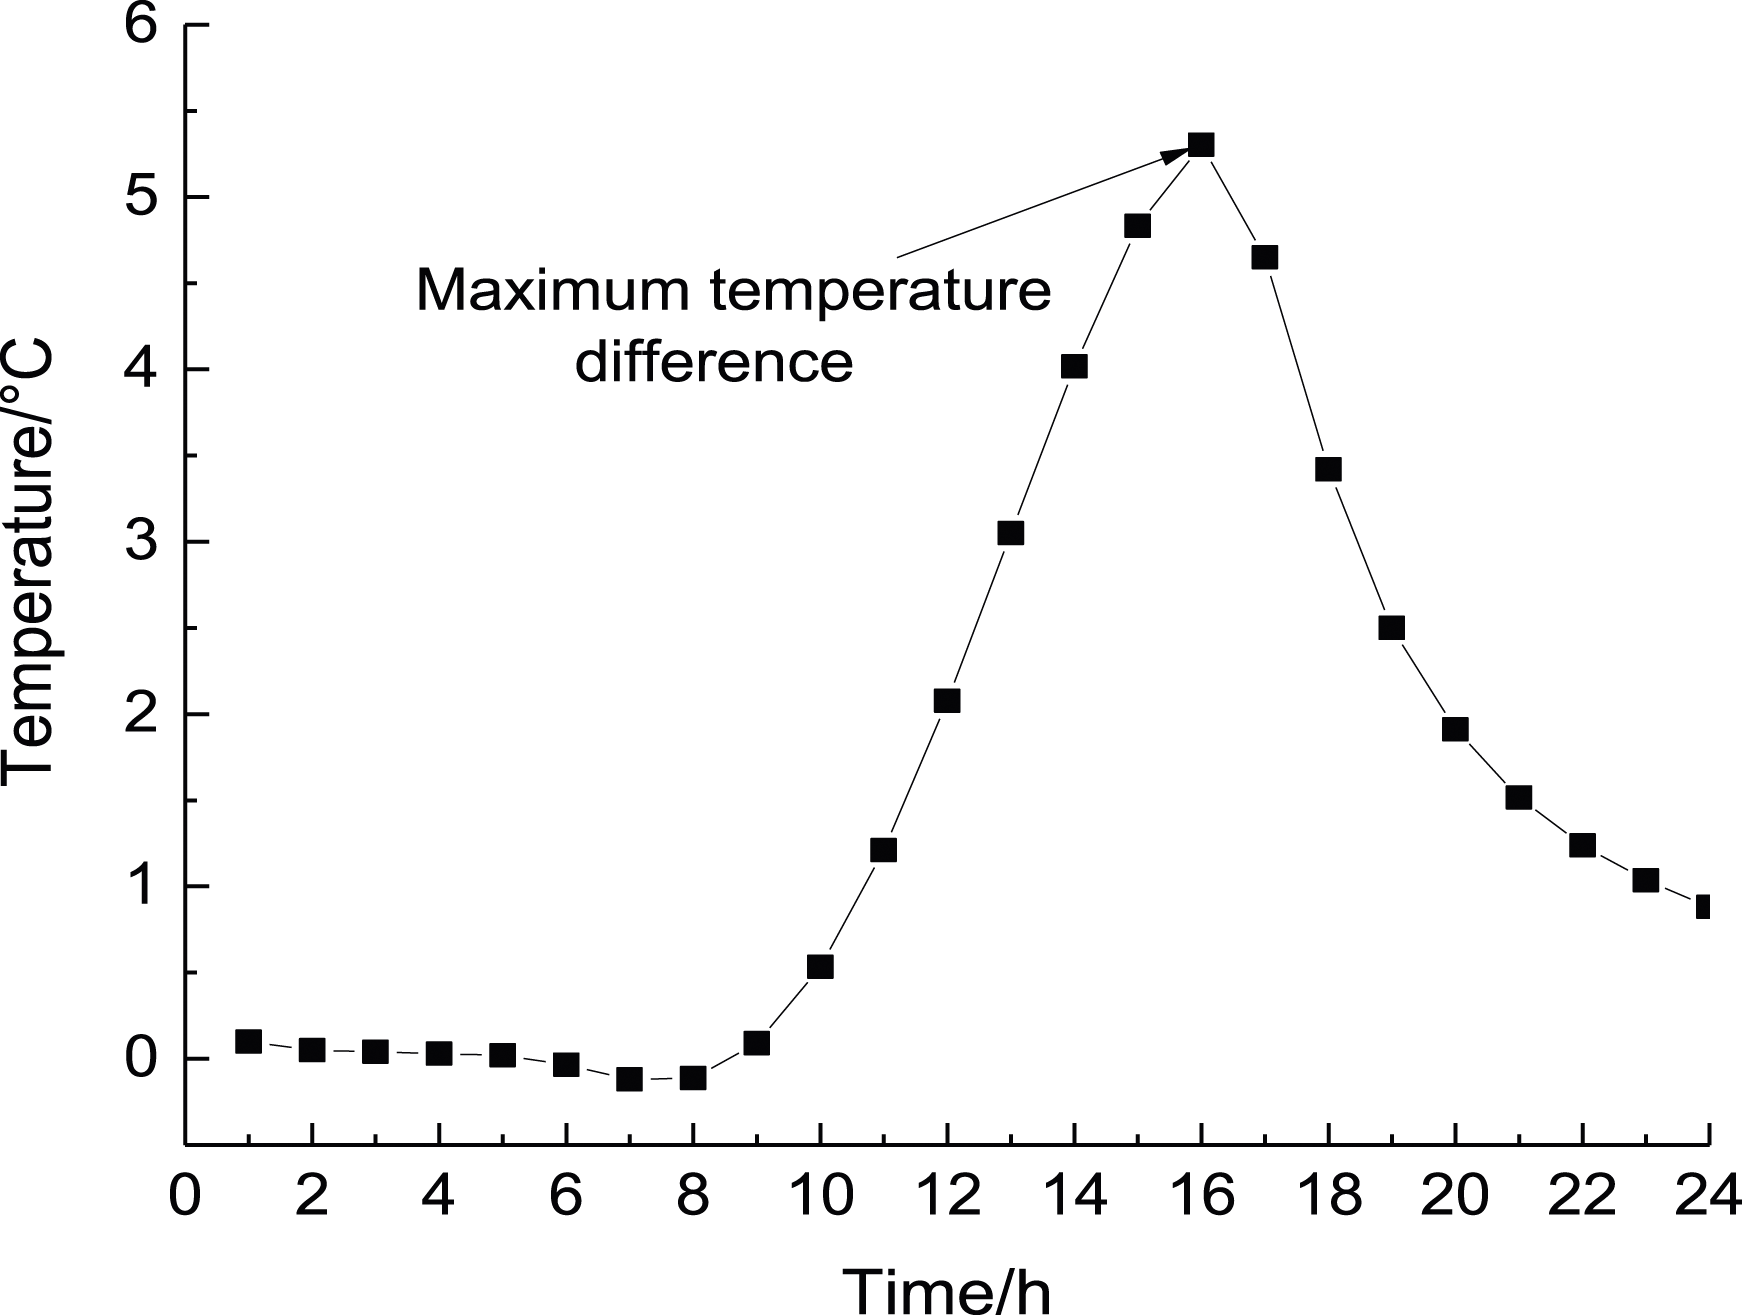
Fitting of full-arch temperature gradient model under solar radiation
Positional information, such as the azimuth and inclination of the primary structural surfaces of most bridges, remains constant along the longitudinal direction of the bridge. Consequently, in bridge design, only the two-dimensional temperature gradient variation across the cross-section is typically considered. However, in the case of an RC arch bridge, the arch rib axis is curved, leading to a certain degree of temperature field variation along the longitudinal direction of the bridge.
Temperature difference at different heights from the top plate of each key section of the arch rib (°C).

Parameters of temperature gradient curves for the top plate in each section of the arch rib.

From Table 10, it is evident that the values of T
0
and 
Conclusion
In this investigation, the study focused on the arch rib of the Shuiluo River bridge, conducting a three-dimensional temperature field test and numerical simulation of the arch rib under solar radiation during its construction period as a separated arch rib RC arch bridge. The variation of the temperature field of the arch rib section under sunshine was summarized. The temperature gradient of the arch foot section of the Shuiluo River Bridge was fitted by comparing and combining with the norms of different countries. A numerical simulation adaptive finite element model of the temperature field of the arch rib was established, and the three-dimensional temperature field of the arch rib was analyzed. A method of sunshine temperature gradient fitting considering the longitudinal temperature difference of the arch axis was proposed. The summarized conclusions are as follows: (1) The external surfaces of the top plate showed a considerable daily temperature difference of up to 15.3°C due to solar radiation influence, starting to warm between 6 a.m. to 8 a.m. However, the temperature variations were less pronounced near the inner surface, leading to a substantial temperature difference between the inside and outside of the chamber. The bottom plate, not directly exposed to sunlight, exhibited much smaller temperature variations compared to the top plate and webs. (2) Compared and combined with the specifications of various countries, a temperature gradient model for the arch foot section was constructed, using an exponential function to fit the measured temperature gradient at the top plate of the arch foot section. The bottom plate was fitted with a linear temperature gradient of 3.4°C within a range of 20 cm from its outer surface. (3) An adaptive finite element numerical simulation model of the temperature field in the arch rib section was established based on the theories of astrophysics and meteorology, which was verified using the measured temperature field data. The analysis of numerical simulation results shows that the solar radiation temperature field pattern across the arch rib cross-section indicated that the concrete temperature peak is closer to the top plate, requiring less time to reach the peak. The temperature variation curves for the left and right webs differed due to varying direct solar radiation exposure times. (4) The three-dimensional temperature field pattern of the arch rib revealed higher temperatures on the top plate surface at the arch crown and lower temperatures on the top plates of the two banks at the arch foot. The maximum temperature difference between the arch crown and the arch foot’s top plate surface reached 5.3°C, and the vertical temperature difference increased by 29.61% from the arch foot to the arch crown. Based on finite element simulation outcomes, a full-arch insolation temperature gradient fitting method considering the axial temperature difference of the arch ring was proposed, and a three-dimensional temperature gradient model for the Shuiluo River bridge arch rib solar radiation was obtained.
Footnotes
Declaration of conflicting interests
The author(s) declared no potential conflicts of interest with respect to the research, authorship, and/or publication of this article.
Funding
The author(s) disclosed receipt of the following financial support for the research, authorship, and/or publication of this article. It is financially supported by the National Natural Science Foundation of China (Grant Nos. 51478049, 52078058), the Natural Science Foundation of Hunan Province (Grant Nos. 14JJ2075, 2022JJ50323), the Postgraduate Research and Innovation Project of Hunan Province (Grant No. CX20190660).
