
Abstract
The orthotropic steel decks (OSDs) are vulnerable to fatigue fractures, which will inevitably impair the normal service of the steel bridge panels. To determine the impact of the initial cracks on the fatigue life, this study constructed an evaluation model of the OSD rib-to-deck joints crack based on the fracture mechanics principle. And combined it with the multi-scale finite element analysis model, the digital fatigue test model of the whole bridge was established. Research shows: A typical I-II-III composite crack with the supremacy of type I crack can be seen in the OSD rib-to-deck joints. Fatigue cracks developed at the deck weld toe dominate the fatigue failure mode. Further research revealed that as the depth of cracks increased, the stress on the cross-section was redistributed. The intensity factor then displayed a trend of growing and then gradually flattening or even dropping. Based on the relationship between cracks of different depths and the remaining life of the OSDs, recommendations are given for bridge maintenance. The multi-scale digital fatigue test can provide analysis and simulation methods for the fatigue crack propagation in the steel bridge deck of the bridge in operation.
Keywords
Introduction
The orthotropic steel decks (OSDs) have been widely used in various types of bridges, such as highways and railroads, because of their outstanding advantages, such as lightweight, high load-bearing capability, and a broad range of applications, along with the rapid development of steel bridges (Kolstein, 2007). The OSD structure is constructed by welding together the decks, longitudinal ribs, and diaphragms. This OSD provides structures with superior strength while producing many welds. Meanwhile, the OSD directly bears the vehicle’s local wheel load, the stress pattern is complex. The imbalance of stiffness in different directions leads to additional deformation in OSDs, and the stress concentration problem is prevalent. Severe fatigue cracking will develop over the bridge’s service life, posing a substantial threat to its operational safety (Mukhopadhyay et al., 2014; Sohn et al., 2014; Ushakov et al., 2011). Scholars domestically and internationally have conducted numerous studies to reduce the cracking of current OSD bridges by optimizing the structural system (Fang et al., 2021; Iqbal et al., 2019; Xia et al., 2013), enhancing the welding process (Van Puymbroeck et al., 2019; Wu et al., 2021; Zhang et al., 2021), and improving the pavement performance (Chen et al., 2020; Dieng et al., 2013; Liu et al., 2020). Still, they have been unable to effectively prevent fatigue cracking on in-service bridges. Fatigue cracking of OSD structures significantly impacts the service performance and quality of structures, as well as the whole life cycle cost of structures. To preserve the sustainability of steel bridges, it is crucial to prevent and treat fatigue cracks as soon as to prolong the service life of the structure, as well as to conduct an accurate life assessment for OSD cracks.
For assessing the fatigue life of steel bridges, the nominal stress method, the hot spot stress method, the fracture mechanics method, and the damage mechanics method are common approaches (Tsiatas and Palmquist, 1999; Aygül et al., 2012; Cui et al., 2018a; Sun and Li, 2014; En 1993-1-9, 2005). If a reasonable standard section is not selected when applying the nominal stress method, it can introduce considerable errors in the fatigue life assessment of steel bridges. Yuan (2011) performed finite element analysis to determine the stress state on the fatigue cracking locations, and made special considerations for the application of hot-spot stress methodology, and derived the hot-spot stress range values. Maljaars et al. (2023) derived the fatigue resistance of welded details in orthotropic decks using structural stress (hot-spot stress) based on tests. Based on the hot spot stress interpolation equation was proposed to more appropriately evaluate the fatigue life of the curved cutout of the cross-sectional plate (Zhu et al., 2021). From the energy perspective, the damage mechanics method regards the fatigue damage process as an energy loss process accompanied by fatigue crack growth. The fatigue life assessment method based on the damage evolution model was applied to the Runyang Bridge, Tsing Ma Bridge, Stonecutters Bridge, and the Hong Kong-Zhuhai-Macau Bridge (Li et al., 2001a, 2001b; Zhou et al., 2016; Cui et al., 2018b; Wang et al., 2019). However, the hot spot stress technique cannot be used for fatigue investigation of fractures beginning at the weld root. In addition, for the time being, this approach is only relevant for uniaxial stress patterns, and its applicability to multiaxial fatigue stresses requires additional validation. The life assessment model constructed based on damage mechanics involves numerous parameters, while current few relevant tests cannot provide sufficient support for the model parameters. Fundamentally, damage constitutive models for different materials are fundamental to this approach. The damage constitutive model of OSD needs further research to improve the evaluation accuracy.
Unlike the methods above, fracture mechanics uses crack size and crack growth rate as the criterion for structural damage in fatigue life assessment. Within linear elastic fracture mechanics frame, stress intensity factor can be easily obtained using J-integral and M-integral to describe the crack tip stress state. Total fatigue life can therefore be predicted. In recent years, the fracture mechanics method has been successfully applied to fatigue performance, residual fatigue life assessment, maintenance, and reinforcement measures during the operation period of OSDs (Choi and Kim, 2008; Croce and Pellegrini, 2015; Gu and Zhou, 2012; Zhu and Guo, 2014). Wang et al. (2018) investigated the fatigue performance of steel bridge decks through fatigue tests and numerical analysis. The combination of fracture mechanics and finite element method defined the cracking mode of typical fatigue cracks at the macro level of OSDs, which provided the possibility for digital fatigue test (Gupta et al., 2019; Maljaars et al., 2018; Zhu et al., 2018). Nagy et al. (2016) proposed an improved analysing tool using linear elastic fracture mechanics and extended finite element model, and the calculations indicated that increasing the thickness of the deck plate and the longitudinal stiffener increases the fatigue life of the structure. Sim and Uang (2012) conducted fatigue tests of full-scale orthotropic steel decks to evaluate the fatigue performance of rib-to-deck partial-joint-penetration (PJP) groove welded joints. With the development of computational science, the numerical calculation methods of fracture mechanics have been adopted by more scholars, among which the extended finite element method is widely used to simulate geometric discontinuities of fatigue cracks (Singh et al., 2012). In the existing research of numerical fracture mechanics simulation, based on the finite element method, the stress analysis and fatigue life assessment of the U-rib roof connection joint of steel bridge deck under wheel loads are carried out (Xiao et al., 2008). Based on full-scale fatigue test data, Wang et al. (2020) established a multi-scale numerical analysis model for fatigue cracks caused by deformation in steel web gaps to analyze the propagation behavior of representative fatigue cracks in web gaps. In the OSDs, the crack size is considerably smaller than the structure size. The conventional finite element method meshing does not coordinate properly with the cracks, leading to errors between the simulation and the reality. In the crack life assessment, the multi-scale joint simulation method with FRANC3D software is successfully implemented (Patil et al., 2019; Zong et al., 2015; García et al., 2016; Narasimhachary et al., 2018; Paarmann et al., 2017; Ye et al., 2022). In addition to fatigue vehicle tensile stress, initial defect and welding residual stress are contributing factors to fatigue cracking of steel bridges (Chen et al., 2024). Luo et al. (2023) investigated crack-inclusion interaction for rib-to-deck welded joints in OSDs based on numerical simulation and linear elastic fracture mechanics (LEFM) by using the FRANC3D-ABAQUS interactive technology, and analyzed critical parameters, including the stress intensity factor (SIF), the shape factor, the growth rate, and the growth direction. A numerical simulation method of welded residual stress has been proposed to analyze the effects of welding residual stresses on fatigue reliability assessment of a PC beam bridge with corrugated steel webs under dynamic vehicle loading (Zhang et al., 2022).
Based on the finite element method and linear elastic fracture mechanics, this work established a multi-scale digital fatigue test model of box girder section between suspenders by the multi-scale modeling method and sub model technology. The most unfavorable state of the target structure was obtained by applying different working loads via the DLOAD subroutine. A solid sub model of the rib-to-deck welded joints was established using the nodal sub model technique and its accuracy was verified by the nodes. Combining the fatigue crack size and distribution obtained from the actual inspection, a local three-dimensional crack expansion finite element model of the rib-to-deck weld joints considering the actual initial crack was established based on the joint simulation analysis of ABAQUS and FRANC3D, and the crack tip stress intensity factor was calculated. Finally, the fatigue life assessment of crack expansion in the welds of the top plate and longitudinal rib joint details was achieved based on the composite Paris formula. Recommendations were given in assessing cracks in orthotropic anisotropic steel bridges to provide a reference for the operation and maintenance of actual bridges in service.
Digital fatigue test model for fatigue cracking
Interaction between FRANC3D and ABAQUS
FRANC3D (Fracture Analysis Code for 3D) is a crack analysis software developed by FAC Corporation, which can simulate and calculate the three-dimensional fatigue crack extension and fatigue life of engineering structures under complex geometry, loading conditions, and crack patterns. FRANC3D is based on the finite element method to calculate fracture mechanics parameters. Its interaction integral method can calculate three types of stress intensity factors (
The interaction between ABAQUS and FRANC3D is shown in Figure 1 to investigate fatigue crack growth in the rib-to-deck weld joints of orthotropic steel decks. Initially, a more accurate finite element model was established based on ABAQUS software. The model file was imported into FRANC3D, the area of interest was separated and the initial crack is introduced, a high-quality mesh was generated at the crack tip position, the model with the crack introduced and the overall model were merged, and the ABAQUS solver was called for stress analysis. After finishing the solution in ABAQUS, FRANC3D read the calculation result file (.odb file) and calculated the stress intensity factor of the crack tip based on the related theory of fracture mechanics, updated the initial crack and crack tip mesh by defining the fatigue crack expansion rate model and expansion step, and imported it into ABAQUS again for stress analysis solution, etc. repeatedly until the fatigue crack expanded to the critical crack size. The FRANC3D software predicted the fatigue crack life by recording the crack size and the number of stress cycles. Additionally, the software was capable of recording the crack cracking state at each extension step to simulate the actual crack path in the meantime. Schematic diagram of the interaction between FRANC3D and ABAQUS.
Multi-scale digital fatigue test model
In this paper, the OSD structure of the Yichang Yangtze River Highway Bridge serves as the research background, and the analytical model takes the box girder section between the two sets of suspenders. The standard cross section of the box girder is schematically depicted in Figure 2. Schematic diagram of a standard cross-section of steel box girder (cm).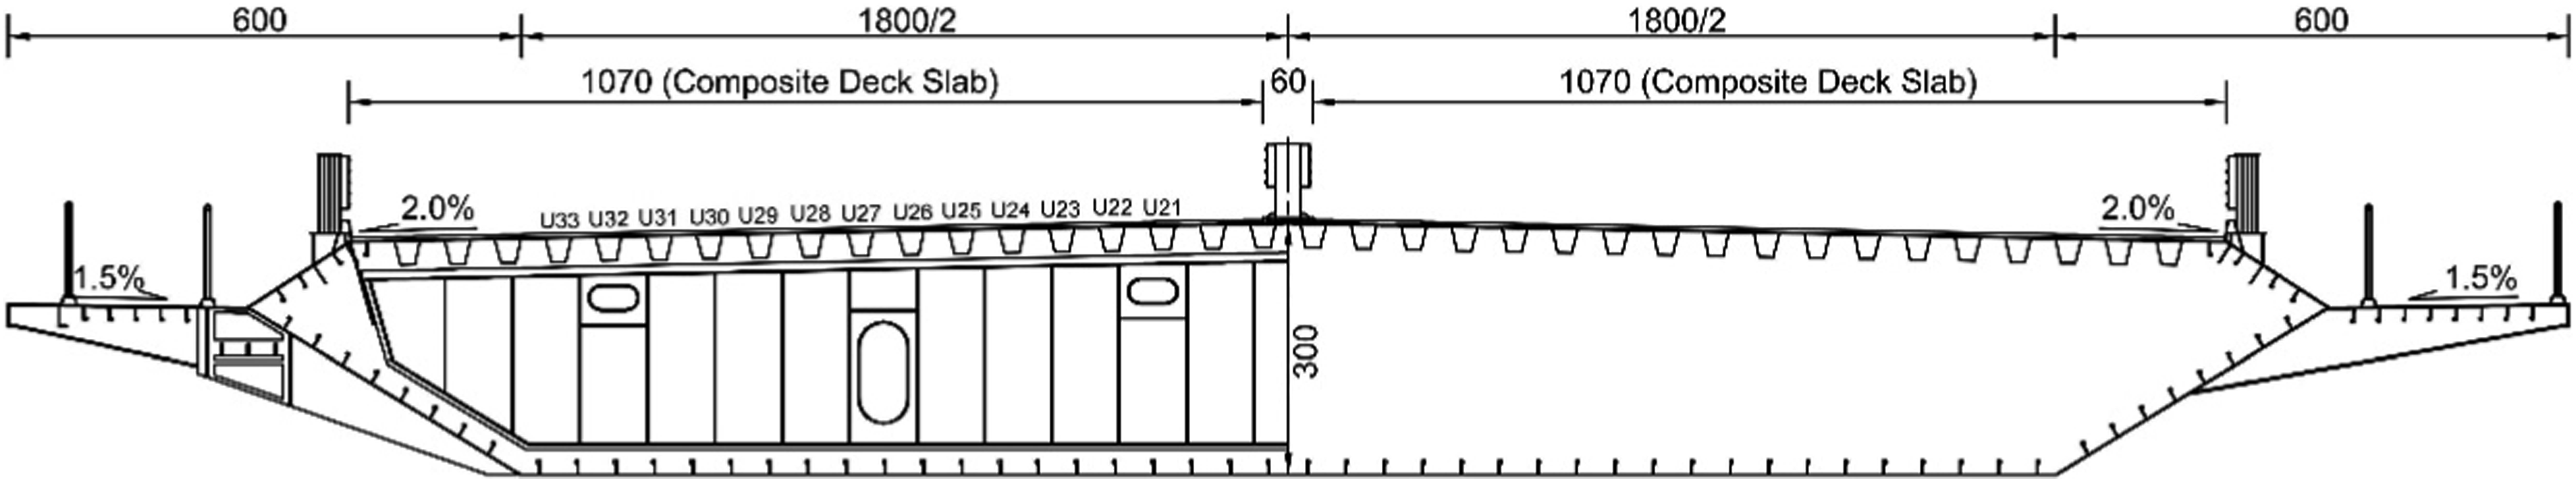
The primary construction consists of Q345 E, the top plate of the steel box girder is 12 mm thick, the center spacing between U-ribs is 590 mm, and the plate thickness is 6 mm. The top plates of the steel bridge panel are joined to the longitudinal ribs by welds with a penetration ratio of at least 80%, while the longitudinal ribs are connected to the diaphragms by double-sided fillet welds. Based on the joint simulation method of ABAQUS and FRANC3D, a multi-scale digital fatigue test model of OSD rib-to-deck weld joints was constructed, as shown in Figure 3, including three levels of models: box girder segmental plate and shell element model, rib-to-deck solid sub model and rib-to-deck fatigue details model with the initial crack body. For the finite element analysis model of steel box girder segment between two sets of booms, the 4-node curved shell element (S4R) was used to simulate the OSDs, transverse diaphragms and stiffening ribs. The U-rib was constrained by “tie” with the top plate and the transverse partition. The global size of the element was 100 mm, the element size of the transition section was 60 mm, and the mesh of the local analysis area was encrypted to 10 mm, totaling 1.599 million elements. The main body of the steel bridge was made of Q345qD material with an elastic modulus of 206 GPa, Poisson’s ratio of 0.3 and a density of 7850 kg/m³. The model boundary was set according to the complete consolidation of steel bridge panels and diaphragms in the direction of the bridge without any lateral displacement. The sub model of roof-longitudinal rib connection details of OSD took 200 mm along the longitudinal length of the bridge, 100 mm in the transverse direction, and 45 mm in height. The model is simulated using C3D20 R solid elements with the same material as the box girder section model (80% weld through and 1 mm mesh size). Based on FRANC3D software, a local 3D finite element model is intercepted in the rib-to-deck sub model as the rib-to-deck fatigue detail model, the model transverse width is 25 mm, the longitudinal bridge direction length is 60 mm, and the longitudinal rib height is 20 mm. 8 wedge-shaped elements with 15 nodes were generated at the crack front edge. Two layers of hexahedral element rings with 20 nodes were established around the crack front edge elements. The combination of wedge-shaped elements and hexahedral elements formed a “template” for the crack front. A tetrahedral element with 10 nodes were used in other areas. A pyramid shaped transition element with 13 nodes was used for the transition between hexahedral and tetrahedral elements. Multi-scale digital fatigue test model.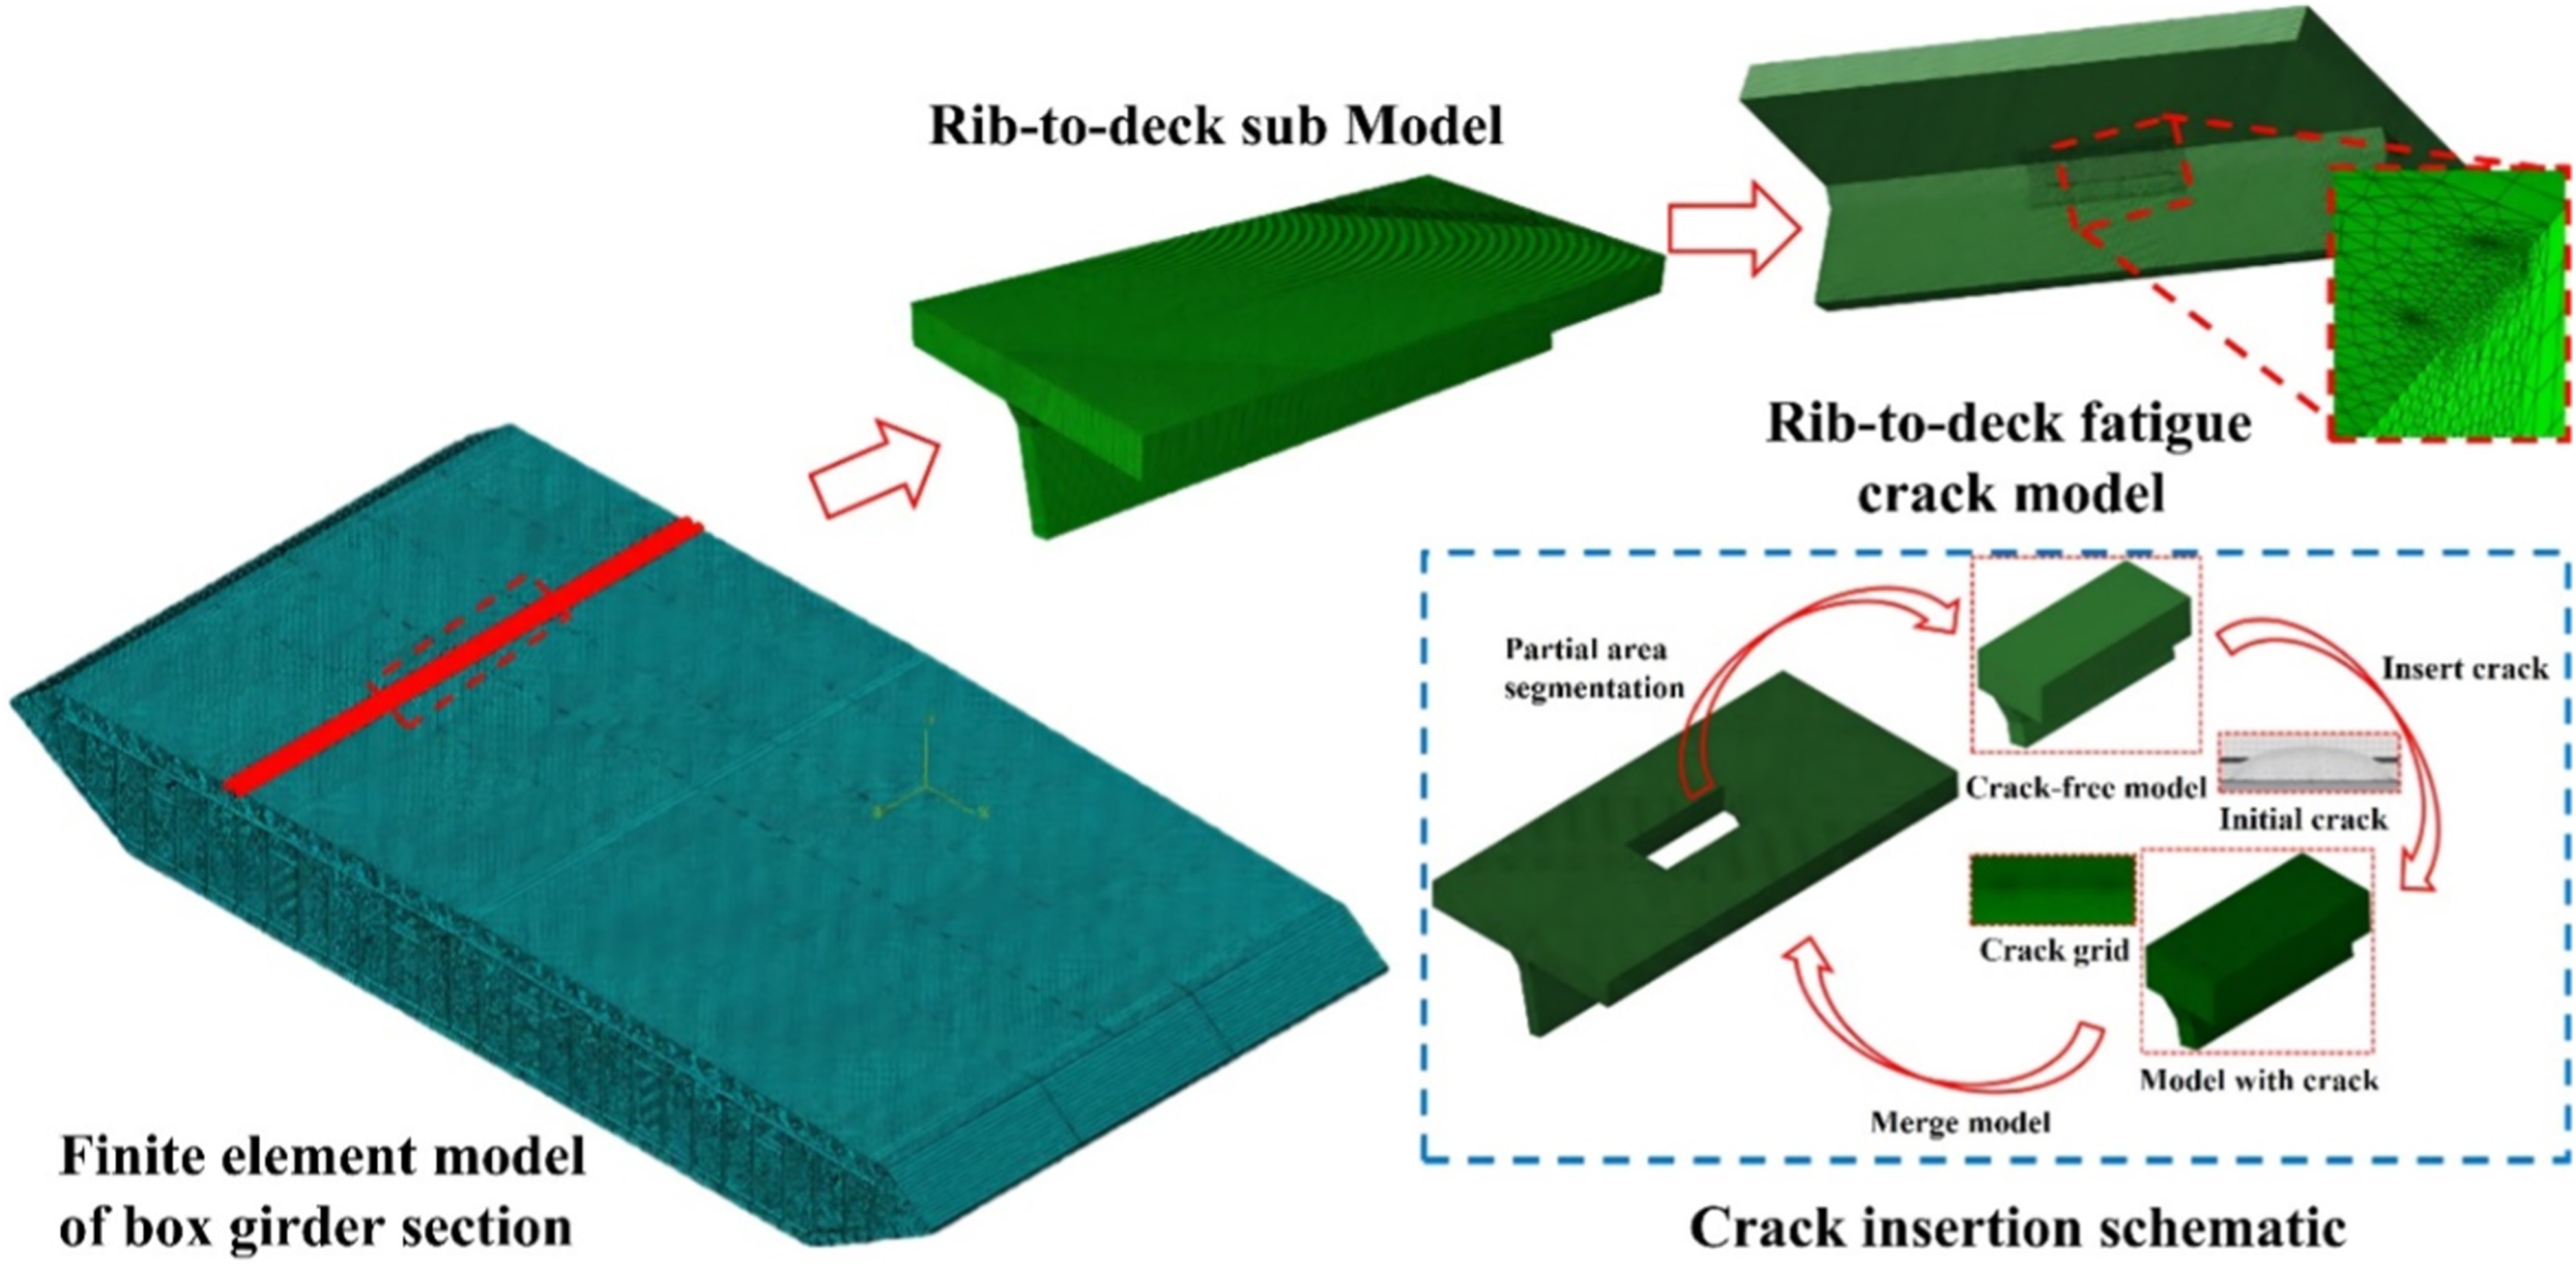
Loading conditions and cracking parameters setting
Fatigue crack concentration area
The cracks collected from the inspection at the Yichang Yangtze River Highway Bridge are mainly deck cracks, so this paper focuses on top plate cracks as the research object to implement the weld life assessment work. The distribution of fatigue cracks is plotted as shown in Figure 4. It can be found that the weld cracks in the rib-to-deck connections are mainly concentrated at the mid-span position of the box girder section between the two sets of booms, especially at the L/8 position of the box girder butt welds. The L/8 area is where the butt welds of the box girder sections are located. During construction, a section of the area was reserved for welding the rib-to-deck joints after the butt welds of the decks. In fact, during the welding of the rib-to-deck, the temperature in the welded area was much higher than the surrounding area. When the thermal stress exceeded the yield strength of the material, a plastic thermal compression was formed in the weld zone. After the material has cooled, the weld zone was relatively shorter, narrower, or smaller than the surrounding area. This area is subject to tensile residual stresses, and the surrounding area is subject to compressive residual stresses. For this reason, it is requisite to consider the effect of residual stress on fatigue in this region. Distribution of fatigue cracks detected (mm).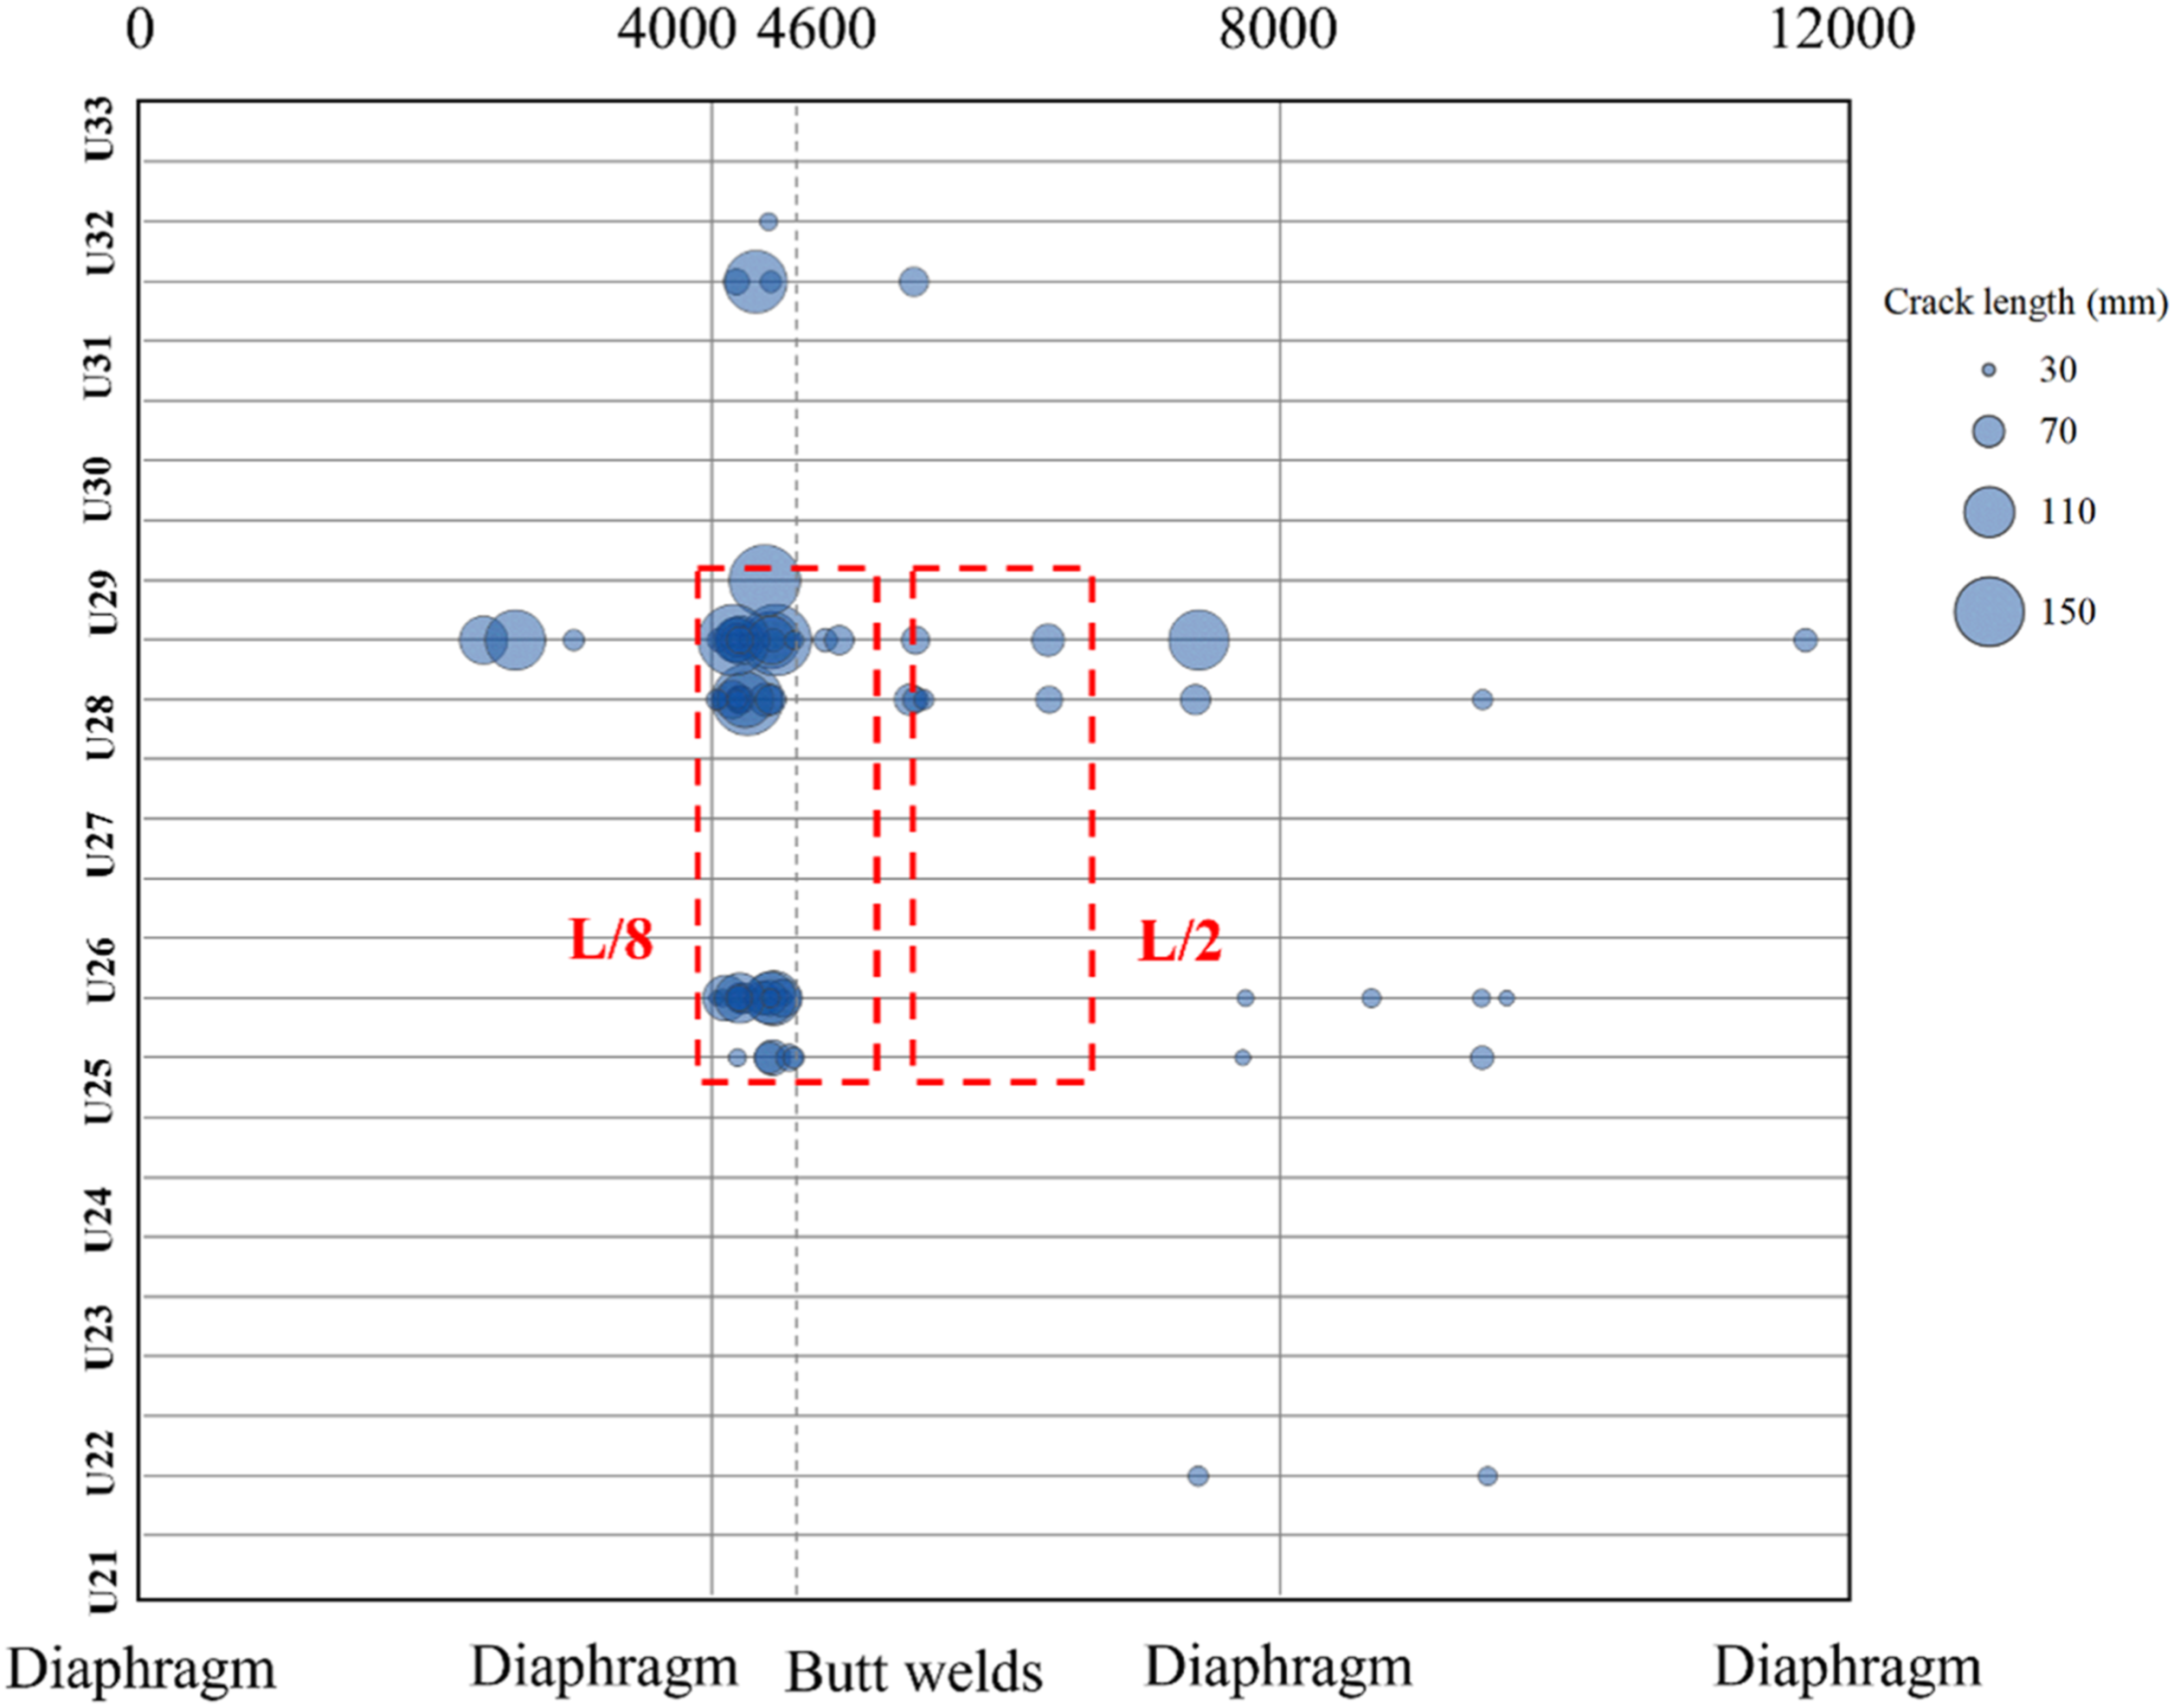
Loading conditions
The fatigue load calculation model III was defined as the loading vehicle for bridge deck system members in accordance with the relevant requirements of the Specification for the Design of Highway Steel Bridges (JTG D64-2015, 2015). The fatigue load calculation model is shown in Figure 5. Taking into account the diffusing effect of the bridge deck pavement, the actual area of action of a single wheel is 0.34 m × 0.74 m, which is attached to the top plate of the bridge deck as the pressure in the model. Fatigue-loaded model III (unit: m).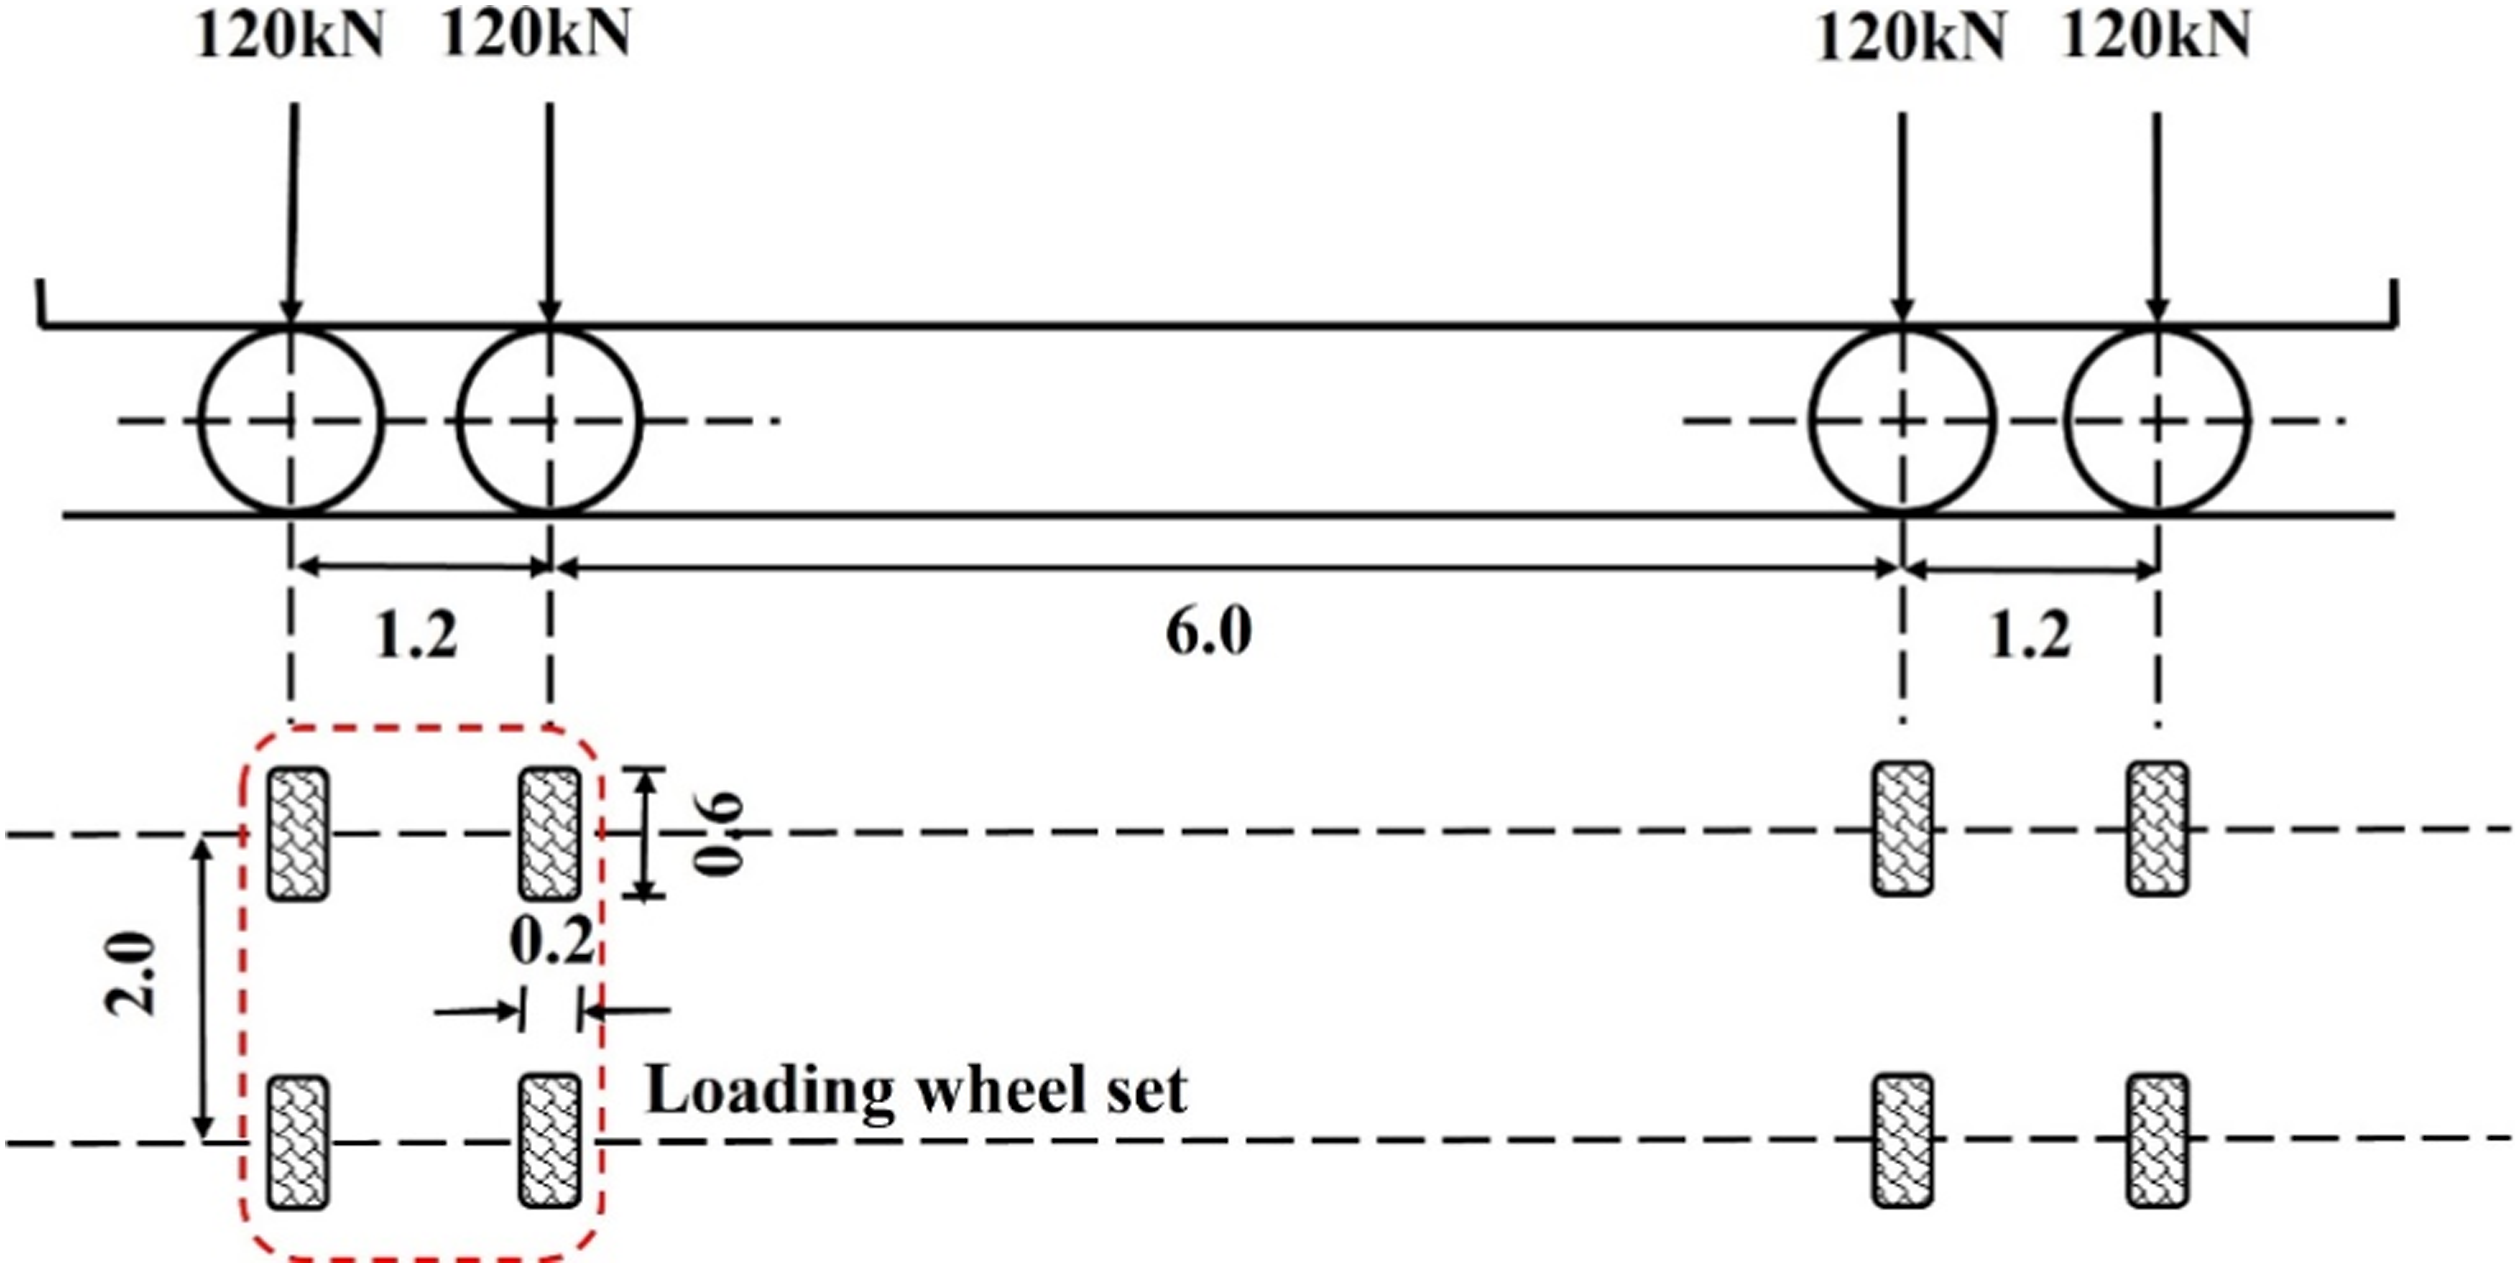
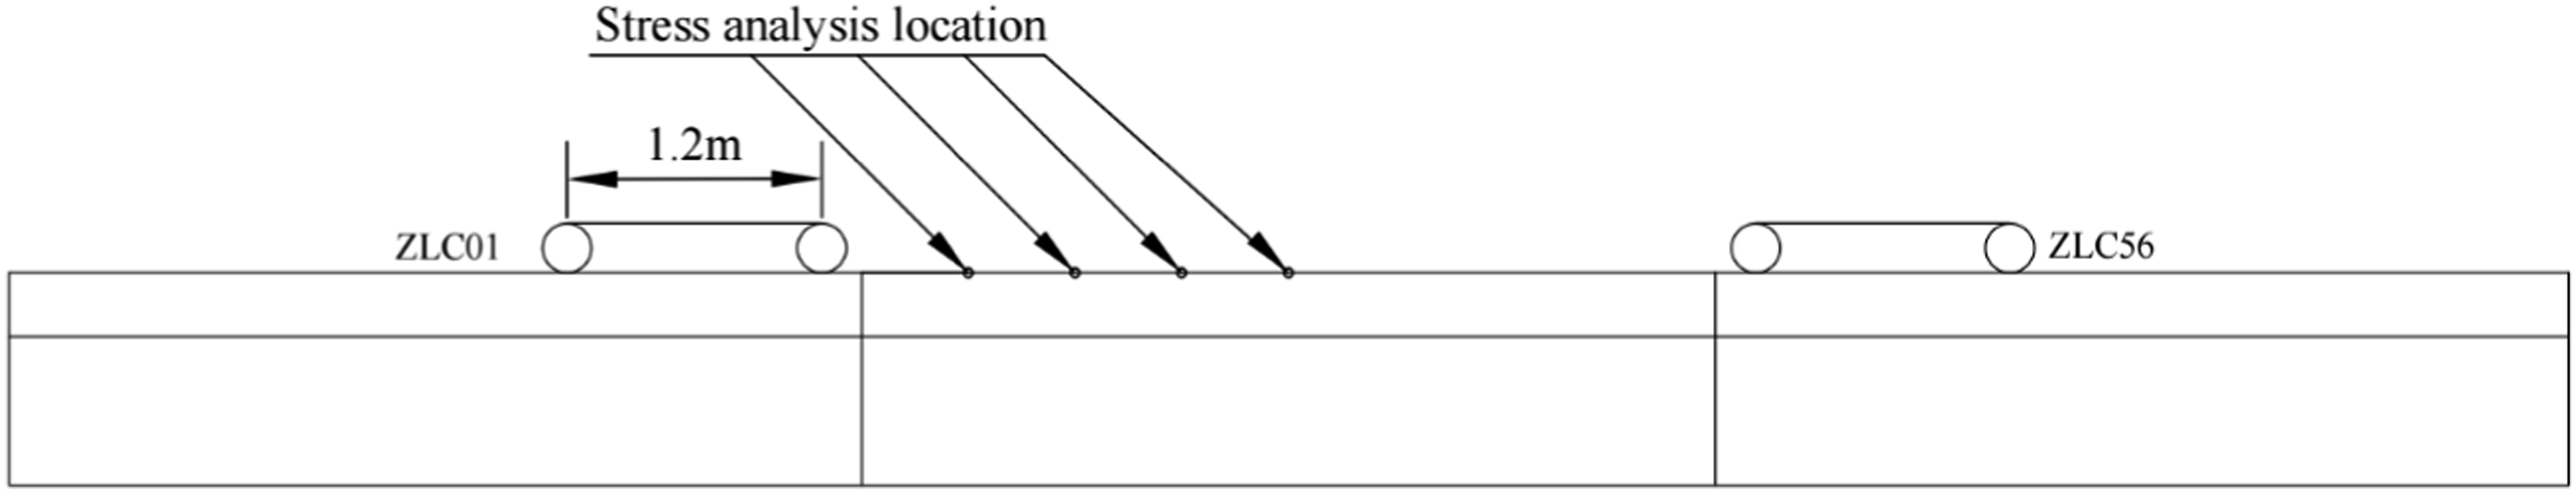
The minimum axle distance of the fatigue load calculation model III is 1.2 m and the maximum axle distance is 6m. Considering the partition effect of the diaphragms, at most two groups of axles are allowed to be located between two diaphragms at the same time under the same longitudinal working condition. In order to avoid the mutual influence of the interaction between two wheels on the same axle, this work adopted the loading method of the two groups of axles marked with dashed lines in Figure 5 to simplify the working condition setting. In ABAQUS finite element analysis software, the DLOAD subroutine prepared in the FORTRAN language was used to implement the loading of lane loads for different transverse and longitudinal operating conditions. The transverse working conditions were established as seen in Figure 6, where the centerline of the load action of the HLC01 working condition was located at the midline of the U-rib, and HLC02 and HLC03 are set at a transverse movement of 150 mm correspondingly. The longitudinal loading method was illustrated in Figure 7. Taking the middle line of the diaphragm as the origin, the central line of the axle of the fatigue vehicle was established every 100 mm from the origin position at −2.8 m to the origin position at 2.8 m, for a total of 56 loading conditions. The transverse stress extraction point in this article was located at a distance of 1.0 t from the weld toe position (node A) and a distance of 1.0 t from the weld root position (node B). In the longitudinal direction, stress extraction was performed at L/8, L/4, 3 L/8, and L/2 (L is the spacing between diaphragms) in the middle section of the steel box girder according to the crack detection results of the rib-to-deck weld joints in the actual site, combined with symmetry, as shown in Figure 7. Lateral loading conditions (unit: mm). Longitudinal loading condition.
Initial crack depth
For fatigue crack extension analysis, the initial crack selection is crucial. The shape and size of the crack are irregular. Typically, during the analysis of online elastic fracture mechanics, an elliptical or semi-elliptical surface is generally chosen to simulate the initial crack. Therefore, crack depth
Determination of the most unfavorable lateral loading conditions
Considering that the fatigue cracking of the OSD rib-to-deck weld joints is mainly affected by the stress component perpendicular to the cracking direction, this paper focuses on the cross-bridge stress as a crucial object of concern for relevant research.
The Yichang Yangtze River Highway Bridge cable-stayed suspenders distribution is shown in Figure 8. The length of the standard segment of the box girder between the suspenders is 12.056 m, the thickness of the diaphragm is 12 mm, and the location of the diaphragm is 4.6 m from the box girder’s butt welds. During the site inspection, it was found that most of the cracks in the OSD rib-to-deck weld joint were located in the four U-rib locations of U25, U26, U28, and U29. For the crack region of the rib-to-decks to be studied, the structures are similar, and there are no distinct differences. Therefore, this paper analyzed U-rib No. 29 as a representative area, and the rest of the defects were diagnosed and treated by the defects there. Cable-stayed suspender distribution (unit: mm).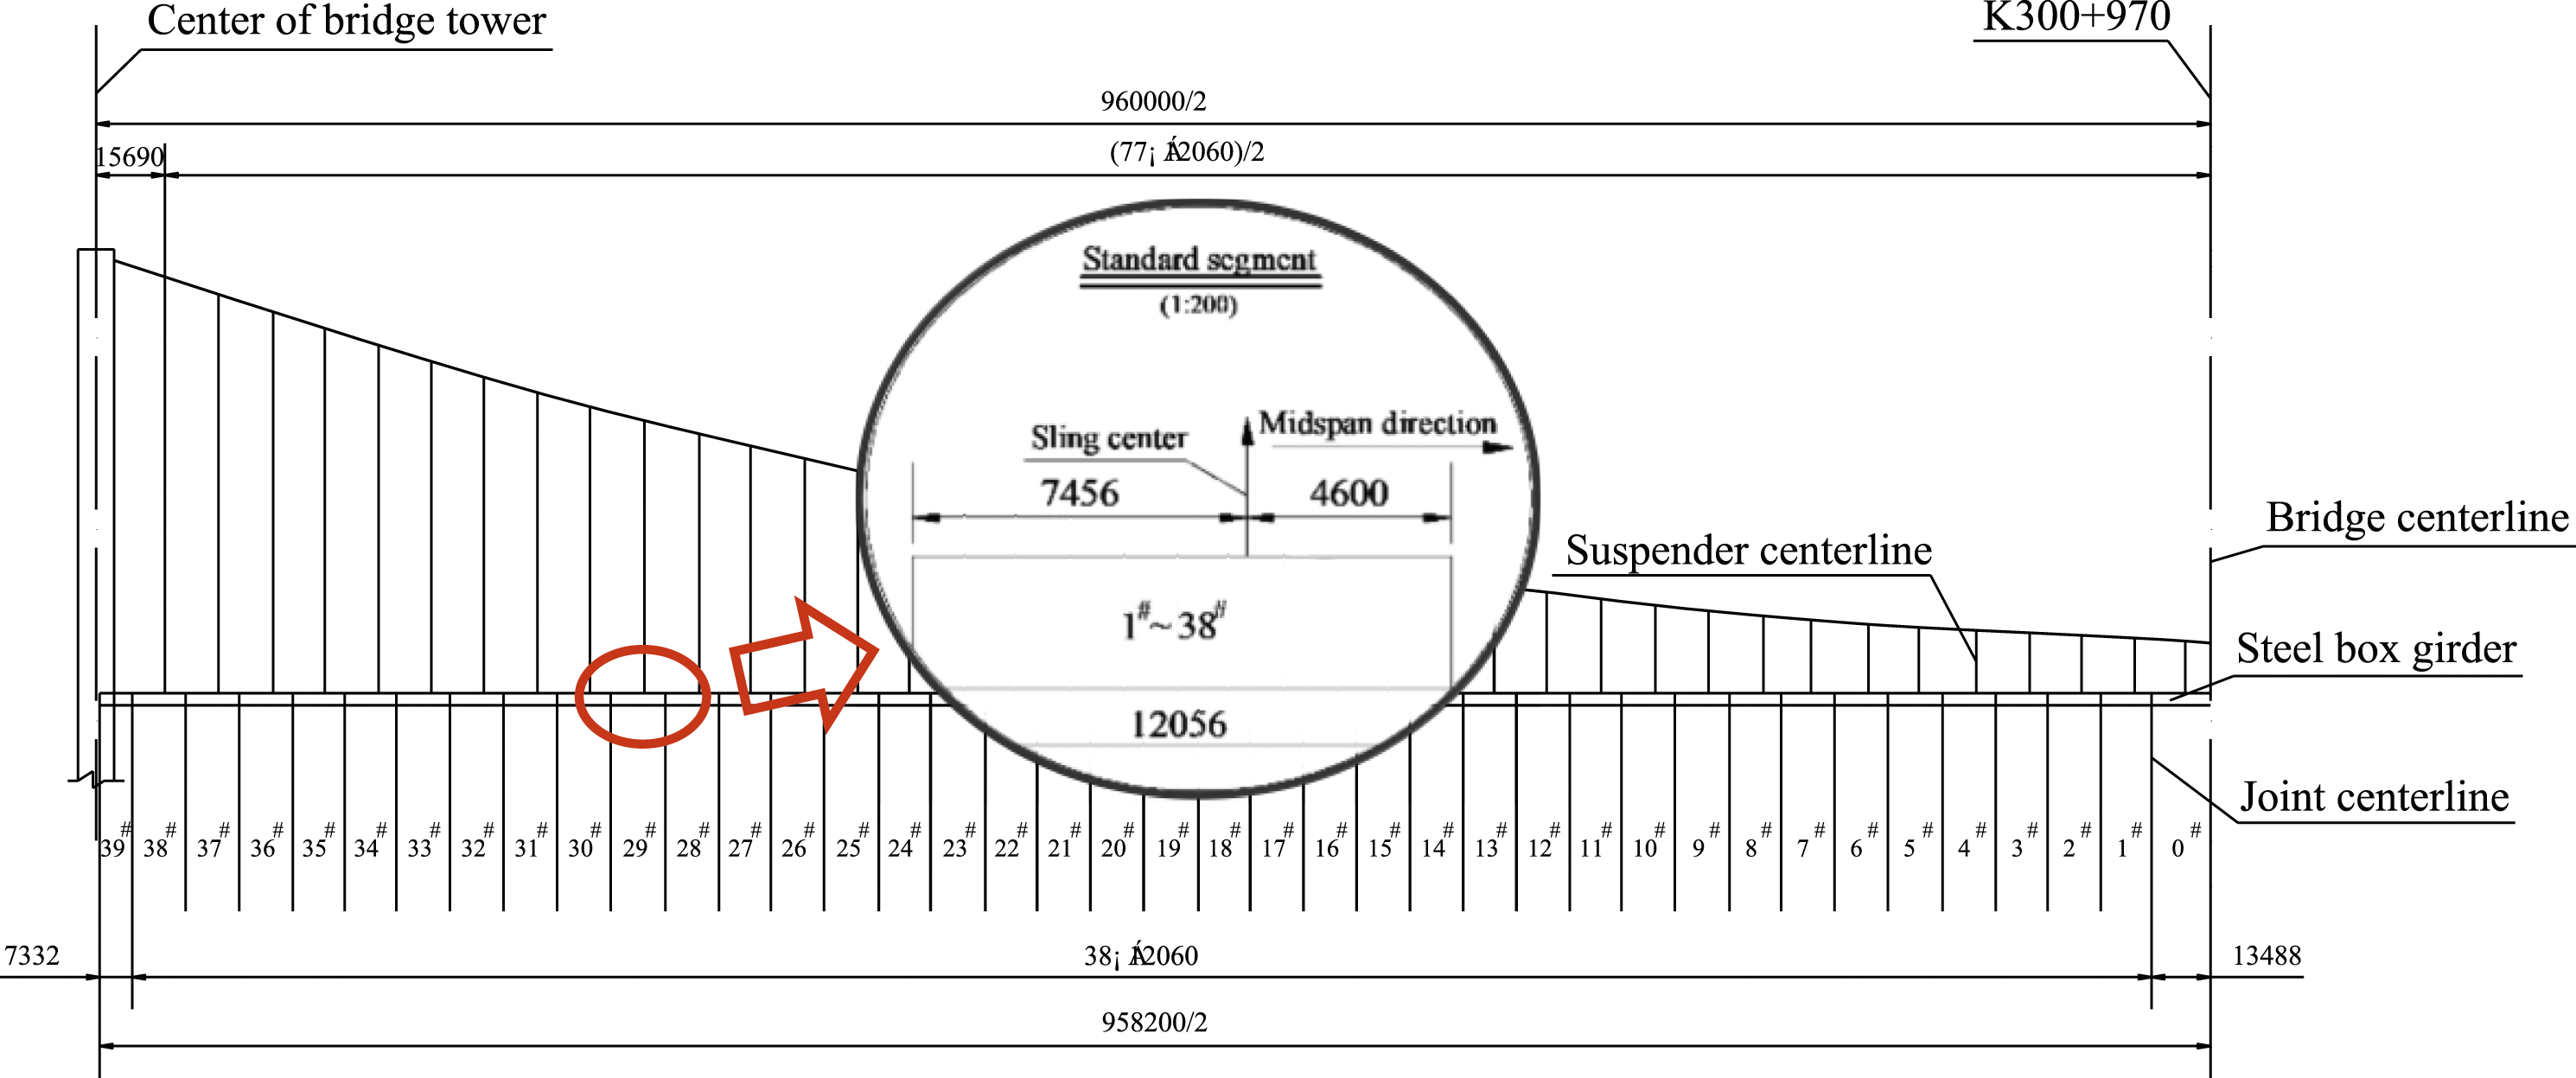
Extract the transverse stress of weld toe at node A and weld root at node B. The variation of transverse stresses at the attention points of the welds of the rib-to-deck joints under each working condition is shown in Figure 9. Transverse stress distribution under each condition: (a) under. HLC01 condition, (b) under HLC02 condition and (c) under HLC03 condition.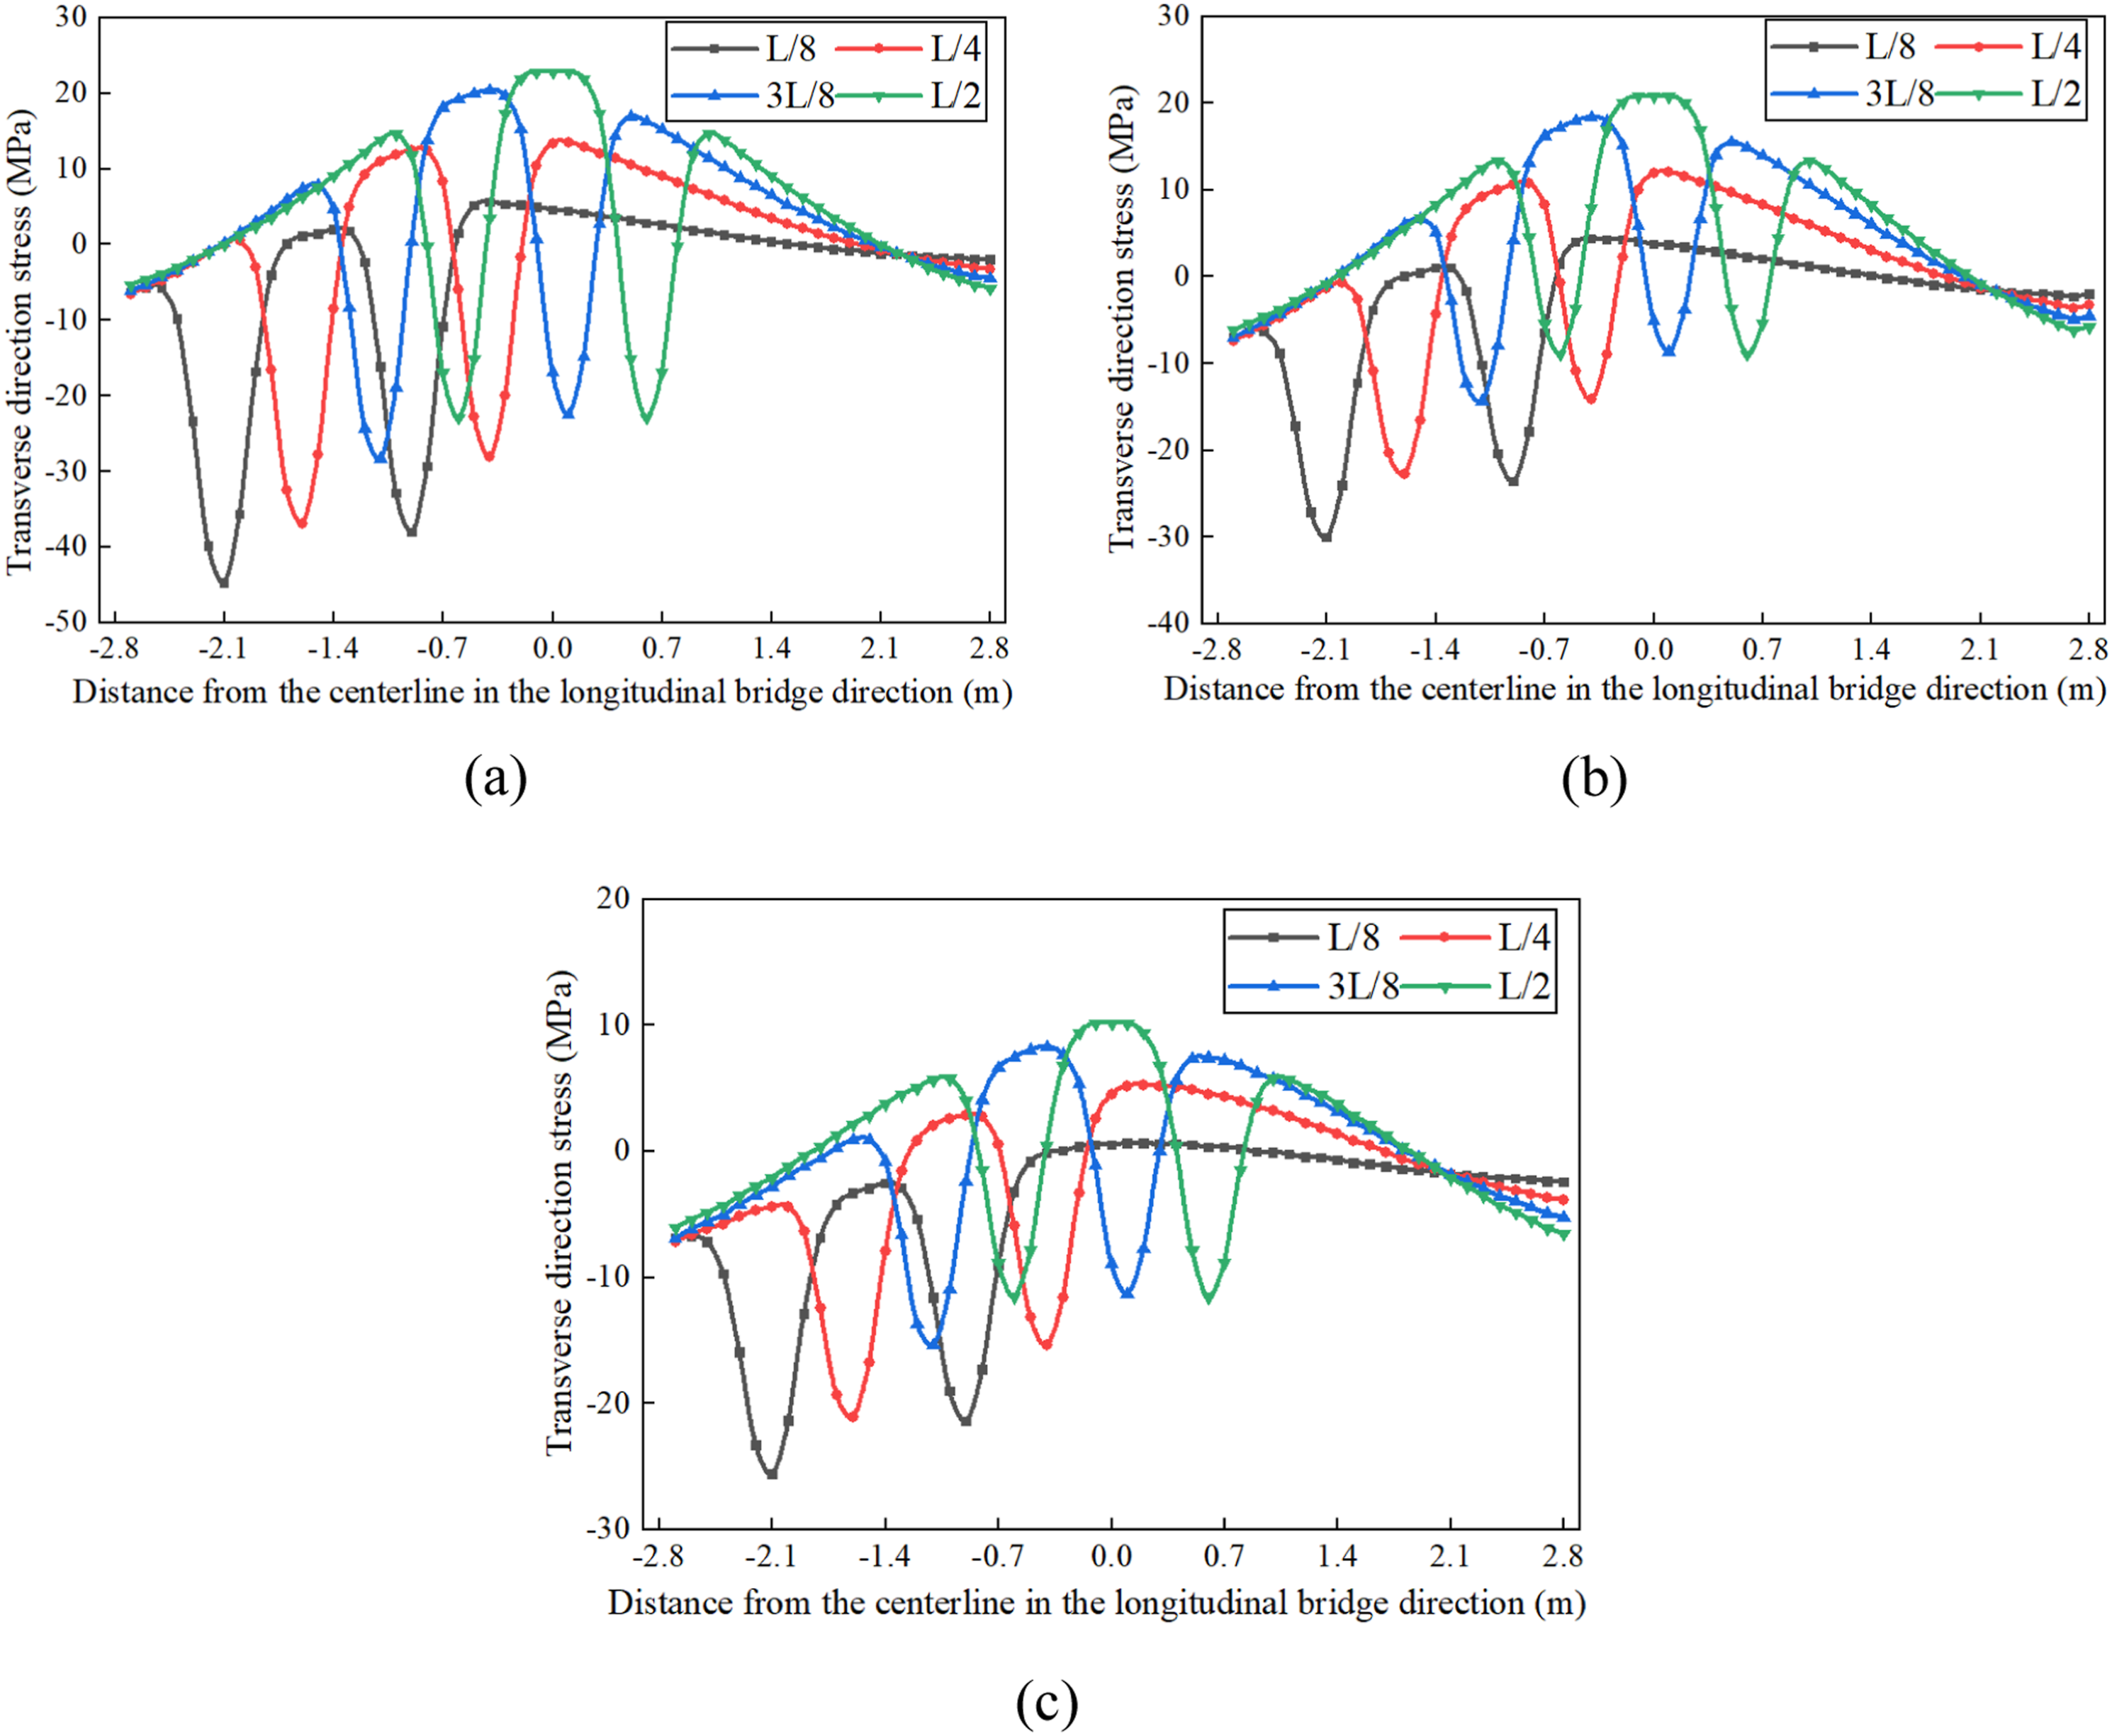
As seen in Figure 9, it can be found that under the vehicle load, the stress pattern in the weld area of the rib-to-deck joints was a tensile-compressive stress cycle pattern dominated by compressive stress. When the wheel acts directly on the stress extraction point, the node was subjected to compressive stress. As the wheel gradually moved away from the point, the compressive stress decreased, and tensile stress appeared. The tensile stress reached its maximum value when the extraction point was located precisely at the center of the two sets of wheels. The smallest amplitude of tensile stress and the largest amplitude of compressive stress in the transverse stress influence line of the node at L/8 were primarily due to the proximity of this location to the diaphragm and the diaphragm’s vertical constraint, resulting in sizeable compressive stress in this region. When moving away from the diaphragm, the compressive stress at each node progressively diminished and the tensile stress gradually increased, reaching a maximum at L/2 tensile stress amplitude. Under the fatigue vehicle loading condition, considering the effect of transverse tensile stress on the expansion of fatigue cracks, it can be found that the L/2 position was the most unfavorable section position. In addition, among the three transverse loading methods, the maximum tensile stress at each observation point under the HLC01 loading method was significantly higher than the remaining two groups of transverse loading methods, indicating that for the rib-to-deck weld joints, HLC01 was the most unfavorable loading method in its transverse direction, and the subsequent life assessment analysis would be conducted with the HLC01 transverse working condition.
Structural fatigue life assessment
Analysis of stress intensity factor
Distribution of stress intensity factors at the crack front
Under fatigue loading, the crack front stress intensity factor distribution of the 1 mm surface cracks in the weld toe and root of L/2 at the worst longitudinal operating condition of HLC01 is depicted in Figure 10. In Figure 10, the numerical range of normalized length is generally between 0 and 1, where 0 represents the minimum length and 1 represents the maximum length. Through this standardization process, different crack lengths can be transformed into a unified numerical range, facilitating comparison and analysis. Type I crack referred to the crack formed by tensile stress perpendicular to the crack surface. It can be found that the fatigue crack of the rib-to-deck weld joint was a composite type I-II-III crack dominated by type I crack under vehicle loading for a crack with a depth of 1 mm. Which is found in the weld root position, Stress intensity factor distribution of surface semi-elliptical crack fronts at: (a) weld toe and (b) weld root.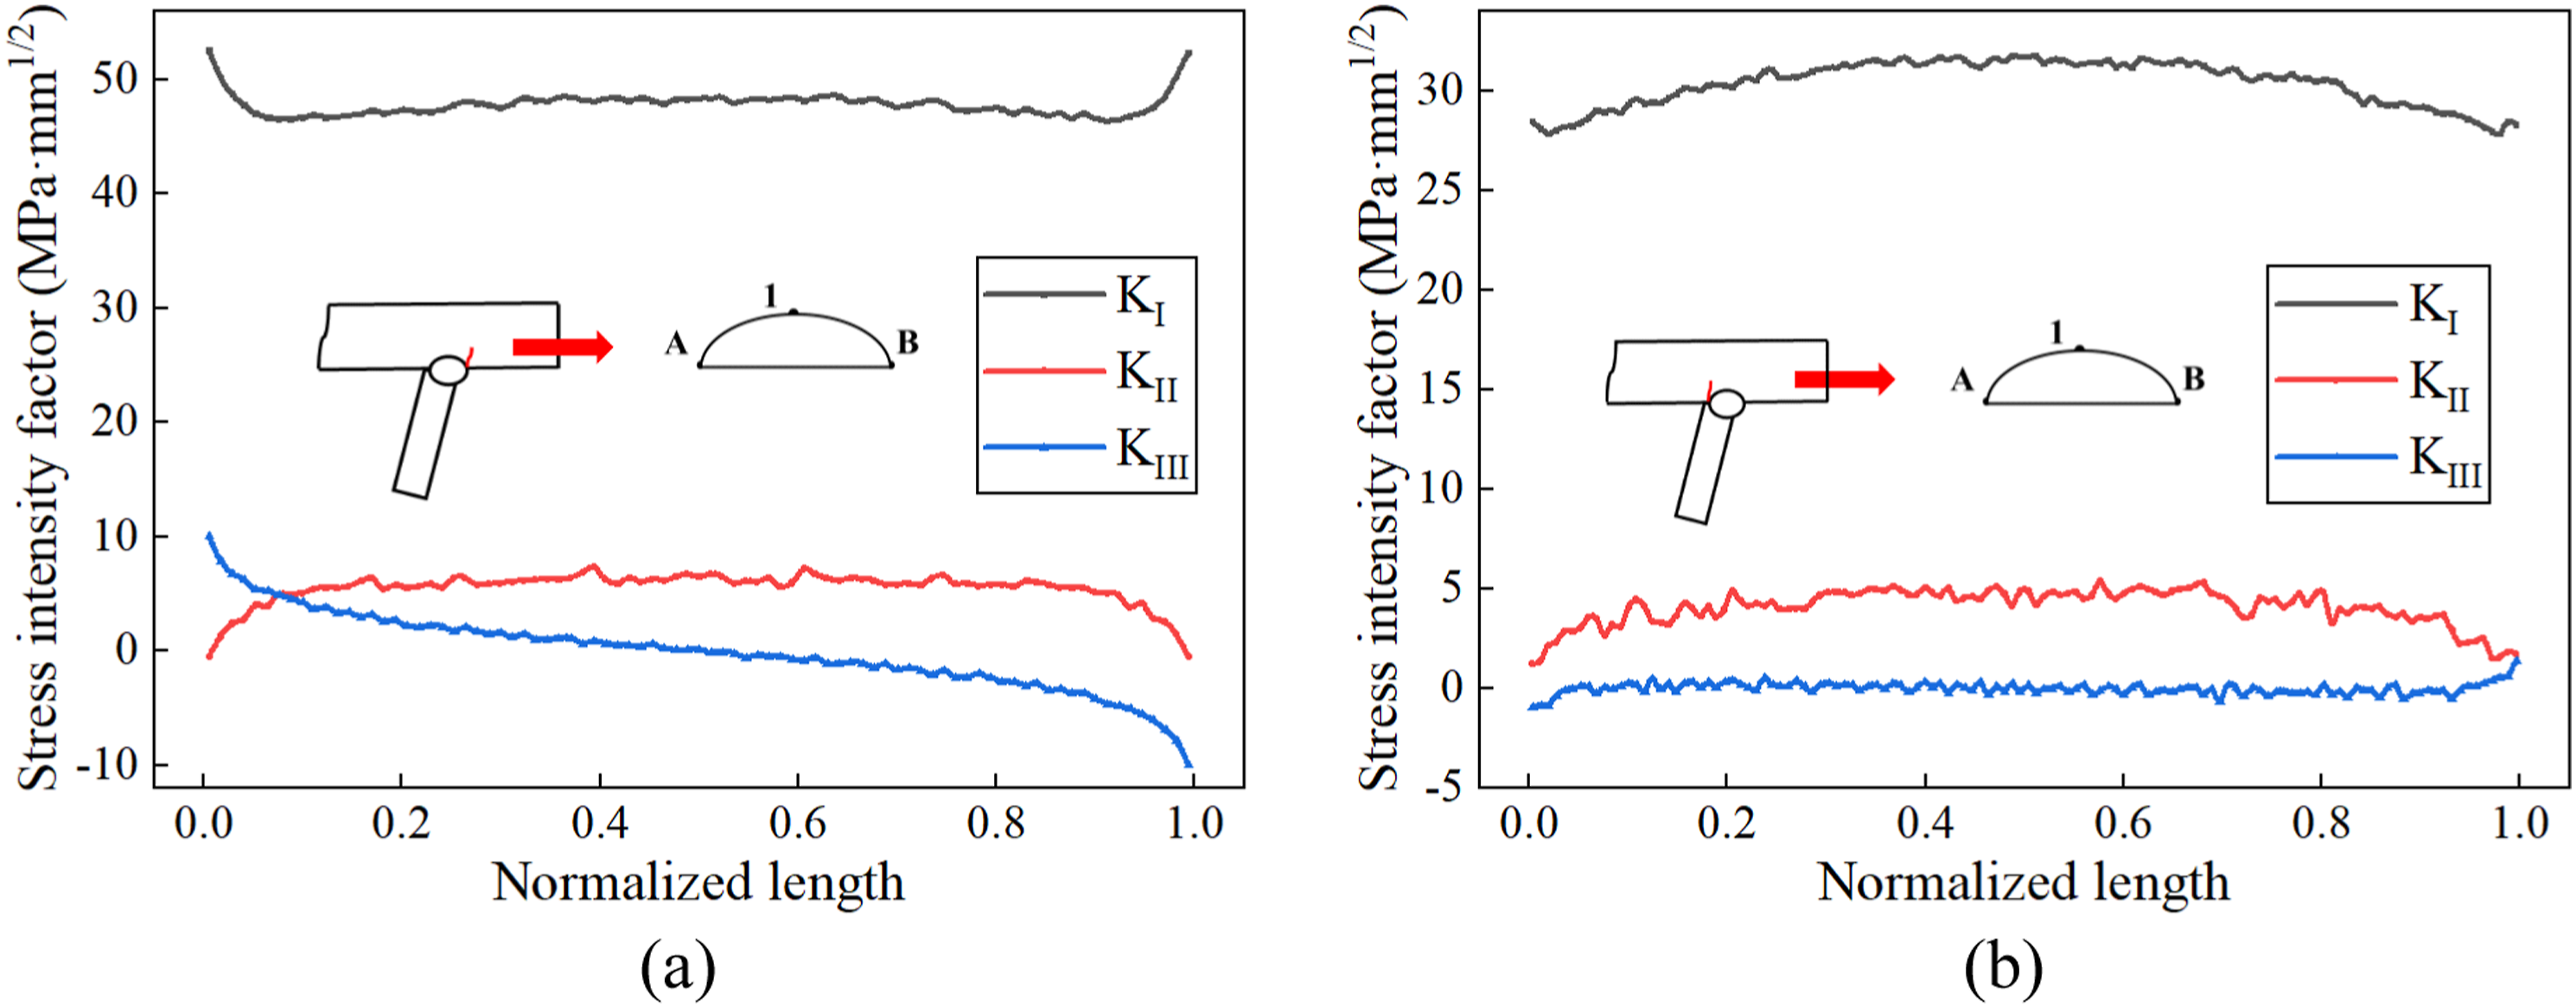
Furthermore, the stress intensity factor of type I crack at the weld toe was much bigger than that at the weld root, indicating that the failure mode of such joint was primarily determined by the fatigue crack at the weld toe, which was consistent with the conclusion obtained by Ya et al. (2011).
Crack tip stress intensity factor influence line
The initial cracks of 1 mm, 2 mm, 3 mm, and 4 mm were introduced at the root and toe of the rib-to-deck weld joints in the L/2 area, and the stress intensity factor at the crack front varies with the longitudinal working condition as shown in Figure 11(a) and (b). It can be found that the variation trend of the influence line of Time variation curve of stress intensity factor 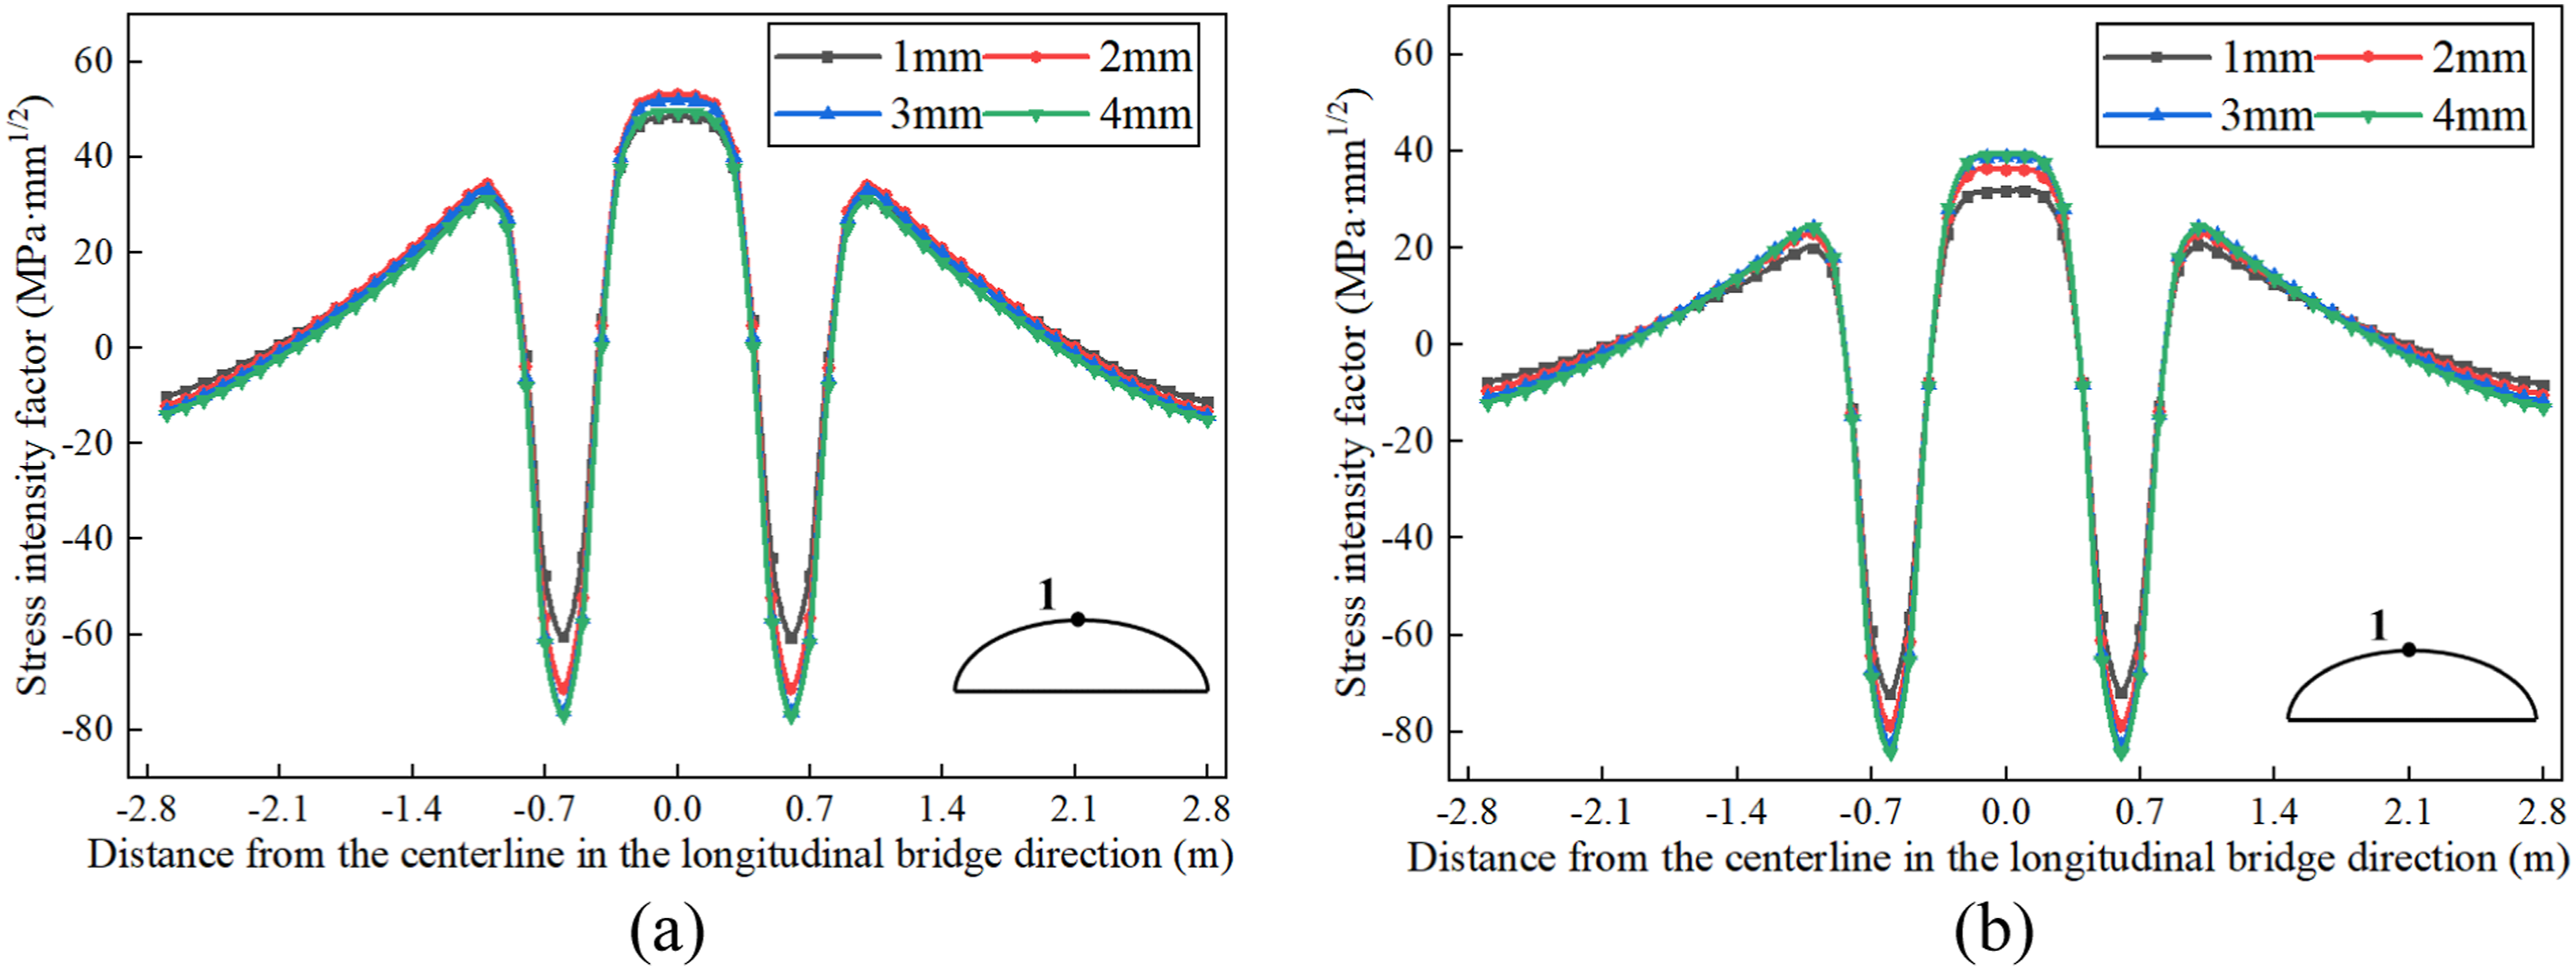
According to Figure 11(a), the initial crack depth exerted a considerable impact, reflected mainly by the maximum and lowest. With an increase in the size of the original fracture, the maximum value of
Effect of welding residual stress on stress intensity factor
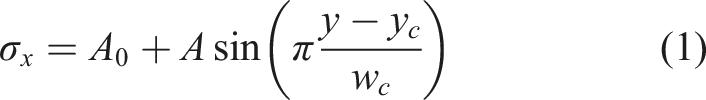
The longitudinal residual stresses distribution of the roof mainly manifested as tensile stresses near the weld seam and residual compressive stresses far away from the weld seam (Cui et al., 2018c; Zhao and Wu, 2012a, 2012b). There is also a certain variation trend of residual stress along the thickness direction of the roof, and the distribution pattern of lateral residual stress is shown as follows:
Parameters of lateral residual stress formula.
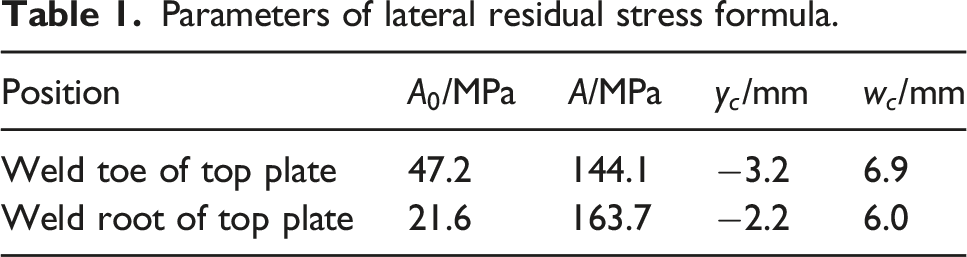
Based on the above formula and corresponding parameters, draw the distribution patterns of residual stress along the thickness of the top plate at the weld toe and root positions, as shown in Figure 12. We could find that the residual stress changed at the same location are similar. The residual stress gradually decreased and then increased along the thickness of the top plate. The actual manifestation was that the upper and lower surfaces of the top plate shown a tensile trend, and there was a certain compression zone in the middle area. Comparing the transverse residual stress distribution of the weld root and weld toe, it can be found that the difference in maximum transverse residual tensile stress was not significant. Transverse residual stress distribution along the thickness of top plate.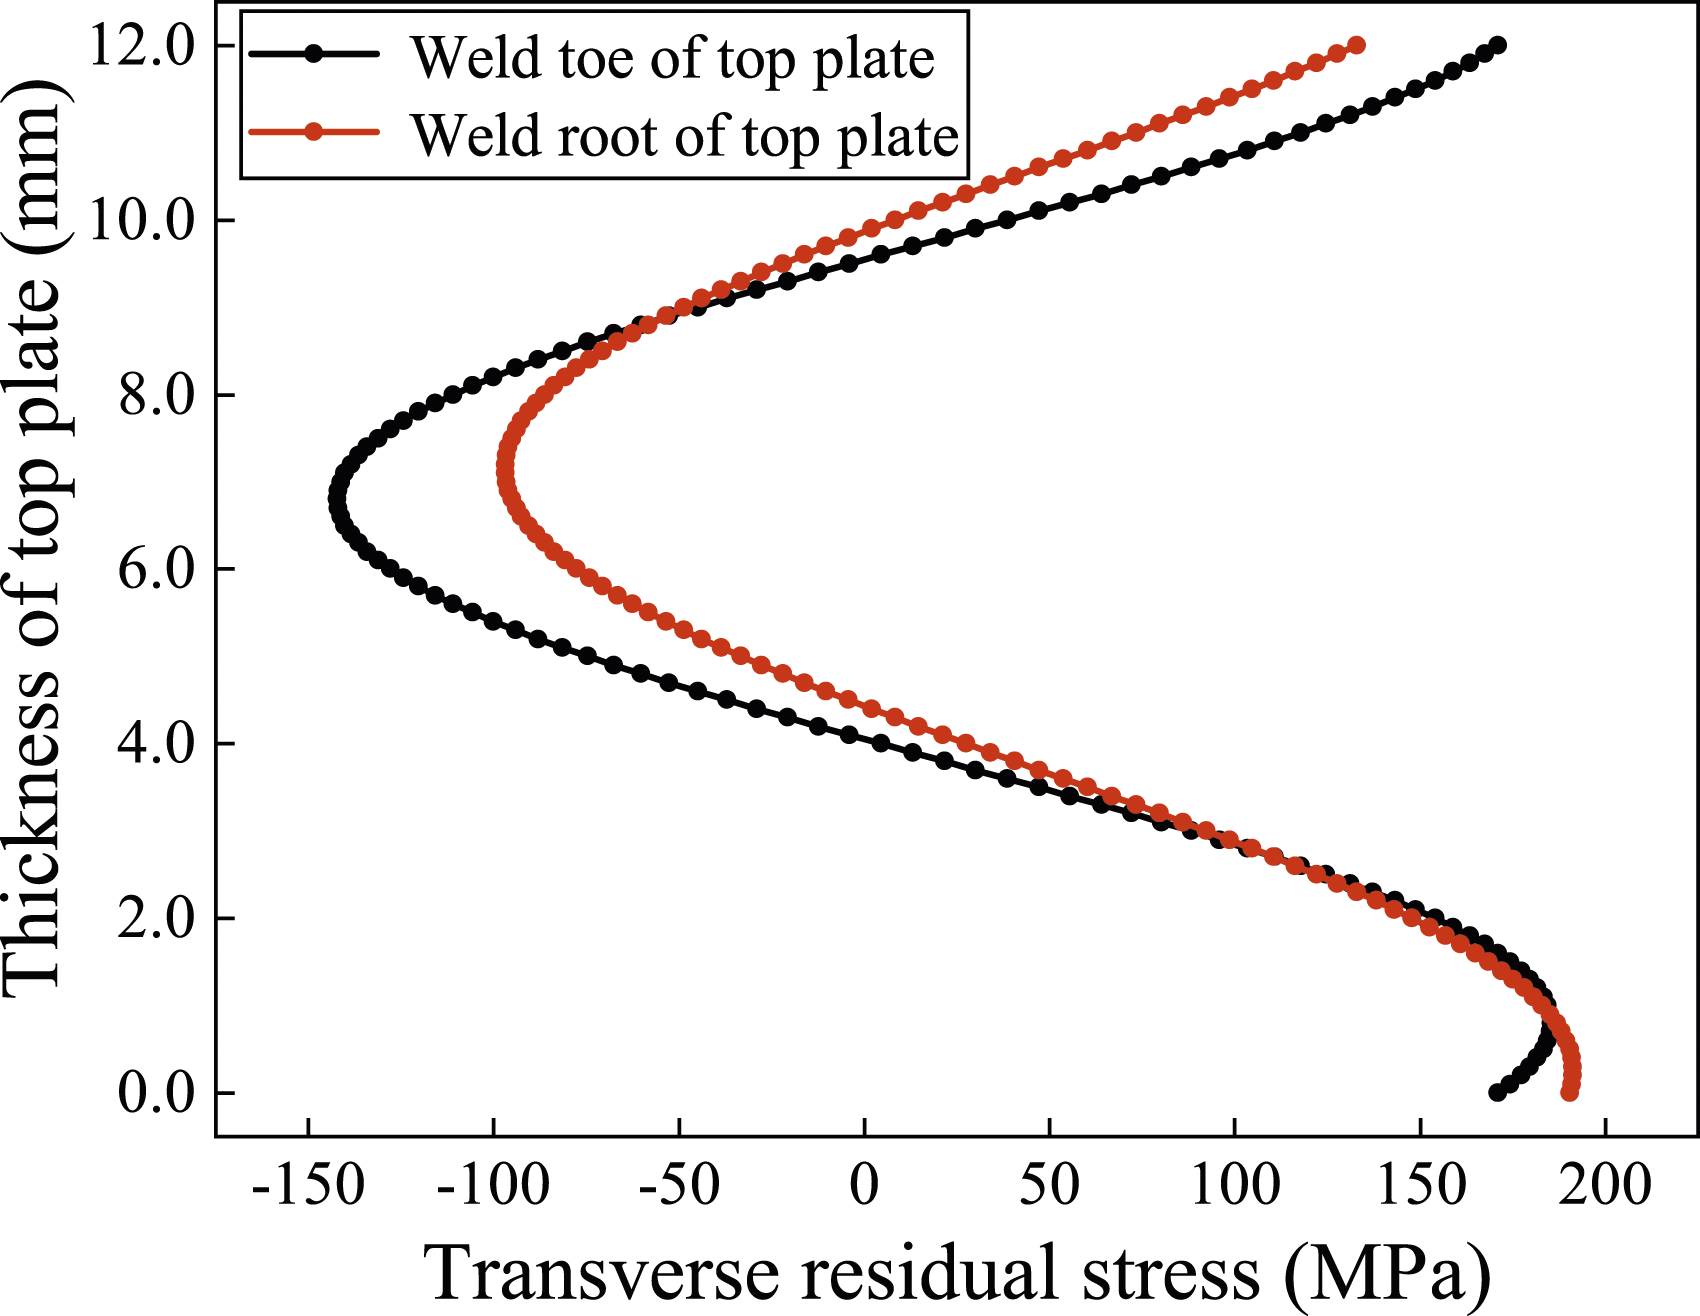
In order to effectively reflect the effect of residual stress on the stress intensity factor at the initial crack tip of the roof-longitudinal rib connection, based on linear elastic fracture mechanics, the stress intensity factor calculated by the residual stress at the crack front and the stress intensity factor generated by external load were linearly superimposed to analyze the effect of residual stress on the stress intensity factor (Glinka G, 1979). The bottom surface of the top plate was used as the reference surface for lateral residual stress loading. The lateral residual stress shown in equation (1) and Figure 4 was applied along the thickness direction to construct a residual stress field. Taking the weld toe position in L/2 region as an example, the initial crack of 1 mm was introduced and the stress intensity factor Stress intensity factor 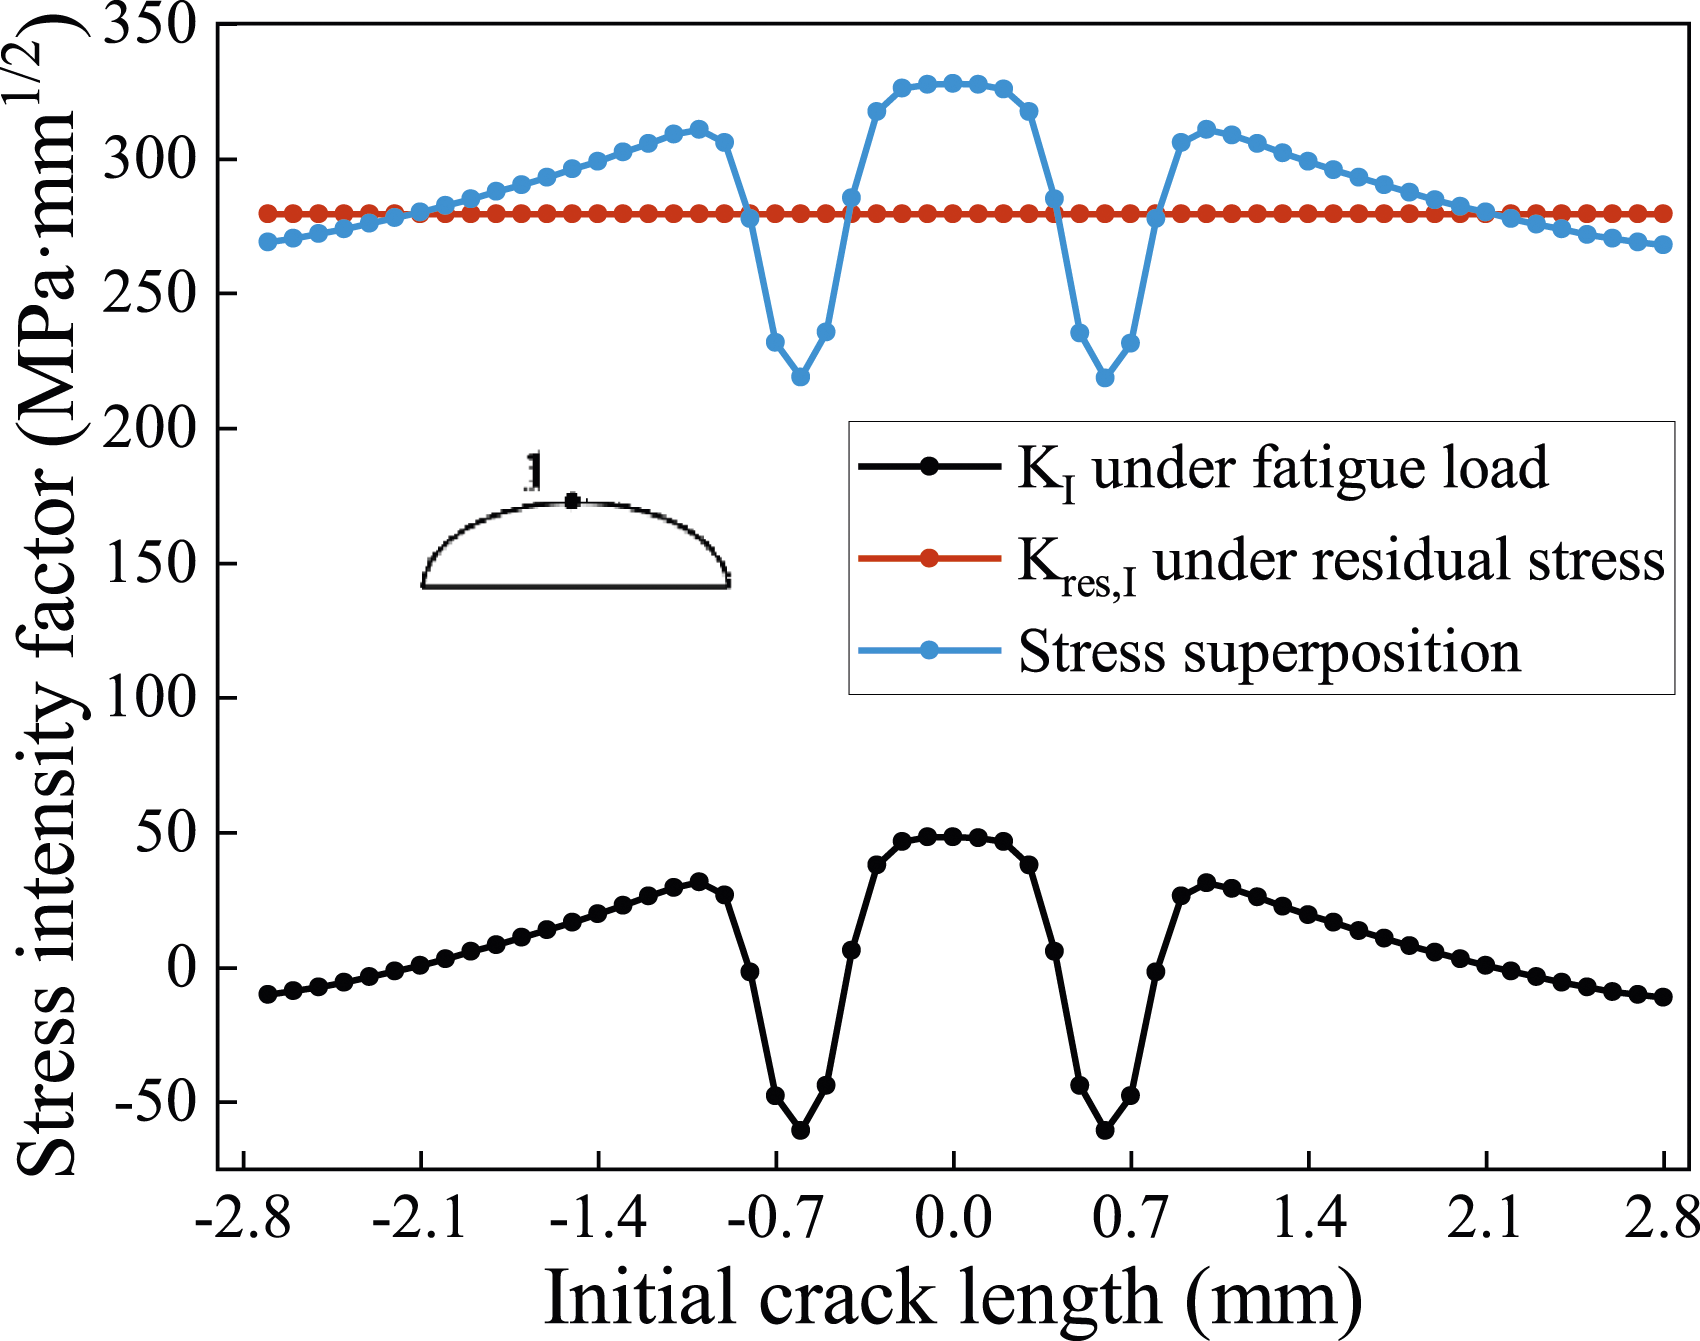
Digital fatigue test of OSD rib-to-deck joints
Based on the analysis of stress intensity factors at the crack front and crack tip, the most unfavorable loading conditions under multi field coupling were determined. Taking the fatigue load calculation model III as the loading vehicle for bridge deck, the digital fatigue tests on three typical fatigue crack propagation behaviors of the OSD rib-to-deck joints were conducted. The expansion pattern of OSD rib-to-deck weld joints belonged to the typical type I, II, and III composite crack. The fatigue crack expansion pattern was simulated referring to the British Standard (BS 7910, 2019). Hence the equivalent strength factor amplitude 
According to the Paris equation, the compound crack expansion rate model equation is given in the equation (3).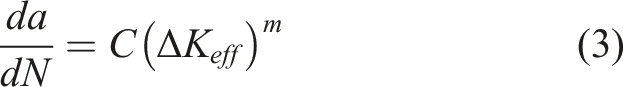
After considering the threshold of the stress intensity factor 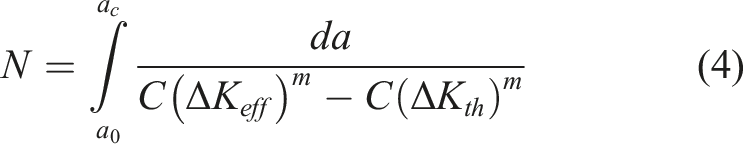
The critical crack length is generally determined by the K-criterion of fracture mechanics in practical engineering applications. Still, the uncertainty of the actual test leads to certain randomness the
Parameter setting of the crack extension model.

Fatigue crack life assessment
The OSD rib-to-deck weld joints belong to the typical fatigue problem under the tensile-compression cycle mode dominated by compression. For the calculation of the stress intensity factor amplitude (1) Consider only the tensile stress as the driving force of fatigue crack, i.e. (2) Referring to the provisions of the steel bridge code, for the elimination of residual stresses in the welded members, (3) For the case containing residual stresses, the residual stresses change the force pattern of the rib-to-deck weld joints, while the effect on the stress intensity factor amplitude can be neglected. In the calculation of
The calculated equivalent force strength factors are shown in Figure 14 for different initial crack sizes using the three equivalent force amplitude calculation methods mentioned above. Considering only the tensile stresses under the action of the fatigue loading vehicle as the calculated equivalent force strength factor amplitude is smaller than Equivalent stress intensity factor calculation at: (a) 1/8L and (b) 1/2L.
In 2019, the overall number of trucks crossing the bridge was 3,520,333, according to figures from the toll center. There were 1,998,291 vehicles with gross vehicle weight (GVW) under 20t and 1,522,042 trucks with GVW over 20t. Referring to the British Highway Code (BS 5400-10, 1980), the vehicle allocation ratio for the fast and slow lanes is 2:3, and the yearly average traffic volume of the slow lanes is 1,056,100 cars.
The remaining fatigue life for different initial cracks is shown in Figure 15. From both figures, it can be found that the remaining fatigue life of the structure showed a decreasing trend with the increase of the initial crack, and its drawdown rate gradually decreased. Regardless of the stress amplitude calculation mode, the remaining fatigue life at the weld toe was lower than that at the weld root location in the same cross-section of the rib-to-deck fatigue detail with the same crack depth, which also indicated that the fatigue failure mode of the rib-to-deck joint detail was mainly determined by the crack at the weld toe location. Residual fatigue life under different initial cracks at various stress amplitudes at: (a) 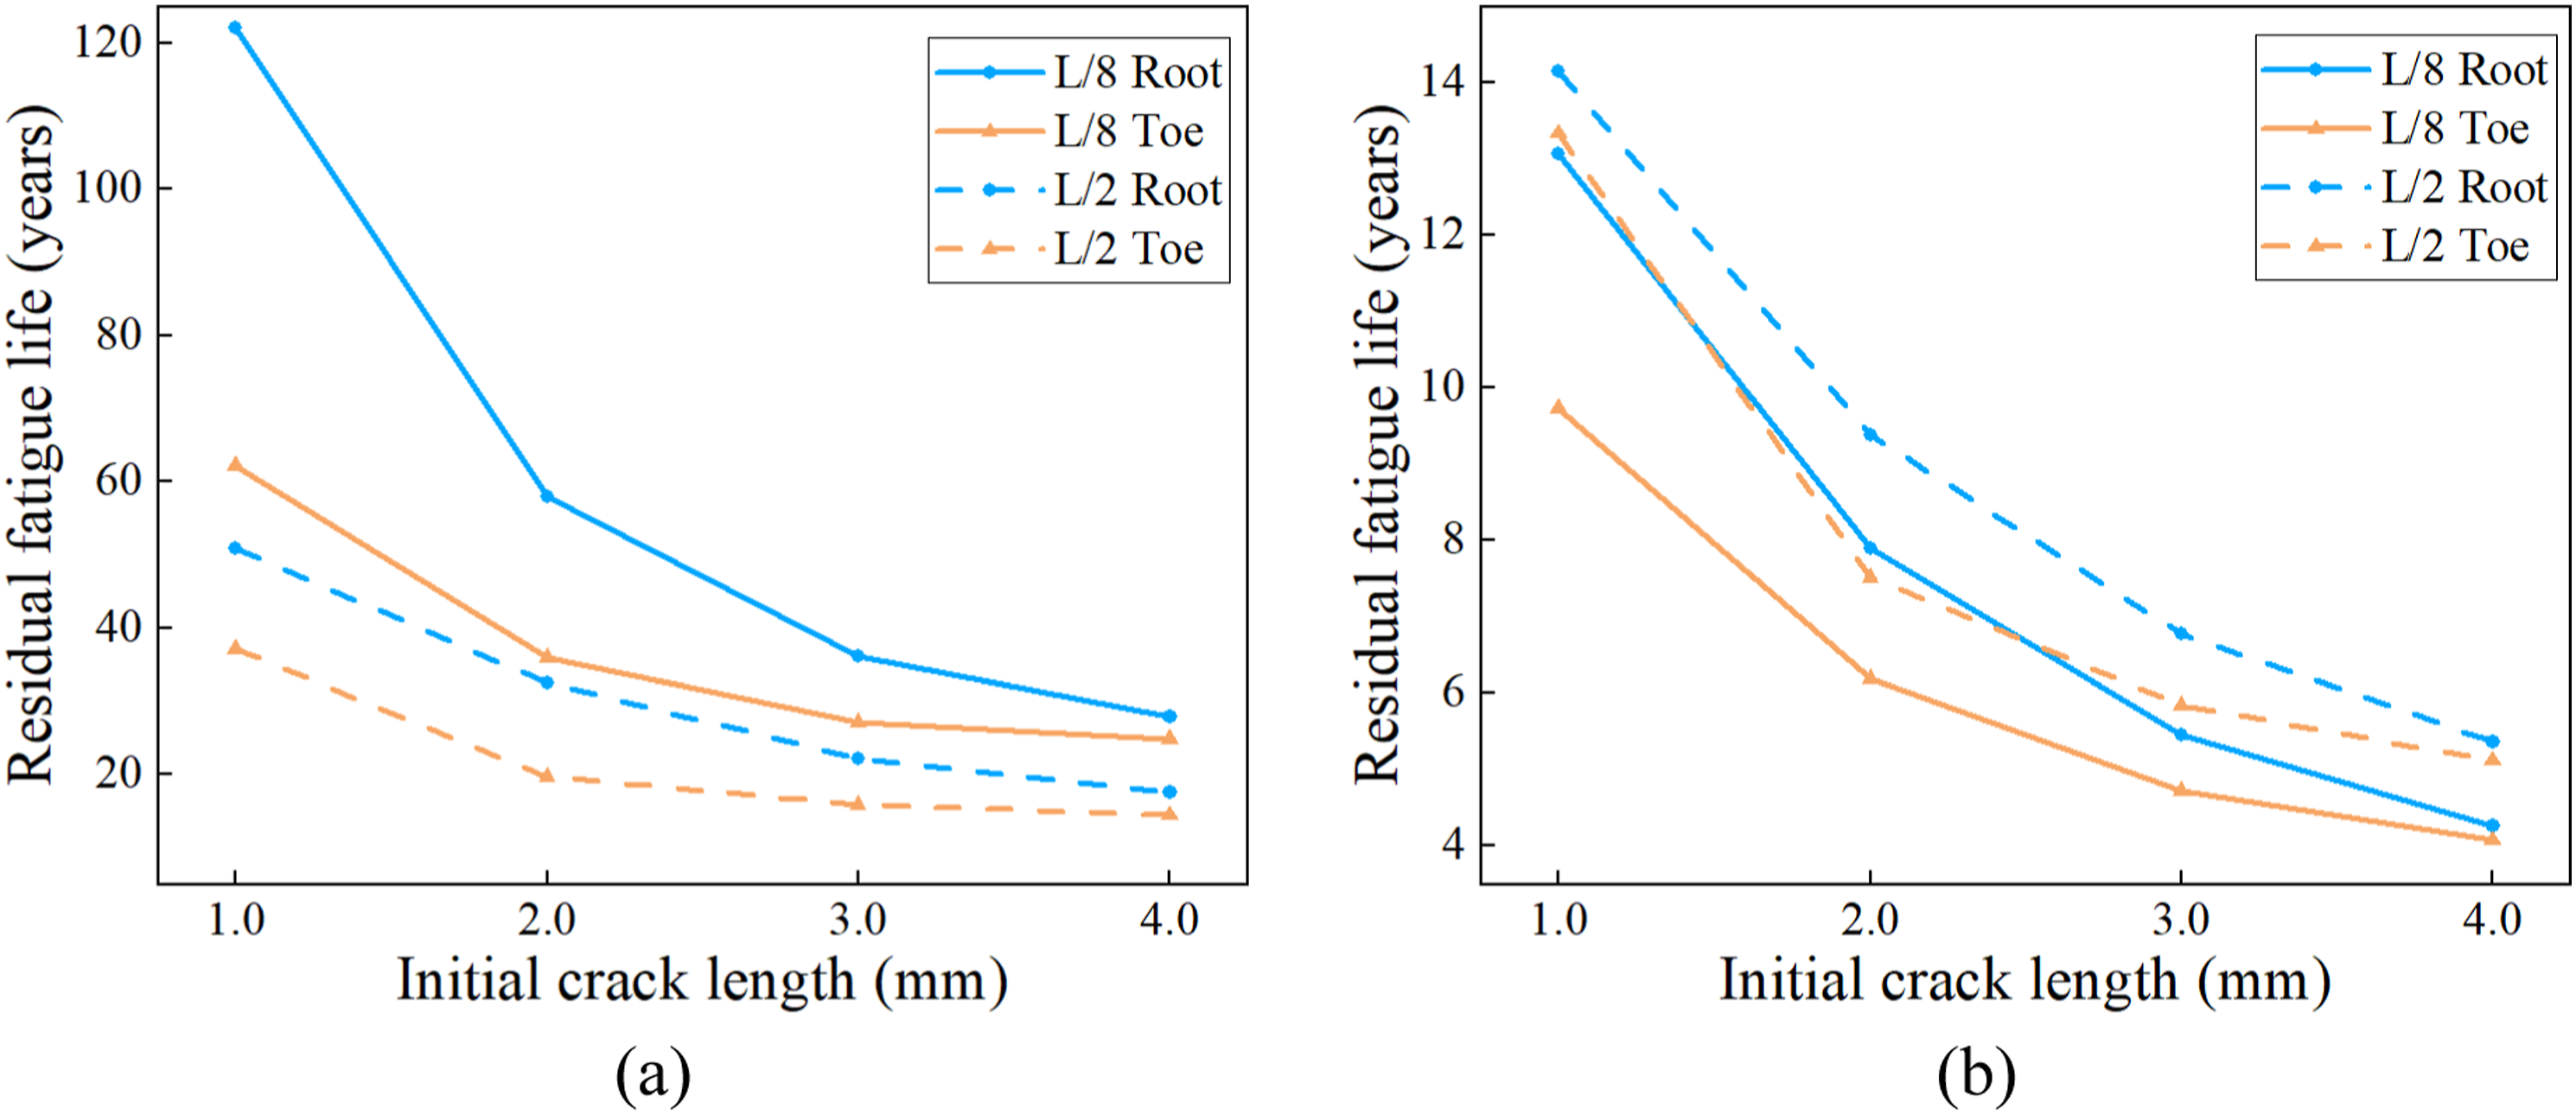
From Figure 13(a), it can be found that when calculating the stress amplitude in
Compared to the fatigue life of the same position, the fatigue life of the welded structure is relatively low when considering the full stress amplitude, with a residual life of 4.08 years for a crack depth of 4 mm in the L/8 area toe and 5.12 years for a crack of the same depth in the L/2 area toe. With this result, it is recommended that the next testing interval be 4 to 5 years, and that priority be given to cracks with an initial crack depth greater than 4 mm.
Conclusion
In this paper, based on the fracture mechanics related theory, a multi-scale digital fatigue test model and a fatigue life assessment model of the cracked rib-to-deck weld joints are constructed and the relationship between the influence of initial crack on fatigue life is studied. The main conclusions are as follows. (1) OSD rib-to-deck weld joints is typical of I-II-III composite cracks dominated by type I cracks. Besides, due to the influence of II, III cracks, cracks in the expansion will send a certain degree of deflection. The fatigue failure mode of this weld detail is mainly determined by fatigue cracks sprouting at the top plate weld toe. As the crack depth develops away from the stress concentration location, and as the crack grows, it causes the redistribution of stress in the cross-section, which causes the stress intensity factor to rise initially before leveling off or even dropping. The influence of welding residual stress on the amplitude of stress intensity factor can be basically ignored. But residual stress directly changes the stress state of fatigue details, transforming the compression dominated tension compression mode of the top plate longitudinal rib connection details under vehicle load into a tension-tension stress mode. This stress state will promote crack development and reduce the fatigue life of the material. (2) Considering only the fatigue vehicle tensile stress as the crack driving force does not cause further crack expansion, the fatigue life of the structure is negligible when considering the effect of residual stresses, with a remaining life of 4.08 years for a crack depth of 4 mm in the L/8 area weld toe and 5.12 years for a crack of the same depth in the L/2 area weld toe. Considering that the evaluation results under residual stress are on the safe side, regarding this result, it is recommended that the next inspection interval be 4 to 5 years while prioritizing the maintenance of cracks with an initial crack depth greater than 4 mm found in the current inspection.
Footnotes
Acknowledgements
The authors acknowledge the anonymous editor and reviewers who provided useful comments for improving the quality of the paper.
Declaration of conflicting interests
The author(s) declared no potential conflicts of interest with respect to the research, authorship, and/or publication of this article.
Funding
The author(s) disclosed receipt of the following financial support for the research, authorship, and/or publication of this article: This work was supported by the National Natural Science Foundation of China (Grant No.52172374), the Sichuan Outstanding Youth Science and Technology Talent Project (Grant No.2022JDJQ0016) and the International Science and Technology Cooperation Programme of Chengdu City (Grant No.2023-GH02-00051-HZ).