



Abstract
The application of segmental precast assembled concrete cover beams in bridge construction is beneficial to promote low carbon, green and sustainable development of construction projects. To investigate the influence of the fabrication process of large key tooth joints on the shear performance of precast assembled concrete cover girders, the damage process of large key tooth assembled prestressed concrete cover girder specimens was investigated by using ABAQUS finite element analysis (FEA). The results show that: the section precast assembled concrete beams under four-point bending loading conditions, it is in the key tooth joint area that obvious cracking occurs; the finite element model of the large key tooth assembled prestressed cover beams can be effectively used to simulate the overall stress behavior of the beams; as the key tooth depth-to-height ratio increases, the stronger the connecting effect between the damaging key tooth and the positive key tooth is, and the load carrying capacity of the assembled beams is increased by 20% compared with the single key tooth, and ductility is increased by 30%; in the range of suitable reinforcement, the change of reinforcement rate does not have a significant effect on the stress performance of the beam.
Introduction
With the rapid development of bridge construction, urban viaducts and rail transit have emerged to alleviate the problem of urban road traffic congestion (Han et al. (2014); Yuan et al. (2019); Yuen et al. (2020)). However, due to the special geographic location of urban bridge construction, its construction has a low impact on the surrounding environment of the construction site (Jia et al. (2020)), a short construction period, and high-quality requirements (Le et al. (2019); Zheng et al. (2019); Liu et al. (2019)). Compared with the traditional cast-in-place concrete construction process, segmental precast bridge construction is less affected by the construction environment and has other advantages (Tanarslan (2017)). However, there are joints between sections of precast concrete girders, and the existence of joints has an important impact on the overall performance of the bridge structure (Cai et al. (2018); Zhou et al. (2018)). Most of the existing codes are for small-section shear keys, but the force characteristics of large prefabricated prestressed shear keys for cover beams are not well understood (Le et al. (2020); Tran et al. (2021)).
At present, numerous scholars have carried out theoretical and experimental research on segmental precast assembled reinforced concrete beams, and certain progress has been made (Sakr et al. (2019); Özkılıç et al. (2021); Wu et al. (2020)). Segmental precast assembled bridges are designed to transfer shear forces and bending moments at the joints under the combined action of prestressing and key-tooth shear bonds, which eventually form the precast segmental girders into a single unit (Ahmed and Aziz (2019a); Ahmadi and Kashani. (2020); Al-Rousan R Z and Alnemrawi B A R (2023a)). In precast segmental concrete bridges, the joints between the segments require special attention in design and construction because of the discontinuity introduced in the bridge (Buyukozturk et al. (1990); Ahmed and Aziz (2019b)). Jiang et al. (2018) conducted shear damage tests on box section beams with inclined sections and investigated the effects of different joint types and number of joints on the inclined section shear performance of precast segmental in vitro prestressed concrete beams, and found that in vitro prestressed precast segmental dry joint concrete beams are prone to cracking at the key teeth. Jiang et al. (2016) investigated the effects of the number of small key teeth and prestressing tendons on the flexural strength of segmental beams and found that segmental beams can achieve the required flexural load capacity and ductility. In bridge design, as an important element, the cover beam is not allowed to have shear brittle damage (Yan et al. (2020); Ahmed et al. (2019c)). In the existing research, most of the studies on the shear performance of the bond-tooth joints of prefabricated assembled beams are mostly on the force performance of small bond-tooths, and there are few studies on the actual force characteristics of the bond-tooths at the joints of large bond-tooth assembled prestressed cover beams. Al-Rousan R Z and Alnemrawi B A R (2023b) used nonlinear FEA techniques to establish and simulate the force performance of carbon fiber reinforced plastic (CFRP) shear critical nodes under sulfate corrosion and reinforcement.
ABAQUS is a powerful finite element software for engineering simulation. A reasonable finite element model can effectively verify the test observations and predict the damaged state of the bridge after loading (Kyaure M, Abed. (2021); Dawood et al. (2012); Demir et al. (2016)). ElGawady and Dawood (2012) used ABAQUS to develop a three-dimensional nonlinear finite element model to evaluate the performance of segmental precast post-tensioned piers under transverse loading and found that the length-to-width ratio, cross-sectional dimensions, and restraint conditions had significant effects on the performance of the piers. Zhu et al. (2021) proposed a structural design of precast segmental ultra-high performance concrete (UHPC) beams combining prestressing strands and bolted connections. The effect of the number of prestressing strands on the bending behavior of precast segmental UHPC beams was investigated by combining the finite element results with the bending test results. Kang et al. (2015) evaluated the structural properties of post-tensioned concrete members with and without bonded prestressing tendons using nonlinear finite elements, Janghorban F et al. (2020) Detailed finite element modeling investigated the in-plane properties of unbonded post-tensioned walls. Rawi et al. (2020) investigated the mechanical properties and damage behavior of post-tensioned slabs under impact loading, and Jahami A et al. (2020) explored the effectiveness of fast shear reinforcement as a repair technique for post-tensioned slabs with rockfall damage.
To improve the convenience of segmental collocation and minimize the weight of the main segment in the span of the cover beam at the joint position, and to further exploit the advantages of fast construction and green environment of segmental precast collocation bridges, this paper carries out a study on large key-tooth collocated prestressed concrete cover beam. The purpose of this study is to investigate the four-point bending stress performance and damage mode of a new large key-tooth segmental assembled girder based on the existing research status of precast assembled bridges. A three-dimensional finite element model was also developed to verify the damage process of the large key-tooth precast collapsible segmental girders and to predict the effects of the number of key teeth at their joints and the key-tooth depth-to-height ratio on the mechanical properties of the large key-tooth collapsible prestressed concrete cover girders. In addition, a coefficient study was conducted for calculating the effects of factors such as the number of large key teeth and key teeth size on the structural properties of prestressed concrete cap beams.
Experimental overview
Experimental design
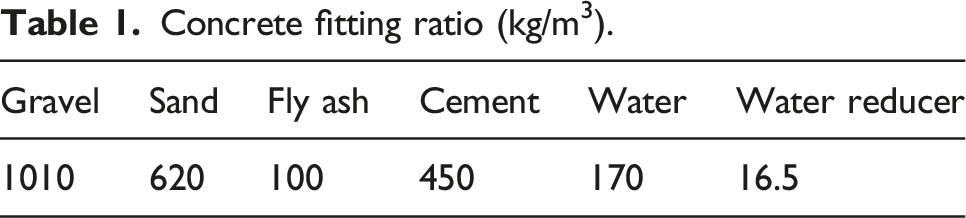
Concrete fitting ratio (kg/m3).
The cross-sectional dimensions of this test cap beam are 400 mm × 800 mm and the length is 7000 mm. The number of these members was 3 to ensure the accuracy of the test. The longitudinal reinforcement diameter of the cap beam is 16 mm in the tension zone, 20 mm in the compression zone, 10 mm in the girders, 8 mm in diameter HRB400 in the hoops, and 6 mm in the tie bars. The dimensions and reinforcement design of the large key-tooth assembled prestressed concrete cap beam are shown in Figure 1. The total length of the test beam is 7000 m, and the effective span is 6600m, as shown in Figure 1(a). The concrete protective layer thickness (outermost reinforcement protective layer) is 28 mm, the reinforcement anchorage length is 200 mm, and the reinforcement rate is 0.393%. Dimensional and reinforcement design of large key-tooth assembled prestressed concrete cover beam. (a) Dimensions of large key-tooth assembled prestressed concrete cover beam. (b) Design of reinforcement for large key-tooth assembled prestressed concrete cover beam. (c) A-A (d) B-B (waist reinforcement as A-A).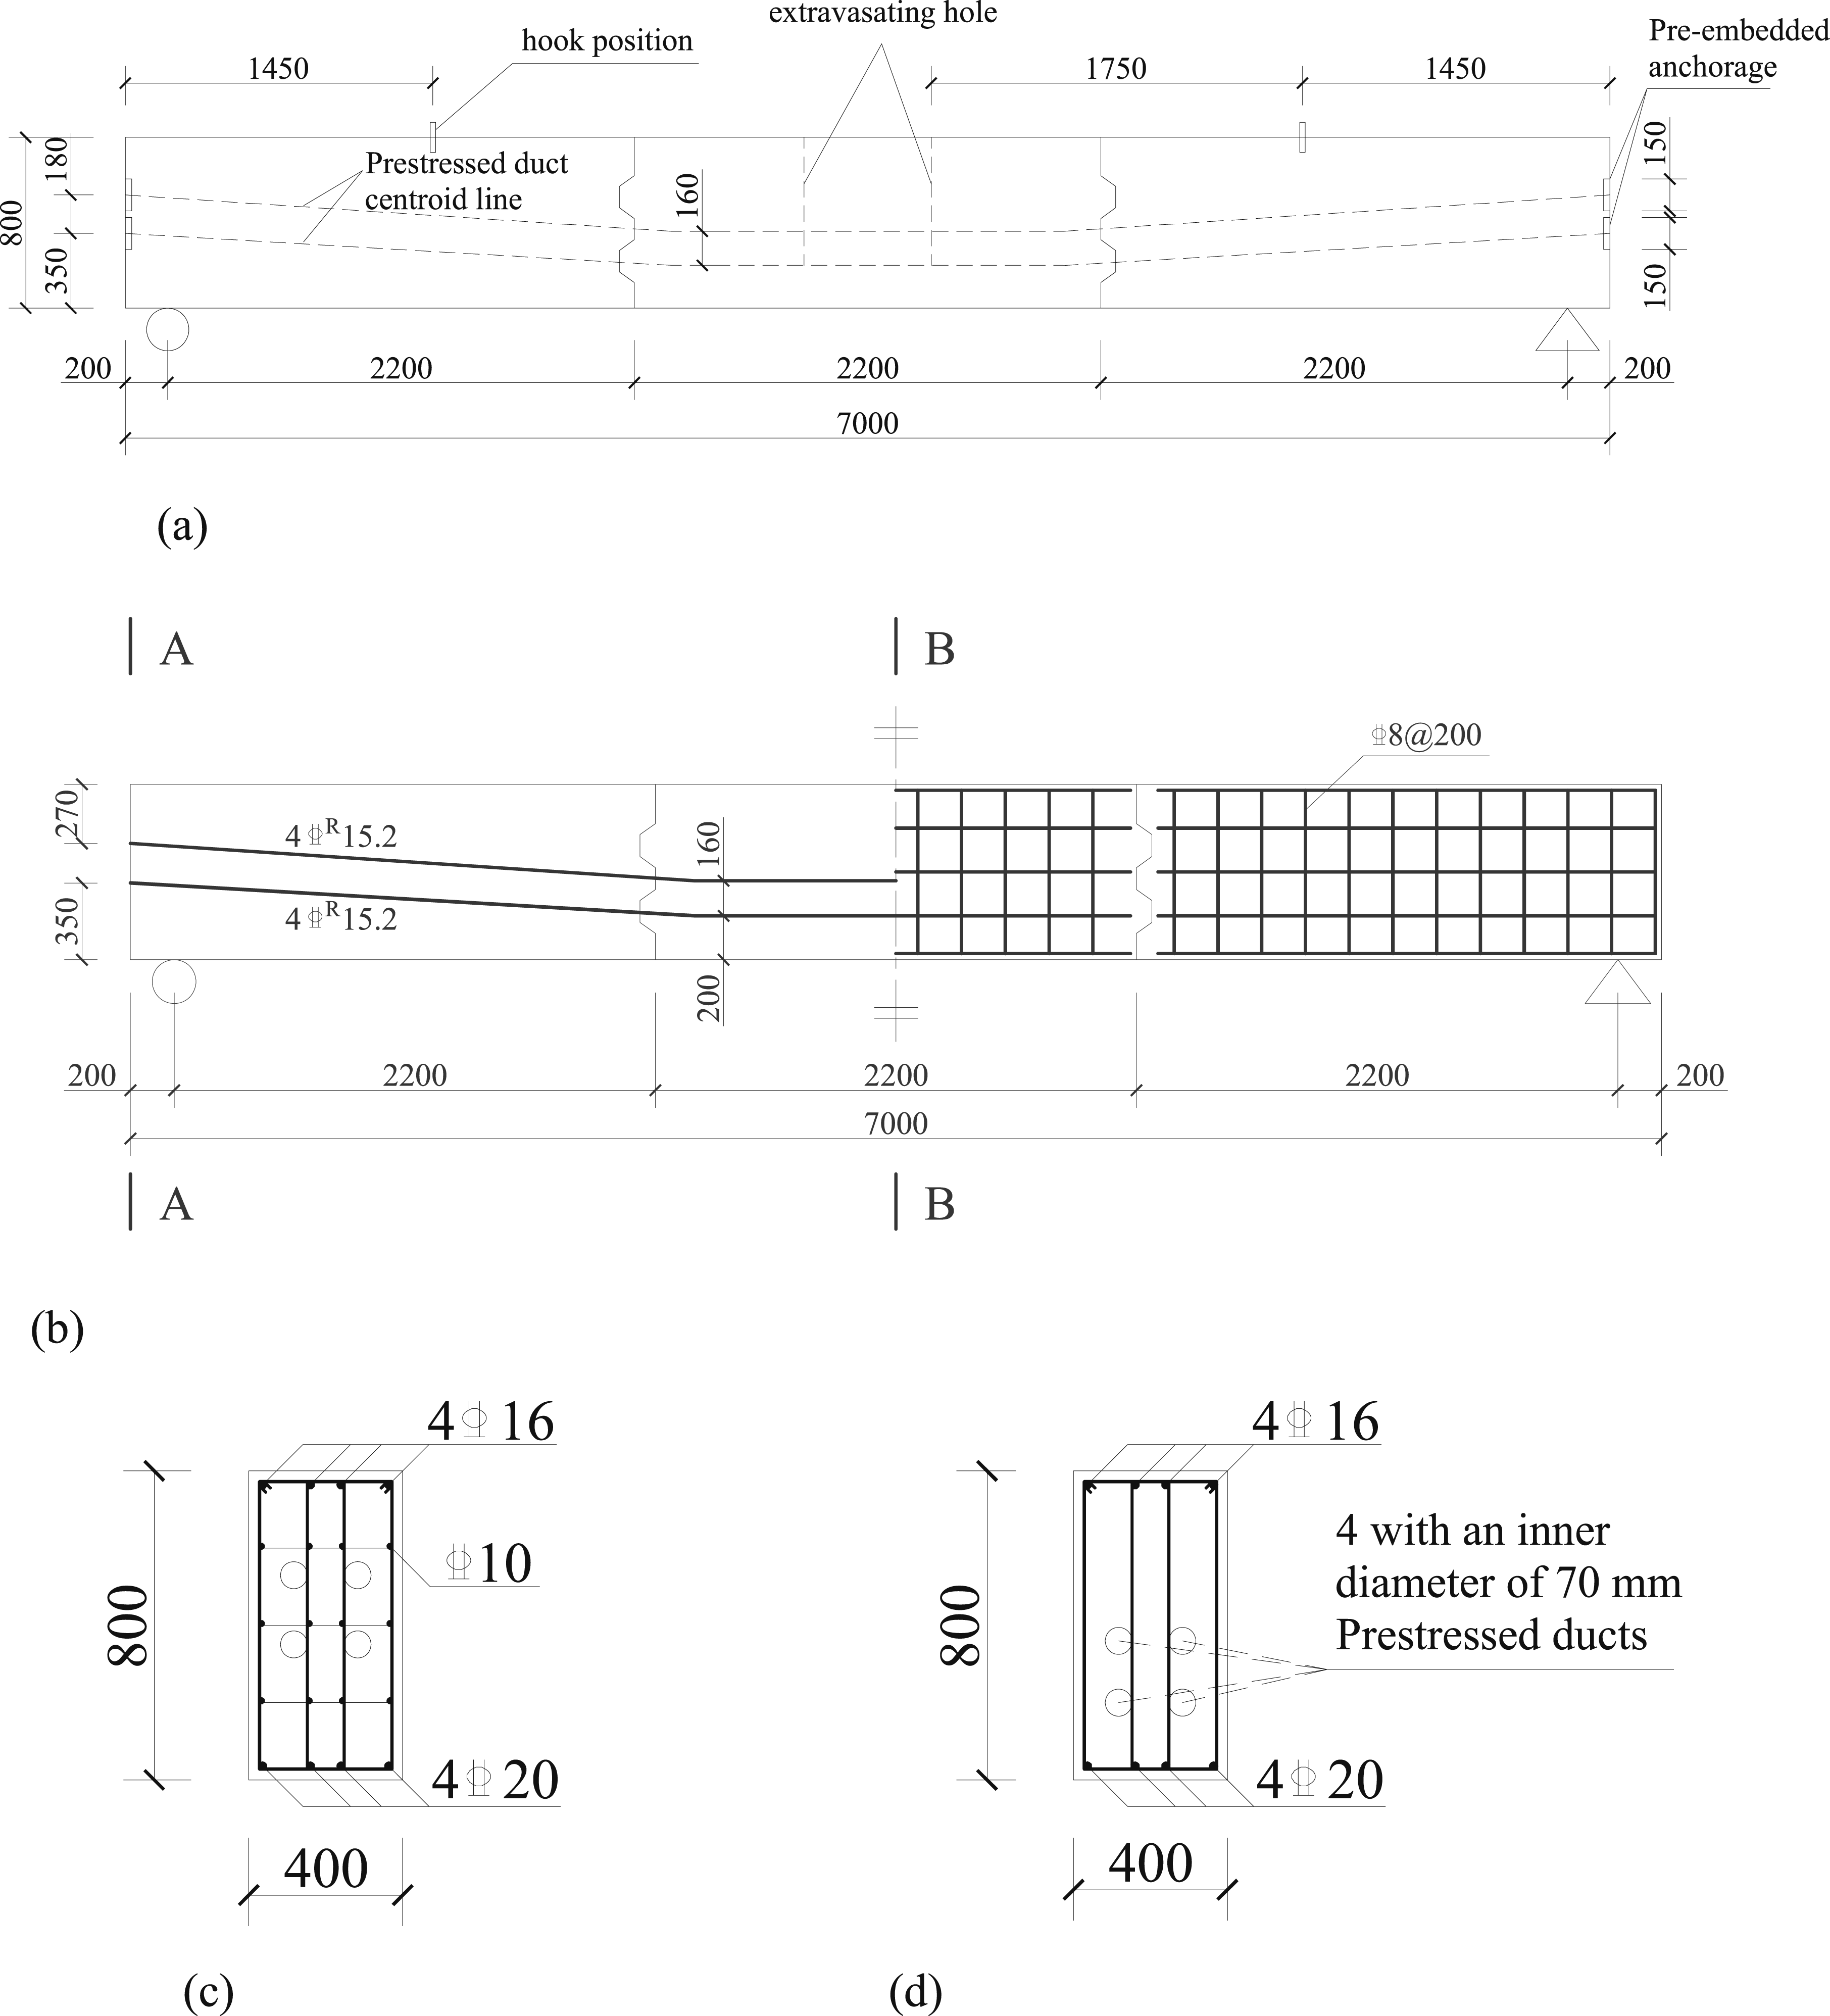
The spliced section of the test beam has two key teeth with a depth of 70 mm, a base height of 200 mm, and a top height of 100 mm. The detailed construction of the large key teeth is shown in Figure 2. Detail structure of large key teeth of assembled prestressed concrete cover beam. (a) Detailed structure of big key teeth. (b) Large key tooth detail construction section.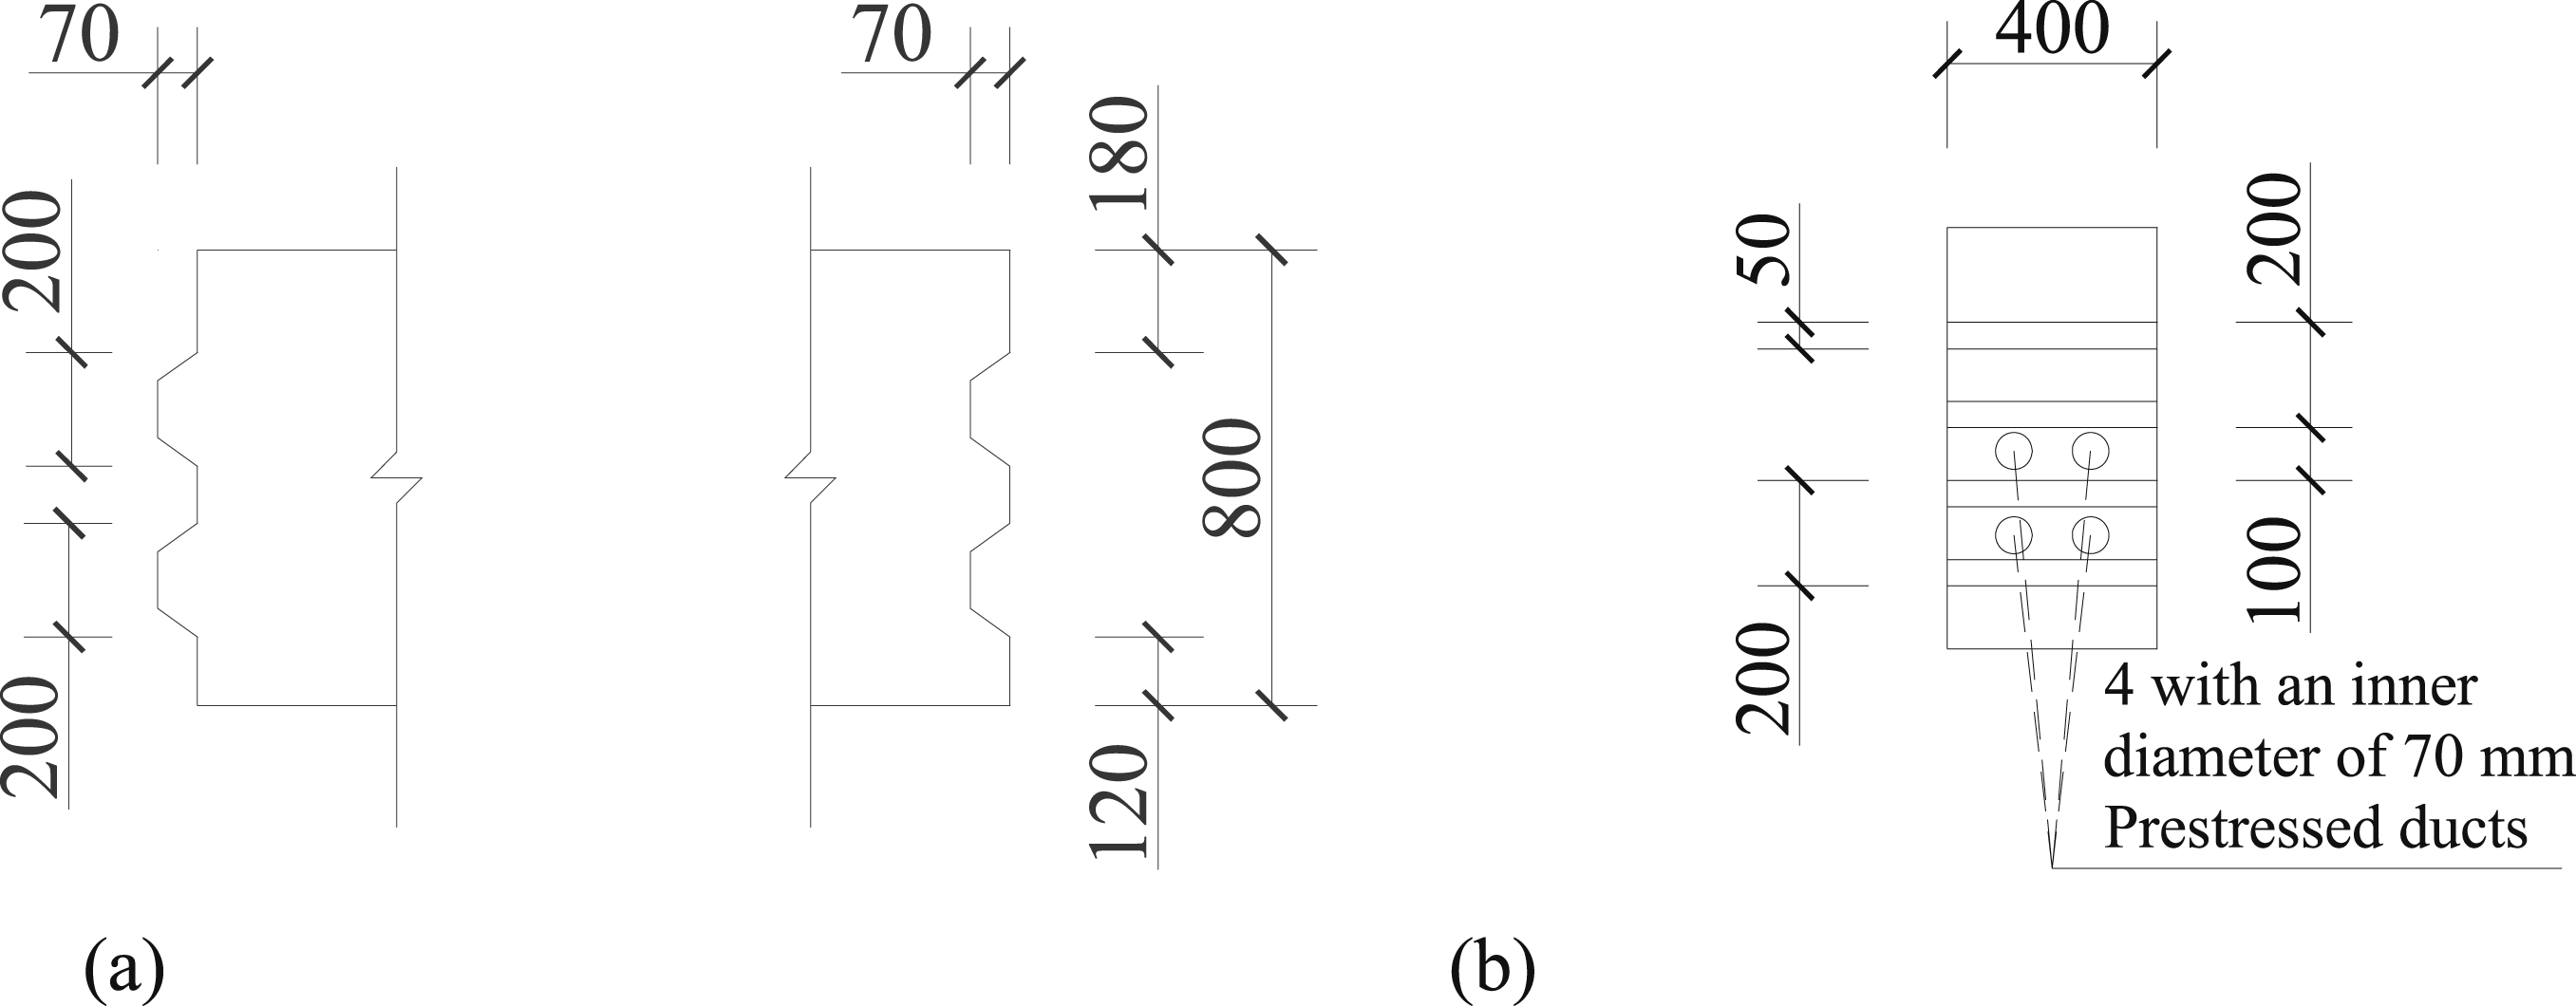
Experimental program
The test is a four-point bending test, in which the horizontal prestress is applied to the specimen by tensioning equipment in advance before loading. In addition, it is necessary to select the suitable jack loading device and the supporting reaction frame and reaction beam for loading according to the ultimate load that the large bonded tooth cover beam can bear calculated by the test design, and the load is recorded by the gravity sensor. Before the test begins, all the instruments and equipment used in the test process need to be calibrated. The test loading schematic is shown in Figure 3, where two concentrated forces are applied at a distance of 2400 mm from the reaction frame, and the 1800 mm span area is a pure bending section. The test beam is subjected to two concentrated loads transmitted by the reaction beam to apply a four-point load. The jack used for the test controlled the applied force by hydraulic pressure, and before the test beam cracked, the load was loaded in steps of 10 kN per step to maintain the load for 1 min, and after the test beam cracked, the load was increased to 50 kN per step. After the test beam reached the ultimate load, it was loaded by displacement until the specimen was damaged. Loading position of large key teeth assembled prestressed concrete cover beam.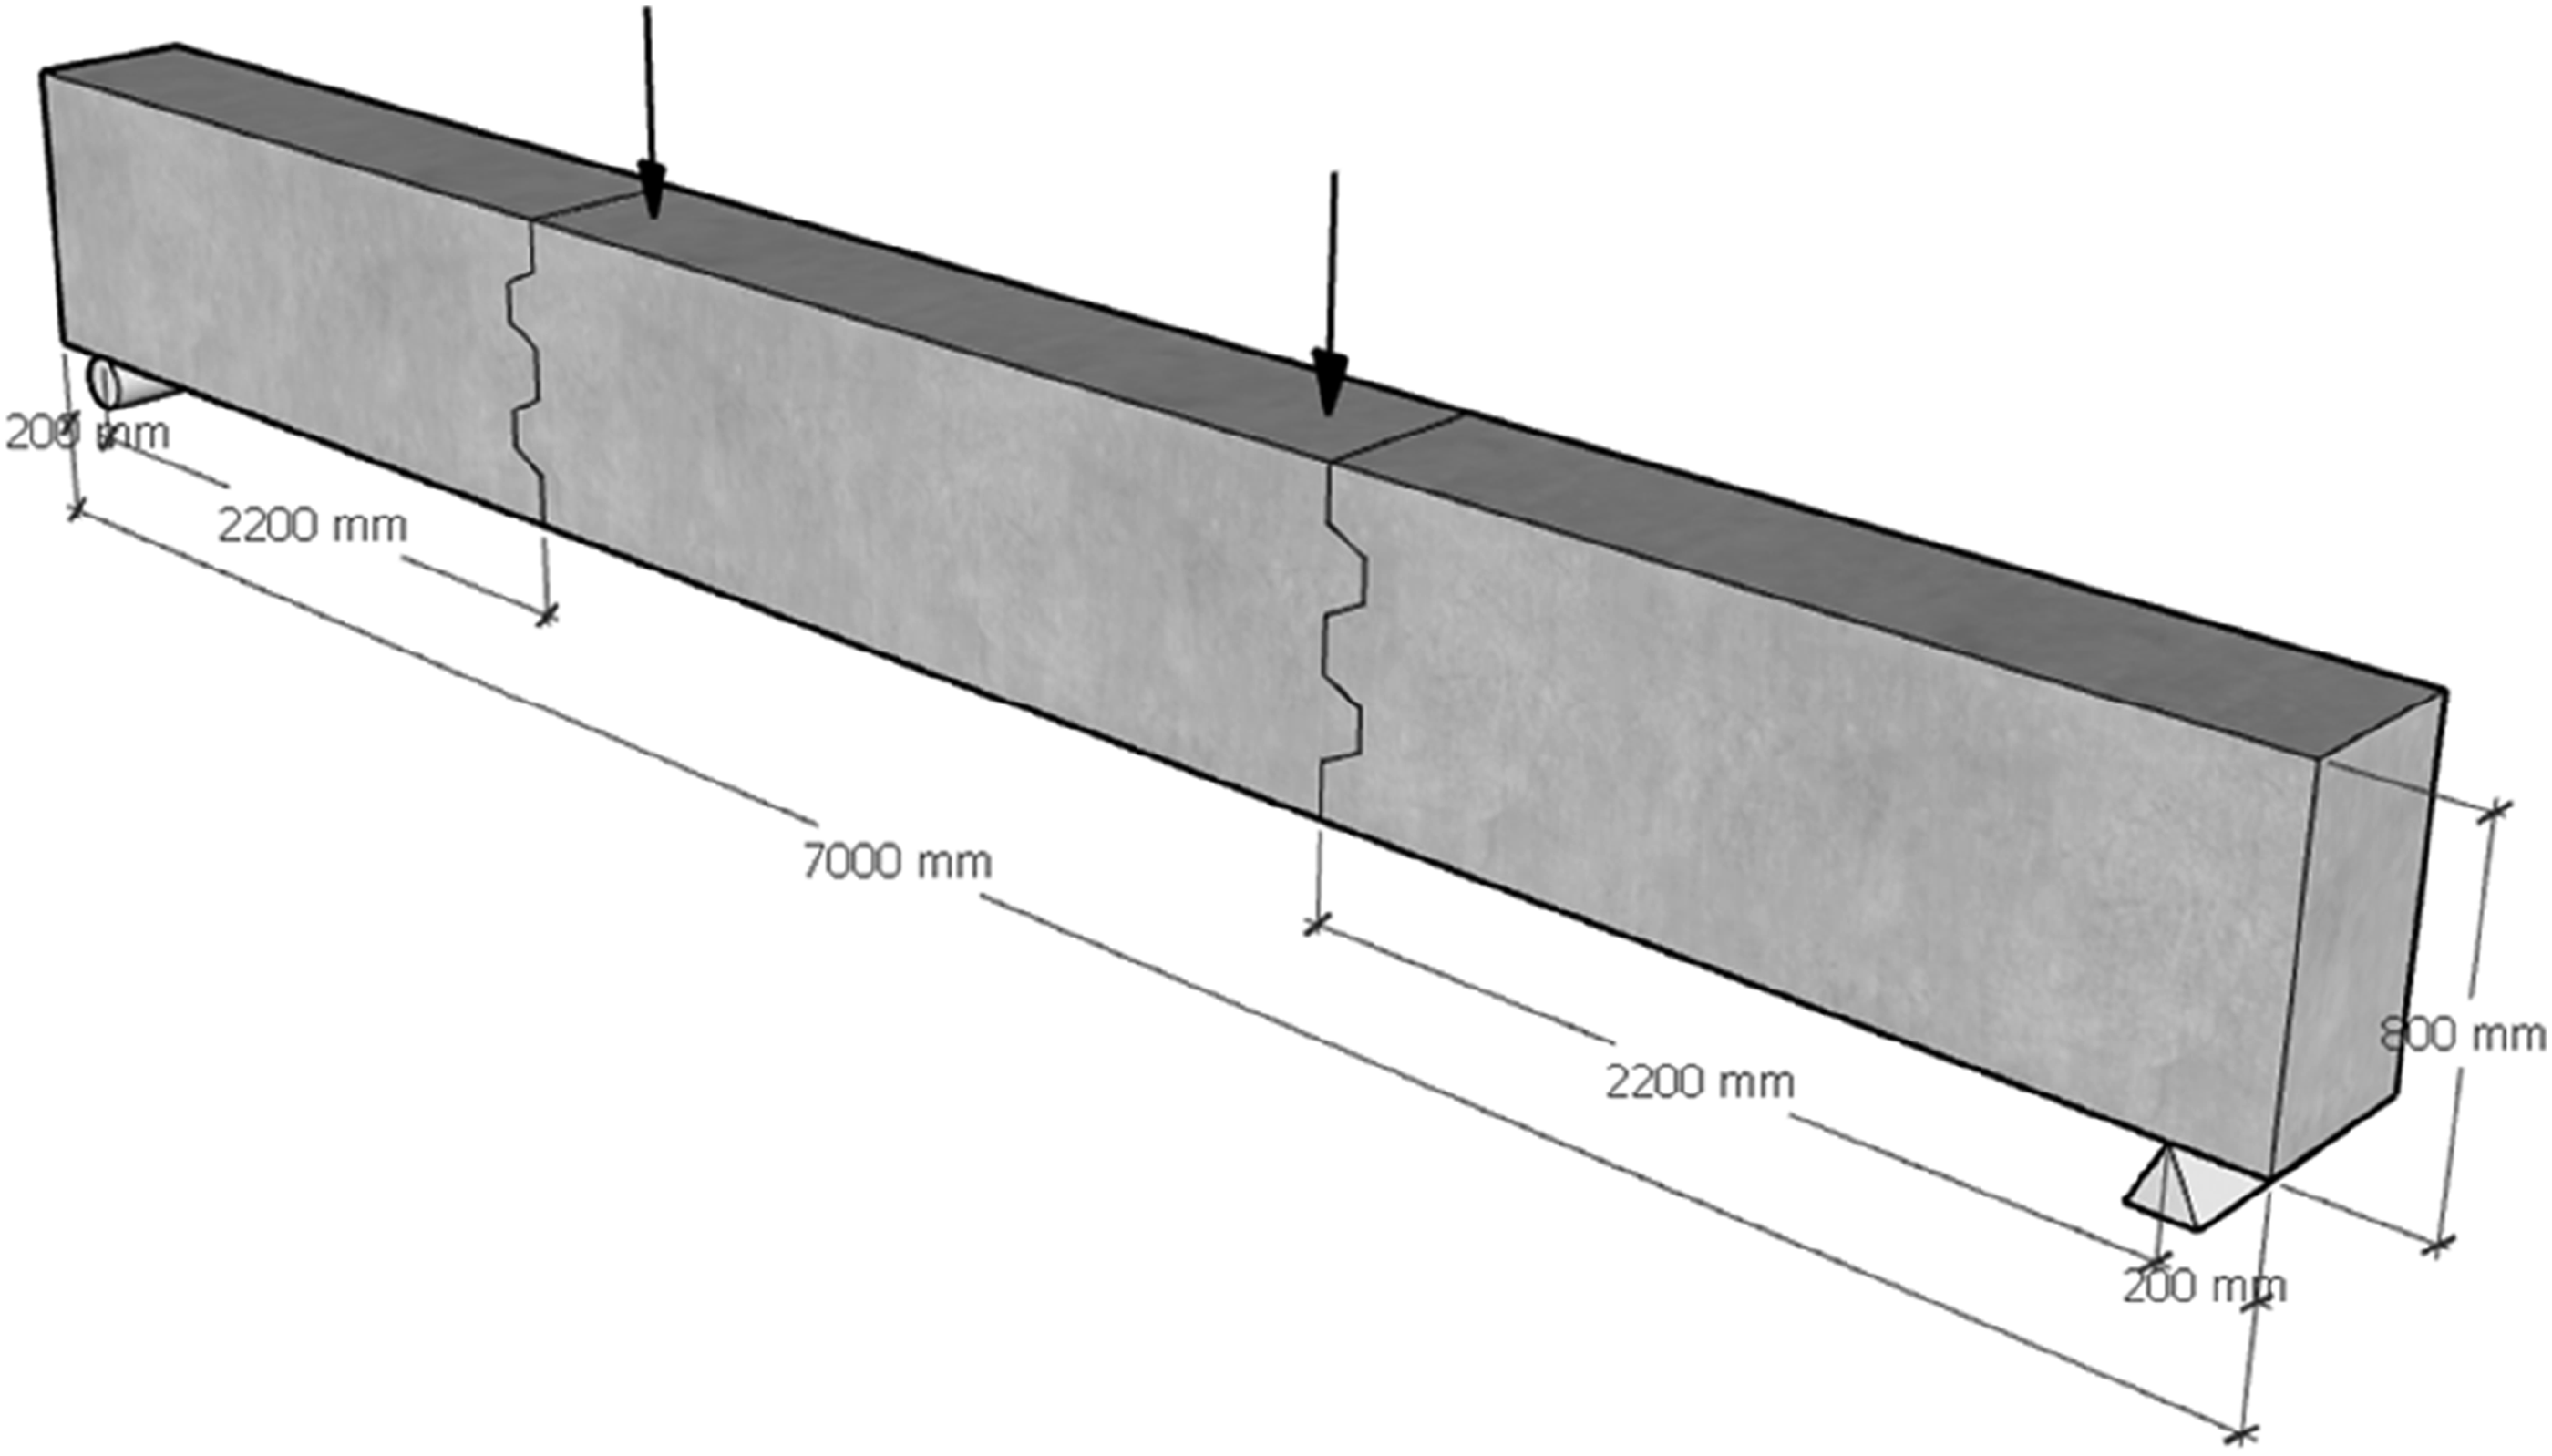
Analysis of test results
Damage process and damage mode
Observing the two ends of the spliced section of the test beam, it can be found that the key teeth consist of positive and negative key teeth. During the whole four-point bending test, the test cap beam experienced the elastic phase, the working phase with cracks, and the damage phase. The damage process of the large bond-tooth assembled prestressed concrete cover beam mainly consisted of cracks appearing first in the middle section in tension, cracking at the intersection of the bond-tooth joints, and forming oblique shear cracks at the sides of the cover beam. With the obvious expansion of the cracks, some of the hoop bars yielded and the concrete in the compressed zone cracked and spalled. The damage pattern of the test beam is shown in Figure 4. During the loading process, the test beam exhibited a more obvious shear compression damage pattern. In addition, at the joints of the precast assembled cover beam, the cracks have a tendency to expand to the weak points of the key-tooth splices. Damage mode of large key teeth assembled prestressed concrete cover beam.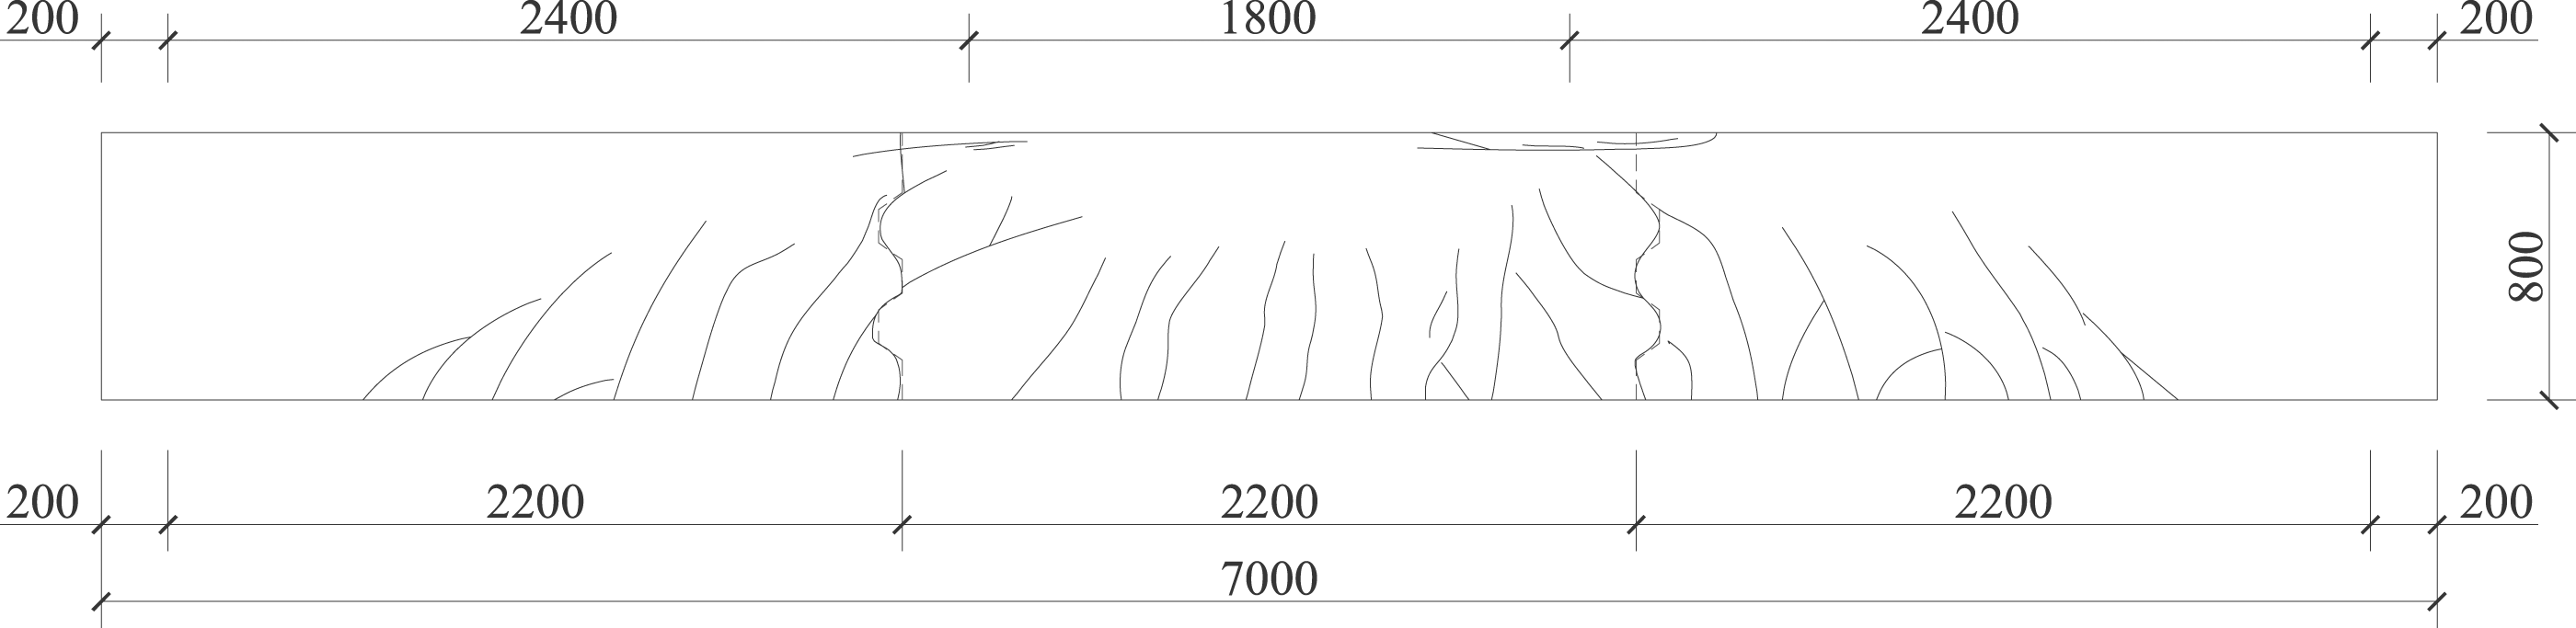
Load-displacement curves
To measure the deformation and deflection changes of the large key-tooth assembled prestressed concrete cover beam, this test was carried out using linear variable displacement transducers to test the displacement changes at different locations of the beam, and the arrangement of the displacement meters and the corresponding numbers are shown in Figure 5(a). By observing Figure 5(b), it can be found that due to the addition of prestress tendons, prestress was applied to the test beam, which significantly delayed the appearance of cracks, and the load at the time of cracks on the surface of the specimen was about 400 kN. From the stage of applying load until the appearance of cracks in the concrete in the tension zone, it is the stage of linear elastic force. In this stage, the concrete is subjected to tensile force resisted by the prestressing force applied by the prestressing bar and then by the concrete in the tensile zone and the reinforcement in the tensile zone. At this time, the concrete begins to appear cracks. As the load increases, the cracks in the concrete in the tension zone gradually expand and the cracks in the span increase, and the tensile stress on the prestressing tendons also increase. It is not difficult to find that during the four-point bending test of the large bond-tooth assembled prestressed concrete cover beam, the displacement change at the bond-tooth connection is similar to that of the mid-span displacement, and its value is only slightly smaller than its mid-span displacement. At about 90% of the peak load, longitudinal cracks appeared in the concrete compression zone and the concrete began to spall gradually. And then, the non-prestressing tendons yielded, the concrete in the compressed zone was crushed, and the prestressing tendons approached the damage strength, at which time, the cracks in the test beam were wider. By comparing the load-displacement curves at S-1, C-1, and M positions, it is remarkable to find that the changing pattern of these three curves remains consistent, and the change of displacement value at S-1 at the side span position is about 1/2 of that at the middle of the span. When the ultimate load is reached, the displacement at C-1 at the key-tooth joint is 42.80 mm and the deflection at the middle of the span is 43.88 mm, which indicates that in the construction of segmental assembled concrete cover beam, the large key The ultimate deformation capacity of the prestressed concrete cover beam with large key teeth is larger, which can retard the damage of the specimen. Displacement meter arrangement and load-displacement curve. (a) Displacement meter location and number. (b) Load-displacement curve.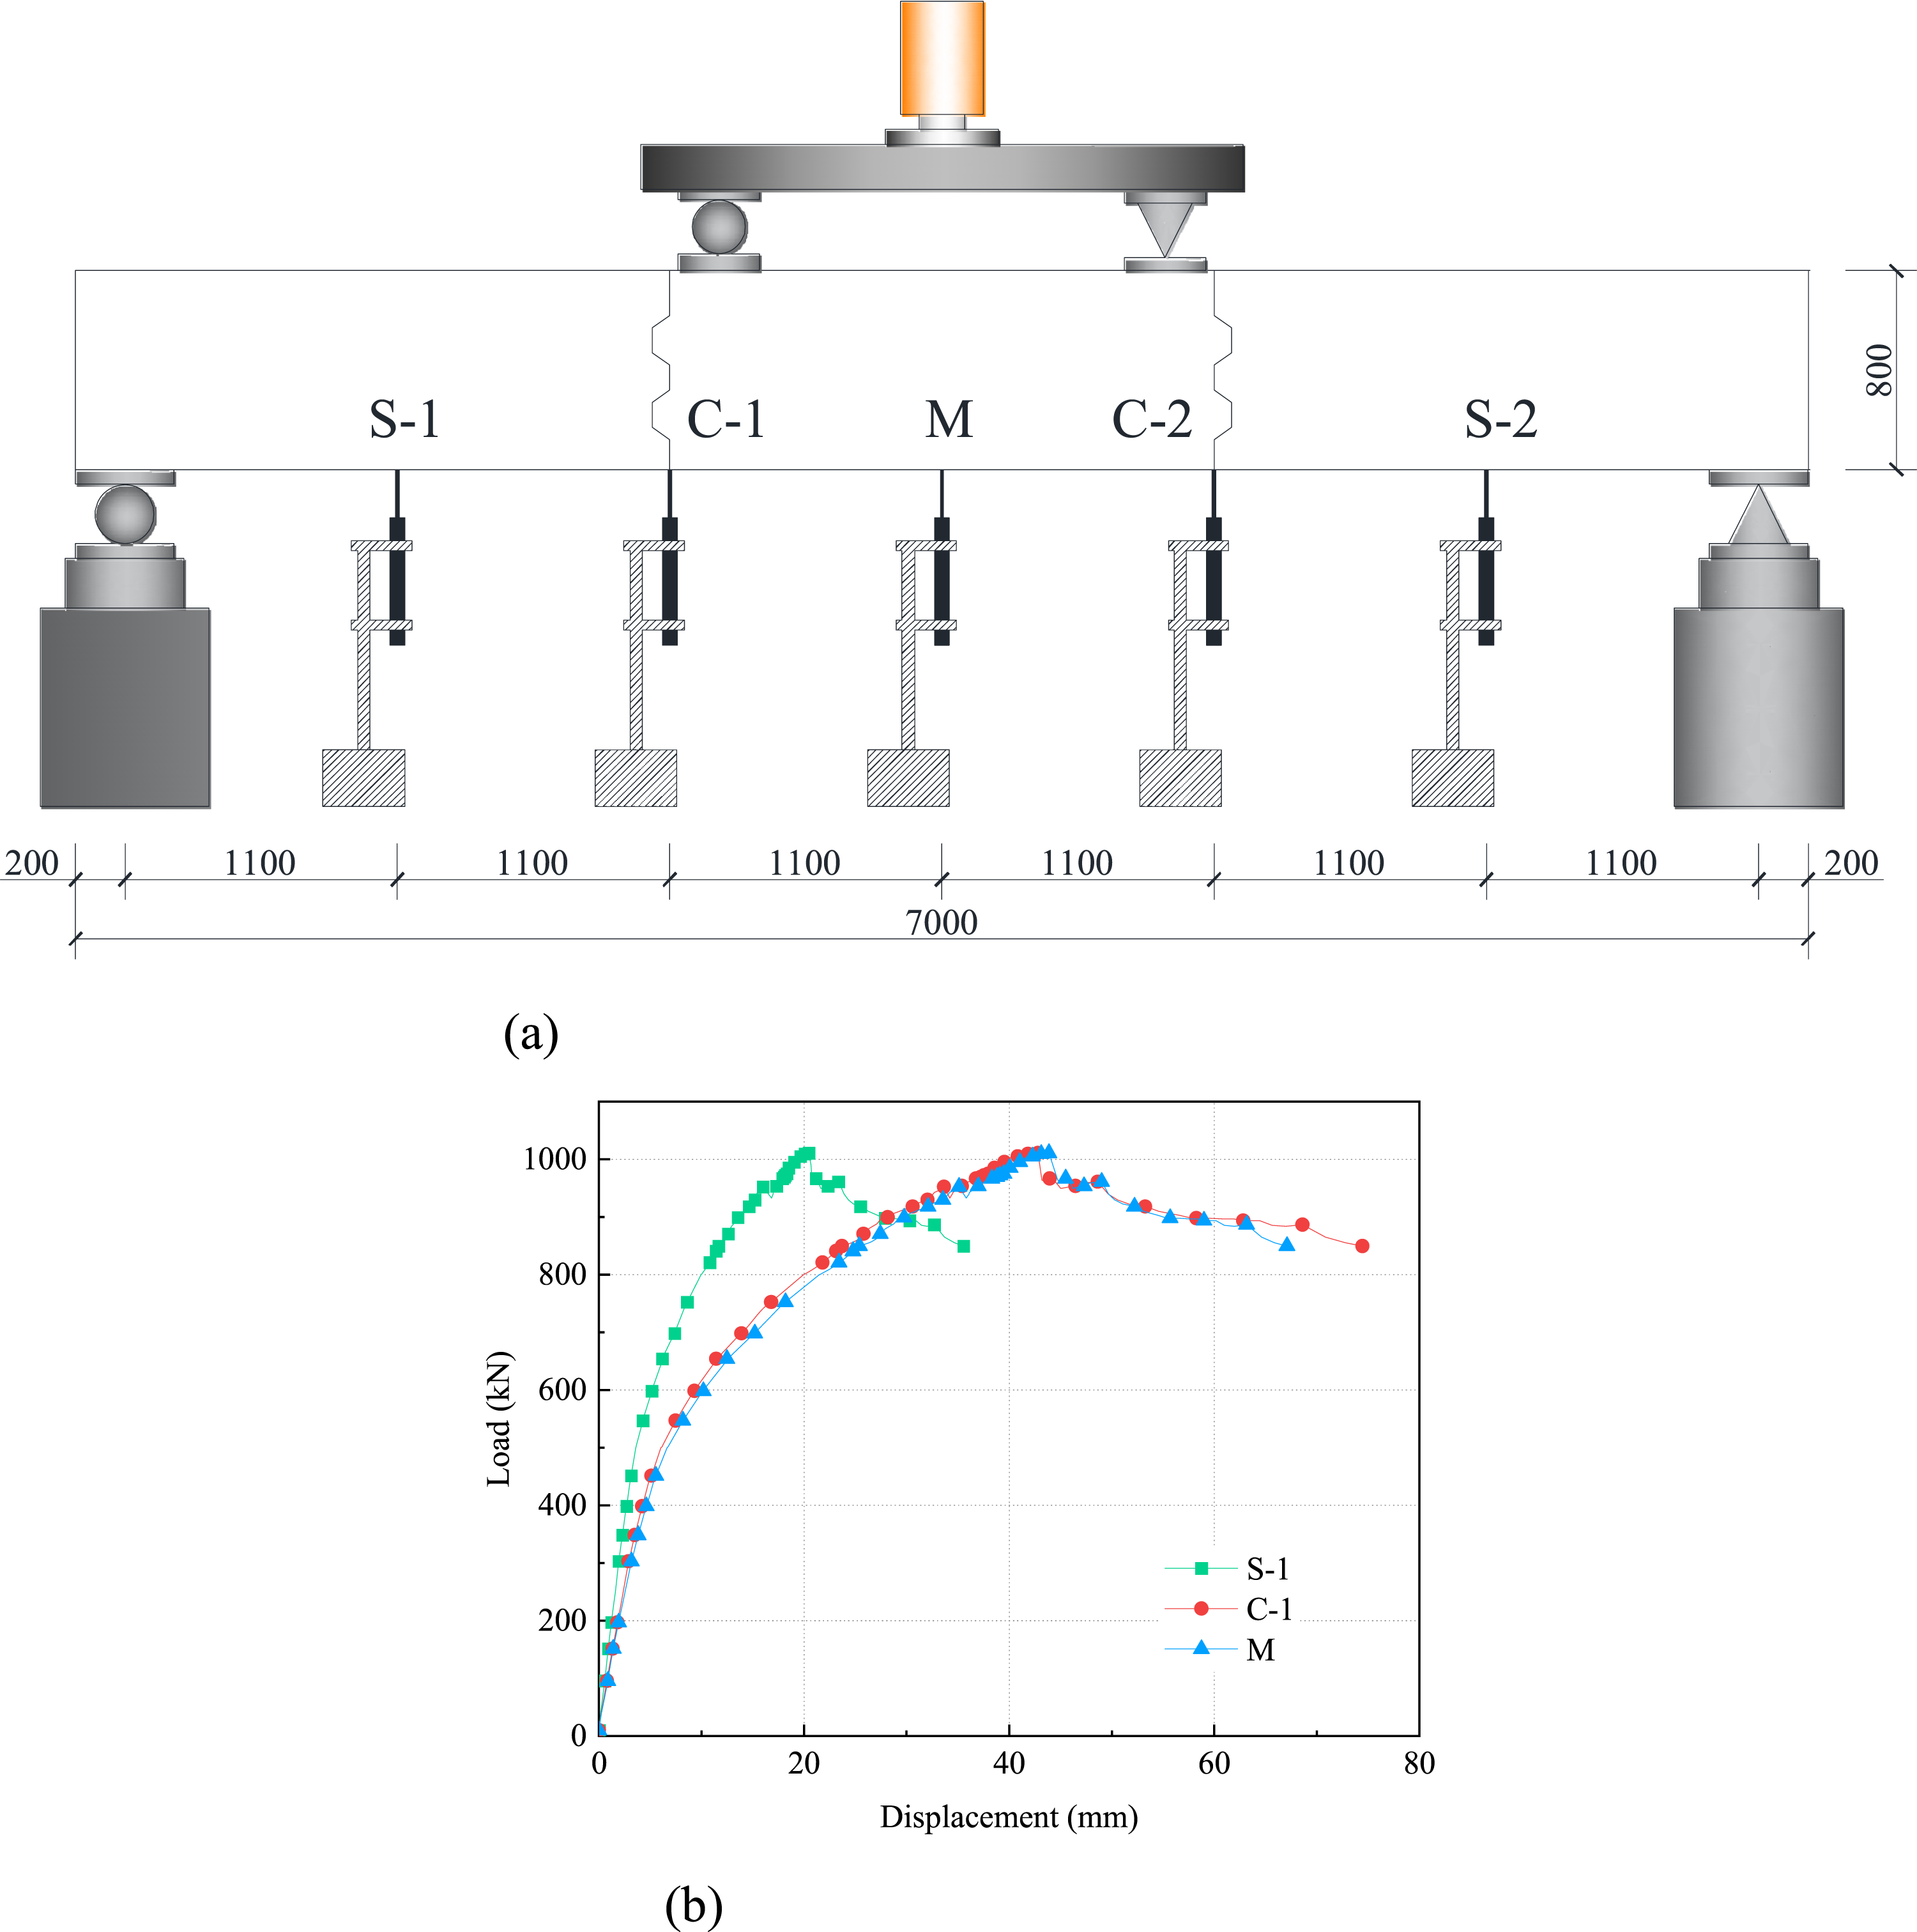
Comparison of Existing Similar Research Results.
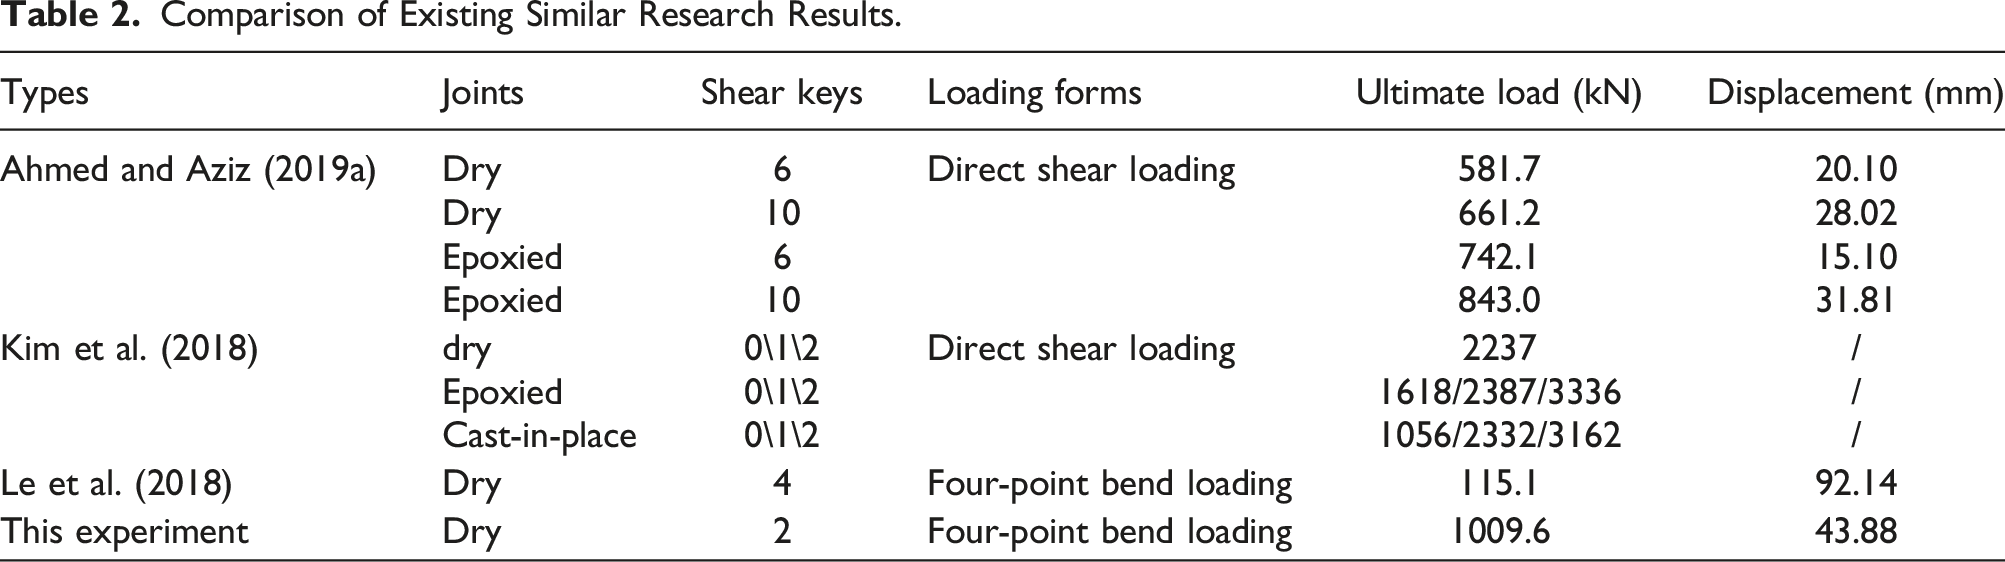
Figure 6 shows the curve of deflection variation of the test beam at different loads during the loading process. At the early stage of loading, the deformation of the test beam is increasing, but its growth rate is slow, and the load-deflection values at each location point show a nearly linear growth relationship. During this period, the test beam is in full section working condition at this stage. The deflection of the test beam reaches the normal service limit state when the load reaches 0.6Pu. After this period, the concrete cracked, the rate of increase of deflection increased significantly and the test beam entered the elastic-plastic phase. It is worth pointing out that due to the presence of prestressing tendons, their relative slip with the test beam occurs during the loading process, resulting in a large deflection deformation of the test beam before damage occurs. Load-deflection curve.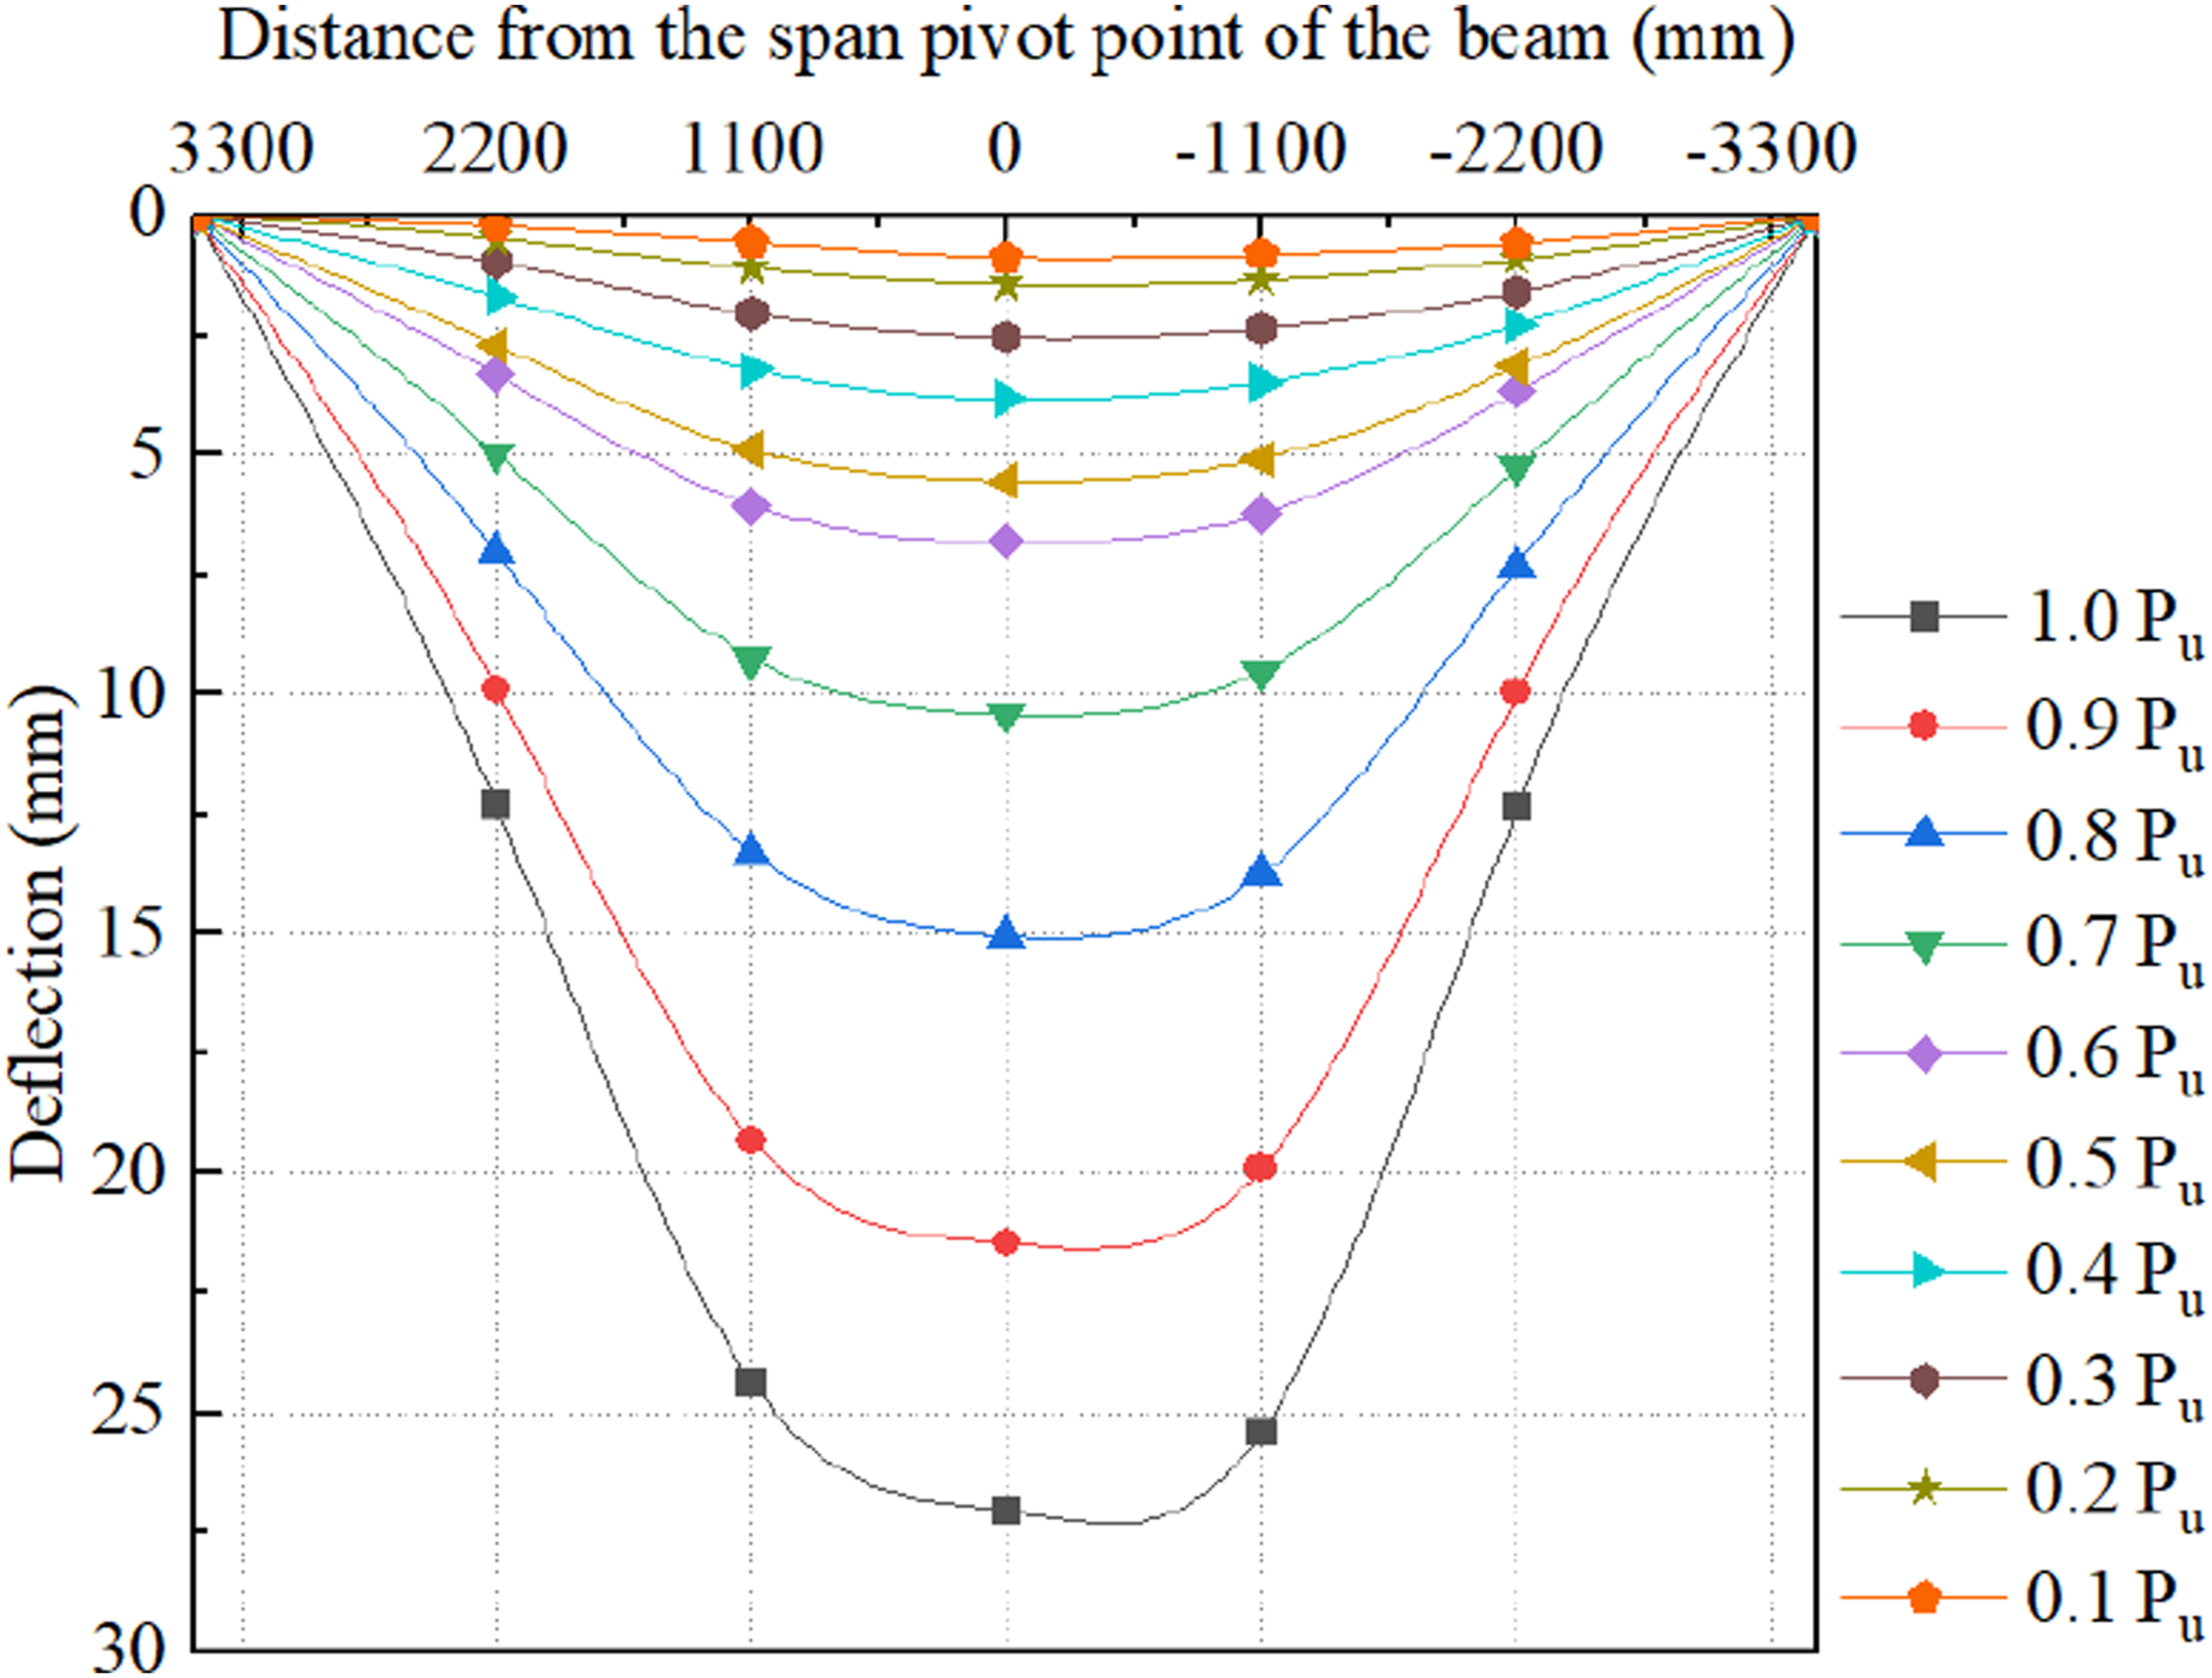
Reinforcement strains
The analysis of the strain variation law of the reinforcement can study the stressing mechanism of the test beam. In this study, the strains of hoop reinforcement and bottom longitudinal reinforcement of the test beam were tested, and the arrangement of strain gauges and their corresponding numbers are shown in Figure 7(a) and (b) shows the load-strain curves of the bottom longitudinal reinforcement of the test beam. It is easy to see that the strain of the reinforcement at each position shows a linear growth trend at the beginning of the test loading. The first turning point of the curve occurs at the location of the initial cracking load, and the slope of the strain growth of the reinforcement in the span of the test beam decreases. However, in the key-tooth connection region, the slope of the reinforcement strain increases at L-2 and L-1 with a linear growth trend. At a load of about 700 kN, when the reinforcement is about to reach the yielding stage and the prestressing tendons start to bear mainly the tensile forces, the strain of L-1 reinforcement at the area of the negative key teeth increases abruptly while the strain rate of L-2 reinforcement at the area of the positive key teeth does not change significantly. This indicates that at this time, the deformation damage of the longitudinal reinforcement at the L-1 position of the negative bond tooth is larger. Test beam steel strain gauge arrangement and load-strain curve of bottom longitudinal bars. (a) Longitudinal reinforcement, hoop strain gauge arrangement. (b) Load-strain curve of the longitudinal reinforcement at the bottom of the test beam.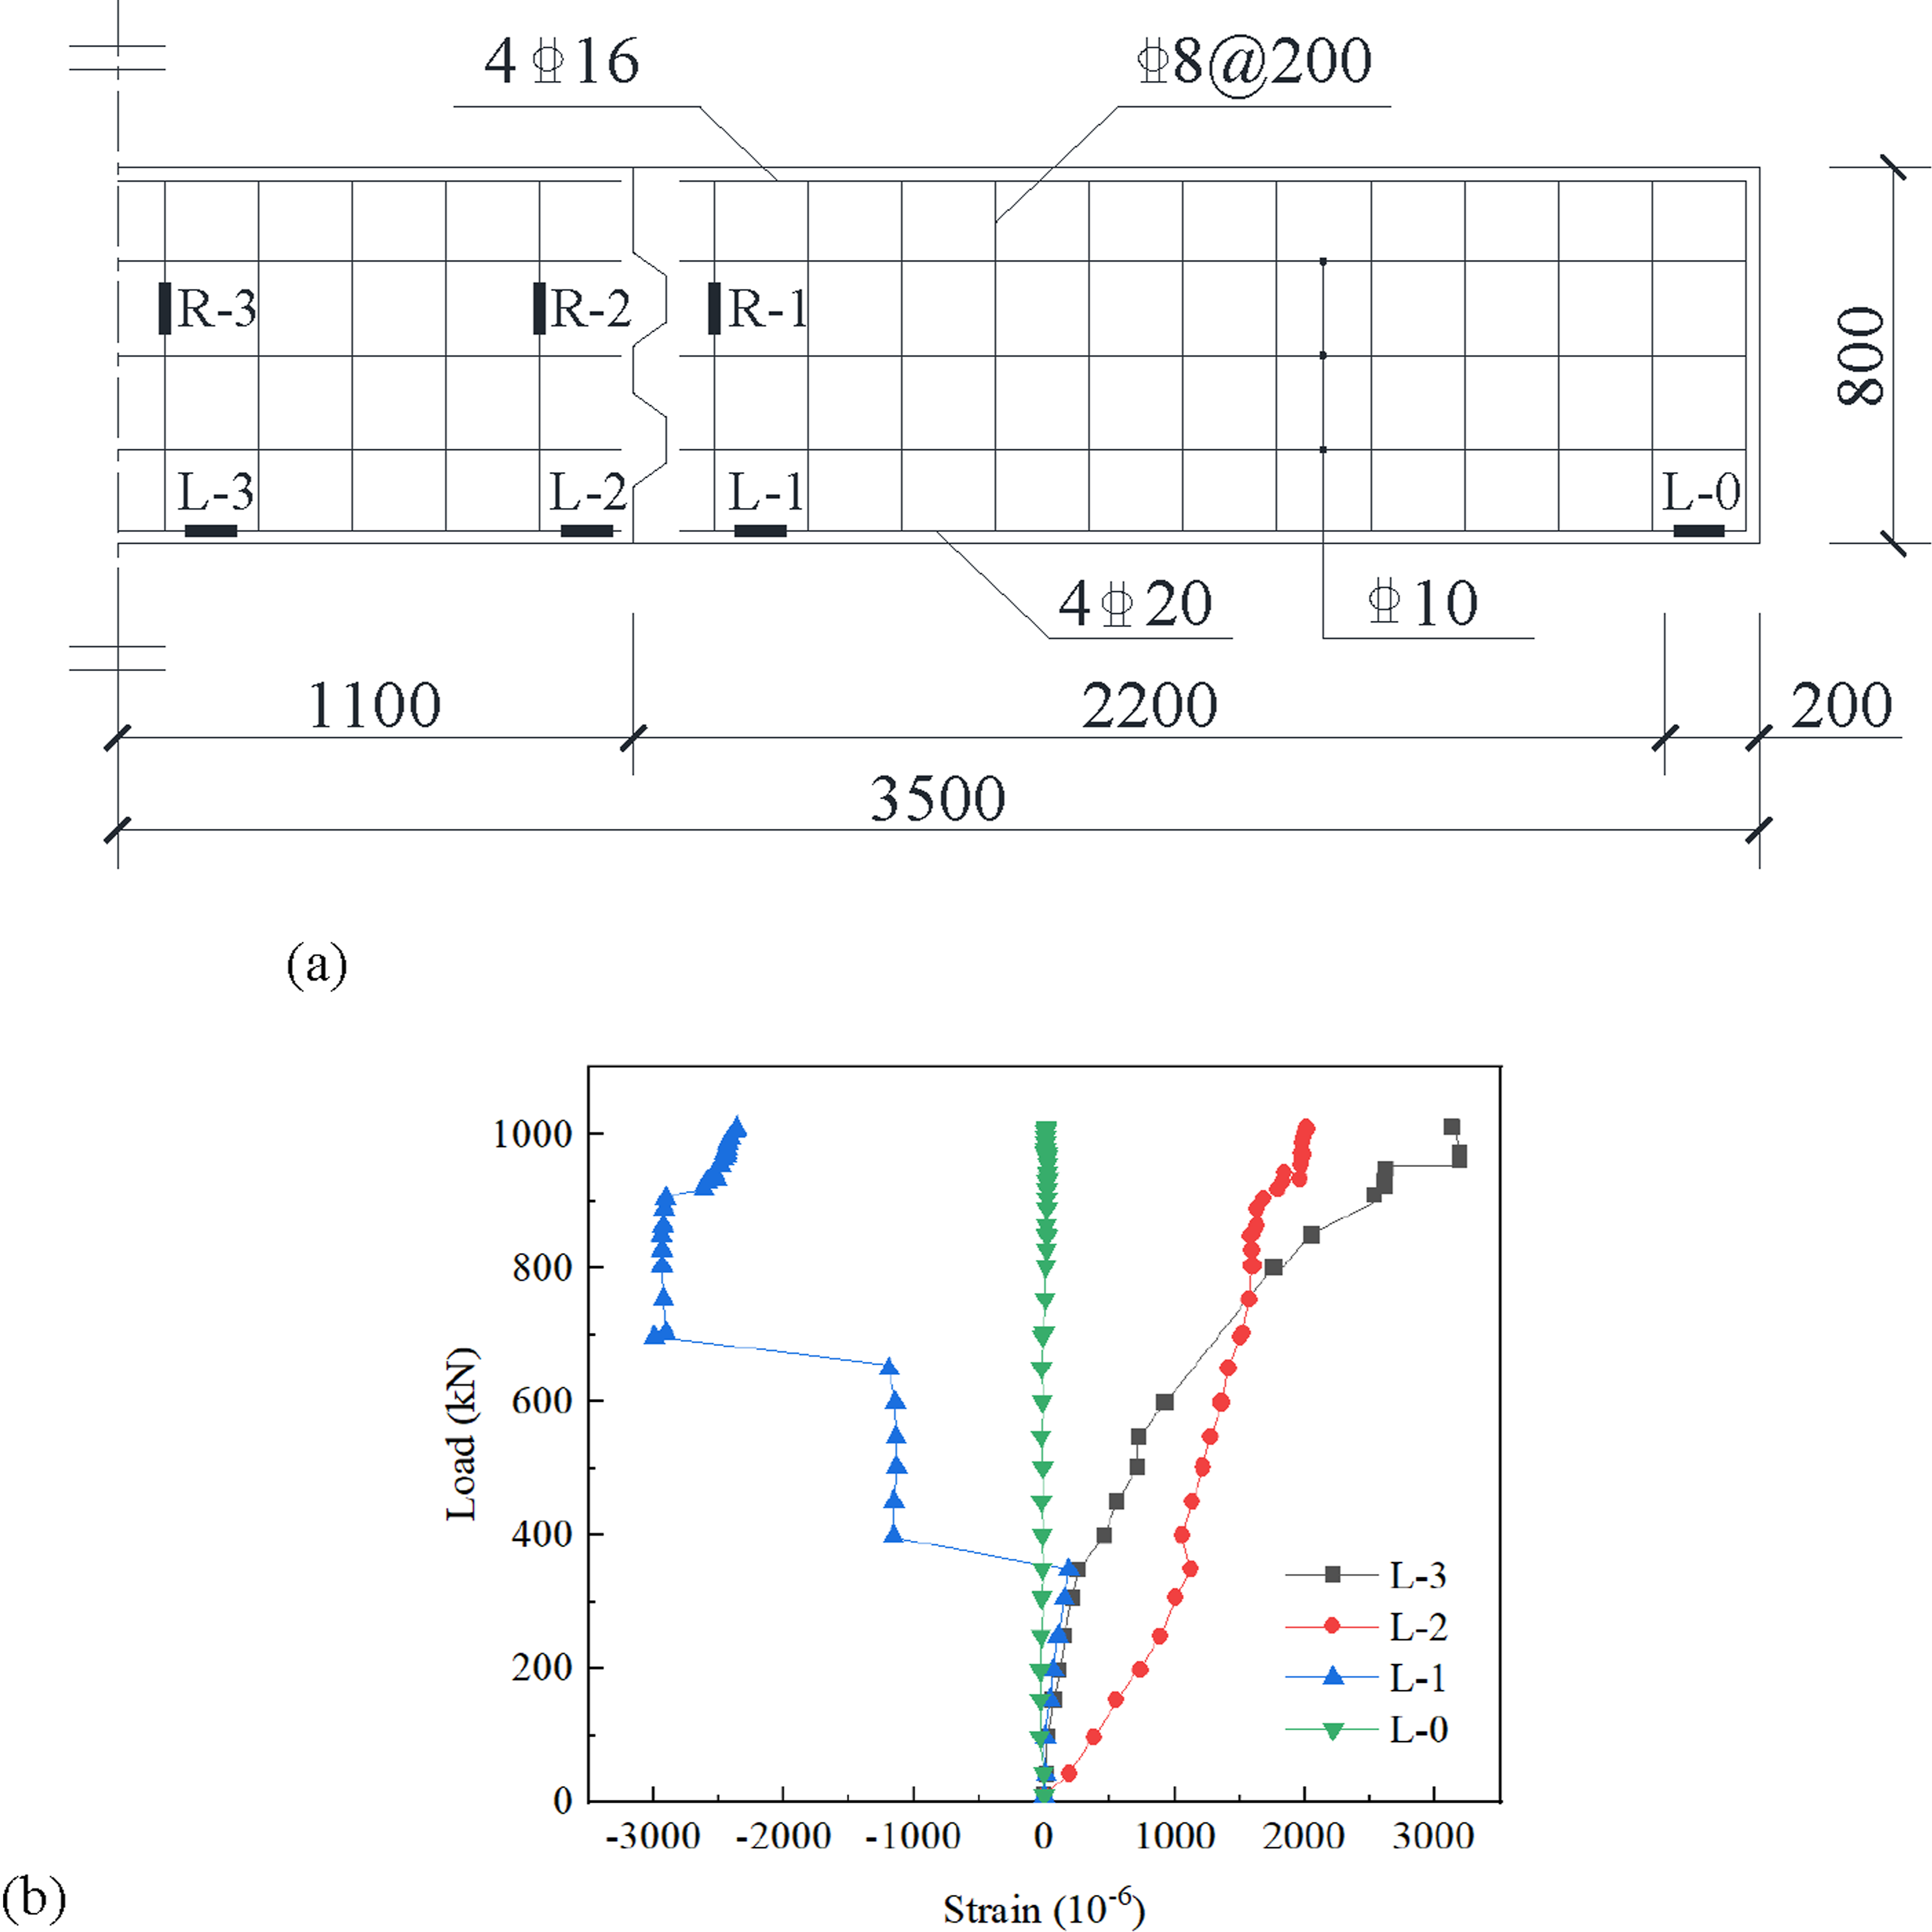
The main role of hoop reinforcement in reinforced concrete beams is to link the tensile reinforcement and the concrete in the compression zone so that they act together to withstand the shear force. Figure 8 shows the load-strain curve of the hoop reinforcement in the test beam. The variation of the hoop strain reflects the deformation process of the reinforcement here under stress. Around the initial cracking load (400 kN), there is a sudden increase in the hoop strain at position R-2, and the hoop is deformed considerably by the shear force. In addition, at around 700 kN, when the reinforcement mainly bears the tensile force, R-1 and R-2 are the key teeth connection positions. The key teeth here are in the weaker position, and the hoop strain increases due to the concrete cracking at this position where the hoop bears the oblique shear force. Load-strain curve of hoop reinforcement of test beam.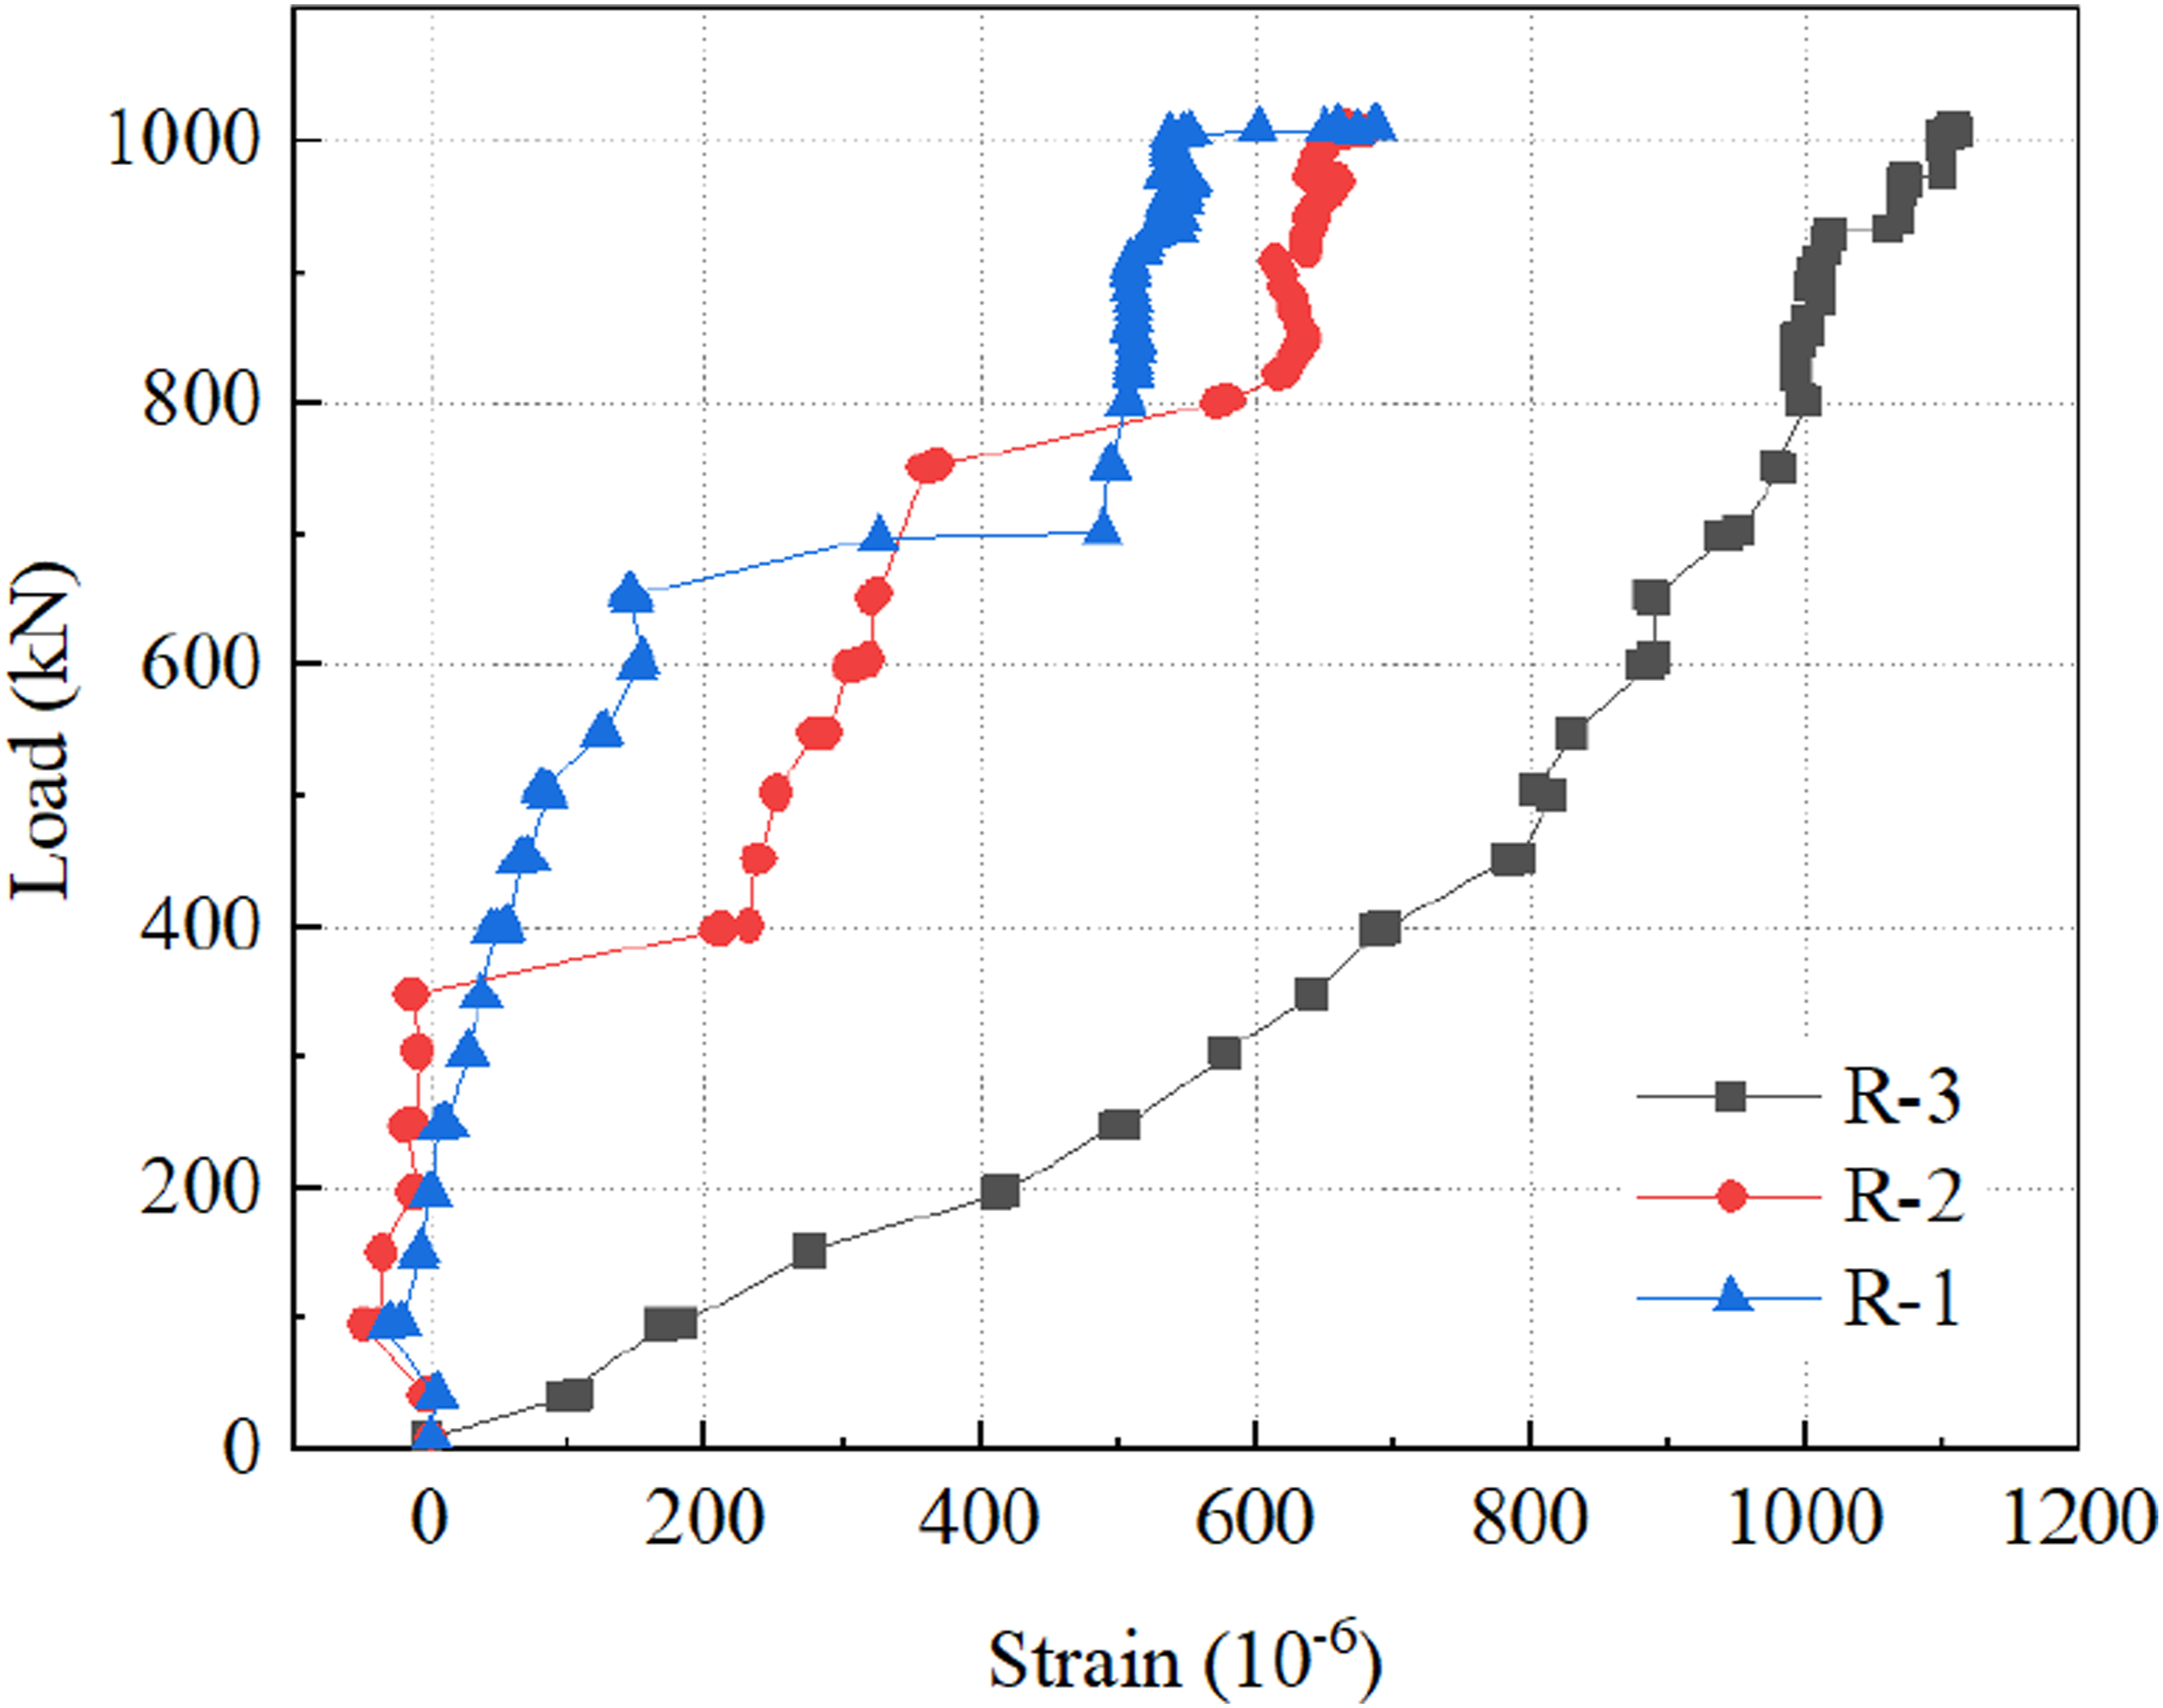
Combining the load-strain curves of the test beam longitudinal reinforcement (Figure 7) and hoop reinforcement (Figure 8), it can be found that the large key-tooth spliced prestressed concrete cover beam in the four-point bending test, except for the mid-span, which exhibits obvious typical shear damage, in the key-tooth splice region, as the load increases, after the initial cracking load (after the concrete cracks), the splice section tension is shared by the concrete and reinforcement, and the reinforcement strain changes abruptly and undergoes obvious deformation. At the later stage of loading, the concrete in the key-tooth part of the test beam basically quit working, and the tensile force was mainly borne by the reinforcement, and the prestressing tendons played a certain tensile role, and the reinforcement at the key-tooth area increased abruptly, and obvious deformation occurred at this time.
Concrete strain
The strain gauges were arranged at the locations of the spliced negative and positive key teeth of the test beam sections, and the strain gauge numbers and specific locations are shown in Figure 9(a). Combining with the load-strain curve of concrete at the position of the large bond tooth splice of the test beam in Figure 9(b), it can be found that the strain of V-2 suddenly increased at a load of about 430 kN during the test loading, which indicates that at this time, the concrete at the position of V-2 of the yin bond tooth was cracked by the compressive stress applied at the interface of the yang bond tooth. As the load increases, the strain in the concrete only increases at a slow rate; however, at about 810 kN, the strains in both the negative and positive key teeth increase and a large number of microcracks appear in the concrete at both key teeth. Since the concrete at the bond-tooth joint is under tension at this load, the strains at the V-4 position are smaller because of the separation of the concrete bond-tooth intersection. The maximum strain at position V-2 is since the interaction between the key-tooth intersection interface of the assembled section is the largest at this position, making V-2 the area with the largest force at the key-tooth intersection interface, followed by V-3. Strain gage arrangement and load-strain curve at the splice position of the large key teeth of the test beam. (a) Concrete strain gauge arrangement of test beam with large key teeth splice. (b) Load-strain curve of concrete at the splice position of large key teeth of the test beam.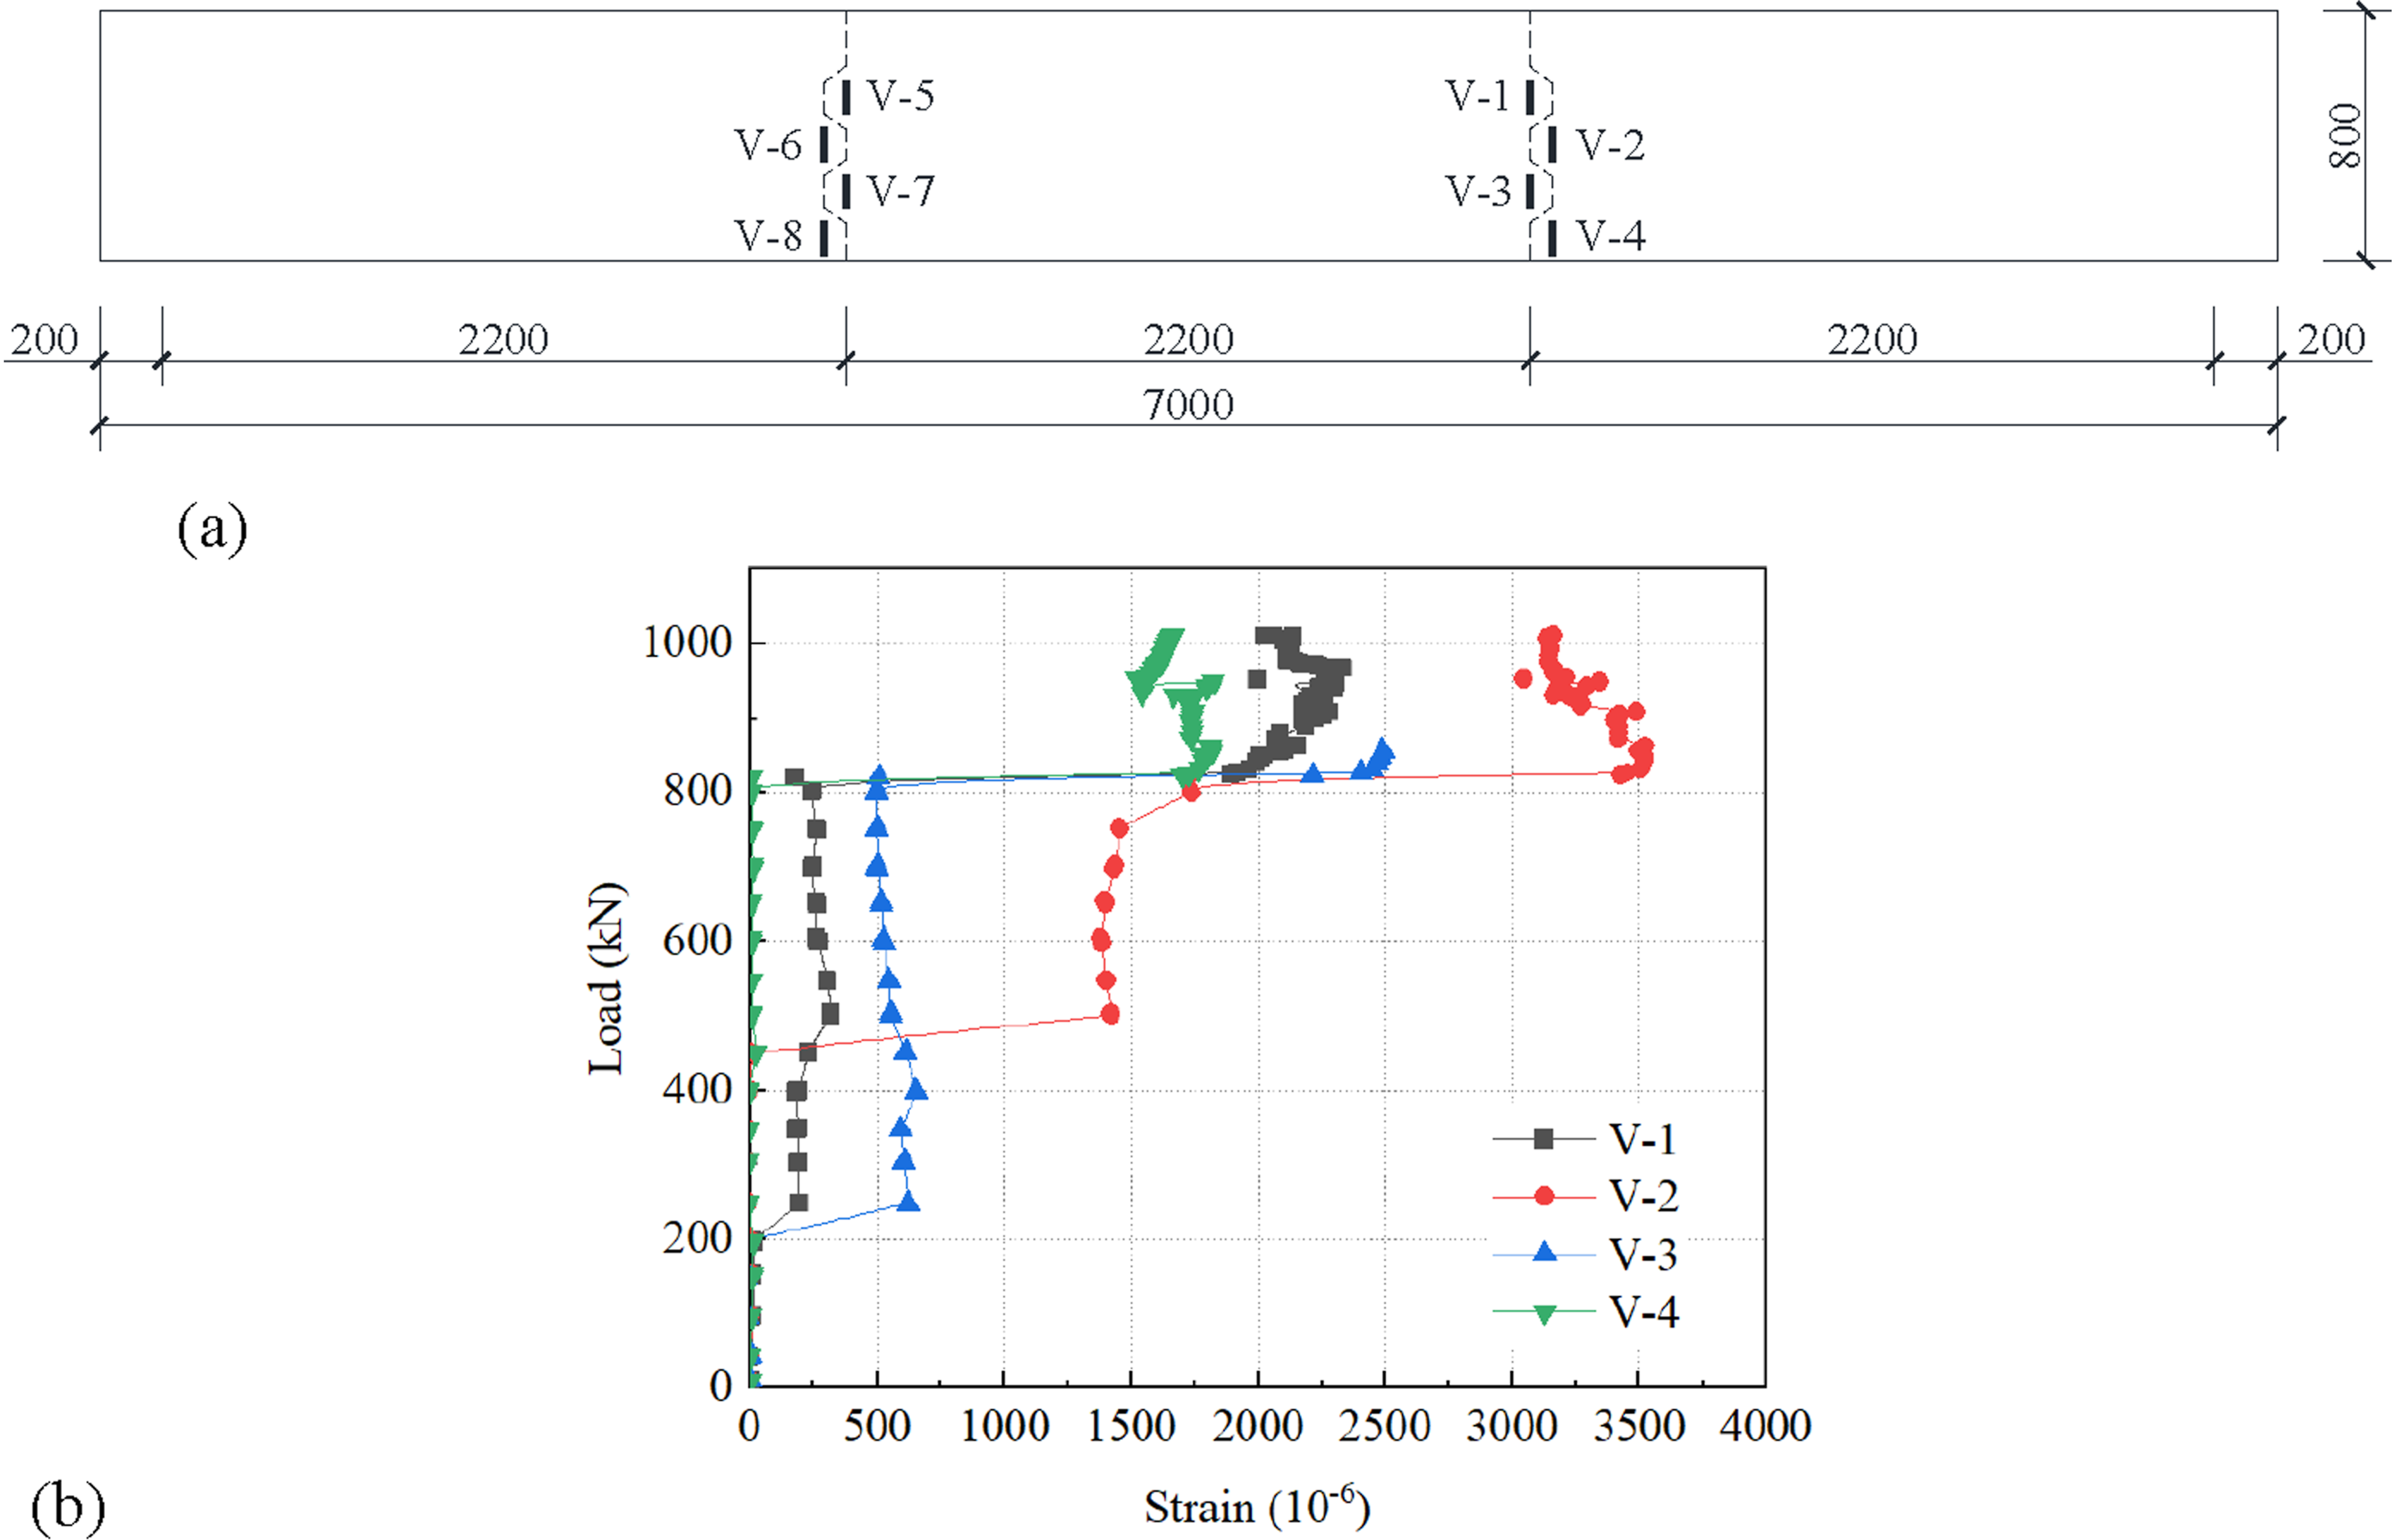
Finite element analysis
Finite element model establishment
The FEA was conducted utilizing the renowned commercial software package “ABAQUS,” a tool that has garnered substantial adoption within the research community, as exemplified by the works of Al Rawi et al. (2018) and Elani et al. (2018). The components under consideration primarily encompass concrete, various forms of reinforcement (including longitudinal reinforcement, hoop reinforcement, girdle reinforcement, and tie reinforcement), as well as prestressing tendons.
To obtain simulation results for concrete cracking a very dense mesh is required, therefore C3D8R hexahedral cells are chosen; the dialyzed frame cells are rods that can only withstand tensile loads. They cannot bear bending moments, so they are suitable for simulating the reinforcing members in the cells. Since the specimen is subjected to a large load, if the point loading method is used, it will cause the concrete near the stress point to break before the key teeth because of the stress concentration, so the C3D8R cell is used to establish the loading plate concerning the actual test.
In this modeling process, the concrete, loading block, and support are used 8-node solid unit C3D8R, the prestressing tendons and rebars inside the concrete are used truss unit T3D2, the rebars inside the concrete are connected to the concrete at both ends of the key teeth respectively through the embedded connection, the loading end and the structure are used in the way of bundling (Tie) connection, and the top surface of the upper loading end and the points are subjected to the kinematic coupling.
In FEA, the mesh size will have a large impact on the FEA results. In FEA, the mesh size is too large to reflect the real force and damage of the key teeth, while too small a mesh will make the calculation time increase exponentially and convergence tends to be difficult. In this experiment, the mesh size of the model beam is selected as 50 mm to ensure the calculation accuracy of the model and improve the calculation efficiency, concerning the existing research (Abid S R et al., 2021; Krauthammer T and Otani R K, 1997). Figure 10 shows the three-dimensional finite element model. The loading method is displacement loading, applied at the coupling point on the top surface of the loading end. Three-dimensional finite element model. (a) Loads and boundary conditions applied to the finite element model. (b) 3D finite element model reinforcement.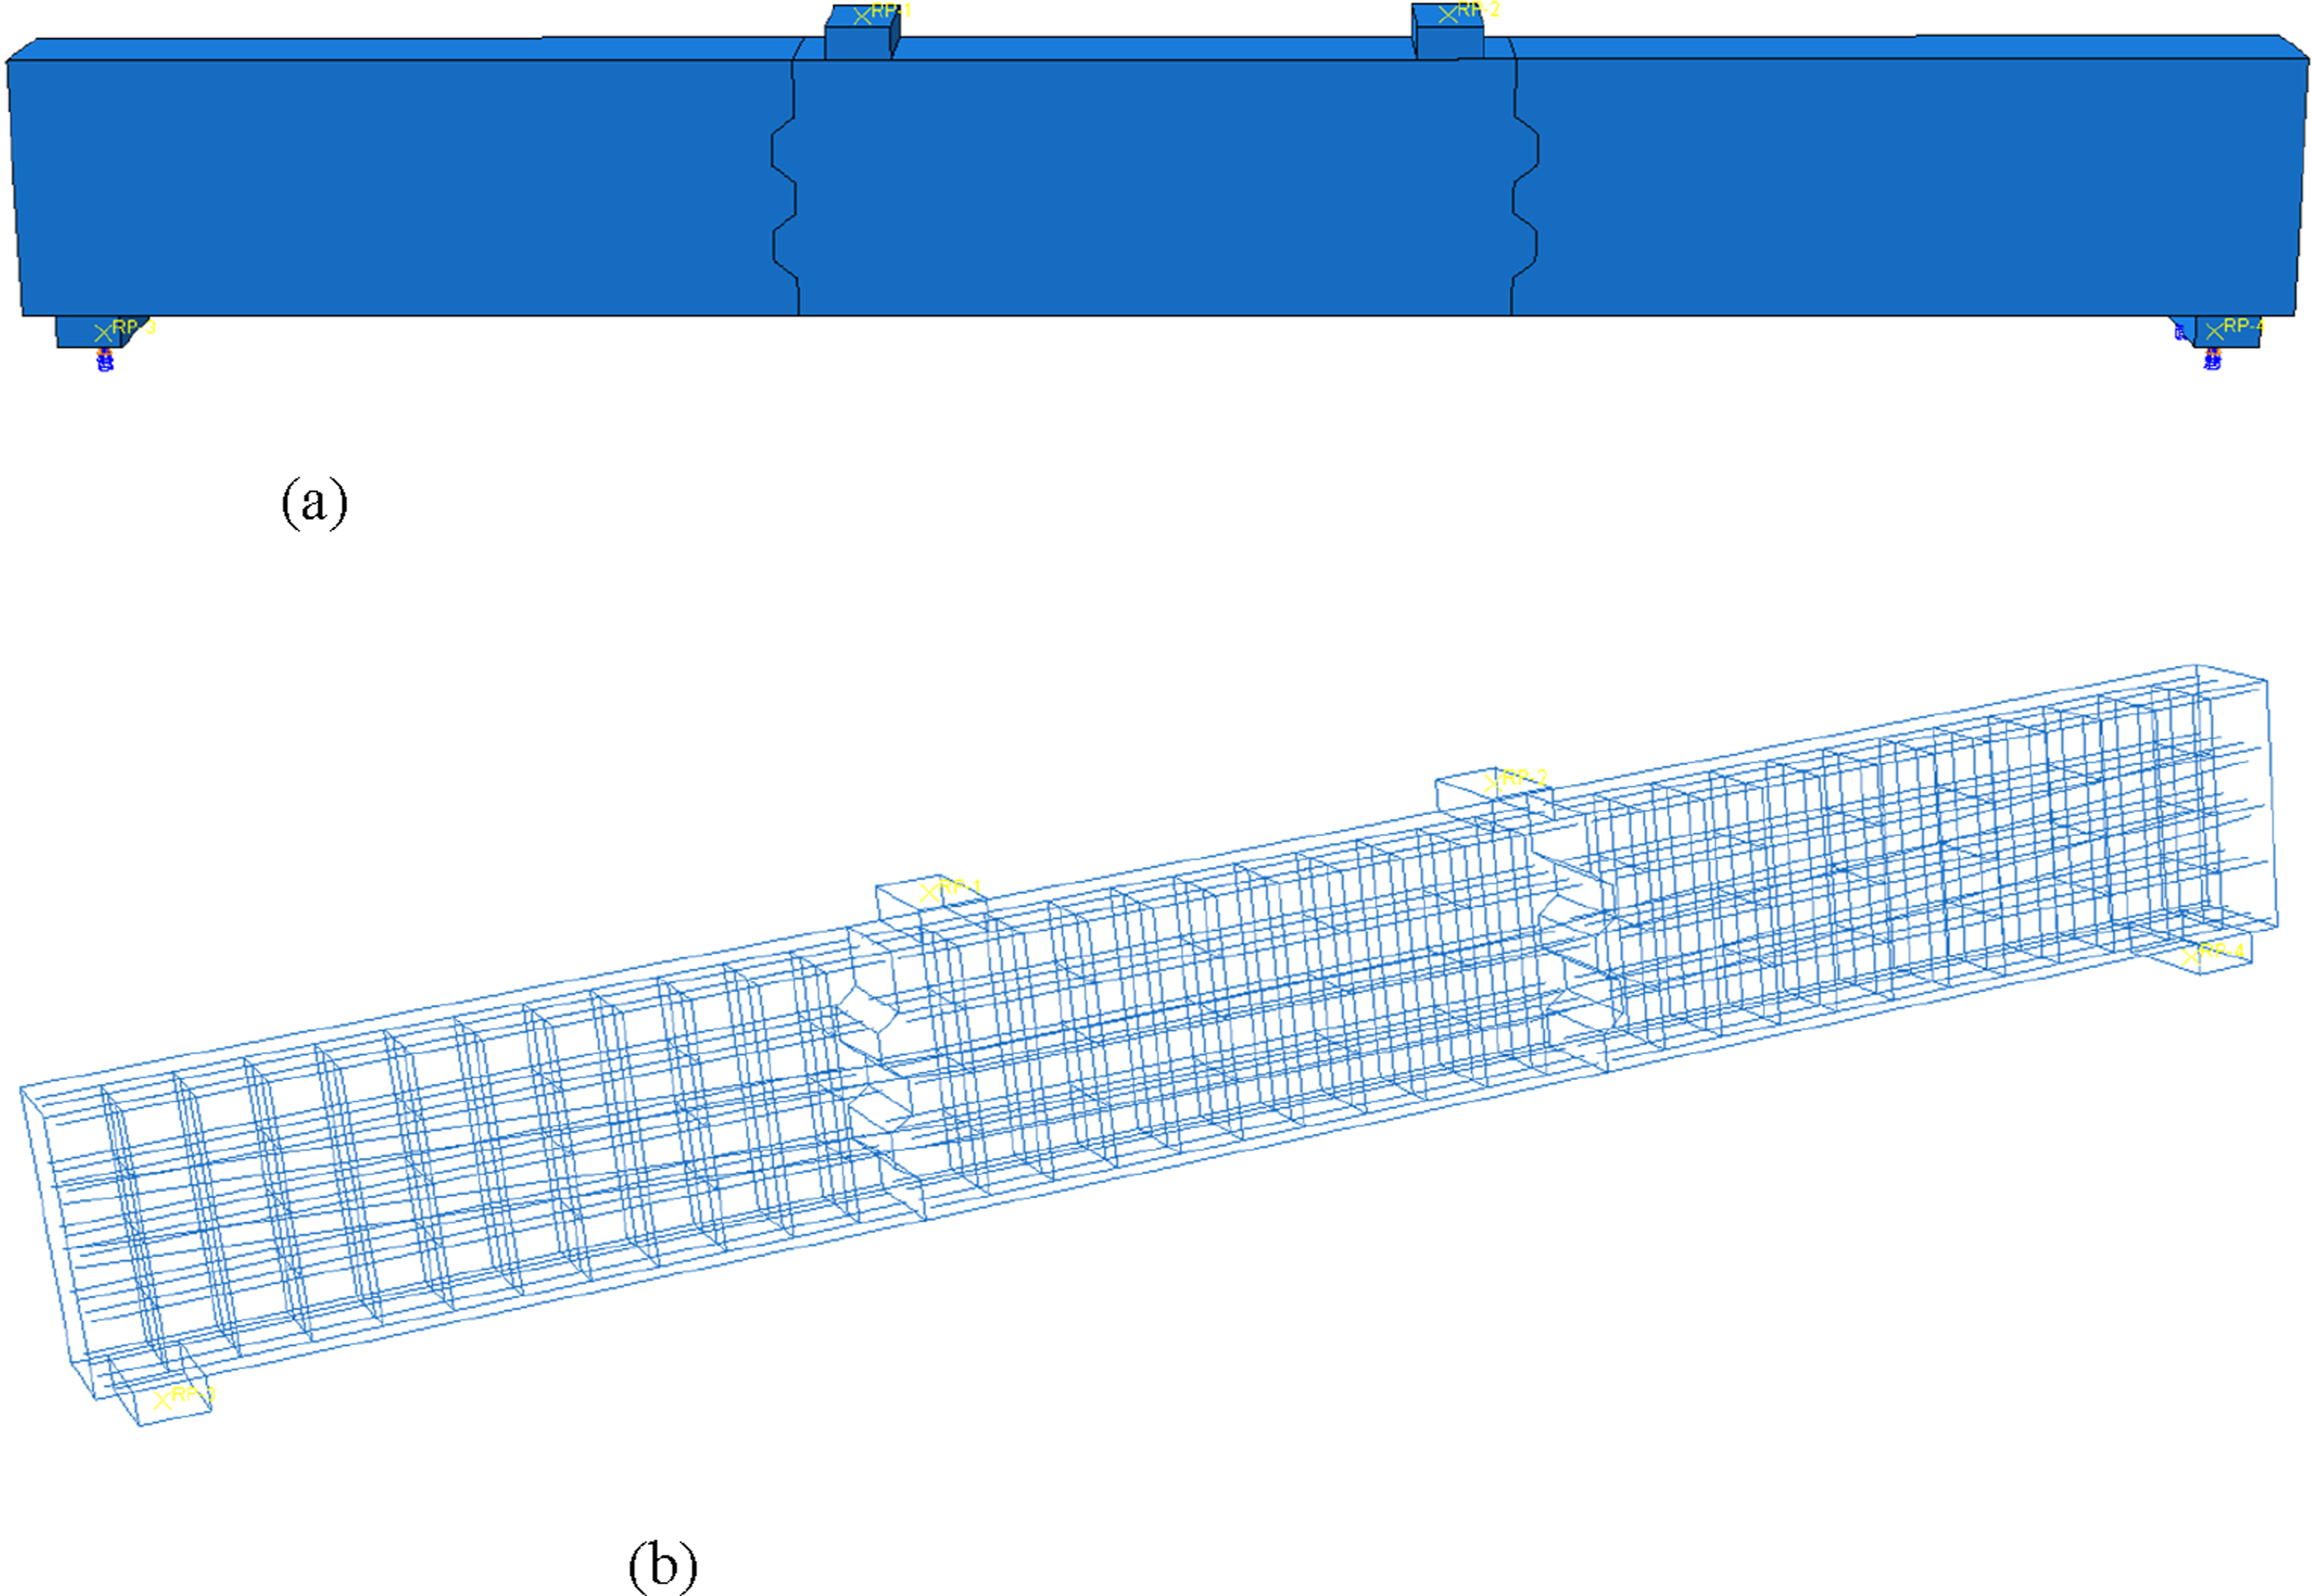
To more accurately simulate the contact relationship of each component and unit of the large bond-tooth assembled prestressed cover beam, it is necessary to make a reasonable selection of the contact surface settings between each unit to ensure the accuracy of the model and improve the calculation efficiency (Alkayem et al. (2018); Seventekidis et al. (2020)). The friction between the key teeth and the compression and shear effects are modeled by defining the Surface to Surface Contact (SSC). The contact between key tooth joints consists of Tangential Behavior and Normal Behavior, to facilitate the convergence, both Normal Behavior and Tangential Behavior are adopted as penalty functions. The friction coefficient of tangential contact is taken as 0.618 concerning the test and is set as finite slip mode.
Material ontology model
The reinforcement principal structure model adopts the ideal elastic-plastic model, and its principal structure relationship is elastic-plastic. Because of the complex and diverse material properties of concrete, a more accurate description of the concrete and damage is required during the FEA. In this study, the concrete plastic damage model (CDP) is used to simulate and investigate the shear capacity of concrete key teeth. Based on the use of the CDP model, the concrete compressive stress-strain as well as tensile stress-strain ontological relationships and damage factors are calculated based on the following equations. The parameters characterizing the yield function and the flow potential function of the CDP model are chosen as follows: the expansion angle, the eccentricity of the flow potential, and the viscosity parameter are set to 36, 0.1, and 0.0015, respectively, the ratio of the biaxial to the uniaxial initial yield strength, σb0/σc0, is 1.16, and the ratio of the second stress invariant of the tensile and compressive meridional surfaces, Kc, is 0.6667. In this study, it was determined that the concrete was divided into compressive and tensile principal structure relationships.
The equation used for the compressive principal structure model of the test beam is as follows (Li et al. (2010)):
The equation used for the tensile principal structure model of the test beam is as follows (Dugat et al. (1996)):
In the simulation, the stress-strain relationship of reinforcement bars and rebars is selected as the bilinear model, the stress-strain curve of reinforcement bars is based on the modulus of elasticity and yield strength of HRB400-grade reinforcement bars stipulated in the specification, and the yield strength corresponds to the peak stress of the bilinear reinforcement strength model; rebars are also adopted in the bilinear model, and the peak strength is the strength of M8 steel provided by the manufacturer.
In ABAQUS, there are three kinds of prestressing force application methods, namely, cooling method, initial strain method and rebar initial stress method, and the text adopts the cooling method to apply prestressing force to the prestressing tendons. First of all, the coefficient of thermal expansion is defined in the material parameter of the prestressing tendon, and the coefficient of thermal expansion along the length of the reinforcement (alpha33) is defined as 1.2 × 10⁻⁵ in the option of setting the prestressing tendon to be an Orthotropic material. The model also uses the cooling method to apply the prestressing force, and the temperature parameters are calculated as in the following equations:
The stress distribution of each component (concrete, reinforcement, and prestressing tendons) in the finite element model beam at the final damage under the design load is shown in Figure 11. It can be found that at the final damage of the large key-tooth assembled prestressed concrete cover beam, the concrete in the compression zone has been crushed and there is no significant change in the stress values of the concrete components (Figure 11(a)). The tensile reinforcement yielded and plastic deformation occurred, and the prestressing tendons (Figure 11(c)) were subjected to a large tensile stress. It is obvious that the concrete of the model beam is damaged when the yielding load is reached, and the main tensile stresses are mainly distributed at the end reinforcement of the key teeth and the tensile section of the prestressing tendons. Comparing the stress cloud of the model beam (Figure 11) with the damage pattern of the test beam (Figure 4), it can be found that the established finite element model is consistent with the actual damage pattern of the test. Stress cloud diagram of each component. (a) Concrete stress cloud diagram. (b) Steel stress cloud. (c) Prestressing tendon stress cloud.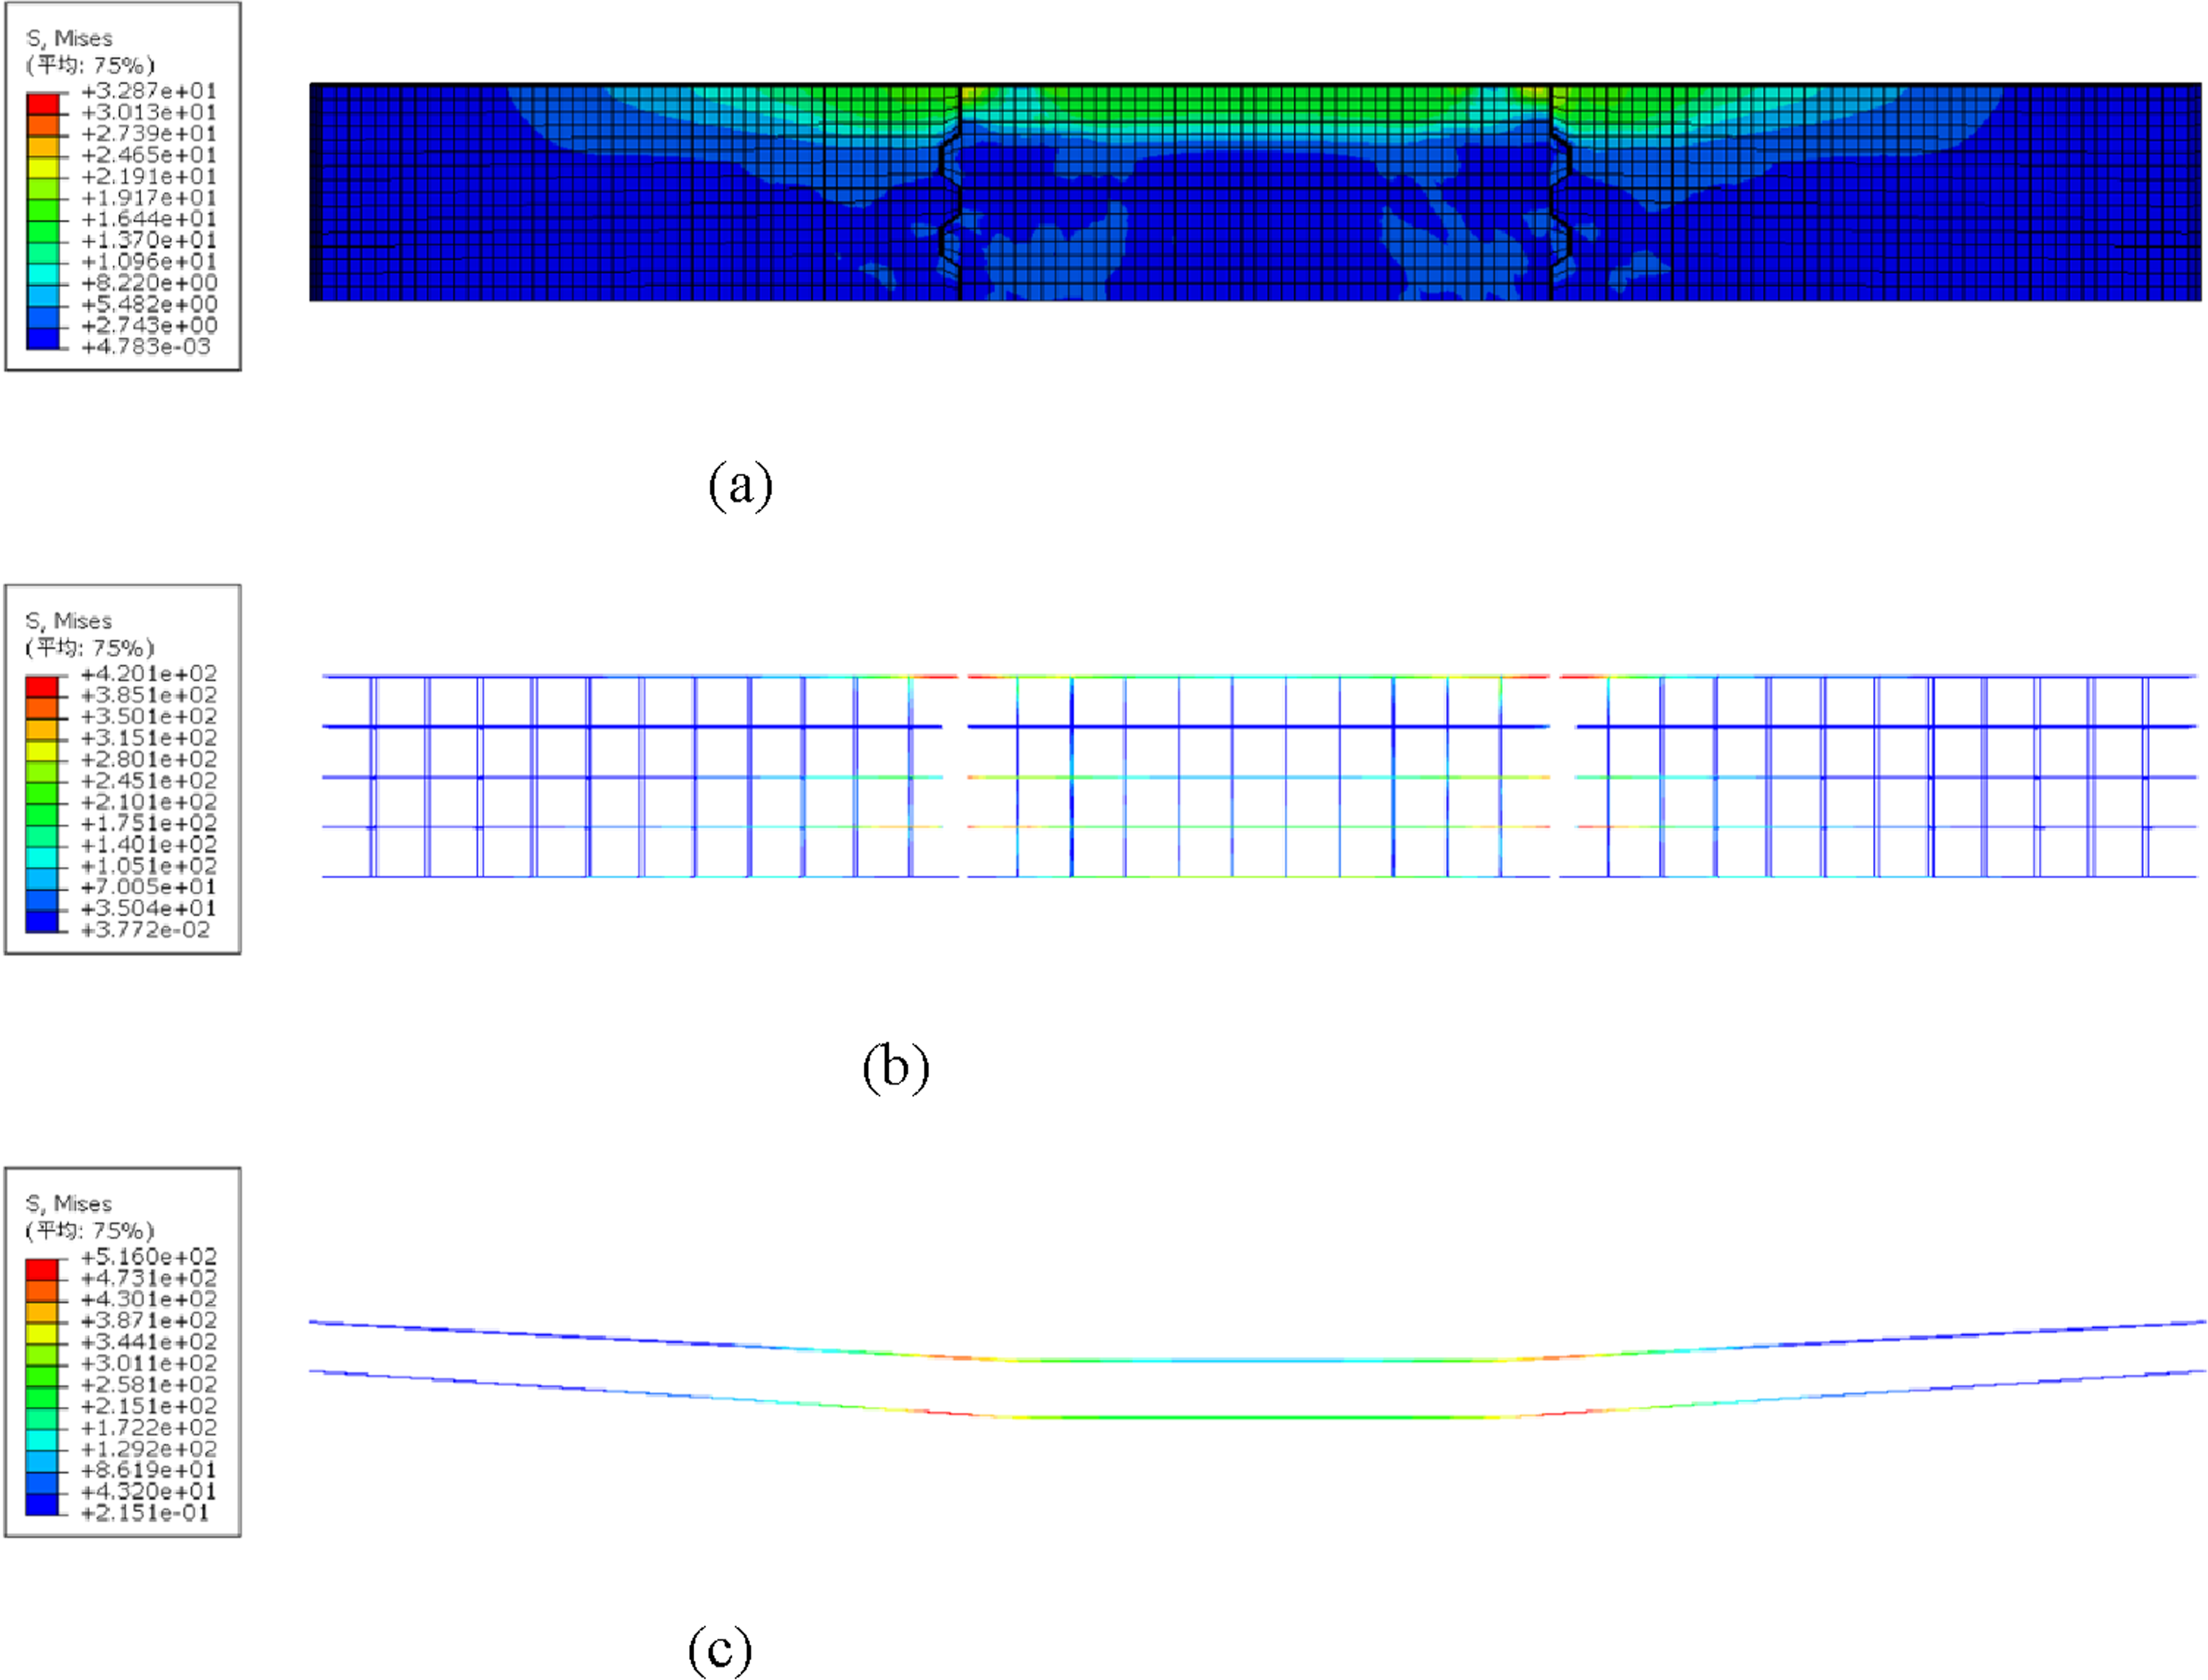
To further understand the internal damage of the large key-tooth spliced prestressed concrete beam, a free-body section of this model beam was established, and its selected section location and corresponding plastic strain distribution are shown in Figure 12. At the time of damage, the maximum plastic strain at the splice location of the beam key teeth appears at the bottom of the key teeth in the concrete tension zone, and the tensile stress runs through the root of the key teeth, and the concrete of the tensioned key teeth at the joint is in a crushed state, forming an oblique shear surface, at which time the key teeth are sheared off. Comparison of the cross-section plastic strain distribution (Figure 12) with the damage mode of the large key tooth assembled prestressed concrete cover beam (Figure 4) shows that the damage modes of the model beam and the test beam are similar. Therefore, it is considered that the calculation results of the finite element model and the crack development of the test beam can be verified with each other. The distribution of plastic strain at different positions in the cross-section. (a) Side span in the middle. (b) Left side of key-tooth. (c) Right side of key-tooth. (d) Mid span.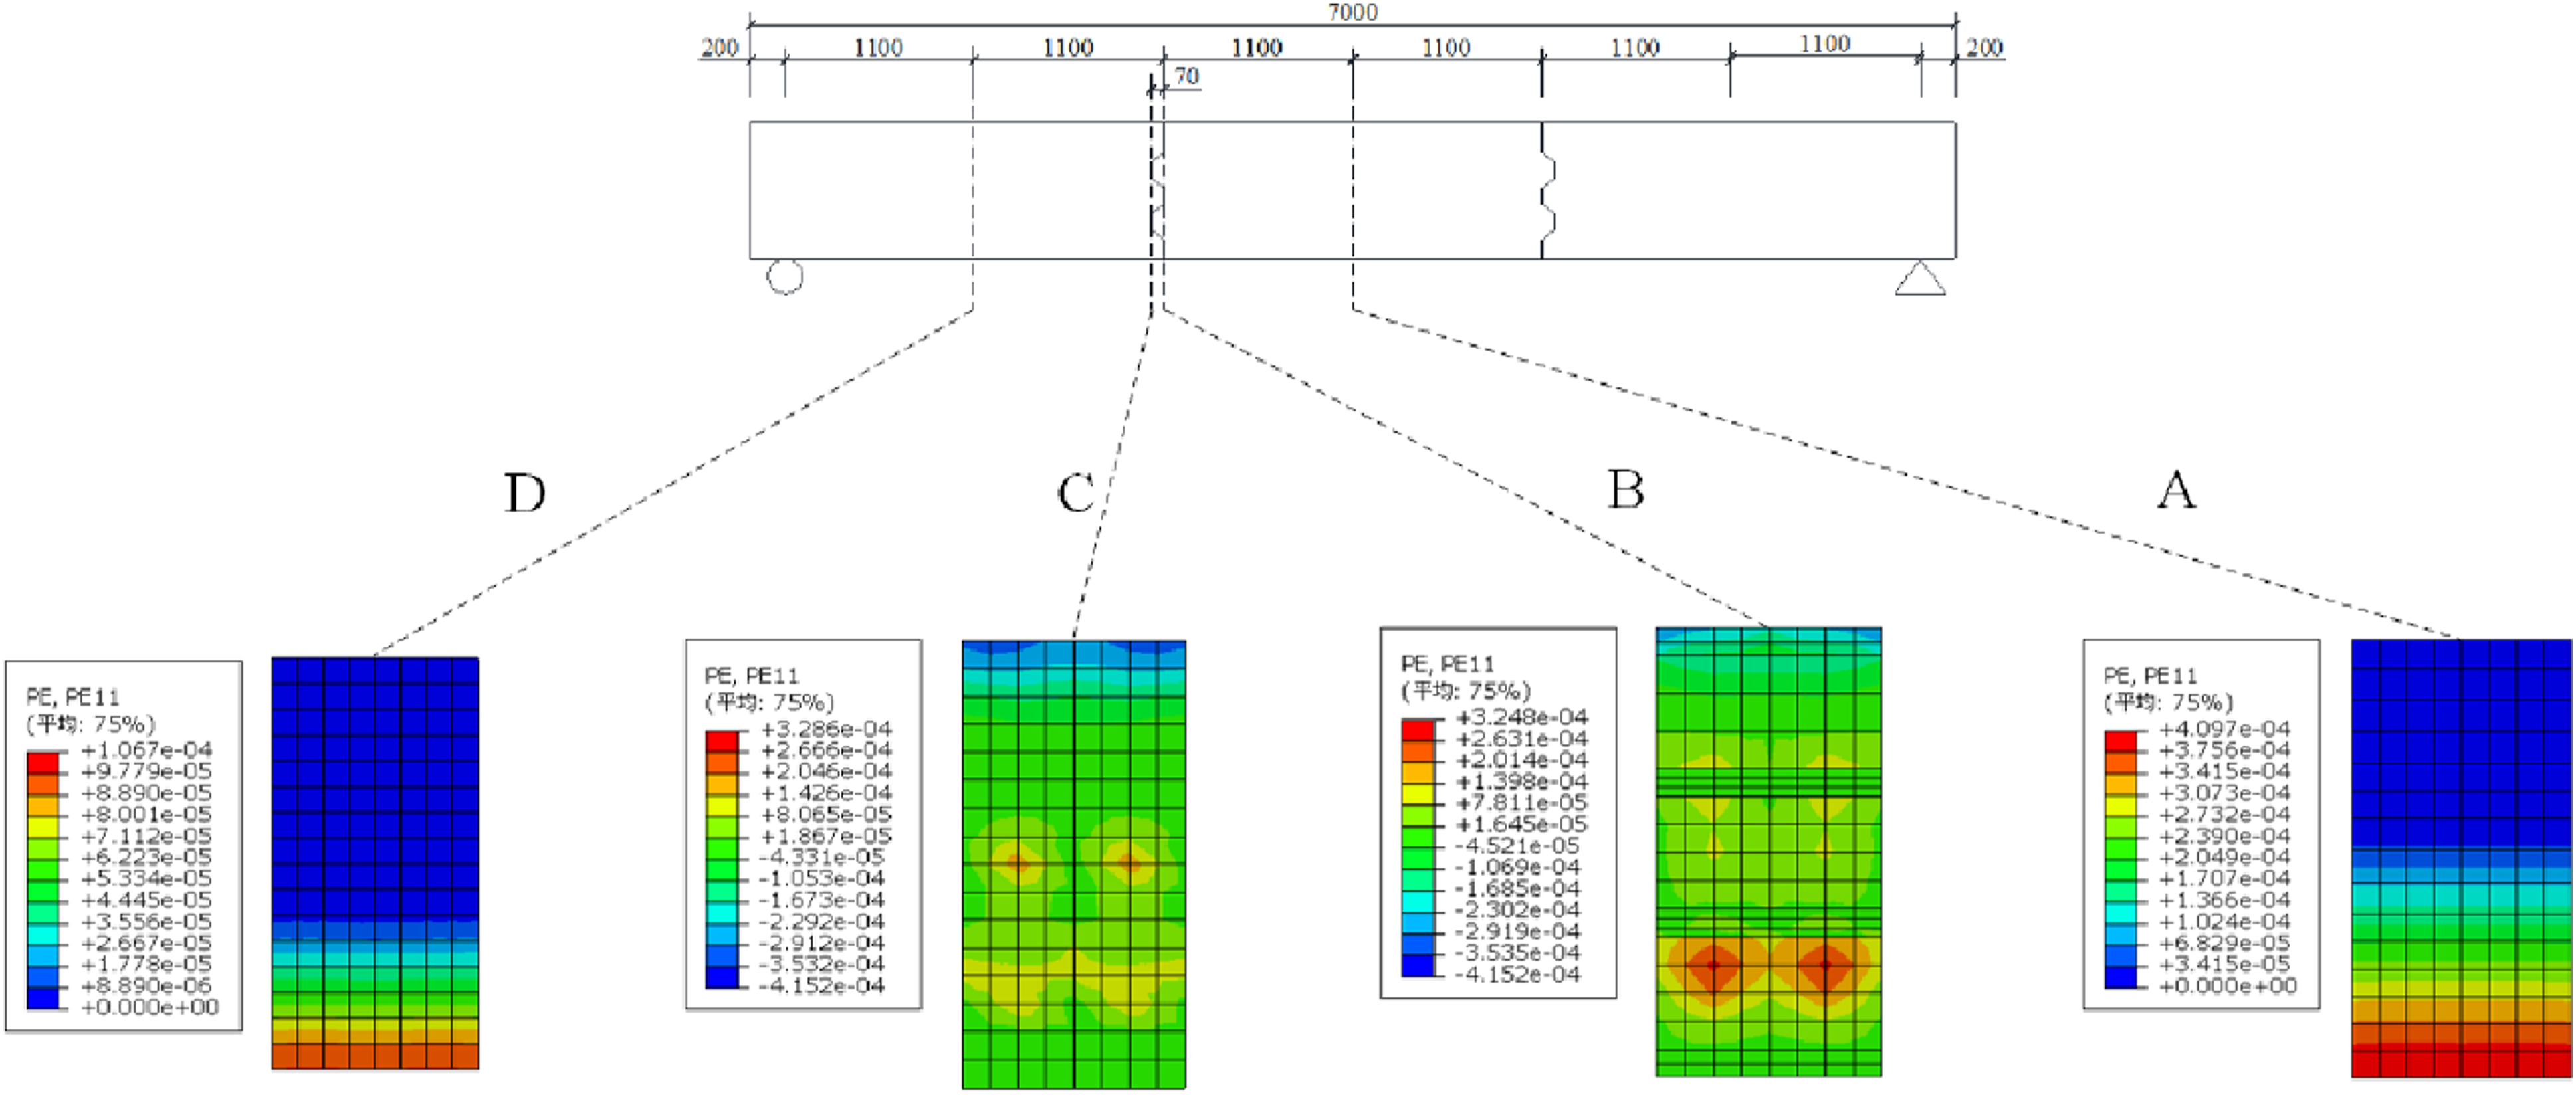
The tensile damage clouds of the concrete components of the model beam at different stages are shown in Figure 13. When the cracking load is reached, cracks perpendicular to the longitudinal reinforcement appears at the bottom of the span of the purely bending section of the beam. As the load increases, the mid-span cracks extend toward the top, while multiple cracks perpendicular to the bottom of the beam appears upward on both sides of the purely bending section in turn. In addition to this, oblique cracks appear in the shear section. With the increase of load, the diagonal cracks keep developing on both sides until the diagonal cracks develop through the beam body, leading to beam damage. Tensile damage clouds of the concrete components of the model beam at different stages. (a) Resilient stage. (b) Elasticity stage. (c) Destruction.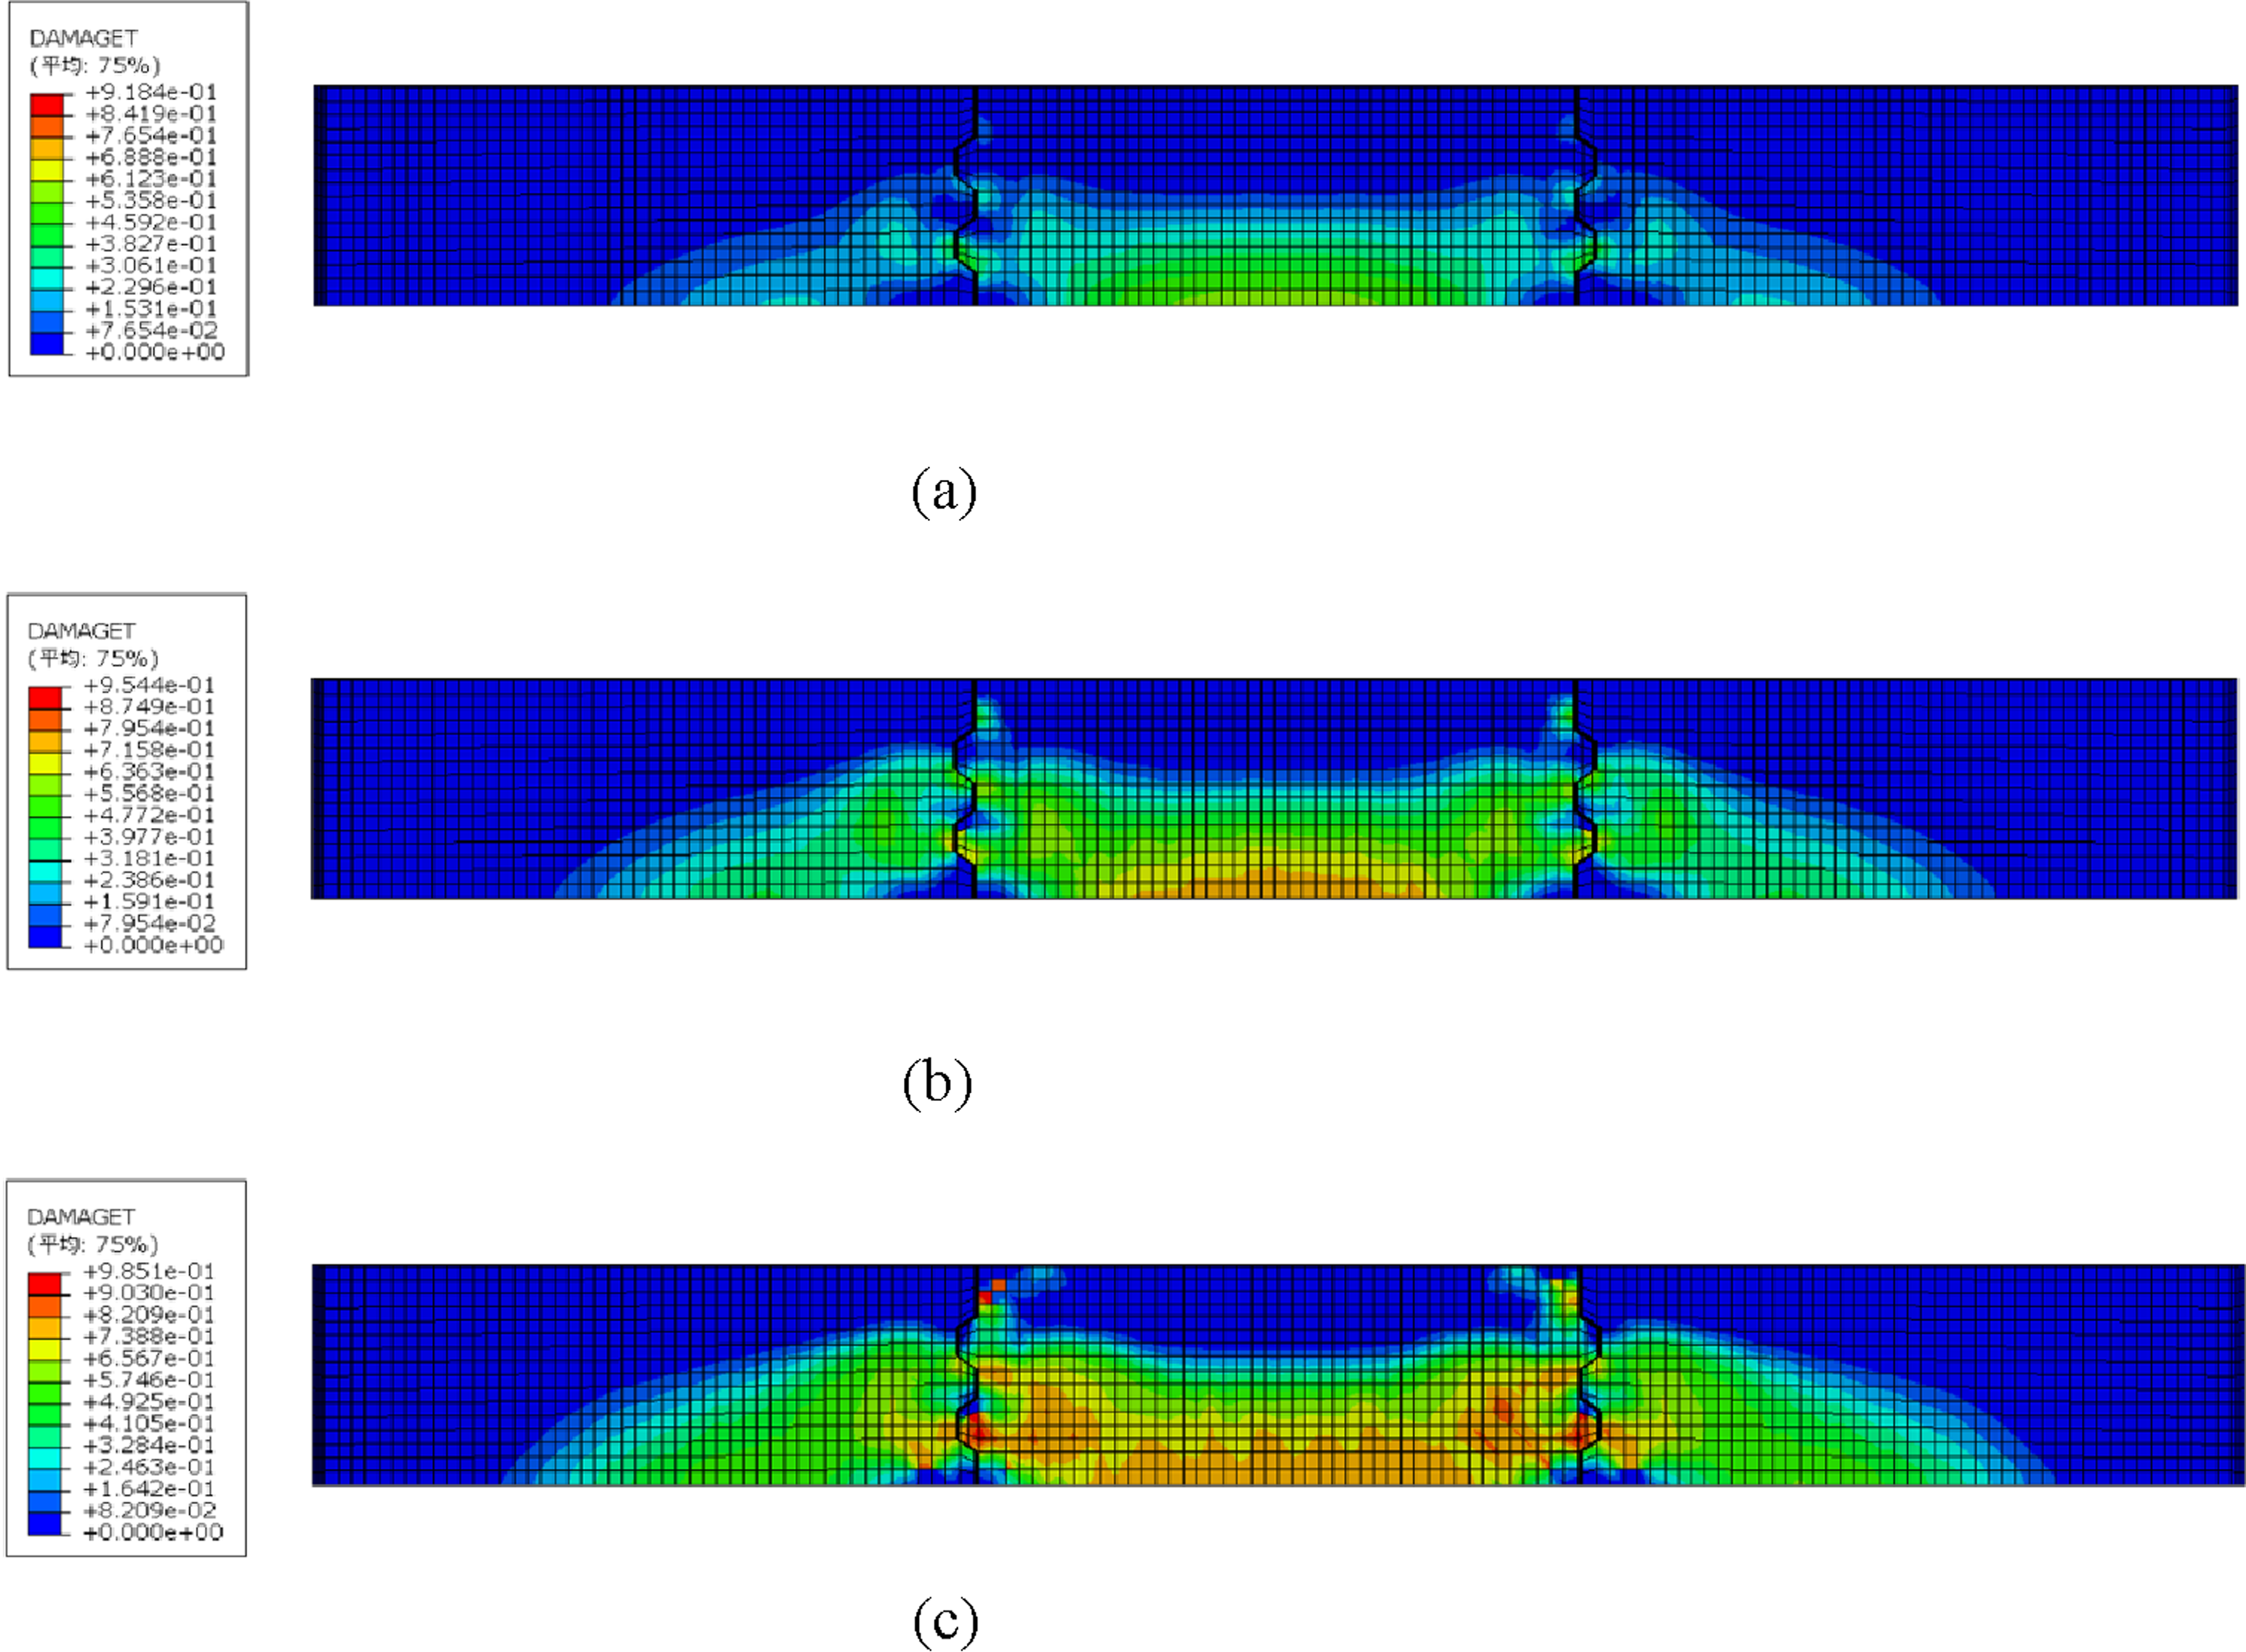
The finite element model load-displacement calculation results and the experimental load-displacement results are shown in Figure 14. When the load is 400 kN before, the FEA results are almost consistent with the curve fit of the test results. In addition, the ratio of the ultimate load test value to the finite element value is 0.989 when the ultimate load is reached, and the ratio of the test value to the finite element value is 0.848 before the ultimate load, where the difference between the test value and the finite element calculated value is the largest. The proposed FEA model can simulate more effectively and realistically the force behavior of the large bonded prestressed concrete cover beam in the loading stage until the ultimate load is reached. The load-displacement curves, crack patterns, and damage characteristics obtained from the FEA are in good agreement with the experimental results. Load-displacement curve in the span.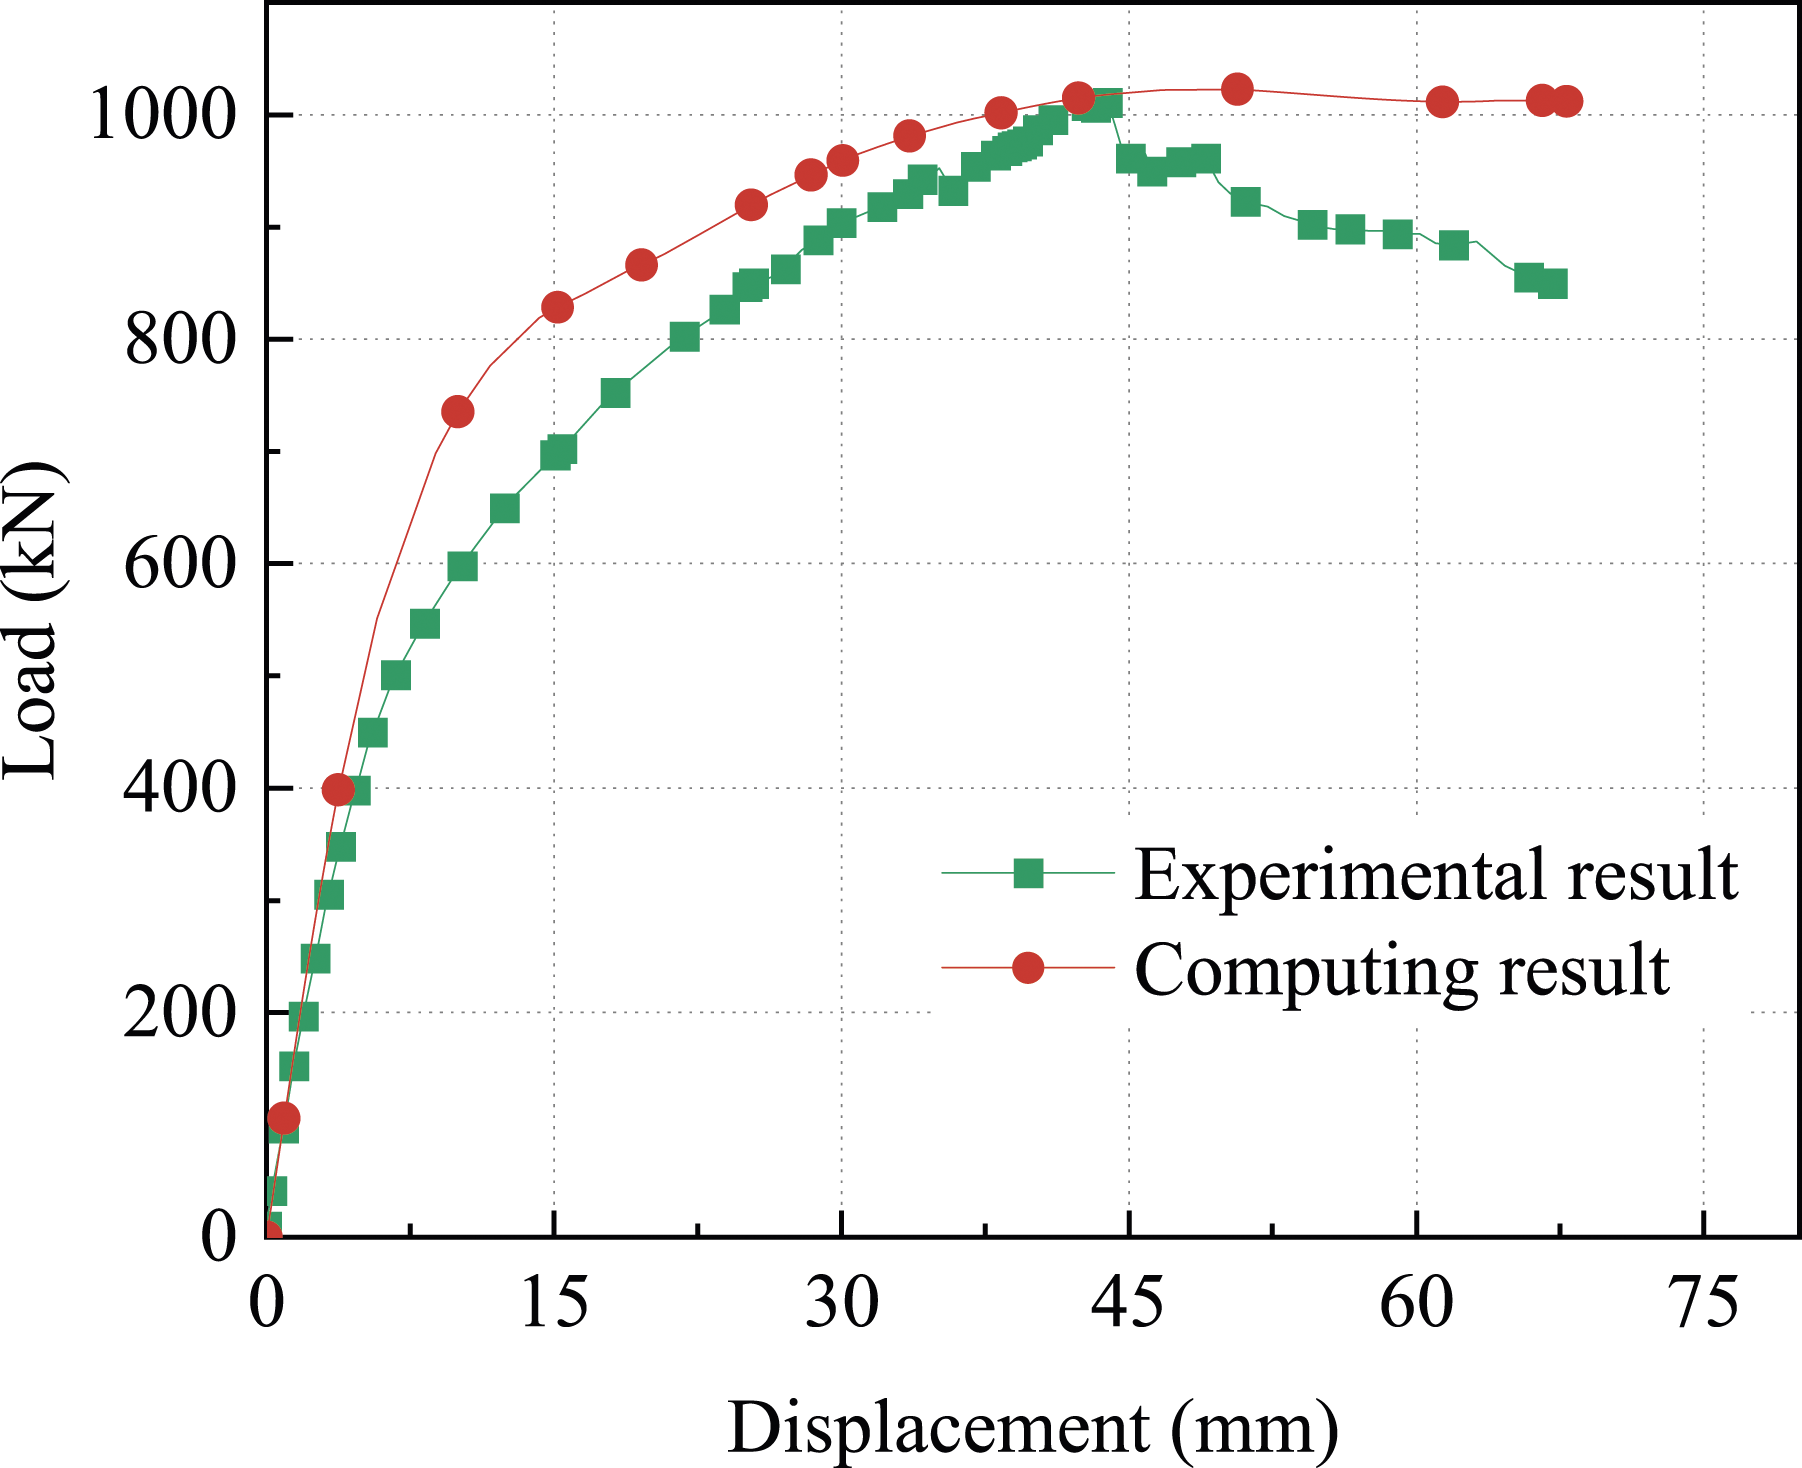
Analysis of sensitivity parameters
Key tooth depth to height ratio
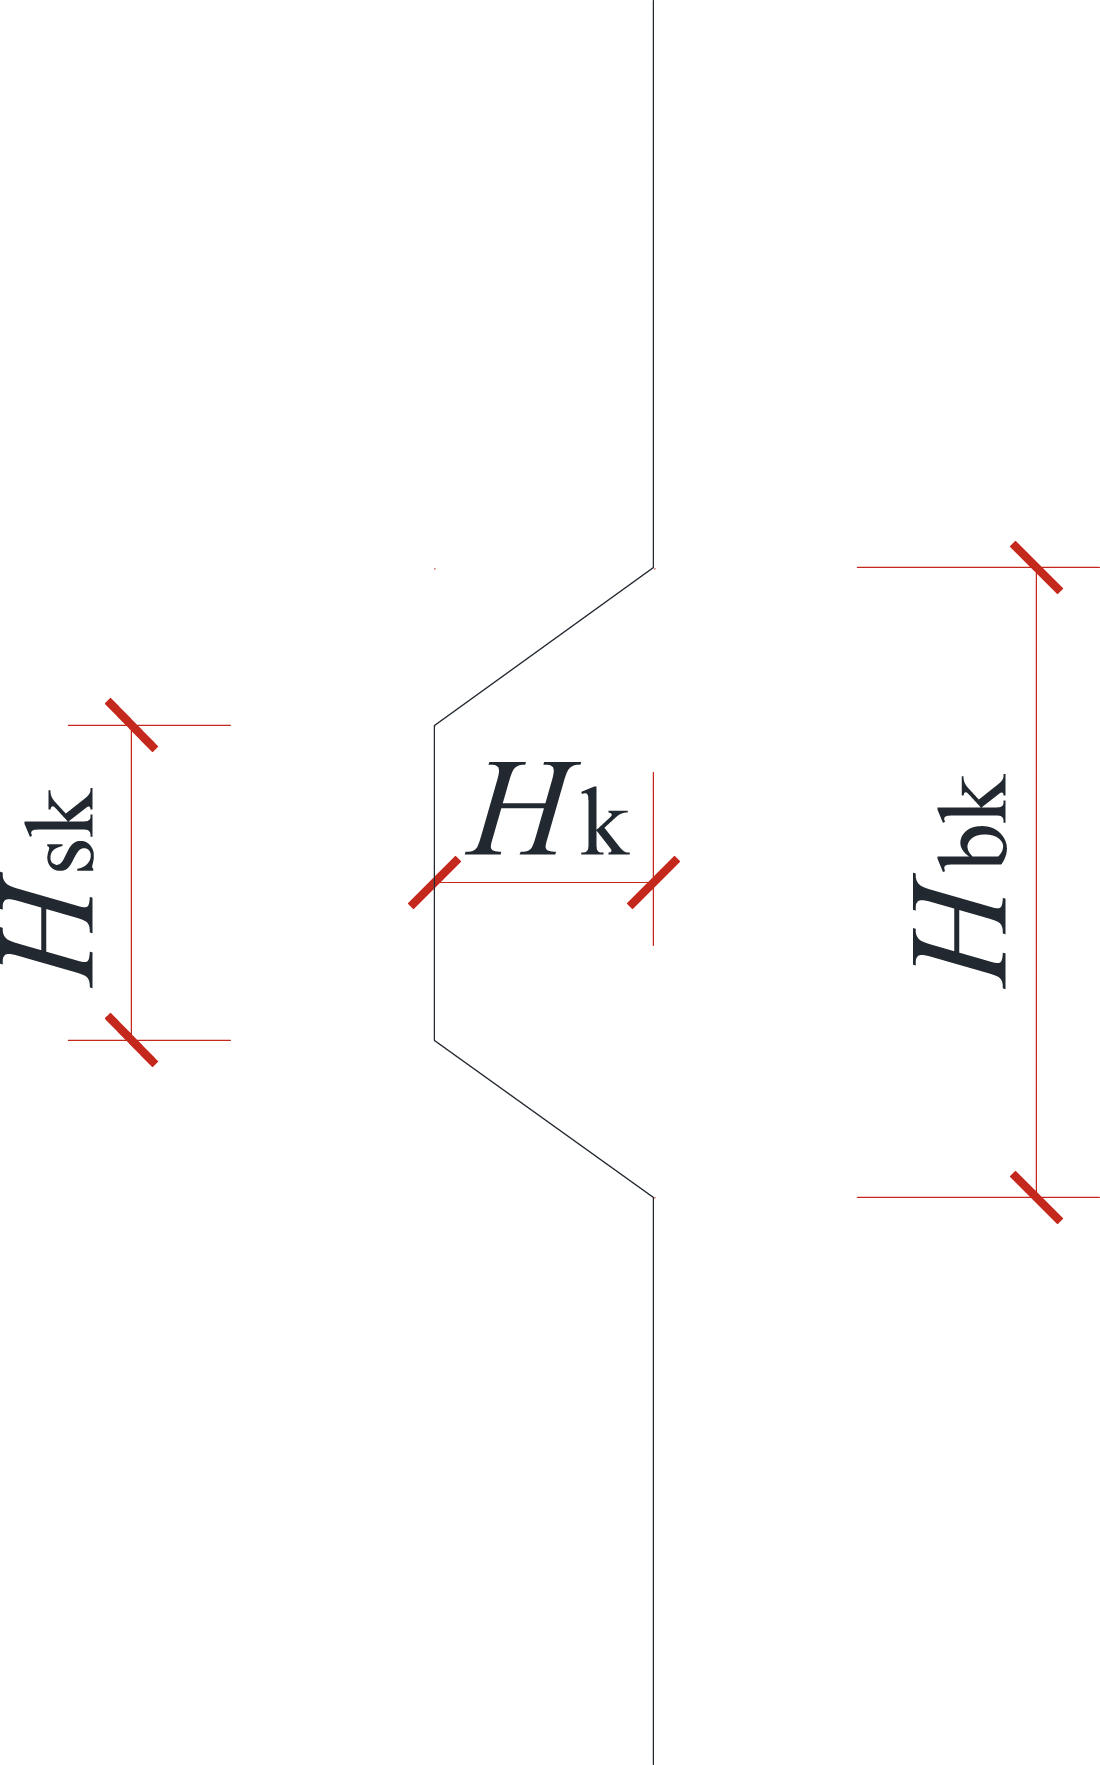
To study the effect of key tooth depth and height on the force performance and damage of the beam, three key tooth depth to height ratios (1:4, 1:2, 1:1) were designed for this test, and the calculation schematic of each depth to height ratio of the key tooth of the beam is shown in Figure 15. The key tooth depth-height ratio (h/d) is the ratio of the key tooth depth to the sum of the top height of the key tooth and the base height of the key tooth, as: Schematic of key tooth depth to height ratio.
According to the design of key tooth depth to height ratio, this test established two key teeth of different depth to height ratio model beam, the top height of the key teeth of the beam is designed to 100 mm, and the base height is designed to 200 mm, to ensure that the key teeth height remains the same premise to change the depth of the key teeth, the specific dimensions at the location of the key teeth as shown in Figure 16. Key teeth with different depth to height ratios.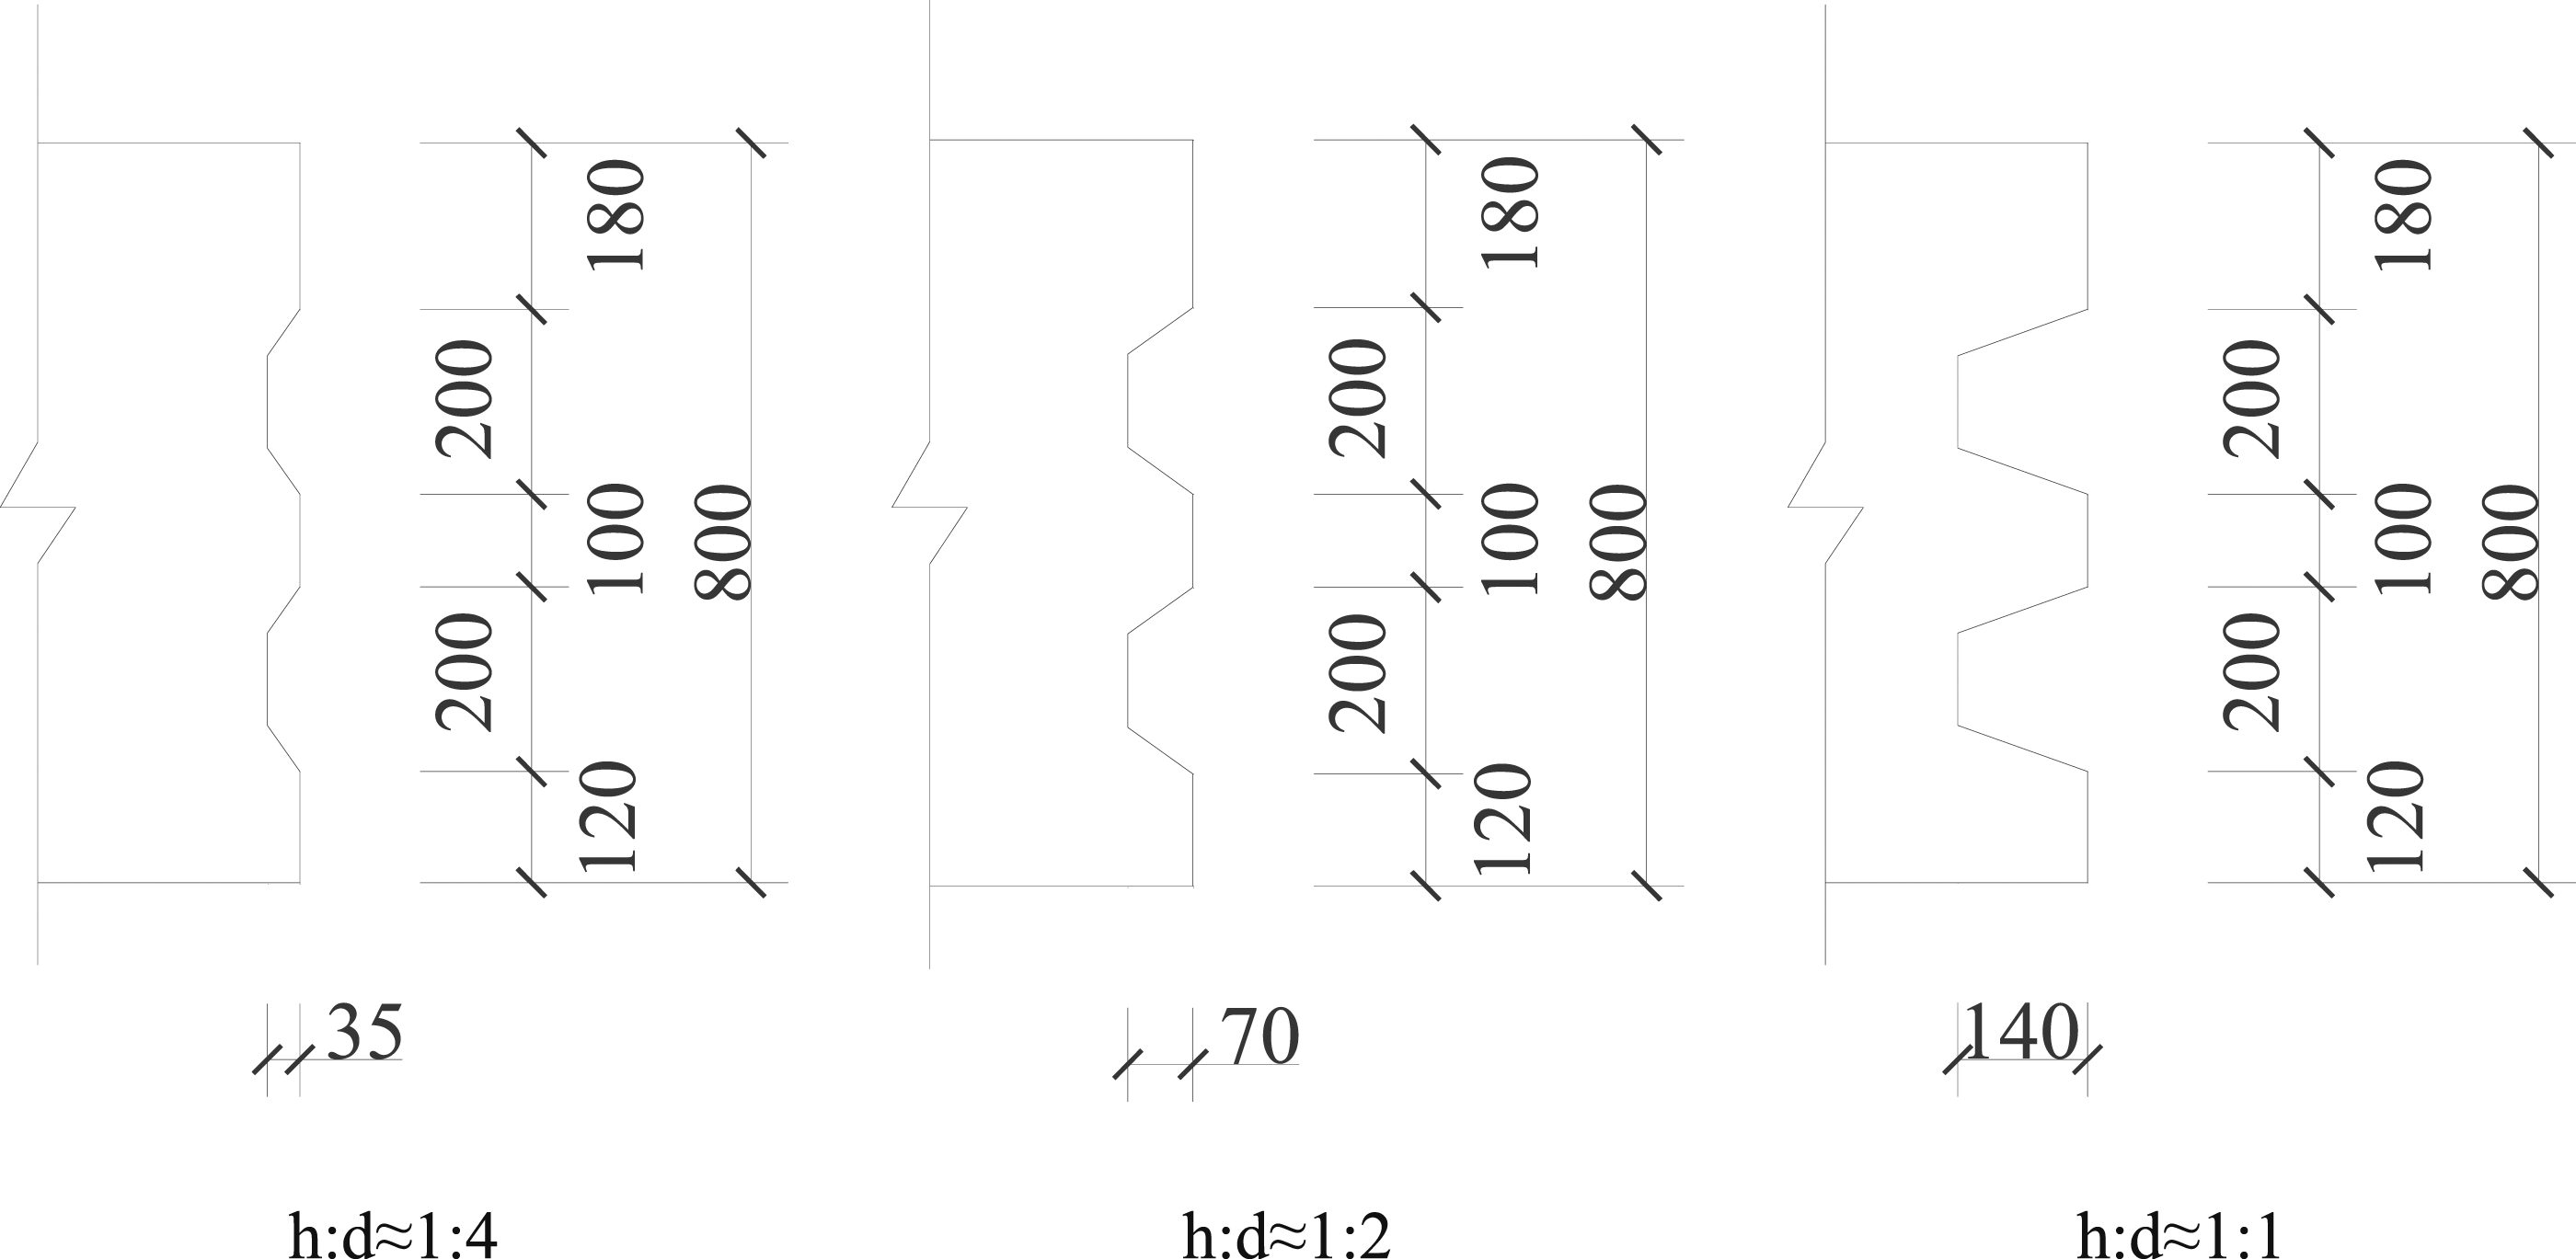
The span moment-displacement characteristics and tensile damage characteristics of the assembled prestressed concrete cover beam with two key teeth of different depth-to-height ratios are shown in Figure 17. From Figure 17, it can be seen that in the elastic stage, the load on the model beam is small and cracks have not yet appeared, and the different depth-to-height ratios of the key teeth have no obvious effect on the beam at this stage. As the loading process continues, the load on the beam increases, the bending moment in the span increases, cracks appear in the concrete in the tensile zone, and the different depth-to-height ratios of the key teeth have an effect on the stress performance of the beam. From the analysis of the simulation curve in Figure 17, it can be obtained that the load-carrying capacity of the beam increases with the increase of the key tooth depth to height ratio. This is mainly due to the fact that the height of the key teeth increases while the depth-to-height ratio of the key teeth increases, and the stronger the connection between the negative key teeth and the positive key teeth, which improves the load carrying capacity of the assembled beam. Combined with the tensile damage characteristics of the key teeth with different depth-to-height ratios, the conclusion can also be verified that the tensile damage value of the model with low key teeth depth-to-height ratios is smaller, and the material is damaged earlier and the load-carrying capacity is lower. In addition, comparing the ultimate displacements of beams with different key tooth depth to height ratios, it can be found that the ultimate displacements of beams decrease with the increase of key tooth depth to height ratios, and their ductility decreases. Bending moment-displacement and tensile damage diagrams in the span of key teeth with different depth-to-height ratios.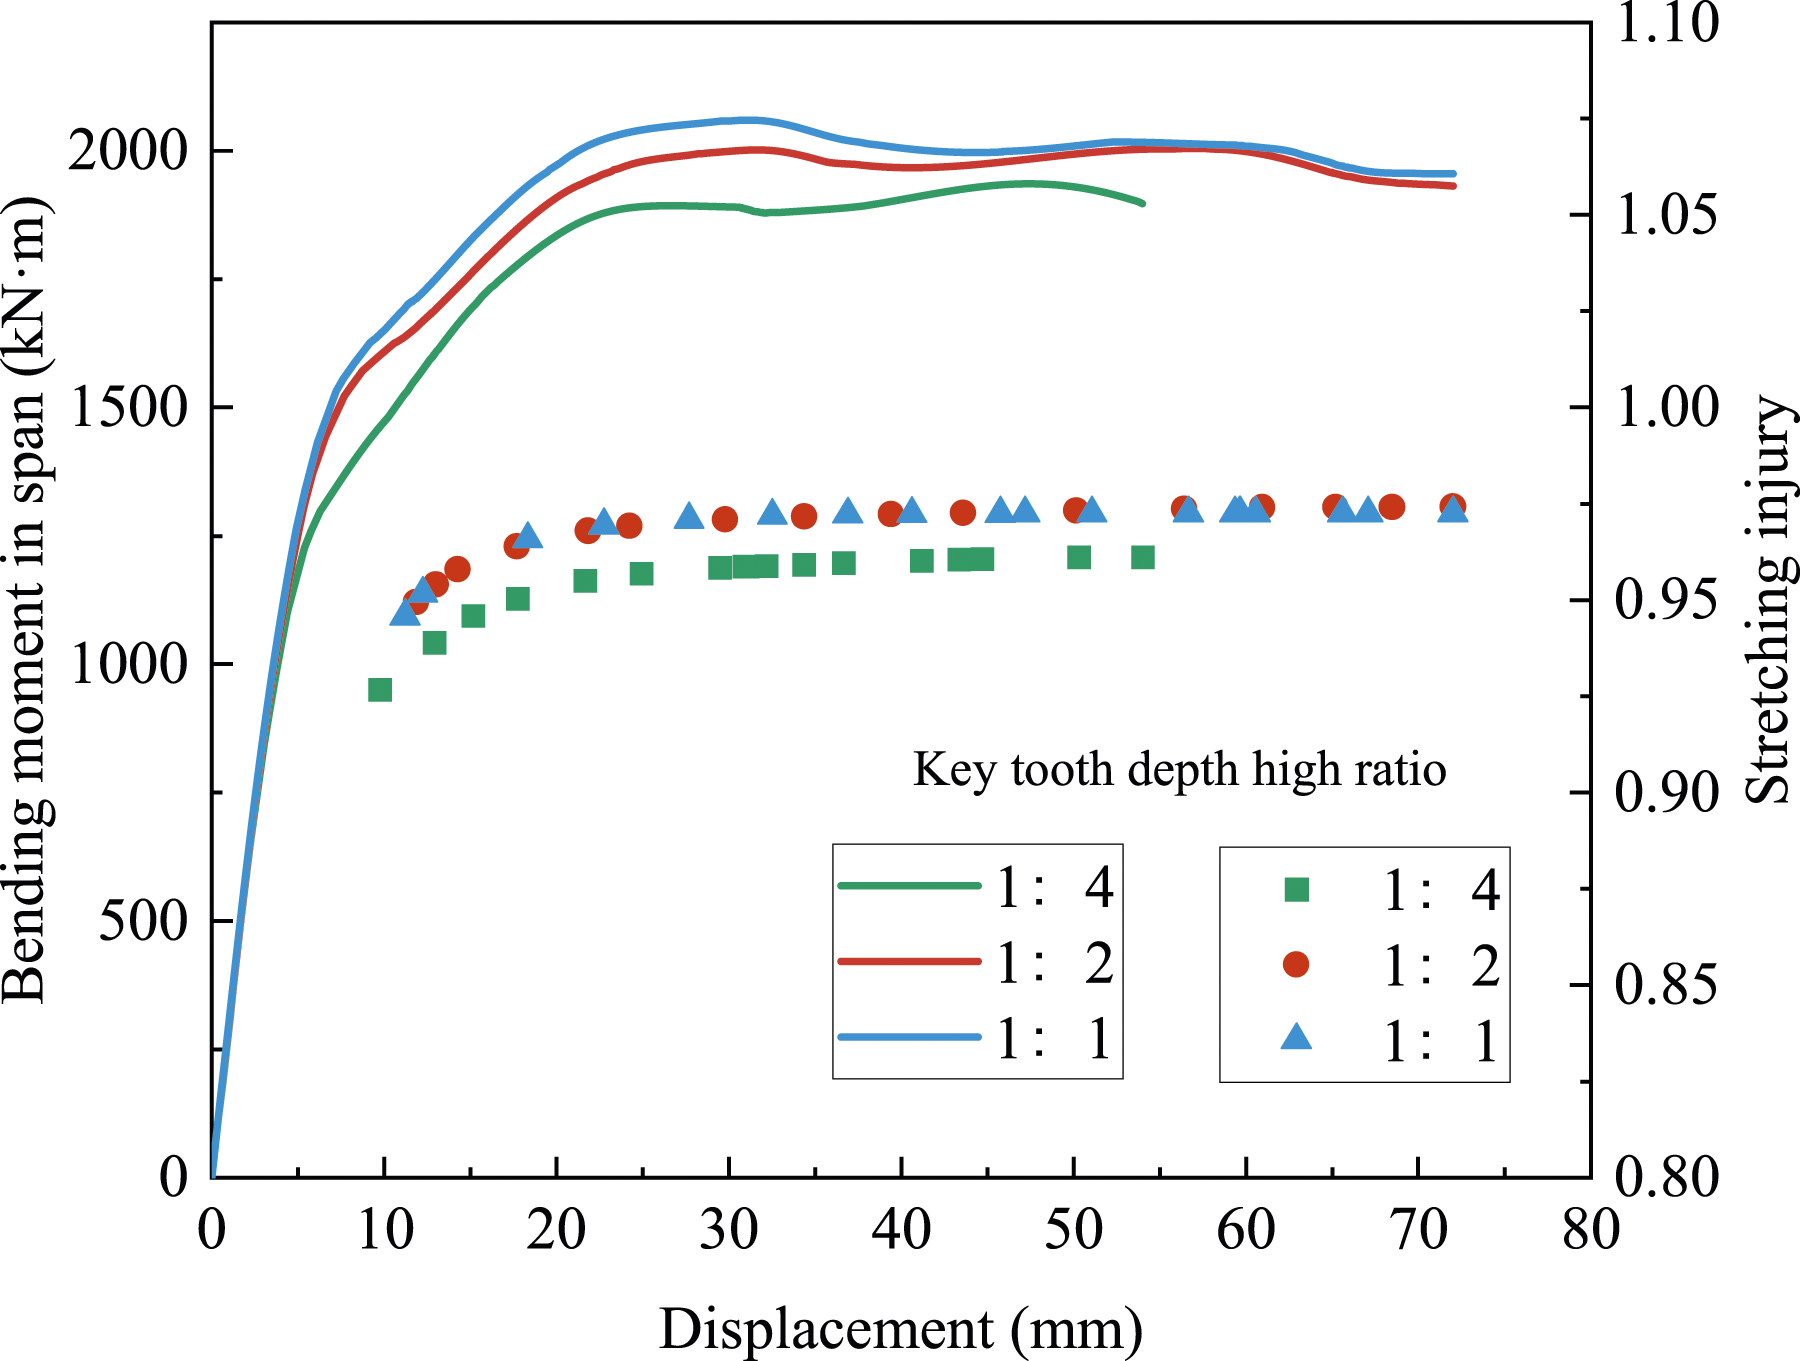
Comparing the plastic strain-displacement characteristics of the key-tooth assembled prestressed beams with different depth-to-height ratios (Figure 18) with their mid-span moment-displacement characteristics (Figure 17), it is easy to find that the plastic zone appears in all the structures before they reach the ultimate load, and the plastic strain of the model beam with the key-tooth depth-to-height ratio of 1:4 is significantly lower than the other design values, which indicates that the load-bearing capacity decreases more significantly at the later stage of the structure entering the plastic zone with the small key-tooth depth-to-height ratio. This further verifies that the load-carrying capacity of the beam increases with the increase of the key tooth depth to height ratio. Plastic strain value-displacement diagram for different depth-to-height ratios of key teeth.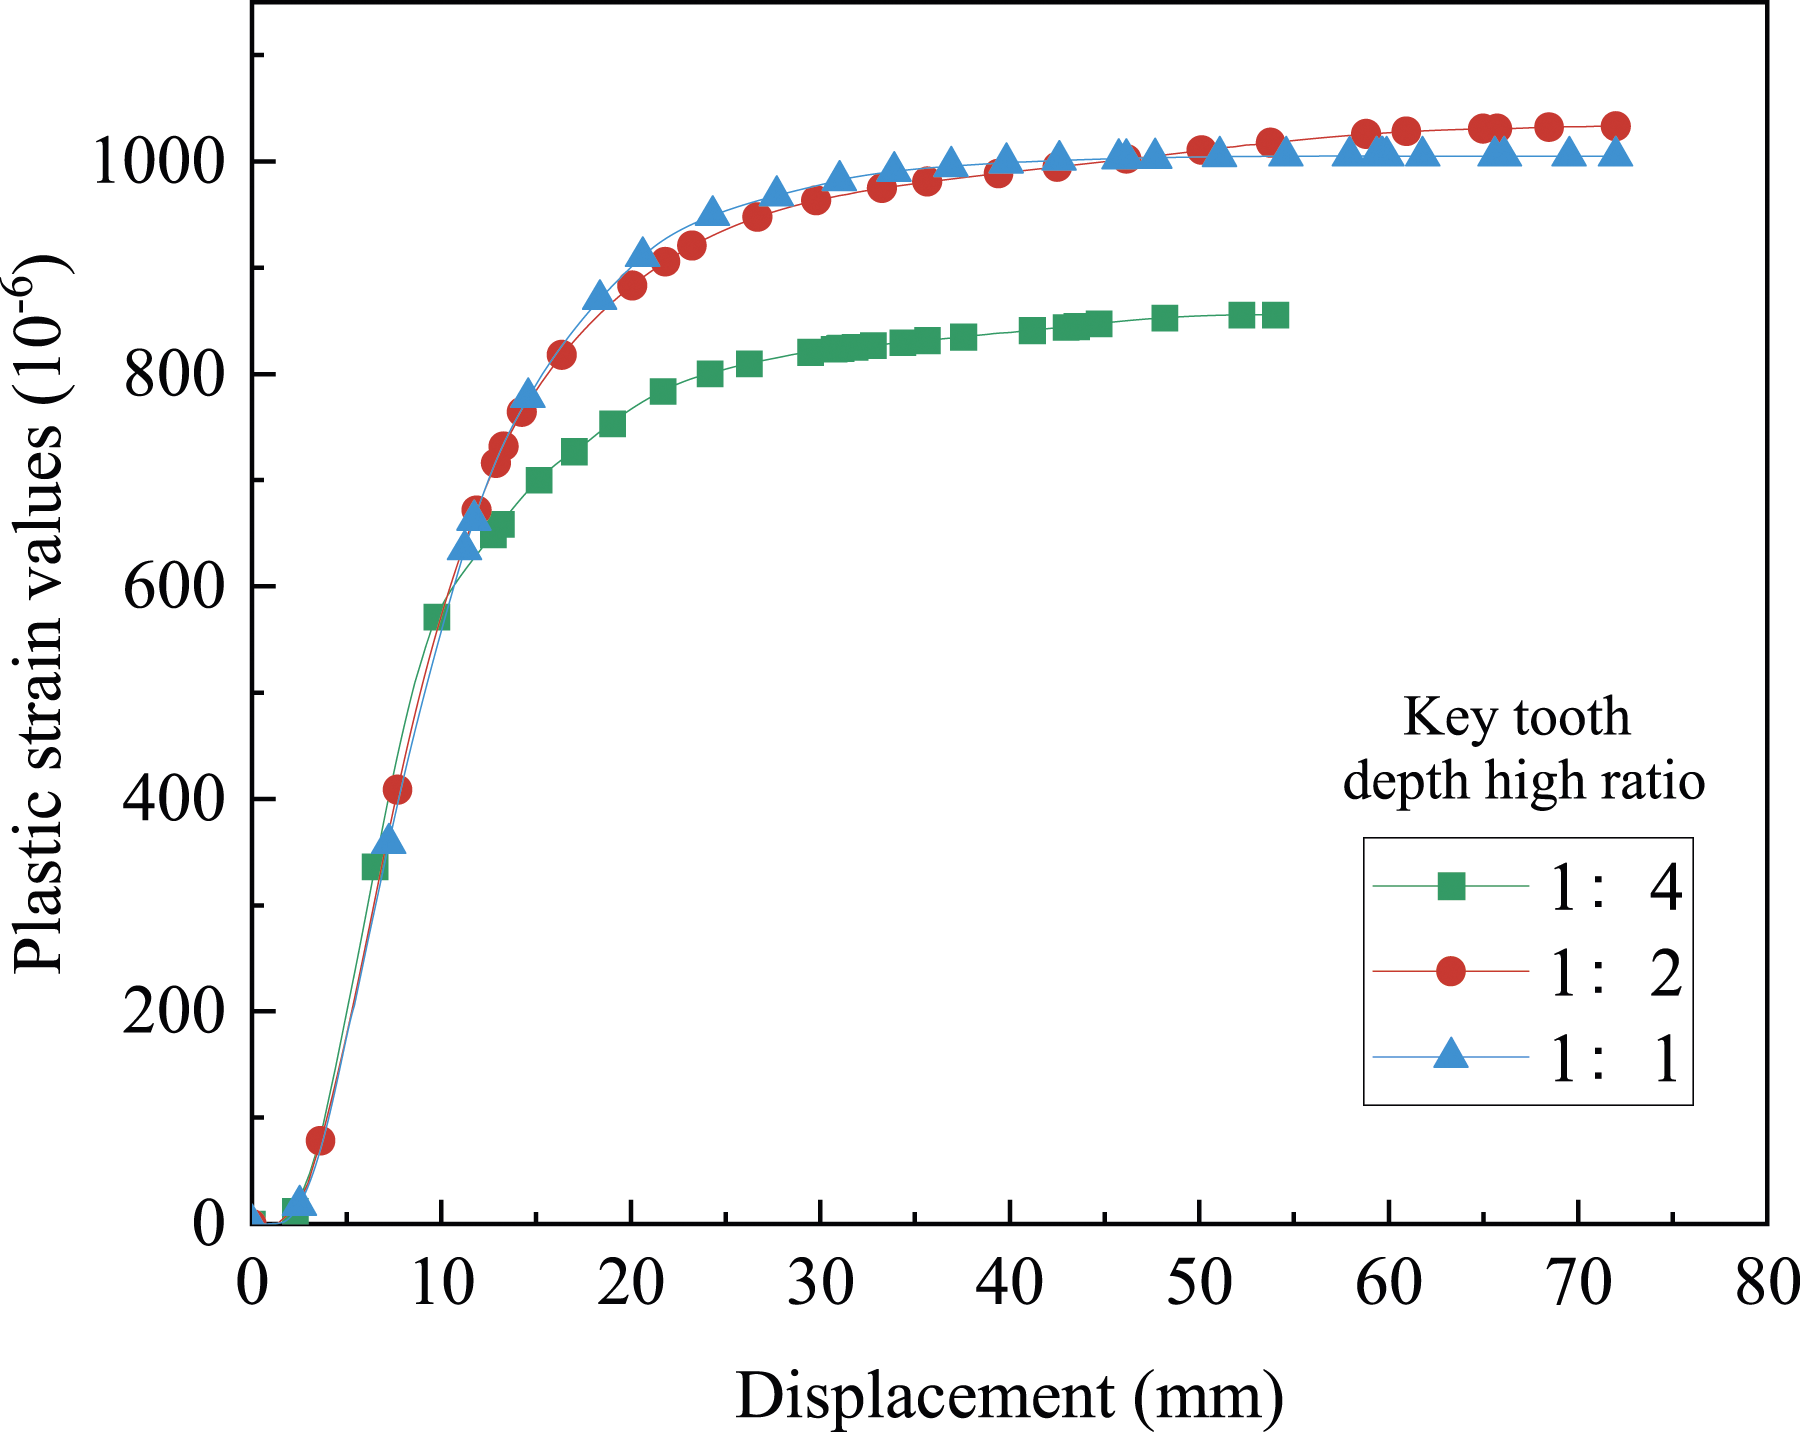
A cloud diagram of the damage process of the tensile damage at the joints of the two bond-tooth assembled prestressed concrete beam members with different depth-to-height ratios is shown in Figure 19. From the figure, it can be found that as the time course continues, micro-cracks appear at the root of the Yang key teeth in the model beam joint area, where the concrete is damaged first. As time increases, the tensile damage to the model beam increases and shear damage occurs at the beam joint location. Comparing the damage clouds of each depth-height ratio, it can be seen that the roots of the two key teeth with a depth-height ratio of 1:1 are damaged by force almost simultaneously, while the key teeth with smaller depth-height ratios are damaged by tension at the roots of the upper key teeth first, and the lower key teeth are damaged by force only with further increase of the load. This shows that the key tooth depth to height ratio will be too large on the root of the key teeth caused of greater tensile damage. Cloud diagram of the damage process of tensile damage at the joint of two key teeth deep to high ratio assembled prestressed beam. (a) The depth to height ratio is 1:4. (b) The depth to height ratio is 1:2. (c) The depth to height ratio is 1:1.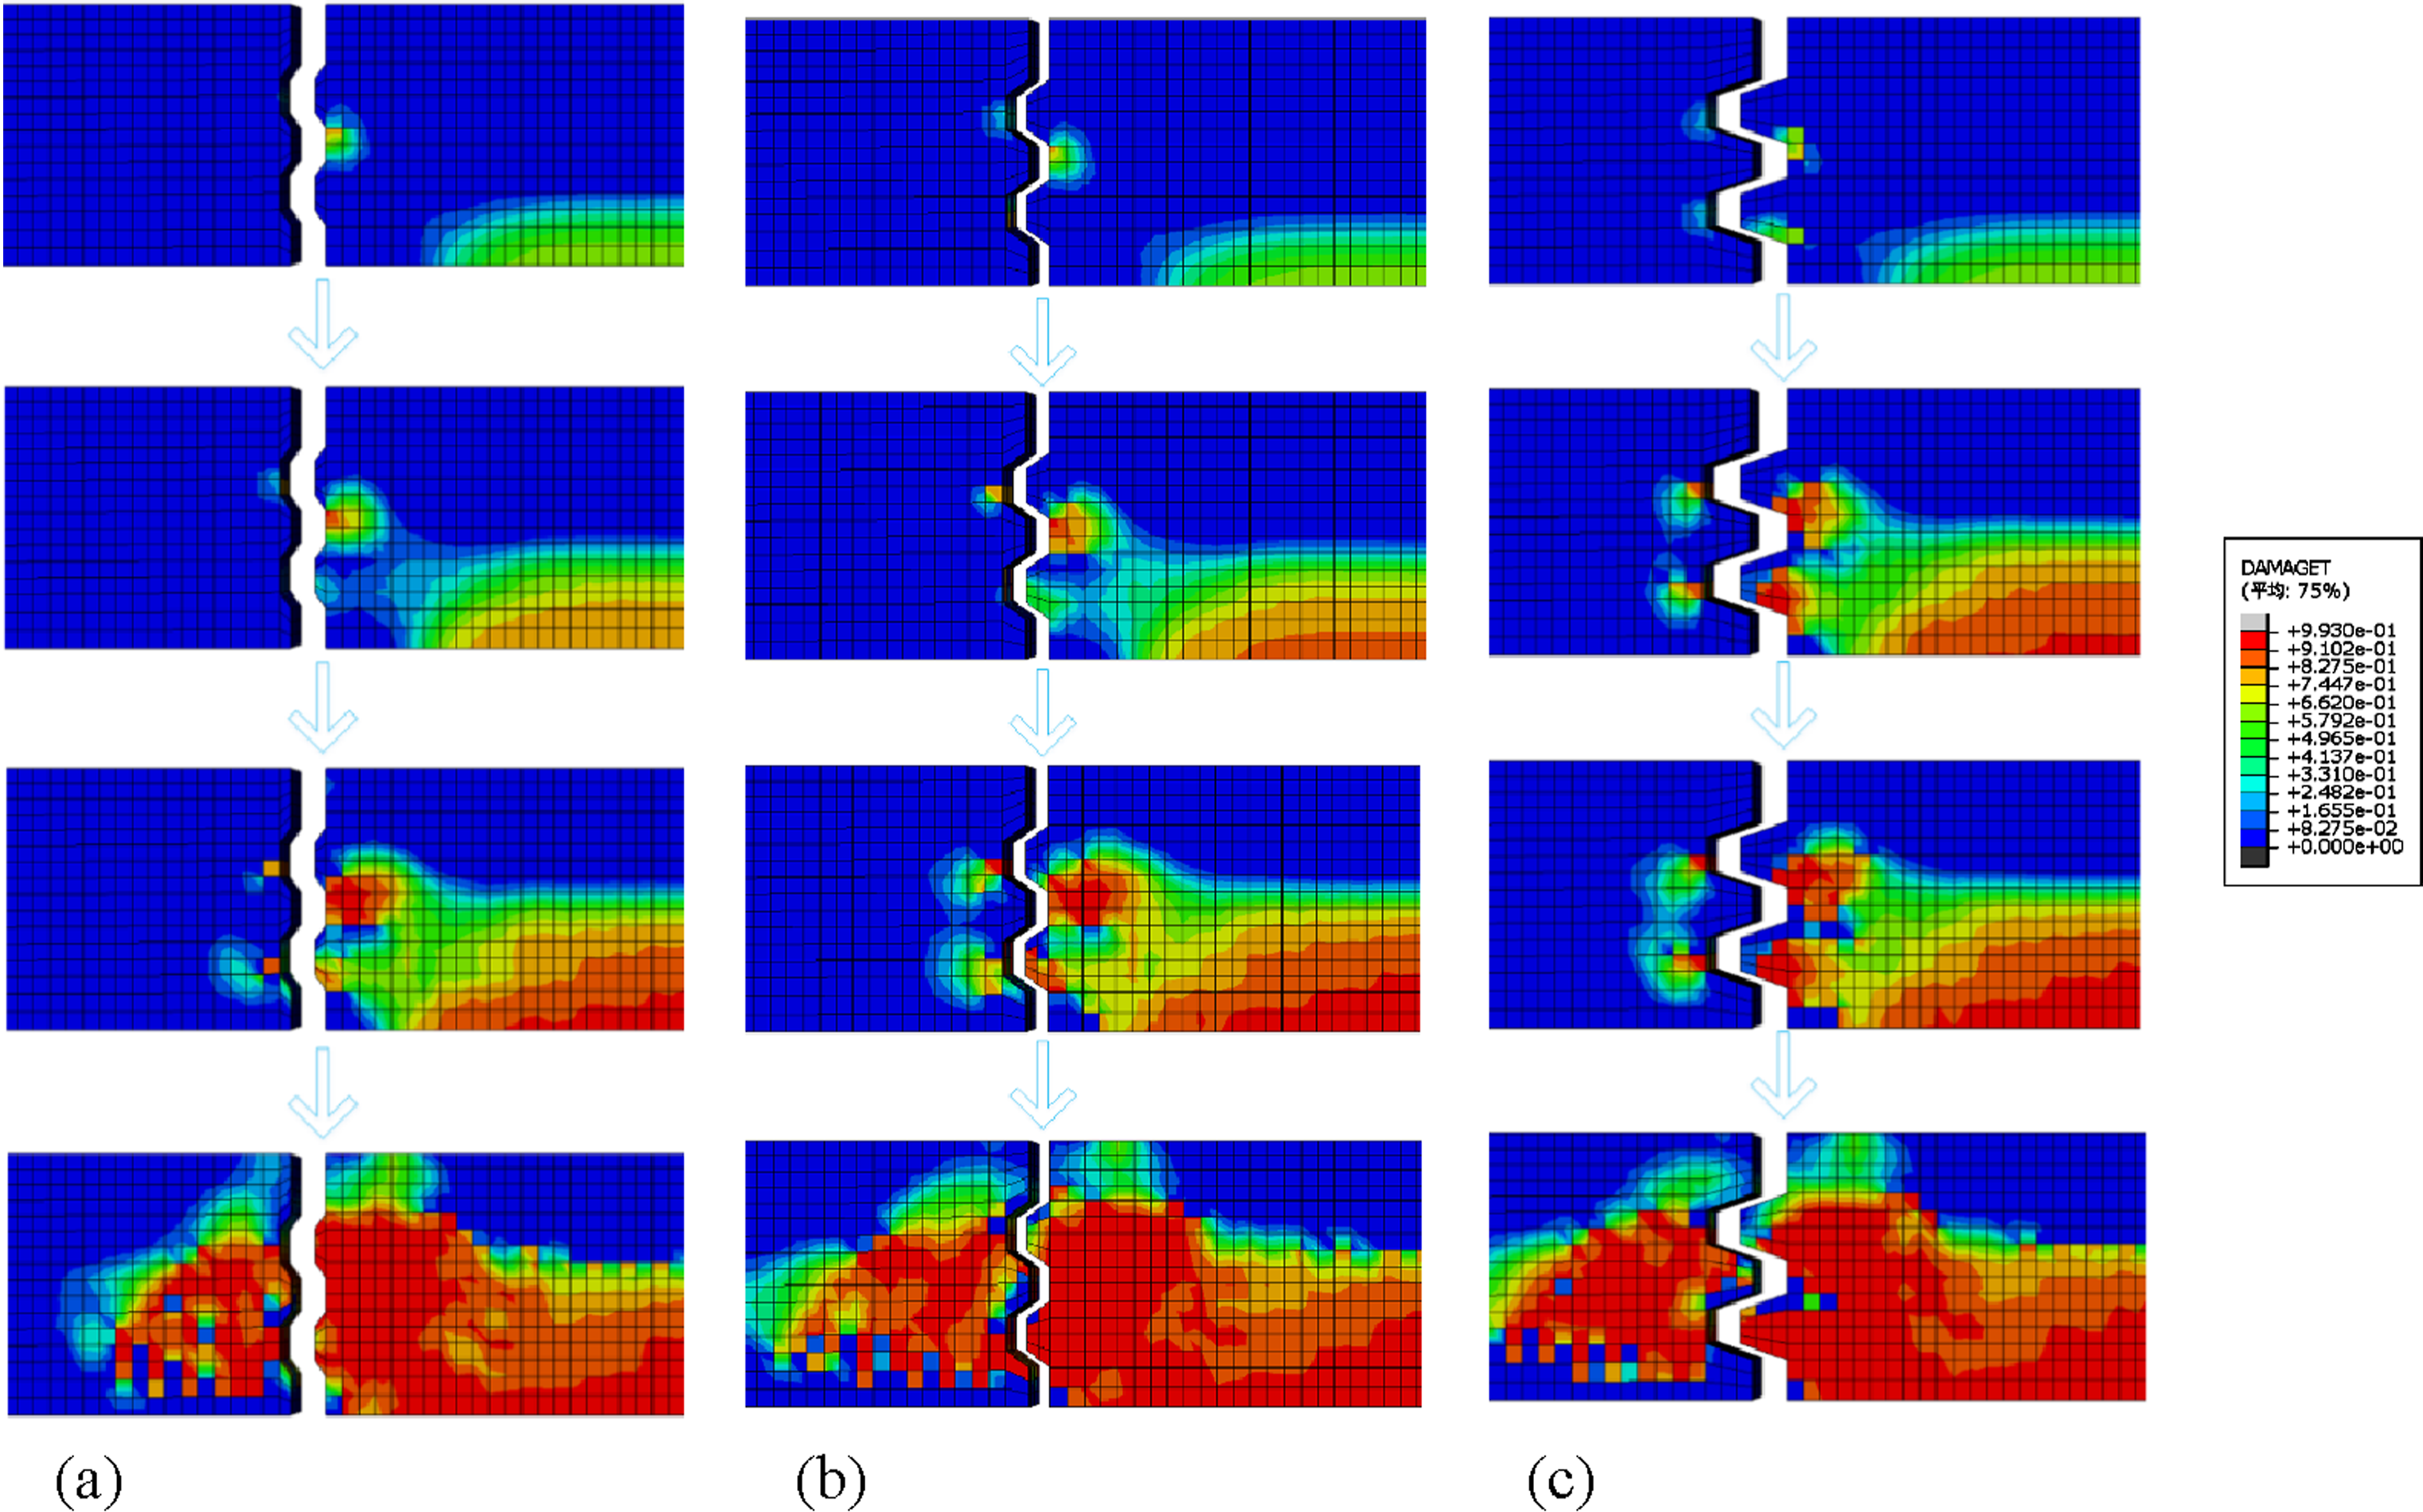
Number of key teeth
Combined with the analysis results of Key Tooth Depth to Height Ratio for consideration, a key tooth with a key tooth depth to height ratio of 1:2 was selected for study, and three key tooth numbers (single key tooth, two key teeth, three key teeth) were designed to assemble the prestressed concrete beam for model analysis, and the detailed dimensions of each key tooth number are shown in Figure 20. Dimensions of each key tooth number. (a) Single key teeth. (b) Two key teeth. (c) Three key teeth.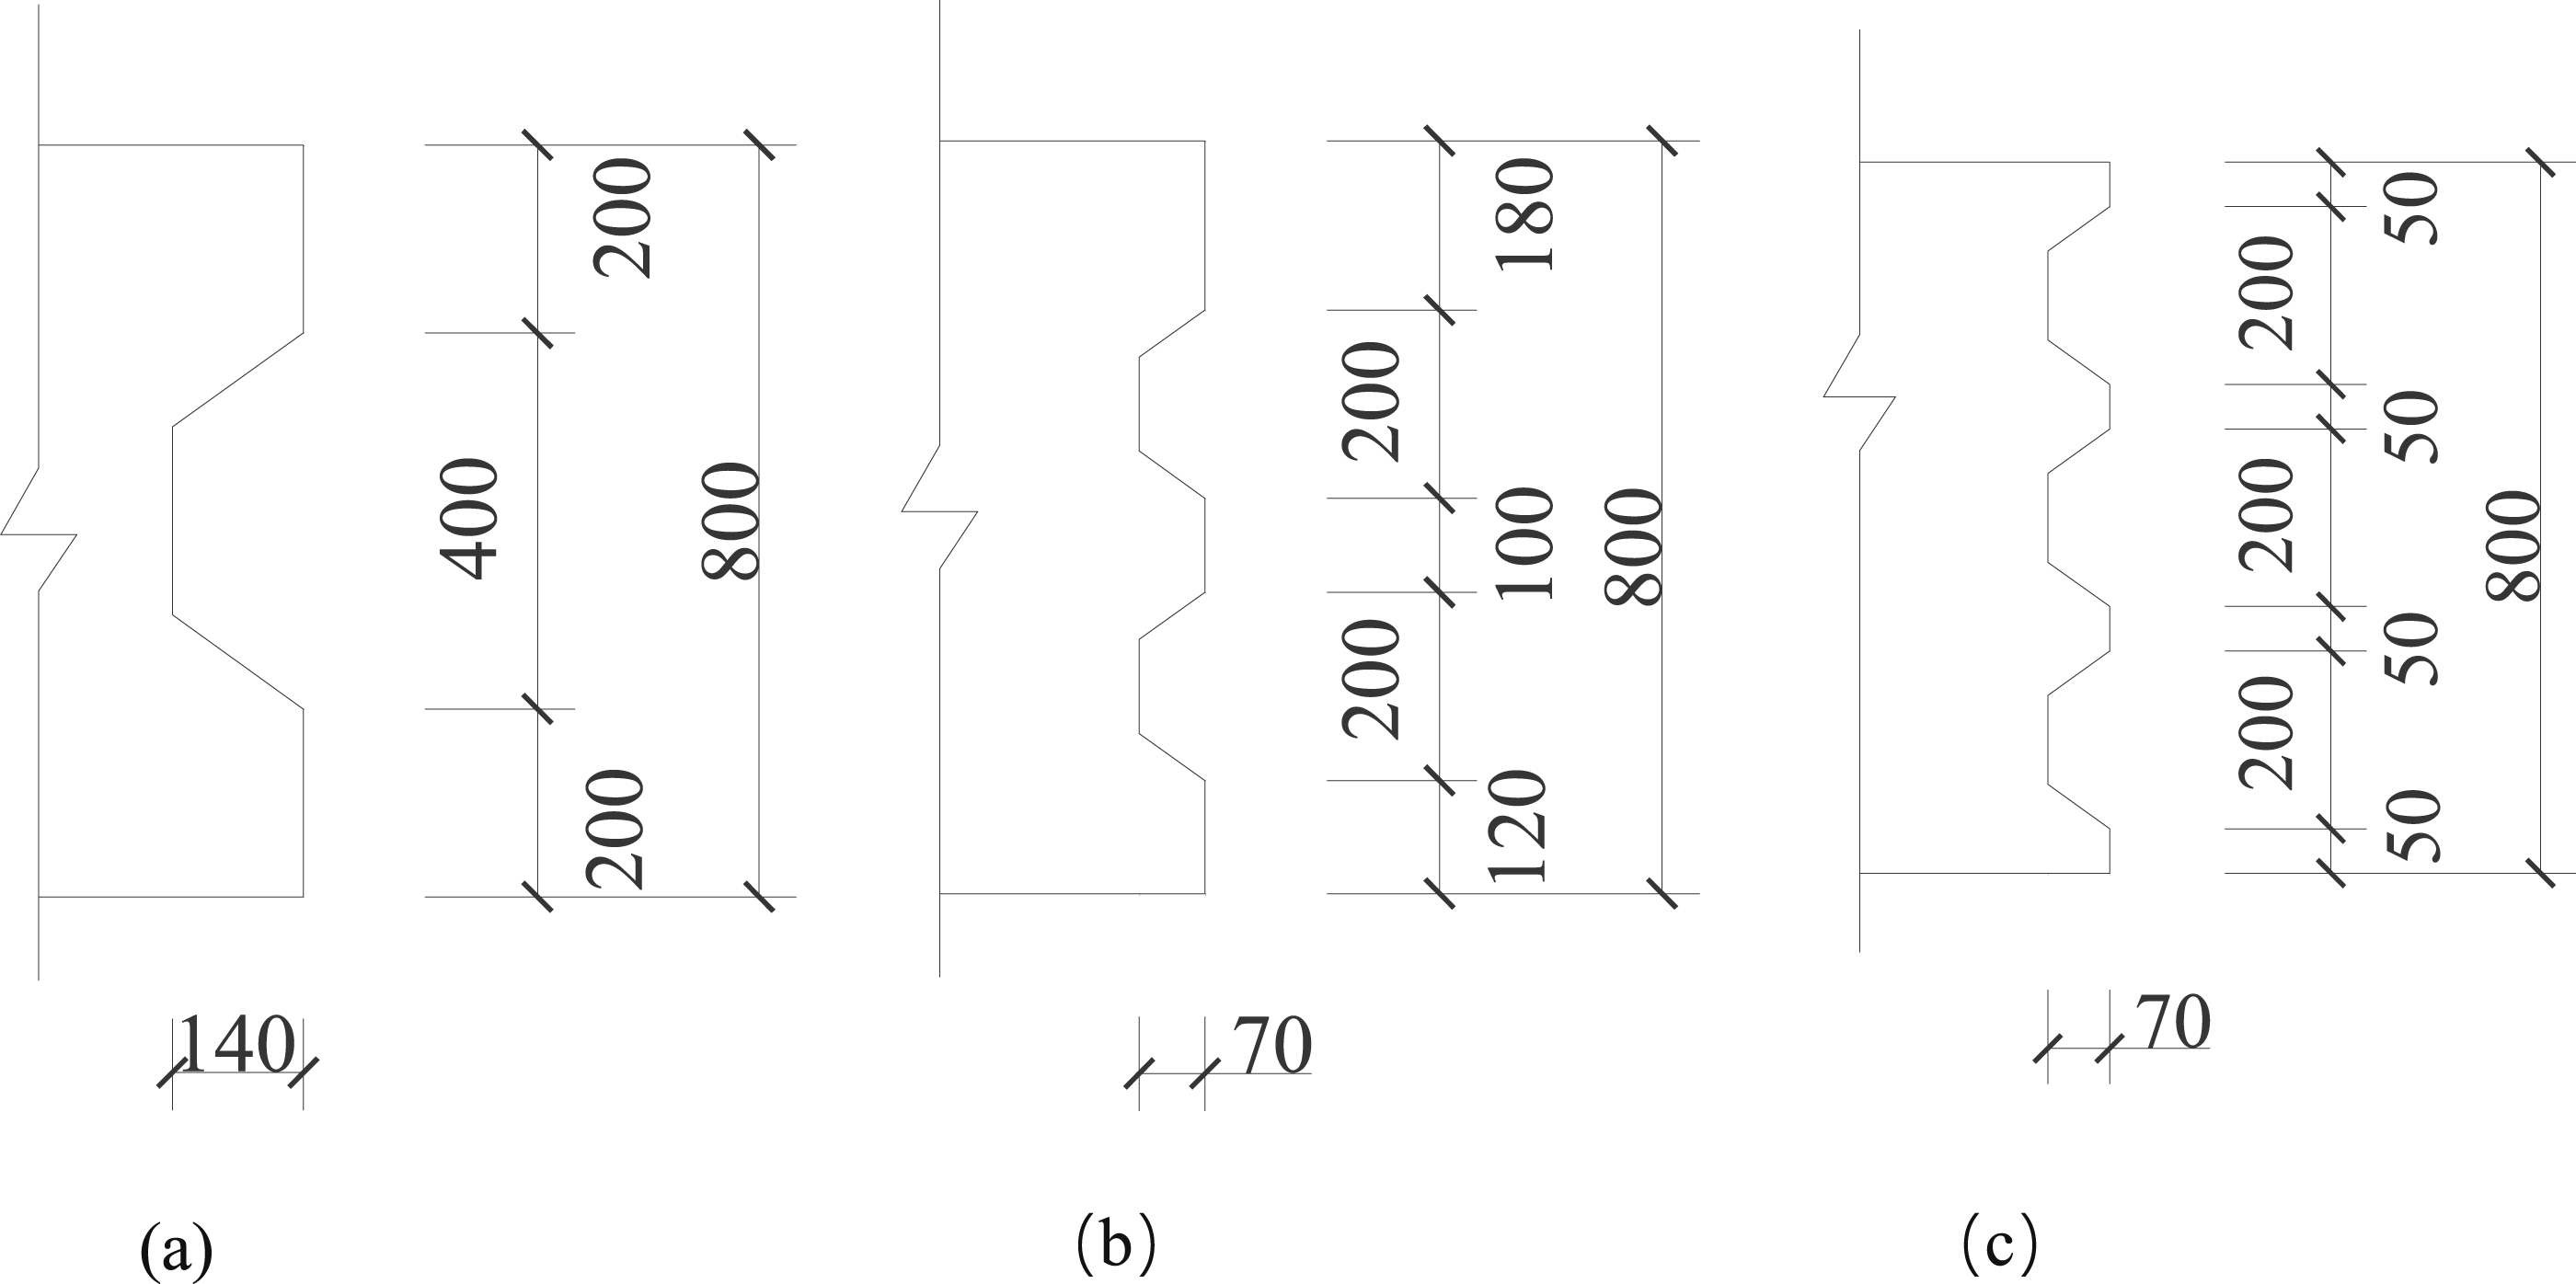
Figure 21(a) shows the comparison of the mid-span moment-deflection curves with different numbers of key teeth, from which it can be found that the large key teeth assembled prestressed concrete cover beam exits work at the peak point when the concrete is damaged by tension. As the load increases, the reinforcement starts to work and the mid-span bending moment starts to show an increasing trend again, however, after reaching the second peak point, a bond slip occurs between the reinforcement and the concrete, and the specimen is completely damaged and destroyed. The load-carrying capacity of the beam with three key teeth is only 3% lower compared to that of the beam with single key teeth, from which it can be concluded that the number of key teeth can be regarded as having no significant effect on the load carrying capacity of the assembled beam when the depth-to-height ratio of the key teeth is 1:2. Comparing the development law of plastic strain value and tensile damage value of a single-keyed tooth, double-keyed tooth and triple-keyed tooth (Figure 21(b)–(d)), it can also be found that there is no significant effect of the different number of key teeth (single-keyed tooth, double-keyed tooth, and triple-keyed tooth) on the deformation damage process of the collocated prestressed concrete beams at the depth-height ratio of 1:2. Force characteristics curve of model beam for each number of key teeth. (a) Mid-span bending moment-displacement. (b) Plastic strain-transverse displacement and tensile damage of single bonded teeth. (c) Plastic strain-transverse displacement and tensile damage of two key teeth. (d) Plastic strain-transverse displacement and tensile damage of triple bonded teeth.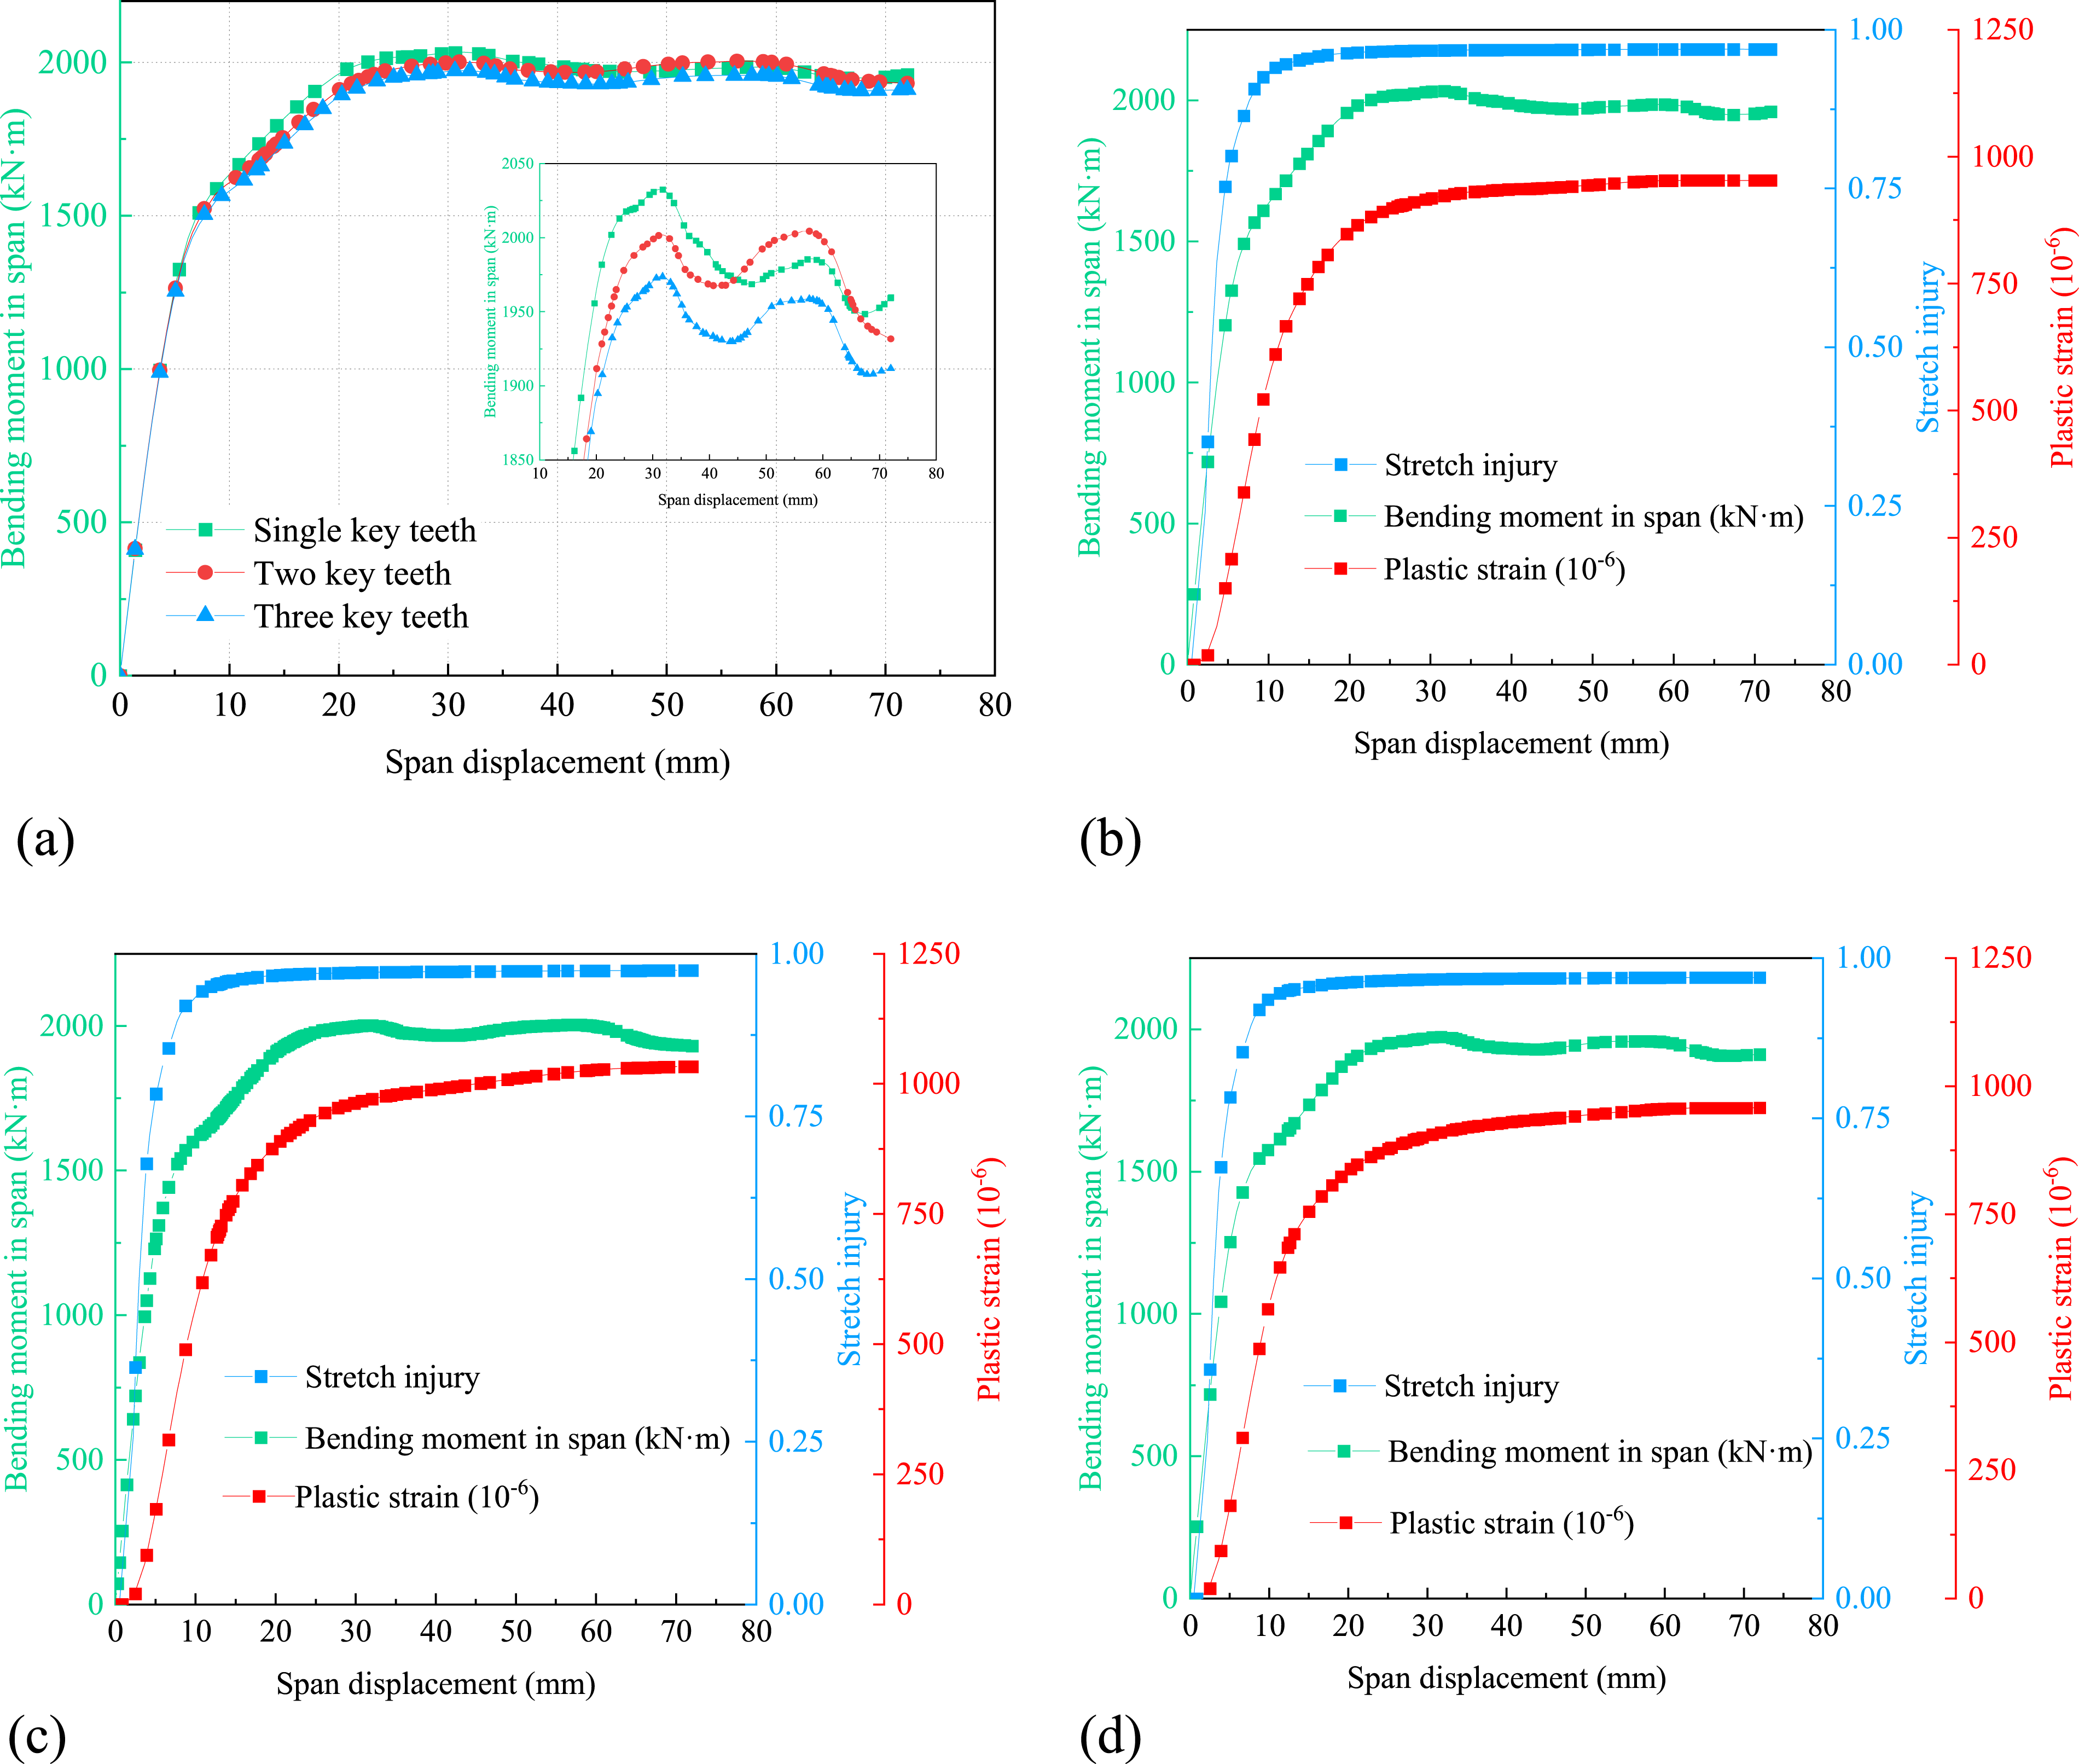
Figure 22 shows the cloud diagram of the damage process of tensile damage at the joints of single-keyed teeth and triple-keyed teeth assembled with a prestressed beam. Combined with the comparative analysis in Figure 19(b), it can be seen that, under the premise that the depth-to-height ratio of key teeth is 1:2, tensile damage occurs at the root of both negative and positive key teeth. For the single bonded tooth, the damage starts from the root and eventually runs through the whole bottom of the bonded tooth. For the two-key tooth, the damage starts at the root of the upper key tooth, and for the three-key tooth, it starts at the root of the middle key tooth, and finally, the crack at the bottom of the key tooth leads to the damage of the key tooth structure. Cloud diagram of the damage process of tensile damage at the joints of single-key tooth and three-key tooth assembled prestressed beam. (a) Single key teeth. (b) Three key teeth.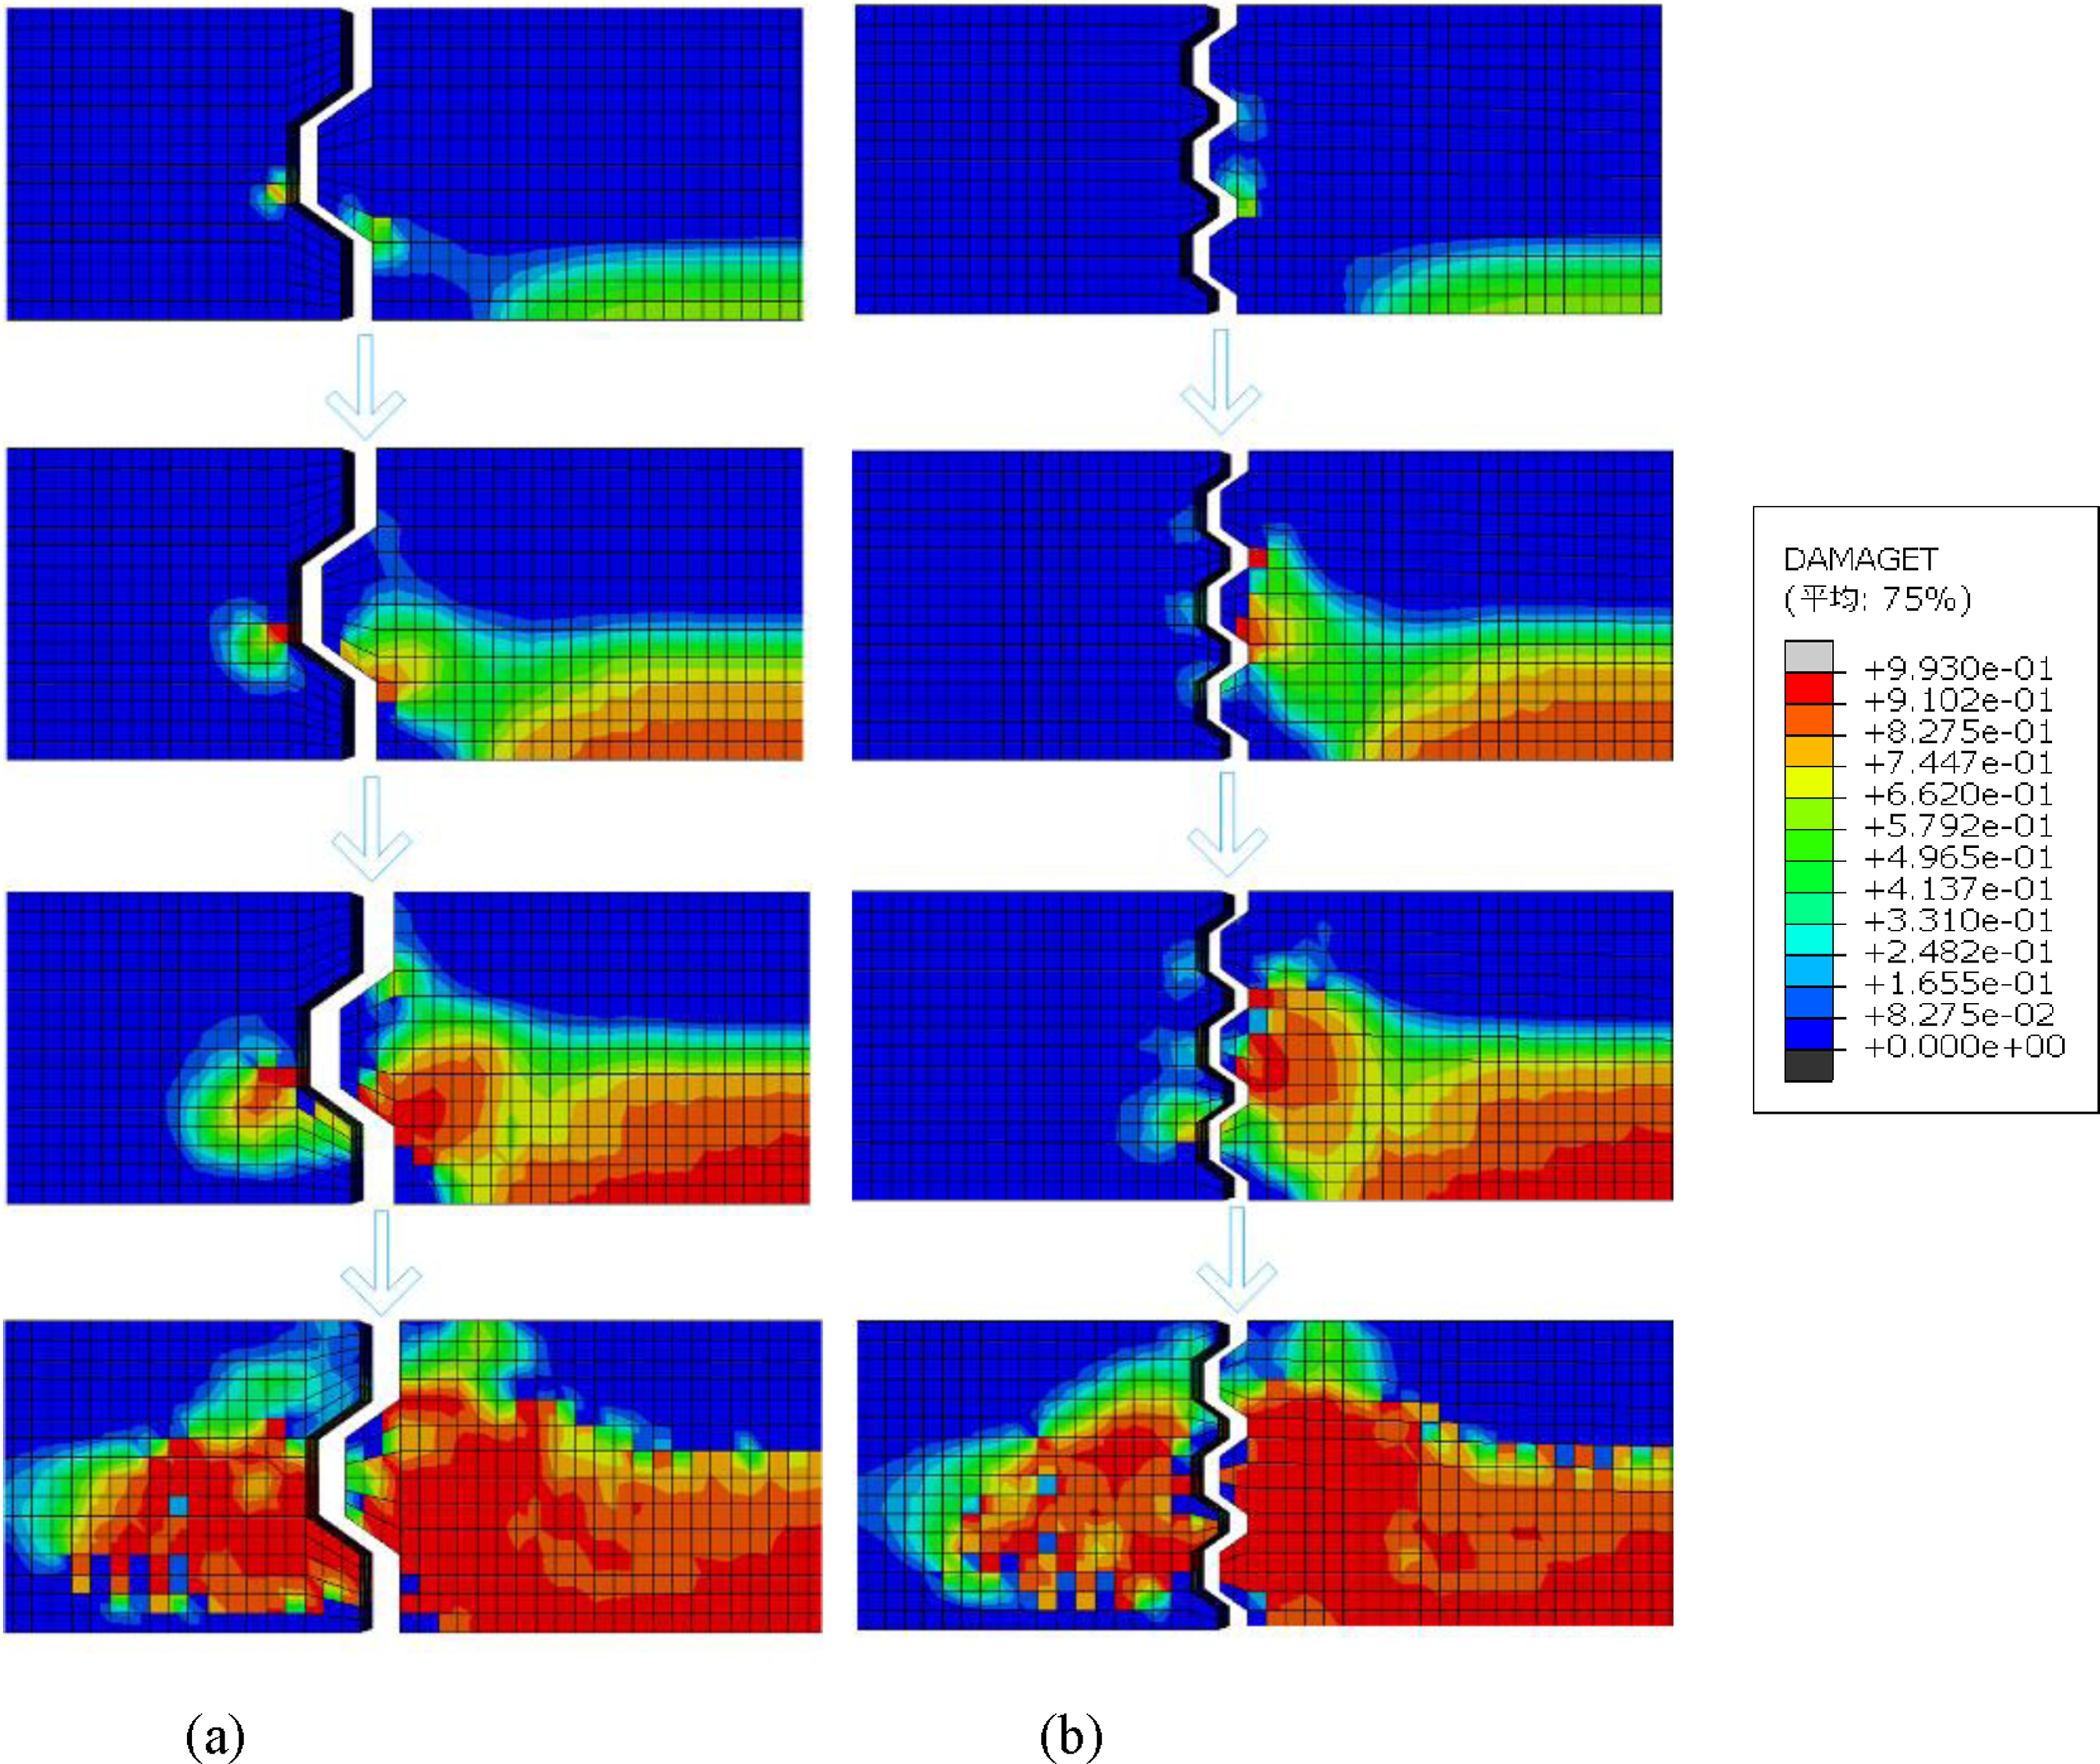
Reinforcement ratio
Based on the above finite element model, only the reinforcement rate is changed to establish the finite element models of large bond-tooth assembled prestressed concrete beams with different reinforcement rates (0.251%, 0.317%, 0.393%, 0.475%, 0.613%) to study the effect of reinforcement rate on the force performance of large bond-tooth assembled prestressed concrete beams in four-point bending test, and the finite element simulation results of the load and its corresponding mid-span deflection are shown in Figure 23. The simulation results are shown in Figure 23. From Figure 23, it can be seen that the peak load and the corresponding mid-span deflection of the large bond-tooth assembled prestressed concrete beam increase continuously with the increase of reinforcement rate before the peak load, but the increase is not significant. This indicates that increasing the reinforcement ratio can improve the shear bearing capacity and deformation resistance of the large key-tooth collocated prestressed concrete beams to some extent. However, in the range of suitable reinforcement, the effect of the change of reinforcement ratio on the shear bearing capacity and deformation resistance of large key-tooth collocated prestressed concrete beams is not obvious. Load-displacement curves of large key-tooth assembled prestressed concrete cover beams with different reinforcement ratios.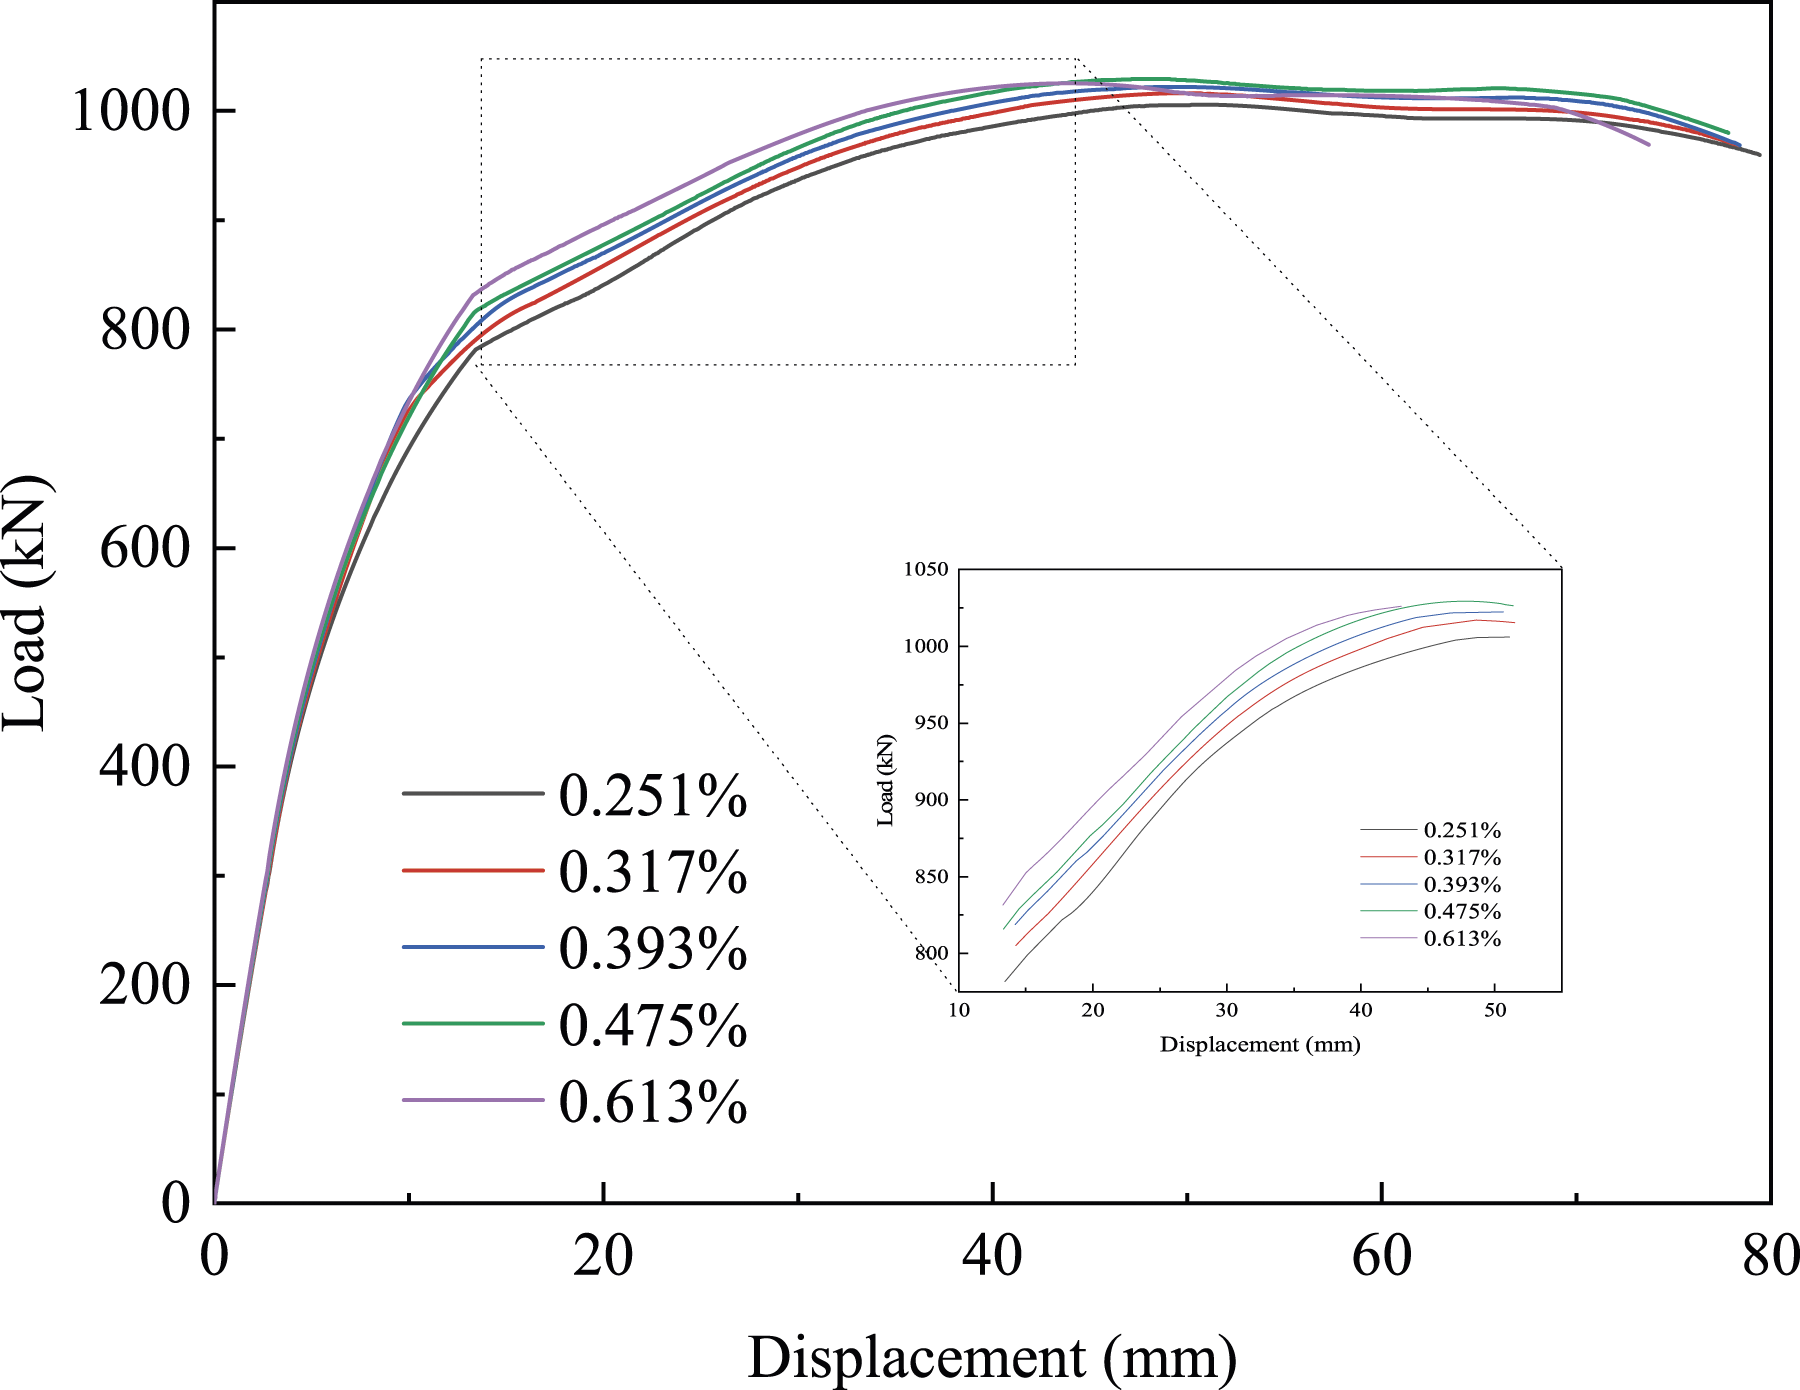
Conclusions
To investigate the practical application feasibility of the large key tooth assembled prestressed cover girder, this study combines FEA with a four-point bending test to examine the force characteristics of this girder. The following are the main findings: (1) The force characteristics of the large key tooth assembled prestressed cover girder were analyzed through FEA and four-point bending tests. (2) The results showed that, in the region of the key-tooth joint, both concrete and steel reinforcement bear the tension force of the spliced section as the load increases. Significant deformation was observed in this region. (3) As the loading progresses, the concrete in the key tooth area of the test beam ceases to function effectively, and the steel reinforcement assumes the majority of the tensile load. The prestressing tendons play a crucial role in tensile strength, leading to a sudden increase in strain in the steel reinforcement around the joint. This strain results in visible cracking at the key tooth joint. (4) The finite element model of the large key tooth assembled prestressed cover girder can be effectively utilized to simulate the overall stressing behavior of the girder. This simulation aids in further exploring the patterns and laws of stressing behavior in the girder. (5) The number of key teeth has minimal impact on the force performance of assembled prestressed concrete girders when the depth-to-height ratio of key teeth is 1:2. As the depth-height ratio of key teeth increases, the connection between negative and positive key teeth becomes more substantial. This increase results in a 20% boost in the load-bearing capacity of the assembled girders and a 30% increase in ductility compared to single key teeth. However, a disproportionately large depth-to-height ratio can lead to greater tensile damage at the root of the key tooth.
The findings of this study provide valuable insights into the force characteristics and stressing behavior of large key tooth assembled prestressed cover girders. These insights can be utilized in practical applications to enhance the design and construction of such girders, thereby improving their load-bearing capacity and ductility while reducing tensile damage at the key tooth joint. In the case of girder sections with key tooth joints in actual bridge construction, the prestressing force of the prestressing tendons changes due to the overall bending of the girder and the loss of prestressing force. For the resulting positive stress increment at the joint face, it is suggested that key tooth dry joints and key tooth glulam joints be investigated next. Then, the actual bridge correction formulas for the shear capacity of precast assembled bridge joints with different key tooth dry joints and key tooth rubber joint segments are further proposed so that they can be applied to actual bridge projects.
Footnotes
Declaration of conflicting interests
The author(s) declared no potential conflicts of interest with respect to the research, authorship, and/or publication of this article.
Funding
The author(s) disclosed receipt of the following financial support for the research, authorship, and/or publication of this article: This work was supported by the National Key R&D Program of China (Grant No. 2021YFB2600200); National Natural Science Foundation of China (Grant No. 51979090), and Qinghai Provincial Key R&D and Transformation Plan (Grant No. 2019SF127).
