
Abstract
The seismic behavior of six corroded recycled aggregate concrete (RAC) columns with ultra-high-strength bars (UHSB) was investigated through quasistatic test and numerical analysis. The main parameters include different corrosion ratios, axial load ratios (ALR), and stirrup ratios. The results revealed that: The damage development of the corroded specimen sped up with increasing corrosion ratio and ALR, and the corroded specimens suffered brittle shear failure due to the stirrup fracture or the concrete failure. The difference in carrying capacity of the specimens with low corrosion ratios and ALR was relatively small, while the deformation capacity was significantly reduced with increasing corrosion ratios and ALR. Reinforcement corrosion had a minor effect on the strength and stiffness degradation but would reduce the maximum cumulative energy dissipation capacity. By combining residual drift and residual crack width, the corroded specimens all could meet the limit of repairable residual drift and crack width before 4% drift, showing satisfactory resilient performance. Based on the modified corrosion models of materials, the numerical analysis showed the detrimental and coupling impact of the high ALR, high corrosion ratio, and low stirrup ratio on the carrying and deformation capacity. Through numerical analysis data, an equation was proposed that can satisfactorily predict the peak drift of the corroded columns with UHSB.
Keywords
Introduction
The traditional seismic design concept takes life safety as the primary goal, which allows the plastic damage and deformation of the lateral force resisting members of the structures to dissipate seismic energy and avoid the collapse of the structures. However, if the structures suffer severe damage and residual deformation, the post-earthquake rehabilitation of the structures will lead to huge economic losses, and even the severely damaged structures have to be demolished and rebuilt, which will have a huge impact on the post-earthquake urban operation. With the resilient structures (Lu et al., 2011) being put forward, it has gradually become a hot spot in the seismic engineering field. The resilient seismic structures mainly utilize rocking (Qu et al., 2014; Roh and Reinhorn, 2009, 2010), self-centering (Cui et al., 2017; Vasdravellis et al., 2013), replaceable, and energy-consuming (Guo et al., 2020; Liu et al., 2020) devices to make the structural and non-structural components suffer as little damage as possible under the earthquake action, and can quickly restore the intended function with minor or no repair after the earthquake.
It is found (Ibrahim et al., 2017; Pandey et al., 2008) that keeping a certain elastic section of the reinforcement or delaying the yield of the reinforcements is also the key to a resilient structure, and reducing the bonding performance of the longitudinal rebars can significantly improve the ductility of the structure. Therefore, with the continuous development and application of high-strength steel bars, there are more and more researches on employing UHSB as longitudinal rebars to improve the resilience of the structure. Sun et al. (2013a, 2013b) first adopted UHSB as the longitudinal rebars of the column. Zhang et al. further reduced the bond strength between rebars and concrete by applying coating on the surface of UHSB and successively studied the seismic and resilient performance of the frame columns (Tao et al., 2023; Zhang et al., 2023a, 2023b), shear walls (Zhang et al., 2023a, 2023b), frame structures (Liu et al., 2021) and frame-shear wall structures (Liu et al., 2023; Zhang et al., 2022a, 2022b, 2022c) equipped with UHSB. The above research results showed that the high yield strength and low bond strength of UHSB can further delay the yield of rebars, thus improving the horizontal load-carrying capacity and reducing the residual drift, and the satisfactory resilient performance of concrete structures can be realized by traditional construction techniques.
However, with the increase of the service life of structures, the reinforced concrete (RC) structures will be affected by various factors, such as corrosion, carbonization, freezing and thawing, which will cause a detrimental effect on the seismic performance of the structures. Among them, steel corrosion is the main reason for the deterioration of RC structures, which will directly impact the safety and durability of the structures (Capozucca, 1995). The corrosion will directly reduce the cross-section of rebars, and the expansion of rust will cause the cracking of the concrete cover and weaken the bond strength, thus leading to the degradation of structural performance. In addition, many buildings are in corrosive environments and earthquake-prone areas at the same time, so the seismic performance of corroded structures has attracted extensive attention of scholars. At present, in addition to studying the seismic performance of corroded steel structures, such as steel columns (Wang et al., 2021; Zhang et al., 2023a, 2023b) and steel frames (Chen and Jiang, 2023; Zhang et al., 2020), series of studies on the seismic performance of corroded RC structures have also been conducted, including concrete beams (Zheng et al., 2022) (Huang et al., 2022; Ou and Nguyen, 2016; Yalciner et al., 2019), columns (Goksu and Ilki, 2016; Meda et al., 2014; Rajput and Sharma, 2018; Yang et al., 2016; Zheng et al., 2022b), shear walls (Zheng et al., 2022b; Zhou et al., 2021), joints (Dangwal and Singh, 2023; Kanchanadevi and Ramanjaneyulu, 2018), and frame structures (Liu et al., 2017; Nagender et al., 2022). The research results generally show that with the increase of corrosion ratio, the corroded RC structures present a more obvious brittle failure mode, and the horizontal load-carrying capacity, energy dissipation, and deformation capacity of the structures are reduced under the horizontal earthquake action. For recycled aggravate concrete, it is found (Wang et al., 2013) to have a comparatively high chloride ion permeability, which is about 14% higher than that of natural aggregate concrete. Olorunsogo and Padayachee (2002) found that the chloride ion conductivity of RAC with 50% and 100% replacement ratio was 62.7% and 86.5% higher than that of natural aggregate concrete, respectively. Therefore, the corrosion risk of rebars in RAC is higher than that of natural aggregate concrete. As RAC has gradually become an effective measure to solve construction waste, the research and application of RAC structures have become more and more extensive, while the researches on the seismic performance of corroded reinforced RAC structures are rare.
Therefore, with the increase of research on the resilient structures with UHSB, especially for the structures with both UHSB and RAC, it’s necessary to investigate the impact of corrosion on their seismic performance. However, based on the overview of the previous research, it is evident that current studies on the seismic performance of corroded reinforced concrete structures are limited to natural aggregate concrete structures with ordinary steel bars, and there is a lack of relevant research on the seismic performance of corroded RAC structures and UHSB reinforced concrete structures with corrosion. In addition, the column is an important lateral force resisting member of RC structures, so the corrosion of concrete columns has a significant impact on the seismic performance of the structure. In this paper, a group of RAC columns equipped with UHSB were subjected to electrochemical chloride erosion, and the corroded columns were subjected to a quasistatic test and finite element analysis to study the impact of corrosion on the seismic performance and resilience of the column, filling the research gap of the seismic performance deterioration of the corroded structure equipped with UHSB.
Experiment programs
Specimen design
Main design parameters.
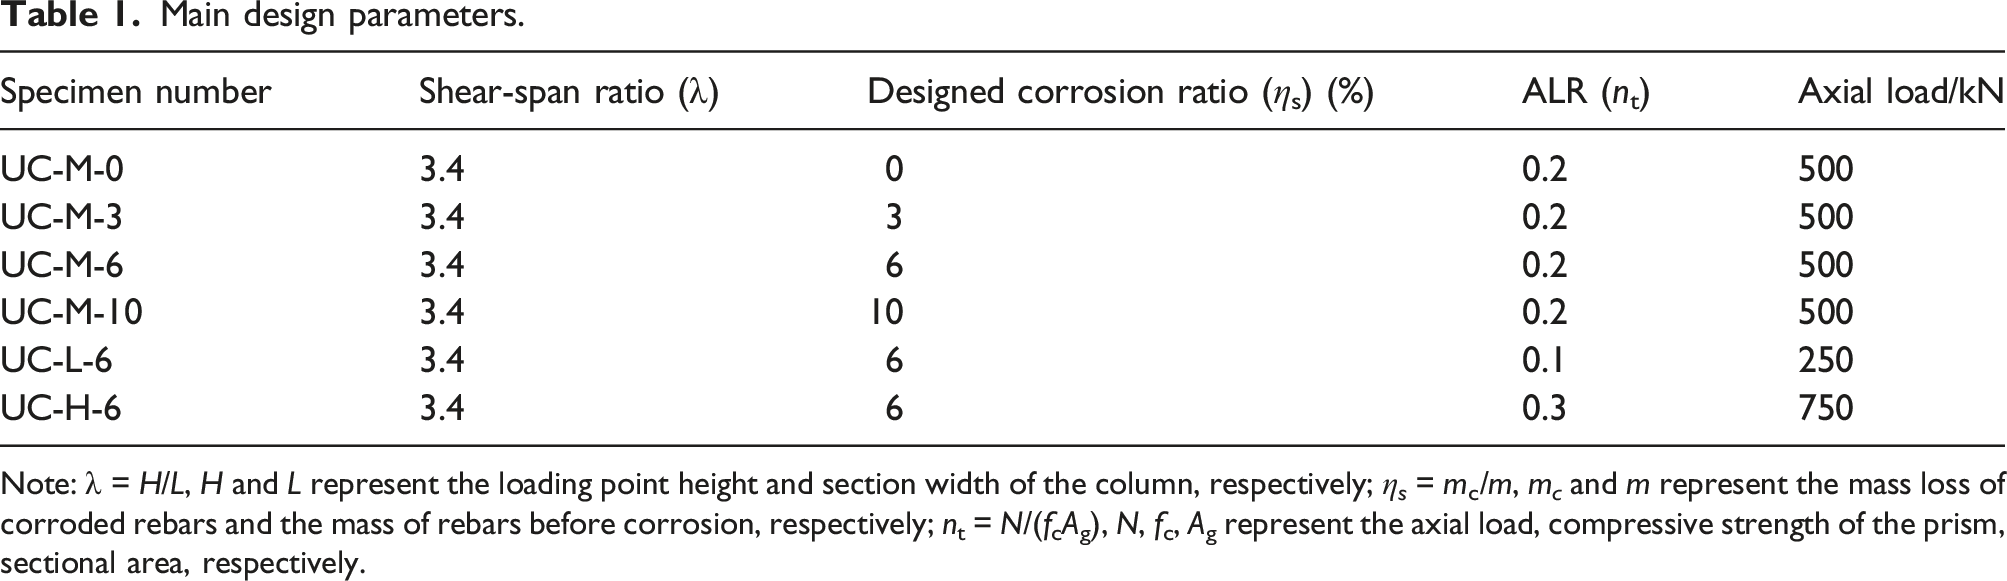
Note: λ = H/L, H and L represent the loading point height and section width of the column, respectively; η s = mc/m, m c and m represent the mass loss of corroded rebars and the mass of rebars before corrosion, respectively; nt = N/(fcAg), N, fc, Ag represent the axial load, compressive strength of the prism, sectional area, respectively.

Reinforcement details and dimensions of specimens. (a) Elevation of the specimens. (b) Section detail of 1-1. (c) Section detail of 2-2. (d) Anchorage of UHSB.
Material properties
RAC
RAC mix proportion and mechanical properties.
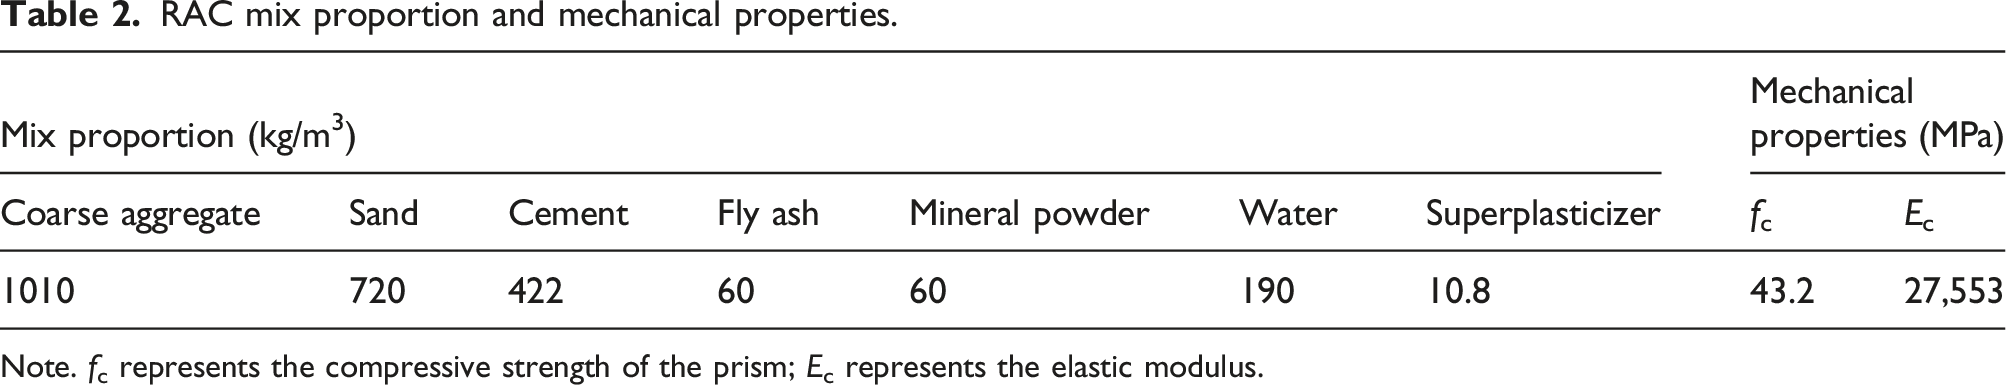
Note. fc represents the compressive strength of the prism; Ec represents the elastic modulus.
Steel bar
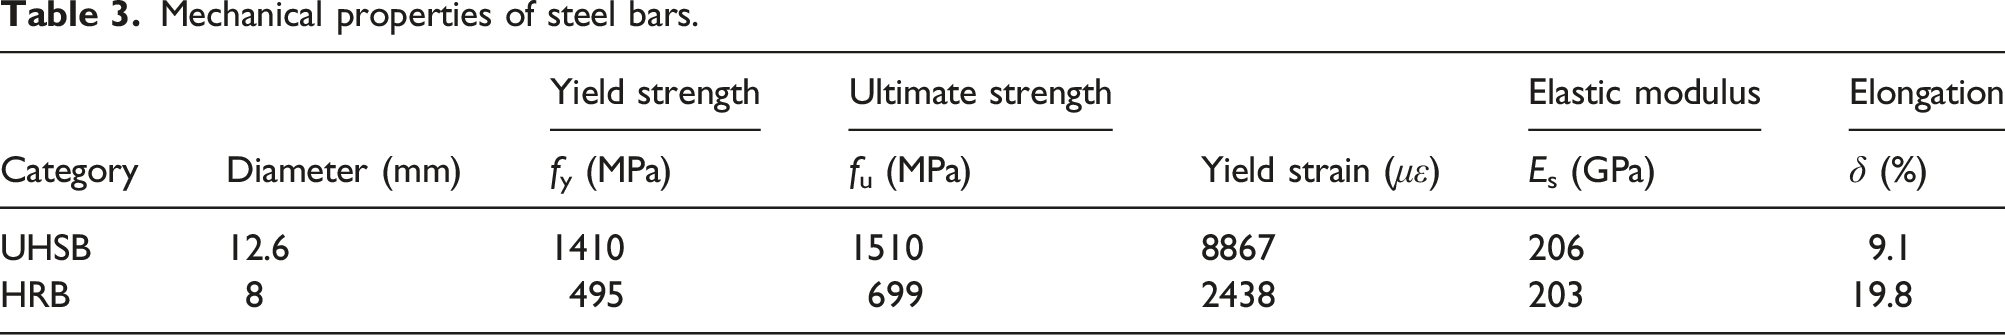
Two types of rebar are adopted in the specimens. The longitudinal bars of the column are UHSB, the others are HRB. Figure 2 shows the comparison of stress-strain curves of the two categories of rebars. It can be found that UHSB has no obvious yield platform and has a higher yield strength of up to 1400 MPa compared with HRB. The detailed mechanical properties of rebars are shown in Table 3. Stress-strain curves of the rebars. Mechanical properties of steel bars.
Corrosion scheme
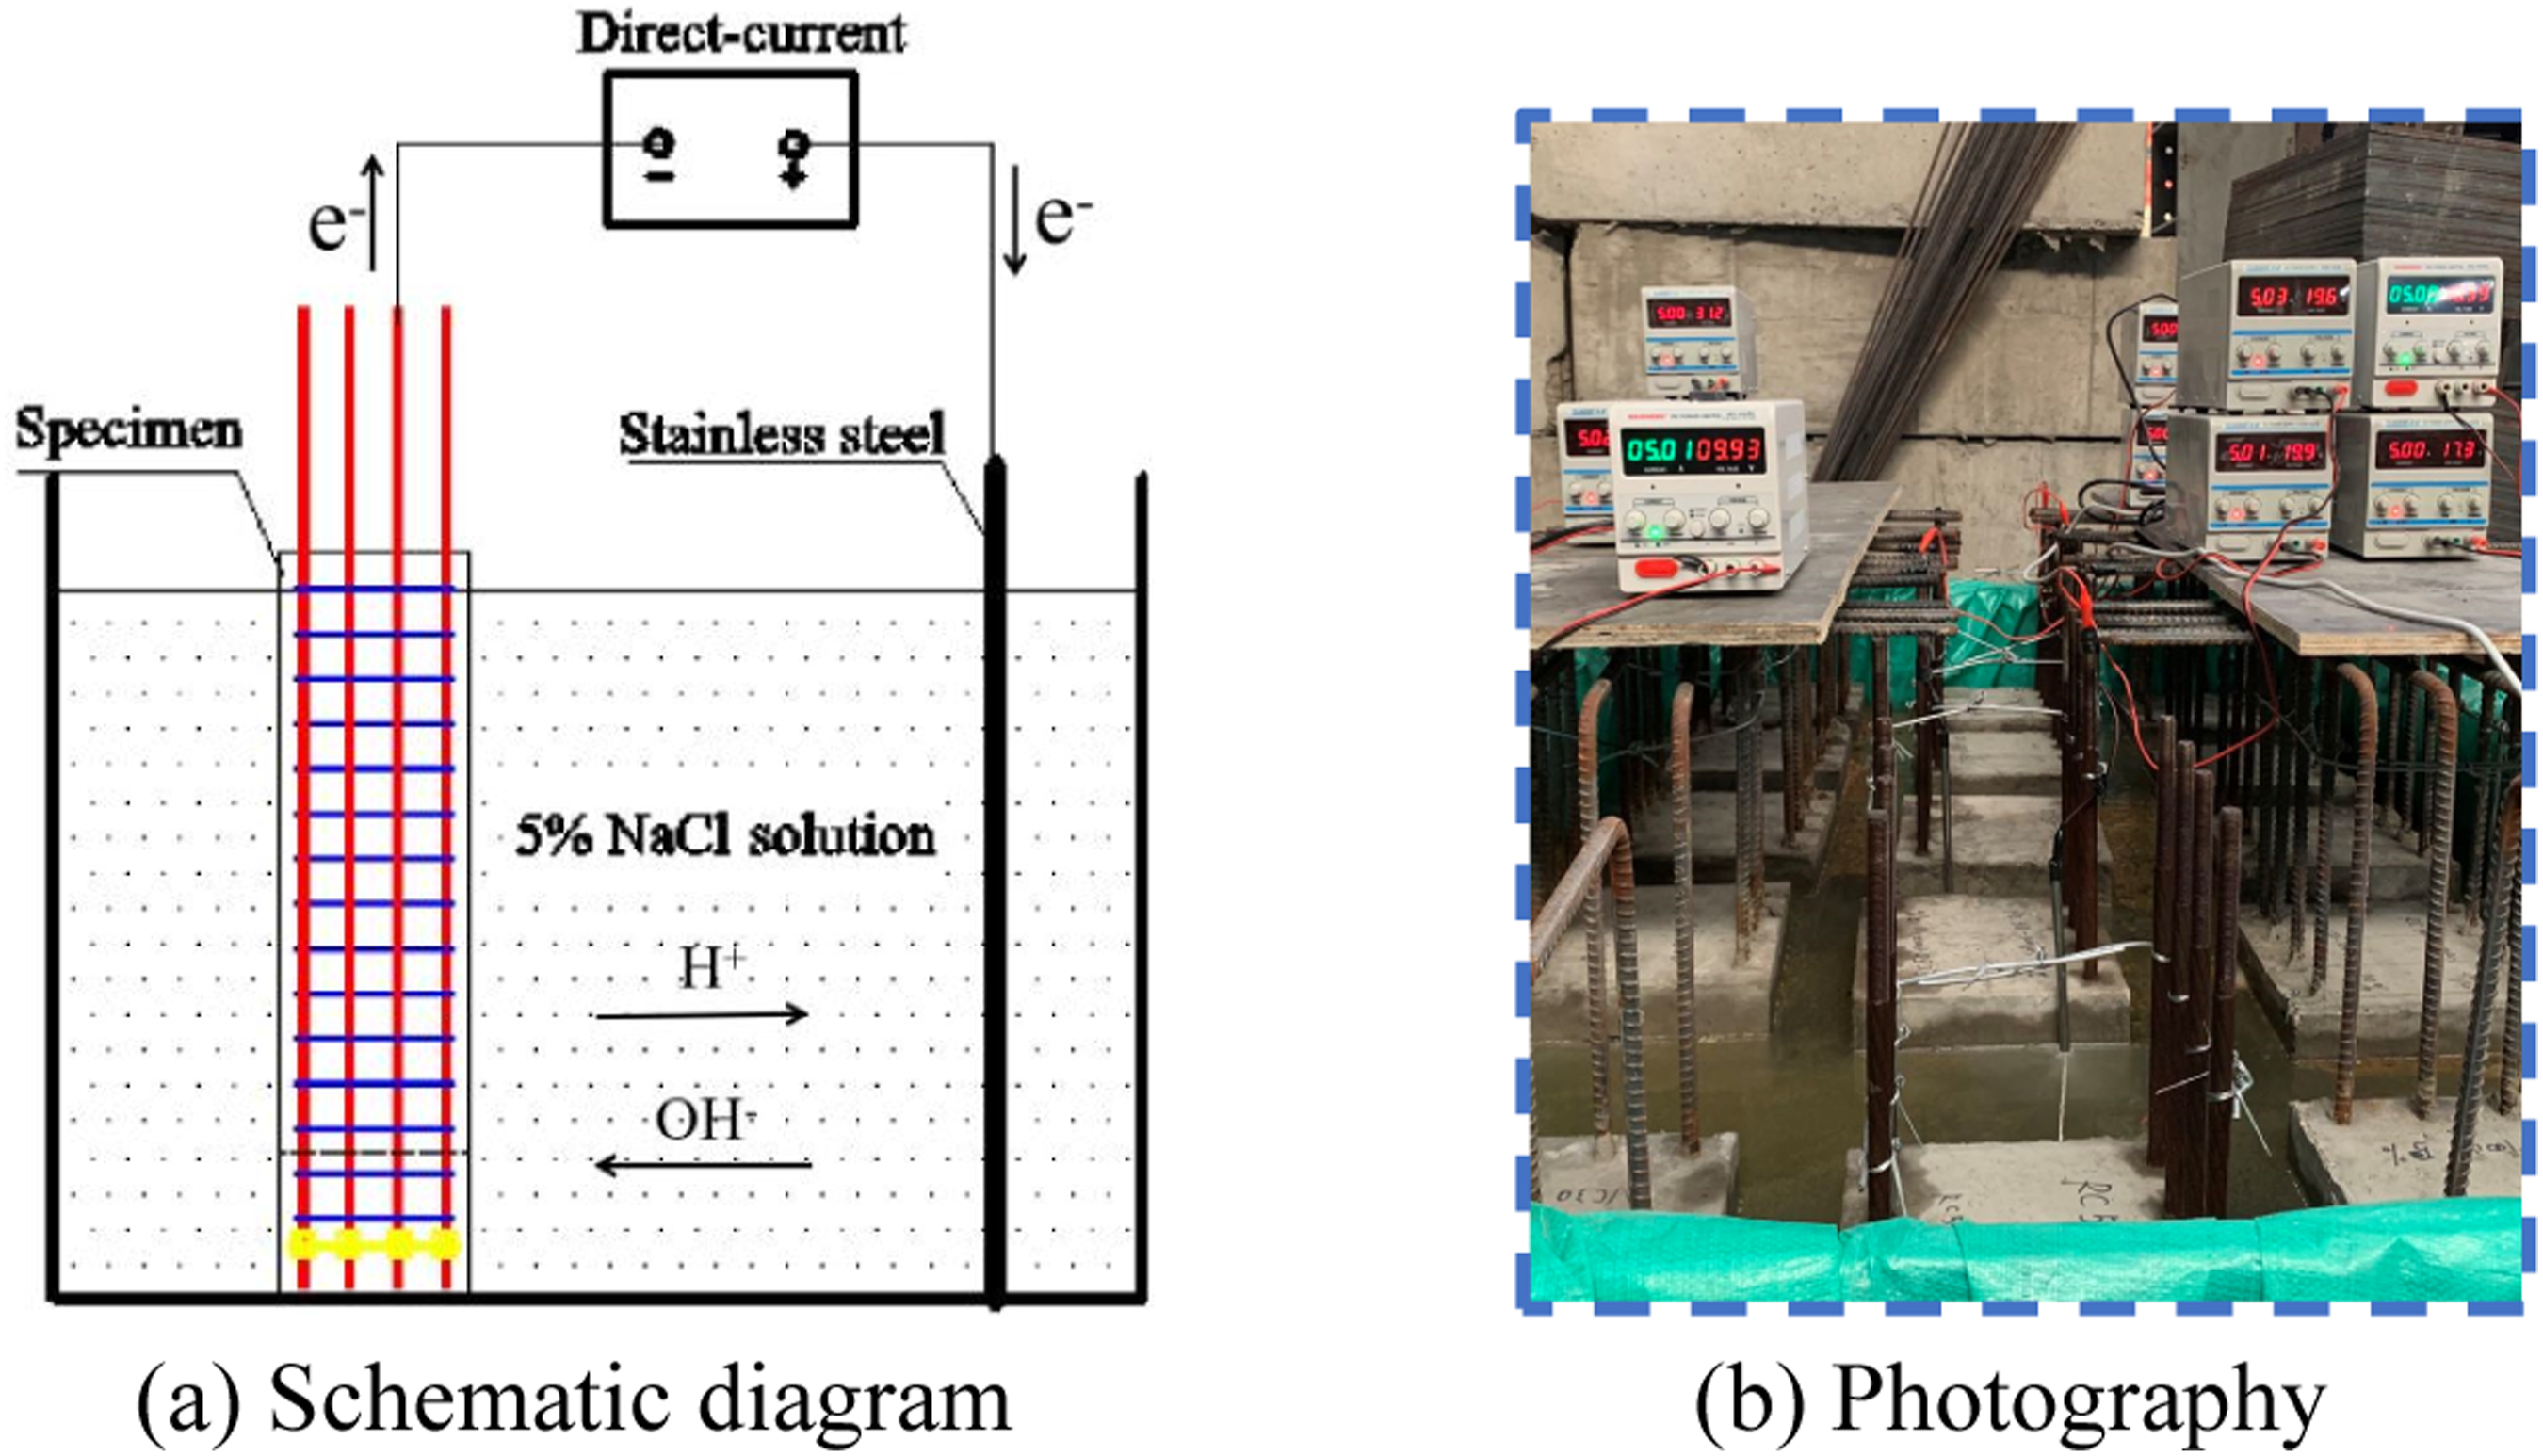
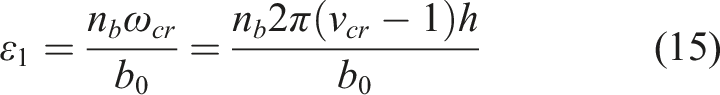
The electrochemical chloride erosion (ECE) process was conducted before making the foundation. Figure 3 shows the device diagram of the ECE. To immerse chloride ions into the concrete and destroy the passivation film on the rebar surface as much as possible, the columns were soaked in 5% sodium chloride solution for 7 days before electricity was applied. The rebars and stainless steel were respectively connected to the positive and negative poles of the power supply to form a circuit with the electrolyte. To ensure a higher corrosion rate and similar corrosion products to the practical engineering, the current density was constant at 0.6 mA/cm2 (Higgins, 2006). The electrification time was defined by Faraday’s law in equation (1). Since the passivation film on the rebar could not be destroyed completely before the electrification, the actual electrification time was increased to 1.2 times to ensure that the corrosion ratio could reach the target value. ECE device. (a) Schematic diagram. (b) Photography.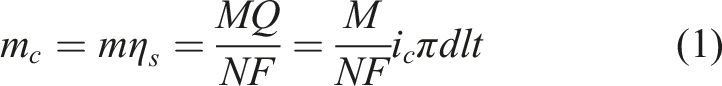
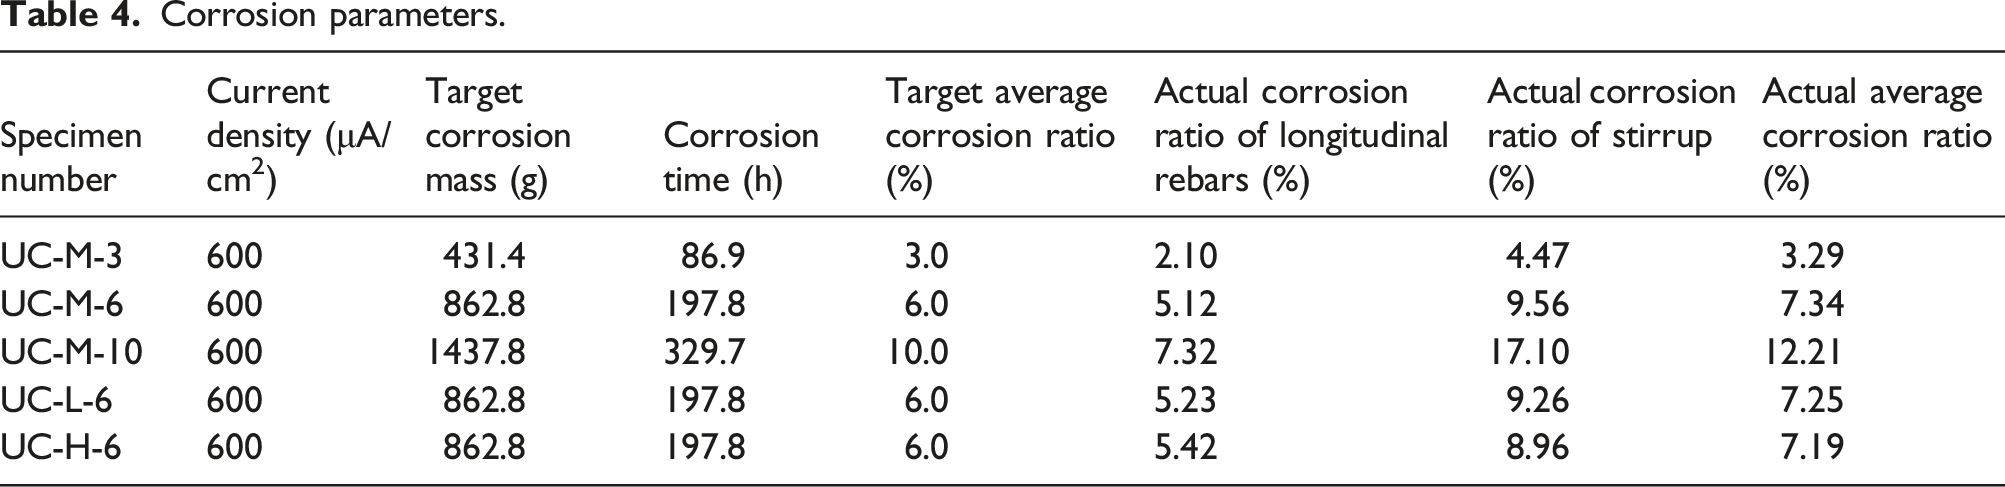
Corrosion parameters.
Quasistatic test device and measurements
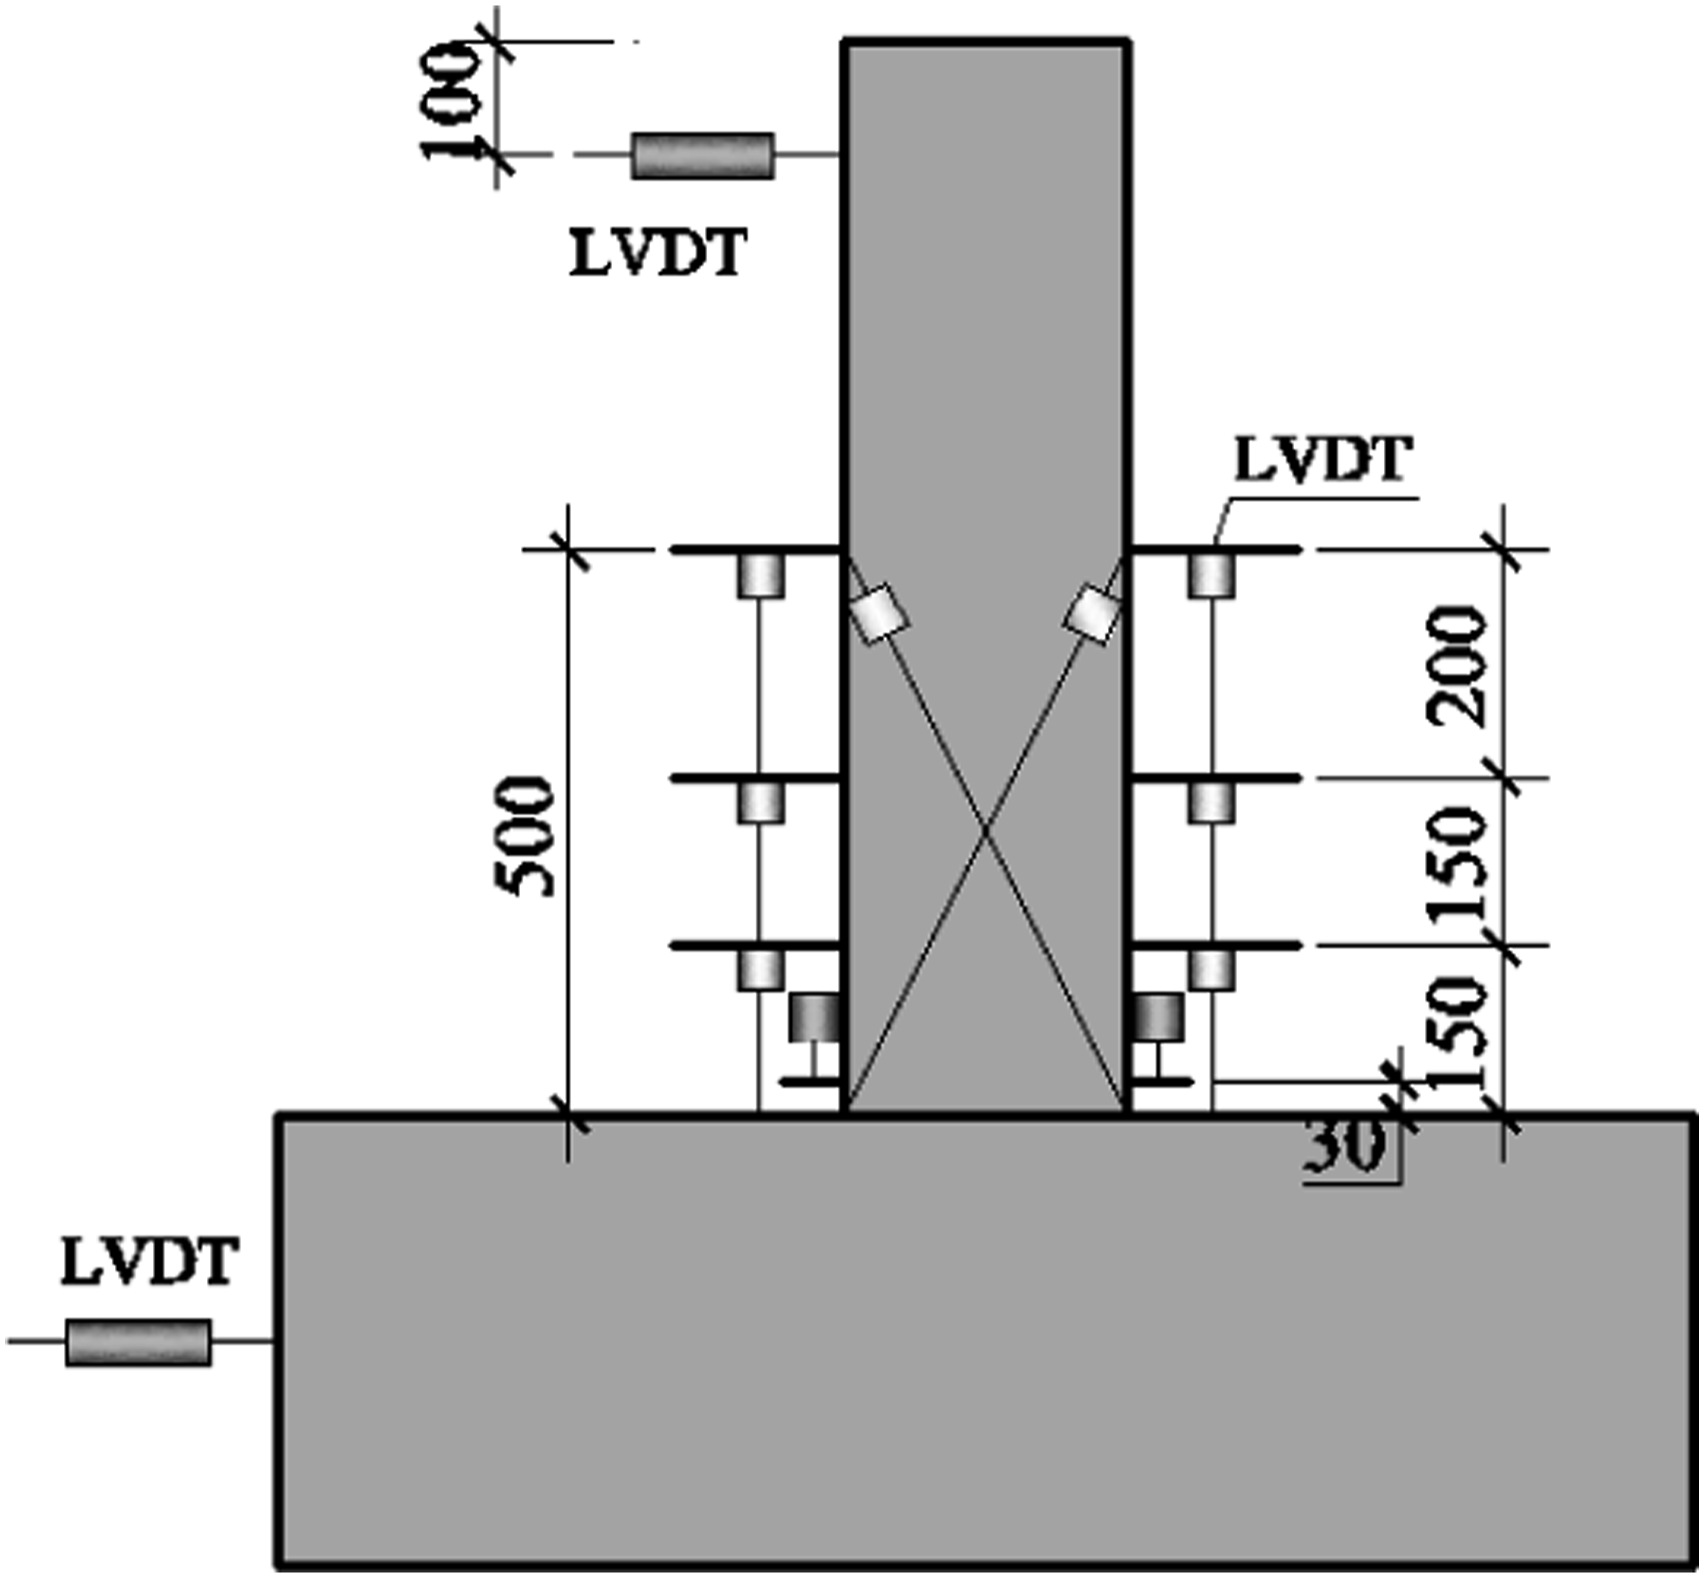
The quasistatic loading device is shown in Figure 4. The vertical constant load and the horizontal cyclic load were respectively applied by the vertical actuator fixed on the reaction frame and the horizontal actuator fixed on the reaction wall. The displacement-controlled loading was adopted throughout the test as shown in Figure 5. The test would be terminated after the horizontal load-carrying capacity decreased to 85% of the peak value or the specimen failed. The linear variable differential transducers (LVDTs) were arranged to monitor the horizontal displacement and the deformation of the specimens, as shown in Figure 6. Test device. (a) Schematic diagram. (b) Photography. Loading program. The measurements.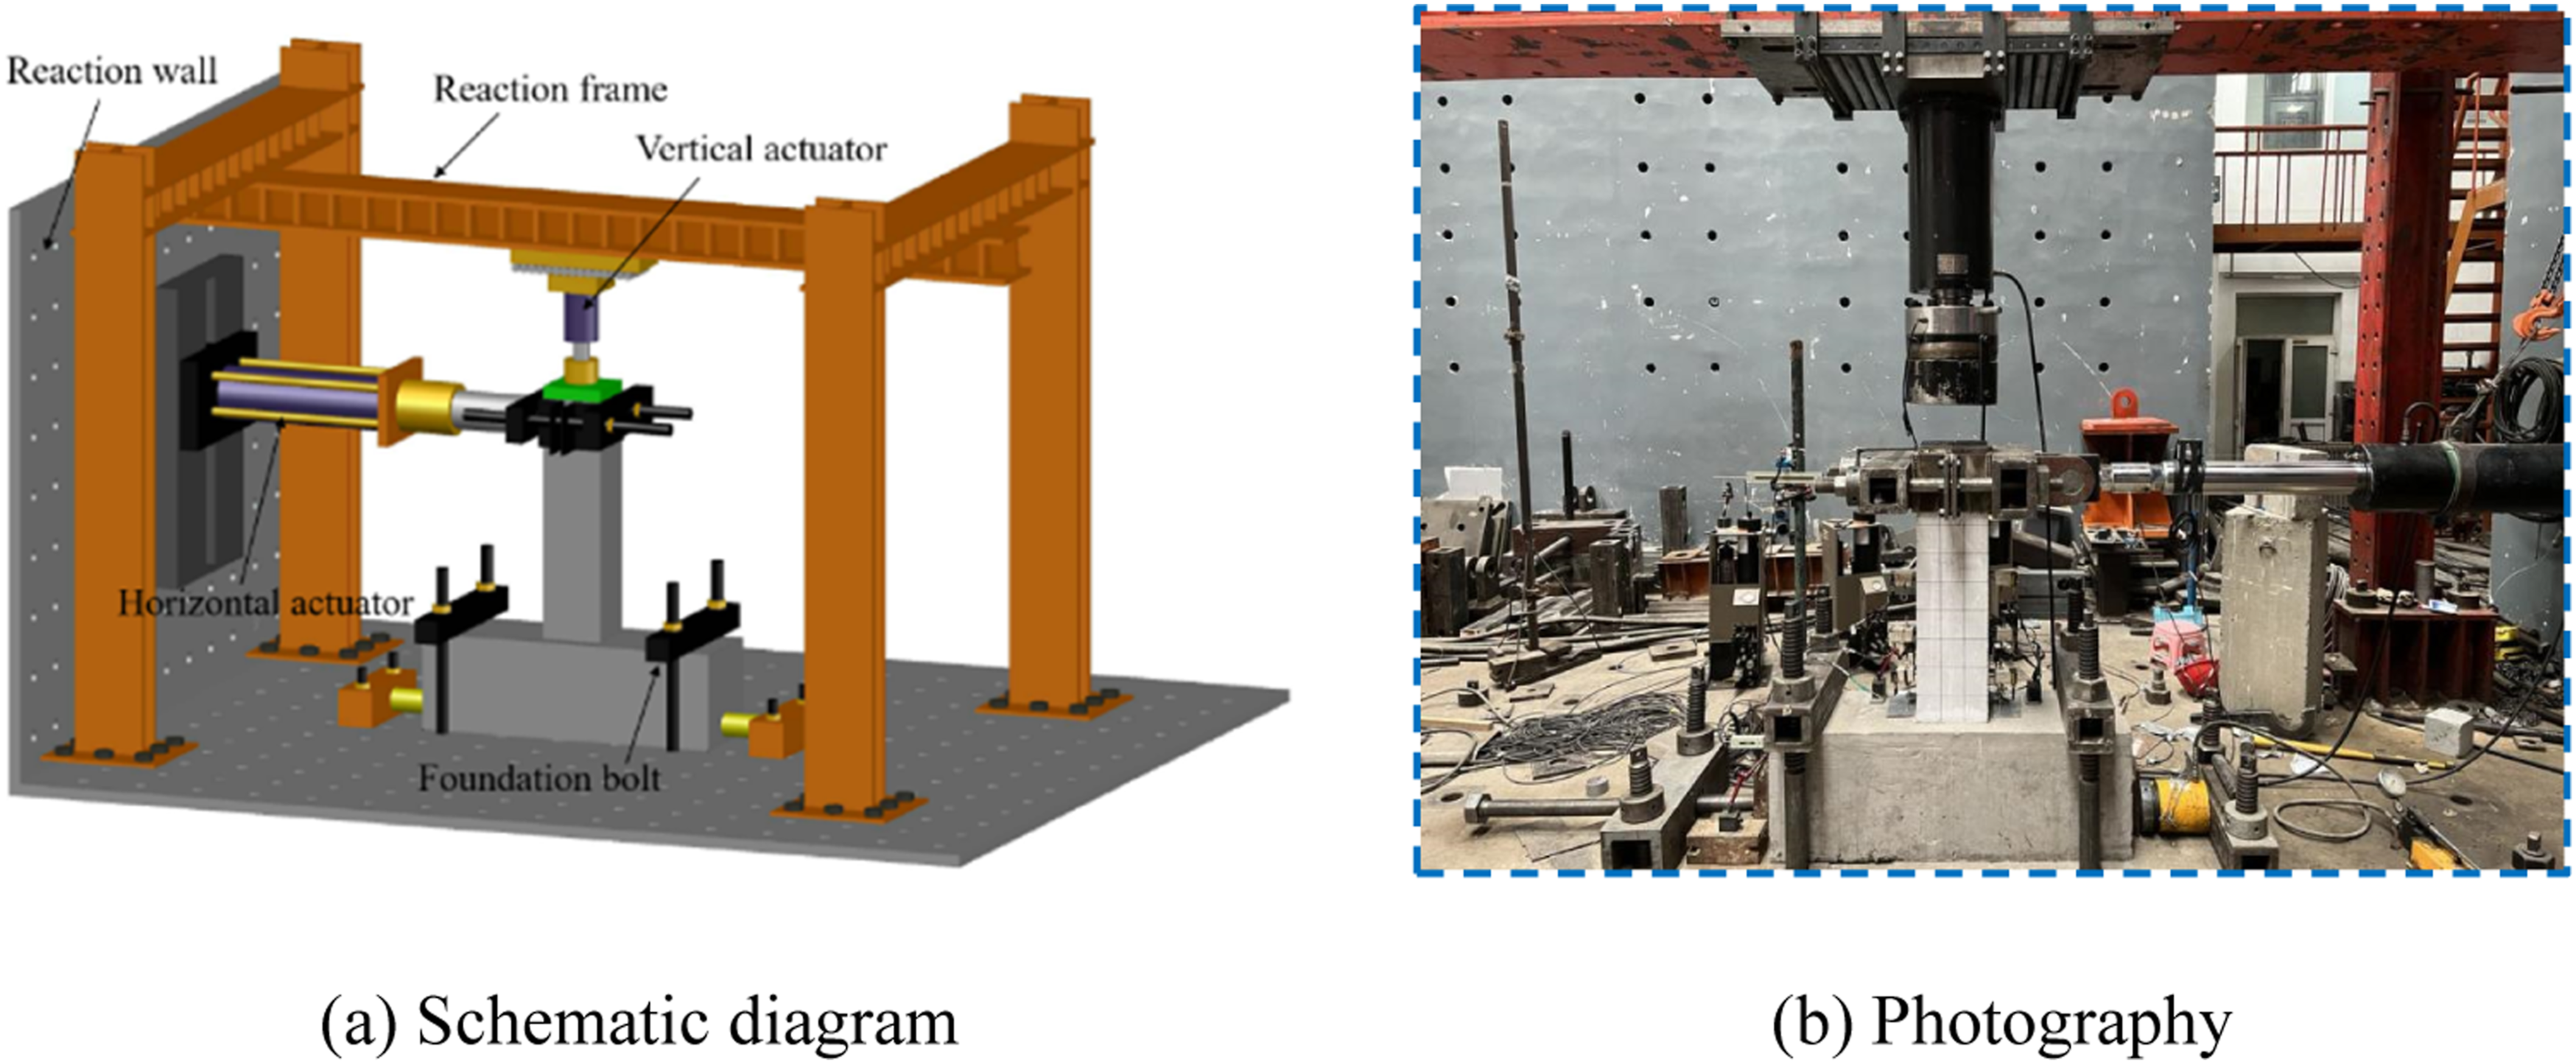

Test results and analysis
Observation of corrosion damage
As shown in Figure 7, the surface of the specimens was covered with accumulated brown nodular corrosion products. The corrosion damage degree of each specimen could be preliminarily judged since the accumulation of corrosion products increased with the increase of the corrosion ratio. Distribution of corrosion products.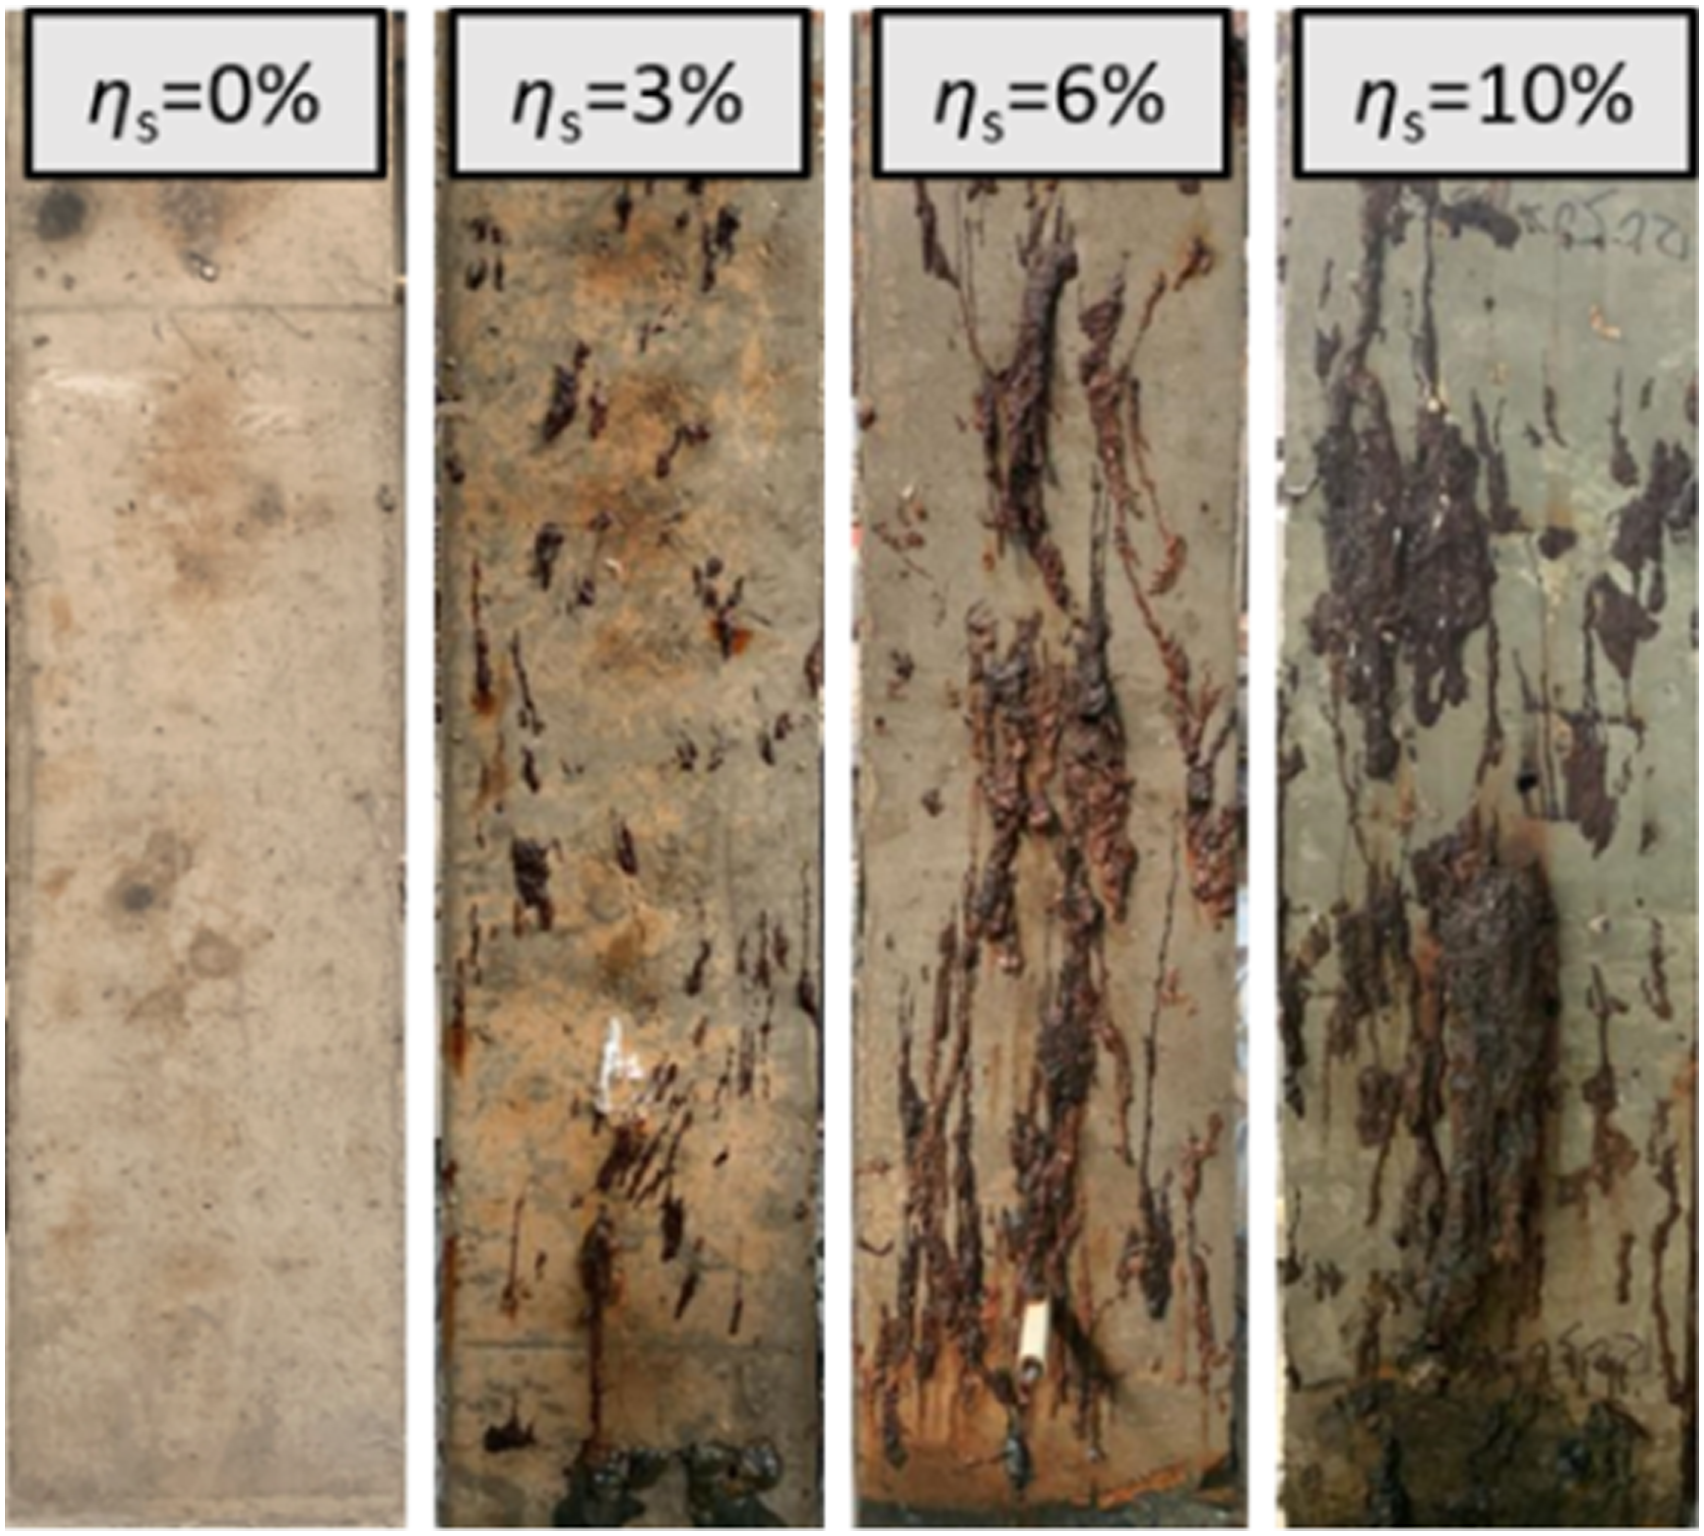
With the accumulation of corrosion products, the internal corrosion-induced cracks would gradually expand to the surface of the concrete, forming macroscopic cracks. It can be found from the macroscopic crack distribution shown in Figure 8 that: The corrosion-induced cracks were mainly distributed along the longitudinal bar and stirrup positions. Most cracks were distributed near the column edge, which were wider than the cracks at the middle of the column due to the lack of the stirrup and surrounding concrete restraint on the cover concrete. In addition, since the corrosion products could permeate from the existing pores and corrosion cracks into the solution and the corrosion products would not accumulate with the increase of corrosion ratio, the crack widths of specimens with different corrosion ratios vary minor, ranging from 0.1 mm to 0.5 mm. Distribution of corrosion-induced cracks.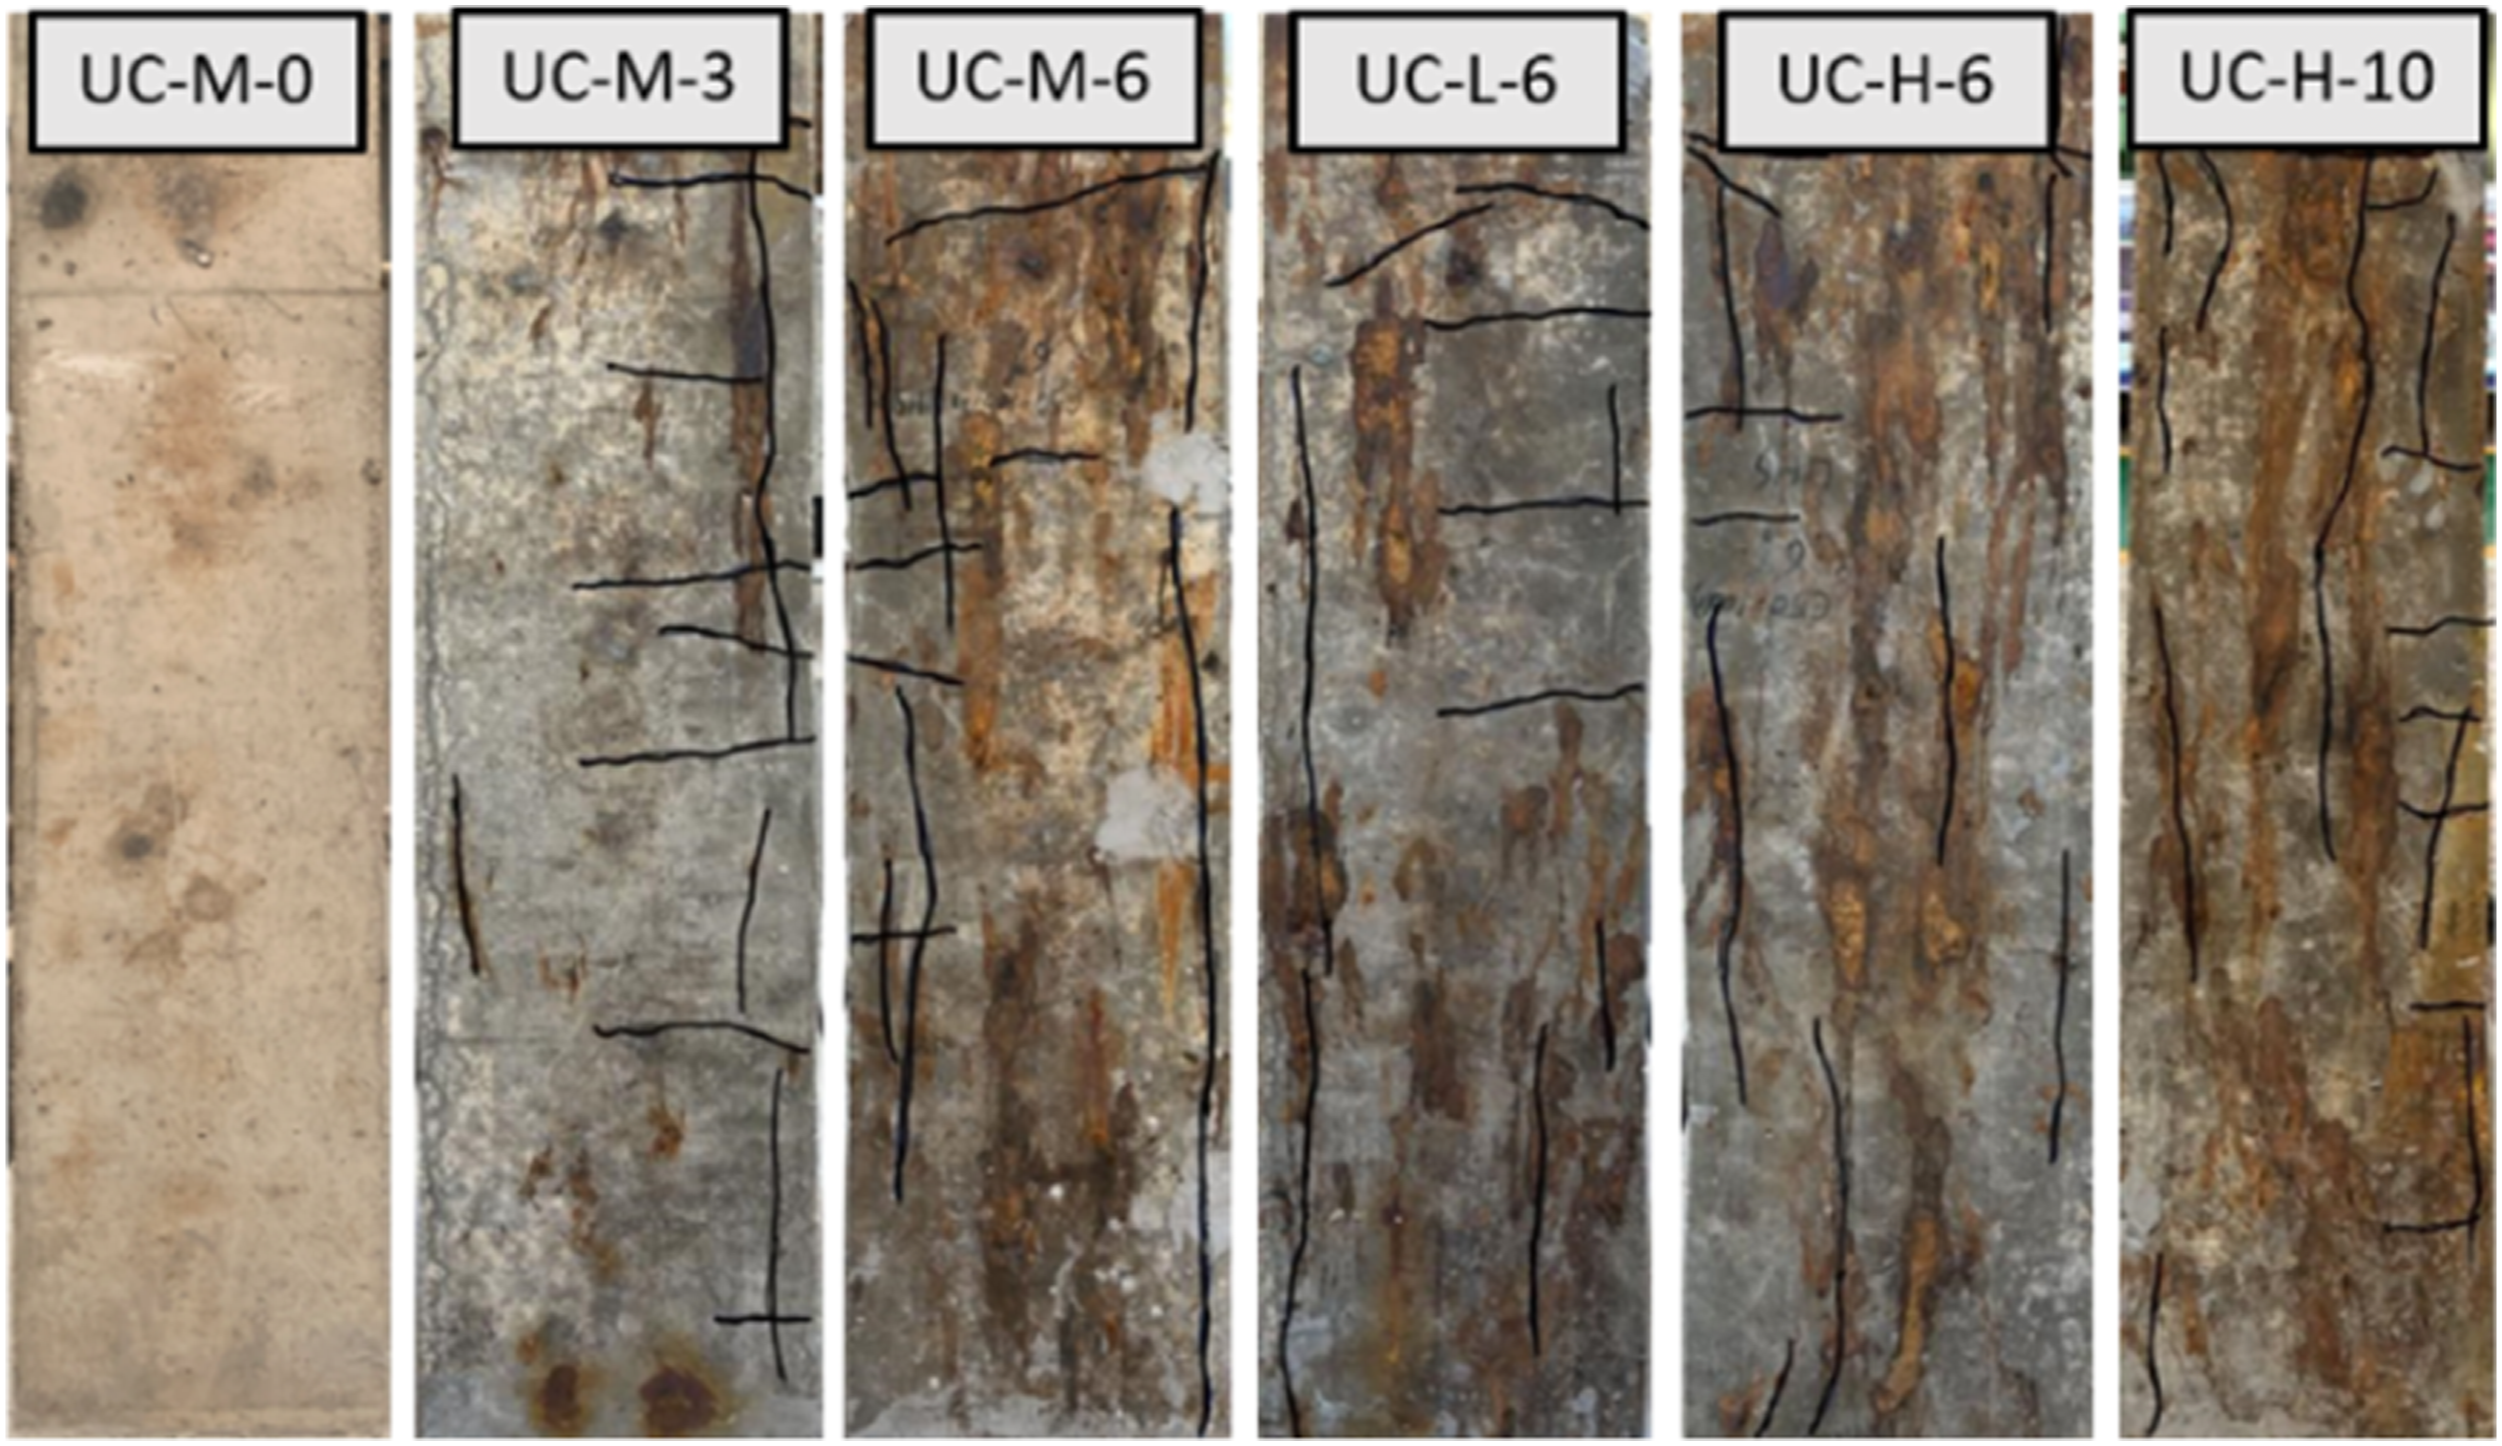
As the oxygen and water near the stirrup position are more abundant, which is easier to react with the cathode electrons to generate OH−, and the corrosion products of the stirrups can permeate from cracks in time, the corrosion process of the stirrups would be accelerated. Therefore, the stirrups suffered obvious pitting corrosion and the side of the rebars near the concrete surface had a higher corrosion degree as shown in Figure 9. Corroded rebar samples.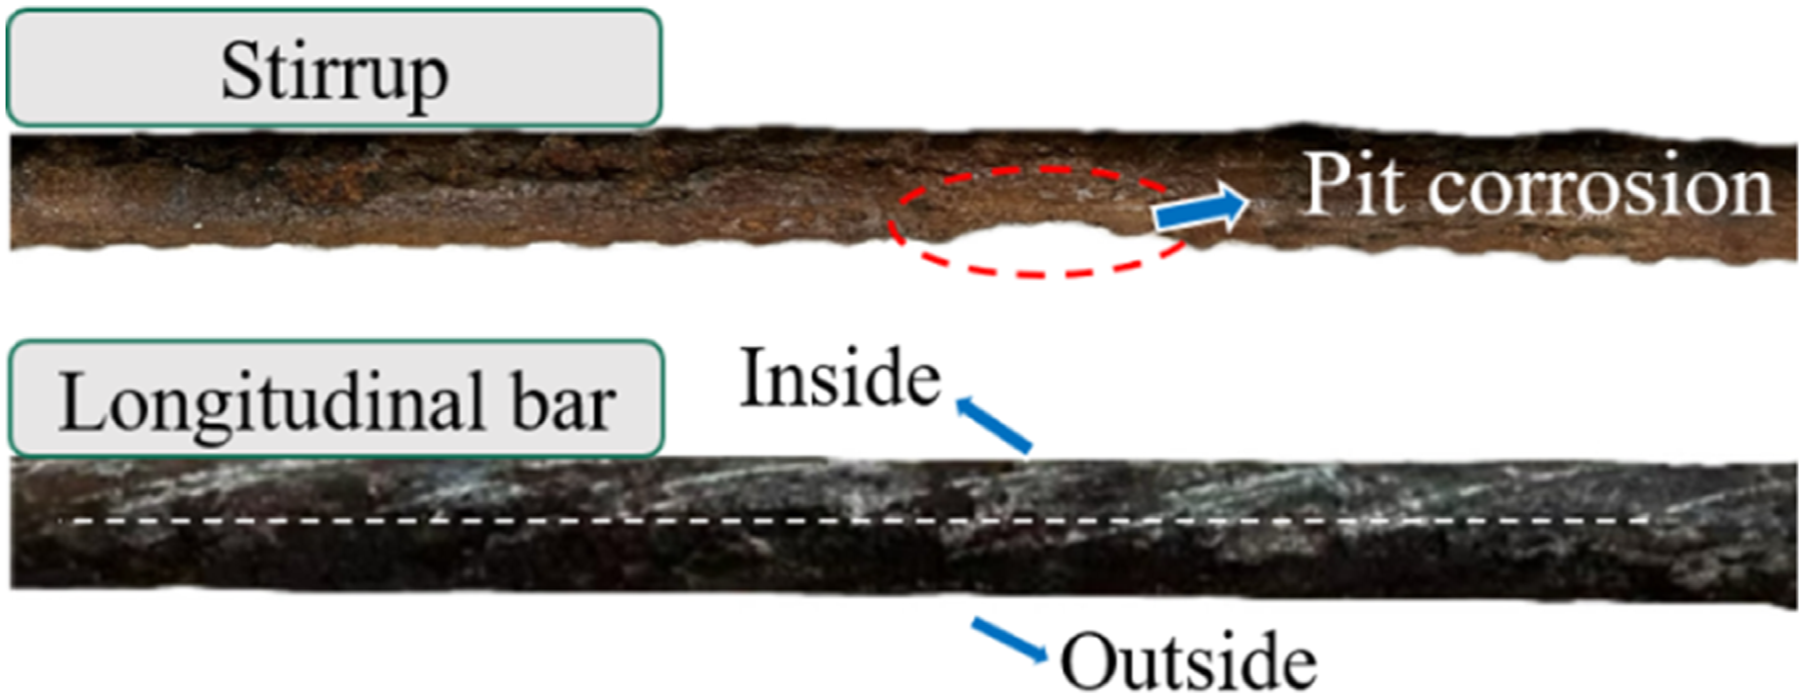
Observation of quasi-static test
The damage development of the specimens is shown in Figure 10. There were some similarities in the damage development. Firstly, there was no obvious observation at the elastic stage. Then after reaching the cracking load, horizontal cracks began to appear within 200 mm of the column base. When the drift reached 0.5%, the distribution range of horizontal cracks increased to 300 mm. After 0.75% drift, the existing horizontal cracks began to extend obliquely, and the distribution range of the cracks increased to about 500 mm. After 1.25% drift, there were few new cracks, in addition to the existing cracks continuing to extend obliquely, the damage was mainly manifested in the increase of the crack width. With the increase of the loading drift, the concrete at the bottom of the columns began to peel off, in addition to the increasing crack width, the damage was mainly manifested in the aggravation of concrete crushing and spalling. Finally, due to the extensive peeling of the cover concrete and the fracture of the stirrups, the corroded columns underwent brittle flexural-shear failure. Damage development observation. (a) UC-M-0. (b) UC-M-3. (c) UC-M-6. (d) UC-M-10. (e) UC-L-6. (f) UC-H-6.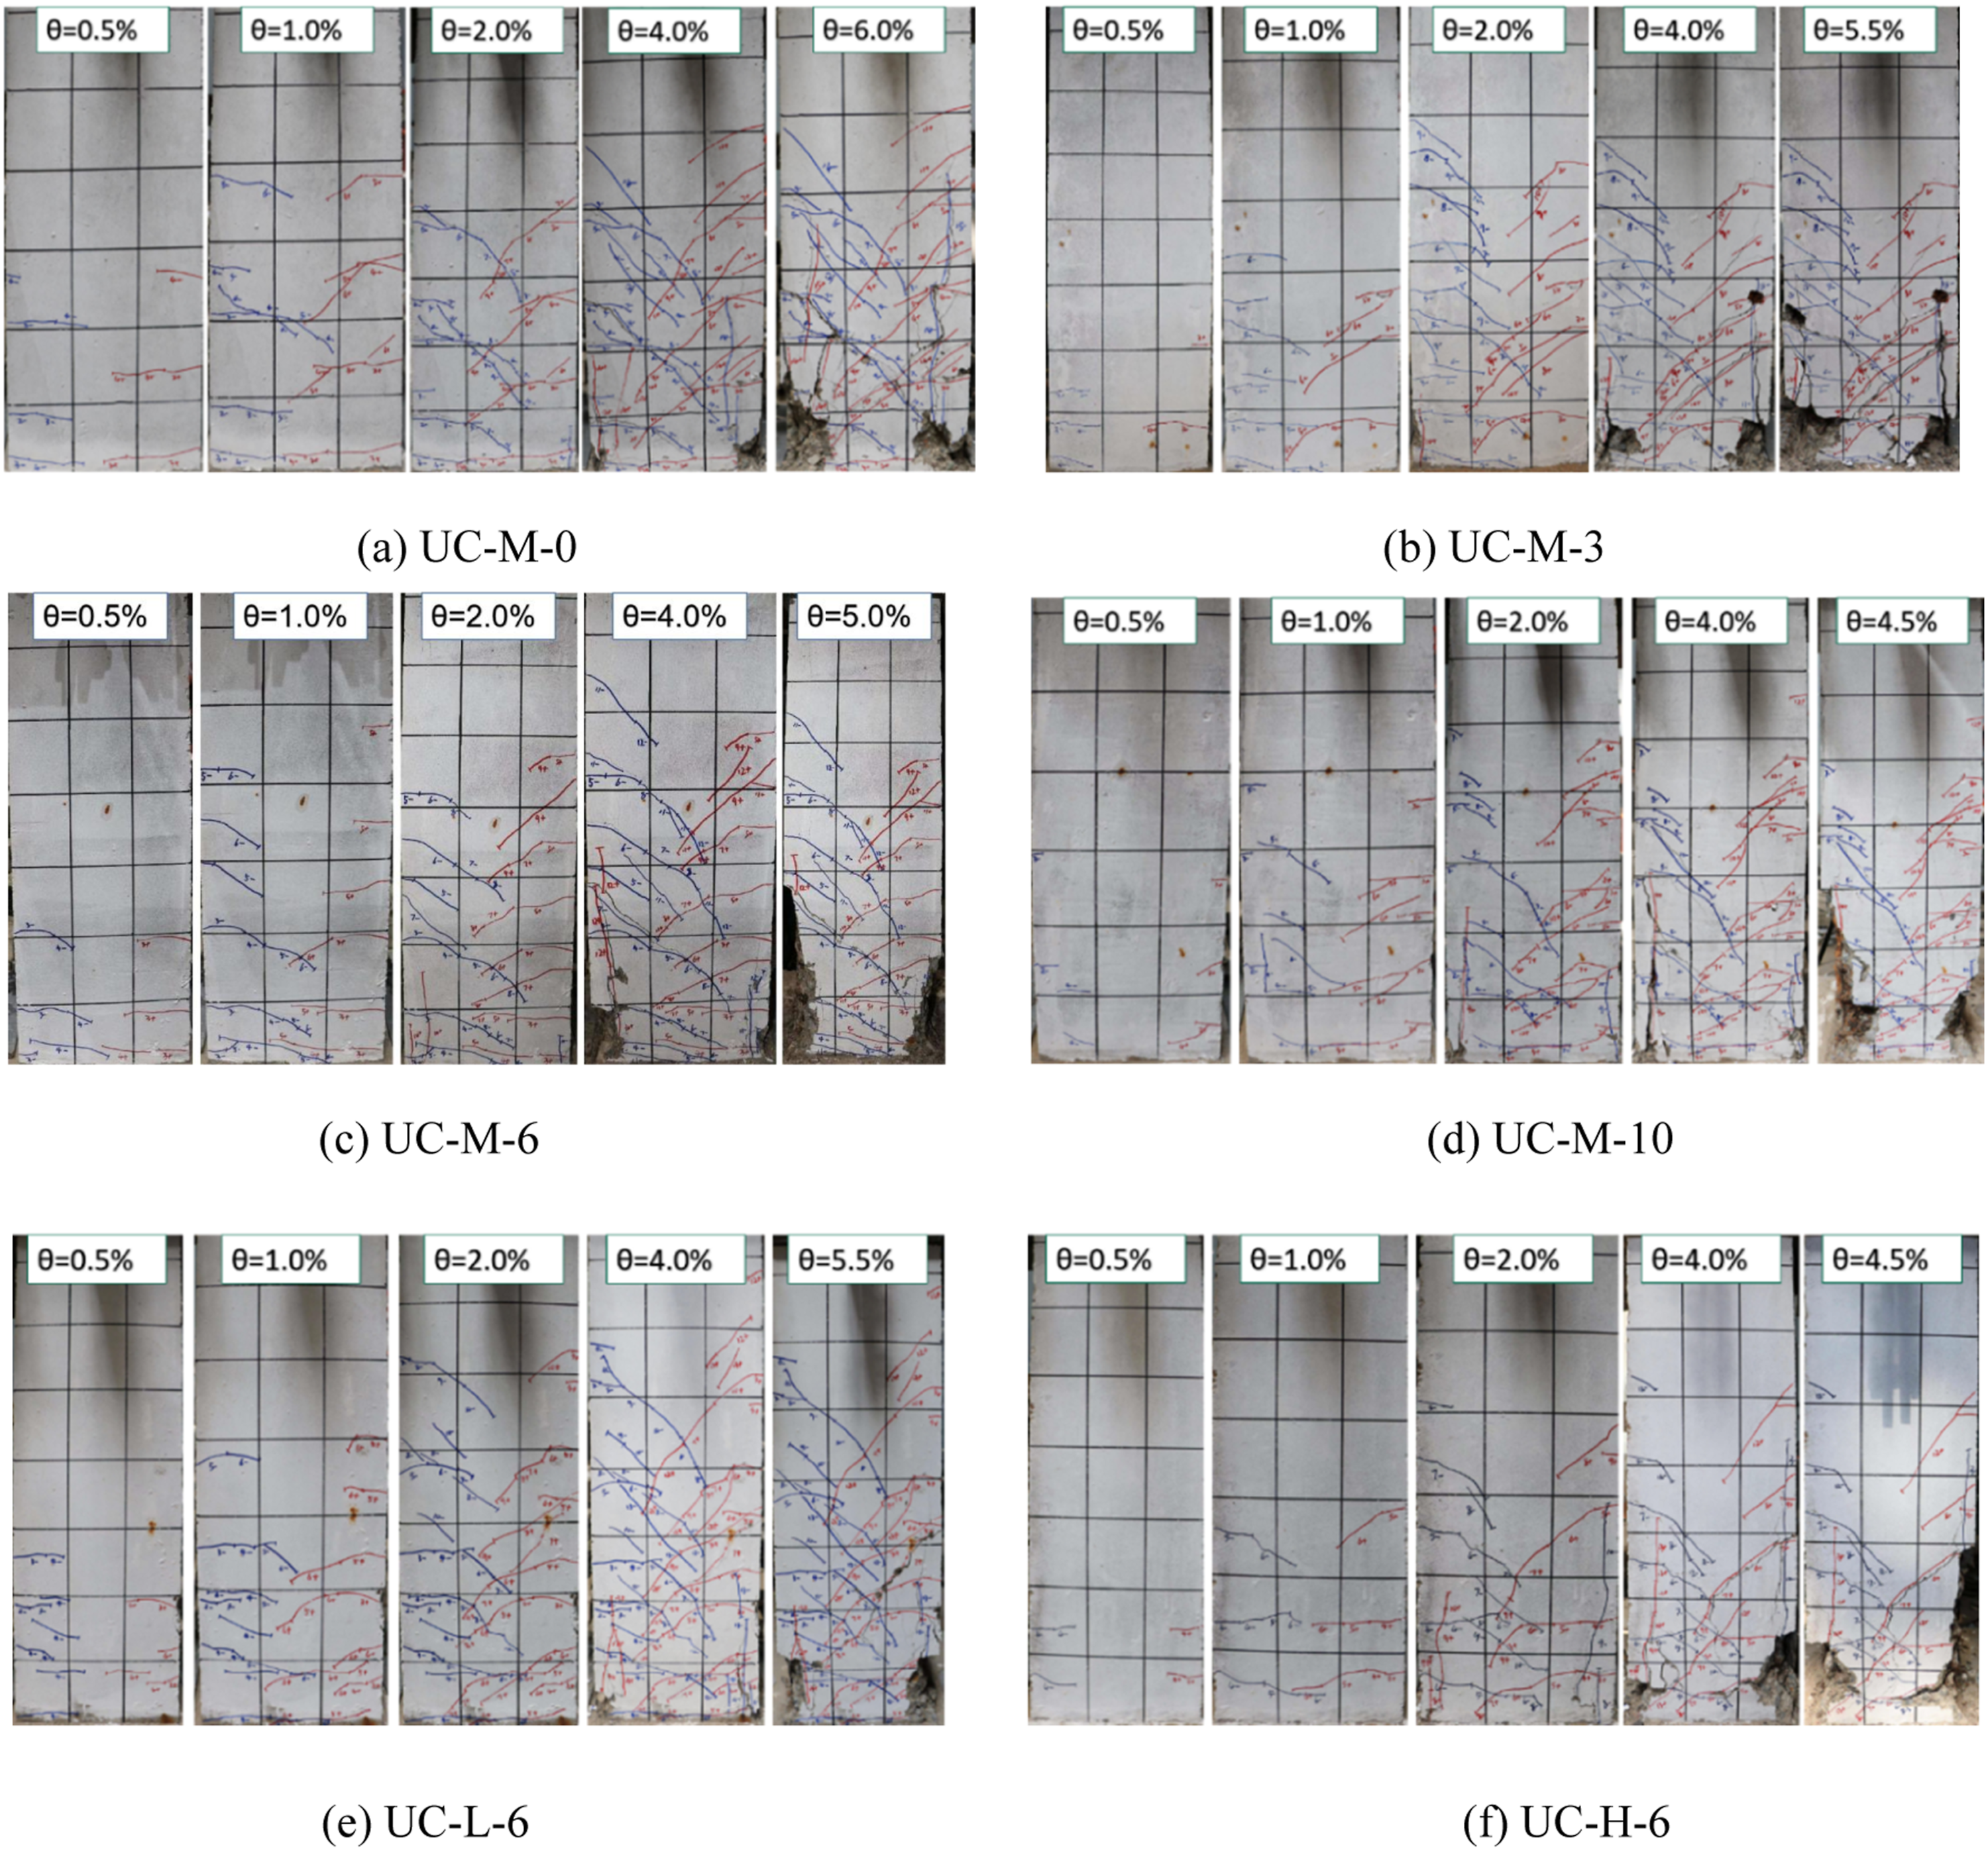
However, there are also some differences in the damage development for each specimen due to the different corrosion ratios and ALR. For uncorroded specimen UC-M-0, when the drift reached 2.5%, compression vertical cracks and spalling of concrete at the column bottom began to appear, and the horizontal load-carrying capacity began to decline after 4.5% drift. Due to the corrosion caused initial damage to the concrete cover, and the higher ALR would make the concrete damage more serious, the peeling of the concrete occurred earlier with the increase of the corrosion ratio and ALR. Among them, the concrete of UC-M-3, UC-M-6, and UC-M-10 began to peel off when the drift reached 1.75%, 1.5%, and 1.25% respectively, and the concrete peeling of UC-L-6 with lower ALR and UC-H-6 with higher ALR occurred after 2% and 1.25% drift, respectively.
The failure drift decreased with the increase of the corrosion ratio. For UC-M-0, although the test was terminated at 6% drift for the safety consideration, the horizontal load-carrying capacity didn’t decrease to 85% of the peak value. But when UC-M-3 was loaded to 6% drift, the stirrups broke suddenly, the concrete was crushed, the longitudinal bars buckled, and the specimen failed. And UC-M-6 and UC-M-10 failed at 5% and 4.5% drift respectively due to the shear failure of concrete and the corroded stirrup fracture. In addition, due to the higher compressive stress of the column with high ALR, the damage of cover concrete and stress of stirrups developed faster, resulting in earlier spalling of the cover concrete and earlier reaching of the ultimate stress state of the confined concrete during the horizontal loading process. The failure drift decreased with the increase of ALR under the same corrosion ratio, and the failure drift of UC-L-6 and UC-H-6 were 5.5% and 4.5%, respectively.
Figure 11 shows the failure details of specimens. Since the corrosion led to initial damage to the concrete of the column, the damage was primarily concentrated in the existing corrosion-induced cracks when the corroded column was subjected to horizontal load. Consequently, it can be clearly observed that the cover concrete of the corroded column was extensively peeled off, and the peeling range of the cover concrete increased with increasing corrosion ratio. In particular, stirrup fractures occurred in specimens with higher corrosion ratios, and X-shaped shear cracks appeared in concrete. On one hand, due to the initial damage caused by corrosion, a large area of the cover concrete peeled off during the later loading period, which reduced the effective shear section of the column. On the other hand, non-uniform corrosion of rebars, especially local pitting, reduced the effective diameter of the stirrup and led to stress concentration, causing the stirrup to reach the yield or even break prematurely. Therefore, the corroded columns with UHSB are more prone to brittle flexural-shear failure at large drift, leading to a decrease in deformation performance. Failure details of specimens.
Hysteresis performance
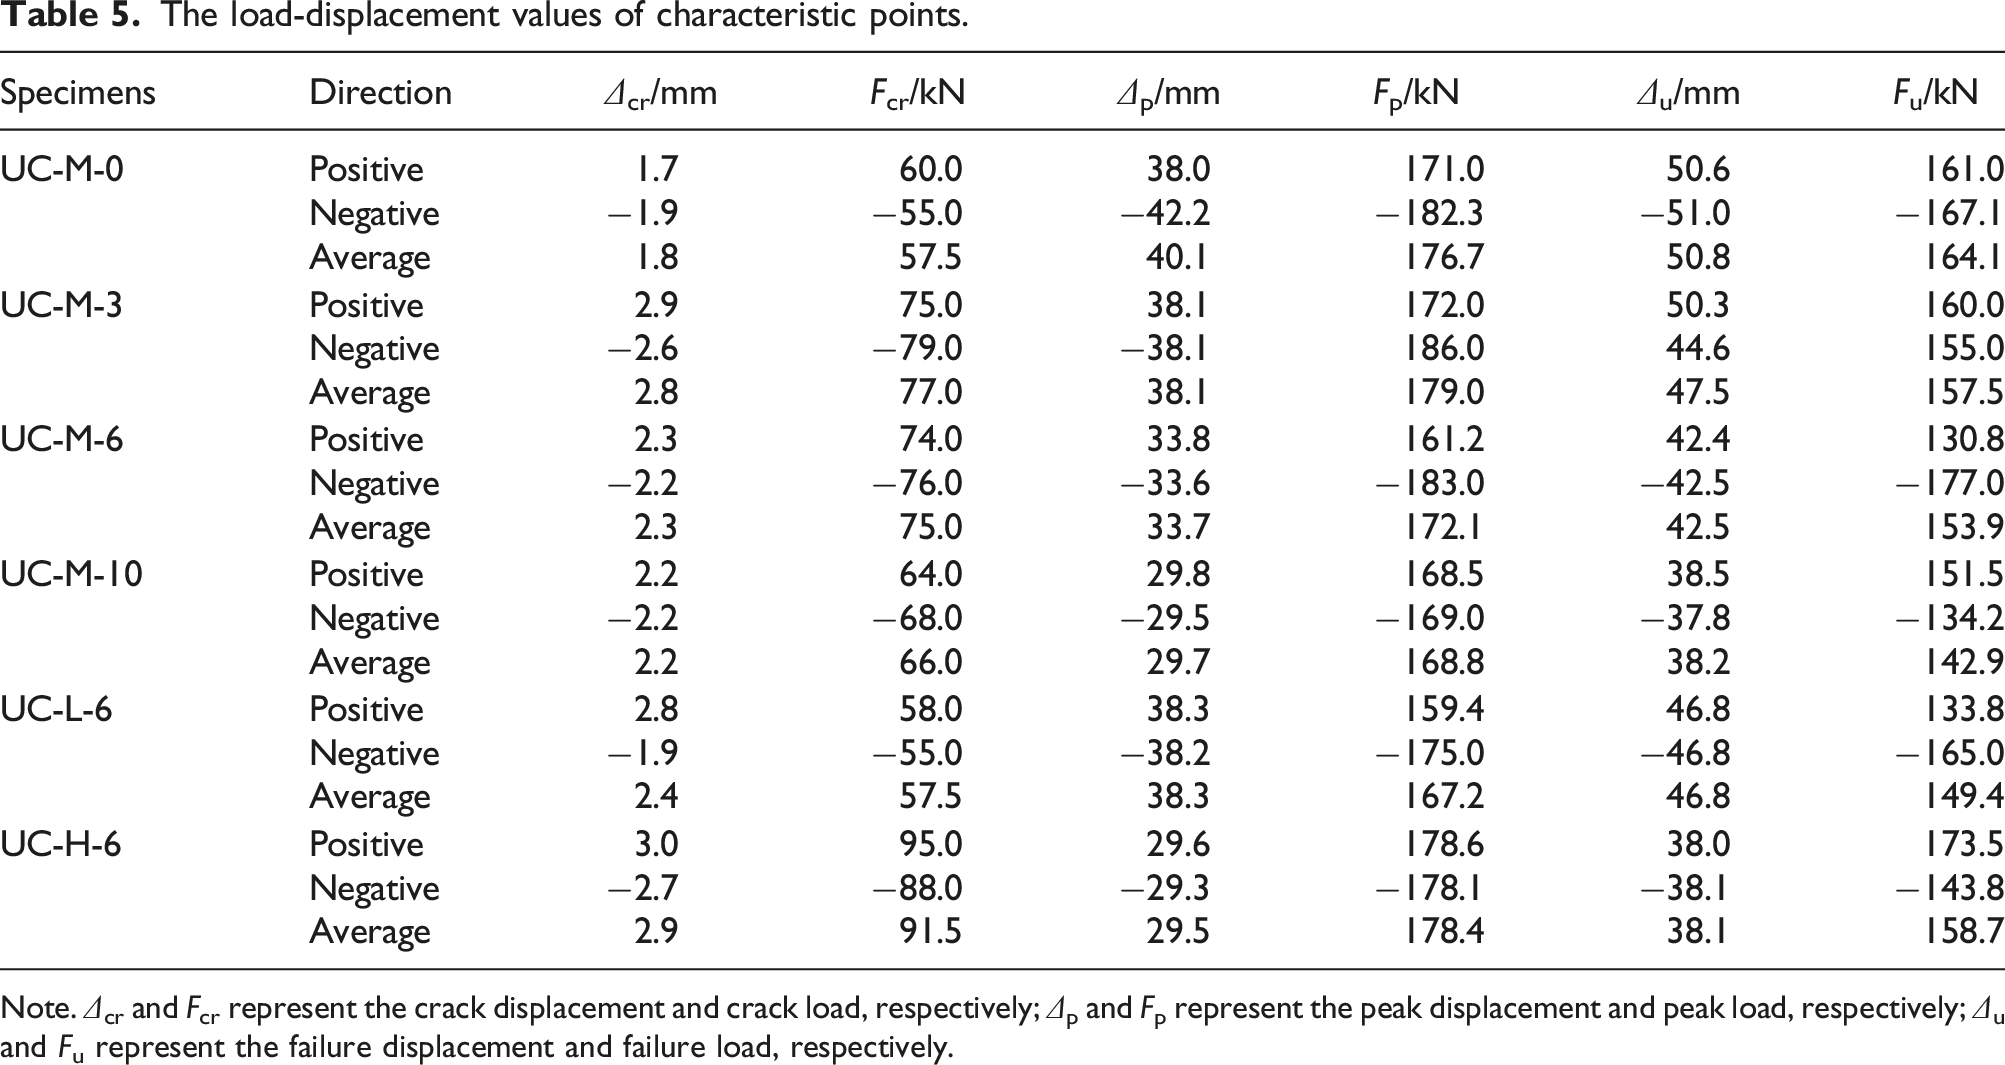
Figure 12 shows the hysteresis curves, Figures 13 and 14 show the skeleton curves, and the load-displacement values of the characteristic points were shown in Table 5. It can be found that: (1) There are some similarities in the shape and development of the hysteresis curves of the specimens. At the initial loading stage, the hysteresis curves were approximately linear as the specimens were in the elastic stage and had no obvious damage. When the specimens reached the elastic-plastic stage with the increase of damage accumulation, the hysteresis loop presented a flag shape with a pinching effect, showing excellent self-centering performance. At the later loading stage, the hysteresis curve gradually presented a fusiform shape, the pinch effect was weakened, and the residual drift was increased. (2) As the damage of cover concrete would be aggravated with the accumulation of corrosion products, the corrosion also reduced the constraint on concrete and the shear resistance of stirrups. Although the UHSB was hard to yield during the loading process, the specimen would reach its peak horizontal load-carrying capacity when the concrete in compression reached its compressive strength, and the specimen reached the failure state when the concrete failed or even the corroded stirrups were sheared fracture. Therefore, the peak horizontal load-carrying capacity of the specimens had a minor difference. Compared with the uncorroded specimen, the peak horizontal load-carrying capacity of the specimens with 6% and 10% corrosion ratio was only reduced by about 3.4% and 5.6%, respectively. Hysteresis curves. (a) UC-M-0. (b) UC-M-3. (c) UC-M-6. (d) UC-M-10. (e) UC-L-6. (f) UC-H-6. Skeleton curves. (a) Effect of corrosion ratio. (b) Effect of ALR. The load-displacement values of characteristic points. Note. Δcr and Fcr represent the crack displacement and crack load, respectively; Δp and Fp represent the peak displacement and peak load, respectively; Δu and Fu represent the failure displacement and failure load, respectively.


However, as the development of concrete damage was accelerated under a higher corrosion ratio or ALR, the deformation performance decreased with the increase of corrosion ratio and ALR. For uncorroded specimen UC-M-0, the peak drift is 5%, and the ultimate drift can exceed 6%. Compared with UC-M-0, the peak displacement of UC-M-3, UC-M-6, and UC-M-10 decreased by 5.0%, 15.9%, and 25.9% respectively, and the ultimate displacement decreased by more than 6.5%, 16.3%, and 24.8% respectively. Compared with UC-L-6 with a lower ALR, the ultimate displacement of UC-M-6 and UC-H-6 decreased by 9.2% and 18.6%, respectively. In addition, all specimens showed excellent drift-hardening performance before failure, that is, steel corrosion had a minor effect on the drift-hardening performance of specimens.
Strength and stiffness degradation
Strength and stiffness degradation can reflect the horizontal load-carrying capacity stability and the damage development law of the specimens. Figure 15 shows the strength degradation curves before 2% drift, and the ordinate μ is the ratio of the maximum load of the second cycle to that of the first cycle at each loading level. It can be found that: Reinforcement corrosion had a minor effect on the strength degradation of RAC columns with UHSB, and the horizontal load-carrying capacity degradation ratio of the specimens was lower than 5%, indicating that the specimens presented stable load-carrying capacity before the 2% drift. Strength degradation.
From the stiffness degradation rate curves in Figure 16, it can be drawn that: The stiffness degradation trend of the specimens was similar. Before the 1.5% drift, the stiffness degradation was rapid due to continuous concrete cracking. After 1.5% drift, since there were few new horizontal cracks in the concrete, the damage mainly presented in the development of existing cracks and the compression damage of concrete, so the stiffness degradation rate tended to be stable. (a) Stiffness degradations of the specimens with different ALR. (b) Stiffness degradations of the specimens with different corrosion ratio.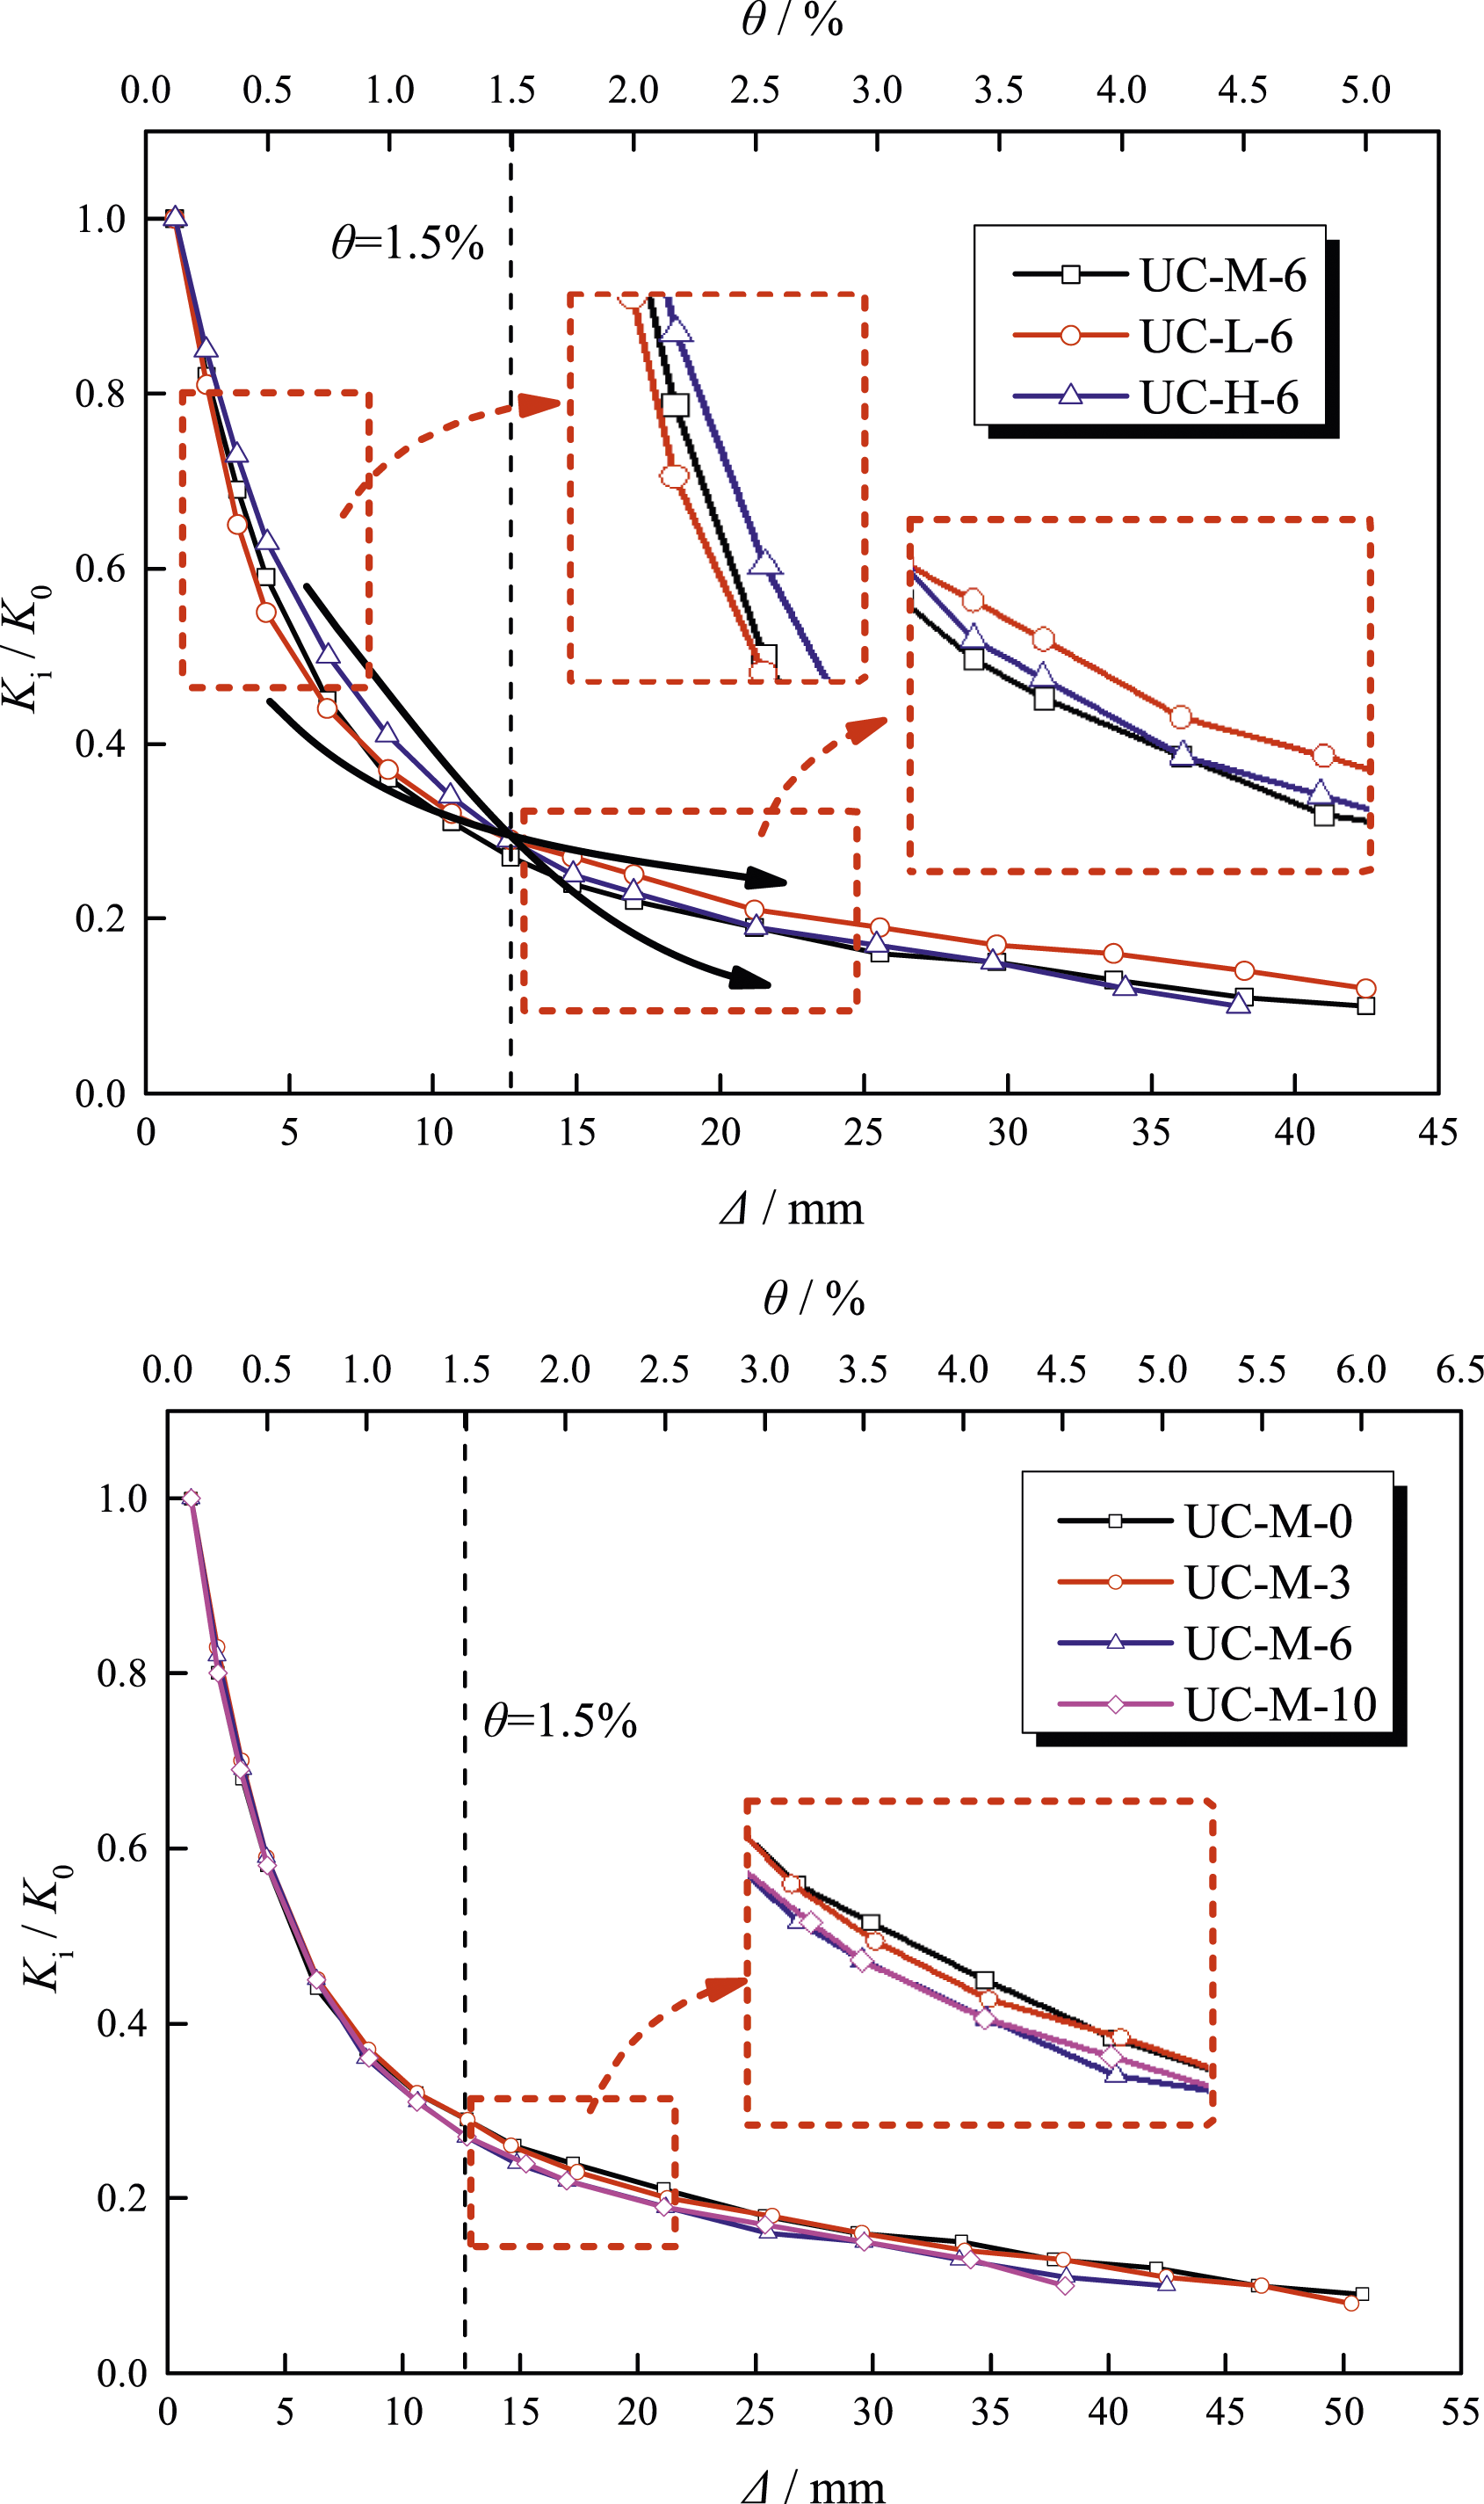
Overall, the corrosion ratio had little impact on the stiffness degradation. Especially before the 1.5% drift, the stiffness degradation rate was similar because there was no obvious difference in the damage of the specimens with different corrosion ratios. After 1.5% drift, the damage of cover concrete developed more rapidly due to corrosion, so the stiffness degradation rate of the higher corrosion ratio specimens was higher than that of the non-corrosion specimen.
At a small drift, the concrete had not reached its ultimate state of compression, and the larger axial pressure could better limit the concrete tensile cracking. Therefore, the stiffness degradation rate of the specimen with a larger ALR was slower before the 1.5% drift. With the increase of the loading drift, the damage of concrete in compression developed more rapidly due to the higher ALR, so the stiffness degradation rate of the specimen with a larger ALR was slightly higher than that of the smaller ALR specimen after 1.5% drift.
Corrosion effect on energy dissipation
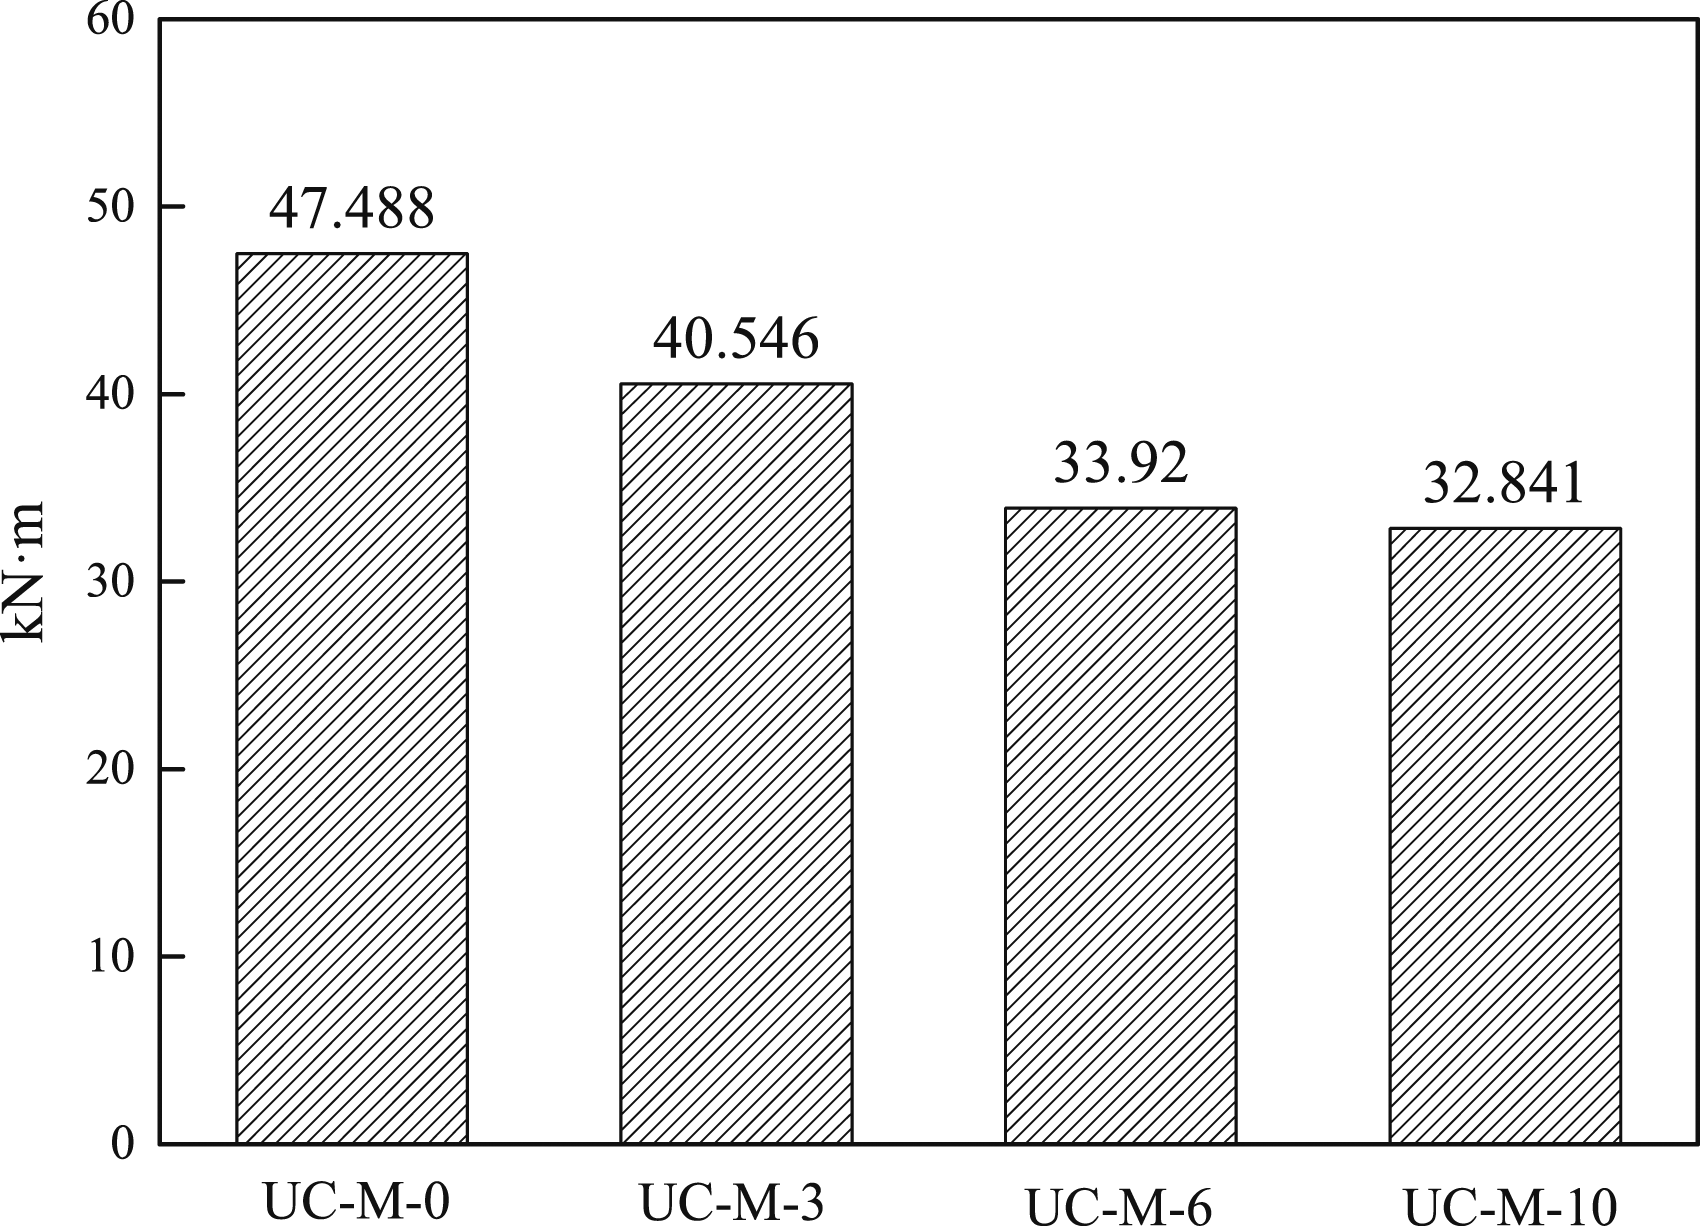
Equivalent viscous damping coefficient (ζeq) and cumulative energy dissipation are important indicators to evaluate the energy dissipation capacity of structures, and corrosion will affect the energy consumption capacity for traditional RC structures. From Figure 17, it can be drawn that: Before the specimens were seriously damaged (before 4% drift), the effect of corrosion on the ζeq of the columns reinforced with UHSB was negligible. But the ALR had an obvious effect on the ζeq, and before 0.5% drift, the ζeq of the specimen with higher ALR was relatively small because the higher ALR had a better restrictive effect on the concrete cracking. With the increase of loading drift (after 1% drift), the damage of concrete under higher axial compression was relatively severe, and the ζeq of the higher ALR specimen became larger. In addition, as can be seen from Figure 18, the maximum cumulative energy dissipation decreased with the increase of corrosion ratio due to the deformation performance of the specimens could be reduced by the corrosion. Compared with uncorroded specimen UC-M-0, the maximum cumulative energy dissipation of UC-M-3, UC-M-6, and UC-M-10 decreased by 14.6%, 28.6%, and 30.8%, respectively. (a) Corrosion ratio effect on ζeq. (b) ALR effect on ζeq. Cumulative energy dissipation.
Resilience performance
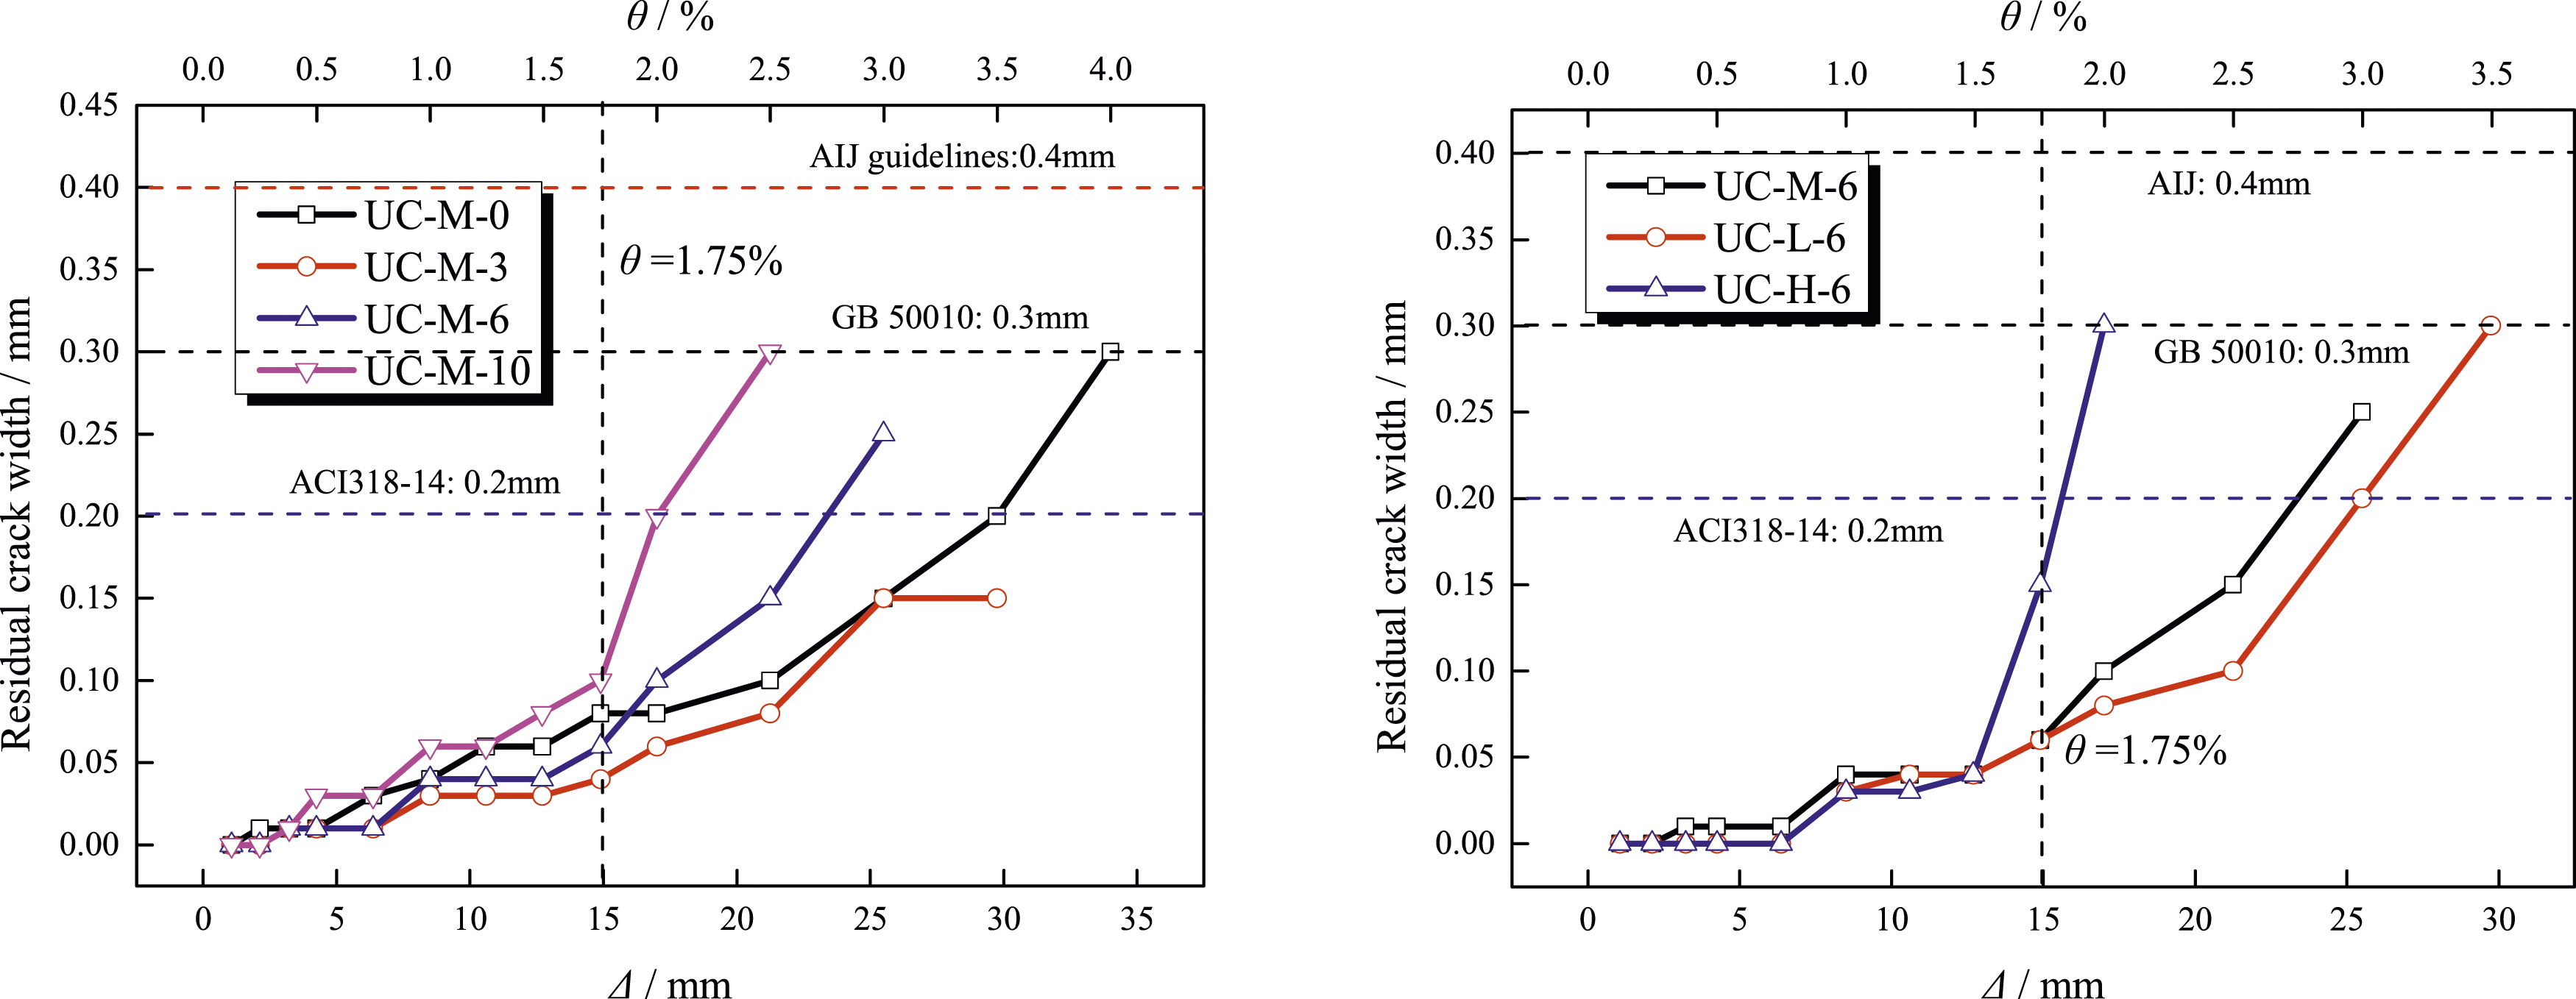
Residual drift and residual crack width are important indexes to evaluate the resilience performance of structures, and smaller residual drift and residual crack width represent the better post-earthquake rehabilitation performance of the structure. For residual drift, FEMA-356 (2000) sets the repairable residual drift limit of concrete frame columns as 1.0%. In addition, the relevant research considers (Joson et al., 2008) that the residual drift limit of the structure is 0.5% based on the building function, safety, and economy. For the residual crack width, the AIJ guide (2004) considers that the residual crack width after the earthquake is not more than 0.4 mm, which has satisfied repairability. In addition, the applicability crack width limits given in the ACI318-14 (2014) and the GB50010-2010 (2010) are 0.2 mm and 0.3 mm, respectively. Figures 19 and 20 show the residual drift and residual crack width, respectively. It can be drawn that: (a) Corrosion effect on residual drift. (b) ALR effect on residual drift. (a) Corrosion effect on residual crack width. (b) ALR effect on residual crack width.
The corrosion had little effect on the residual drift of RAC columns with UHSB. Especially before the 3% drift, there was no obvious difference in the residual drift of specimens with different corrosion ratios; After the 3% drift, the residual drift of the specimens with higher corrosion ratios was slightly larger. However, the effect of ALR on residual drift was more obvious. Under the same corrosion ratio, the specimen with a lower ALR presented a smaller residual drift, and the residual drift of specimen UC-L-6 was smaller than that of the other specimens after 1% drift.
Before the 1.75% drift, the residual crack width of each specimen was similar. When the loading drift exceeded 1.75%, the growth rate of residual crack width increased significantly with the aggravation of the damage, and the residual crack width increased with the increase of corrosion ratio and ALR.
Based on the above analysis, it is concluded that under the corrosion ratio in this test, the corroded RAC columns with UHSB still presented satisfactory repairability under the horizontal load. Before the 2.5% drift, the residual drift of the specimens was no more than 0.5%, the post-earthquake rehabilitation had relatively high economic efficiency. And before the 4% drift, all the specimens met the repairable residual drift limit of 1%. What’s more, before the 1.75% drift, the residual crack width of the specimens didn’t exceed the minimum applicable crack width limit of 0.2 mm, and the residual crack width didn’t exceed the repairable limit of 0.3 mm before the failure of the specimen.
Corrosion models of materials
The degradation of material mechanical properties induced by corrosion is the main factor leading to the degradation of structural performance. Therefore, based on the test results and related researches, this section optimized the corrosion models of corroded concrete and reinforcement, which can provide a better basis for the mechanical evaluation and numerical simulation of corroded RC structures.
Rebar degradation model

Relevant researches on the corroded columns.
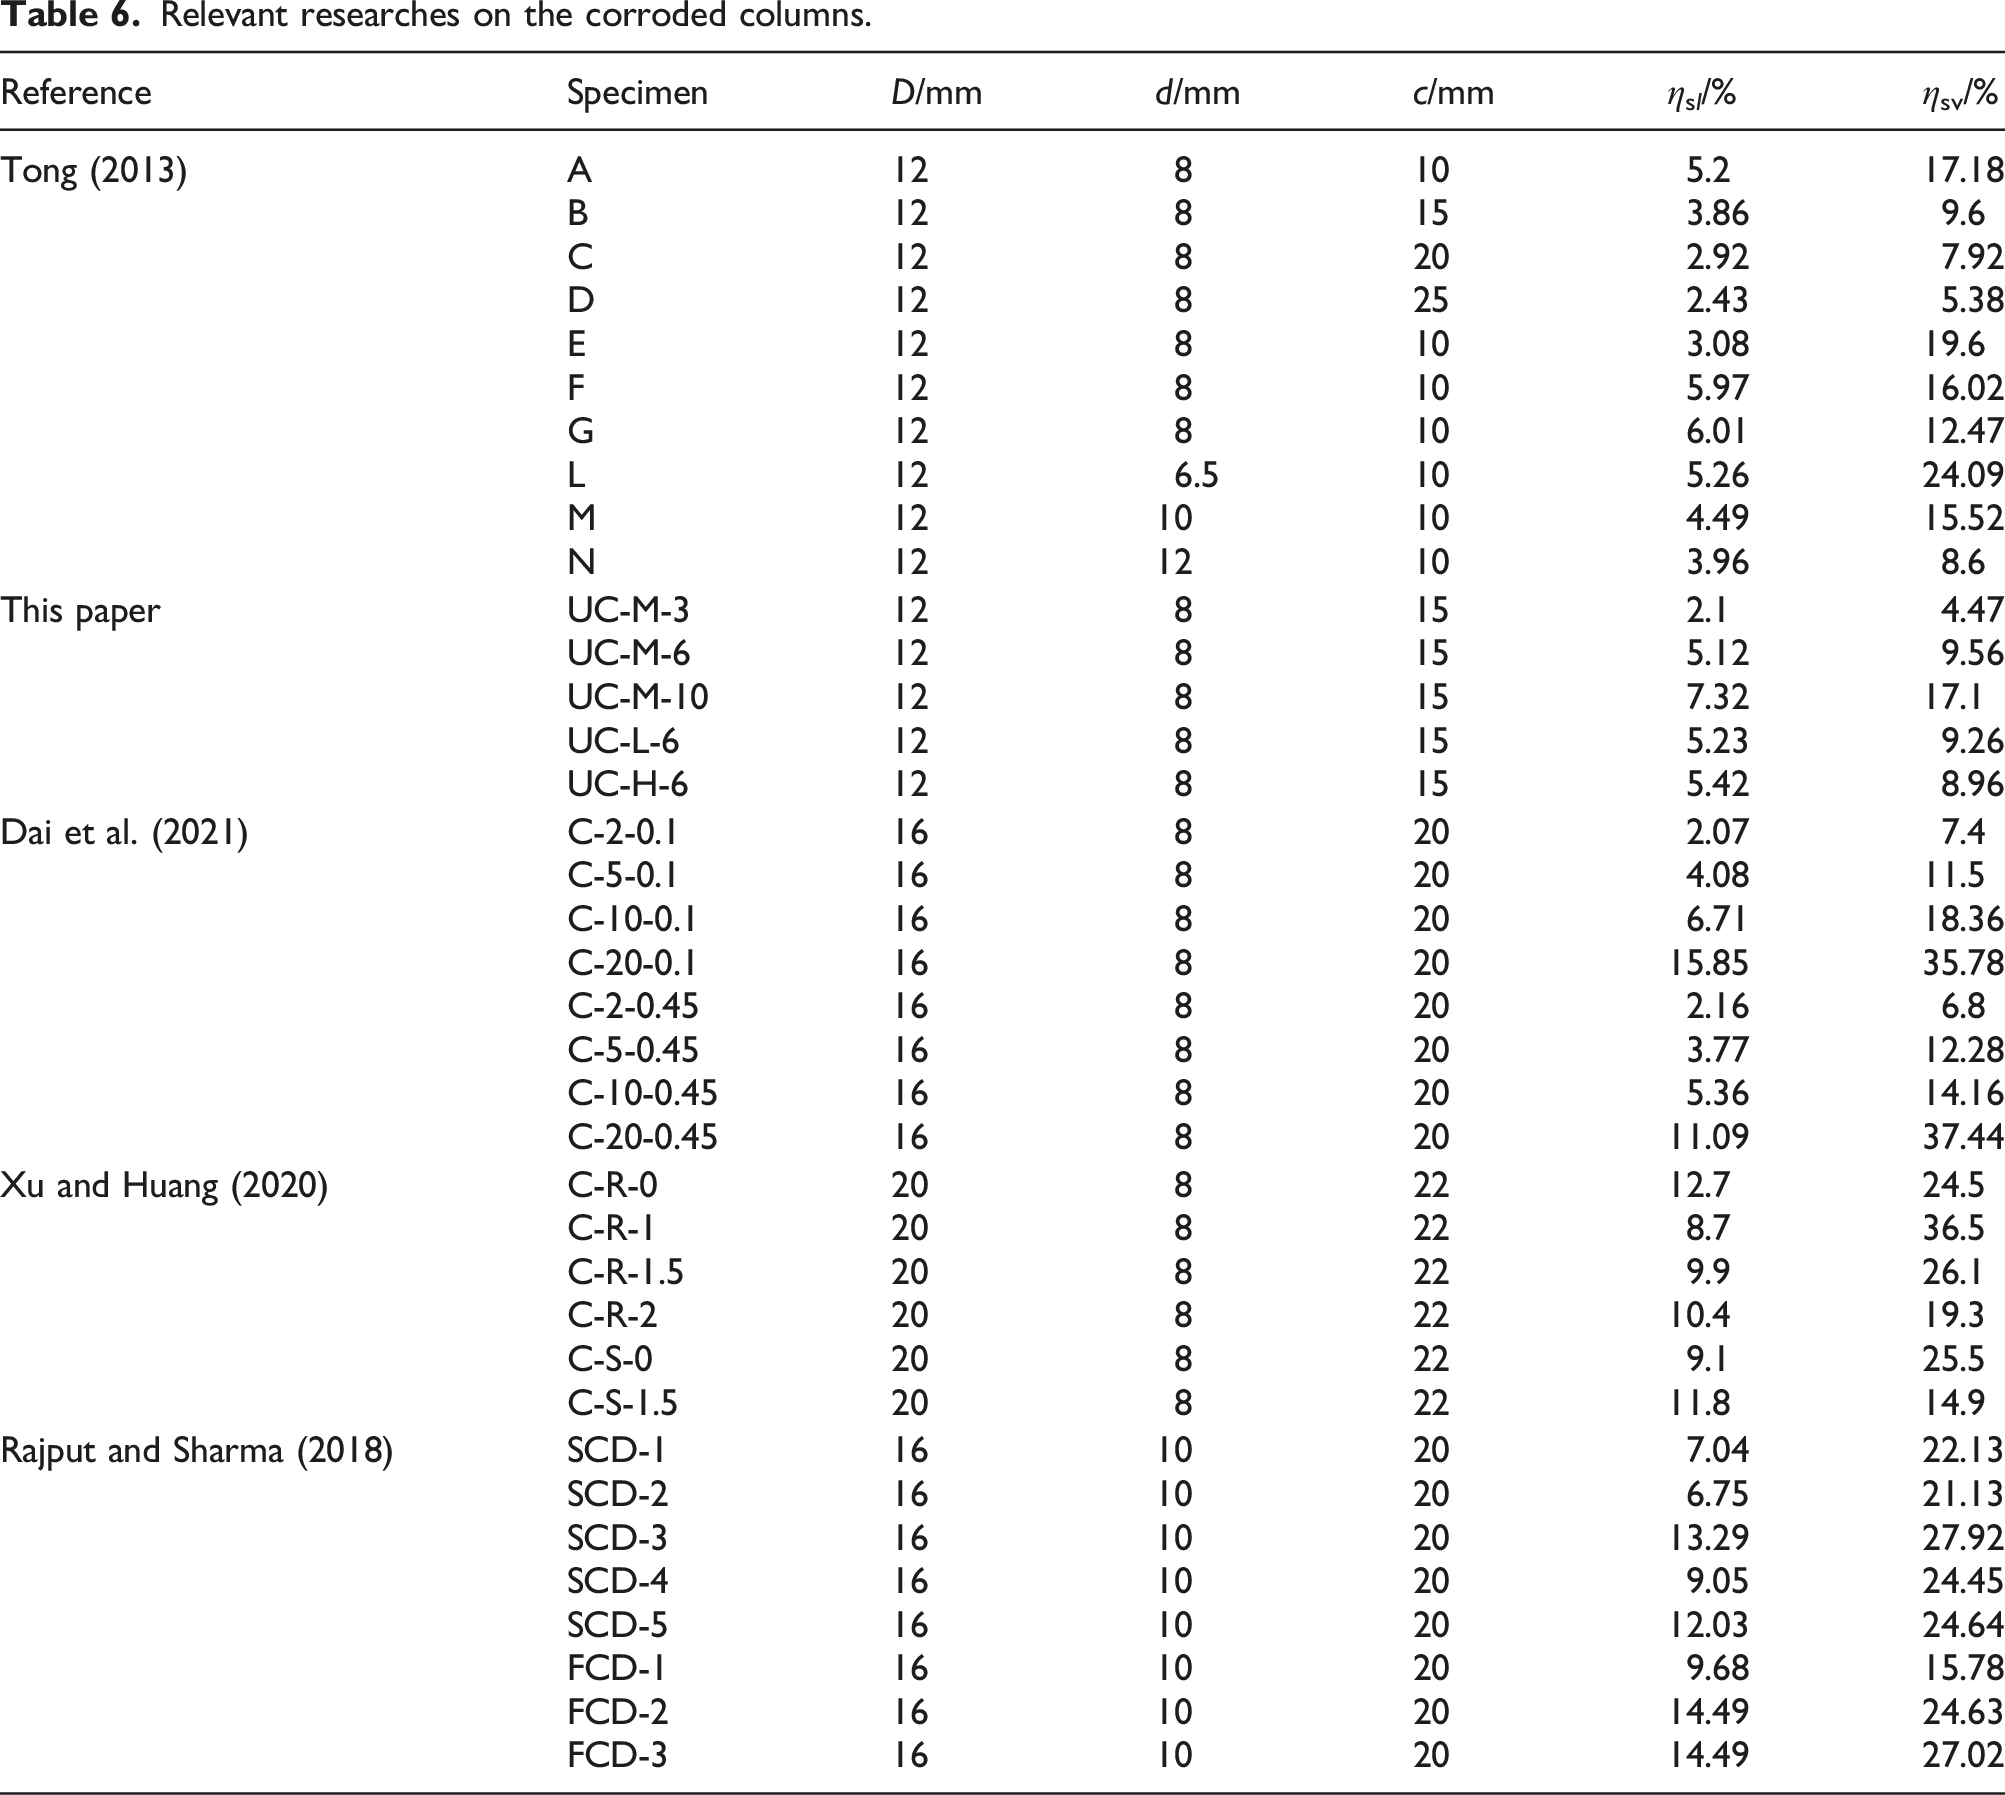

Relationship between ηsv and η sl .
The accuracy of the equation can be evaluated by the overall error index IAE shown in formula (3) (Wang et al., 2019), where Expe and Theo are the test and calculated values, respectively. The IAE is 0.212, indicating that the relationship can estimate the corrosion ratio relationship between the transverse and longitudinal rebars with a satisfied accuracy.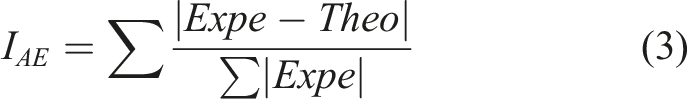
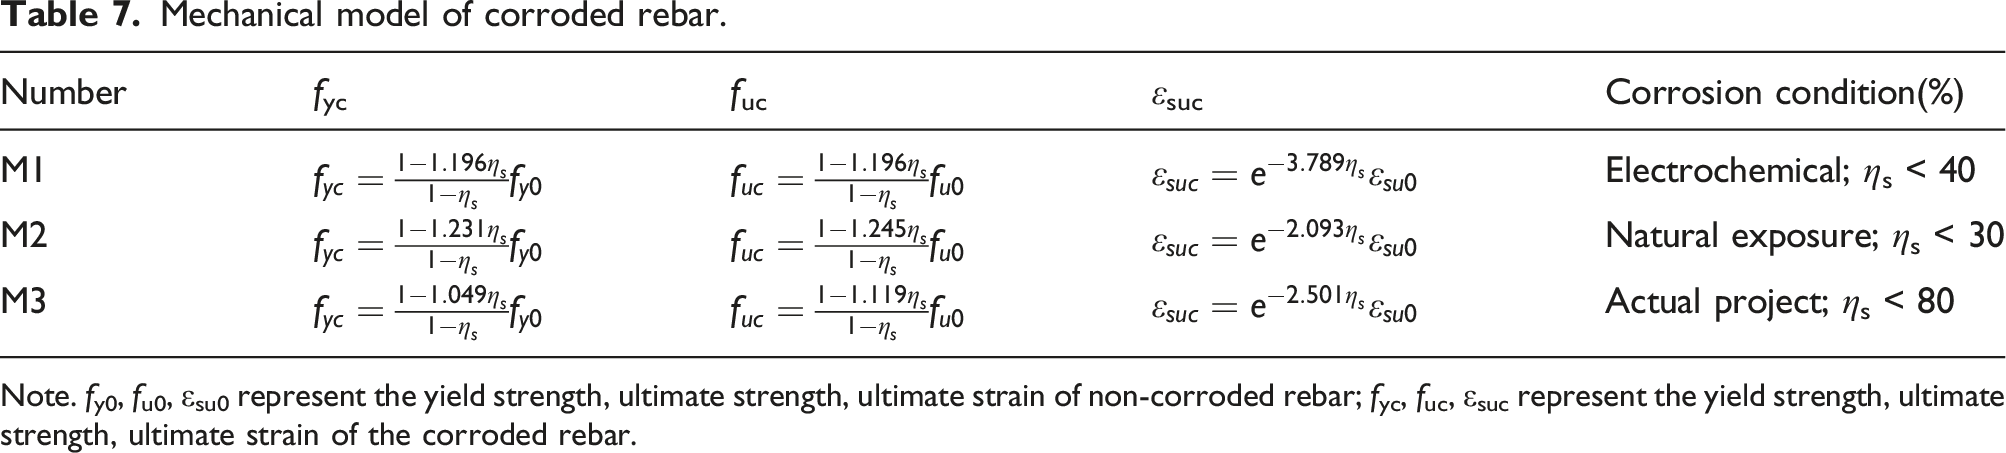
In addition to the reduction of the cross-section area, the mechanical properties of corroded rebar will be reduced, as shown in Figure 22. The sectional area of corroded rebar can be determined by the formula (4), where Asc and As are the sectional area of corroded rebar and non-corroded rebar, Corroded rebar degradation. Mechanical model of corroded rebar. Note. fy0, fu0, εsu0 represent the yield strength, ultimate strength, ultimate strain of non-corroded rebar; fyc, fuc, εsuc represent the yield strength, ultimate strength, ultimate strain of the corroded rebar.

Concrete degradation model
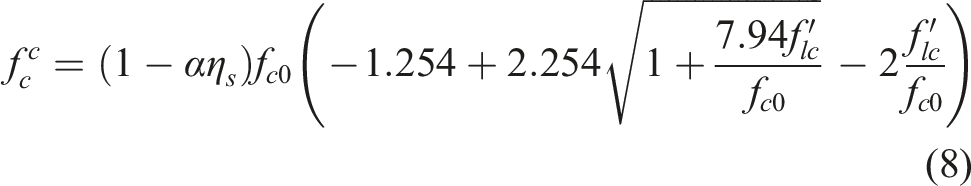
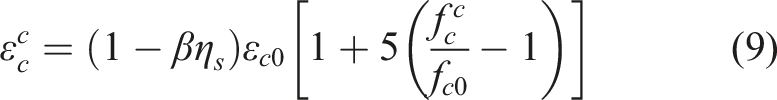
As shown in Figure 23, the rebar corrosion will affect the mechanical properties of the confined concrete and the cover concrete. For the confined concrete, Vu et al. (2017) modified the stress-strain relationship of the Mander model (Mander et al., 1988) based on test results, as shown in formula (5)–(11), where (a) Cover concrete degradation. (b) Confined concrete degradation.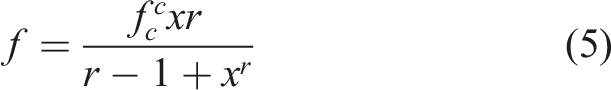


Test measured data of the reference.
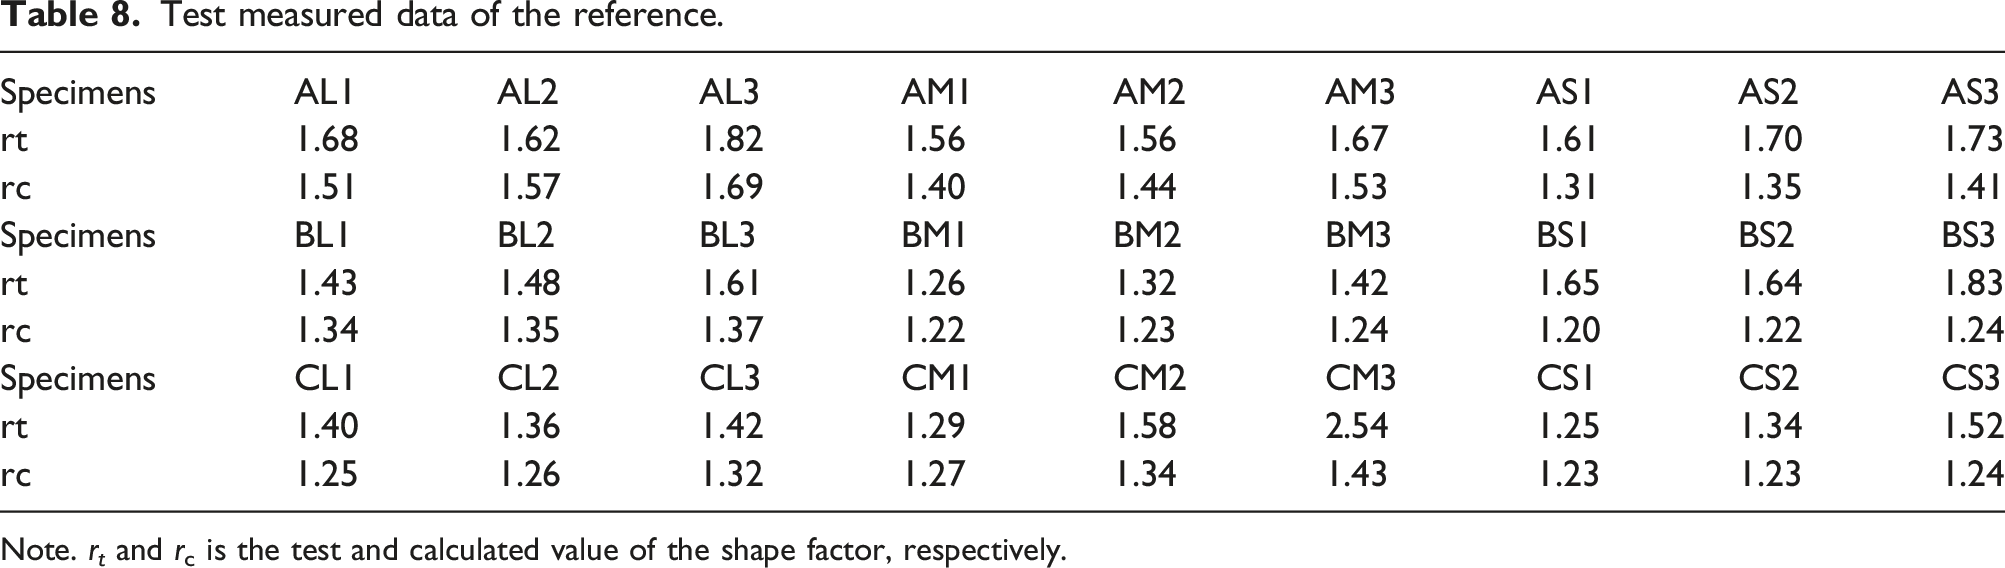
Note. r t and rc is the test and calculated value of the shape factor, respectively.
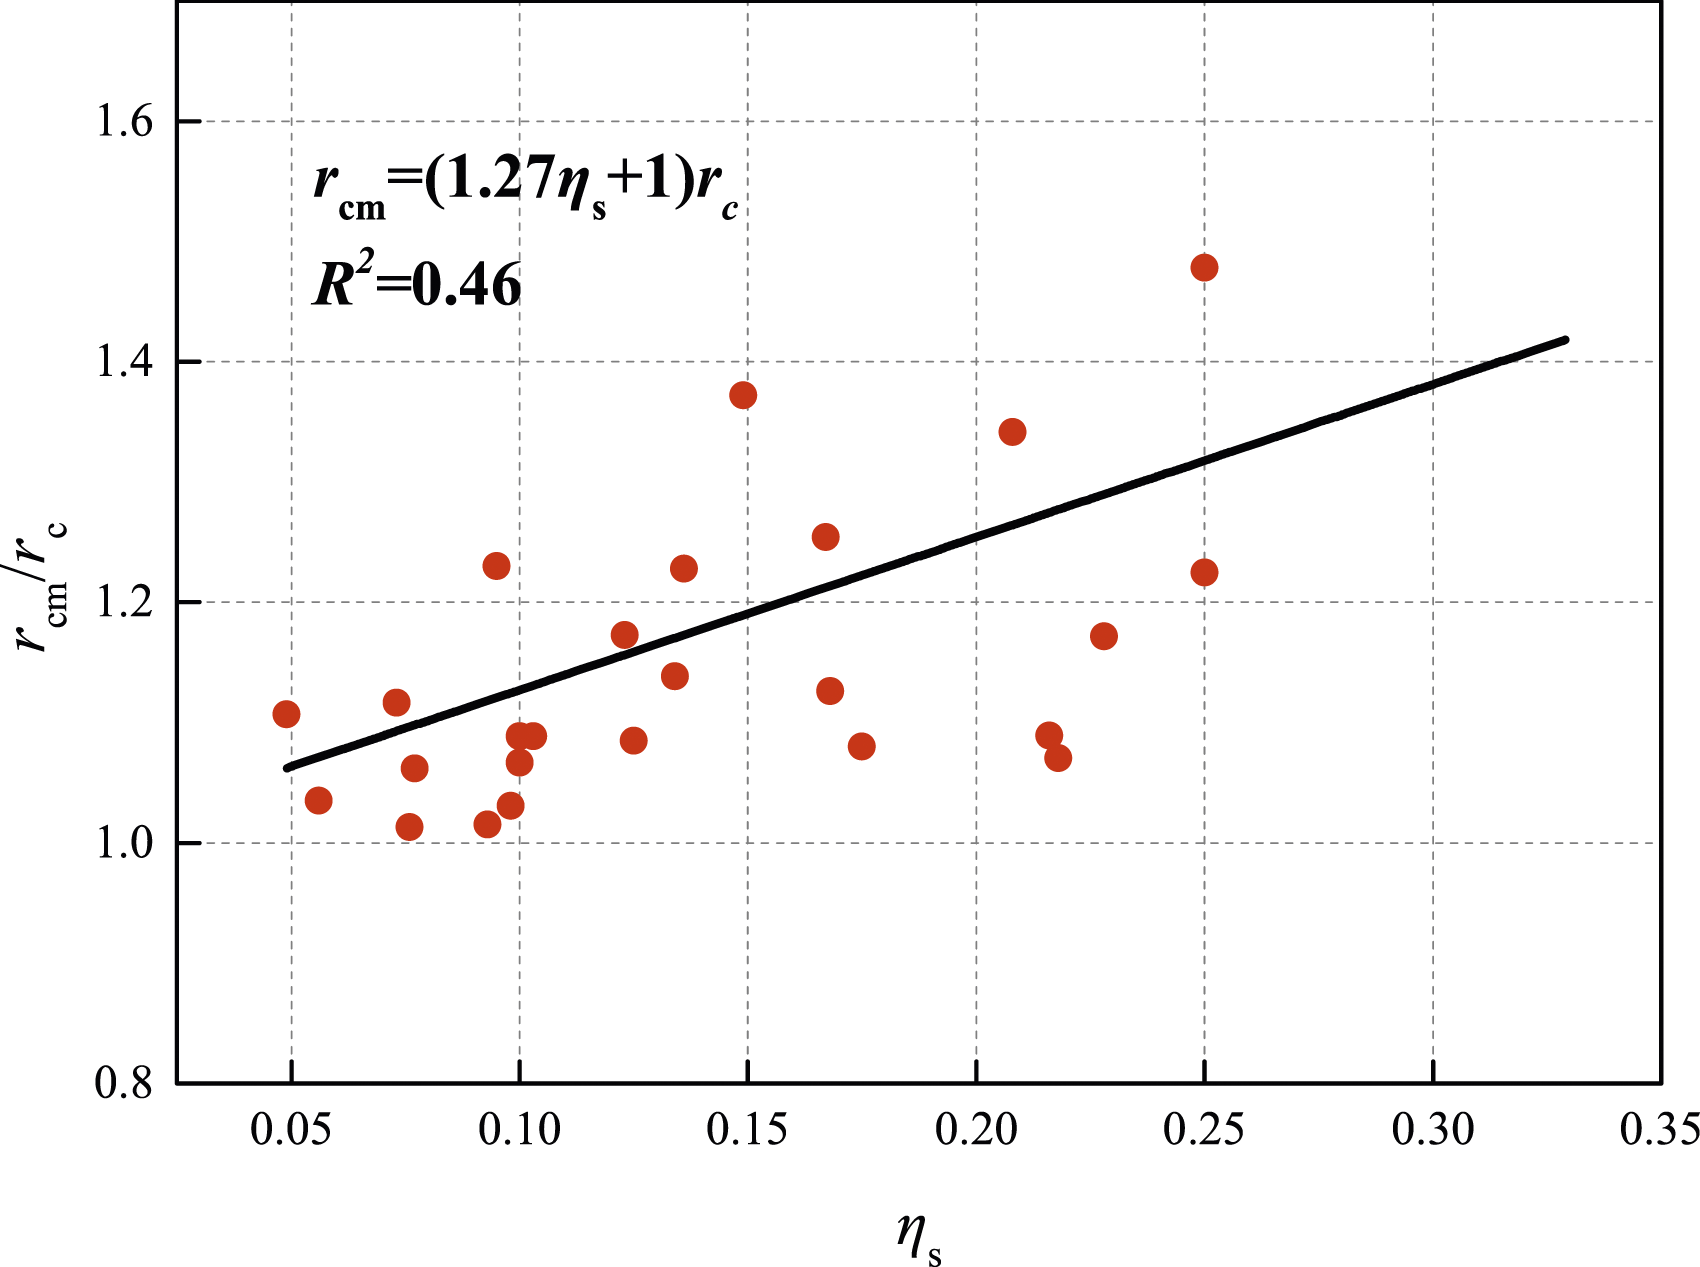
Relationship between rcm and rc.

Comparison between rt and rcm.
For cover concrete, its compressive strength deterioration can be modeled according to formula (13) (Coronelli and Gambarova, 2004), and the tensile strength can be reduced in proportion to the compressive strength reduction by formula (14) (Hanjari et al., 2011): where 


Numerical simulation analysis
Establishment of the finite element models (FEM)
Finite element analysis is one of the important and commonly used method for studying the mechanical properties of structures and materials. (Dadmand et al., 2023; Soltanmohammadi et al., 2024) In this section, based on the modified corrosion model of the materials, the FEM of the specimens was established through OpenSees, and the corresponding parameter analysis was carried out to analyze its seismic deterioration law. The model diagram is shown in Figure 26, DispBeamColumn Element and fiber section were adopted for the FEM. Concrete 01, Concrete 02, and Hysteretic Material were adopted as the material models for the cover concrete, confined concrete, and longitudinal UHSB, respectively. And the material mechanical parameters were calculated according to the modified material deterioration model in section 4. Because the bond strength of UHSB is lower than that of hot-rolled ribbed bars and existing investigation (Zhang et al., 2023a, 2023b) have shown that the slippage of UHSB is more obvious within 400 mm from the column base, the Truss element was adopted for the longitudinal UHSB within 400 mm from the column base, which was equivalent to simulating the overall slippage effect of longitudinal UHSB by ignoring the bond strength of UHSB in this length. Diagram of the FEM.
Verification of the FEM
Figure 27 shows the comparison of the experimental and simulated hysteresis curves, it can be drawn that: The modeled load-displacement curves are basically consistent with the experimental result, among them, the maximum error between the simulated value and the experimental value of the peak load and peak displacement is not more than 6.18% and 12.35%, respectively. And the simulated hysteresis curves also show satisfactory pinch effect, which can simulate the self-centering performance of the specimens. As the incomplete debonding of the weakly bonded rebars in the test specimens, the slip of the rebars was small in the early test loading stage. However, in the finite element model, the slip effect of weakly bonded rebars was equivalently simulated by completely debonding the rebars within a certain range at the bottom of the column. Therefore, in the early loading stage, the simulated hysteresis curve is more pinched, and the stiffness of the simulated hysteresis curves is slightly smaller than the test results. But in the middle and later loading stages, the loading stiffness, horizontal load-carrying capacity, and hysteresis loops all show satisfactory agreement with the test results, that is, the finite element model can effectively simulate the hysteresis performance of corroded specimens in overall. Test and simulated hysteresis curves comparison. (a) UC-M-0. (b) UC-M-3. (c) UC-M-6. (d) UC-M-10. (e) UC-L-6. (f) UC-H-6.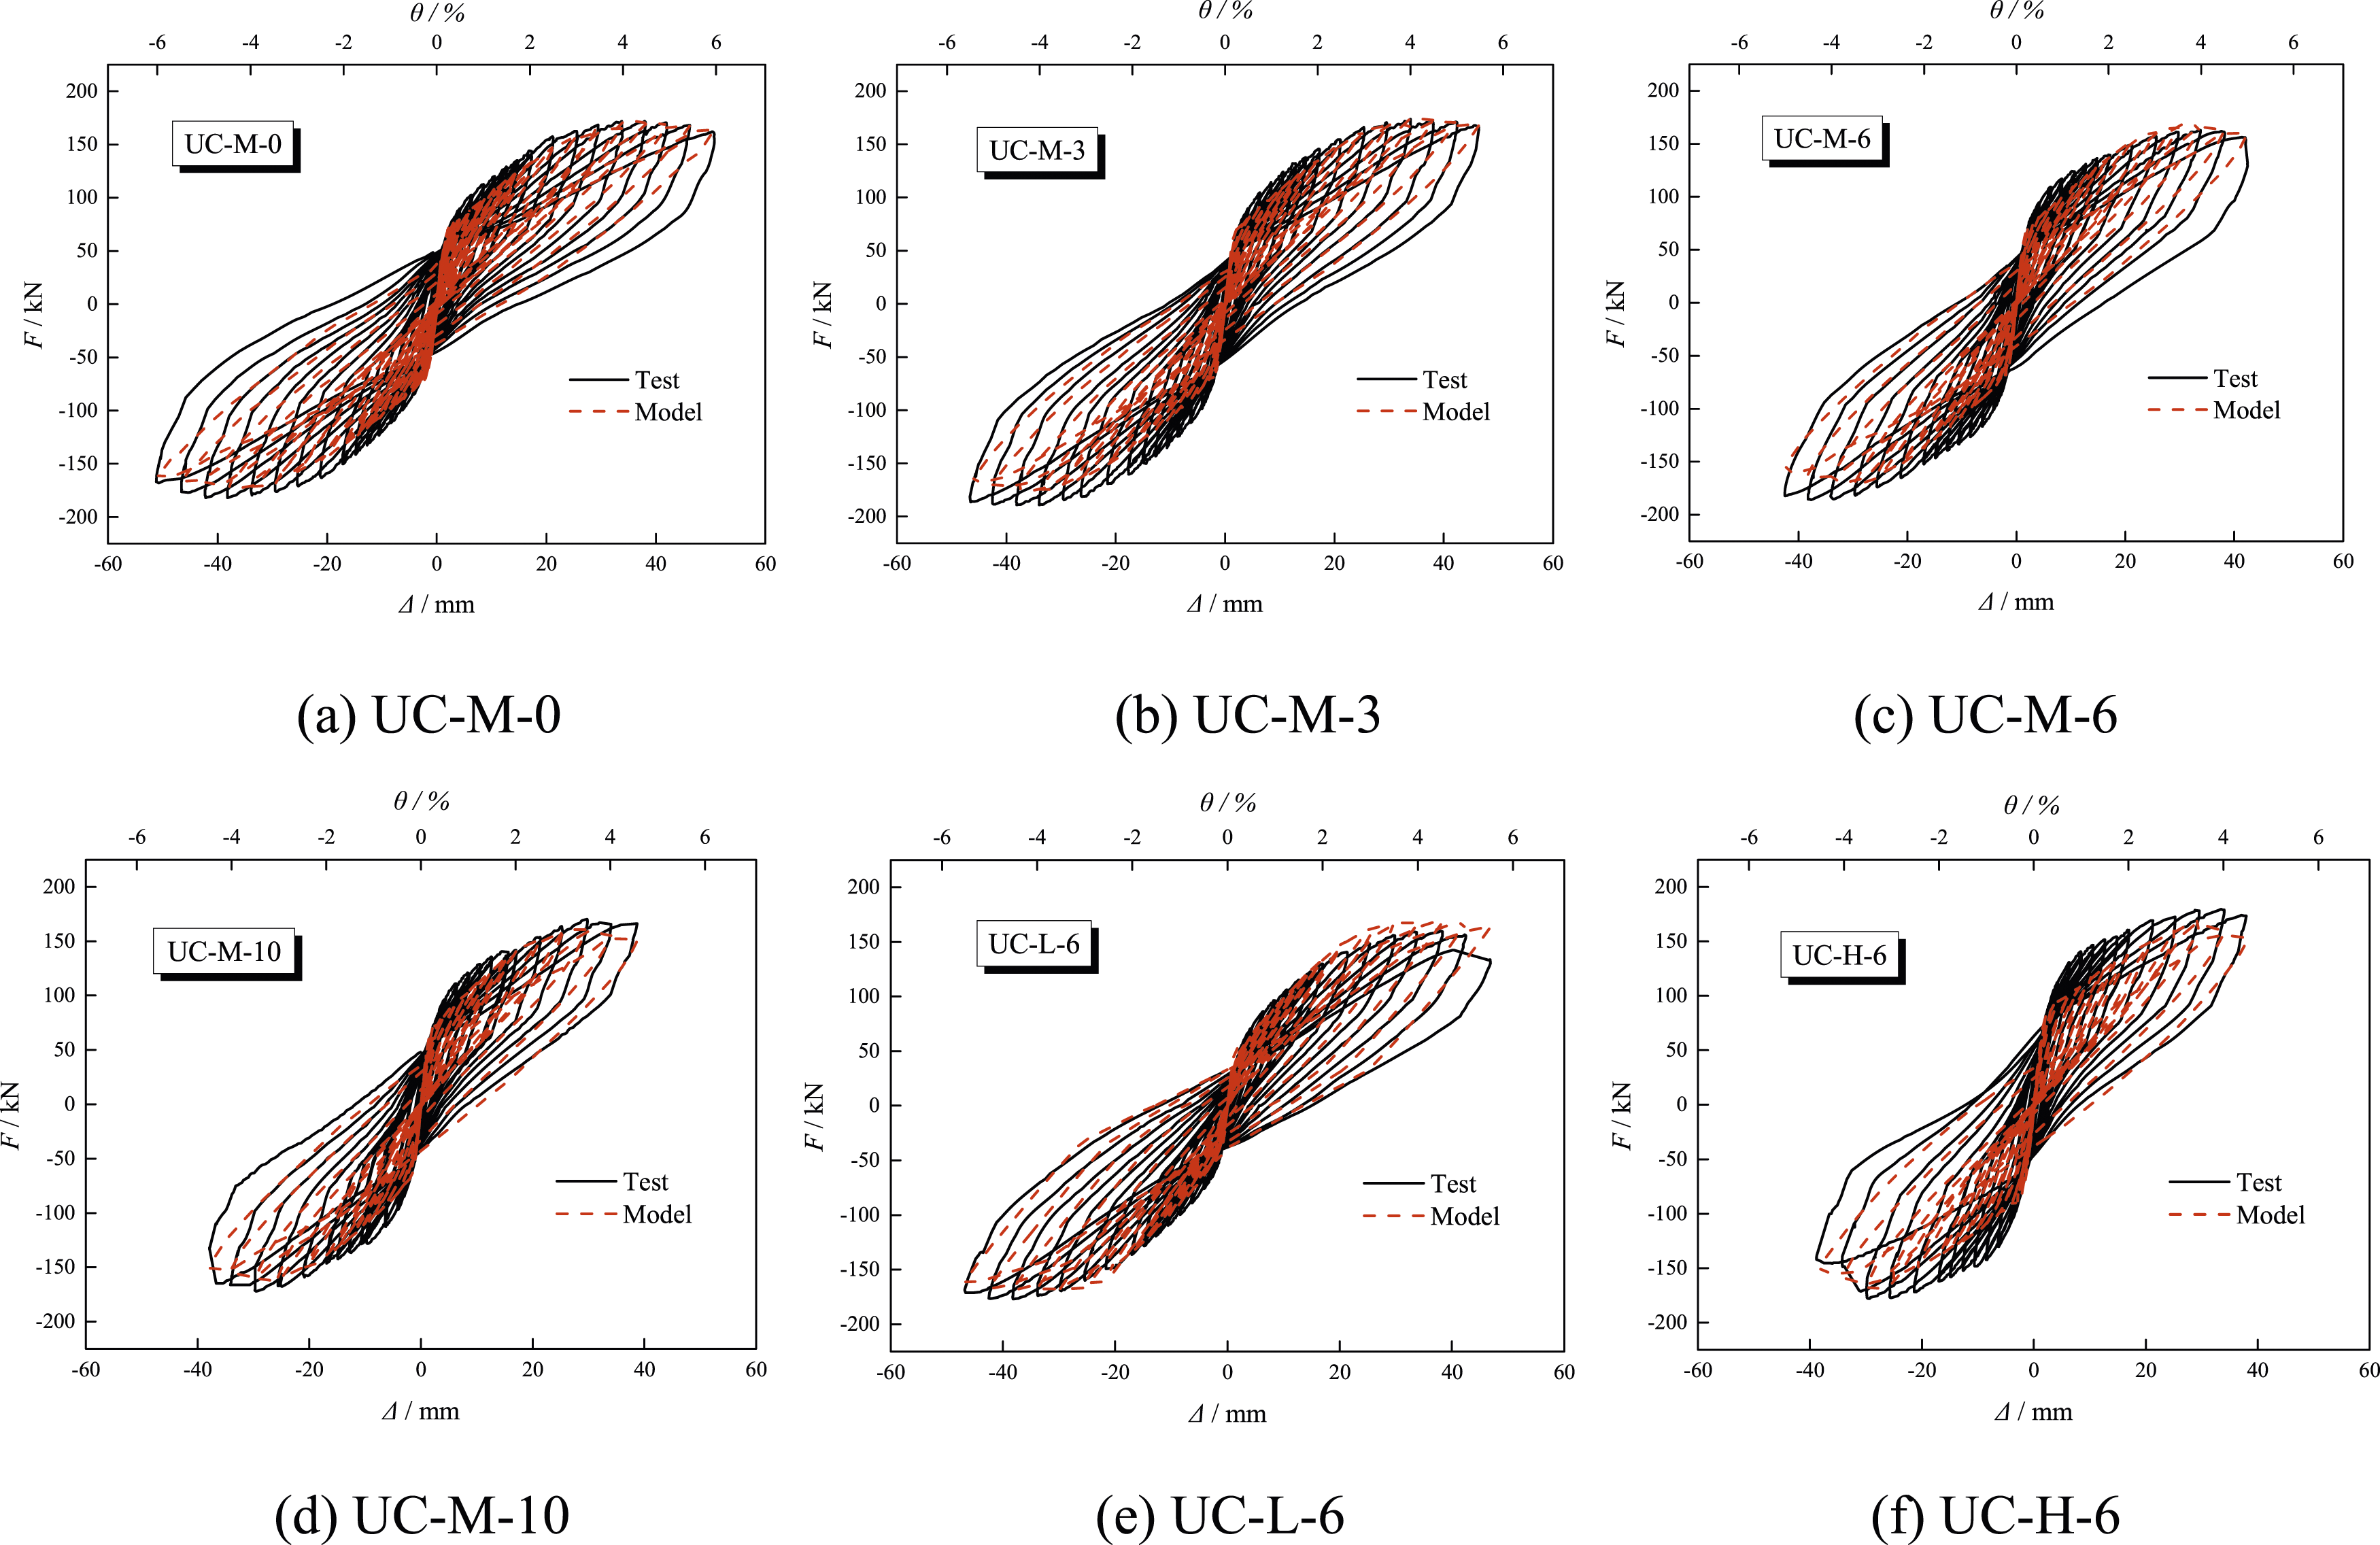
Effect of corrosion ratio
Since the maximum average corrosion ratio of the test only was about 10%, the stirrup ratio ( (a) Corrosion ratio effect (0.2 ALR group). (b) Corrosion ratio effect (0.3 ALR group).
Effect of ALR
In this section, the ALR was increased to 0.4, and the 20% corrosion ratio group was added to analyze the impact of the coupling effect of high corrosion ratio and high ALR on the seismic performance of the models. It can be concluded from the comparison of skeleton curves in Figure 29 that: The ultimate drift decreased obviously with the increase of the ALR, especially under the higher ALR (0.4), the corroded model was more prone to suffer brittle failure. Moreover, at a high corrosion ratio, the ultimate drift reduction was more significant with the increase of ALR. In addition, as the model would reach its peak load-carrying capacity when the corrosion-damaged concrete reached its compression ultimate state, the earlier the concrete suffers compression failure, the lower the strength utilization rate of the UHSB. However, the compressive stress of concrete would increase with the increase of ALR at the same drift, so the peak load-carrying capacity decreased with the increase of ALR, especially under a higher corrosion ratio (20%), the reduction of peak load-carrying capacity was more obvious with the increase of ALR. (a) ALR effect (ηs = 6% group). (b) ALR effect (ηs = 20% group).
Effect of stirrup ratio
This section compared the effect of the stirrup ratio on different corrosion ratio models. It can be found from Figure 30 that: The effect degree of stirrup ratio on horizontal load-carrying capacity was obviously higher than that on deformation capacity under a lower corrosion ratio (6%), while the reduction of the stirrup ratio not only affected the horizontal load-carrying capacity but also significantly reduced the deformation capacity under the higher corrosion ratio. Compared with the higher stirrup ratio models: under 0.2 ALR, the peak horizontal load-carrying capacity of the smaller stirrup ratio model with corrosion ratio of 20% and 30% decreased by 8.3% and 10.7%, respectively, and the ultimate drift decreased by 8% and 10.1%, respectively; under 0.3 ALR, the peak horizontal load-carrying capacity of the smaller stirrup ratio model with corrosion ratio of 20% and 30% decreased by 20% and 16.2%, respectively, and the ultimate drift decreased by 21.6% and 14.4%, respectively. Therefore, the effect of the stirrup ratio on the horizontal load-carrying capacity and deformation capacity was more significant, especially at a higher ALR. (a) Stirrup ratio effect (0.2 ALR group). (b) Stirrup ratio effect (0.3 ALR group).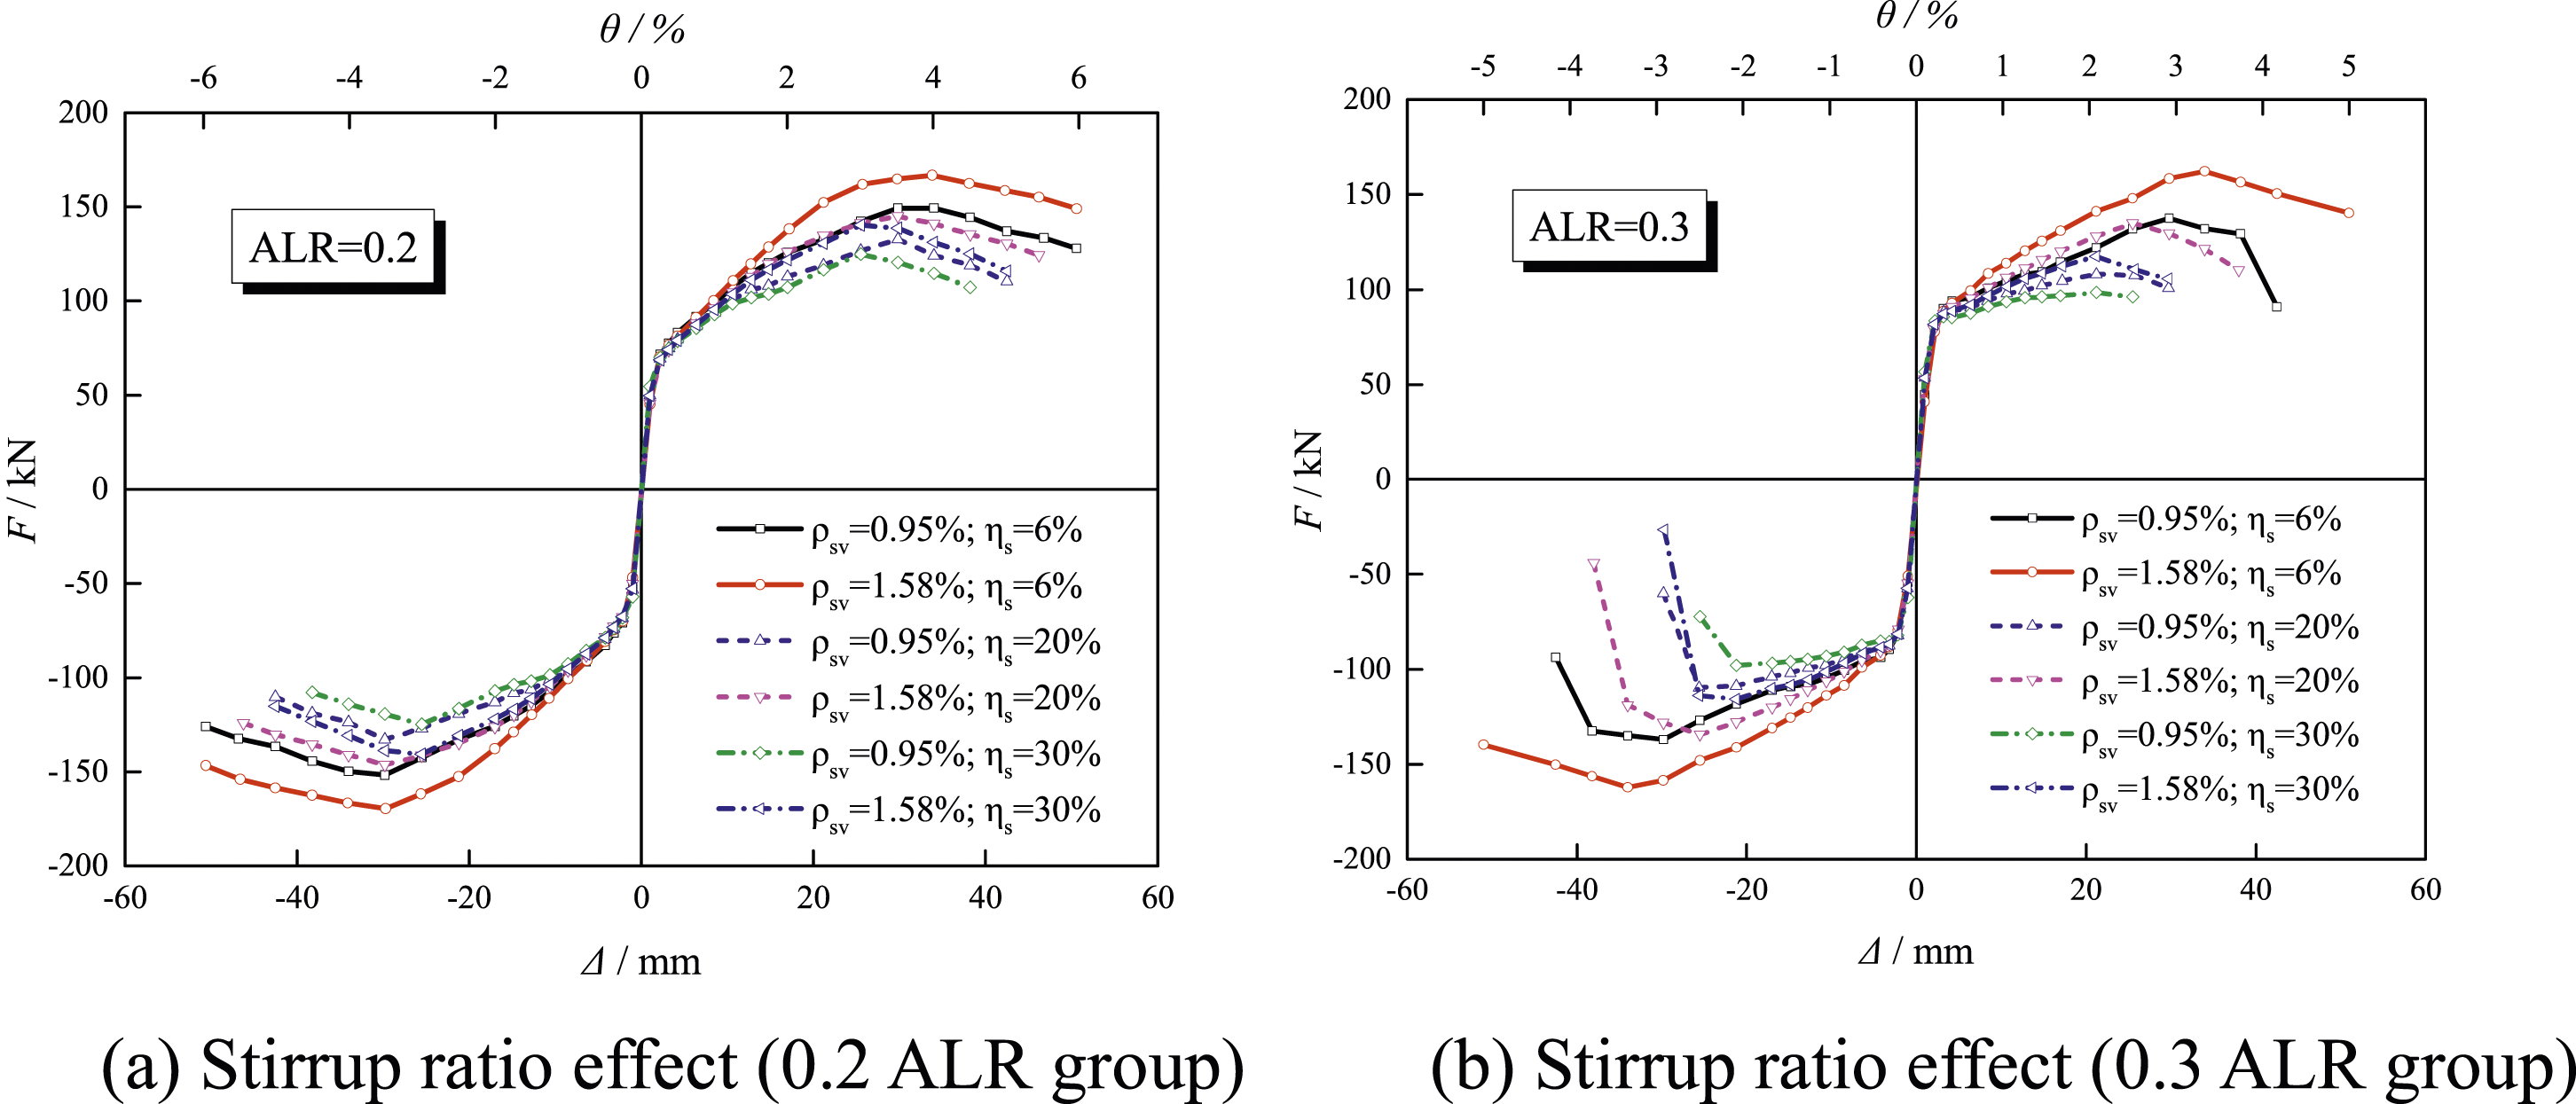
Prediction equation of peak drift

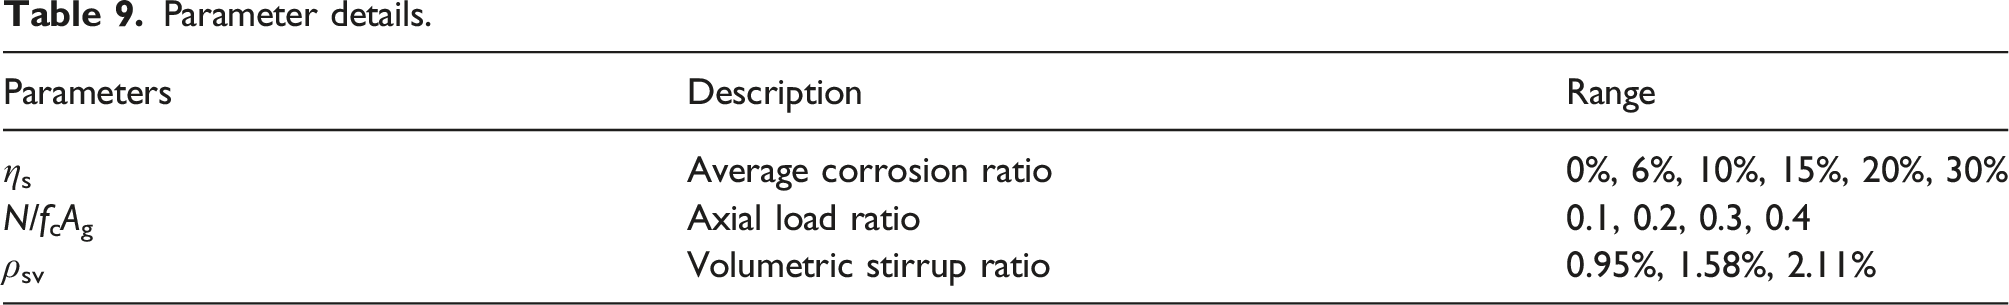
Parameter details.
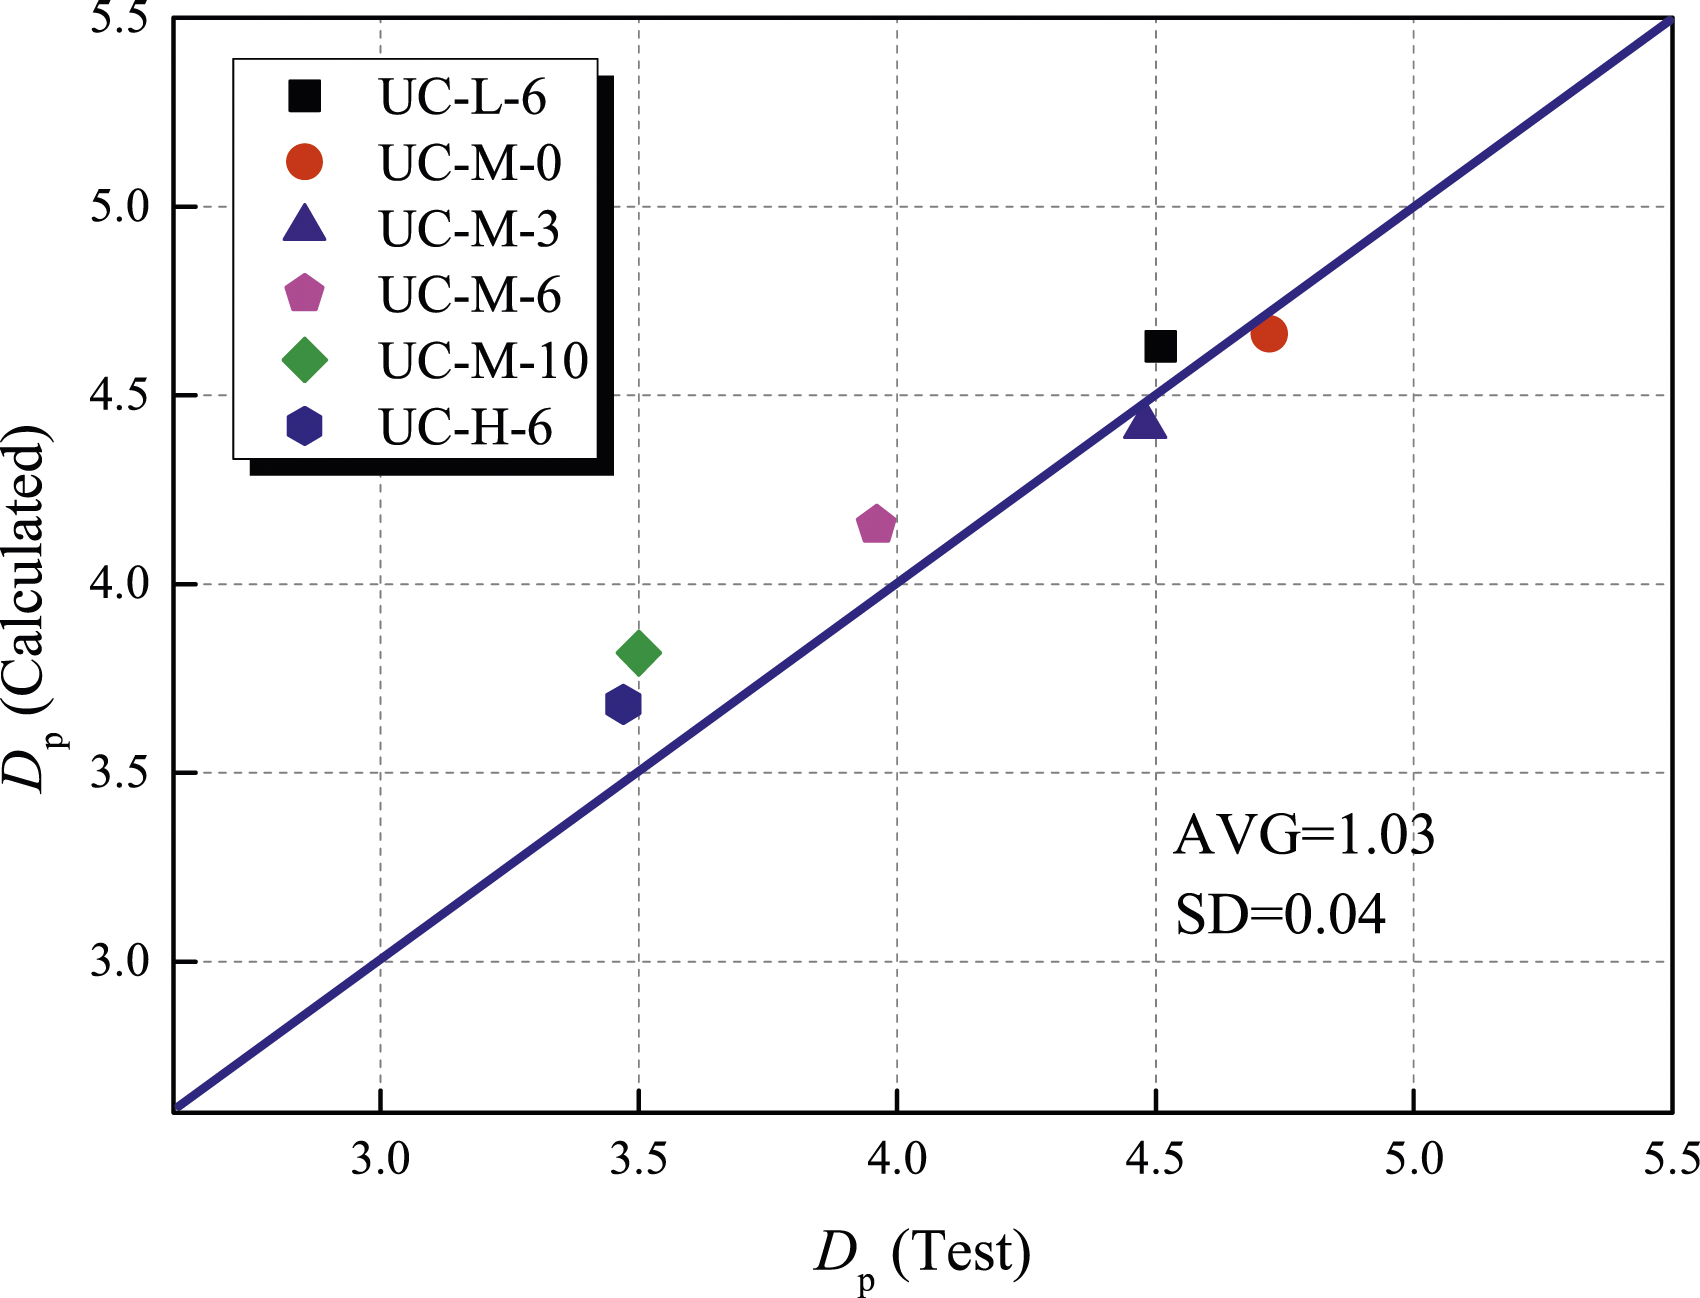
The comparison between the peak drifts calculated by FEM and equation (17) shown in Figure 31 presents a satisfied correlation as the average peak drift ratio of the calculated values by the proposed equation to the simulated values by the FEM is 1.001 and its standard deviation is 0.051. Furthermore, to verify the applicability of the prediction equation for the peak drift capacity of the corroded column with UHSB, the experimental results of six specimens were compared to the calculated results as shown in Figure 32. The average ratio of calculated to the experimental peak drift is 1.08 and the standard deviation is 0.04. Therefore, the proposed formula can effectively predict the peak drift capacity of corroded columns reinforced with UHSB and provide a reference for evaluating the deformation capacity of corroded UHSB-reinforced structures. Comparisons between the FEM Dp and calculated Dp. Comparisons between the calculated Dp and test Dp.
Conclusions
In this paper, six corroded RAC columns with UHSB were subjected to quasistatic test and numerical analysis to study the hysteretic behavior of the corroded specimens with different corrosion ratios and ALR. The main conclusions were as follows: (1) The damage development rate of the cover concrete increased with increasing corrosion ratio and ALR. After 4% drift, the corroded specimens exhibited varying degrees of the concrete cover peeling off and eventually suffered brittle failure due to the stirrup fracture or the concrete failure. (2) Under the experimental corrosion ratio (within 10%), the impact of reinforcement corrosion on the deformation capacity was significantly greater than the impact on the horizontal load-carrying capacity. Compared to non-corroded specimen, the peak horizontal load-carrying capacity of specimens with 6% and 10% corrosion ratios decreased only by 3.4% and 5.6%, respectively, while the ultimate drift decreased by more than 16.7% and 25%, respectively. Similarly, increasing the ALR would significantly reduce the deformation performance of corroded specimens. (3) Reinforcement corrosion had a minor impact on the strength and stiffness degradation of the specimens. Before the 2% drift, the strength degradation ratio of the specimens was within 5%, and there was no significant difference in their stiffness degradation rates. In addition, although there was no obvious difference in the viscous damping coefficient, the maximum cumulative energy consumption capacity decreased with increasing corrosion ratio. (4) Under the experimental corrosion ratio (within 10%), steel corrosion had a minor effect on the residual drift. The corrosion ratio and ALR had no obvious effect on the residual crack width before 1.75% drift, while the residual crack width increased with increasing corrosion ratio and ALR after 1.75% drift. The corroded specimens all could meet the repairable limit before 4% drift, showing satisfactory resilient performance. (5) The FEM based on the modified corrosion model of the materials can well predict the hysteretic response of the specimens, and the proposed equation based on FEM analysis data can satisfactorily predict the peak drift of the corroded columns with UHSB. A higher ALR would aggravate the impact of the corrosion ratio, the degradation of the horizontal load-carrying and deformation capacity would be exacerbated especially for columns with an ALR exceeding 0.4 and a corrosion ratio exceeding 15%.
Footnotes
Acknowledgements
The support is greatly appreciated.
Author contributions
Declaration of conflicting interests
The author(s) declared no potential conflicts of interest with respect to the research, authorship, and/or publication of this article.
Funding
The author(s) disclosed receipt of the following financial support for the research, authorship, and/or publication of this article: This work is supported by the Natural Science Foundation Project of Chongqing, Chongqing Science and Technology Commission (CSTB2022NSCQ-MSX1416).
Data availability statement
The datasets generated during the current study are available from the corresponding author on reasonable request.