
Abstract
To ensure structural safety and integrity, a novel framework is developed for detecting the loosening of multi-bolt connections using wavelet entropy of vibro-acoustic modulation (VAM) signals. Wavelet entropy is employed as the dynamic index to capture the intricate time-frequency characteristics that are indicative of the connection status. Taking the wavelet entropy vectors as input, the proposed framework distinguishes itself by integrating a Transformer model for high-dimensional feature extraction with the recursive feature elimination (RFE) for essential feature selection, followed by a support vector machine (SVM) model for classification. Specifically, the Transformer model with innovative positional encoding capability helps to extract the time-dependent transient features that are sensitive to the bolt loosening. The RFE process reduces the data dimensionality while discerning the diagnostic information for more accurate classification. Through the experiment on a four-bolt joint, the identification results with cross-validation showed high accuracy and robustness of the proposed framework across various loosening cases. It outperformed the traditional SVM, long short-term memory network (LSTM), convolutional neural network (CNN)-SVM models without and with RFE, as well as the Transformer-SVM model without RFE, achieving an accuracy increase of 15.72%, 11.74%, 9.47%, 5.49%, and 5.06%, respectively. The proposed framework was demonstrated to be able to learn the damage-sensitive features more effectively from wavelet entropy data, marking a significant advancement in the health monitoring of engineering structures with high-strength bolt connections.
Keywords
Introduction
High-strength bolt connections and joints are essential for various mechanical and civil engineering structures. They help to transmit and distribute loads, crucially affecting the stability, safety, and durability of structures, particularly in steel constructions. The performance of these connections relies on the preload applied during installation, which secures the components tightly but can be challenging to maintain owing to factors such as mechanical vibrations, dynamic loads, temperature changes, and corrosion. These factors may cause bolts to loosen, which can undermine the joint’s effectiveness and reduce the structure’s load-bearing capacity, thus risking structural integrity (Nikravesh and Goudarzi, 2017). Therefore, prompt and accurate identification of bolt loosening is critical for maintaining the continuous safety and functionality of these fundamental structural components.
In the pursuit of preserving structural safety and integrity, researchers have characterized non-destructive testing (NDT) methods as indispensable tools for the identification of loosening in bolt connections (Li et al., 2019; Wang et al., 2013). Electromechanical impedance (EMI), acoustic emission, ultrasound inspection, machine vision, and intelligent percussion have been widely adopted. Specifically, vibration-based methods and EMI techniques have garnered attention for their proficiency in pinpointing bolt looseness (Amerini et al., 2010; Li and Jing, 2020; Zhuang et al., 2018). Ultrasound methods, with diverse approaches including active sensing, acoustoelastic effects, and nonlinear techniques, have offered a spectrum of diagnostic capabilities. In the realm of nonlinear ultrasound, harmonic methods have shown promise, particularly the subharmonic and second/high-order harmonic techniques (Fierro and Meo, 2018; Johnson et al., 2010; Zhang et al., 2017, 2018).
Further, modulation methods have carved a niche in bolt-looseness detection, with the percussion-acoustic modulation (Meyer and Adams, 2015) and vibro-acoustic modulation (VAM) (Wang and Song, 2019) methods standing out for their precision. VAM harnesses the synergy of vibrational energy and acoustic signals to reveal the presence of loosening with high fidelity. VAM has demonstrated exceptional performance in detecting bolt loosening and has been extensively studied and applied. The strength of VAM lies in its ability to detect subtle changes in the acoustic signature of a bolted joint, changes that are indicative of preload identification and potential loosening (Li et al., 2022). This method not only has demonstrated excellent performance in identifying single-bolt loosening but has also been progressively applied to the more complex scenario of multi-bolt connections, underlining its versatility and effectiveness in the field of bolt preload identification. In the evolving landscape of structural health monitoring, VAM technique has emerged as a robust tool for detecting high-strength bolt loosening. Research by Amerini and Meo, 2011 validated the efficacy of VAM in various structures, demonstrating a promising synergy between theoretical and experimental findings. Ramezani et al.(2019) used a non-destructive evaluation method for fracture critical members in steel bridges. Bolt loosening compromises the integrity of structural systems, making effective detection crucial for maintenance and safety. Conventional time-frequency analysis methods such as wavelet transform continue to provide valuable insights into VAM signal interpretation (Dong et al., 2023; Liu et al., 2018; Staszewski and Sohn, 2010; Huang et al., 2024; Addison, 2017; Huang et al., 2015). Current research predominantly focuses on single-bolt scenarios, aiming to enhance detection efficiency and practicality for individual bolts. However, studies on multi-bolt detection require further expansion to address this critical aspect comprehensively.
With the development of artificial intelligence, many advanced machines learning and deep learning methods have been applied to NDT data processing (Abdel-Hamid et al., 2014; Farrell et al., 2022; Krizhevsky et al., 2012; Li et al., 2021; Yuan et al., 2024). Noori Hoshyar et al. (2019) detected and visualized damage based on several NDT methods. Kim and Choi, 2019 pointed out the advantages of CNNs in processing image and time-series data. Hu et al. (2019) proposed an infrared thermography-based NDT technique and a long short term memory recurrent neural network (LSTM-RNN) model which automatically classifies common defects occurring in honeycomb materials. There has been significant attention on next-generation artificial intelligence applications, including intelligent conversational models like ChatGPT and Transformer model (Brown et al., 2020; Radford et al., 2018; Vaswani et al., 2017). Li et al. (2024) developed a physics-guided deep learning framework integrating supervised and unsupervised learning to diagnose manifold damage mechanisms and identify different loading stages using acoustic emission data. Ai et al. (2022) developed an automatic Alkali-silica reaction monitoring and evaluation approach by leveraging acoustic emission and a heterogeneous ensemble learning framework. Xie et al. (2023) continue used the physics-guided deep learning framework of to expand diagnostic capabilities. Recent work by Wang et al. (2023) showed the potential of Transformer-based neural networks in structural condition assessments, highlighting the task as a semantic segmentation challenge. Artificial Intelligence algorithms provide new approaches for processing large datasets in detection tasks. It becomes a key focus for future research to establish a robust and reasonable learning framework based on the need of multi-bolt detection and the characteristics of VAM data.
This study presents a recursive feature elimination (RFE)-aided Transformer-support vector machine (SVM) framework designed to detect loosening in multi-bolt connections by interpreting wavelet entropy from VAM signals. The process starts with extracting wavelet entropy vectors from VAM signals, providing a time-frequency representation that captures features of bolt loosening. The framework uses this network to identify subtle patterns indicating loosening in multi-bolt connections. After feature extraction by the Transformer and feature set refinement by RFE, an SVM was used to train the feature set and the integrity of the bolt connections was evaluated successfully. By integrating the feature learning capabilities of the Transformer, the feature selection of the RFE, and the classification performance of the SVM, this framework serves as a tool for identifying loosening in multi-bolt connections. The accuracy and efficiency of the proposed framework are validated through an experiment on a four-bolt joint.
Theoretical background
Overview of the proposed method
In the pursuit of structural safety and integrity, a novel approach was formulated for the detection of loosening in connections involving multiple bolts by harnessing the wavelet entropy extracted from VAM signals. This entropy acts as a dynamic marker to encapsulate the complex signature of the connection’s health. Initially, the framework applies a Transformer model, equipped with advanced positional encoding, to unearth high-dimensional features within the wavelet entropy vectors. This model is specifically tuned to pinpoint transient characteristics that are sensitive to states of bolt loosening. The Transformer’s ability to process sequences of data ensures that pertinent features are captured for subsequent analysis. Following the extraction process, RFE is utilized to distill the feature set, focusing on the most informative attributes. This step is critical in reducing the volume of data, allowing for a more streamlined yet effective selection of features that carry significant diagnostic value. The pared-down feature set obtained through RFE is then processed by SVM, which performs the task of classification. The SVM leverages this concentrated feature set to discern between secure and compromised bolt states with high precision, thus improving the accuracy of the diagnosis. The flowchart of the proposed RFE-aided Transformer-SVM framework is shown in Figure 1. First, the data acquisition for training and testing is conducted by applying the VAM method and wavelet entropy vectors to a four-bolt joint. Then, the learnable positional encoding is employed to Transformer model for extracting features of received signals. Subsequently, the eliminated features are selected through the RFE, and then the new feature sets are validated by K-fold cross-validation. Finally, the obtained new feature sets of the training data are fed into SVM classifier, and the identification of different cases of four-bolt loosening is verified by using the new testing feature sets. Flowchart of the proposed RFE-aided Transformer-SVM framework for multi-bolt loosening identification.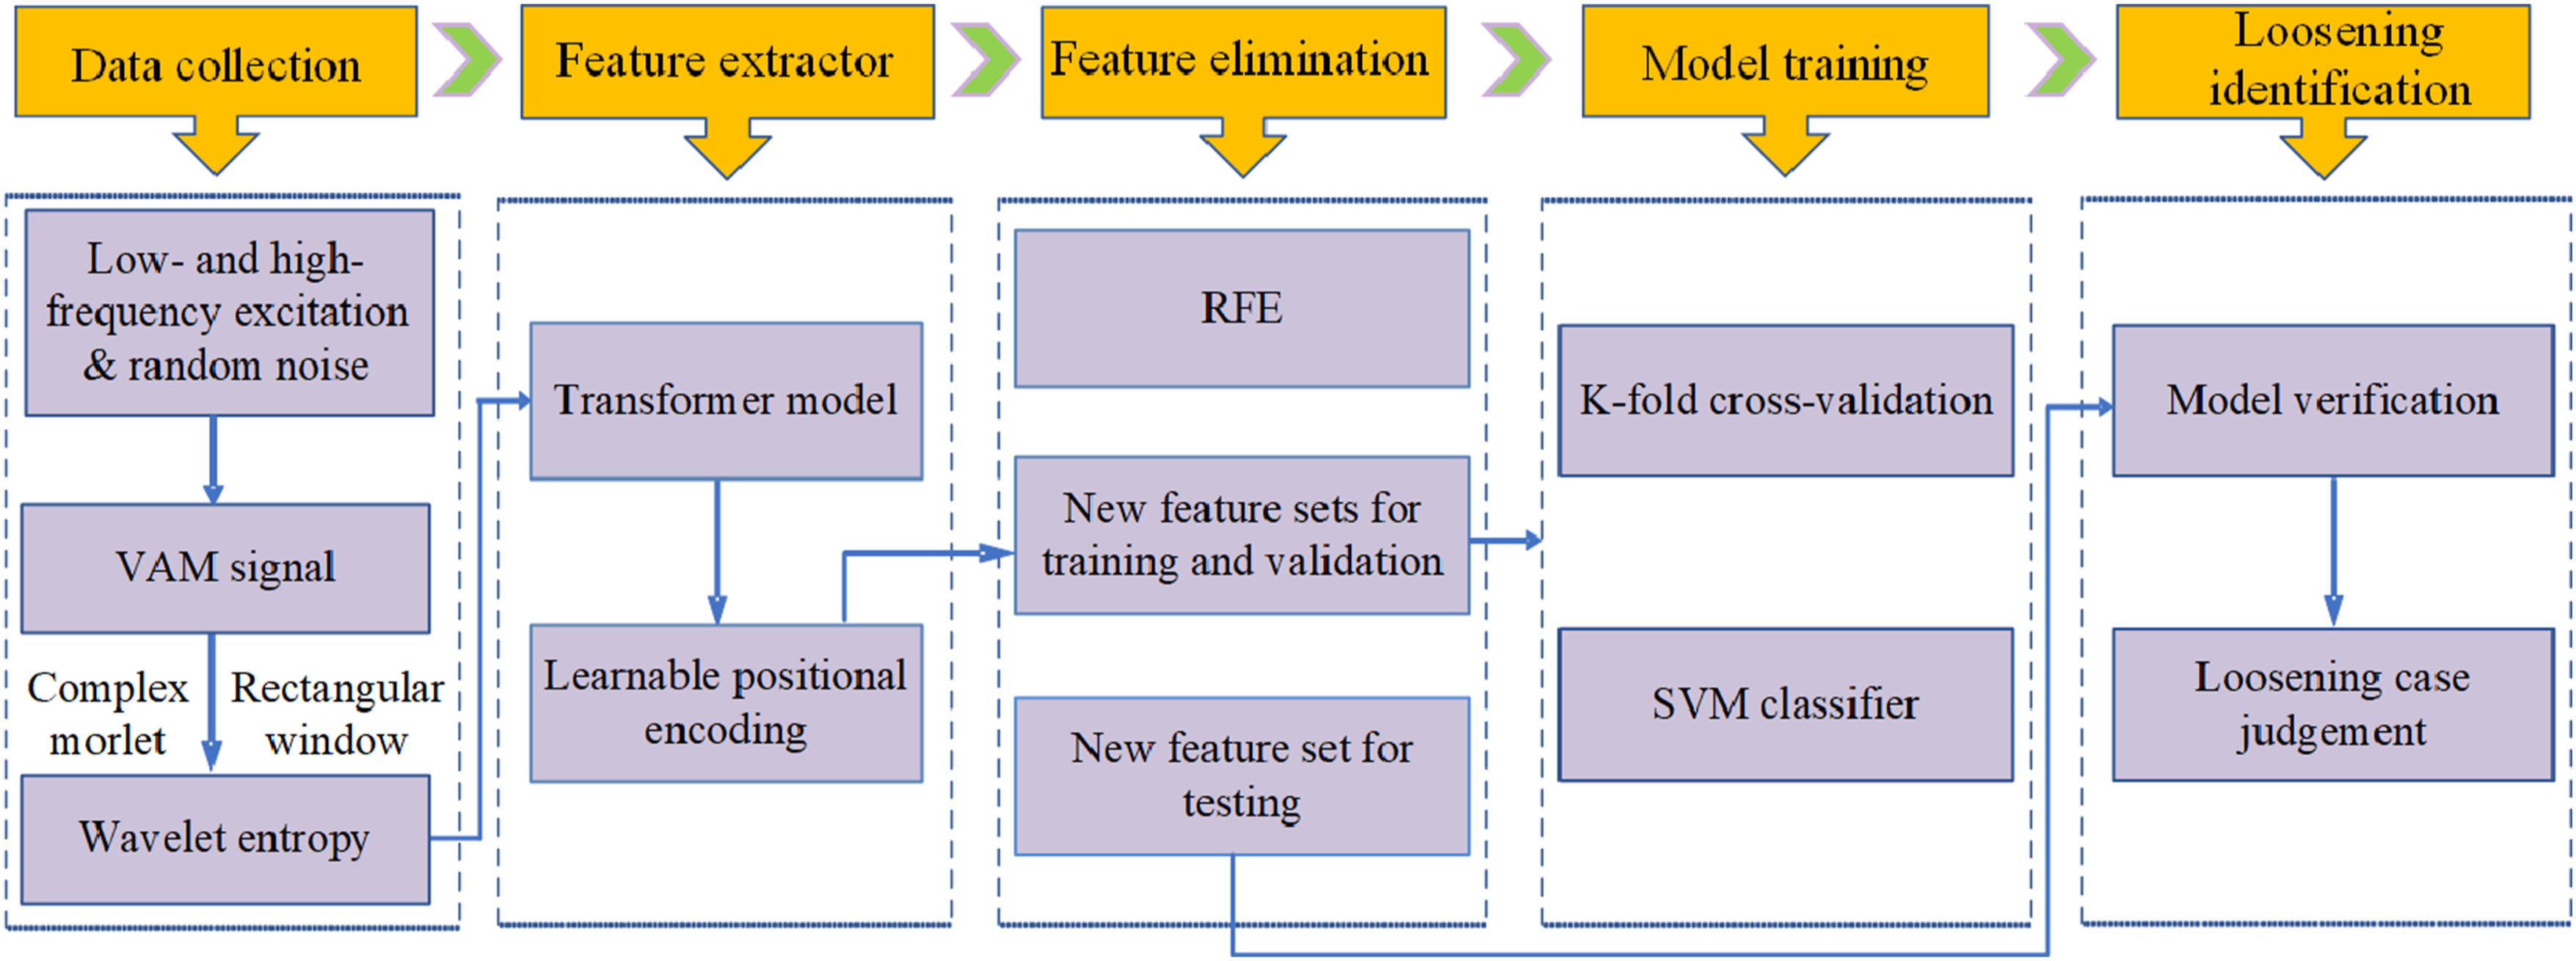
The proposed framework details a methodical integration of a Transformer for initial feature extraction, RFE to hone essential features, and SVM for decisive classification. The combination effectively utilizes wavelet entropy to reflect the integrity of bolt connections, significantly improving the detection of loosening compared with traditional methods and advancing the field of structural health assessment. The proposed methodology underwent rigorous testing on a testbed featuring a four-bolt assembly. The results reflect a high degree of accuracy and reliability, surpassing traditional methodologies such as standard SVM, LSTM (Memory, 2010; Wang et al., 2022), convolutional neural network-support vector machine (CNN-SVM) configurations, and even Transformer-SVM model without the integration of RFE. It underlines the effectiveness of the framework in identifying features indicative of damage from the wavelet entropy data, marking a pivotal development in the domain of structural health monitoring.
Wavelet transform and its entropy for data presentation
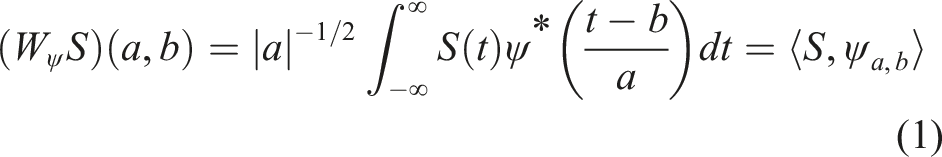
Wavelet analysis is a signal-processing method that relies on the introduction of an appropriate basis and a characterization of the signal by the distribution of amplitude in the basis. If the wavelet is required to form a proper orthogonal basis, it has the advantage that an arbitrary function can be uniquely decomposed, and the decomposition can be inverted. The continuous wavelet transforms of a signal S(t)
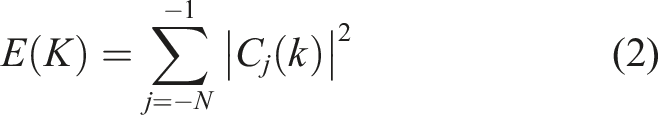
Then, wavelet coefficients are given by
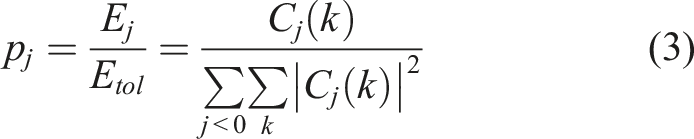
Shannon entropy (Shannon, 1948) gives a useful criterion for analyzing and comparing a probability distribution. According to the Shannon entropy theory and wavelet-energy ratio defined above, wavelet entropy is defined as
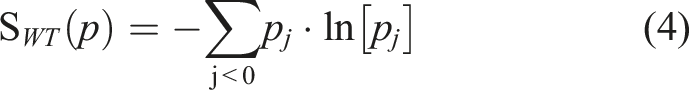
To some extent, wavelet entropy can represent the degree of order/disorder of the signal, so it can provide useful information about the underlying dynamical process associated with measured signals. A signal generated by a totally random process can be taken as representing a highly disordered behavior. This kind of signal has a wavelet representation with significant contributions from all the frequency bands. Additionally, it is expected that all the contributions are of the same order. Consequently, the relative wavelet energy is almost equal for all the resolution levels, and the wavelet entropy takes the maximum value. Damage in the structure results in a change in wavelet entropy. The damage identification problem can be then formulated as follows: given the changes in the wavelet entropy before and after damage, predict the location and severity of the damage.
Transformer-SVM model for feature extraction
Since its introduction by Google in 2017, the Transformer architecture has gained prominence in deep learning for its feature extraction capabilities and widespread use in complex tasks. However, Transformers are typically used for sequential tasks such as text generation and time-series forecasting, not direct vector classification or object detection. A Transformer-SVM model for feature extraction and classification was developed, and a detailed architecture of the Transformer-SVM model is illustrated in Figure 2. In Figure 2, wavelet entropy is represented by bar charts. Then, the architecture and dimensions of the Transformer-SVM model were displayed. Subsequently, t-SNE spectral graphs are used to depict the RFE process and the 16 damage cases of four-bolt loosening identification. Detailed architecture of the Transformer-SVM model.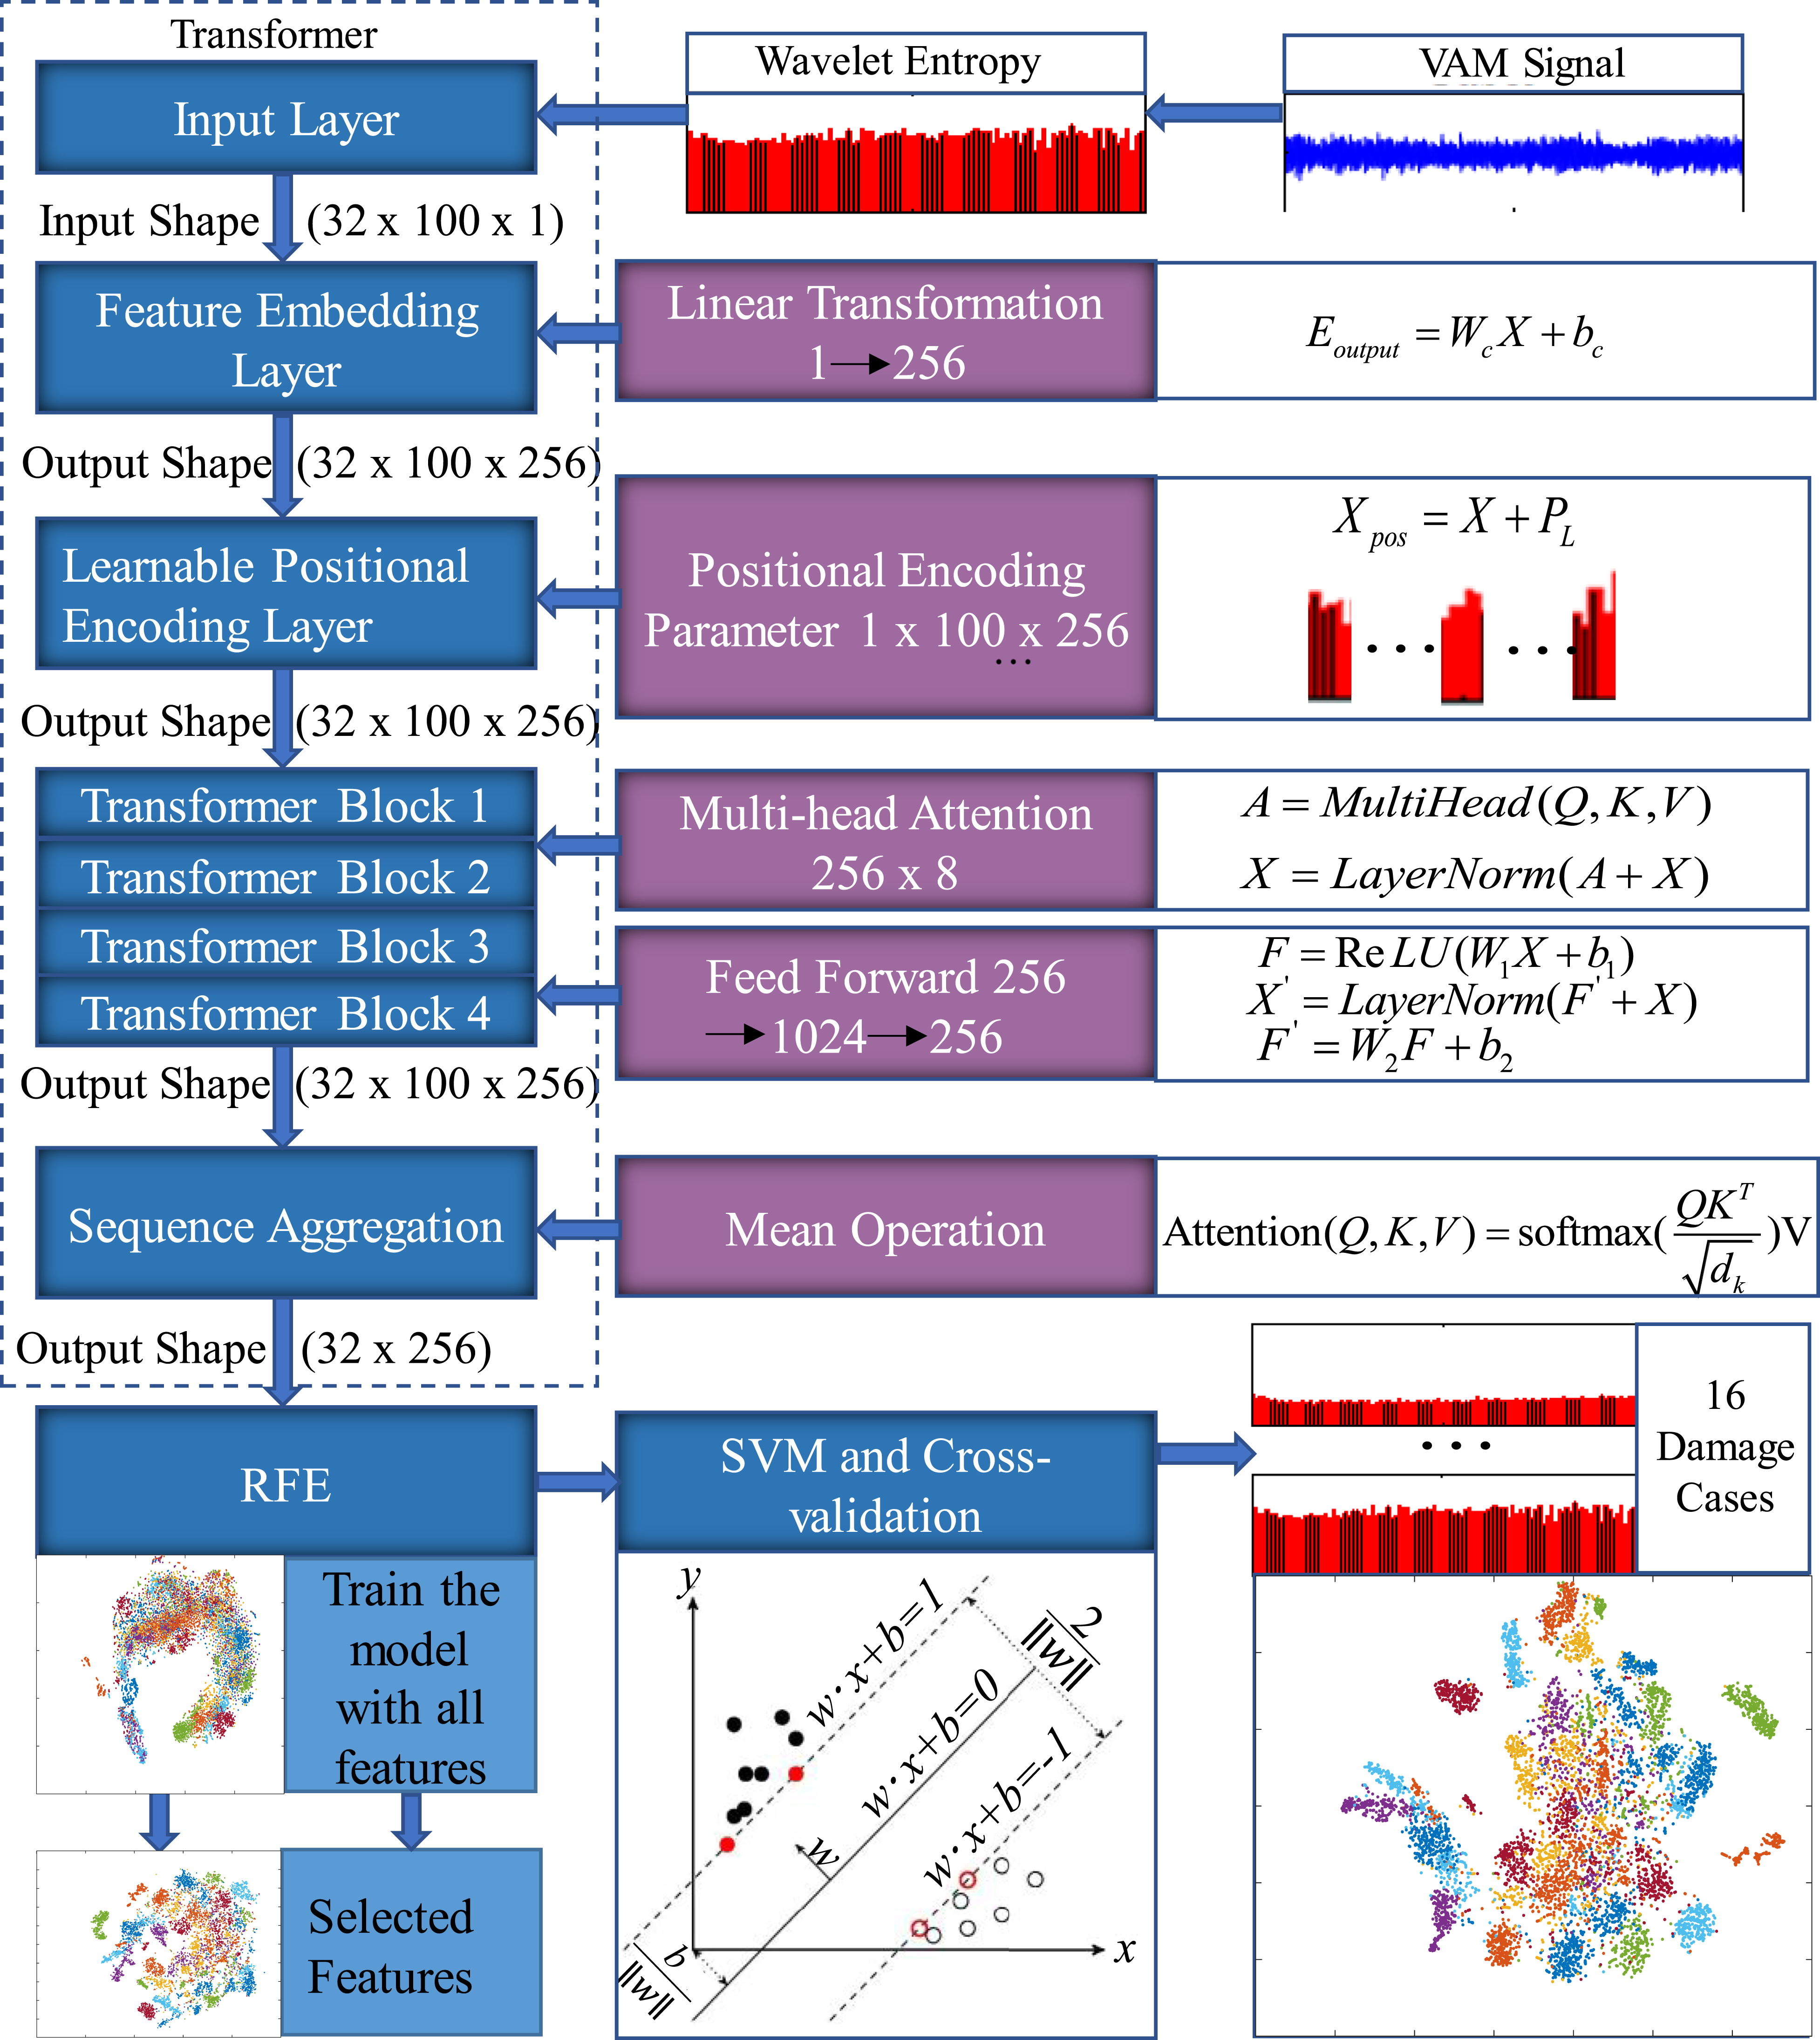
In this study, an innovative learnable positional-encoding schema was engineered with the primary objective of endowing the proposed model with the capability to discern the positional context of elements within an input sequence. Let
The operation of the positional encodings of the input is expressed as

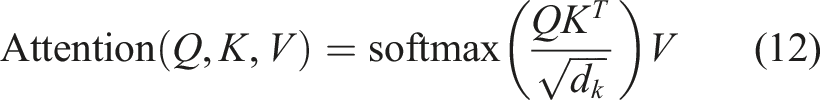
Central to the model’s architecture are the Transformer blocks, which encompass a multi-head self-attention mechanism alongside a feed-forward neural network. The multi-head self-attention mechanism facilitates concurrent attentional focus across multiple sequence positions, a pivotal capability for capturing the intricate dependencies present within the sequence.
Following the self-attention operation, residual connections and layer normalization are adopted to bolster the stability of training and facilitate the learning of more profound feature representations. The sequences, thus processed, are subsequently channeled through a feed-forward neural network, which is also followed by the application of residual connections and layer normalization. This architecture preserves the integrity of input information while simultaneously enhancing the model’s capacity for data processing. At the ingress of the model lies the feature embedding layer, which transmutes the raw data features into a higher-dimensional feature space conducive to the model’s operations.
The feature embedding layer is expressed as follows

This is achieved via a linear transformation, wherein each feature vector is multiplied by a designated weight matrix and appended with a bias vector, culminating in an elevated feature representation. The forward pass of the Transformer block is thus


The feed-forward network is expressed as follows:


A Transformer-based feature extractor is architected to amalgamate the components outlined above, aiming to distill complex features from the primitive input data. In the forward trajectory of this extractor, the raw data are initially refined through the feature-embedding layer, succeeded by the incorporation of learnable positional encodings. The data are then sequentially processed through a cadre of Transformer blocks, each executing self-attention and feed-forward network computations. Upon completion of the sequential processing, a global feature synthesis is conducted via mean pooling across the positional features, followed by the dropout layer for regularization, which yields the ultimate feature representation. Thereafter, the features are subjected to dimensionality reduction through RFE, and the newly constituted feature set is normalized prior to its introduction into an SVM classifier.
Based on the statistical learning theory, the SVM (Iosifidis and Gabbouj, 2016) belongs to a data-driven method, which can realize linear classification through a hyperplane. A hyperplane
RFE process for effective feature selection
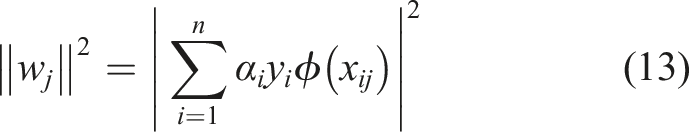
RFE process is an effective algorithm for feature selection, which depends on the specific learning model (Ou et al., 2017). Guyon et al. (2002) proposed RFE, which was applied in cancer classification using SVM. RFE employs all of the features to build a SVM model, which generates a ranked feature list and finally eliminates irrelevant features making less contribution to the SVM model. To evaluate the contribution of each feature, RFE process uses
Experimental procedure
A test specimen was designed by connecting four steel plates using four M20 high-strength bolts, as depicted in Figure 3. The dimensions of the splicing plate were 180 × 180 × 8 mm, while the core plate measured 240 × 190 × 8 mm. Both plates were made of Q345 steel. The four high-strength bolts were labeled as I, II, III, and IV for easy classification of the CNN identification results. To ensure nonrepetitive working conditions due to the symmetry of the piezoelectric ceramic piece, two PZT sensors in specific positions were affixed, as shown in Figure 3. PZT1, located on the same side as the high-strength bolt head, served as the signal emitting sensor, while PZT2, situated on the same side as the nut, acted as sensors for receiving VAM signals. Experimental setup.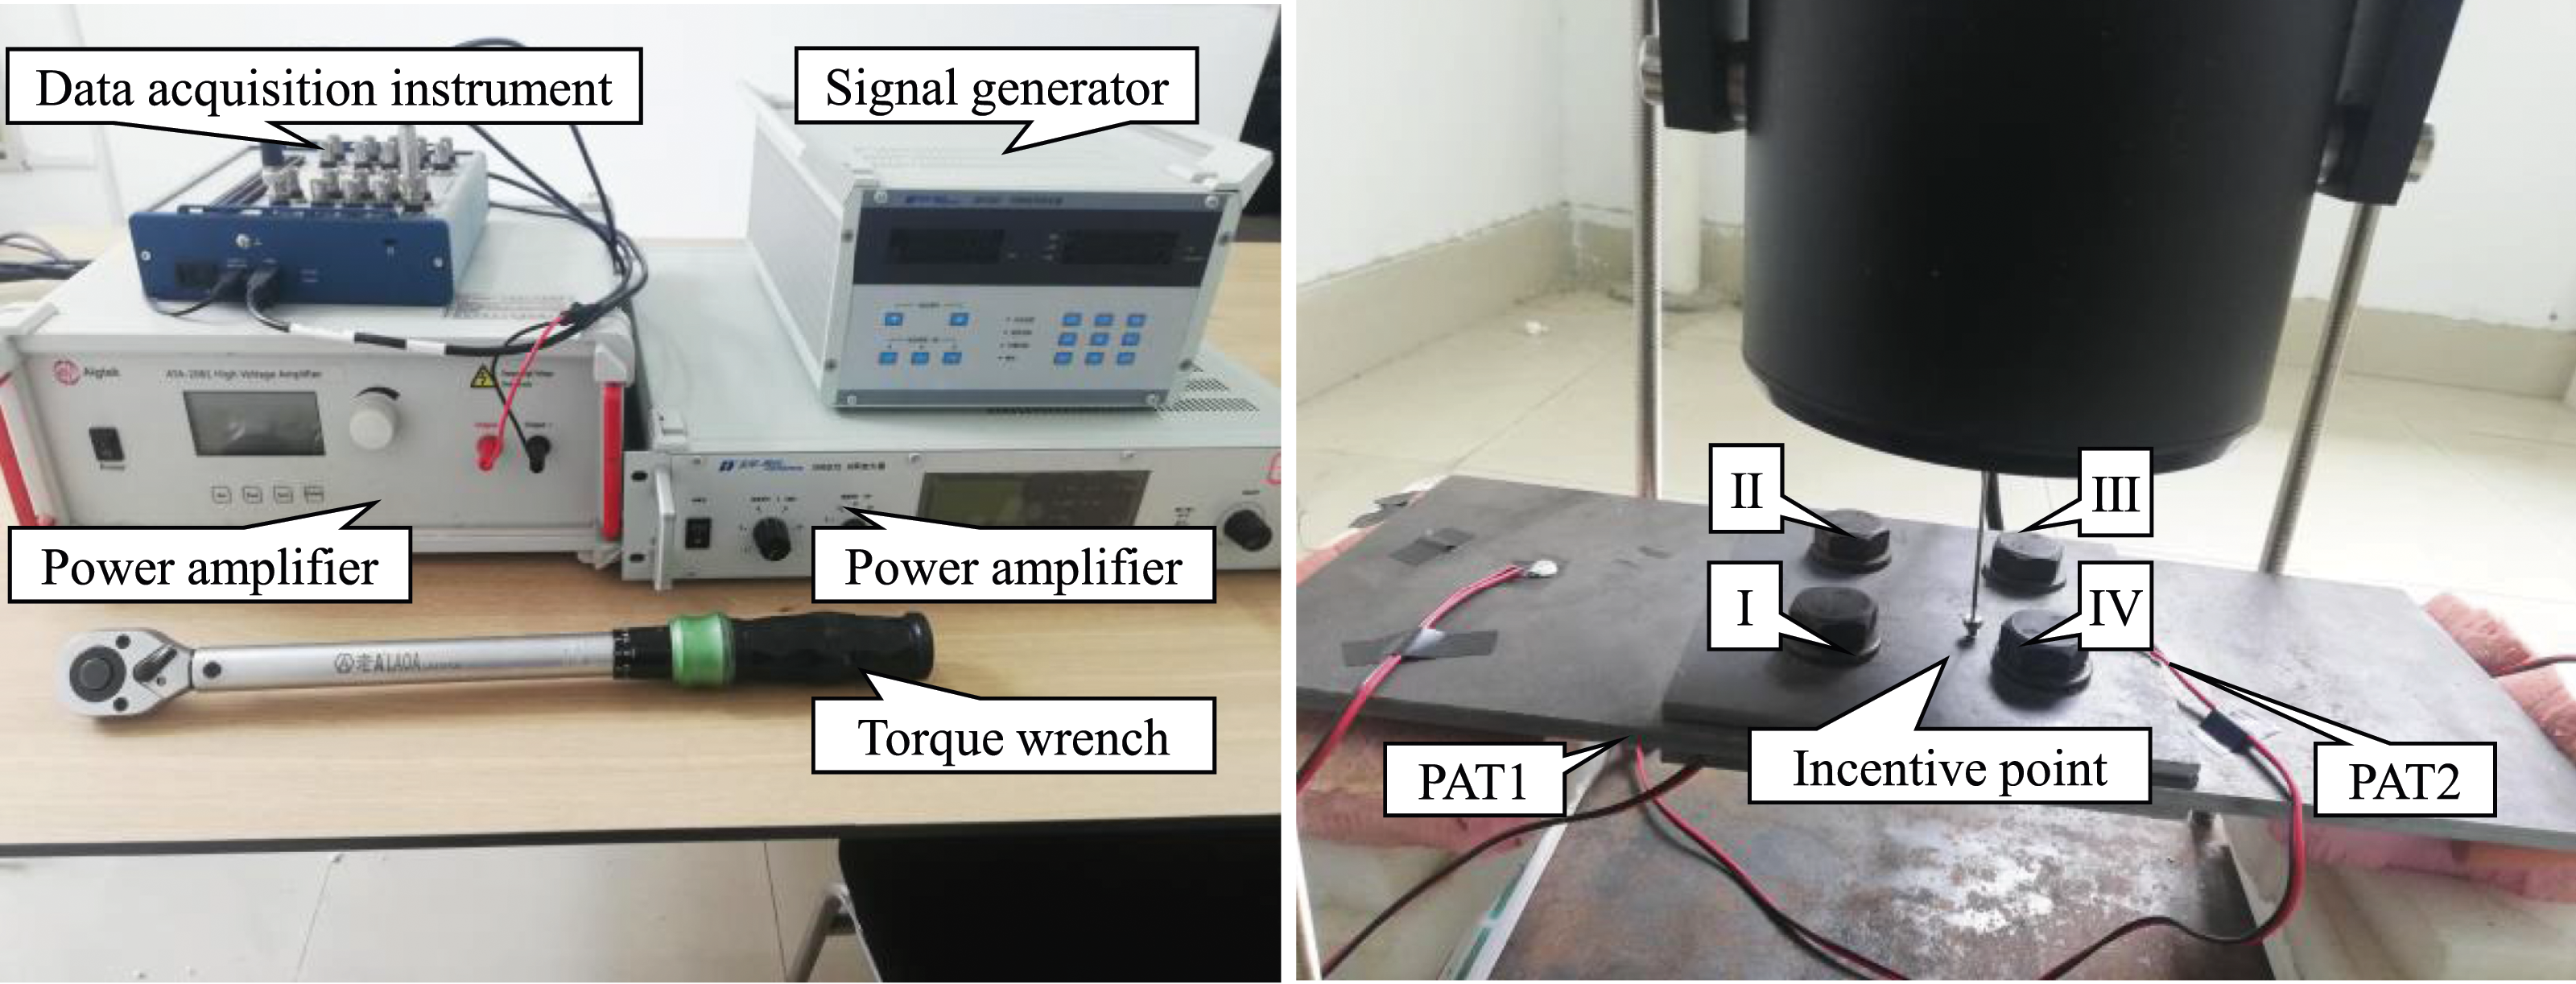
The initial torque for a standard M20 high-strength bolt is typically 221 N·m, with the final torque range falling between 374 and 510 N·m. Based on the findings of Wang and Song, 2019, bolt loosening can occur during the early stages when the pre-tightening force ranges from 50 to 70 N·m. Therefore, a torque value of 70 N·m was selected as the tightening-state torque value to ensure the applicability of this study to a wider range of working conditions. The torque wrench used in this test was a preset torque wrench with a range of 28-210 N·m. To prevent complete detachment, the lower working range of the torque wrench as the loosening state was used. Therefore, the initial torque for bolt loosening was set at 28 N·m. Other torque values were assigned based on the principle of proximity.
The data-acquisition system utilized in this experiment consists of a DH40200 vibration generator, National Instruments data-acquisition instrument, high-frequency (HF) ultrasonic signal-generation equipment, and a computer, as illustrated in Figure 3. The low-frequency (LF) excitation is generated by the vibration generator, and its point of action is depicted in Figure 3. The HF signal serves a similar role to the carrier in VAM identification, carrying nonlinear modulation information. Typically, a continuous single-frequency sine or sweep signal with a frequency ranging from tens to hundreds of kHz is employed, with an amplitude in the tens of volts. To enhance the randomness of the samples, LabVIEW was programmed to apply random noise and HF excitation to the joint via PZT. The vibration generator was used to conduct a test of the LF excitation form, with an output frequency of 640 Hz. The PZT input HF frequency ranged from 10 to 15 kHz with linear frequency modulation. This test is referred to as the vibration-generator test in the subsequent sections.
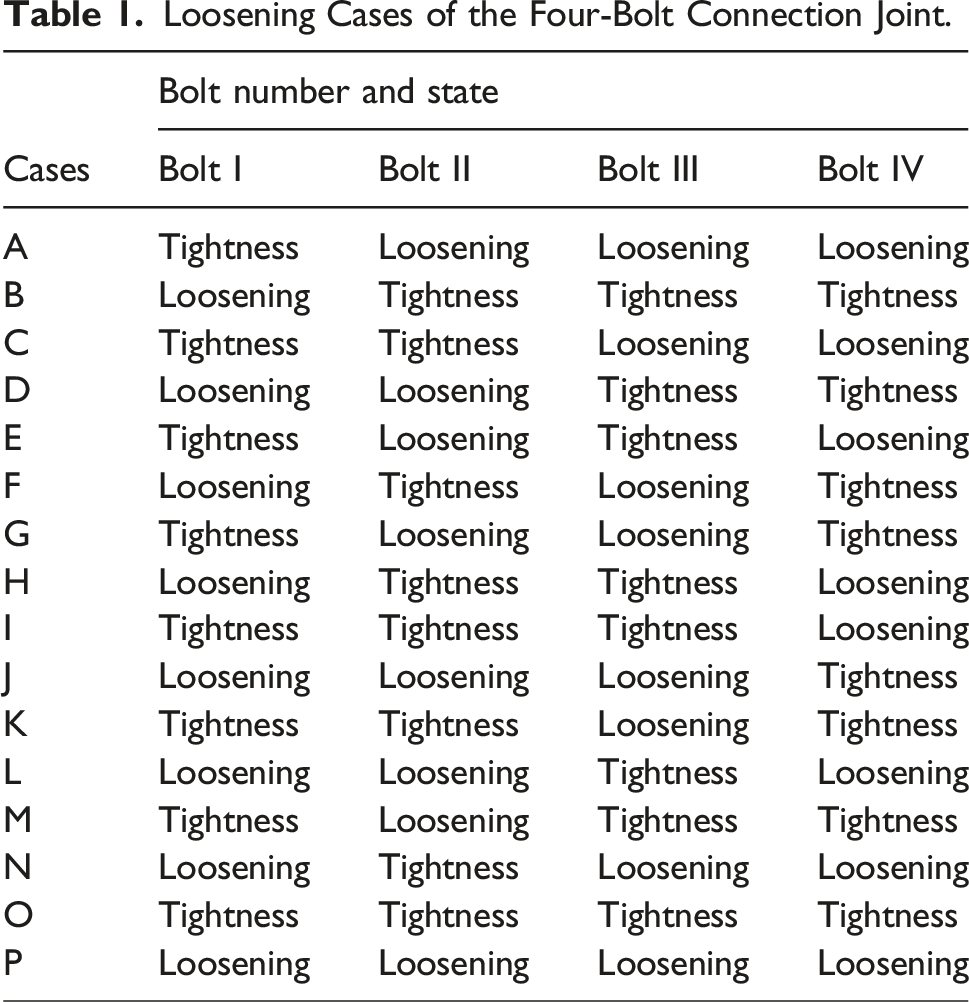
Loosening Cases of the Four-Bolt Connection Joint.
Results and discussion
Performance of the Transformer-SVM model
The received VAM signals for different cases are depicted in Figure 4. The relationship between received the VAM signal energy and each bolt-loosening case of the connection joint was not straightforward, since several peaks were observed in each VAM signal. The signal energy generally grew with the increase in the bolt tightening degree. Wang et al. (2020) also confirmed these results. It was because the transmitted wave energy was proportional to the real contact area that would increase if a larger preload were applied. However, the energy in cases D, F, H, and K was almost the same, so this growth was not monotonous. For multi-bolt loosening detection, the signal energy was not sensitive enough as the damage index. Example VAM signals with corresponding wavelet entropy vectors for different cases.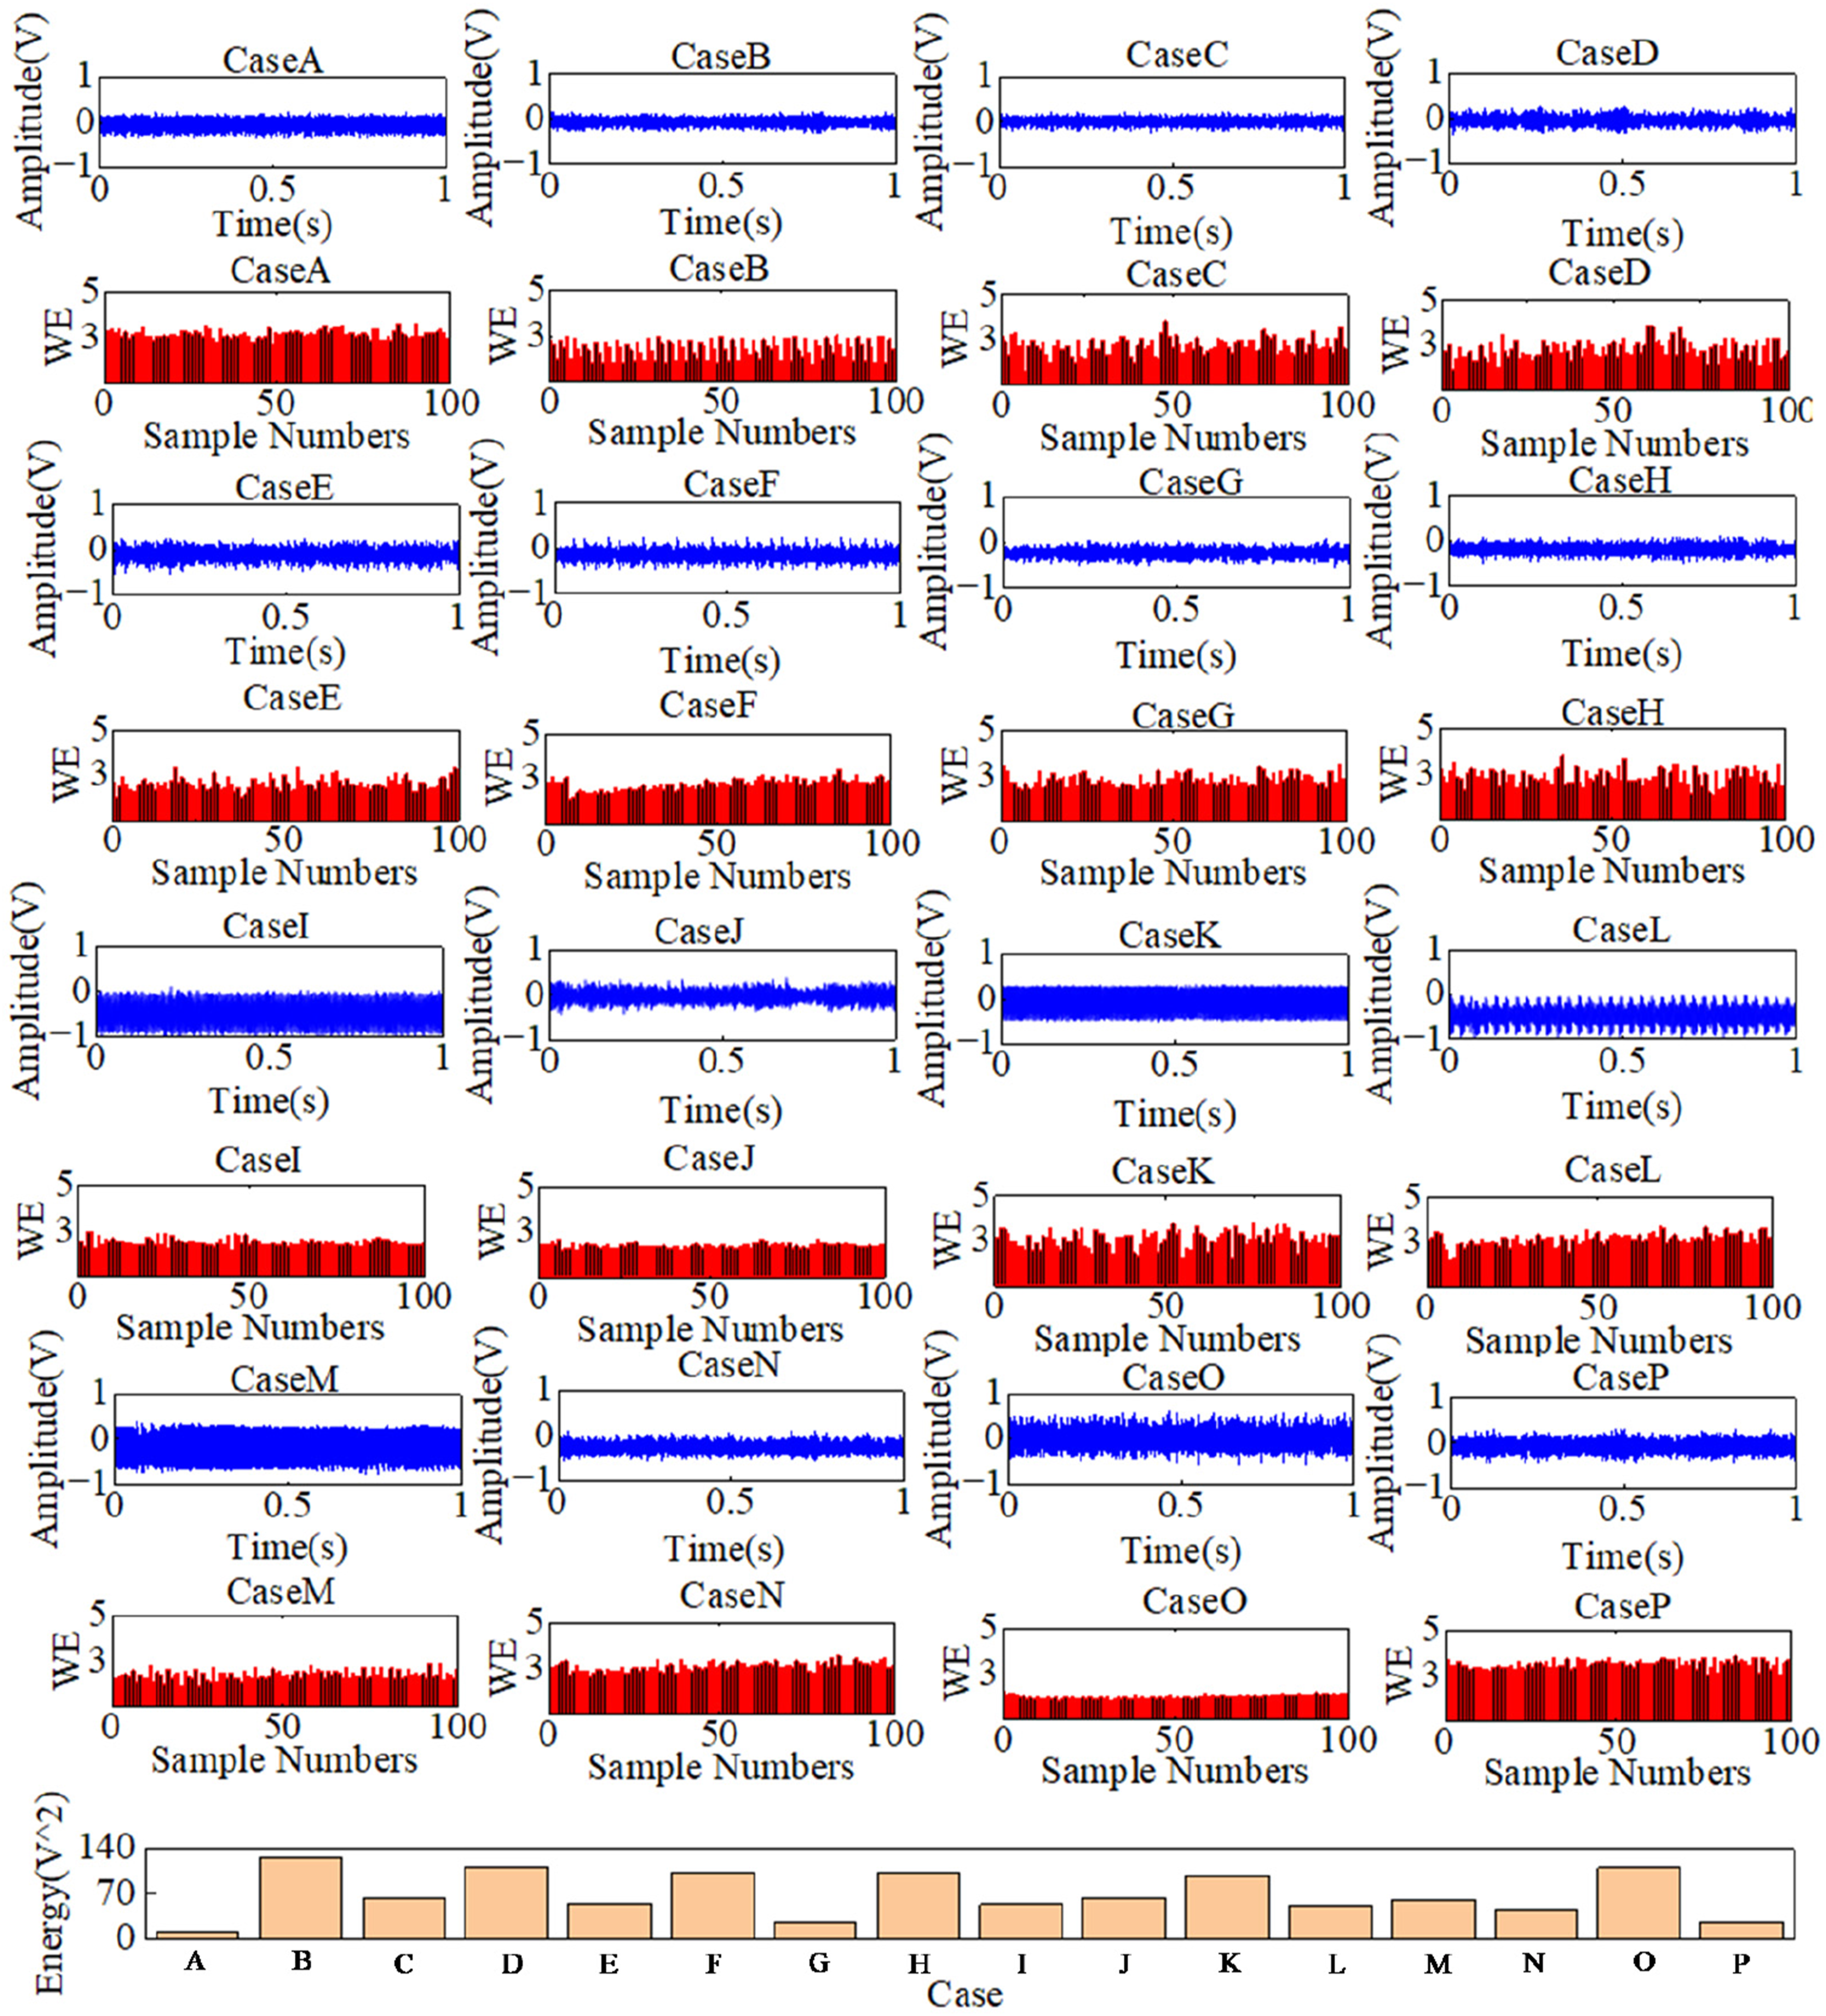
To validate the effectiveness and advantages of the proposed framework, the performances of SVM, LSTM, and CNN-SVM models were compared against the Transformer-SVM model. LSTM was a special kind of RNN capable of learning long-term dependencies in sequential data. It overcame the limitations of traditional RNNs, which struggled to capture long-range temporal relationships due to vanishing and exploding gradients. The LSTM unit included three gates, including input gate, forget gate, and output gate. The CNN-SVM model was an integration of CNNs and SVMs. This hybrid approach utilized the powerful feature extraction capabilities of CNNs to process data through multiple layers of convolution and pooling operations. The high-level features extracted by the CNN were then fed into an SVM, which classified the data. The SVM was typically employed as a replacement for the final fully connected layers of CNN, providing a robust decision boundary for classification tasks. This combination enhanced the generalization and lead to better performance on various pattern recognition problems compared with using CNN with a standard softmax layer. Wavelet diagrams of example VAM signals for different cases are shown in Figure 5. Wavelet diagrams of example VAM signals for different cases.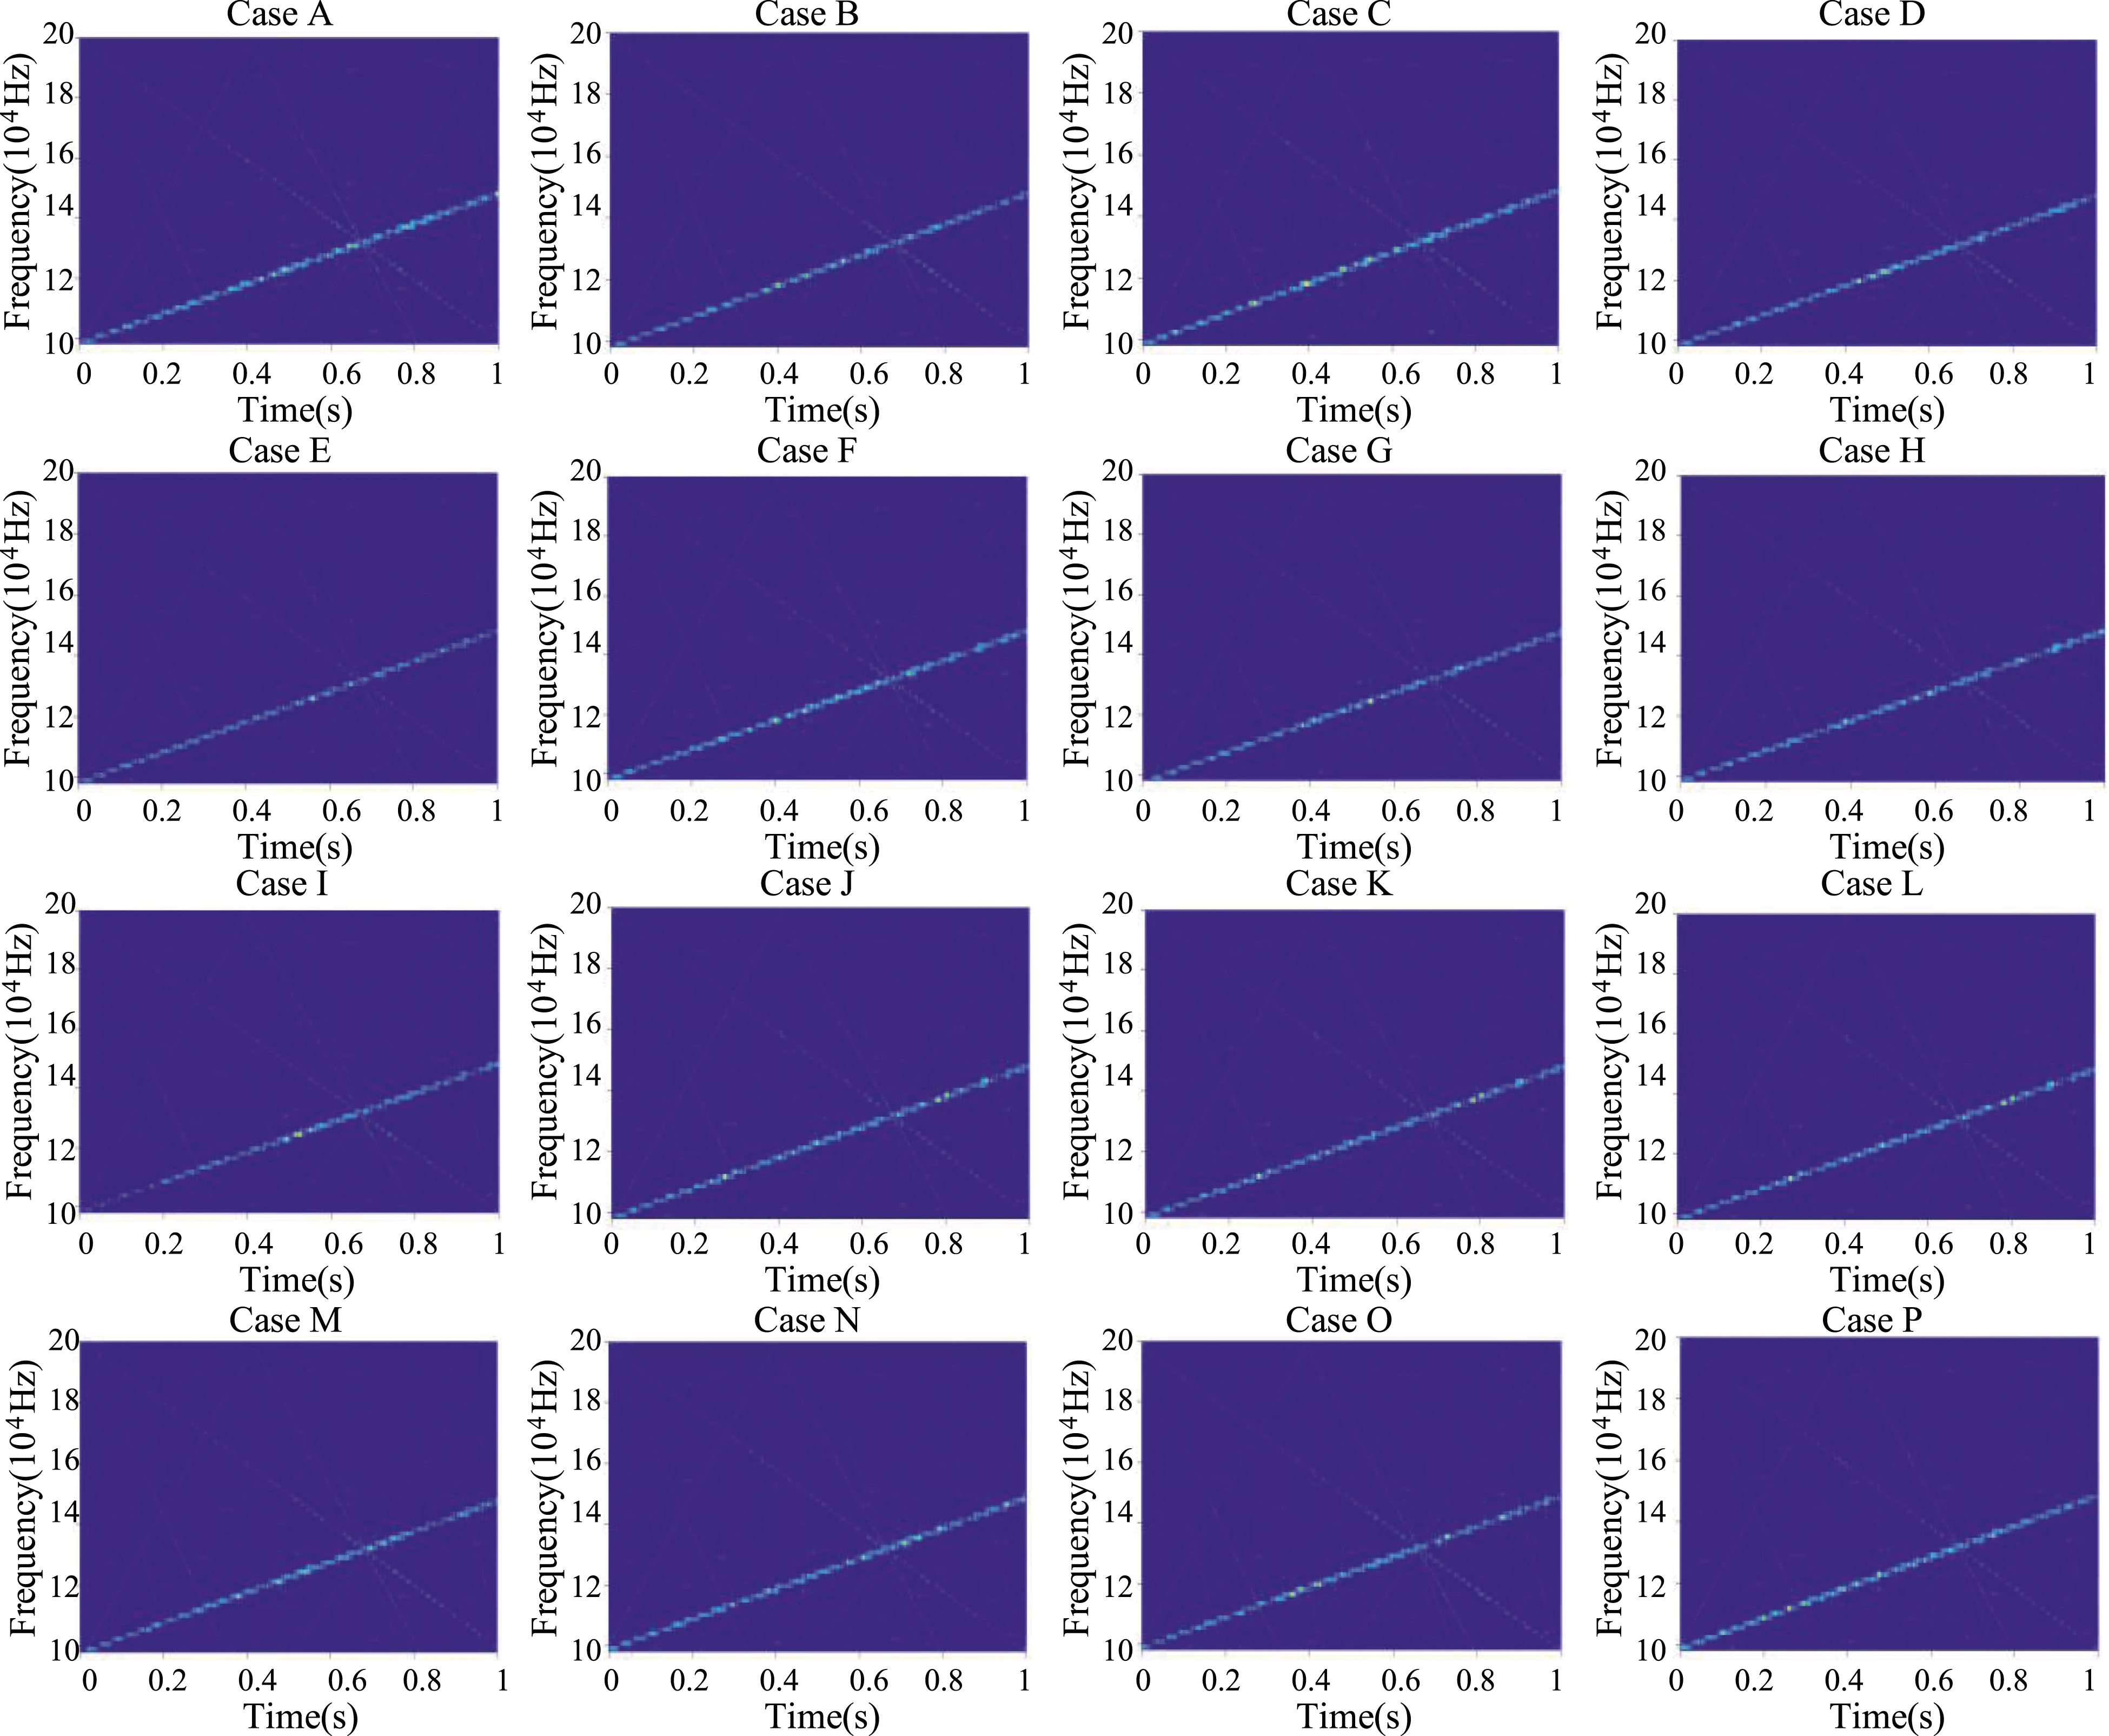
To ensure the robustness of the results, K-fold cross-validation was employed, allowing for training and validating the model on multiple subsets of the data. This approach helped assess the consistency of performance and reduced the impact of data partitioning. To mitigate stochastic effects, all training outcomes over 20 iterations were averaged, which ensured the robustness of the results. Early stopping was used during training to prevent overfitting, and regularization techniques such as dropout were applied to enhance the model’s generalization ability. Extensive hyperparameter tuning was performed. The sparrow search algorithm was used for the Transformer, while grid search was applied for the SVM classifier to identify the most stable configurations for the model. The optimized regularization and kernel bandwidth parameters of SVM were set at 20 and 0.02, respectively. For the Transformer model, the stochastic gradient descent with momentum (SGDM) optimizer, a batch size of 32, a learning rate of 0.047, and a weight decay of 0.003 were meticulously calibrated.
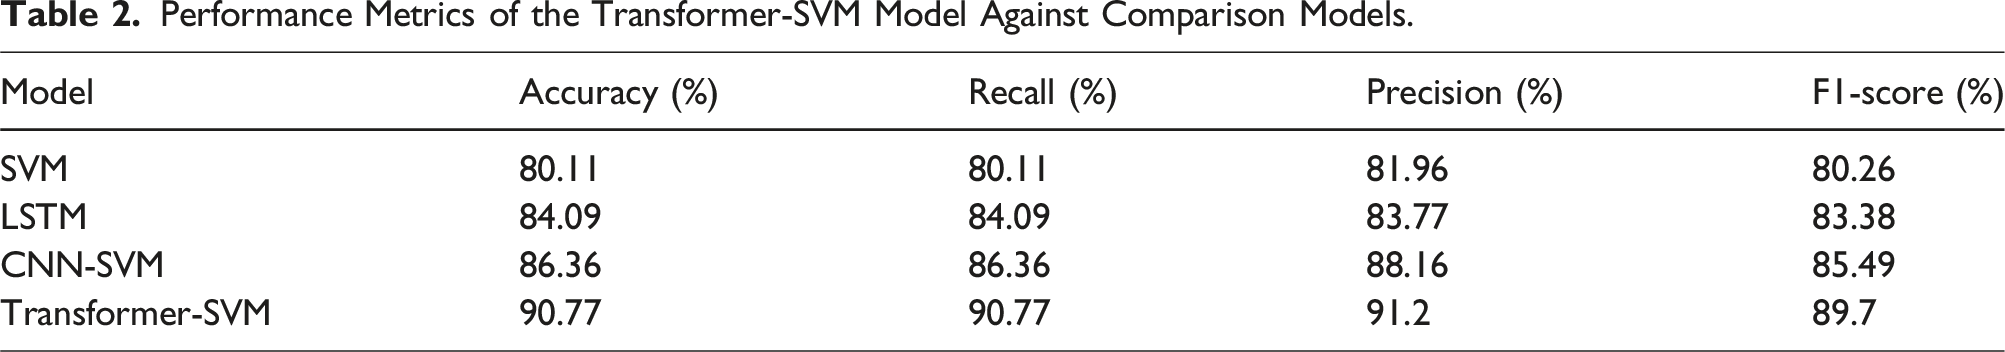
The performance metrics and confusion matrices for different models on the testing set are illustrated in Figure 6 and Table 2. It is evident that the Transformer-SVM model outperformed the other models across all metrics for the loosening recognition and localization of multiple bolts. The testing set accuracy across 20 runs for the SVM, LSTM, CNN-SVM, and Transformer-SVM models averaged 80.11%, 84.09%, 86.36%, and 90.77%, respectively. The Transformer-SVM model surpasses the SVM, LSTM and CNN-SVM by 10.66%, 6.68% and 4.41%, respectively, with similar improvements observed in other metrics. Confusion matrices of different models for testing data: (a) SVM, (b) LSTM, (c) CNN-SVM, and (d) Transformer-SVM. Performance Metrics of the Transformer-SVM Model Against Comparison Models.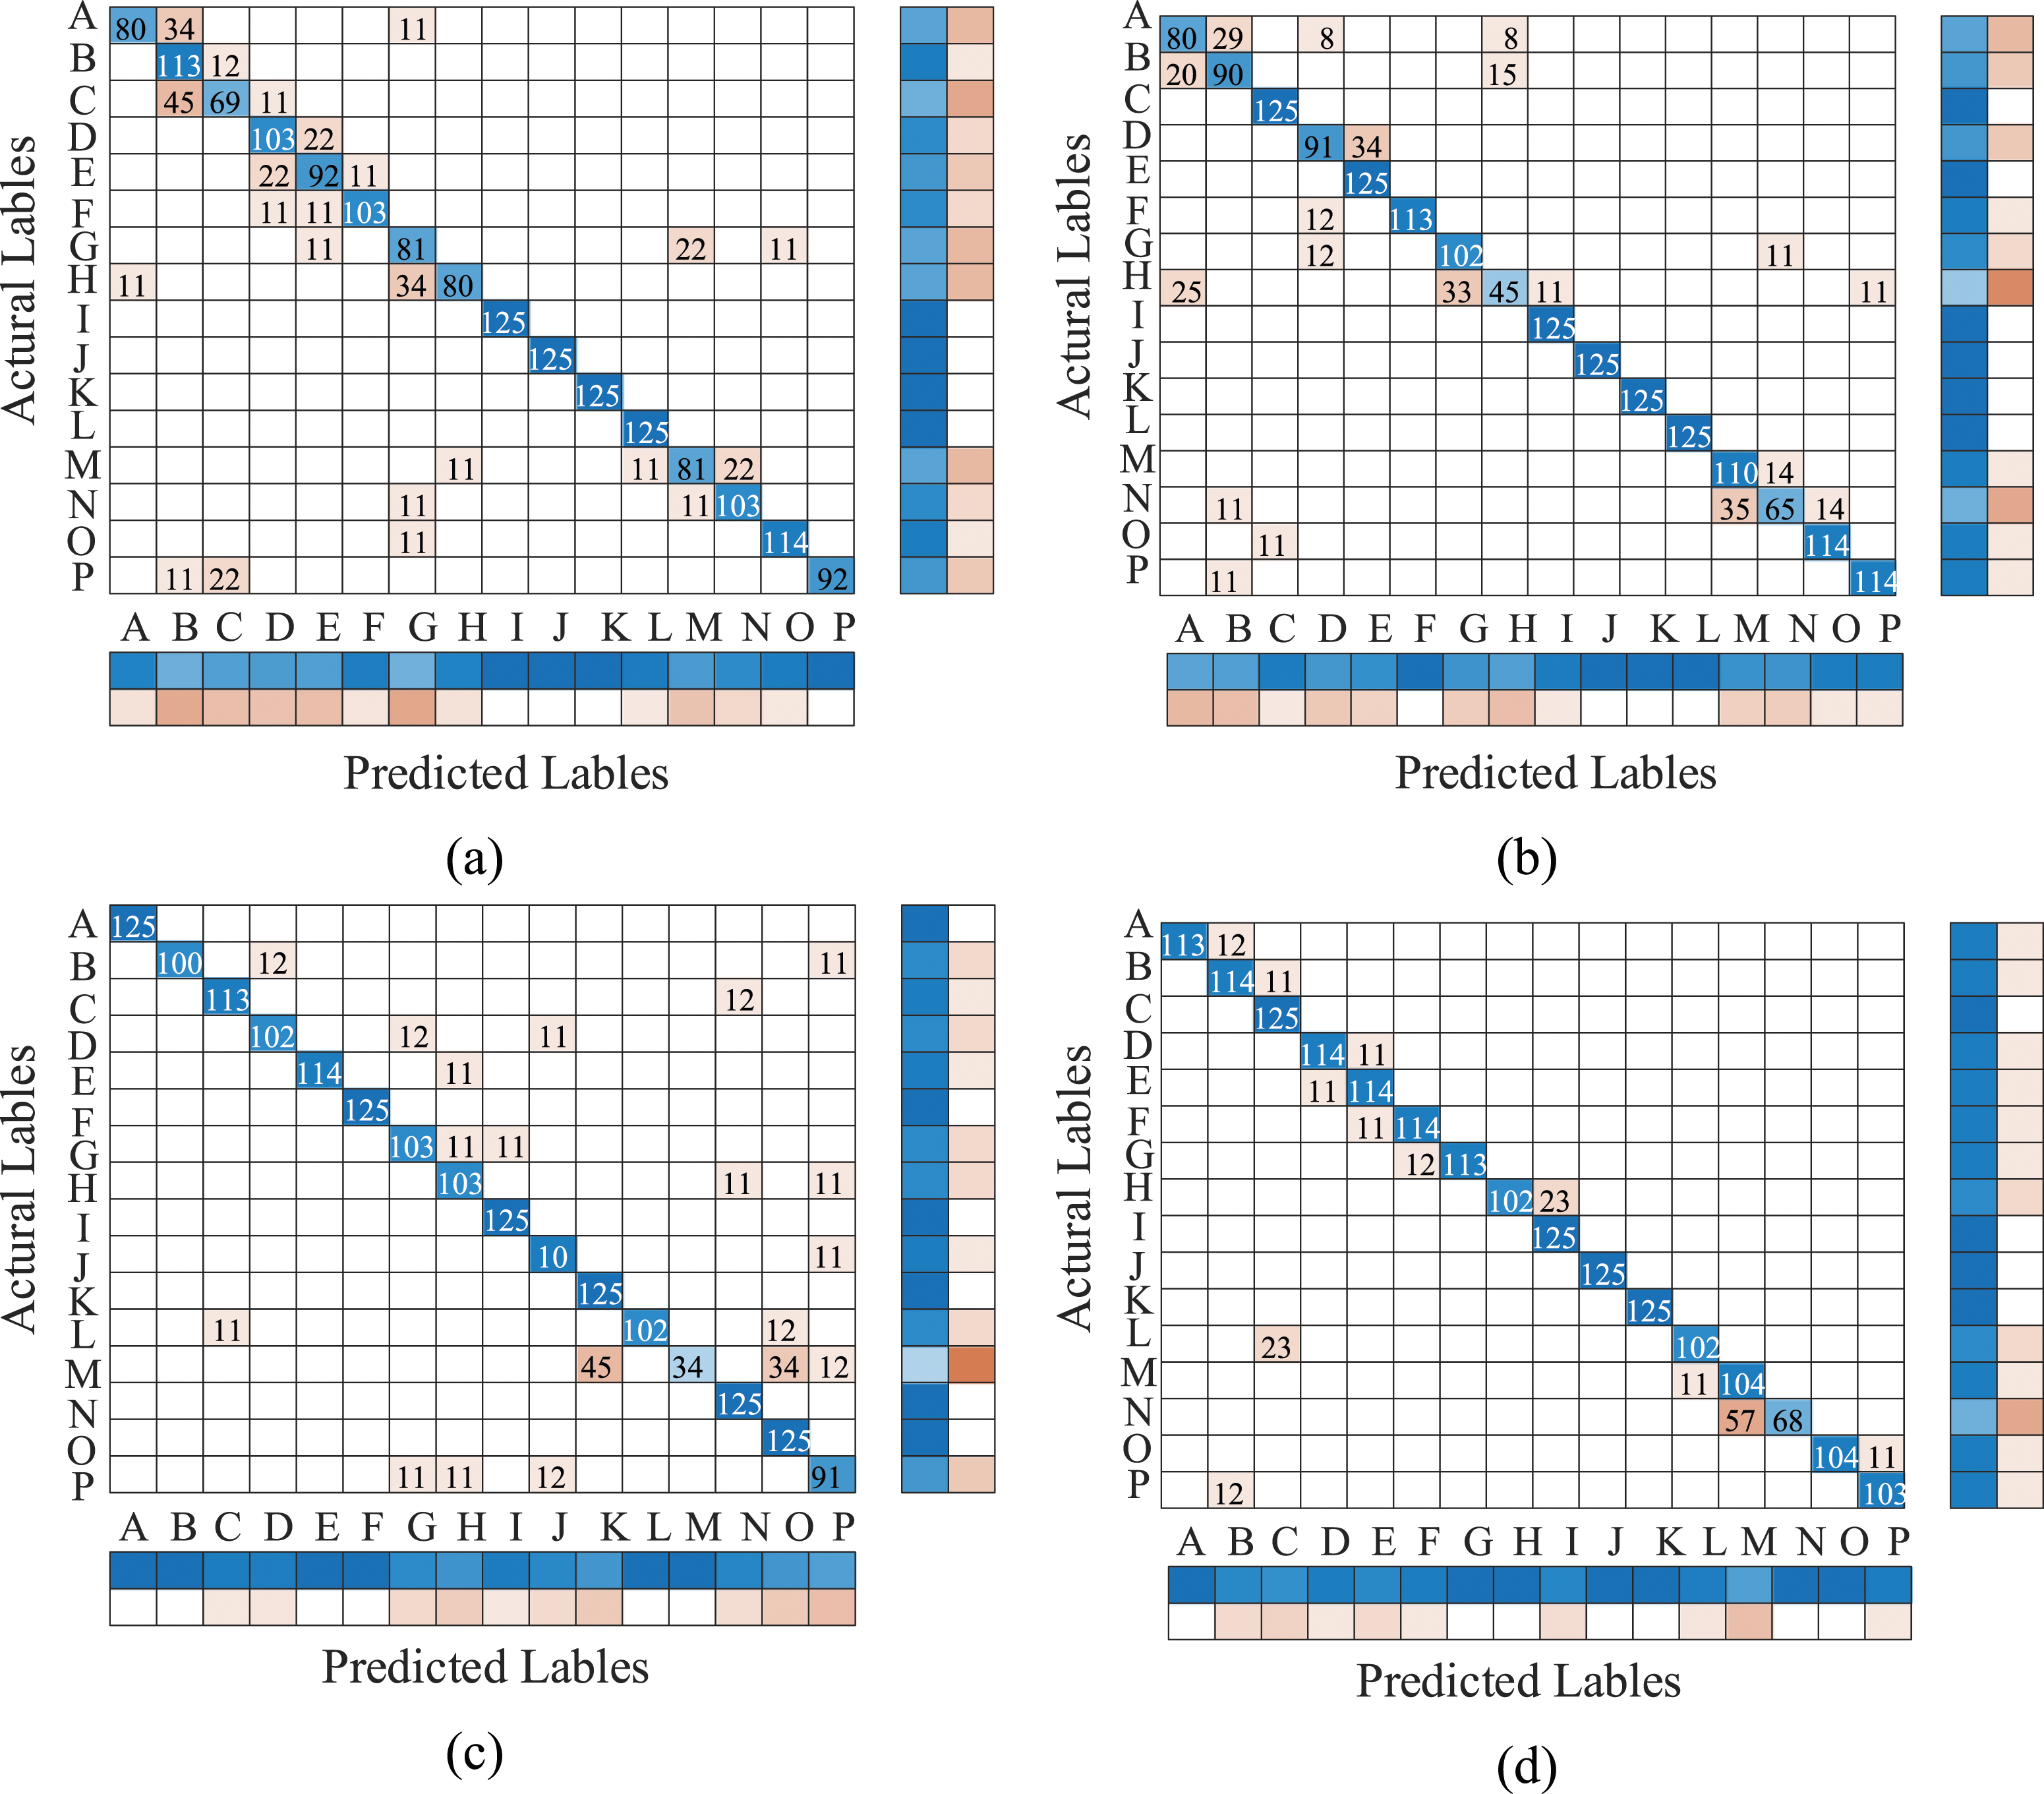
Performance of the RFE-aided Transformer-SVM model
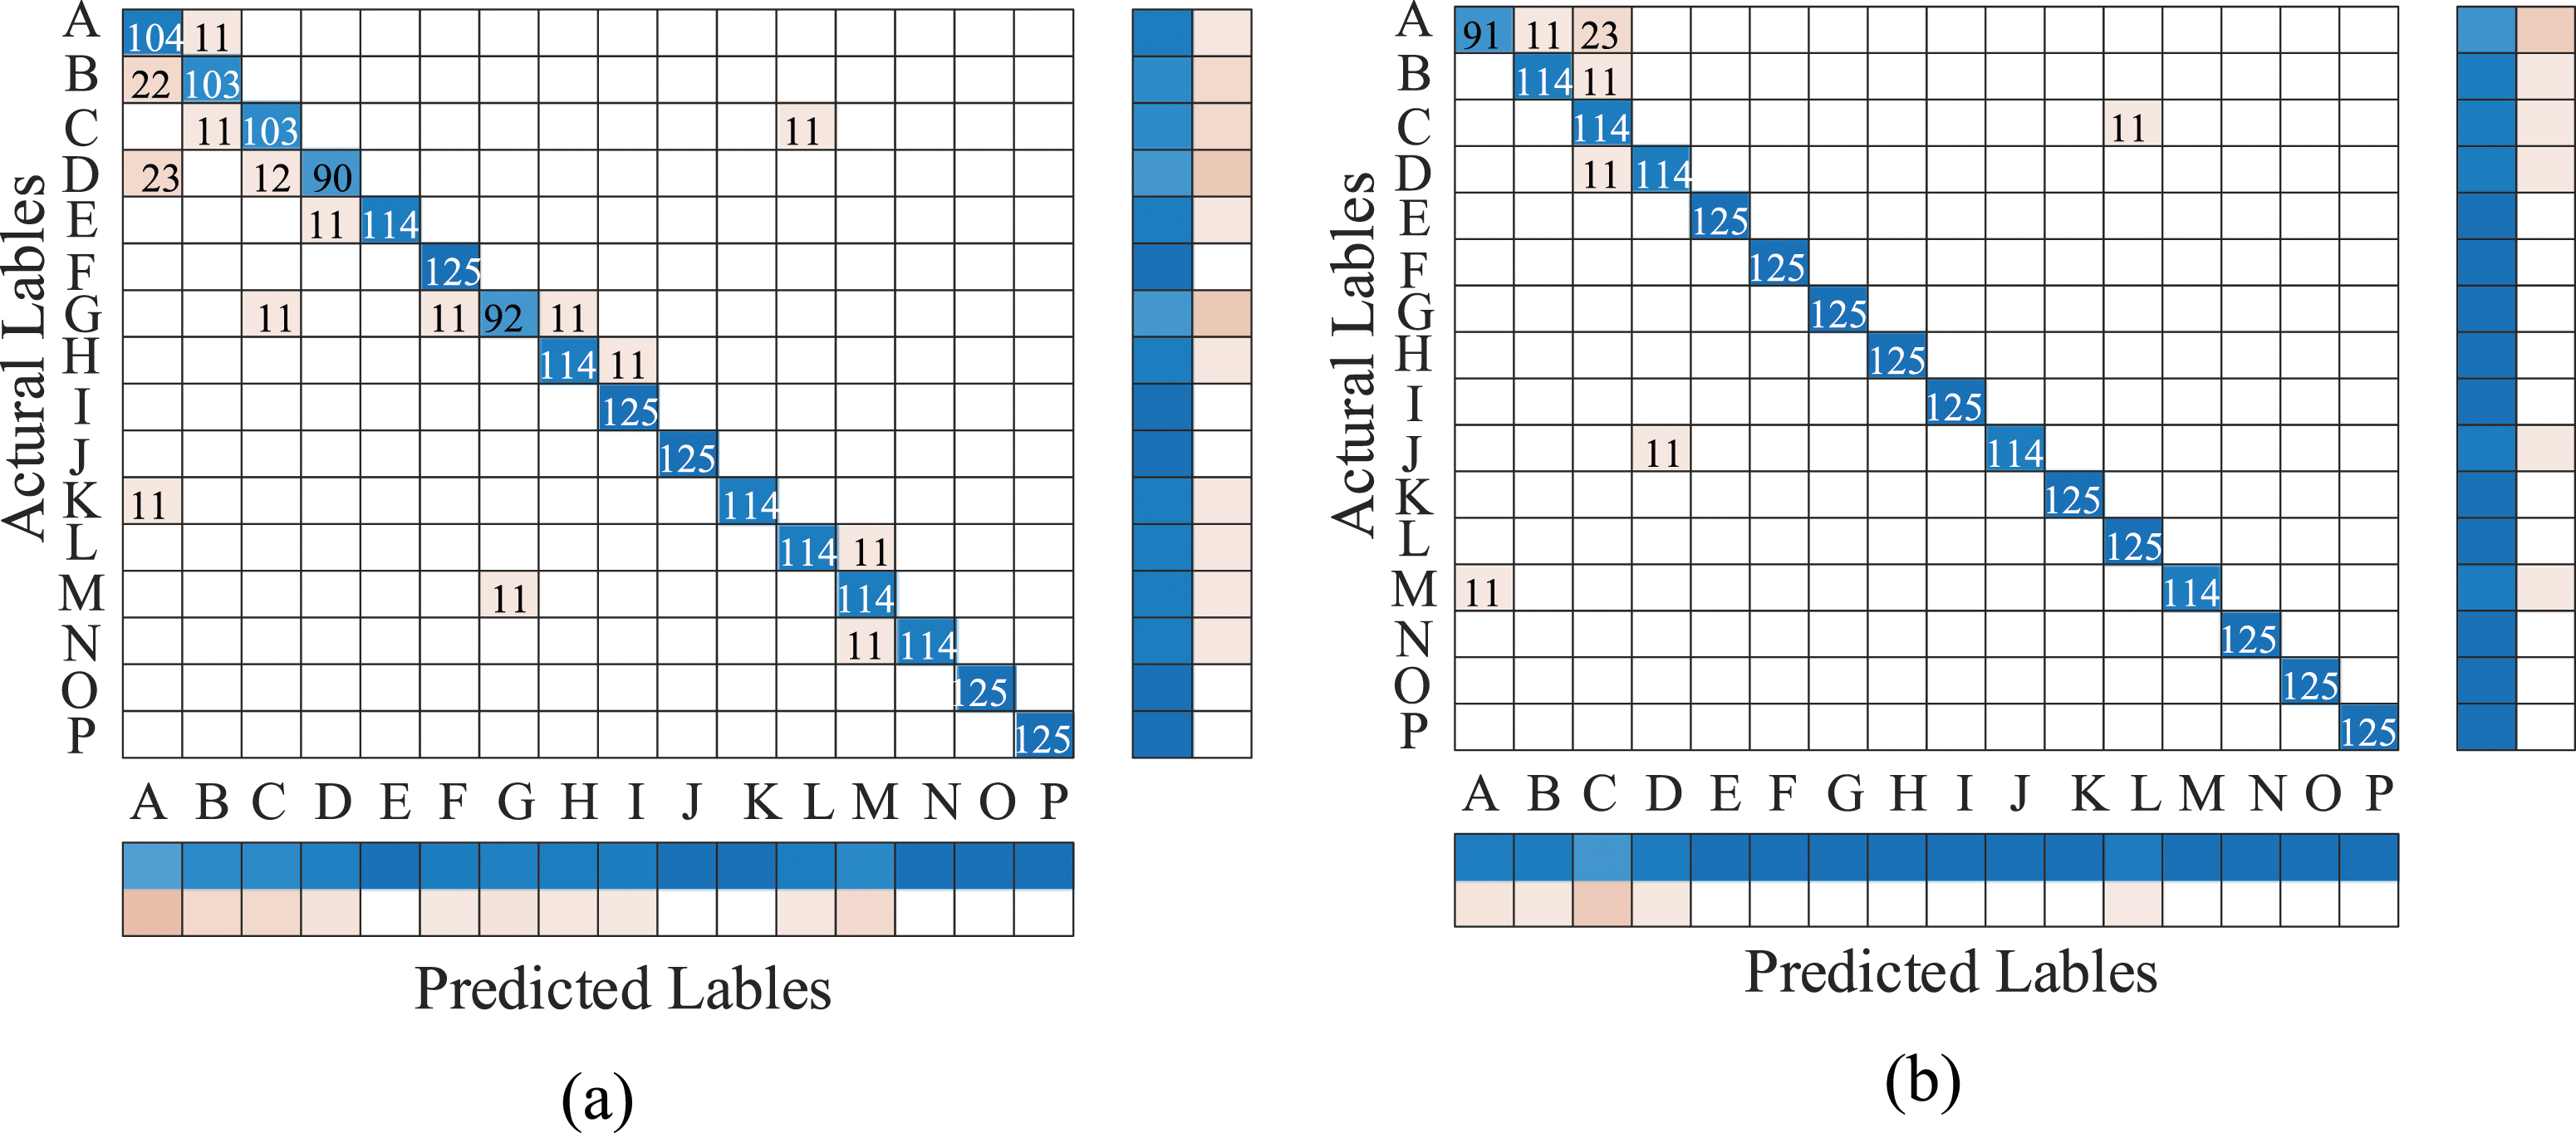
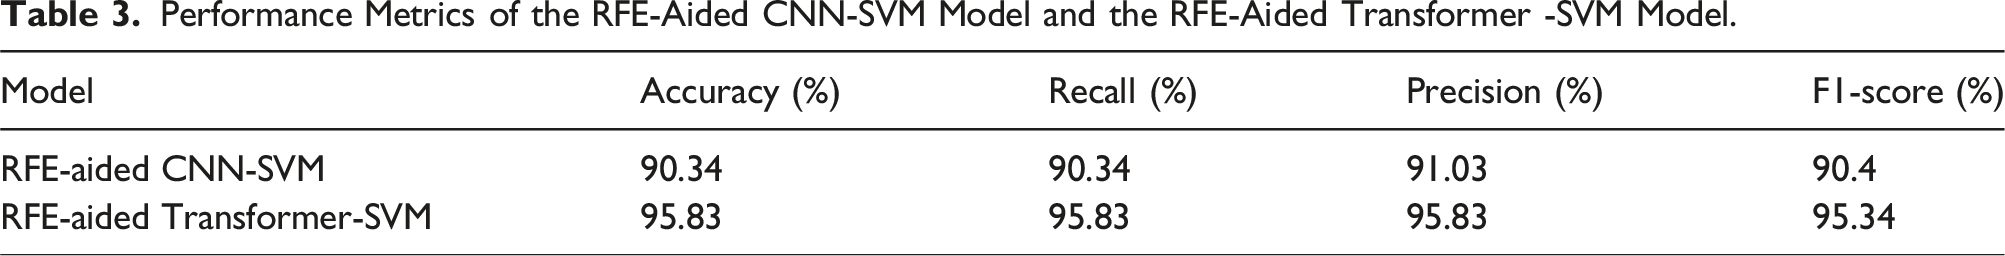
The Transformer architecture was notable for its intricate design and potent capability for feature extraction. Although it was adept at deriving effective features, the resulting feature set could be extensive, which might have presented computational challenges. To mitigate this, an RFE strategy to systematically eliminate less salient features was employed, ultimately distilling the set down to wavelet entropy vectors refined by the RFE process. This refinement aided in curtailing the complexity of the model. Figures 7 and 8 display the learning curves and confusion matrices for the RFE-aided CNN-SVM and RFE-aided Transformer-SVM models on the validation set, post- RFE integration. The learning curves underscored a marked acceleration in the convergence rate of both models after adopting the wavelet entropy vectors refined by RFE. Notably, the RFE-aided Transformer-SVM model demonstrated a more pronounced enhancement in classification accuracy, achieving 95.83%. It surpassed the traditional SVM, LSTM, CNN-SVM models without and with RFE, as well as the Transformer-SVM model without RFE by 15.72%, 11.74%, 9.47%, 5.49%, and 5.06%, respectively. To further ensuring the robustness of the results, all outcomes over 20 iterations were averaged similarly. The loss trajectory for the RFE-aided Transformer-SVM model stabilized more rapidly and exhibited improved smoothness, indicative of robust learning. The confusion matrices proficiently articulated the correlation between actual and predicted classifications, underscoring the augmented predictive accuracy afforded by the implementation of wavelet entropy vectors post-RFE. Table 3 presents the performance metrics of the RFE-aided Transformer-SVM model alongside those of the comparison model, contrasting the RFE-aided Transformer-SVM model with the RFE-aided CNN-SVM model. Learning curves of RFE-aided Transformer-SVM model and RFE-aided CNN-SVM model: (a) validation accuracy and (b) validation loss. Confusion matrices of different models after RFE process for testing data: (a) RFE-aided CNN-SVM and (b) RFE-aided Transformer-SVM. Performance Metrics of the RFE-Aided CNN-SVM Model and the RFE-Aided Transformer -SVM Model.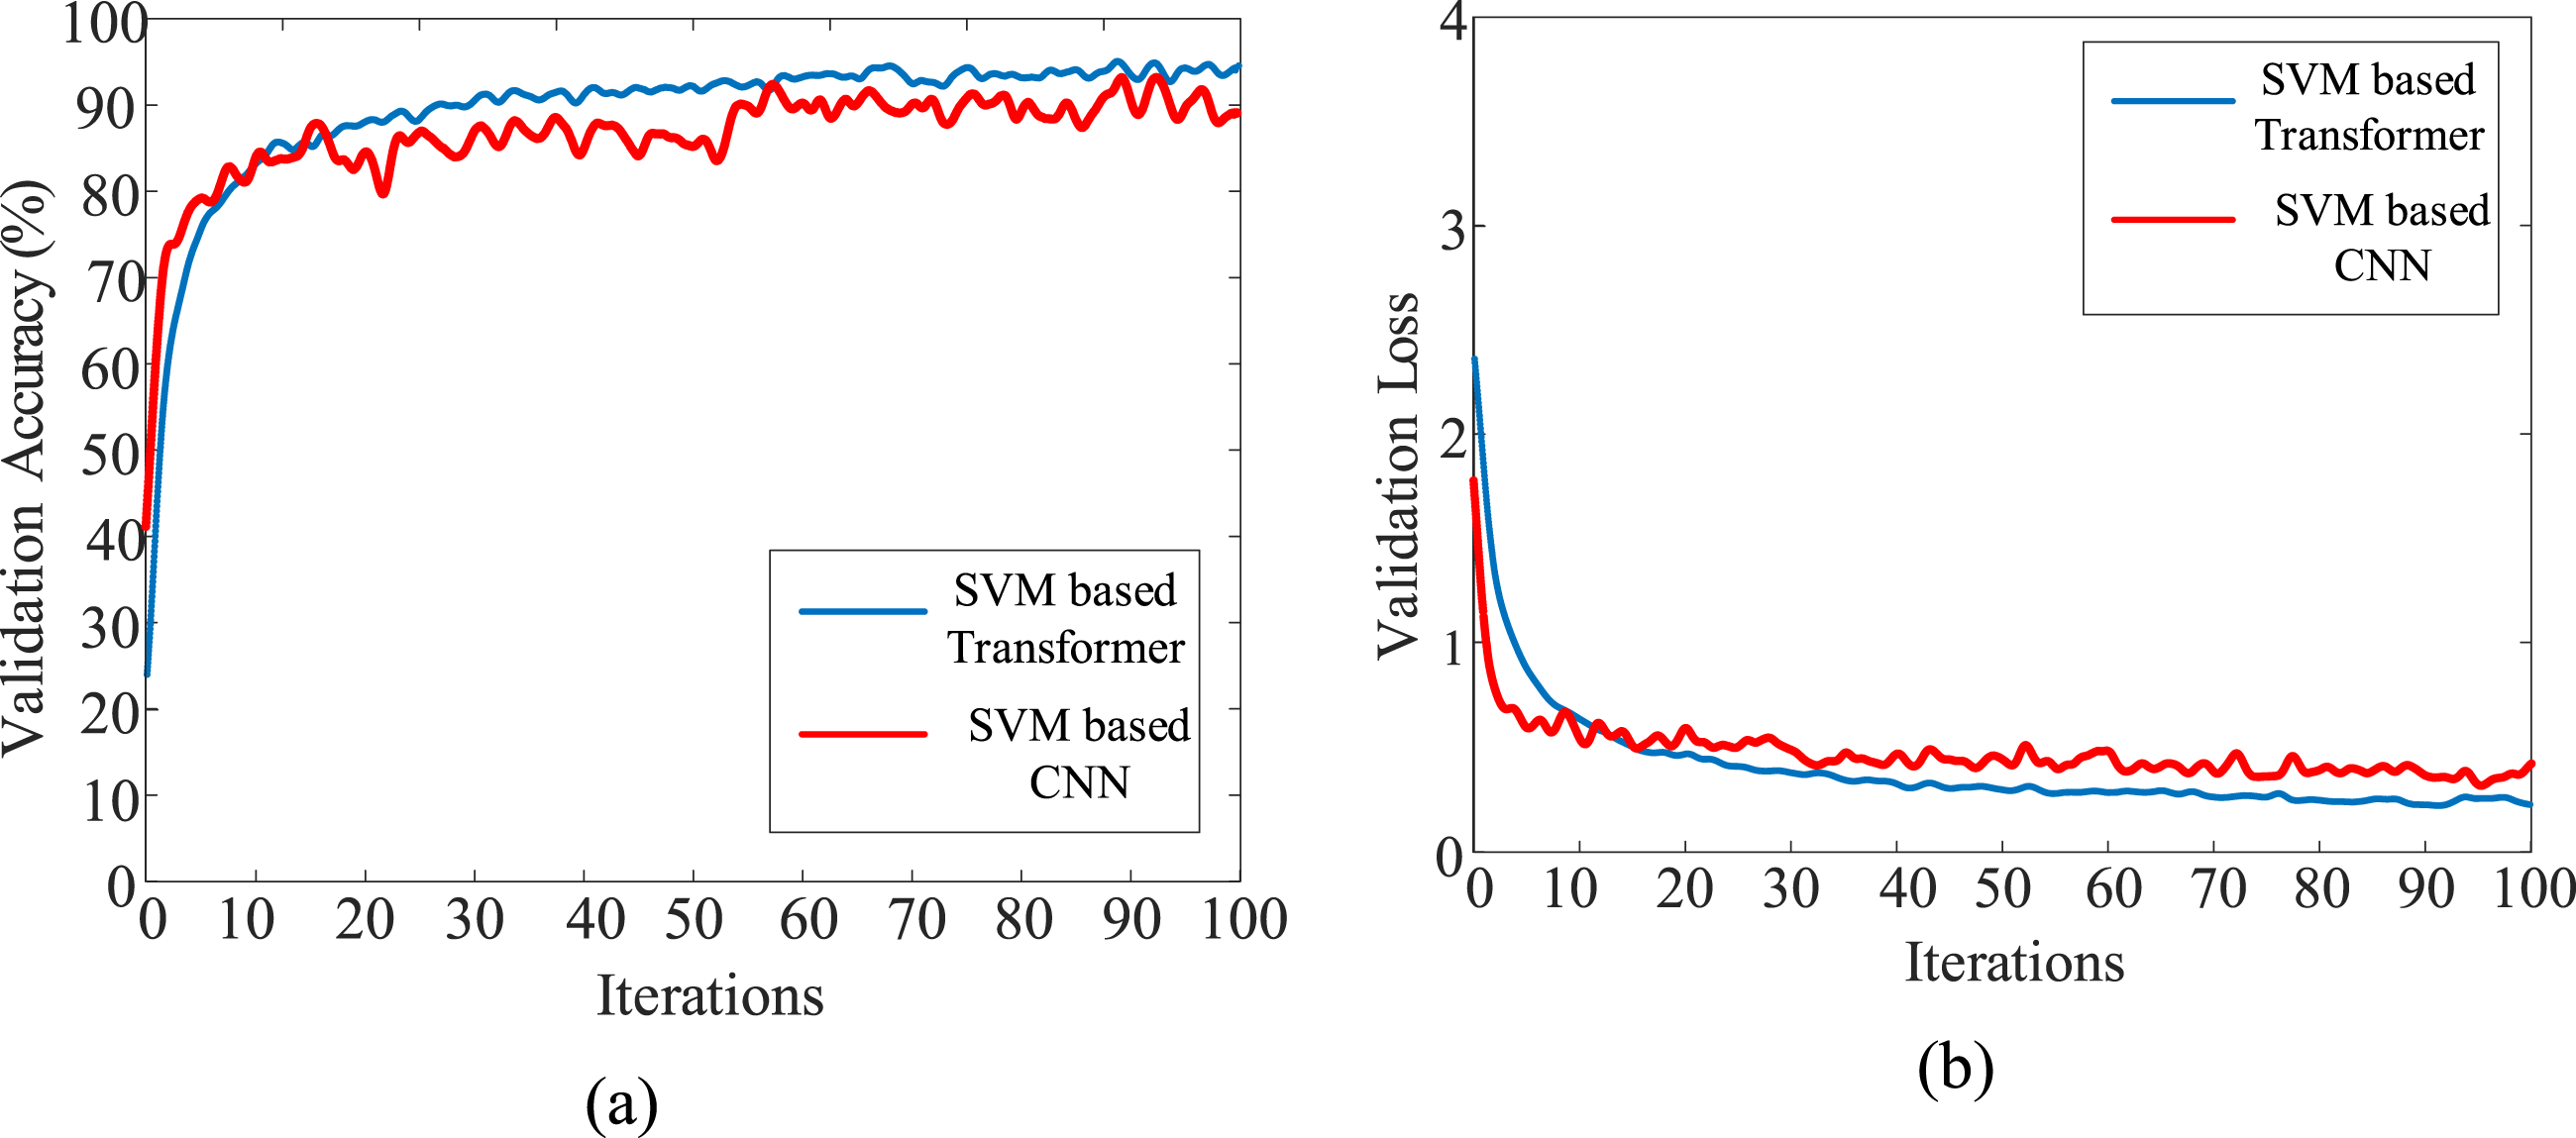
The box plot reviews the distribution of data, providing a visual summary of the maximum, minimum, median, and quartiles of the dataset. Figure 9 illustrate the box plots of the first five essential features selected by the RFE process for both RFE-aided Transformer-SVM and RFE-aided CNN-SVM models. The essential features showed significant changes in their median values, substantial variations in the width of the interquartile range, and differences in the number and distribution of outliers. The disparities were particularly pronounced for features transformed by the Transformer, suggesting that the features had undergone significant changes post-Transformer transformation and that RFE had managed to select essential features that were most beneficial for the classification objective. Box plots of the top five essential features selected by the RFE process for different models: (a) RFE-aided CNN-SVM and (b) RFE-aided Transformer-SVM.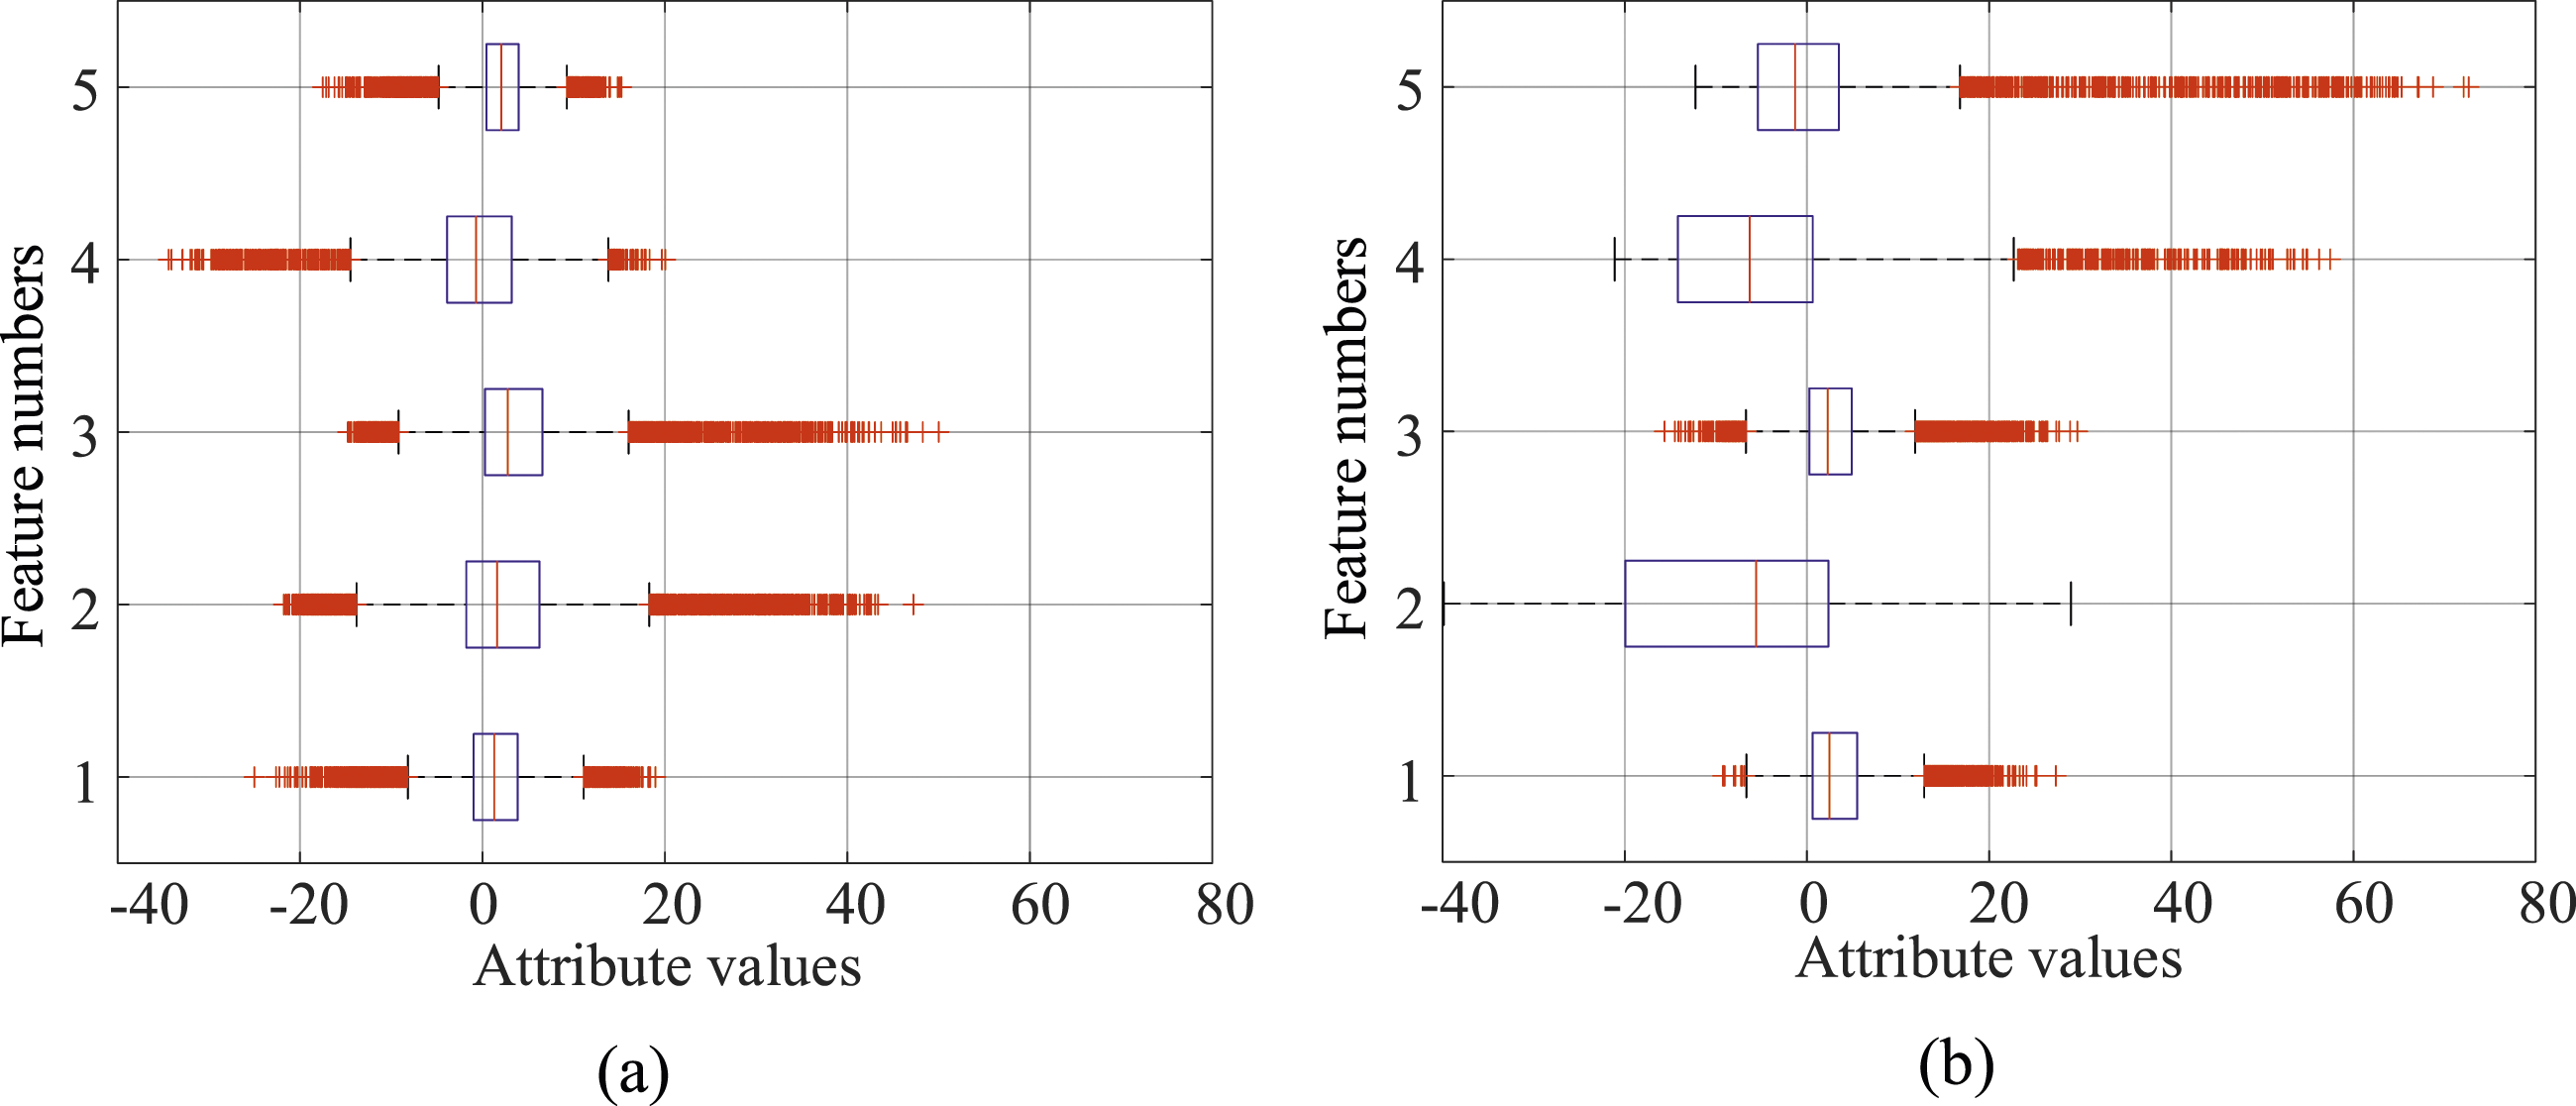
To demonstrate the powerful feature extraction and classification capabilities of the RFE-aided Transformer-SVM model for VAM wavelet entropy vectors, t-SNE algorithm was employed to visualize the critical computational processes on the testing set. As can be seen in Figure 10, the RFE-aided Transformer-SVM framework achieved complete separation of various bolt-loosening cases in the two-dimensional t-SNE space, with the boundaries among different cases being distinctly observable. After feature extraction by the Transformer, there was minimal overlap between the states, and the boundaries were pronounced. Following dimensionality reduction through the RFE process, the remaining essential features exhibited even more defined boundaries. Finally, the feature boundaries processed by the SVM classifier were exceedingly distinct. This visual representation cogently demonstrated the superior bolt-loosening detection and localization performance of the proposed framework. The t-SNE spectral graphs of the RFE-aided Transformer-SVM model on the testing data: (a) original features, (b) Transformer-extracted features, (c) RFE-selected features, (d) SVM-classified features.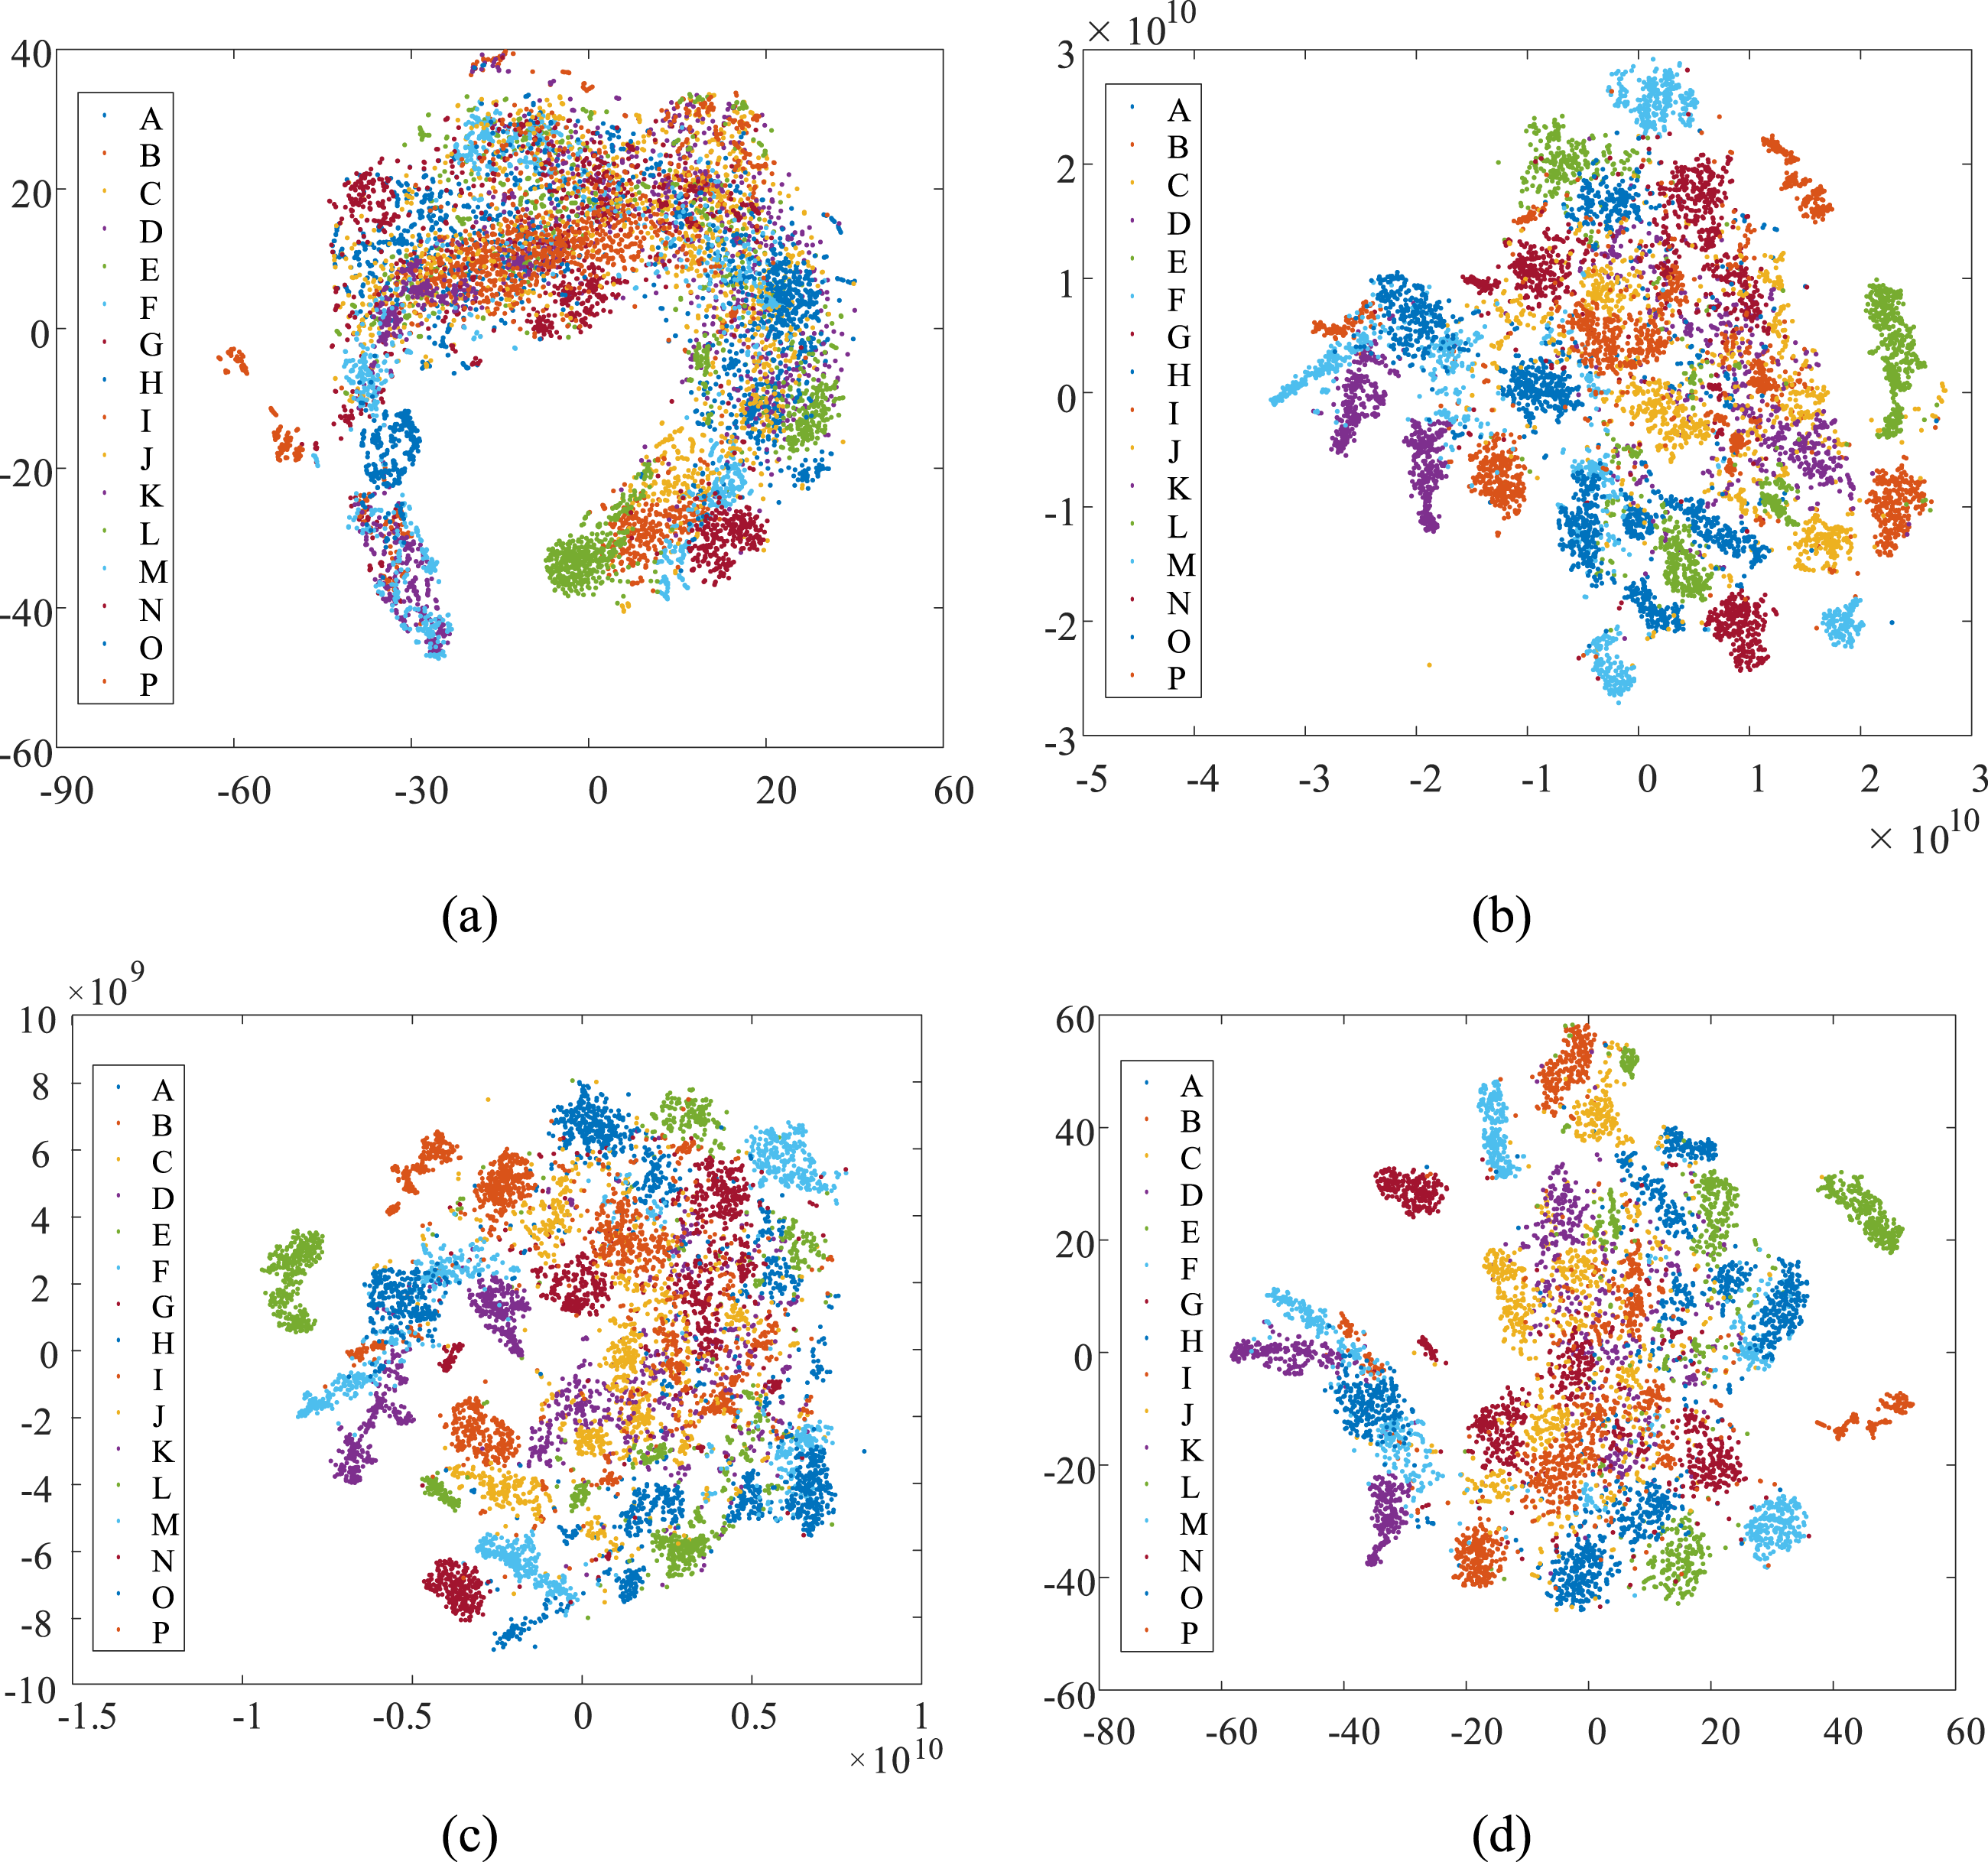
In addition, a fivefold cross-validation was conducted in this study. It partitioned the data into five equal subsets and used each in turn for validation while training on the remaining four. It was particularly effective for reducing variability and detecting issues of overfitting or underfitting, as the model was independently assessed on different data splits. The results of the cross-validation process reflected a standard deviation of 0.5% in classification accuracy of the proposed RFE-aided Transformer-SVM model. This remarkably low standard deviation revealed that the model performance was consistent across different subsets of the data, implying high stability. This consistency across various subsets of data underlined the strength of the model and supported its potential applicability in practical scenarios.
Conclusions
This study developed an RFE-aided Transformer-SVM framework for the loosening identification of multi-bolt connections using VAM signals, in order to ensure structural safety and integrity. For data preprocessing, the wavelet entropy helped to capture complex time-frequency characteristics indicative of bolt connection status. The framework involved a Transformer model for high-dimensional feature extraction, the RFE process for feature selection, and an SVM for damage case classification. Experiment results demonstrated the accuracy of the proposed framework and its outperformance over other counterpart deep learning models in distinguishing different loosening statuses of multiple bolts. The main conclusions and contributions are highlighted as follows. (1) Wavelet entropy worked as a time-frequency characteristic index of VAM signals, which contained more distinct and quantifiable information of the loosening status compared with traditional energy indicators. The entropy values rose as the number of loosened bolts increased, revealing the escalating uncertainty and complexity of VAM signals. (2) Benefit from the positional encoding capability, the established Transformer-SVM model extracted damage-sensitive features from wavelet entropy vectors of VAM signals. Outperformed traditional SVM, LSTM, and CNN-SVM models, it achieved a classification accuracy of 90.77% in identifying the 16 loosening cases of a four-bolt connection joint. (3) The integration of RFE process further refined the feature sets extracted by the Transformer, which provided essential information for subsequent SVM classification. The RFE-aided Transformer-SVM model yielded an accuracy of 95.83% and a low standard deviation of 0.5% with cross-validation, indicating high efficiency and stability. It made a significant advancement in the health monitoring of engineering structures with high-strength bolt connections.
Additional validations are necessary to be adapted for various bolted joint configurations in future work, ensuring its effectiveness under different design specifications and stress conditions. Operational conditions like temperature changes, vibrational noise, and dynamic loads can affect the performance of VAM signal analysis. Future work will test the framework under different environmental and operational conditions to improve its robustness.
Footnotes
Declaration of conflicting interests
The author(s) declared no potential conflicts of interest with respect to the research, authorship, and/or publication of this article.
Funding
The author(s) disclosed receipt of the following financial support for the research, authorship, and/or publication of this article: Financial supports from the National Natural Science Foundation of China (No. 52378290), the Shenzhen Science and Technology Program (No. KQTD20180412181337494), and the Fundamental Research Funds for the Central Universities in China (No. RF1028623228).