
Abstract
This study was conducted to investigate the vibration serviceability and impact coefficient of a seven-span continuous cable-stayed bridge planned for an expressway extension using a three-dimensional vehicle–bridge coupled vibration analysis. For the bridge design, deflection under the designed live load of the continuous cable-stayed bridge did not meet the deflection limit specified in “Japanese Design Specifications for Highway Bridges.” The excessive deflection indicates the possibility of poor vibration serviceability. To clarify the bridge vibration serviceability, the dynamic responses of the bridge and passing vehicles were examined using the three-dimensional vehicle–bridge coupled vibration analysis. The three-dimensional analysis was validated by comparing the vibration response of a single-span steel cable-stayed bridge in service subjected to vehicle running tests with those numerical responses from the three-dimensional analysis. The ride comfort of vehicles on the bridge was assessed in terms of vibration serviceability according to the ISO 2613-1 international standard for evaluating whole-body vibration exposure. The observation from the simulation-based investigation demonstrated that the vehicle response does not exceed the ride comfort limit irrespective of vehicle, road, and running conditions. In other words, the findings confirmed a negligible effect of large deflections on driving safety. The impact factors were found to be less than 1.05 for the main girder, less than 1.03 for the main tower base, and less than 1.04 for the cable. The impact factor was greatest when several vehicles were running at resonant headway.
Keywords
Introduction
A new bridge construction project is planned for the Hanshin Expressway, an urban highway network connecting major cities of the Kansai area in Japan. The new bridge is a continuous span cable-stayed bridge intended to link anthropogenic islands, respectively called Rokko Island and Port Island, in Kobe port as a part of the urban highway network extension project designated as the West Extension Projects. The extension project purposes are to reduce traffic congestion and to improve logistical efficiency, especially for the Osaka Bayshore Line, which connects the Kobe–Awaji–Naruto Expressway to Kansai International Airport. The project is also being undertaken to secure alternative functions in the event of a strong earthquake in the Osaka and Kobe Bay areas. Figure 1 portrays the new bridge location. The target bridge is a seven-span continuous cable-stayed bridge with 2730 m length. Target bridge location.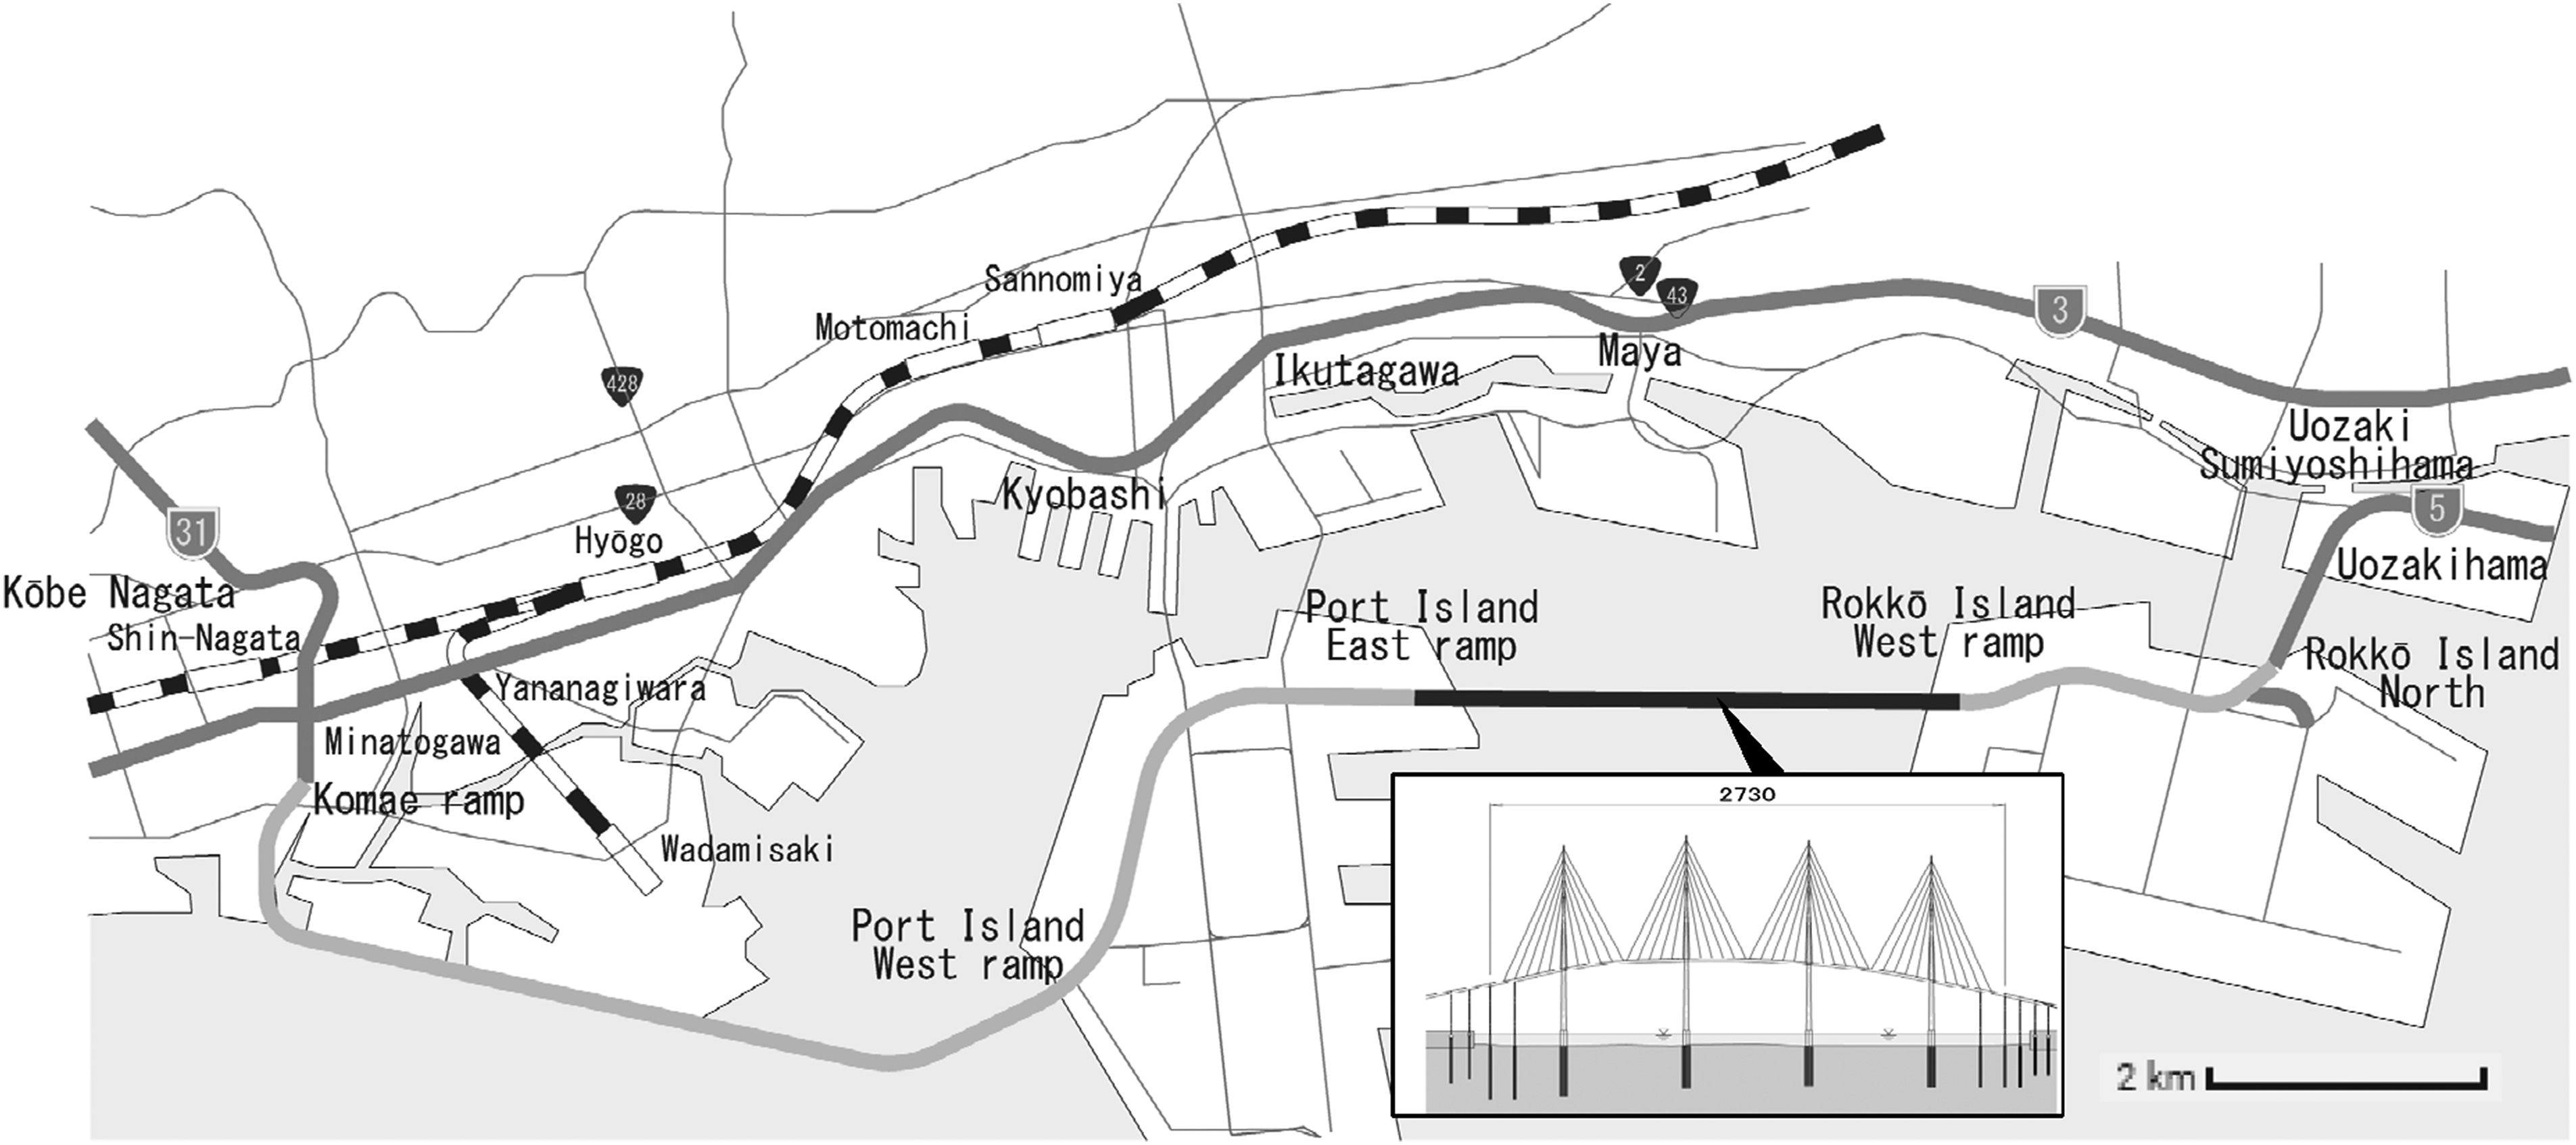
For bridge design, it is generally necessary to confirm serviceability in addition to durability and load-bearing capacity (Japan Road Association I, 2017). For long-span bridges such as cable-stayed bridges, deflection under the design live load can become quite large. Large deflection will cause excessive vibrations that cause discomfort to users. Moreover, repeated excessive deflections cause a high probability of fatigue damage in the steel girders and slabs. For this reason, Japanese Design Specifications for Highway Bridges specify the deflection limits of bridges with span length up to 200 m as “L/400”, where L represents the span length in meters (Japan Road Association II, 2017). The deflection limit ensures the necessary stiffness of the bridge so that repeated vibrations such as those caused by passing vehicles will not affect the bridge. However, investigating the influences of large deflection on driving safety is necessary for long-span bridges with span lengths that greatly exceed 200 m. The maximum deflection of the target bridge under the design live load is expected to be about 4 m.
Cable-stayed bridges exhibit behaviour that is more flexible than that of girder bridges. Moreover, cable-stayed bridges are expected to have more complex vibration characteristics because of their complex structure consisting of beams, cables, and pylons. Although many studies of the vibration characteristics of cable-stayed bridges have been conducted (Ehara and Mori 1993; Fukada et al., 1998; Fukuoka et al., 1984; Kawatani and Honda, 1990; Komatsu and Kawatani, 1978; Okauchi et al., 1992; Yamaguchi et al., 1996), few studies have examined the ride comfort of a continuous span cable-stayed bridge with such a longer span.
This study is therefore aimed at investigating the ride comfort and impact factor of a seven-span continuous cable-stayed bridge with a maximum span length of 650 m. To clarify the bridge vibration serviceability, the dynamic responses of the bridge and passing vehicles are examined using three-dimensional (3D) vehicle–bridge interaction (VBI) analysis. The validity of the three-dimensional analysis was verified by comparing the vibration response of an existing single-span steel cable-stayed bridge in service subjected to vehicle running tests with numerical responses obtained from three-dimensional analysis. The ride comfort of vehicles on the bridge is assessed in terms of vibration serviceability according to the ISO 2613-1 (1997) international standard for evaluating whole-body vibration exposure. In addition, the impact coefficient is estimated using analytical dynamic responses under traffic simulated from the 3D VBI analysis.
Verification of vehicle–bridge interaction analysis for cable-stayed bridges
Moving vehicle experiment on an in-service single-span cable-stayed bridge
Target bridge
To evaluate the ride comfort of the cable-stayed bridge properly using VBI analysis (Kawatani et al., 1998, 2005, 2008), the validity of the VBI analysis must be verified. Therefore, a field experiment was conducted on a similar type of planned bridge to assess the validity of the vehicle–bridge interaction method for the cable-stayed bridge. The general layout and a cross-sectional view of the experiment bridge are shown in Figure 2. The bridge, a steel cable-stayed bridge (Ehara and Mori 1993), crosses the Aji River at the Hanshin Expressway No. 5 Bayside Route. The total bridge length is 640 m, with span lengths of 120 m + 350 m + 170 m. The main tower consists of two A-shaped steel towers in the transverse direction of the bridge. The foundation is a cast-in-place pile. The bridge has three inbound lanes and three outbound lanes: a total of six lanes. General layout of the examined cable-stayed bridge (unit: m).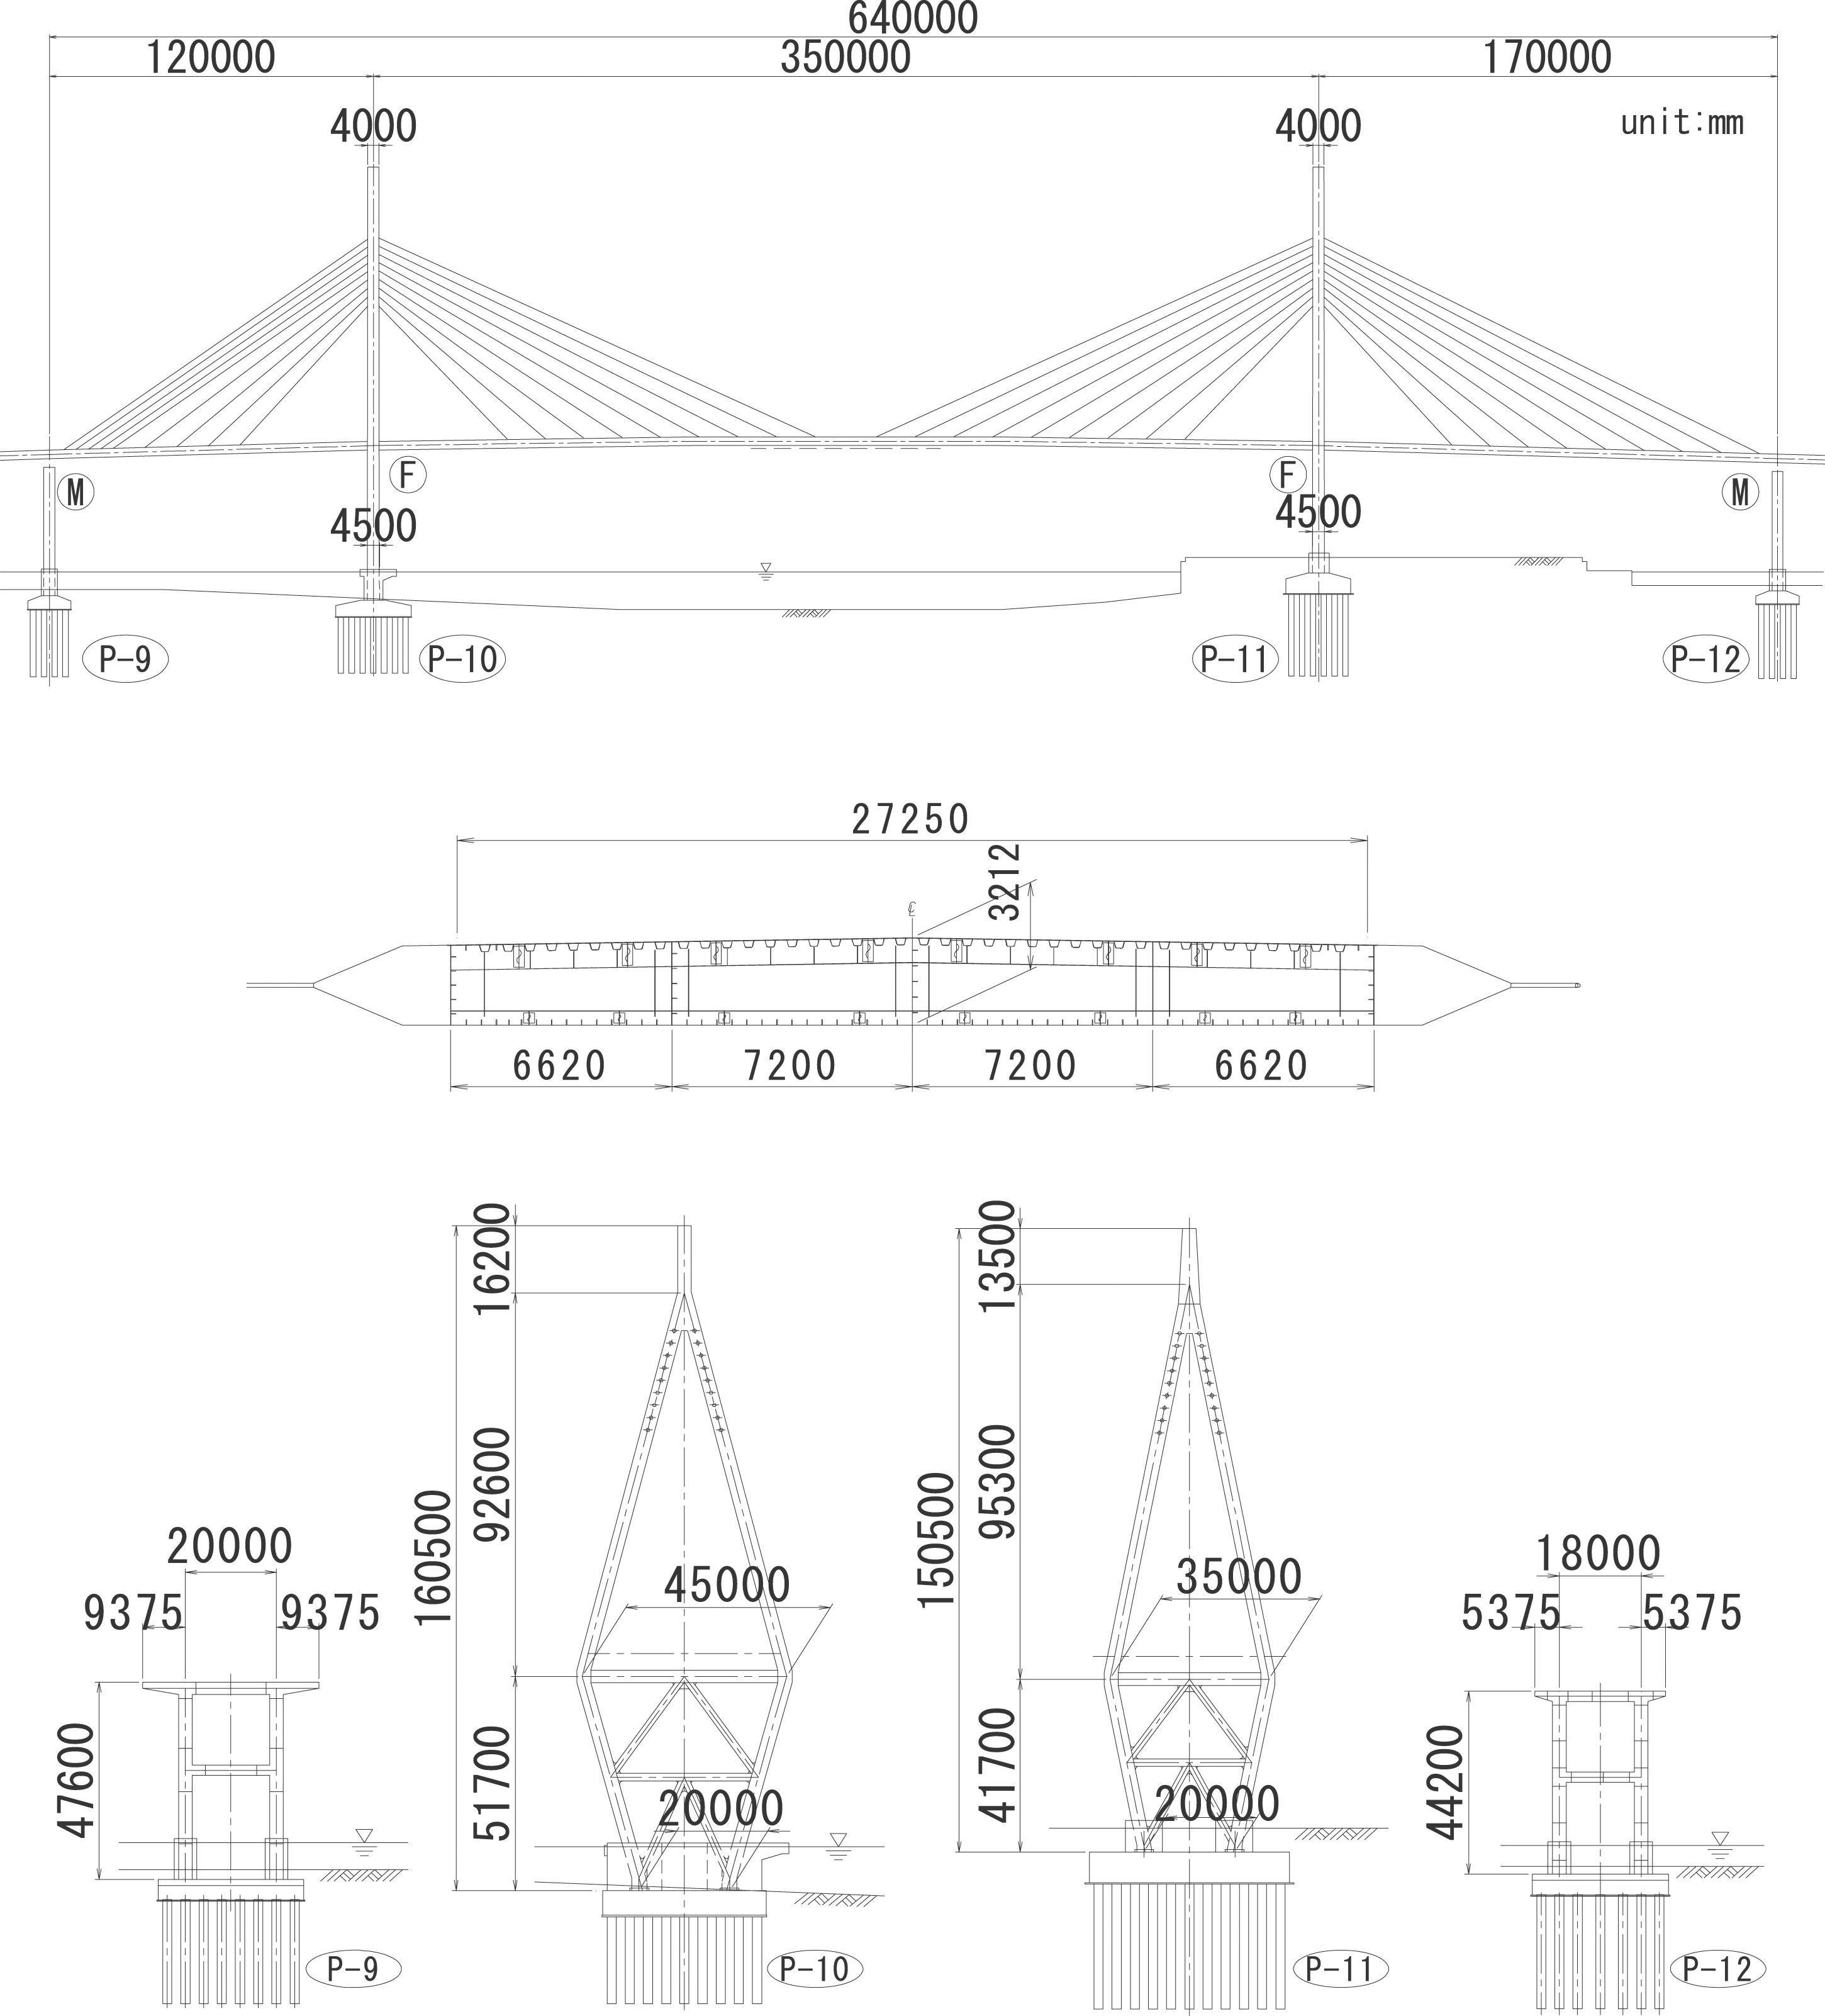
Summary of the experiment
Moving vehicle experiments were conducted in winter (February) and summer (September) in 2019. The experiment time was at night after a sunny day with little wind influence. During the moving vehicle experiment, thermometers were installed on the deck plate and lower flange to measure the temperature. The temperature change in winter was 3.2°C, from 11.4°C to 8.2°C. In summer, it was 2.0°C, from 31.7°C to 29.7°C. Small temperature changes of this magnitude are negligible for the vibration response of the bridge during the moving vehicle experiment. It is noteworthy that the measured frequencies and mode shapes have no differences between winter and summer.
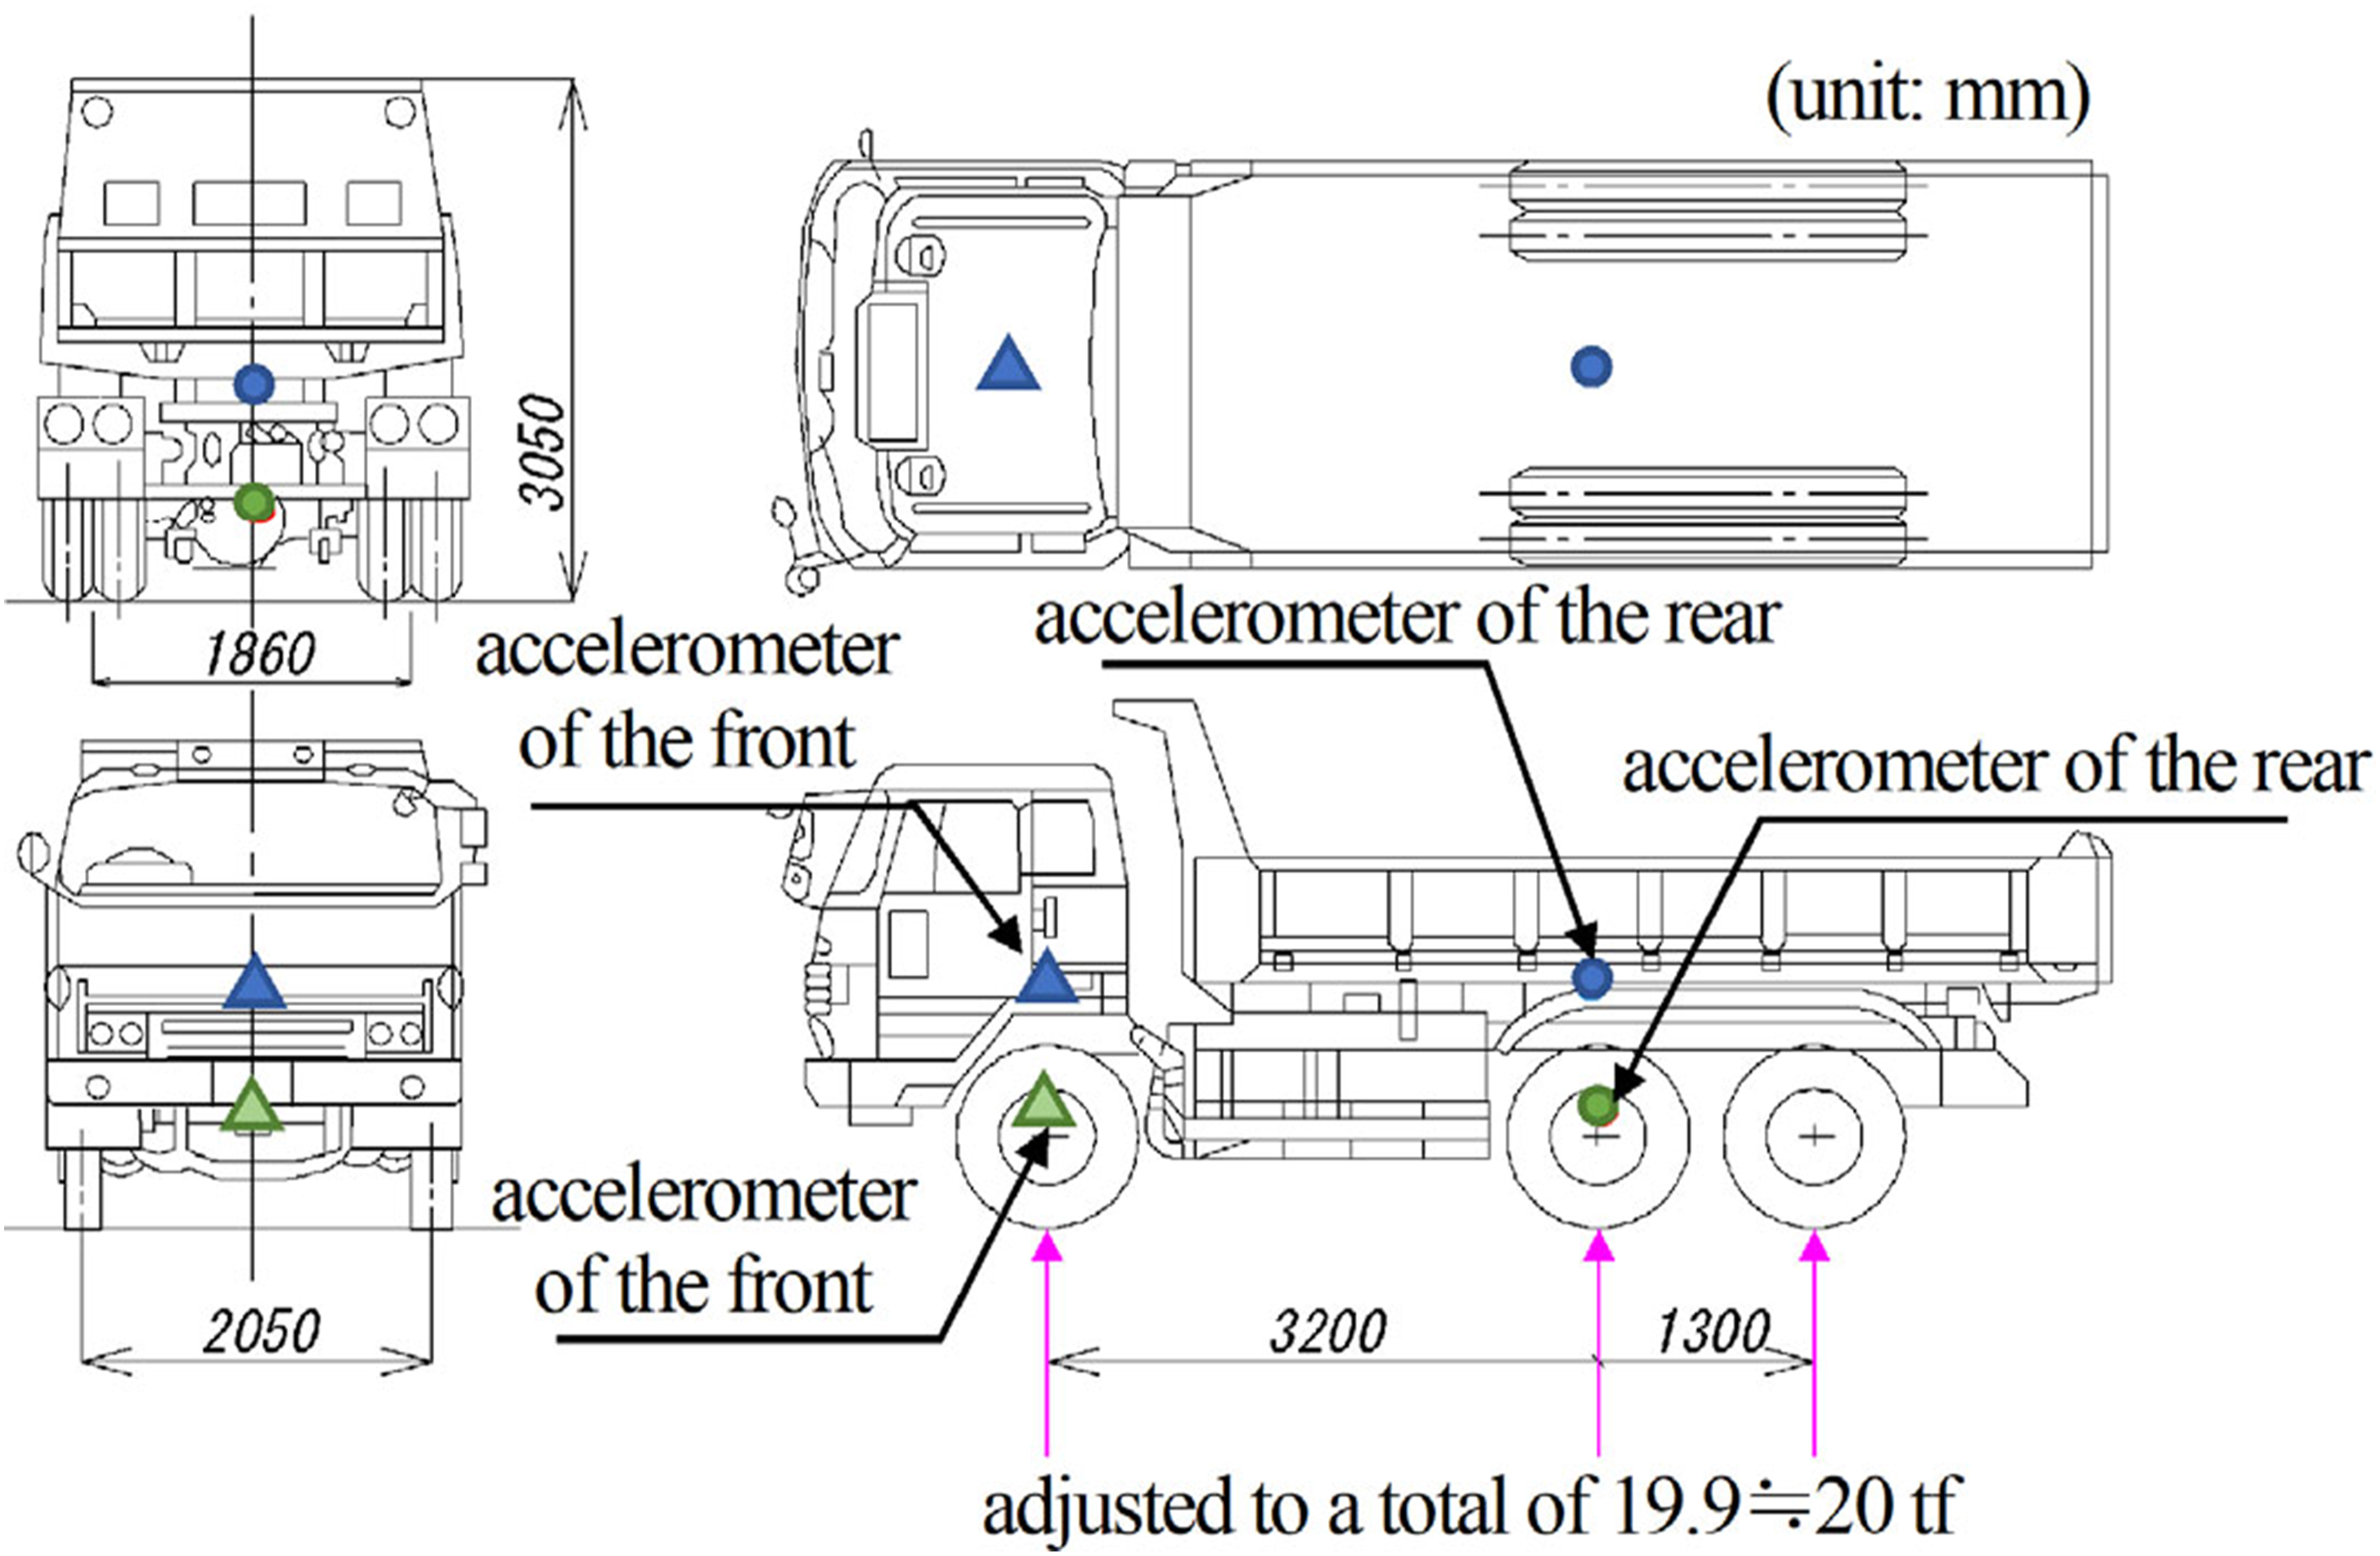
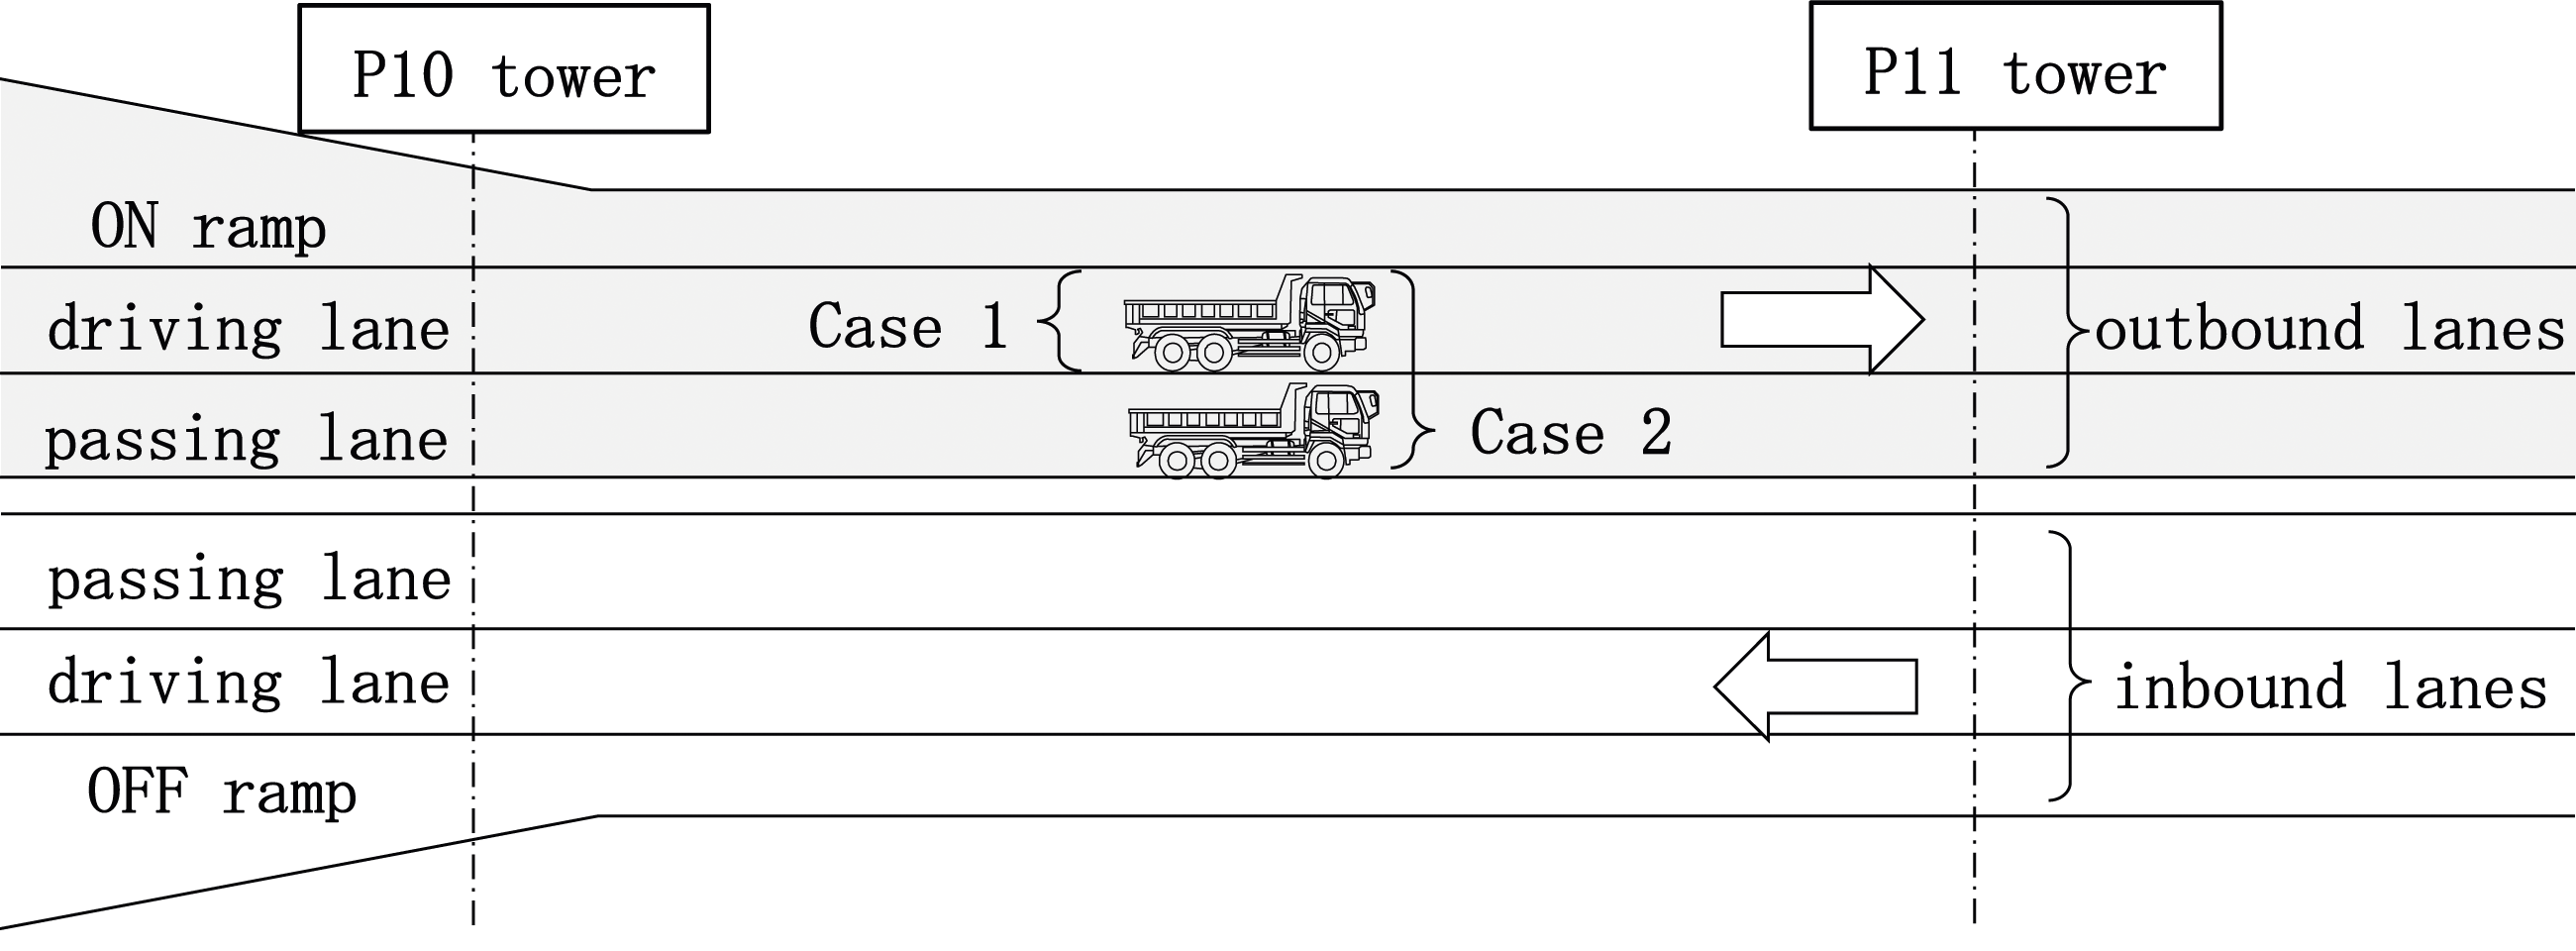
Accelerations of the bridge girder, main tower, and experiment vehicles were measured. Furthermore, the main girder deflection was also measured using a laser displacement transducer. Figure 3 depicts the measurement points and the corresponding node numbers in the VBI analysis. Accelerometers were installed at three points on the top and middle stages of the main tower, and at L/4, L/2, and 3 L/4 of the main girder in the centre span and side span. A laser displacement transducer was installed on the ground under the centre of the span between P11 and P12 to measure. Figure 4 presents an overview of the test vehicle and the instrumentation of the accelerometers. The total weight of the test vehicle was 195.2 kN, of which 54.7 kN was on the front axle and 141.6 kN was on the rear axle. Accelerometers were installed near the centre of the vehicle above and below the front and rear suspensions. Using the free vibration of the test vehicle, the frequency of the front axle bounce motion was identified as 1.5 Hz and the frequency of the axle hop motion as 10 Hz. The rear wheel bounce frequency was 3.5 Hz. The rear axle hop motion was about 10 Hz. The vehicle speed was set as 80 km/h. Figure 5 presents the vehicle running conditions. Measurement points and the corresponding analysis node numbers. Test vehicle overview and locations of accelerometer installation. Vehicle running conditions.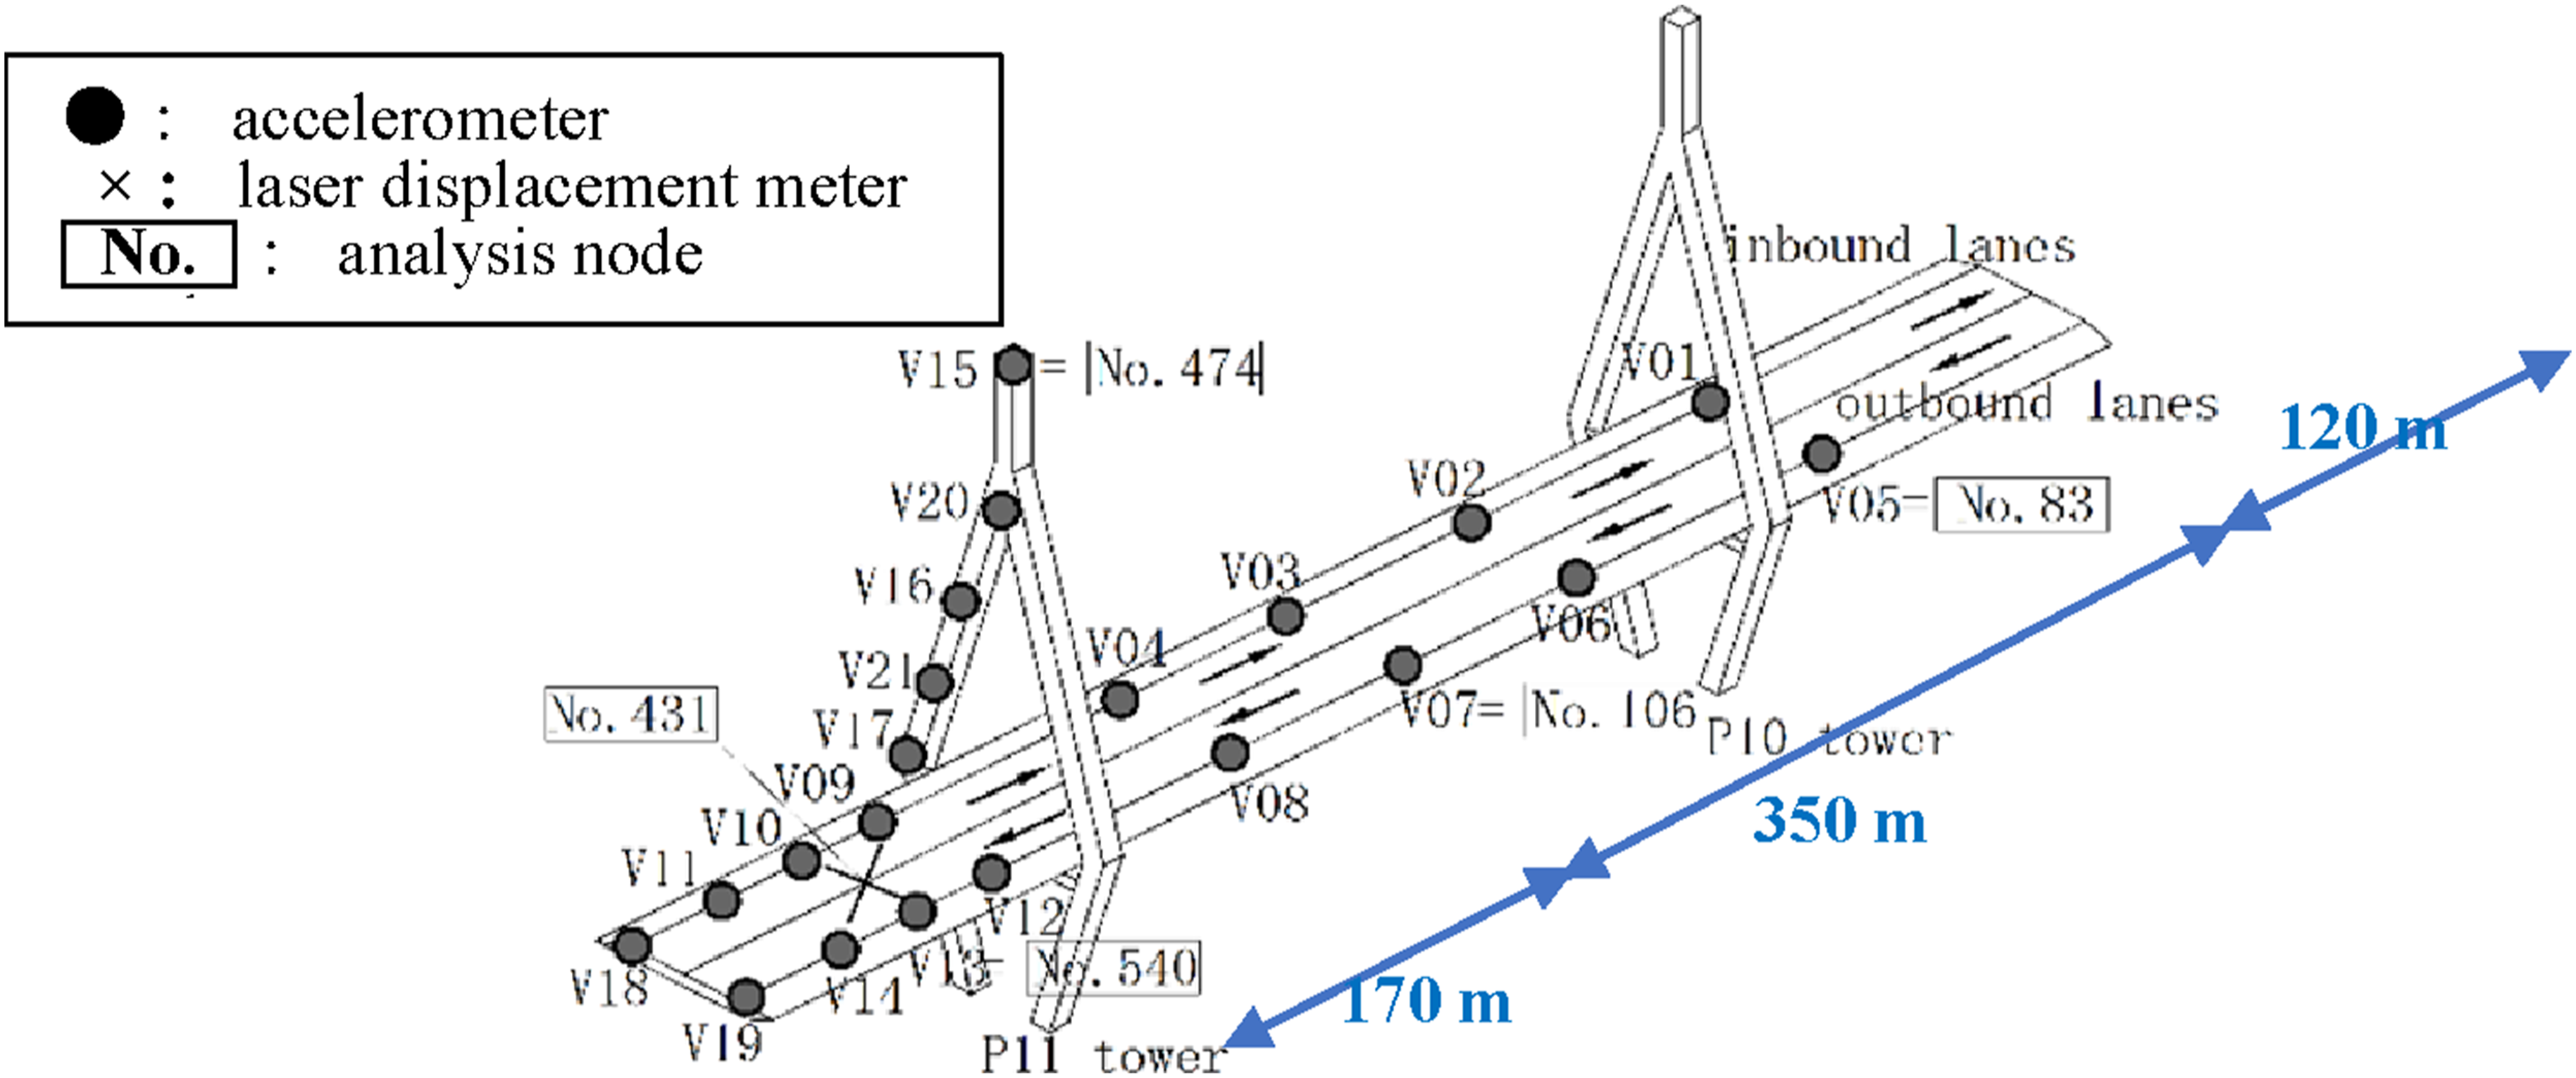
Traffic-induced vibration analysis
Bridge model and analytical method
Dynamic responses of the bridge are simulated using the 3D VBI analysis (Kim et al., 2005), which is based on finite element method for modal analysis using three-dimensional models for both the vehicle and bridge. The bridge model is portrayed in Figure 6. The bridge is modelled using beam elements for girders, a truss element for cables, and a spring element with two nodes with the same coordinate for the elastomeric bearing. Because the bridge response under the moving vehicle exhibits elastic behaviour, seismic isolation structures installed on the bridge, such as dampers, were not modelled. FE model of the bridge.
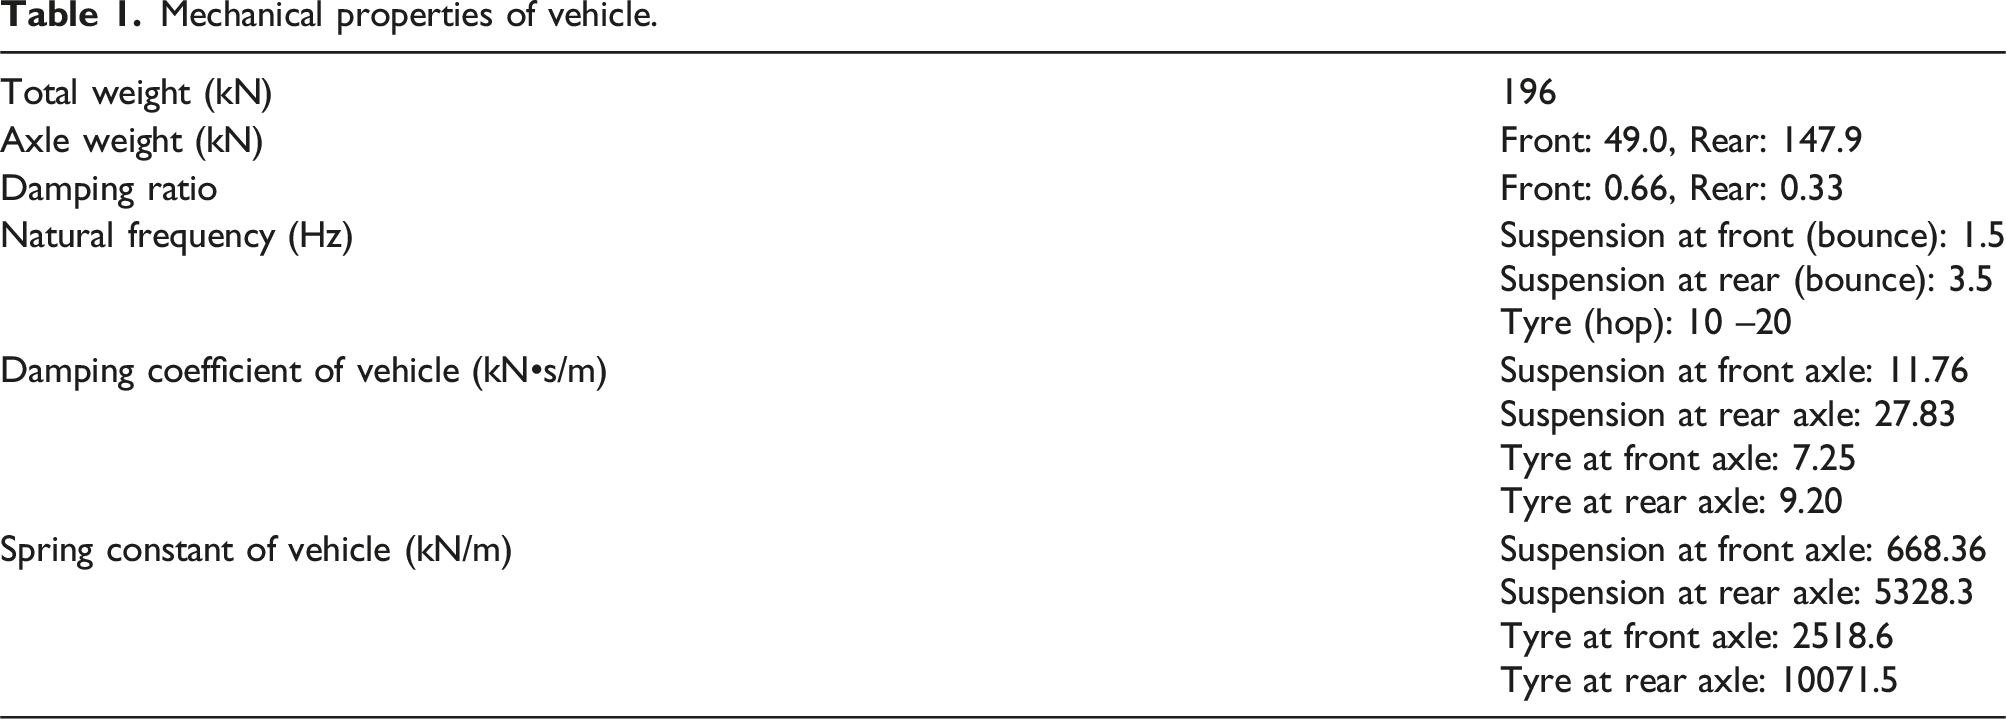
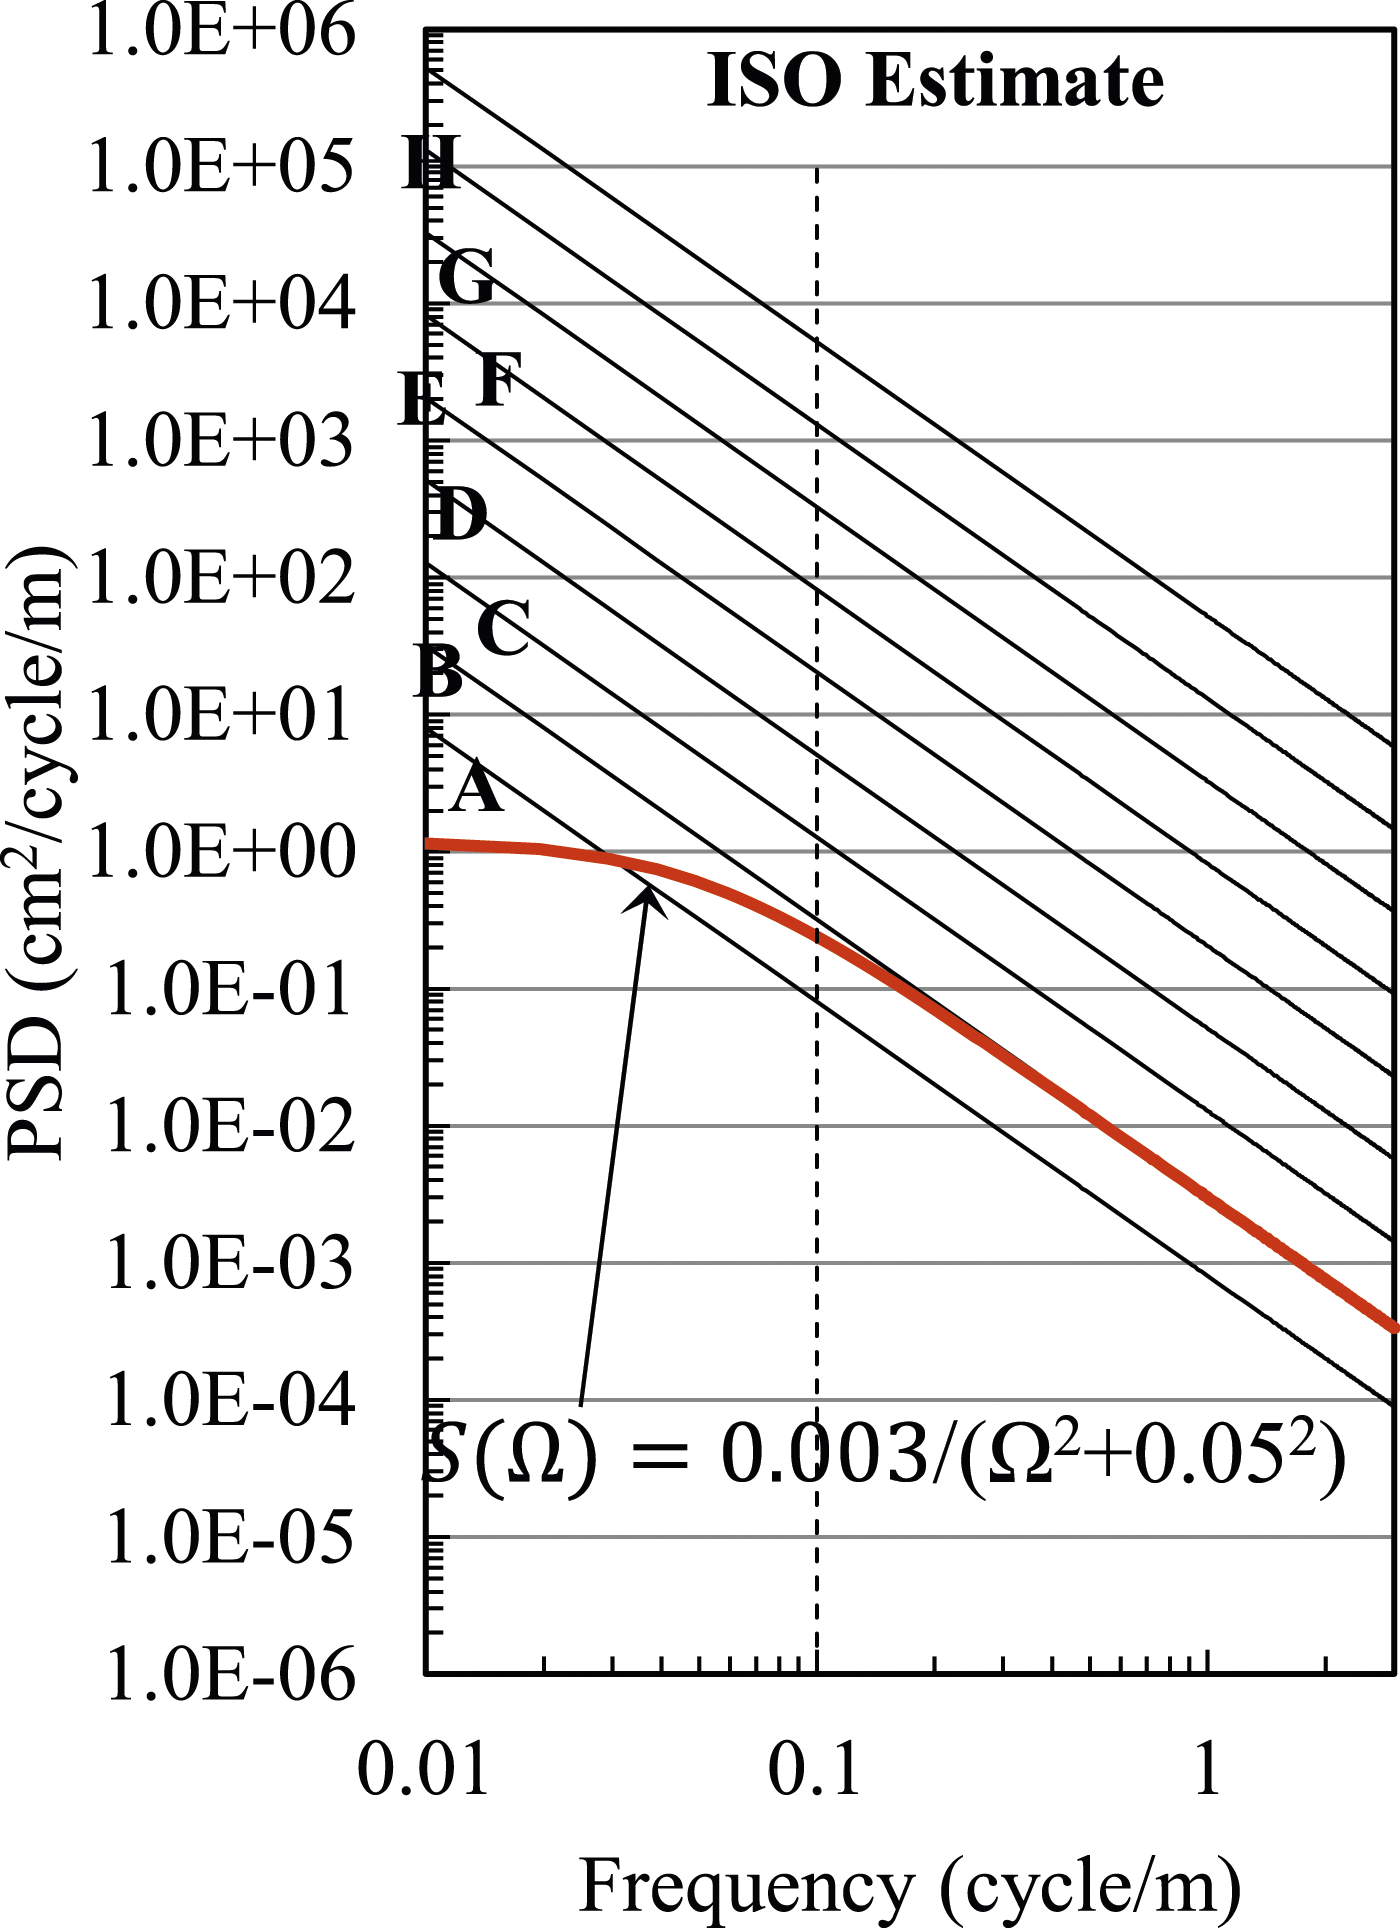
The vehicle model comprises the body, tires, and suspension systems. Details of the vehicle model are presented in Figure 7 and Table 1 along with the eight degrees of freedom representing its movement (Kawatani et al., 2005, 2008). The mechanical properties of the vehicle were obtained from free vibration measurements of the 196 kN dump truck used in the test. The viscous damping and spring constant were set to fit the natural frequencies. Rayleigh damping was adopted for the 3D VBI analysis of the bridge. Equations of motion for vehicles and the bridge interactive system were solved using the Newmark β method assuming β = 1/4. The analysis starts when the vehicle reaches 10 m ahead of the bridge. The time interval in the numerical integration was 0.005 s. In the traffic-induced vibration analysis of the bridge, the roadway roughness on the bridge surface is simulated based on the PSD curves shown in Figure 8 (ISO 8608, 1995). Because the road surface condition was not clear and because the road was not newly paved, the parameters α = 0.003 (cm2/(m/c)), β = 0.05 (c/m), and n = 2.00 were used (Kawatani et al., 2005; Kim et al., 2007). It is noteworthy that α is a parameter representing the road surface flatness. 8DOF Vehicle. Mechanical properties of vehicle. PSD of road surface roughness.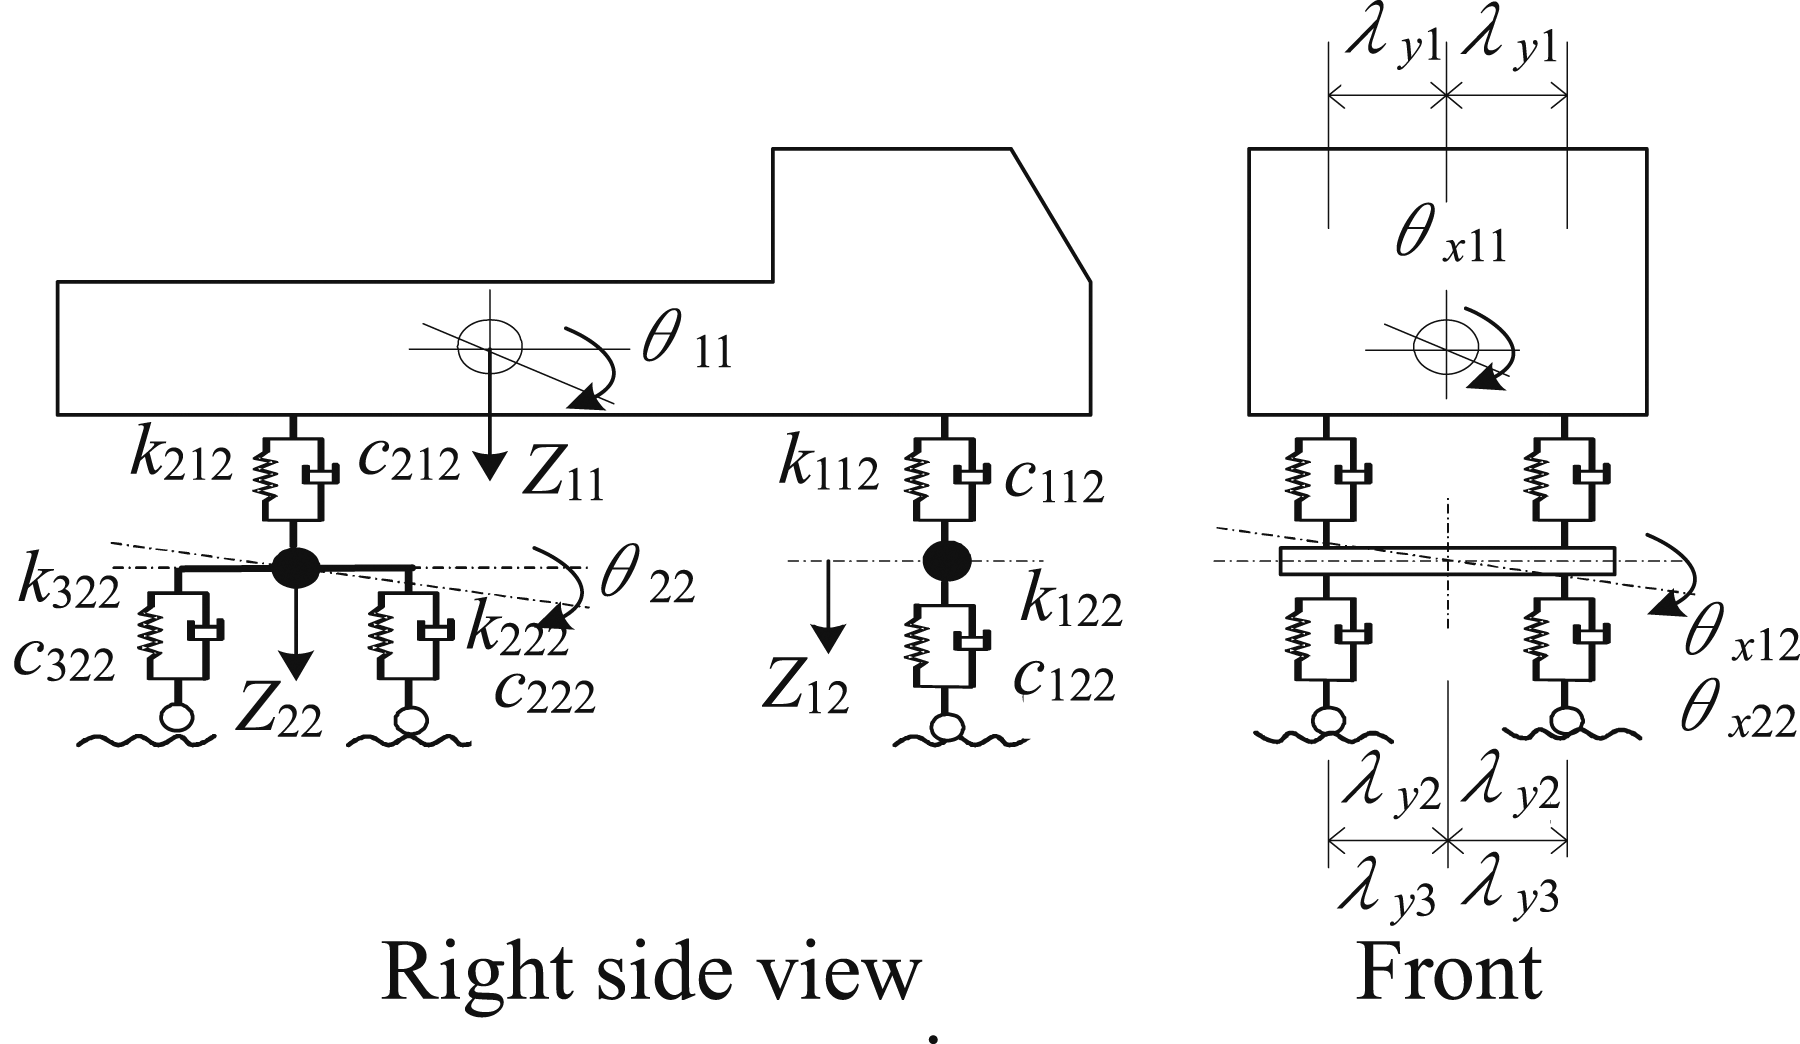
Vibration responses from experiment and 3D VBI analysis
The validity of the 3D VBI analysis was verified by comparing the vibration responses from the experiment on the single-span steel cable-stayed bridge with those from the VBI analysis. The mode shapes and frequencies obtained from the experiments were also compared with those obtained from the eigenvalue analysis. Selected mode shapes and frequencies of the bridge both from the eigenvalue analysis and experiments are shown in Figure 9. Two bending modes at 0.34 Hz and 1.09 Hz from the eigenvalue analysis are closely comparable with those mode shapes and frequencies identified from measured accelerations. The first to third bending modes of the main girder, which are the most significant modes in the bridge, have the significant impact on ride comfort. Therefore, we compared the bending mode shapes and frequencies from experimental observations with those from simulations. The results demonstrated a good similarity between the experiments and the simulations. Selected mode shapes and frequencies of the bridge.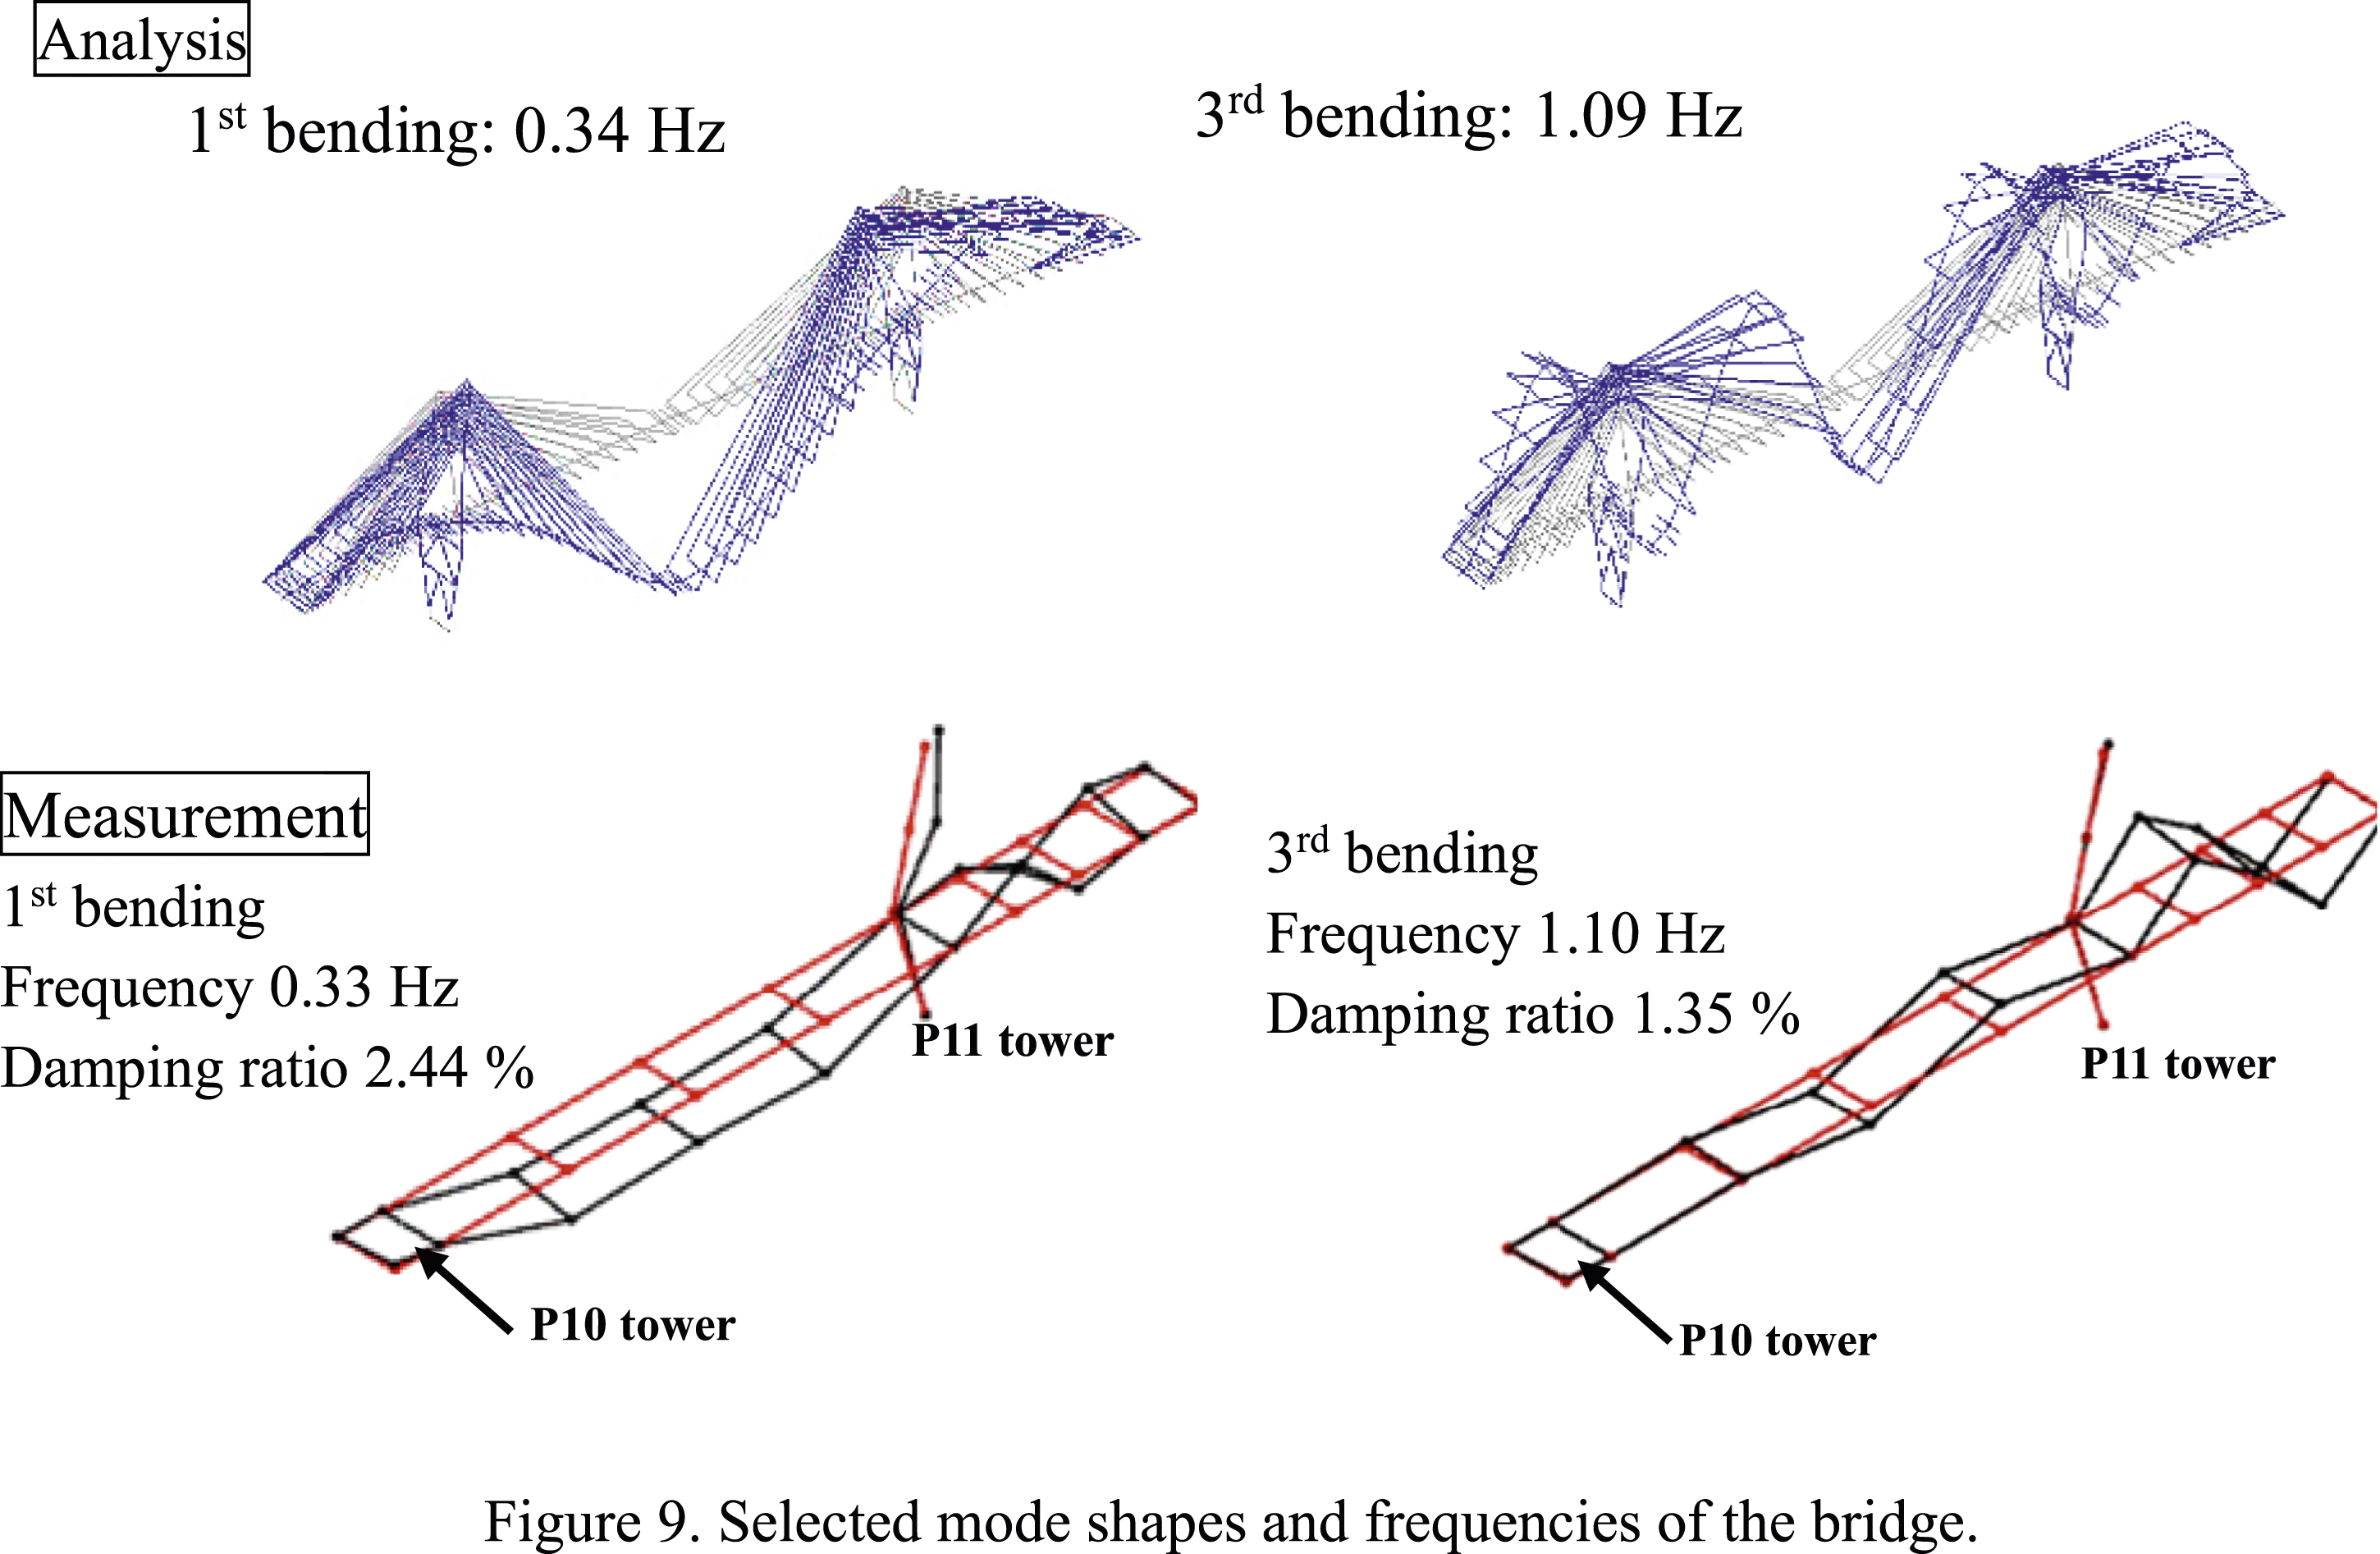
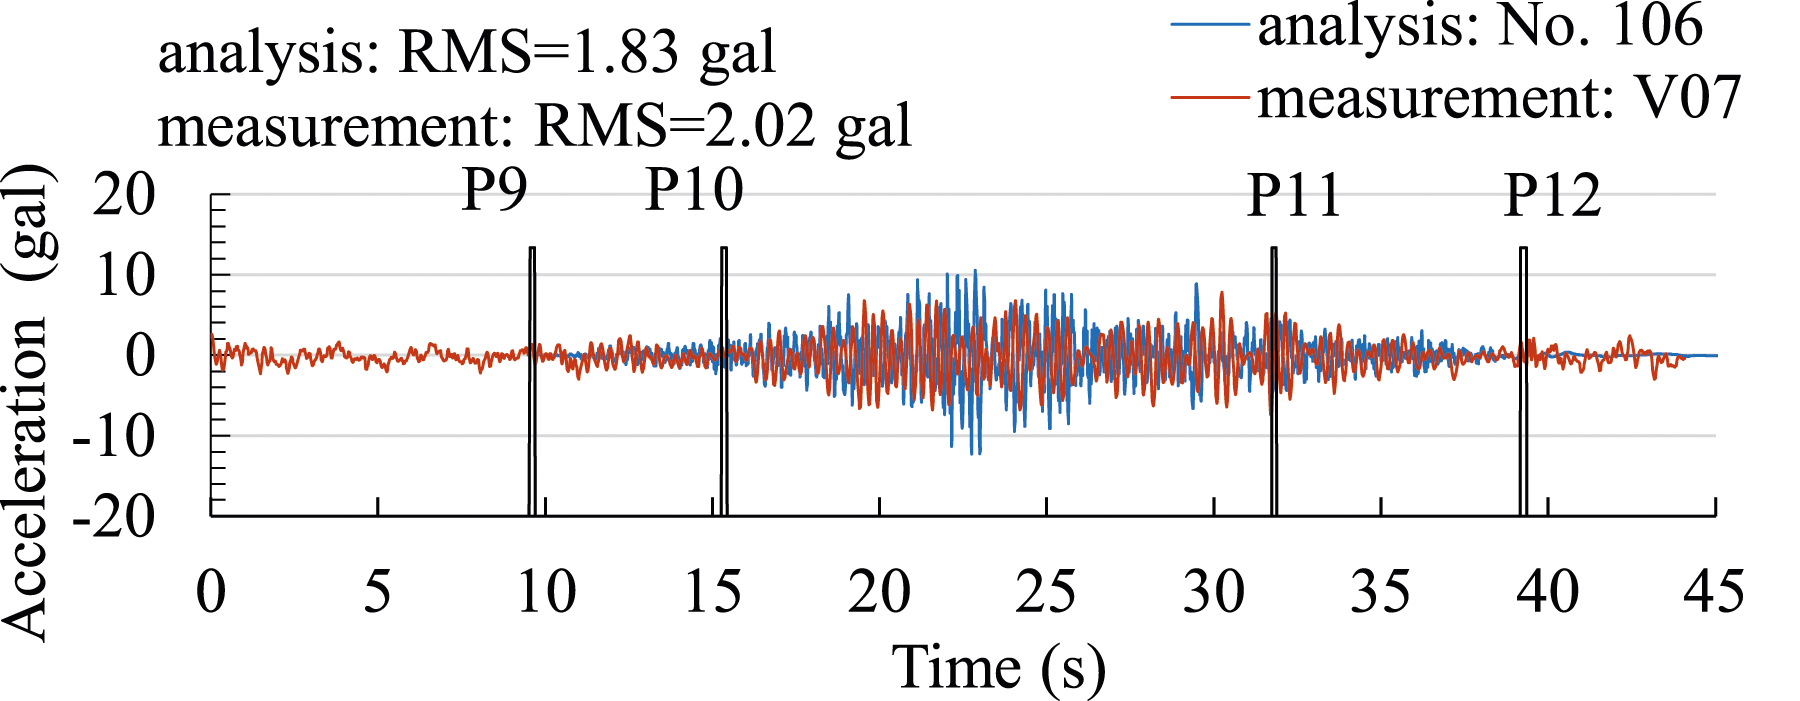
Figure 10 portrays the vertical deflection at the centre of the span between P11 and P12. The maximum deflection from the experiment was 5.35 mm. That from the VBI analysis was 5.27 mm. Although high-frequency components are observed in the experiment, this is because a laser displacement transducer was used, installed on the ground beneath the main girder. Notably, the maximum vertical deflections from the analytical data and the measurements are comparable. Figure 11 shows the acceleration response at the centre of the main span. The analytical accelerations were compared with the measured accelerations at V07 (Figure 3), which corresponds to the same position as that in the analysis. The analytical value of acceleration response depends on the amplitude of road surface roughness. The RMS values of the acceleration from measurement and analysis were, respectively, about 2 gal and 1.8 gal, which demonstrates that the VBI analysis can simulate traffic-induced vibration of the cable-stayed bridge. Displacement responses at the span centre of the main girder between P11 and P12 for Case 1. Acceleration responses at the span centre of the main girder between P10 and P11 towers for Case 1.
Fourier spectra of those acceleration responses in Figure 11 are shown in Figure 12. The dominant frequency of approximately 0.3 Hz is related to the bending mode of the bridge. Those frequencies of approximately 3.5–4.0 Hz are related to the bounce motion at the rear axle of the vehicle, whereas the dominant frequency around 10–30 Hz derives from the vehicle’s unsprung vibrations. Fourier amplitude spectra for Figure 11.
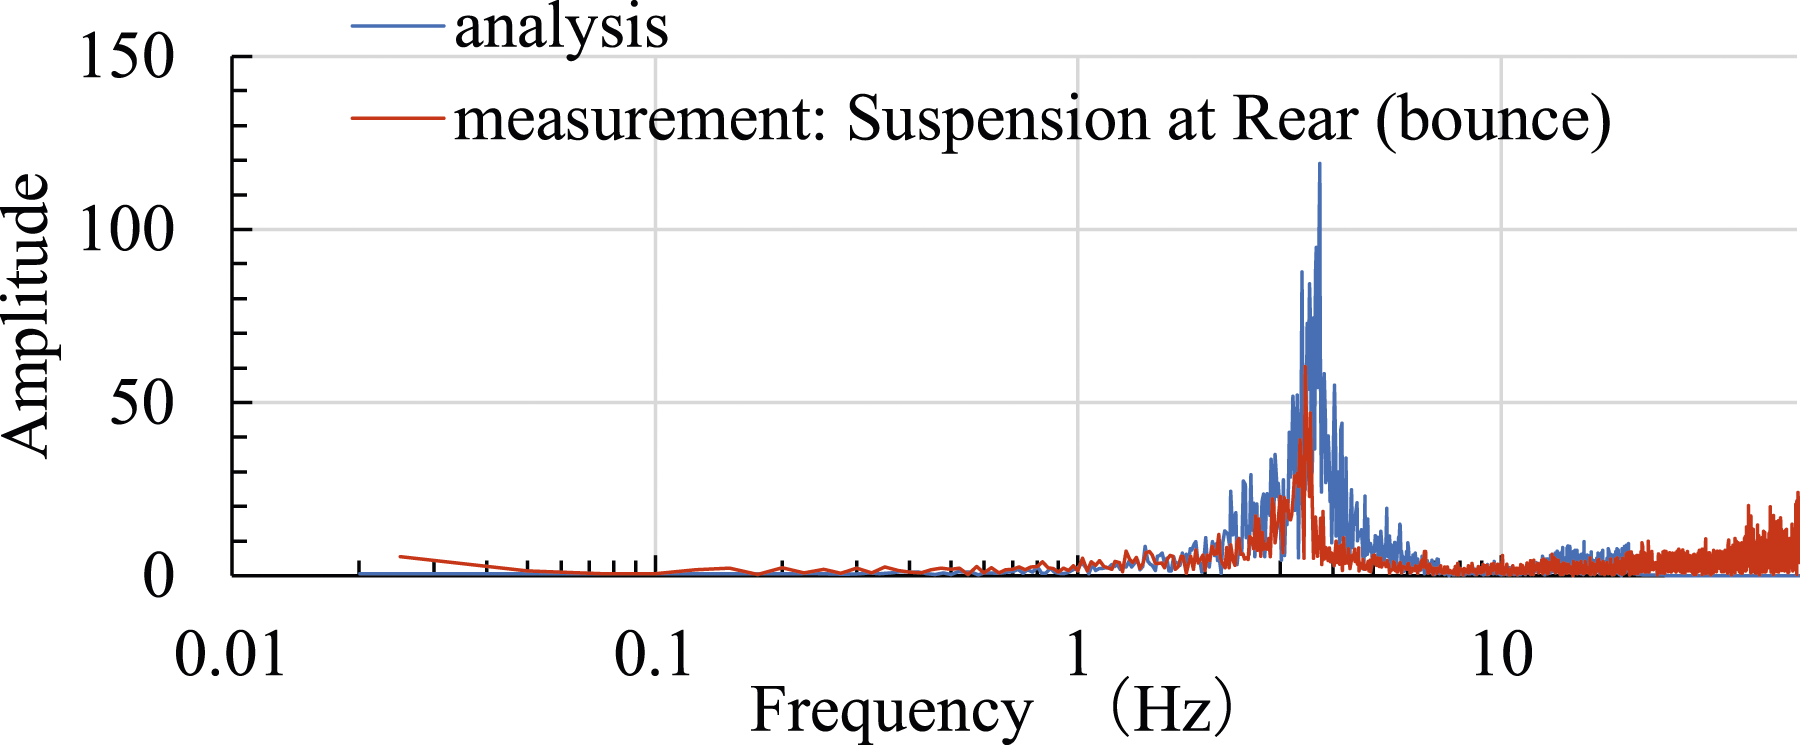
For the evaluation of the vibration serviceability, the ride comfort of vehicles on the bridge is evaluated using the bounce motion of the vehicle. The validity of vehicle bounce motions is therefore worth investigating. The bounce accelerations of the vehicle are shown in Figure 13. Fourier spectra of the bounce accelerations are shown in Figure 14. As might be apparent from Figures 13 and 14, the VBI analysis showed comparable vehicle responses and frequency characteristics to those obtained from experimentation. The RMS value of the analytical bounce acceleration of the vehicle was 288.6 cm/s2, whereas the measured value was 297.4 cm/s2. The finding demonstrates that the VBI analysis also well simulates the vehicle motions. Accelerations of vehicle bounce motion for Case 1. Fourier amplitude spectra for Figure 13.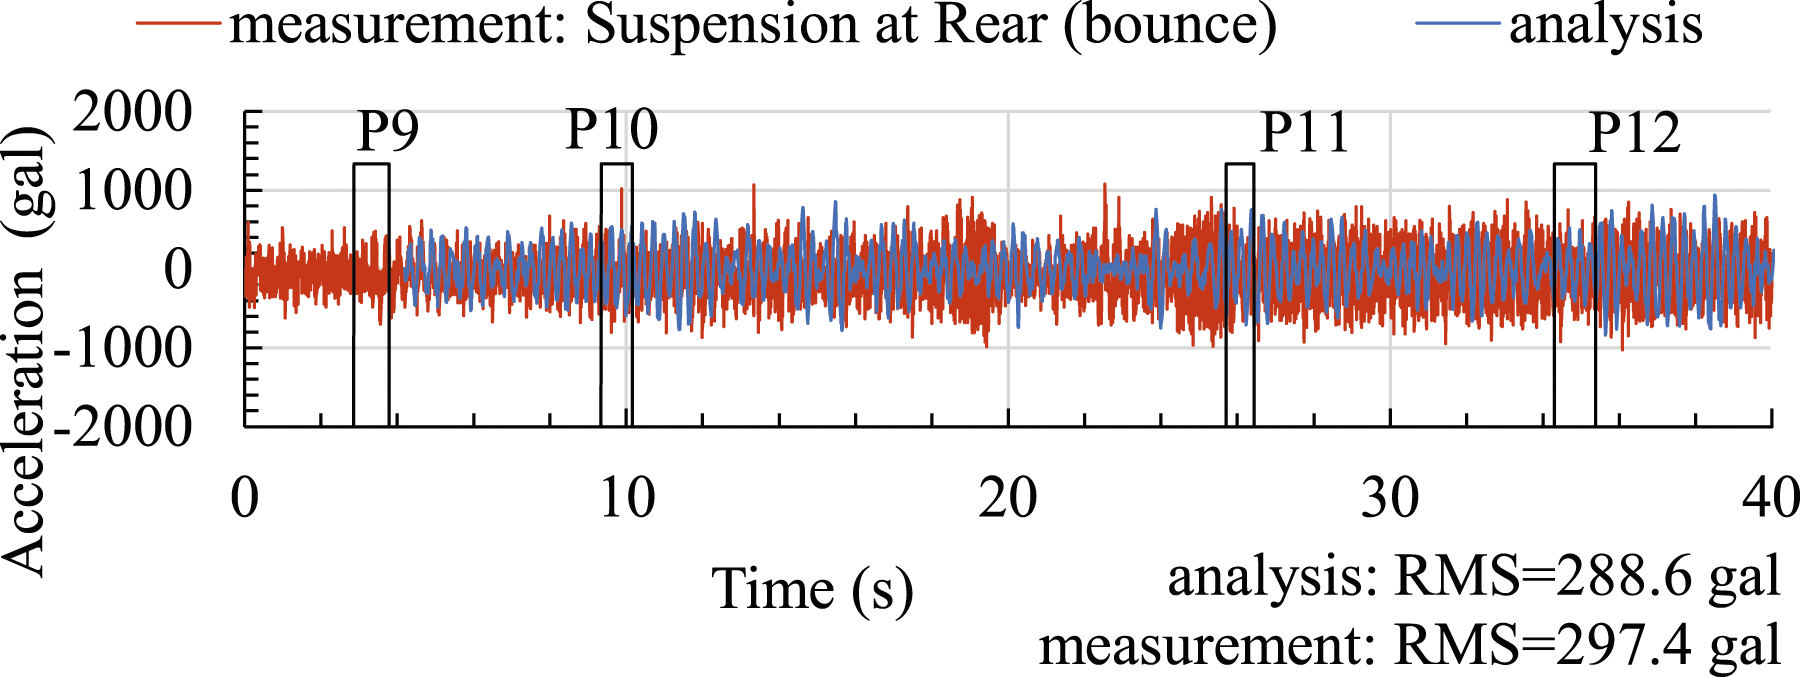
Ride comfort of the seven-span continuous cable-stayed bridge
Bridge model
The general layout and cross-sectional view of the target bridge are shown in Figure 15. The bridge is a seven-span continuous cable-stayed bridge. The total length is 2730 m long with a span length comprising 130 m + 260 m + 3@650 m + 260 m + 130 m. The main tower consists of four A-shaped steel towers in the longitudinal direction of the bridge and adopts a steel pipe sheet pile foundation. The bridge consists of six lanes: three inbound lanes and three outbound lanes. The main girders are separated from the main tower. General layout of the examined cable-stayed bridge (unit: m).
The bridge was modelled similarly to the single-span cable-stayed bridge described in the preceding section, with beam elements for the girders, truss elements for the cables, and spring elements with two nodes having the same coordinates for the elastomeric bearings as shown in Figure 16. The vehicle was also modelled similarly to the single-span cable-stayed bridge. The vehicle type and weight specified in accordance with the Japanese highway bridge design code are that of a dump truck, with a weight of 196 kN. Rayleigh damping was adopted in the VBI analysis of the bridge. Equations of motion for vehicles and the bridge interactive system were solved using the Newmark β method assuming β = 1/4. Two vehicle speeds were considered in the VBI analysis: 80 km/h and 60 km/h. The analysis starts when the lead vehicle reaches 10 m ahead of the bridge. The time interval in the numerical integration was 0.005 s. In the traffic-induced vibration analysis of the bridge, the roadway roughness on the bridge surface is simulated based on the PSD curves, for which the roadway roughness is assumed to be categorized as Class A according to the ISO estimate. Two road surface profiles are considered in the analysis: one is rougher than simulated road surface profiles following Class A; and the other has a hump at the expansion joint. FE model for the bridge.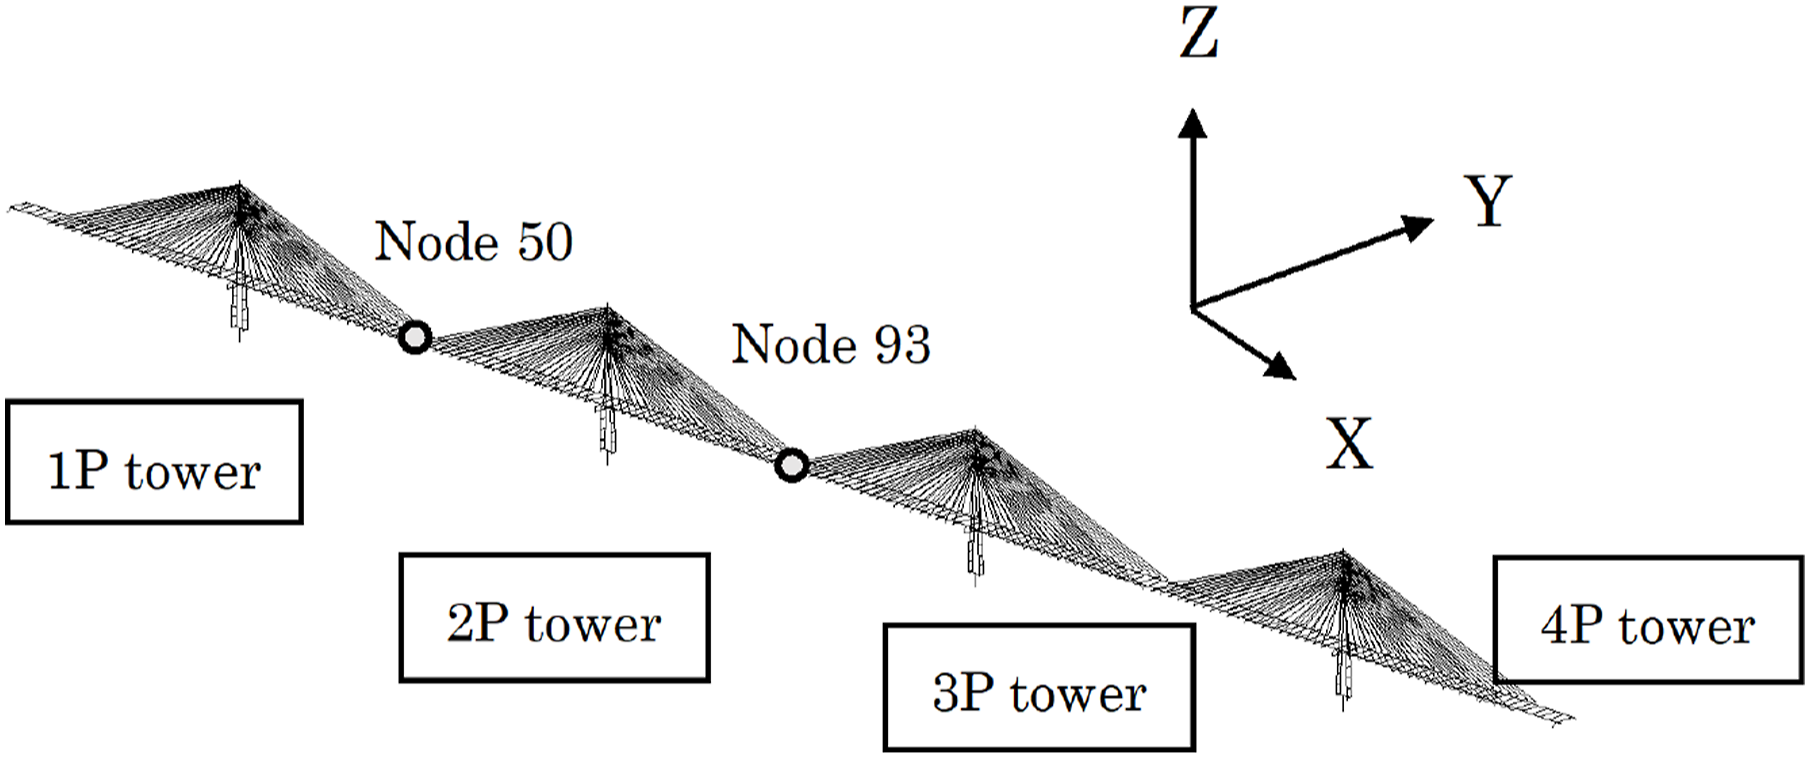
Analysis scenarios
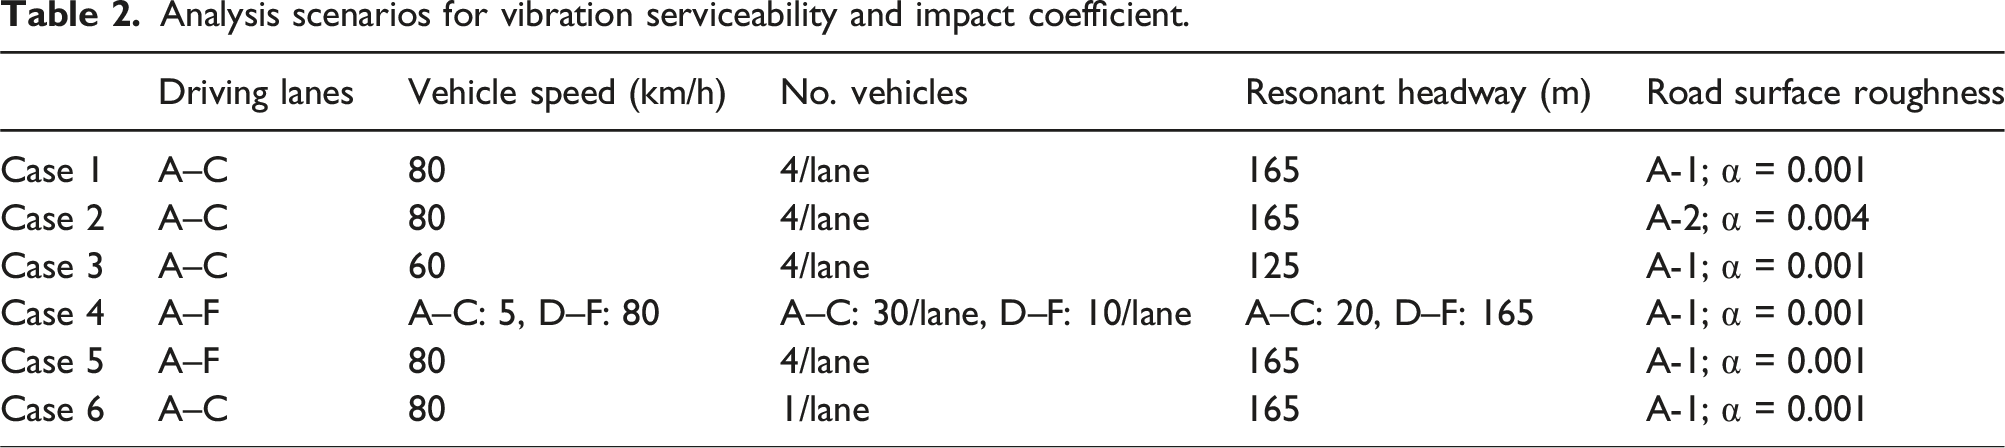
Analysis scenarios for vibration serviceability and impact coefficient.
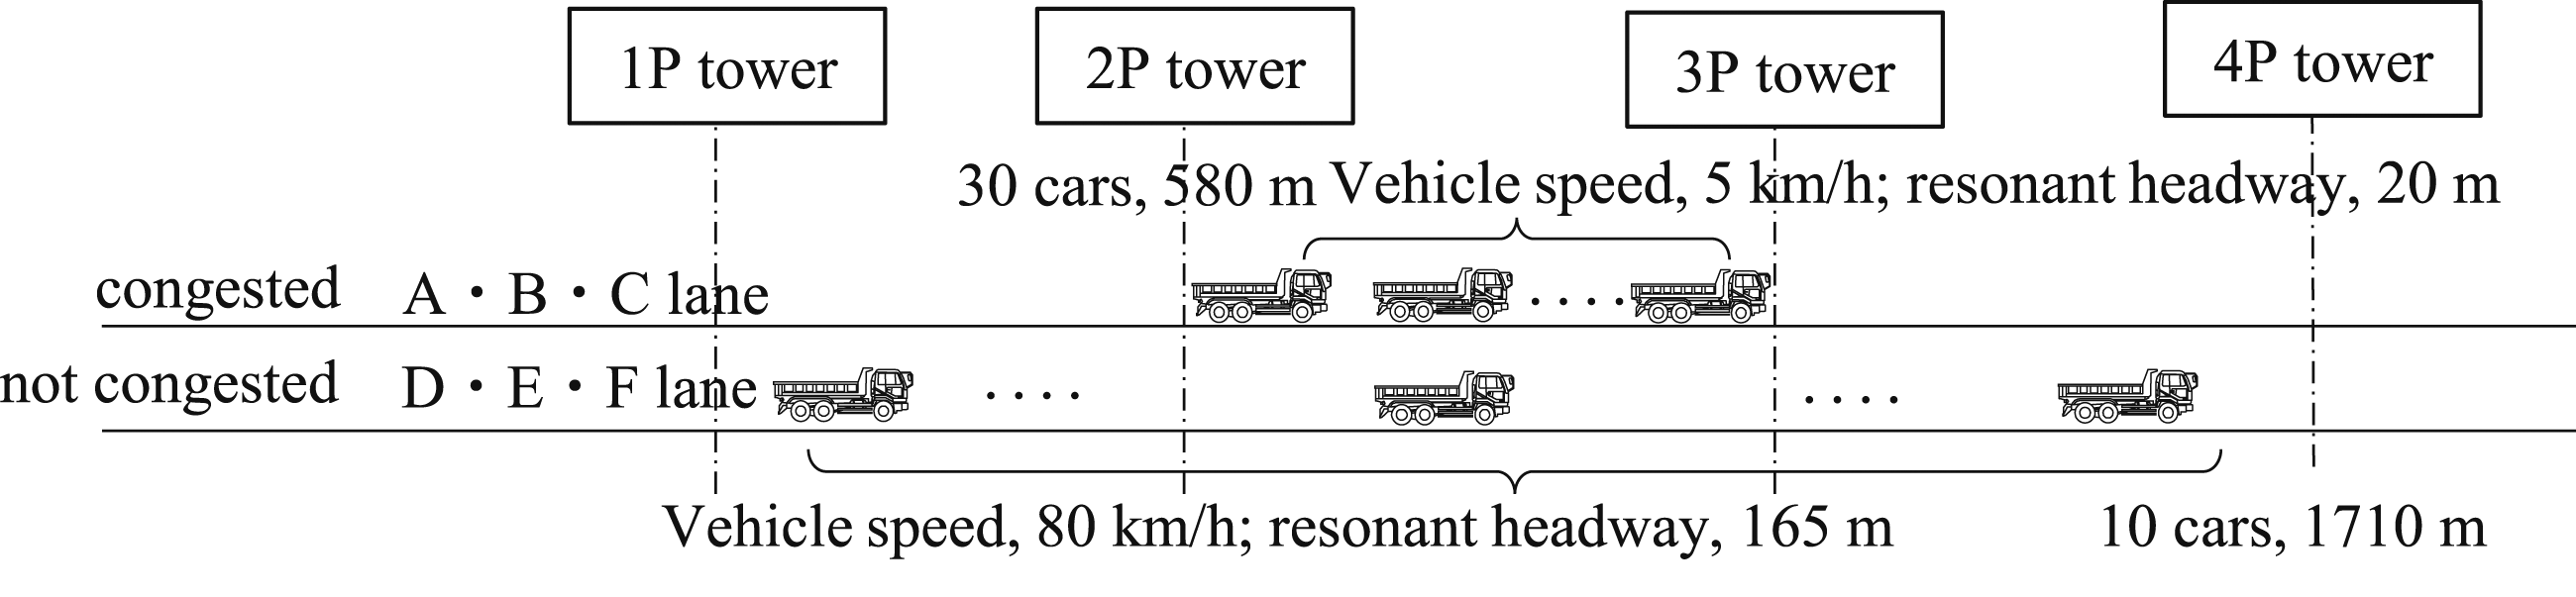
Vehicle placement for Case 4.
Vehicle–bridge interaction analysis
Eigenvalue analysis
Selected mode shapes and frequencies of the bridge used for eigenvalue analysis are presented in Figure 18. The bending mode of the bridge is observed in the first mode (0.136 Hz). The third mode (0.192 Hz) is the second bending mode of the main girder between the 2P tower and 3P tower. The tenth mode (0.356 Hz) shows a sway mode of the main tower. The 17th mode (0.499 Hz) is the second bending mode of all spans. Those dominant frequencies are far from the bounce motion of vehicles: 2.0–3.5 Hz. Selected vibration modes from eigenvalue analysis.
Dynamic responses of bridge and vehicle
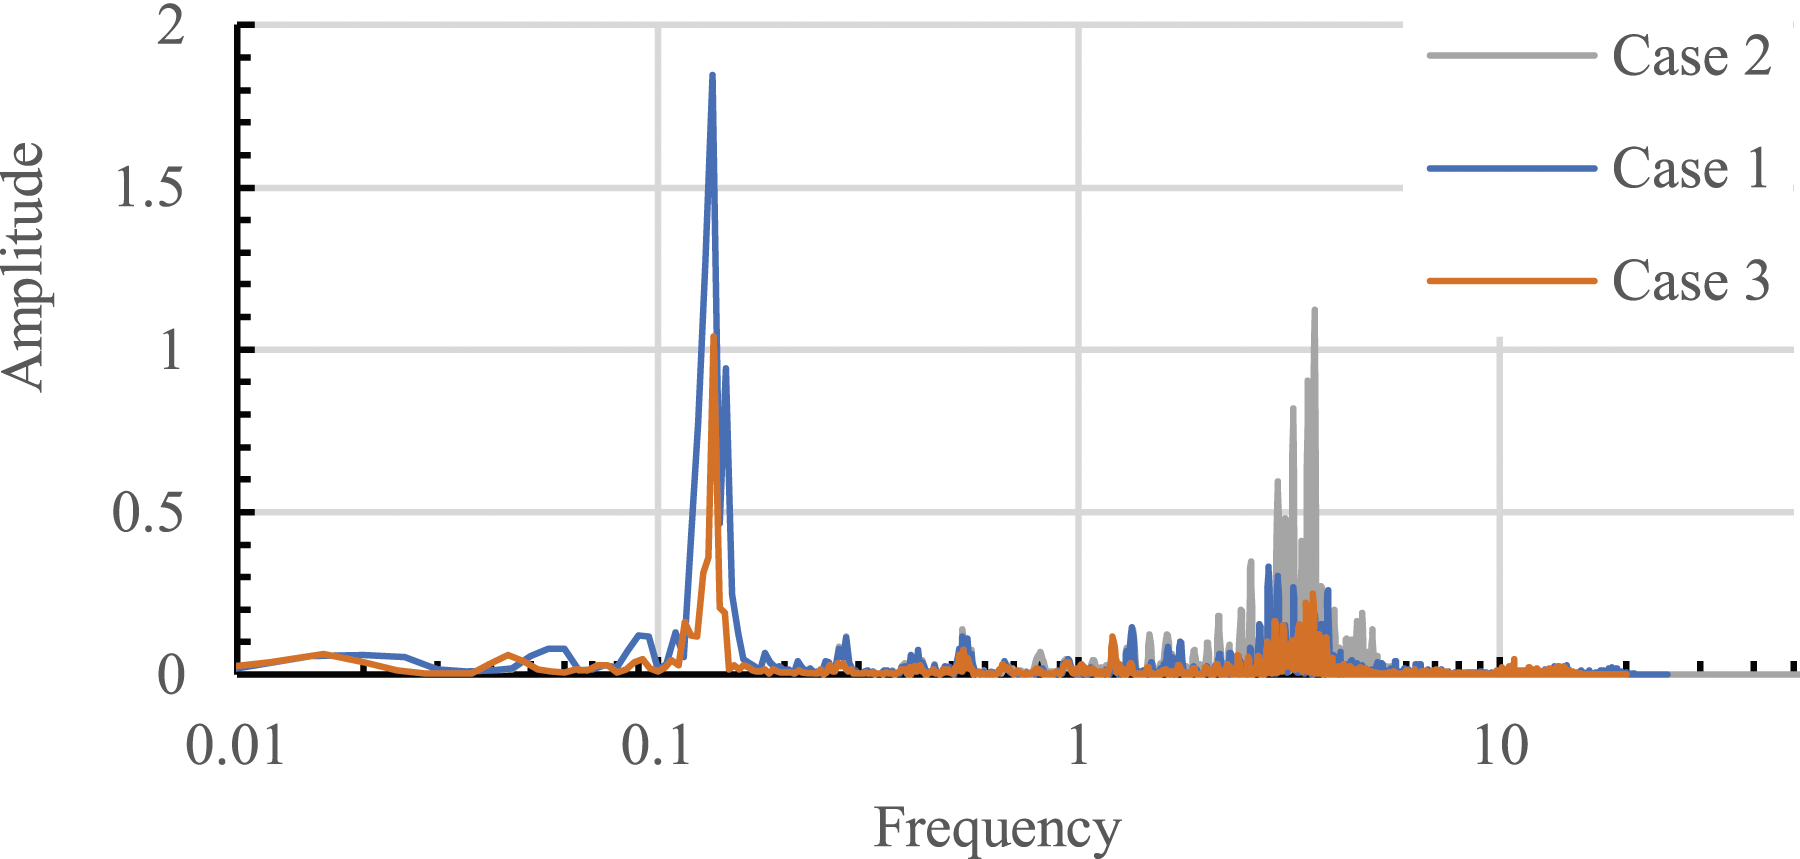
Analytically obtained vertical accelerations of the main girder at the span centre between 2P and 3P towers are shown in Figure 19. That figure demonstrates that the maximum amplitude of acceleration in Case 2 was 27.21 cm/s2 because Case 2 has worse road surface roughness than Case 1 and Case 3. By contrast, Case 3, where the vehicle speed is lower than Case 1 and Case 2 and for which the road surface roughness is smoother than that of Case 2, was found to have the lowest peak amplitude of 8.24 cm/s2. Therefore, it is readily apparent that the dynamic response of the main girder is affected by both road surface conditions and vehicle speed. Fourier spectra of those acceleration responses in Figure 19 are presented in Figure 20. The first bending mode of the bridge (Figure 18) is the major source of the dominant frequency near 0.136 Hz, as depicted in Figure 20. At Fourier amplitudes of approximately 0.136 Hz, the Fourier amplitude of Case 3 is smaller than those of the other two cases, but no clear difference exists between Case 1 and Case 2, even though Case 1 has less road surface roughness. The Fourier amplitude at approximately 3.5 Hz is similar to the frequency for the bounce motion (3.5 Hz) at the rear axle of the vehicle. Case 2 shows the largest Fourier amplitude, which is excited by excessive vehicle vibrations caused by worse roadway surface conditions. Acceleration responses at the span centre of the main girder between 2P and 3P towers for Cases 1–3. Fourier amplitude spectra for Figure 19.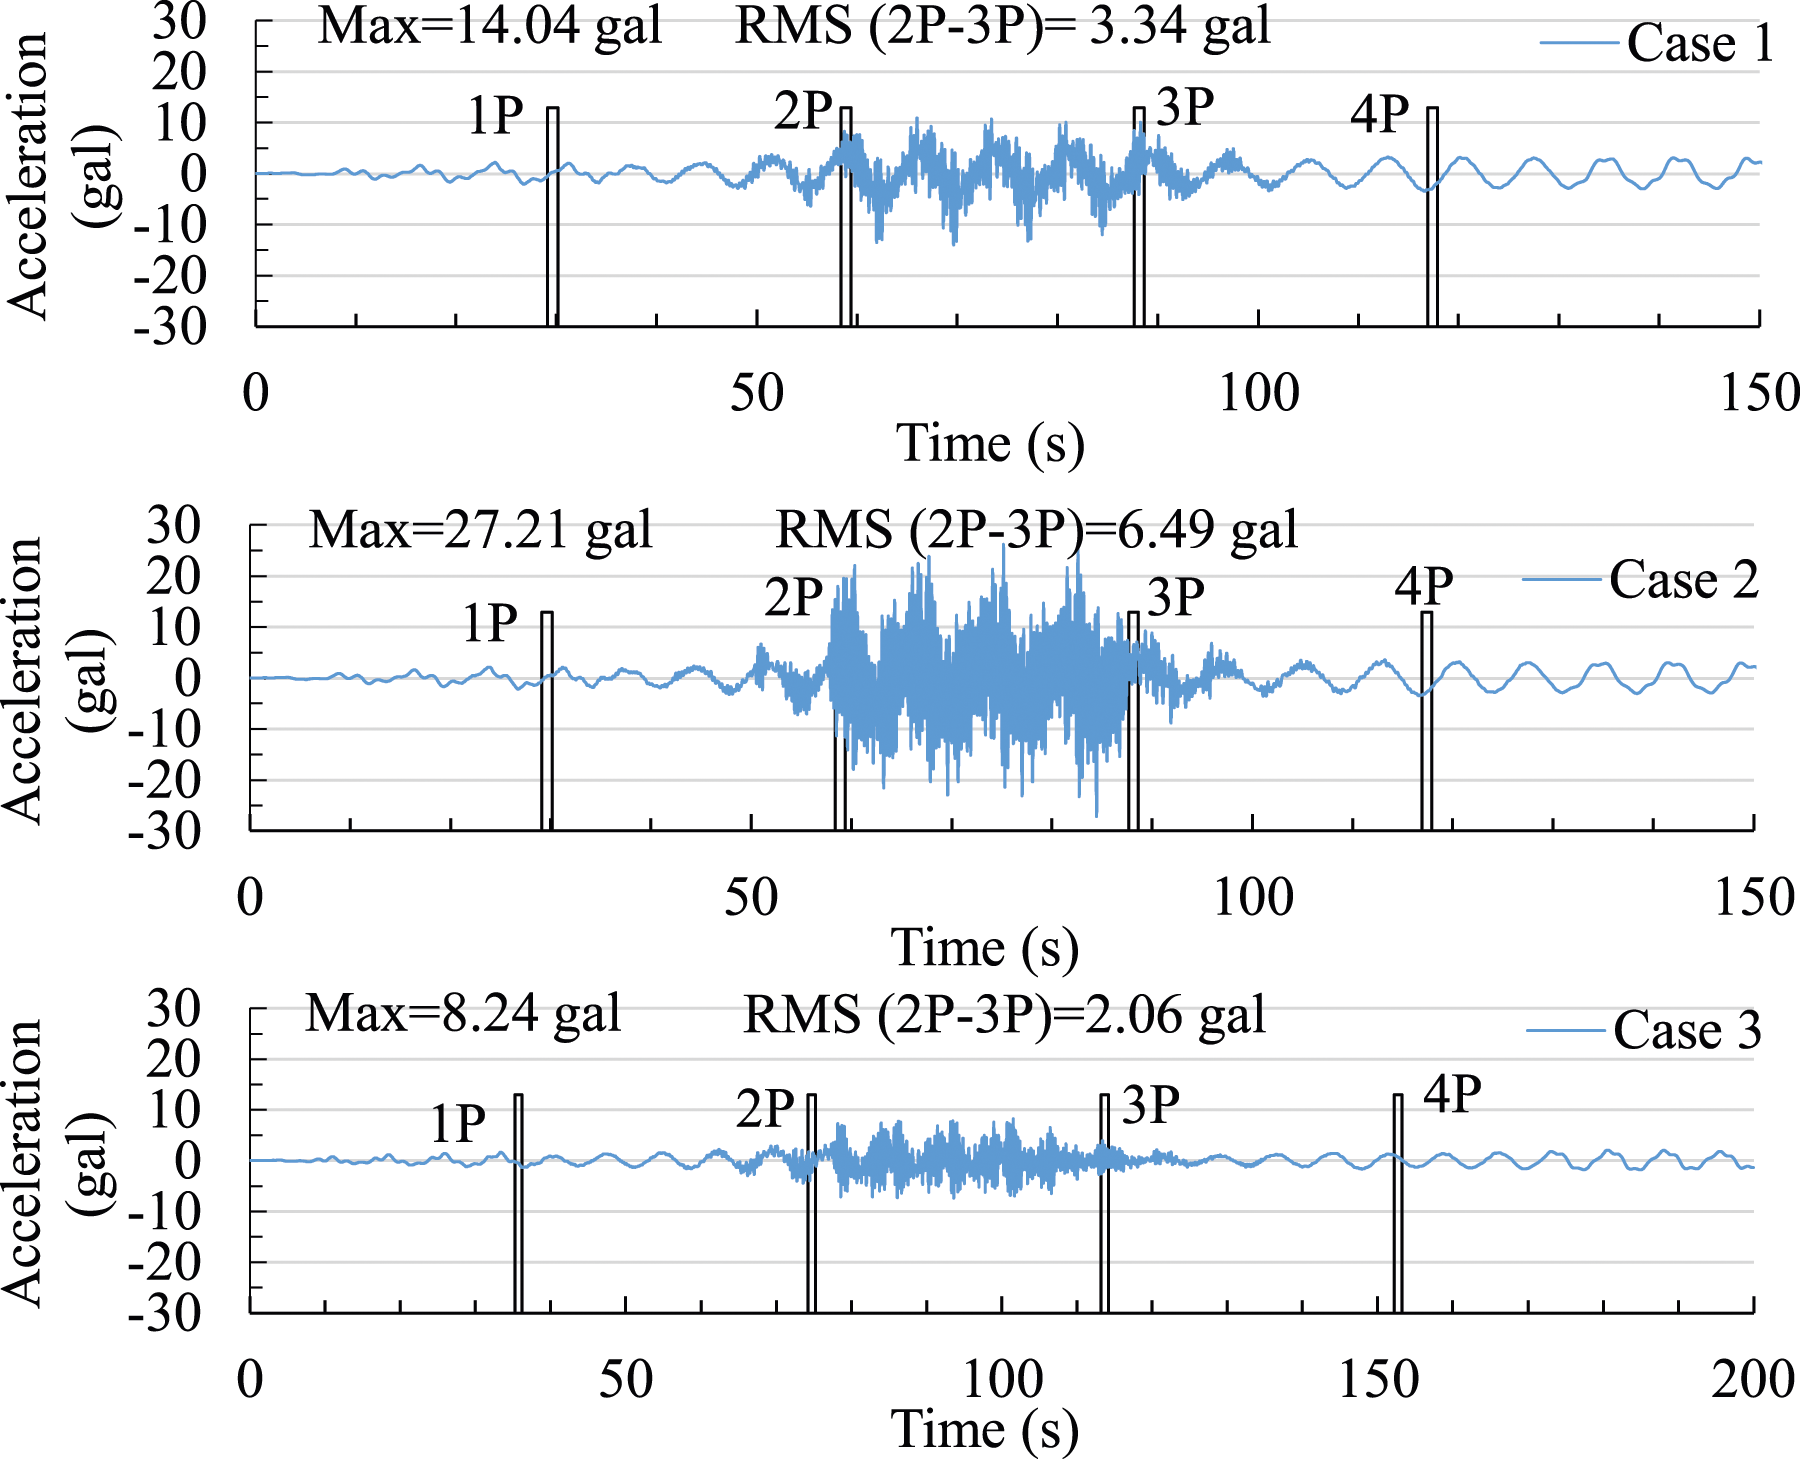
The vibrations of vehicles on the bridge are also simulated and investigated. As an example, the vertical acceleration response of the lead vehicle in lane A (Figure 15) is shown in Figure 21. For the vibration serviceability assessment, the ride comfort of vehicles on the bridge is evaluated using the vertical component of the vehicle’s sprung mass, i.e. the bounce motion. The largest RMS value of the bounce acceleration of the vehicle was observed in Case 2 as 226.48 cm/s2. The smallest RMS was observed in Case 3 as 84.99 cm/s2. These findings demonstrate that road surface roughness and vehicle speed are important factors for assessing vehicle ride comfort, even on long-span bridges such as cable-stayed bridges. Accelerations of vehicle bounce motion for Cases 1–3.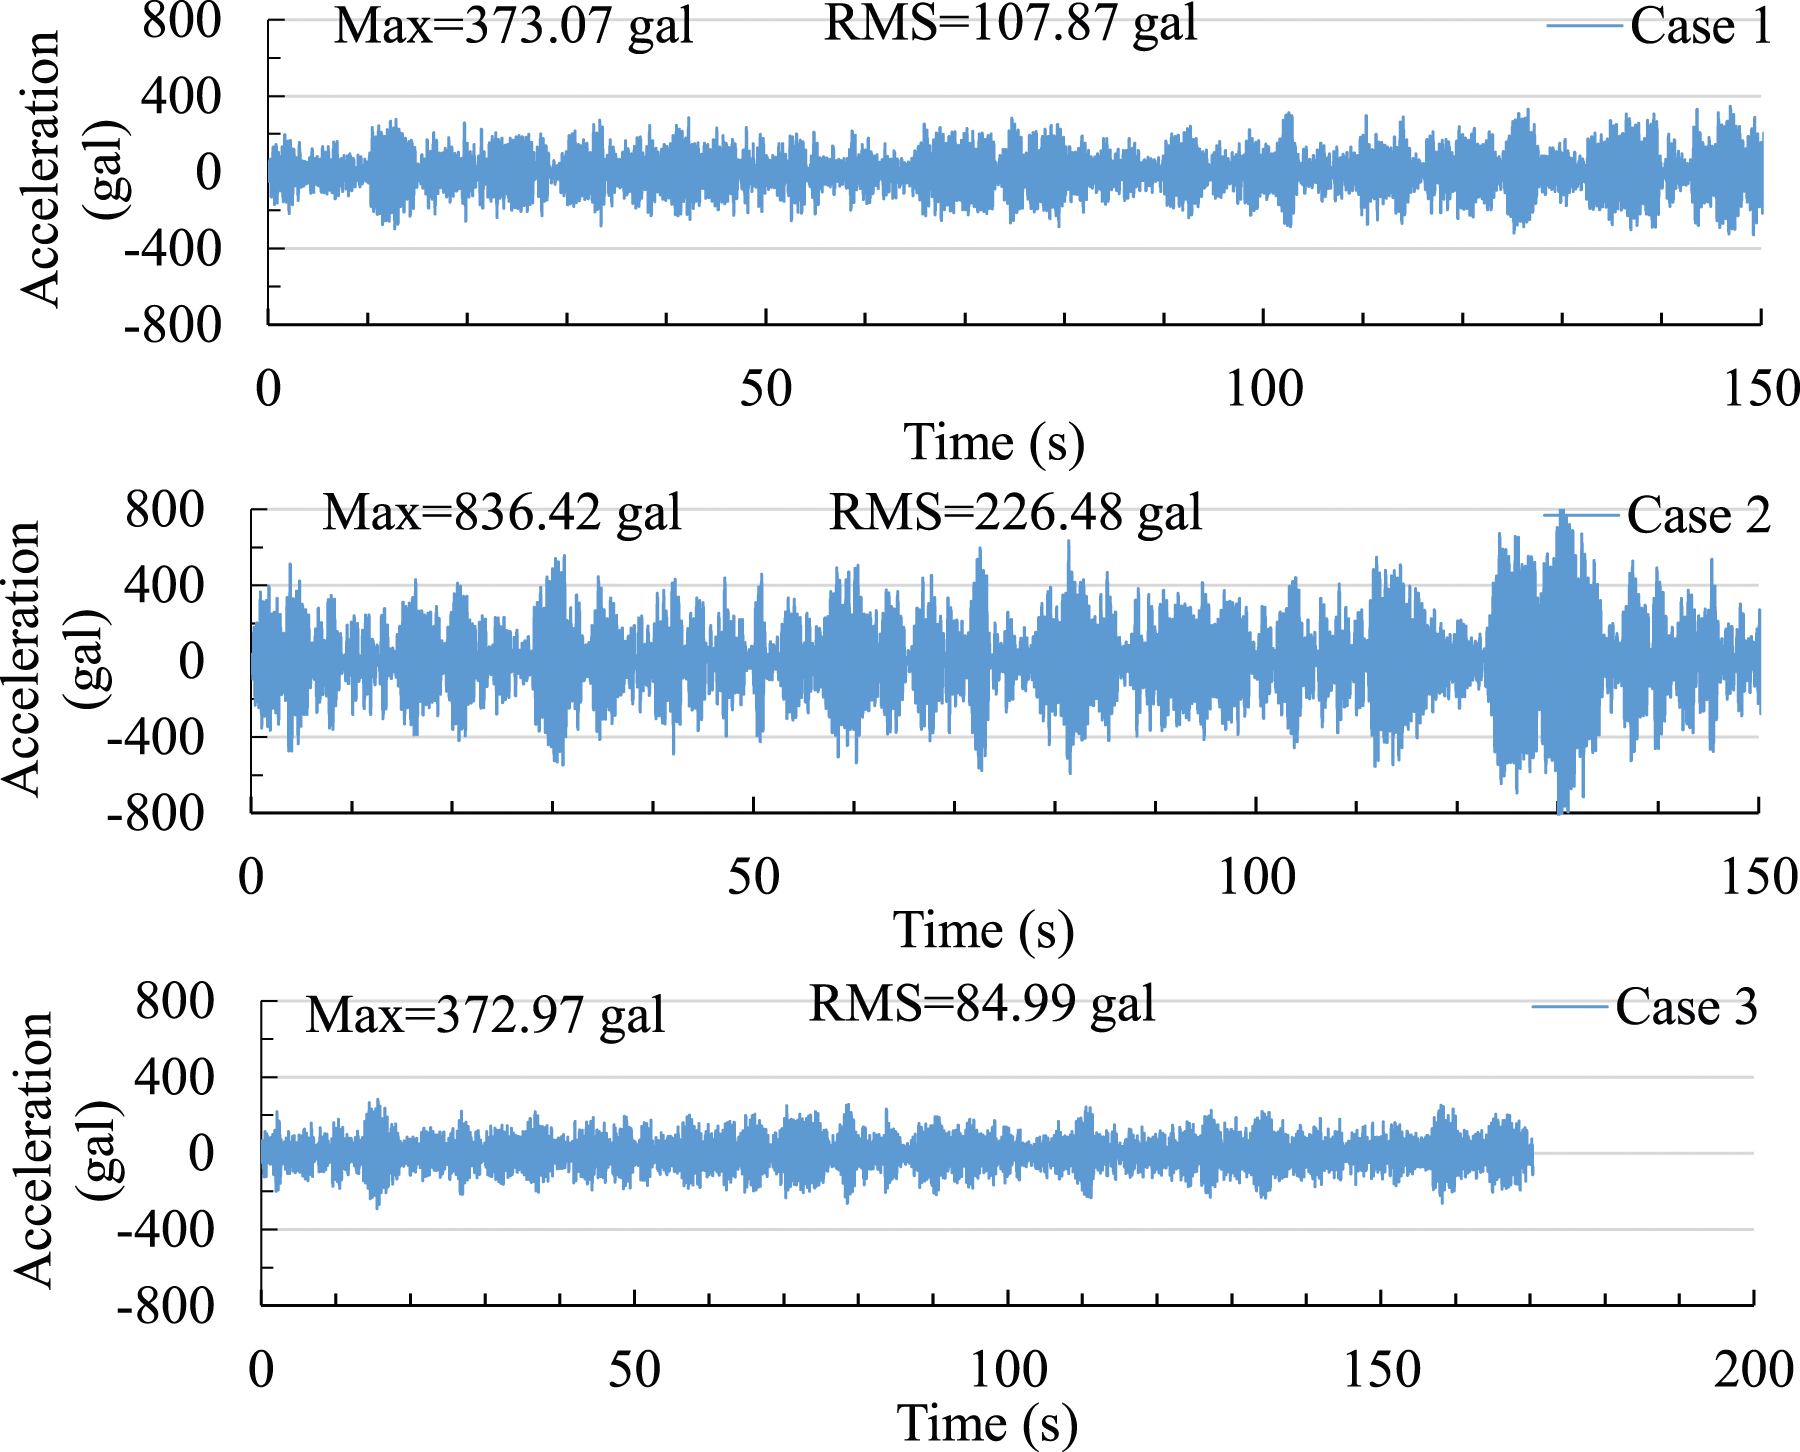
As described in the Introduction, the Japanese Specification for Road Bridges specifies deflection limits for bridges with span lengths of less than 200 m to ensure that the bridge has the necessary stiffness to prevent repetitive vibrations, such as those caused by passing vehicles, from affecting the bridge (Japan Road Association I, 2017). However, considering that ride comfort is also affected by the frequency band to which the human body is exposed and that the span length of the bridge in question is more than 200 m, it is worth investigating ride comfort from the vibration response. Moreover, the relation between the deflection and whole-body vibration exposure in ISO2613-1 is also worth investigating.
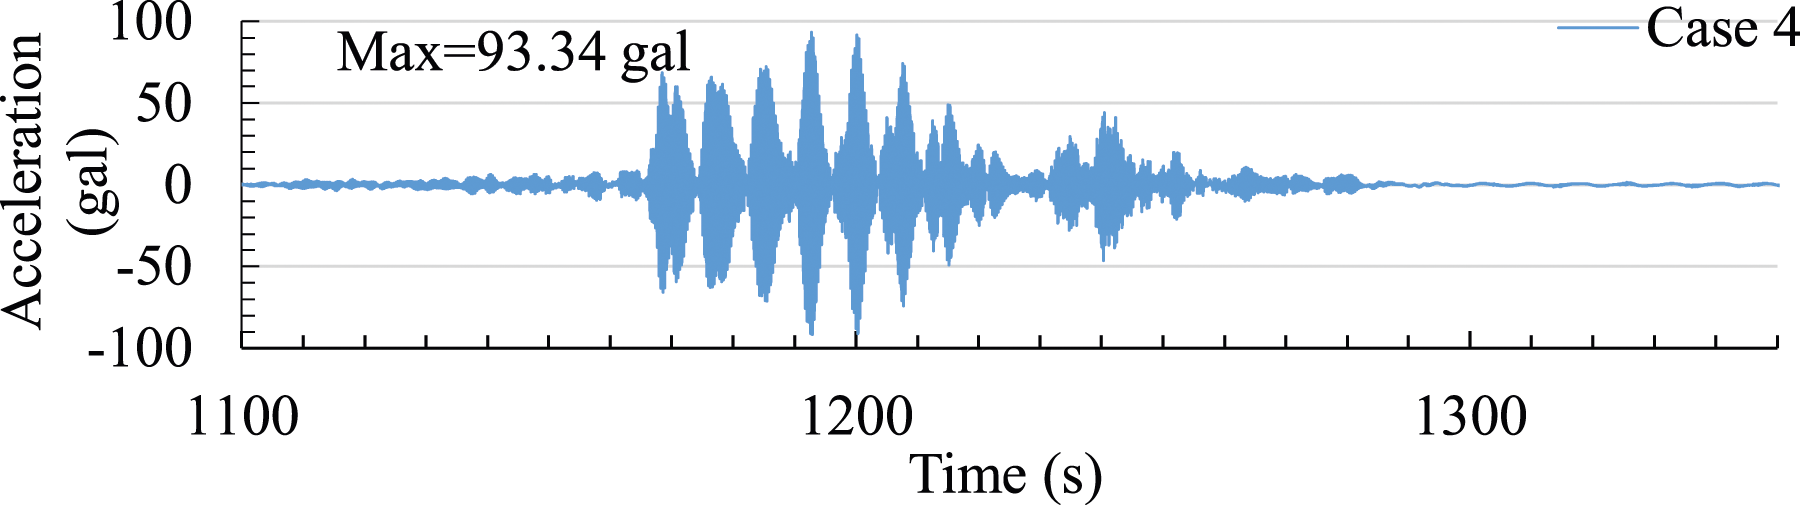
The vertical deflection at the span centre of the main girder between 2P and 3P towers for Case 4 is shown in Figure 22. The Case 4 scenario assumes traffic congestion on A, B, and C lanes and normal traffic on E, F, and G lanes to produce the largest deflection at the main girder among six scenarios, from Case 1 to Case 6. An example of the bounce acceleration of a vehicle on A lane during a traffic jam is shown in Figure 23, in which the vehicle speed of the vehicle during a traffic jam is assumed as 5 km/h. Vibrations of vehicles in congested lanes can be affected strongly by the bridge vibration. Figure 23 shows that the maximum amplitude of the vehicle acceleration is 93.34 cm/s2, which is smaller than that of the vehicle vibration for Case 1 shown in Figure 21. Vehicle vibrations in congested lanes could be significantly influenced by bridge vibrations. However, since the natural frequency of the bridge’s first bending mode is 0.136 Hz—considerably different from the vehicle bounce frequency of 3.5 Hz—the vibrations of vehicles in congested lanes were found to be less intense compared to those in the normal lane. Based on these results, we can conclude that the impact on ride comfort during traffic congestion is relatively minor. Displacement responses at the span centre of the main girder between 2P and 3P towers for Case 4. Acceleration of the vehicle bounce motion on a congested lane under the Case 4 scenario.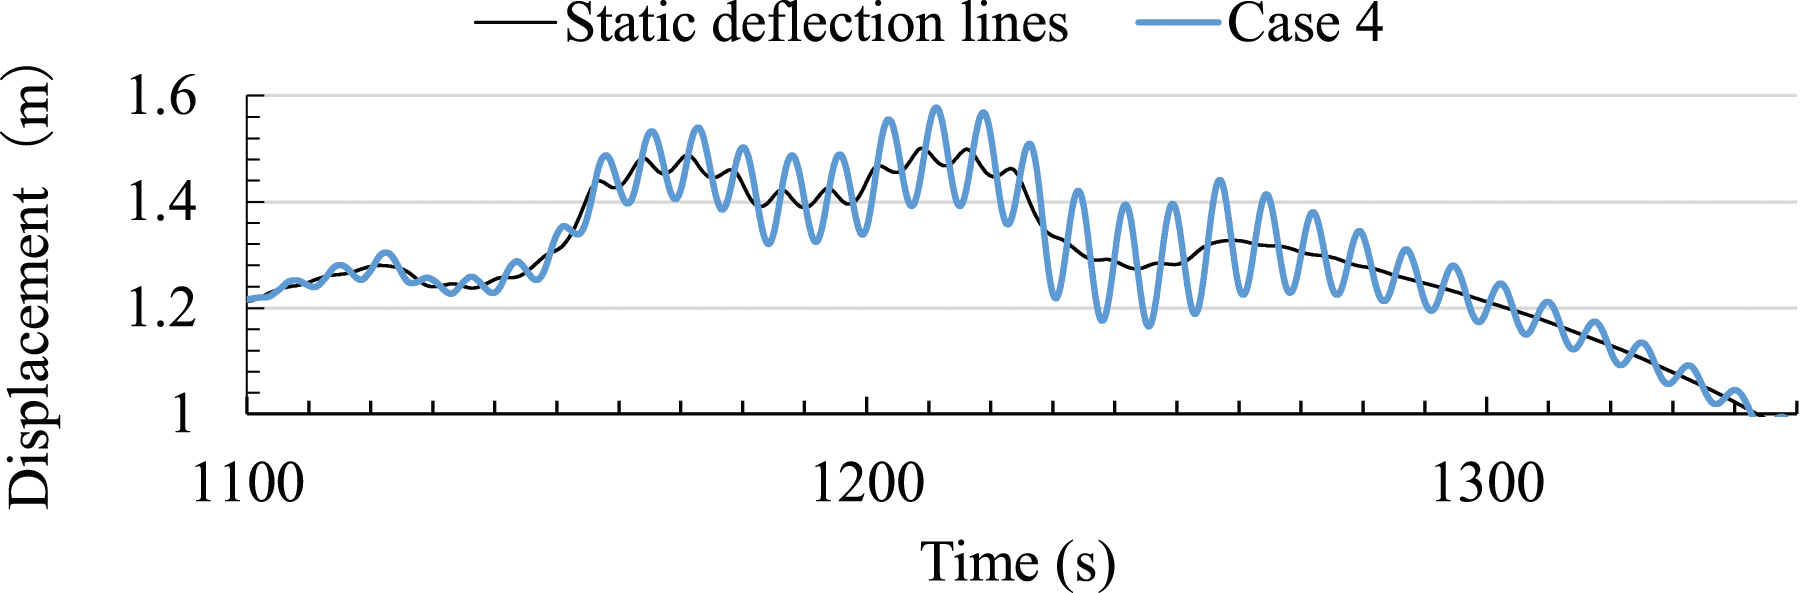
Ride comfort of vehicles on the bridge
The ride comfort of vehicles on the bridge is investigated according to ISO 2613-1 for whole-body vibration exposure (ISO 2631-1, 1997). ISO2613-1 describes evaluations of “vibration effects on health”, “vibration effects on comfort”, and “vibration effects on the occurrence of motion sickness”. This study examines only the effects of vibration on ride comfort: effects of transport on health and motion sickness are beyond the scope of this study. Assuming a vehicle travelling at 80 km/h, the vehicle stays on the target span for approximately 30 s. The intensity of the vibration is transmitted to the human body through the passenger seat. It is therefore determined using the bounce vibration of the vehicle obtained from the VBI analysis. In public transport, the approximate indications of likely reactions to different magnitudes of weighted vibration are as presented below (ISO 2631-1, 1997). – Less than 0.315 m/s2: not uncomfortable – 0.8–1.6 m/s2: uncomfortable – Greater than 2 m/s2: extremely uncomfortable
The weighted RMS accelerations of the vehicle travelling at different speeds, from Case 1 to Case 4, are shown in Figure 24, together with boundaries for ride comfort. The three curves in Figure 24 represent the boundaries of ride comfort with “extremely uncomfortable”, “uncomfortable” and “not uncomfortable” from the top. The boundaries are obtained considering the correction coefficient W
k
according to ISO 2613-1 (1997). In Figure 24, the measured values from the moving vehicle experiment at the single-span cable-stayed bridge denoted as “measurement” are also included for comparison. The dominant RMS accelerations between 1 Hz and 3 Hz are relevant to the bounce motion at the front axle of the vehicle. Those of approximately 3.5–4.0 Hz are related to the bounce motion at the rear axle of the vehicle, whereas the dominant RMS accelerations approximately 10–30 Hz are caused by the axle hop motion of the vehicle. Because the natural frequency of the first bending mode of the bridge is 0.136 Hz and because it is not close to the vehicle bounce frequency of 3.5 Hz, the cable-stayed bridge vibration is unlikely to affect vehicle ride comfort. Evaluation of the vehicle ride comfort.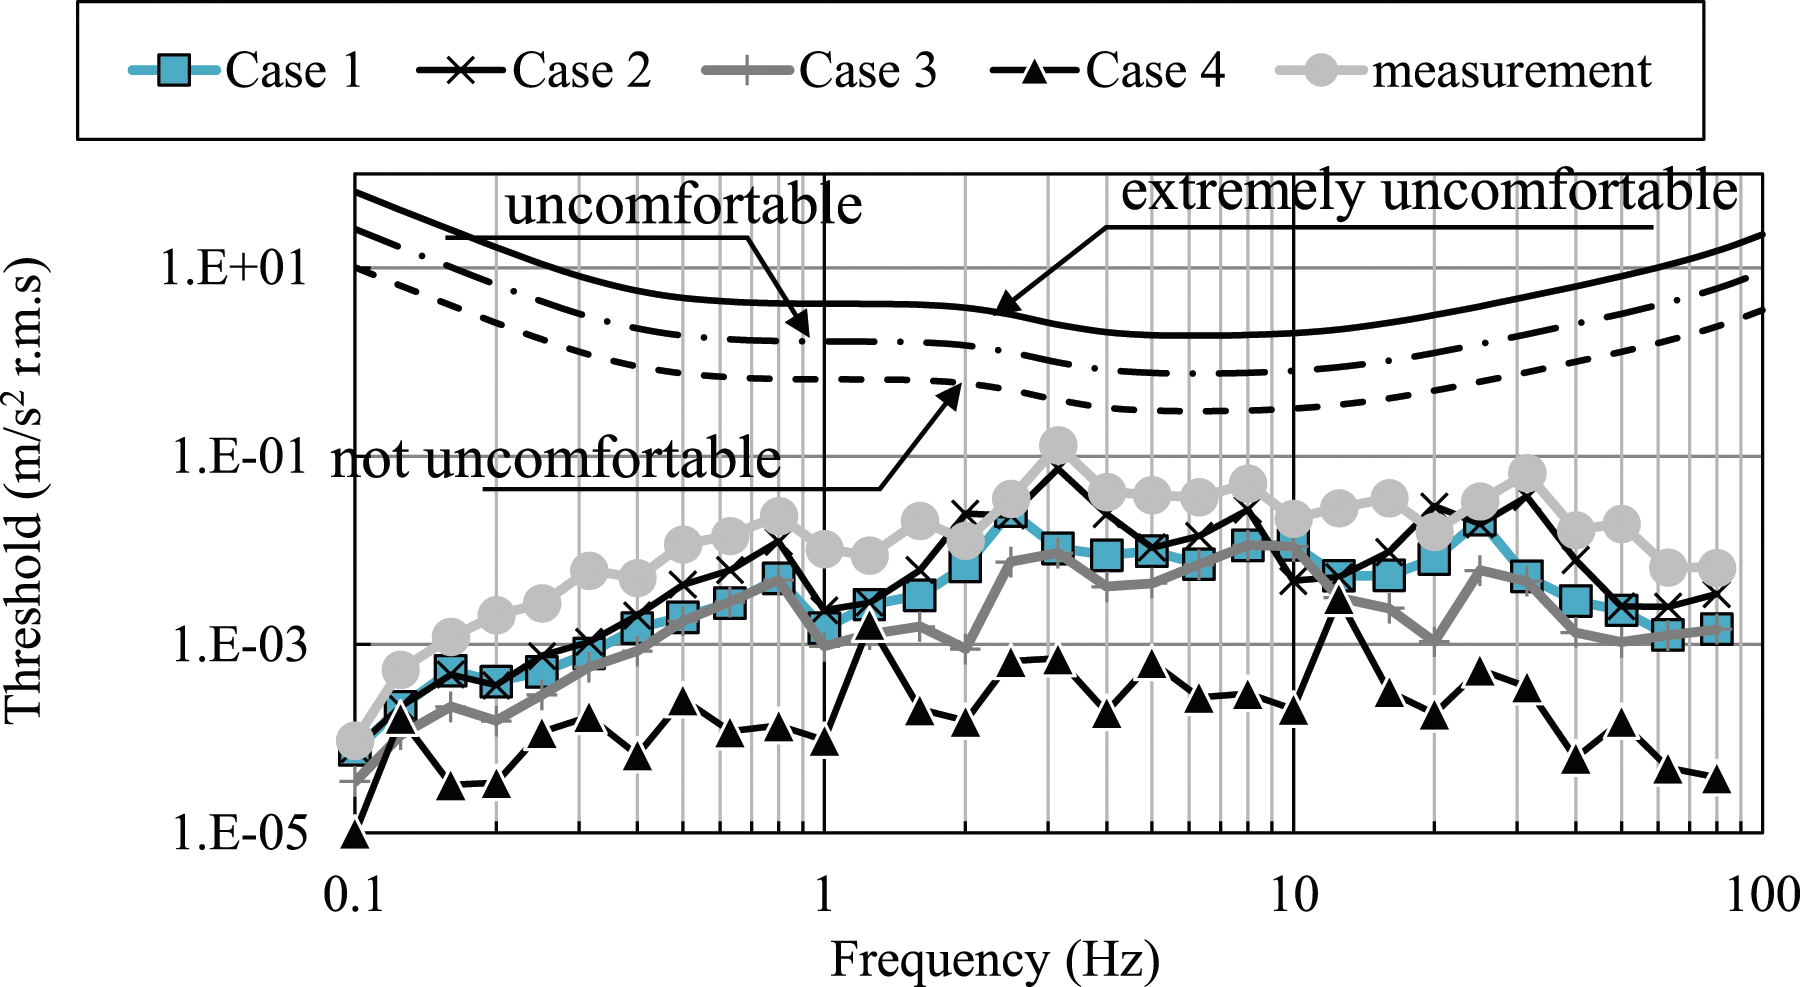
Figure 25 depicts the relation between the sum of the RMS of acceleration of the vehicle in each frequency range and the maximum static deflection at the centre of the span. Comparison of the overall vibration levels in each case reveals Case 2 as larger than the other case. It is apparent that poorer road surface roughness is associated with greater amplitude of the RMS. Among the three scenarios from Case 1 to Case 3, Case 3 with the slowest vehicle speed results in the lowest RMS value of acceleration. However, vehicles travelling in the congested lane in Case 4 have a lower RMS value of acceleration that those of vehicles in Case 1 to Case 3, not to mention vehicles in the normal lane in Case 4. The deflection of the girders in Case 4 was much greater than in the other cases because of traffic congestion, as expected. In Case 4, the bridge vibration is induced mainly by vehicles travelling in lanes E, F, and G. The vibrations of vehicles in congested lanes might be affected strongly by the bridge vibration. Figure 25 suggests that for the long-span cable-stayed bridge in question, excessive deflection alone does not directly affect vehicle ride comfort. Therefore, the natural frequencies and mode shapes of the bridge, the resonant headway distance and the number of vehicles travelling, and the road surface roughness condition are all interrelated. All affect ride comfort. RMS of vehicle acceleration in each frequency range and the maximum static deflection at the span centre.
Impact factor
Definition
In highway bridge design, the dynamic effect of travelling vehicles on bridge responses is considered using the impact factor or dynamic amplification factor. In the Japanese highway bridge design code, the impact factor is defined as i = 20/(50 + L) (L: span length in meters). The impact factor in the design code applies to bridges with span length of less than 200 m. However, the cable-stayed bridge examined for this study has a 650 m span length, which is greater than the applicable range of the impact factor. Therefore, the impact factor of the bridge is investigated using VBI analysis of the bridge. The impact factor is calculated as the ratio of the maximum static response and maximum dynamic response. It is defined as Definition of impact factor.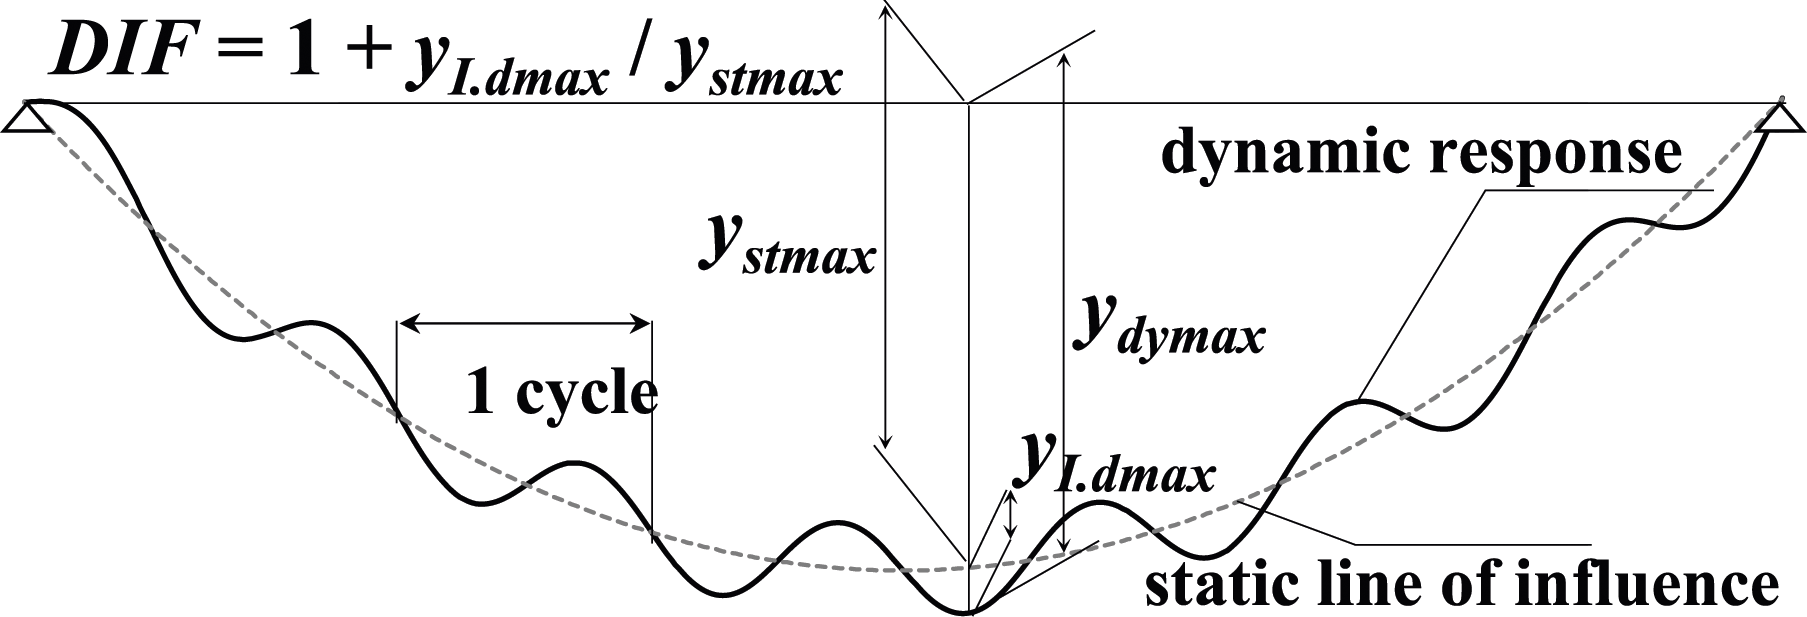
Impact factor of the seven-span continuous cable-stayed bridge
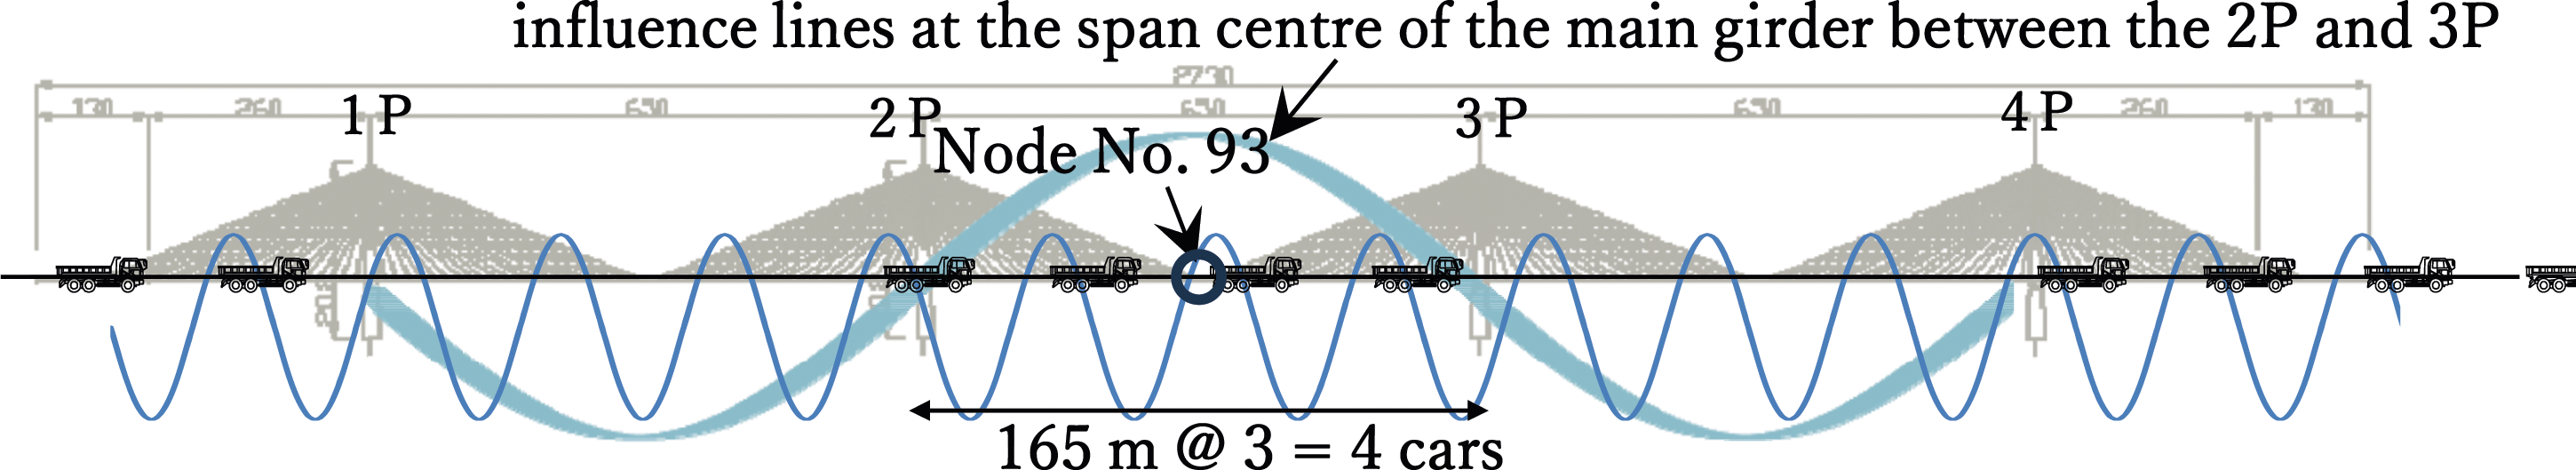
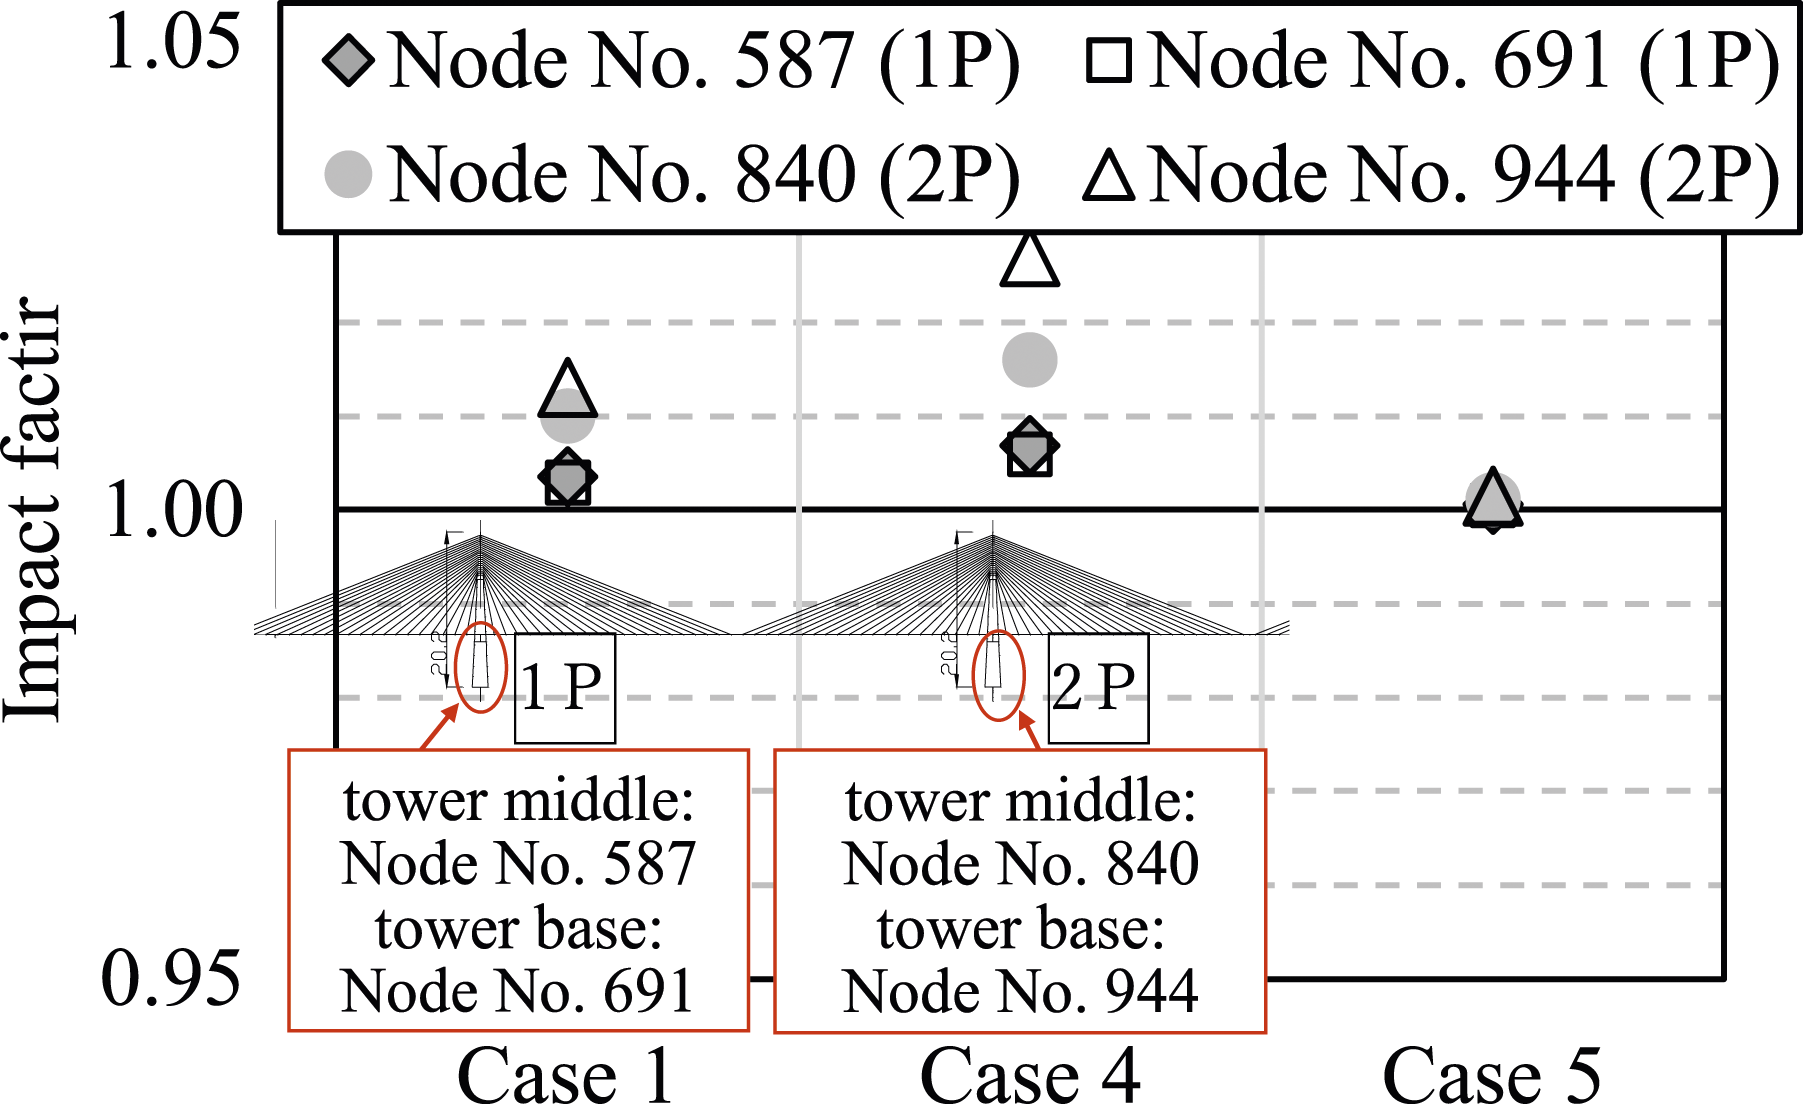
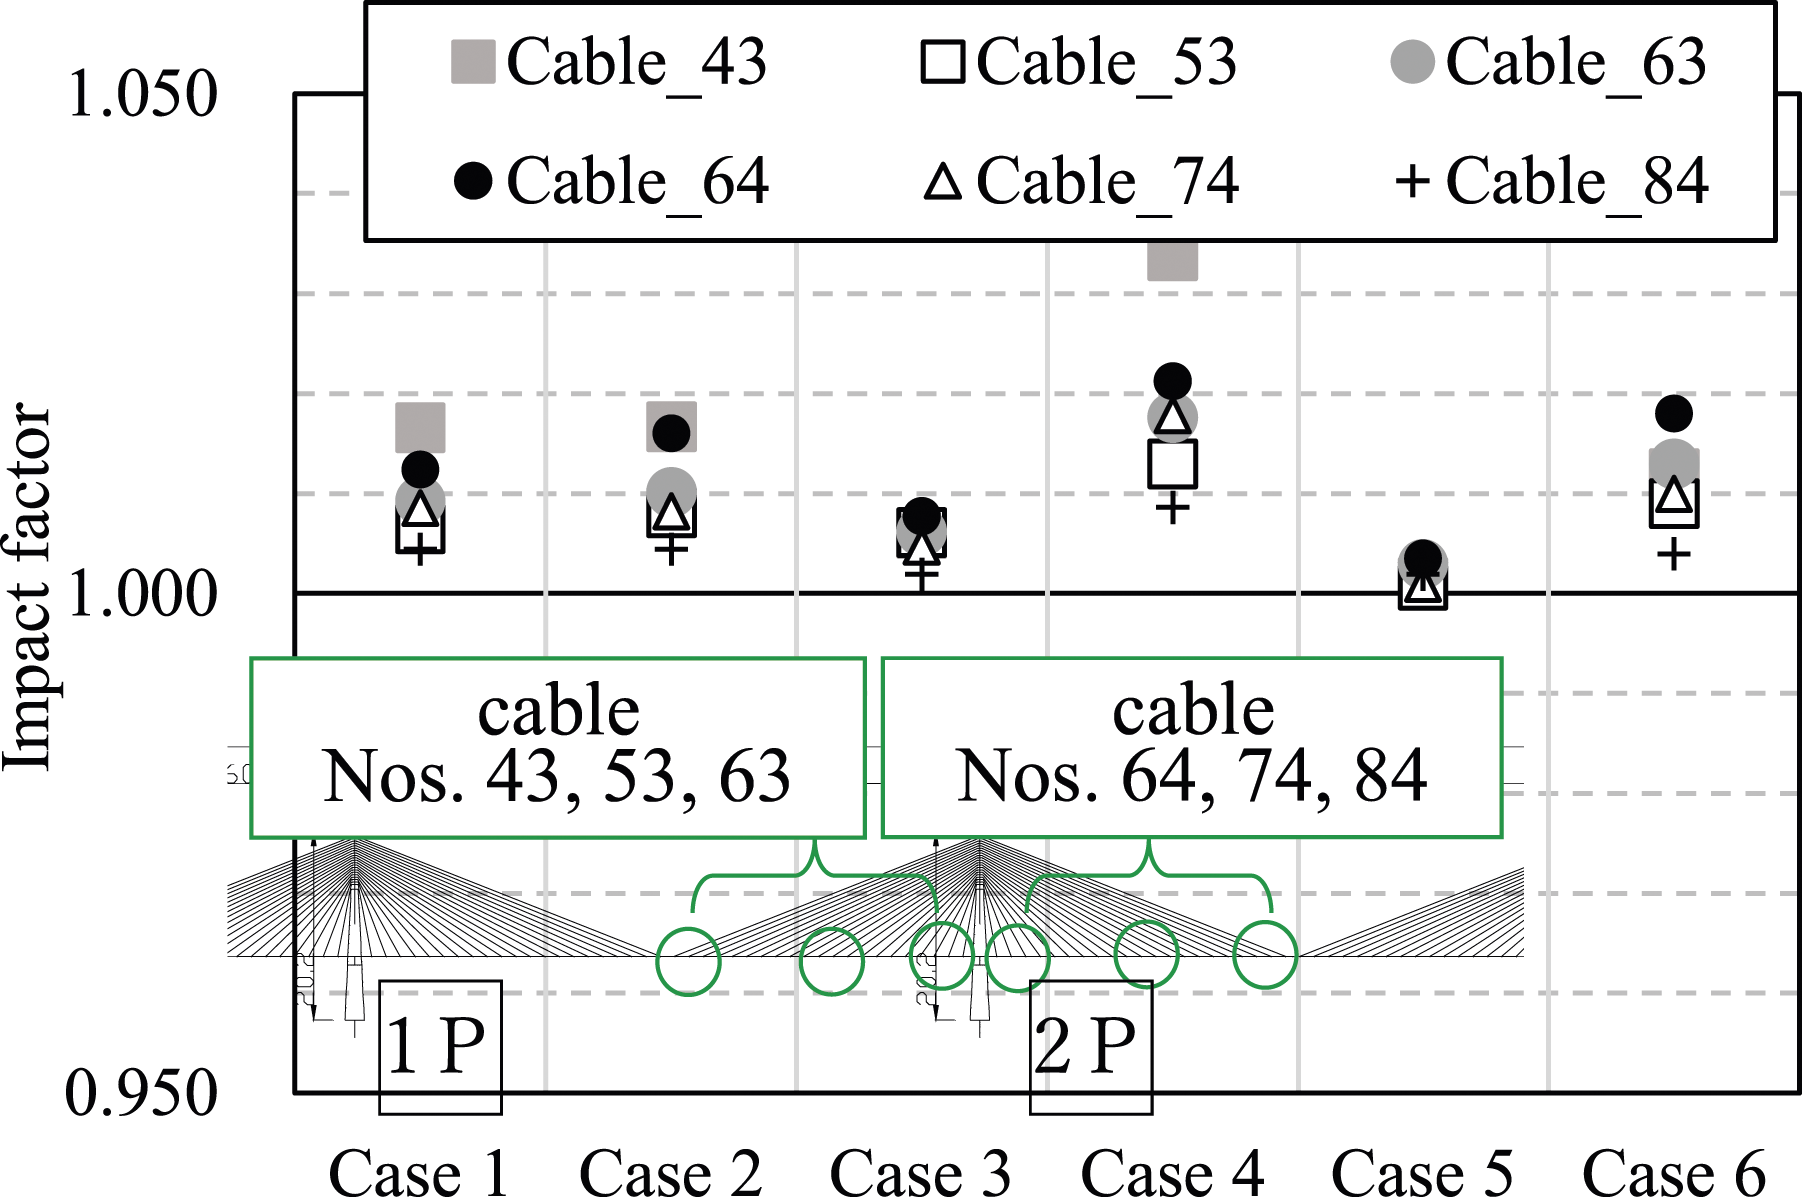
The estimated impact factors of the main girder are presented in Figure 27 under the vehicle loading shown in Figure 28. Because the vertical bending mode of the main girder and the sway mode of the main tower are dominant, the resonant headway is set as Impact factor of the main girder. Vehicle placement for Cases 1–4 of the analysis scenario. Impact factor of the main tower. Impact factor of the main cable.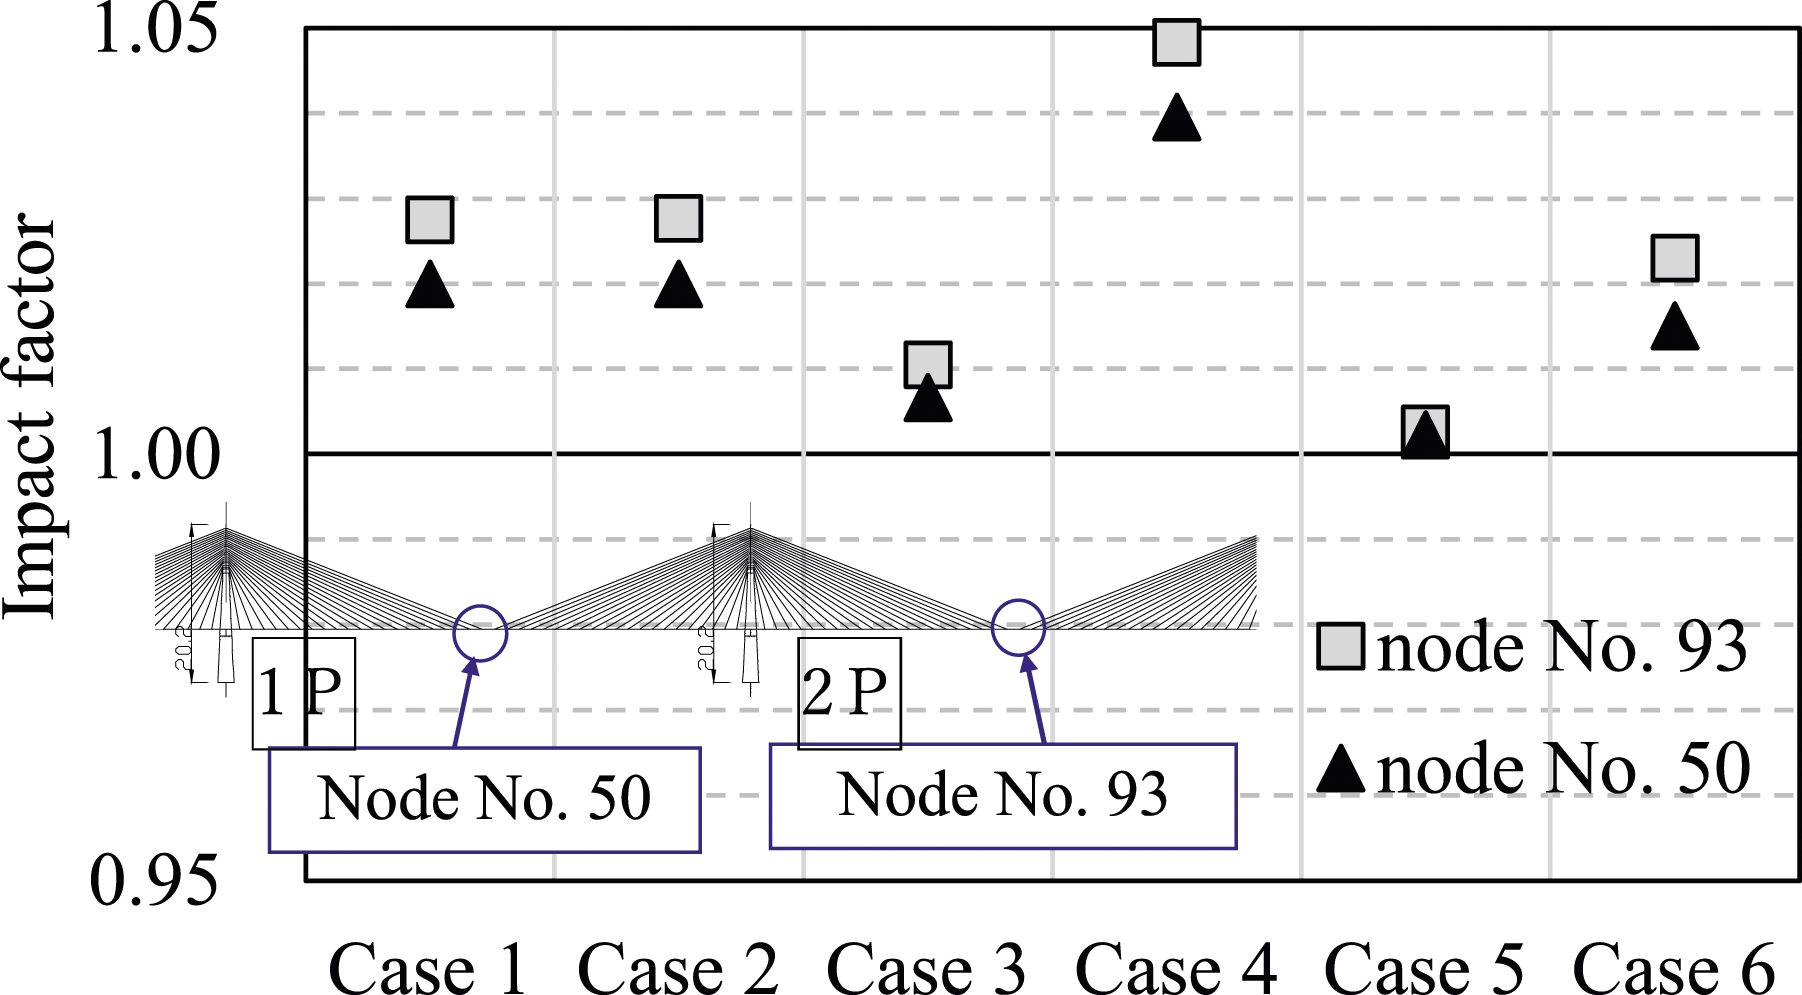
Conclusions
This study analytically investigated the vibration serviceability and impact factors of a seven-continuous cable-stayed bridge with maximum span length of 650 m, where the live load deflection is expected to be about 4 m. Three-dimensional traffic-induced vibration analysis for the bridge is used for the study. Observations through the study are summarized as follows.
Ride comfort of vehicles on the bridge
The ride comfort of vehicles on the bridge is investigated based on ISO 2613-1 for the evaluation of whole-body vibration exposure. Observations demonstrated that the vehicle response does not exceed the ride comfort limit irrespective of vehicle speed, roadway surface roughness condition, and the number of vehicles on the bridge. Although a large deflection is expected under the design live load, the influence of large deflections on ride comfort was negligible. That finding indicates that the natural frequencies and mode shapes of the bridge, the resonant headway distance and the number of vehicles travelling, and the road surface roughness condition are all interrelated. All affect ride comfort. The ride comfort evaluation method used for vehicles on the bridge in this study can be generalized to other cable-stayed bridges with similar designs. However, it is noted that random traffic loading and vehicle speed were not considered in this study. Moreover, validation of the study’s findings will be necessary, which will be investigated after the bridge is completed.
Impact factors
The impact factors were found to be less than 1.05 for the main girder, less than 1.03 for the base of the main tower, and less than 1.04 for the cable. The largest impact factor was obtained when several vehicles were running with resonant headway at higher speeds. Furthermore, the largest impact coefficients were observed when several vehicles were driven in resonant headways. In accordance with the impact factor defined in the Japanese highway bridge design code, i = 20/(50 + L), where L denotes the distance between cables in meters, the impact factor of this bridge is estimated to be 1.30. Through this study, the maximum impact factor was found to be 1.05, which was proposed for the design of the bridge, enabling the realization of a rational structural plan.
Footnotes
Declaration of conflicting interests
The author(s) declared no potential conflicts of interest with respect to the research, authorship, and/or publication of this article.
Funding
The author(s) received no financial support for the research, authorship, and/or publication of this article.