



Abstract
The intense forces imposed by earthquakes on structures can cause significant structural and non-structural losses if not properly planned and managed. It has been revealed that retrofitting structures constructed before the adoption of modern building codes can effectively reduce losses and mitigate earthquake impacts. This paper proposes a framework to quantify the effects of seismic retrofit solutions on: the global response of the structure, component-level damages (structural and non-structural components), loss estimation (including direct losses, based on economic-, social-, and environmental-losses, and indirect losses based on downtime), and resilience quantification (based on functionality loss and recovery model). This study focuses exclusively on retrofitting ground story columns and proved very effective when column capacities primarily control the structural behavior. The social, environmental, and indirect losses are converted into monetary value by using the value of statistical life (VSL), carbon pricing (CP), and relocation/rental price approaches, respectively. These are then incorporated into economic losses to compute total losses as a single value, aligning with the monetary factors prioritized by the funding agencies, insurance companies, and loan granting institutes. The resilience index is determined and the effectiveness of various retrofit alternatives is evaluated. A five-story reinforced concrete building is used as an example, and the methodology is applied. The results indicate that incorporating indirect losses and non-structural damage is crucial for risk and resilience assessments.
Keywords
Introduction
The recent devastating earthquakes, particularly in Turkey (2023) (Qu et al., 2023), Kaikoura (2016) (Ohara et al., 2023), Christchurch (2011) (Yonson et al., 2020), Chile (2010) (Fujisaki et al., 2014), and Italy (2009) (Augenti and Parisi, 2010) earthquakes, have revealed that the inadequate performance of structures can cause excessive damage. These earthquakes result in huge structural and especially non-structural damages, thus triggering to great amount of direct and indirect losses as a result of repair actions and downtime, respectively (Aljawhari et al., 2023; Gentile and Calvi, 2023; Omidian et al., 2024; Ozturk et al., 2023). These earthquakes have exposed the vulnerability of existing infrastructure, including non-code-conforming reinforced concrete (RC) frame structures (Han et al., 2024; Khansefid, 2021; Lin et al., 2024; Tavasoli Yousefabadi and Kazemi, 2024; Wu et al., 2024; Yi et al., 2020; Yuan et al., 2024). These structures are more prone to failure compared to contemporary code-conforming frame structures (Firoj et al., 2022; Joseph et al., 2022; Magliulo et al., 2023; Pereira et al., 2024), because of poor structural detailing during the design and construction phases (Gautam and Chaulagain, 2016; Zhang et al., 2024). Since a large portion of the existing infrastructure are affected, effective assessment techniques are needed to evaluate the potential collapse risks and compare various retrofit strategies (Ahmed et al., 2021; Levine et al., 2022; Ren et al., 2024; Sadeghi Movahhed et al., 2023). Gautam (Gautam et al., 2023) describes the significance of timely retrofitting such earthquake-vulnerable structures as one of the key attempts to ensure safety in seismically prone regions. Various traditional retrofit approaches (Cosgun et al., 2022; Falcone et al., 2022; Markou, 2021; Requena-Garcia-Cruz et al., 2021; Zhao et al., 2021), such as steel or concrete jacketing of columns and the provision of shear walls, have been offered (Di Trapani et al., 2020; Habib et al., 2020; Ozkul et al., 2019; Villar-Salinas et al., 2021) and can be utilized to achieve specific performance levels while mitigating direct and indirect losses. In this study, direct losses are referred to the direct effect of hazards that result in casualties and fatalities, damage to structures, components, and equipment. Indirect losses can be associated with consequential losses, which signifies the indirect result of property loss and/or damage, such as occupants relocation and rent charges [1]. An illustration of these earthquake-induced losses is presented in Figure 1 (where the highlighted ones are considered in the current study). Earthquake-induced losses in structure.
Both structural components (SCs) and non-structural components (NSCs) are equally important in the functionality of a structure, and a structure will be considered functional only if it fulfills the desired performance level (Cao et al., 2024; Jiang et al., 2024). The NSCs depend on the type of facility and vary considerably with the usage of the building. Thus, the list of NSCs will be different for a residential building compared to a commercial or office building. All the NSCs can be broadly classified into two main categories, i.e., acceleration-sensitive and drift-sensitive components. At the same time, most of the studies ignore the damages to NSCs and the resulting losses (more specifically, indirect losses) but focus more on the damages to SCs (Ahmed et al., 2018; Caglar et al., 2023; Gencturk et al., 2016; Kocakaplan Sezgin et al., 2024; Mitropoulou et al., 2011; Vuran et al., 2024). Contrarily, many other studies merely focus on the NSCs damages only, and ignore the most important aspect of SCs (Arshad and Konstantinidis, 2022; Cao et al., 2024; Mahsuli and Haukaas, 2013a, 2013b; Mohsenian et al., 2023; Perrone et al., 2022; Salari et al., 2022; Sullivan, 2020). Nevertheless, some of them focus only on the acceleration-sensitive NSCs (Mohsenian et al., 2023; Perrone et al., 2022; Salari et al., 2022) and ignore the drift-sensitive components, while others focus only on direct losses associated with the NSCs and ignore the indirect losses (Mahsuli and Haukaas, 2013a, 2013b; Sullivan, 2020). To address these gaps, damages of both SCs and NSCs (acceleration- and drift-sensitive components) and the resulting direct and indirect losses are considered in the current study.
The effects of damage in buildings extend from economic losses to social and environmental losses, such as casualties, fatalities, homelessness, and the release of harmful materials. In this study, the repair cost is taken as economic loss, the number of fatalities (deaths) is taken as social loss, CO2 emissions are taken as environmental loss, and downtime is taken as an indirect loss. Since all these losses are computed in different units, it is impossible to combine them in one single entity. However, researchers have used various strategies to unify the impact of these losses for decision-making purposes, for example, a normalization approach is used along with an appropriate weightage factor to derive a final loss value (Ahmed et al., 2019; Ahmed and Shahzada, 2020; Jia and Zhan, 2024; Xie et al., 2009), while others have used the ratio method, where indirect losses are computed as a ratio of direct losses (Calvi et al., 2021; Gentile and Calvi, 2023). This study uses a novel approach, where all the losses, i.e., economic, social, environmental, and indirect, are converted into monetary values and summed up to one single figure, as the funding agencies, insurance companies, and loan granting institutes mainly focus on the economic factor. Thus, this method provides a more relatable and comprehensive tool for decision-makers and stakeholders. The social losses are converted into monetary value using the value of statistical life (VSL) approach, environmental losses are converted using the carbon pricing (CP) approach, and indirect losses are converted using the relocation/rental price approach.
Seismic resilience of structures is also becoming very important these days (Anwar et al., 2020; Dong et al., 2022), as it deals with the losses encountered by the structure during the earthquake and the time required to recover its functionality (Cimellaro and Piqué, 2016). Generally, seismic resilience is measured by direct loss after the earthquake (FEMA, 1999; Mitrani-Reiser, 2007). FEMA P-58 (FEMA, 2012) uses the repair time approach where the cumulative repair time of all damageable components is computed and used as recovery time. REDI (Almufti and Willford, 2013) improves the concept of downtime computation, includes the potential or impeding delays along with the repair time of FEMA P-58, and defines the repair sequence. Various researchers (Abbasnejadfard et al., 2022; Ghosh et al., 2021; Kalemi et al., 2024; Kammouh et al., 2020; Lin et al., 2022; Salem et al., 2020) have proposed resilience calculation methodologies based on a probabilistic approach, and Burton et al. (Burton et al., 2016) developed a method for the recovery phase related to the building infrastructure. Lin and Wang (Lin and Wang, 2017a, 2017b) proposed a procedure for the recovery phase by combining structure-level restoration through probabilistic damage evaluation, which has also been used for the recovery estimation (Dong and Frangopol, 2016; Hashemi et al., 2019; Koliou et al., 2020; Masoomi and Lindt, 2019). Bruneau et al. (Bruneau et al., 2003) described resilience in terms of a recovery function, and the area under the recovery curve was defined as the resilience index. As resilience is estimated using the recovery function, quantification of this function for buildings is a crucial step that has not been fully explored yet. In the current study, the building and retrofit solutions have been investigated systematically based on site-specific hazard analysis, global response analysis, and component damage analysis.
This study proposes a performance-based assessment of RC buildings considering four retrofit techniques, i.e., Steel Plate Jacketing (SPJ), Steel Angles Jacketing (SAJ), Reinforced Concrete Jacketing (RCJ), and Engineered Cementitious Composite, i.e., ECC, Jacketing (ECJ). It aims to identify the impact of these retrifit on the seismic response of the building, reduction in component level damages, reduction of losses, and enhancement of the resilience. The key contributions of this study include: 1. A novel performance-based seismic retrofit assessment framework considering various damage levels for SCs and NSCs is proposed to determine direct and indirect losses (at various hazard levels) and enhance structures resilience. 2. The efficiency of the suggested retrofit strategies in improving the global structural performance by enhancing column capacities and story response is evaluated. 3. A total loss concept is developed, where direct (economic, social, and environmental losses) and indirect losses (due to downtime) are presented in monetary values for each retrofit solution. 4. The impact of non-structural damage in quantifying seismic resilience is assessed for retrofitted and unretrofitted structures.
Performance-based retrofit assessment framework
The loss assessment and resilience quantification can be performed using the performance-based evaluation procedure comprising structural analysis against ground motions. This study employs finite element analysis to study engineering demand parameters (EDPs), i.e., accelerations, velocities, drifts at distinct building floors [34]. These EDPs can be associated with the probability of collapse, repair, and damages to SCs and NSCs to the structures at respected natural hazard cases. Then, the damage assessment, loss estimation, and resilience improvements of the studied retrofit solutions could be estimated. The layout of the framework is presented in Figure 2, which integrates both structural and non-structural damage assessments, setting it apart from existing literature. It emphasizes a holistic approach to loss estimation, accounting for direct and indirect economic, social, and environmental losses to provide a complete assessment framework. Performance-based assessment framework to determine direct and indirect losses and resilience, including structural and non-structural damage for seismic retrofit options.
Response analysis of structure
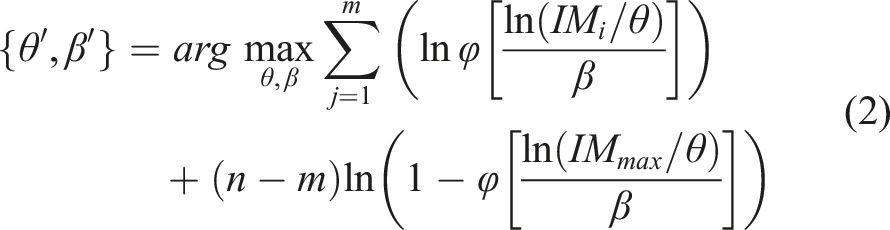
The structural analysis of a building necessitates the development of a numerical model that could offer EDPs given the seismic event. For that reason, a numerical model is needed that can calculate the approximated building response under extreme events through non-linear pushover analyses, time history analyses (THA), response spectrum analyses (RSA), incremental dynamic analysis (IDA), etc. The calculated responses regarding EDPs are employed to generate collapse fragilities, irreparable fragilities, and global response of the structure under increasing seismic hazard intensities. The collapse fragilities are used to estimate the collapse likelihood subjected to seismic events, irreparable fragility offers the possibility that a structure may be demolished or not, and global responses are used to calculate the SC and NSC damages (Jalayer et al., 2017; Zhang et al., 2024). There are several mathematical approaches to generate the fragility curves. The frequently employed ones include IDA, where a suite of seismic event records is chosen, and THA is performed with intensity measures (IM). The total collapses are calculated for all the analyses. The fragility curve is then estimated by employing the lognormal cumulative distribution functions (Calvi et al., 2006), represented as:



Damage analysis of components
The damage study interprets the EDP in terms of equivalent tangible damage states (DSs). Damage levels sustained can vary by components, even for a similar EDP. This is primarily due to variances in response history and subsequently altered path of reaching the same EDP value. Furthermore, uncertainties related to the variation in quality control, material properties, failure pattern, and other aspects persuading the damage extent suffered by a component are counted in the analysis. It should be noted that the uncertainties are exclusively asscoaited with damage initiation of an EDP function and are independent of uncertainties related to the IM or the estimation of EDP.
DSs are described depending on the level of damage, conforming to the repair actions required to restore the component to its initial condition, thereby they are associated with the sustainability pillars. To describe the DSs, components are merged into performance groups (PGs) that EDP impacts similarly. An adequate number of DSs should be identified for every group to define the extent of probable damage at distinct amounts of EDP. For example, two DSs can be specified conforming to slight and significant damages of a PG that comprises the RC columns in a building, prevailing soft-story failure mechanism, along with acceleration- and drift-sensitive NSCs, e.g., HVAC, fire sprinkler, curtain walls.
The damage probability for an EDP is considered by the limit state functions:

Loss analysis
The loss analysis utilizes the DSs to calculate the decision variables (DVs). In the current methodology, multiple DVs are employed that are associated with the repair aspects (in terms of social, economic, and environmental) considering no damage, minor, and major damage states of the SCs and NSCs. They comprise repair cost (economic metric), fatalities (social metric), CO2 emissions (environmental metric), and repair time (indirect cost). This study proposes a total monetary loss concept, where the social, environmental, and indirect losses are converted into monetary values. This approach can be more practical since all the funding agencies, insurance companies, and donors care about the monetary values and deals involved in it. The overview of the total loss model in monetary value is presented in Figure 3. Total Loss model in monetary values.
Quantification of direct (economic, social, and environmental) losses
The term economic loss here represents the repair cost of structure associated with the DSs of various SCs and NSCs. The average overall repair cost is estimated by adding the expected repair cost of all damageable components under various hazard levels. By considering mutually exclusive events of structural ‘collapse’ and ‘no collapse’, the average of total economic losses


The social losses (fatalities) are defined by assembling the population model, as well as specifying the casualty function and the population at risk. The social losses (i.e., fatalities) can be found using the following equation:

The environmental losses in terms of equivalent CO2 emission are described as:

Carbon pricing (CP) is among the most prevailing tools offered to legislators to convert environmental losses into economic losses. Thus, the total direct losses in terms of monetary value, can be given by using the following equation:

Quantification of indirect losses
Although direct losses are certainly of great importance, the aptitude for indirect losses can be of substantial impact and sometimes become greater than the resultant direct loss. Thus, the consideration of indirect losses is essential and has been lacking in any major consideration in the literature. To handle this problem, the method adopted here is based on downtime estimation and the association of various factors with the downtime in terms of monetary losses. Equation A1 to A9 (in Supplemental Appendix A) provide the complete methodology for quantifying the indirect losses.
Total losses
The total loss estimation approach can systematically measure the losses due to seismic activity from multi-faceted prospects and can be recognized by the simple addition of the total direct losses

Equation (11) finally gives the total losses by incorporating social, environmental, and indirect losses into economic losses.
Seismic resilience quantification
The adopted scheme of seismic resilience quantification is presented in Figure 4. The functionality of a structure during a seismic event and its complete recovery after the earthquake can be opted for functionality indicator while evaluating the recovery function. The functionality curve offers the level of performance at the considered time and its recovery to complete functionality after the earthquake. Seismic resilience quantification procedure of structures.
Functionality model
The functionality function for the reference building as well as various retrofitting alternatives is obtained, using the defined recovery function. The functionality function Q(t) in terms of resilience is described as follows:

The occurrence time of the event (i.e., earthquake in this case) is termed as tOE, the structural recovery time is termed as TRE, the Heaviside step function is designated as H (), and toi is the initial delay in the recovery course. In this work, tOE (time of occurrence of extreme event) is assumed at 50 days, with different TRE and total control time (t). The functionality of the structure before the extreme event (Qo) and following the recovery (Q T ) are assumed to be 1 for simplicity in this study. The recovery models considered in this study are presented next.
Recovery model
The functionality of a structure rapidly drops when hit by an earthquake, and depends upon the cumulative damage state of all the components of the structure. Three distinct recovery models frec(t) (linear, exponential, and trigonometric) are used to model the recovery route for various situations, expressed as:



The adopted recovery models are straightforward, and they can define the vigorous recovery course. Recovery models with various factors are presented in Figure 5 to demonstrate the impacts of the factors. At lower Sa values, lower loss is likely, and lesser loss signifies greater robustness of the building. Functional recovery models considering various parameters: (a-c) the linear model, (d-e) the exponential model, and (g-i) the trigonometric model.
For all three models (Figure 5), the researchers usually explore two conditions where the same functionality loss with different recovery times, like in Figure 5(a), (d) and (g), and other functionality losses with the same recovery time like in Figure 5(b), (e) and (h) are considered. The rate of recovery (slope of the recovery path) is different. Both cases have their applications and advantages, but both may not to be practical as compared to the third case, which is considered in this study, where instead of the same functionality loss or same recovery time, the same recovery rate is used (Figure 5(c), (f) and (i)). This concept seems to be more practical, where a lower functionality loss structure requires less time to recover compared to the higher functionality loss structure, which requires more time to recover. Thus, the trigonometric model may be the most accurate and practical as compared to the other two (i.e., linear and exponential), since at the beginning of the restoration/recovery, the process would be slow, and once the work starts, the process boosts and the progress pulls off faster. Based on the current discussion, the model in Figure 5(i) (i.e., the trigonometric model with the same recovery rate) will be used in the resilience quantification of the structure. Badal and Tesfamariam (Badal and Tesfamariam, 2023) adopted a similar approach in their study, where a constant recovery function was proposed for Vancouver city for 3-, 6-, and 9-story RC buildings subjected to earthquakes with near and far field scenarios. They proved this function to be the most effective among others. Other researchers (González et al., 2023; Kalemi et al., 2024) have also reported similar results.
Resilience index
Finally, the seismic resilience index can be calculated by integrating the functionality curve over time, as presented in equation (16):

Case study
Model description and retrofitting strategies
The selected RC frame structure is a five-story building in Abbottabad City Pakistan. The numerical model generated for the building is presented in Figure 6. The building was designed before the modern seismic codes, and therefore, many structural deficiencies were encountered. For instance, no shear wall was provided for the lateral load resistance mechanism. Thus, a soft story mechanism is encountered in the analysis, so the retrofitting was applied to the ground floor columns only. Concrete with 20 MPa strength and steel of 276 MPa yield strength is considered in the modeling assumptions based on the recommendations given in ASCE/SEI-41-13 (ASCE, 2014). Demonstration of the numerical model, highlighting the modeling of frame member behavior, plastic hinge behavior, and loading and boundary condition.
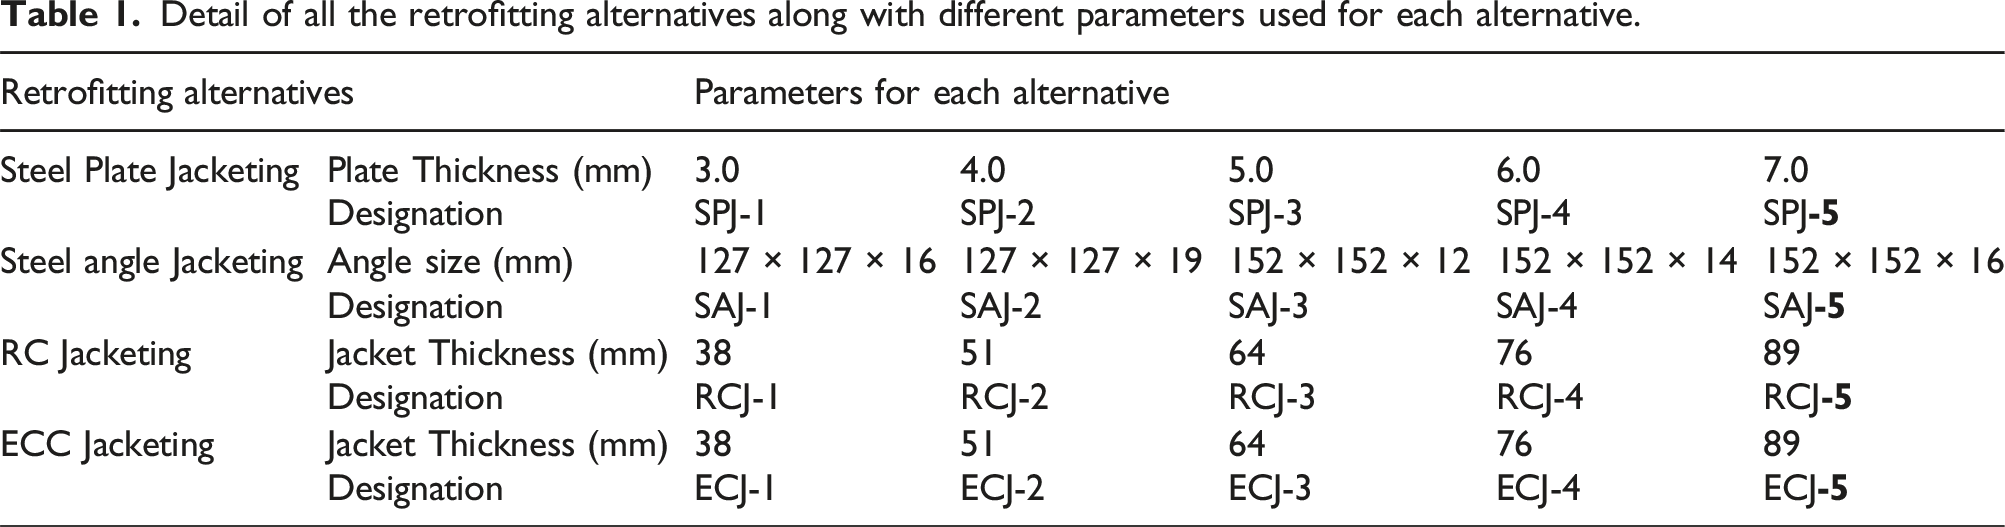
The retrofitted columns considering all four retrofitting strategies, i.e., RCJ, SPJ, SAJ, and ECJ, are shown in Figure 7. The material models used for steel, concrete, rebars, and ECC are presented in Figure 8. The improvement of the cross sections is assumed by the FEMA-547 (FEMA, 2013) guidelines and ASCE/SEI-41-13 (ASCE, 2014) suggestions. Twenty-one models are generated, including the reference model and twenty retrofitted models (i.e., five options for each alternative as presented in Table 1). Various seismic retrofitting alternatives adopted in the study, (a) SPJ, (b) SAJ, (c) RCJ, and (d) ECJ. Material models used to describe (a) steel, (b) concrete, (c) rebar, and (d) ECC. Detail of all the retrofitting alternatives along with different parameters used for each alternative.

The FE models are generated in the finite element analysis “ETABS V21.2” (Strcutures, 2021), and the material models already available in the software are used for rebars, concrete, and steel. The material model is defined for the ECC material according to Bora and Elnashai (Gencturk and Elnashai, 2013).
Global response analysis
It can be stated that the retrofit strategies enhanced the load and deformation capacity of the structure, thus increasing their ductility and energy dissipation capacity, and making them less vulnerable to earthquake demand. Figure 9 shows that the SPJ alternative gives better performance than the other 3 alternatives, followed by SAJ and RCJ alternatives, where SAJ gives better strength enhancement. However, the RCJ performs better in enhancing the total deformation capacity. Load Deformation curve in the longitudinal direction for (a) SPJ retrofit, (b) SAJ retrofit, (c) RCJ retrofit, and (d) ECC retrofit, all are compared with the reference model.
Figure 10 presents the story shear at the peak lateral response of the structure, highlighting the important outcomes: First, the story shear value is enhanced the same amount for all the stories above as for the retrofitted story, regardless of the retrofitting strategy adopted. This indicates that enhancing the ground floor columns strength also affects the load distribution and makes the columns of the above stories take more load and utilize their capacity. Hence, it increases the overall strength of the whole structure and makes it less vulnerable to seismic loads. Second, the enhancement in the story shear is the same for all the stories. If the story shear of the first story is doubled with SPJ-5, then the story shear of all other stories is also doubled, and the same kind of response is observed for all kind of retrofitting alternatives. The response analysis study (Figures 9 and 10) makes it very clear that retrofitting is proven to be very effective in enhancing the global performance, particularly when column capacities and story response primarily control behavior. Story shear at peak lateral response for the reference building compared with (a) SPJ, (b) SAJ, (c) RCJ, and (d) ECJ retrofitting alternatives.
Quantification of structural response based on collapse fragility function
In this case study, a suite of 22 earthquake records was used to create the collapse fragility, performing THA on generated numerical models and chronologically raising the IMs of earthquakes following an IDA procedure. The details of the chosen earthquakes are provided in Table A1. The peak floor response is denoted as a point in Figure 11(a) and (b). 22 points are presented for each floor denoting inter-story drifts (IDRs) and peak floor acceleration (PFA) under chosen earthquake histories with an IM of 0.4 g. Then, the IMs are modified, and THA is conducted to get IDRs for building models. THA results (reference model) at 0.4 g regarding (a) max. inter-story drift, (b) peak floor accelerations, and (c) demonstration of IDR (%).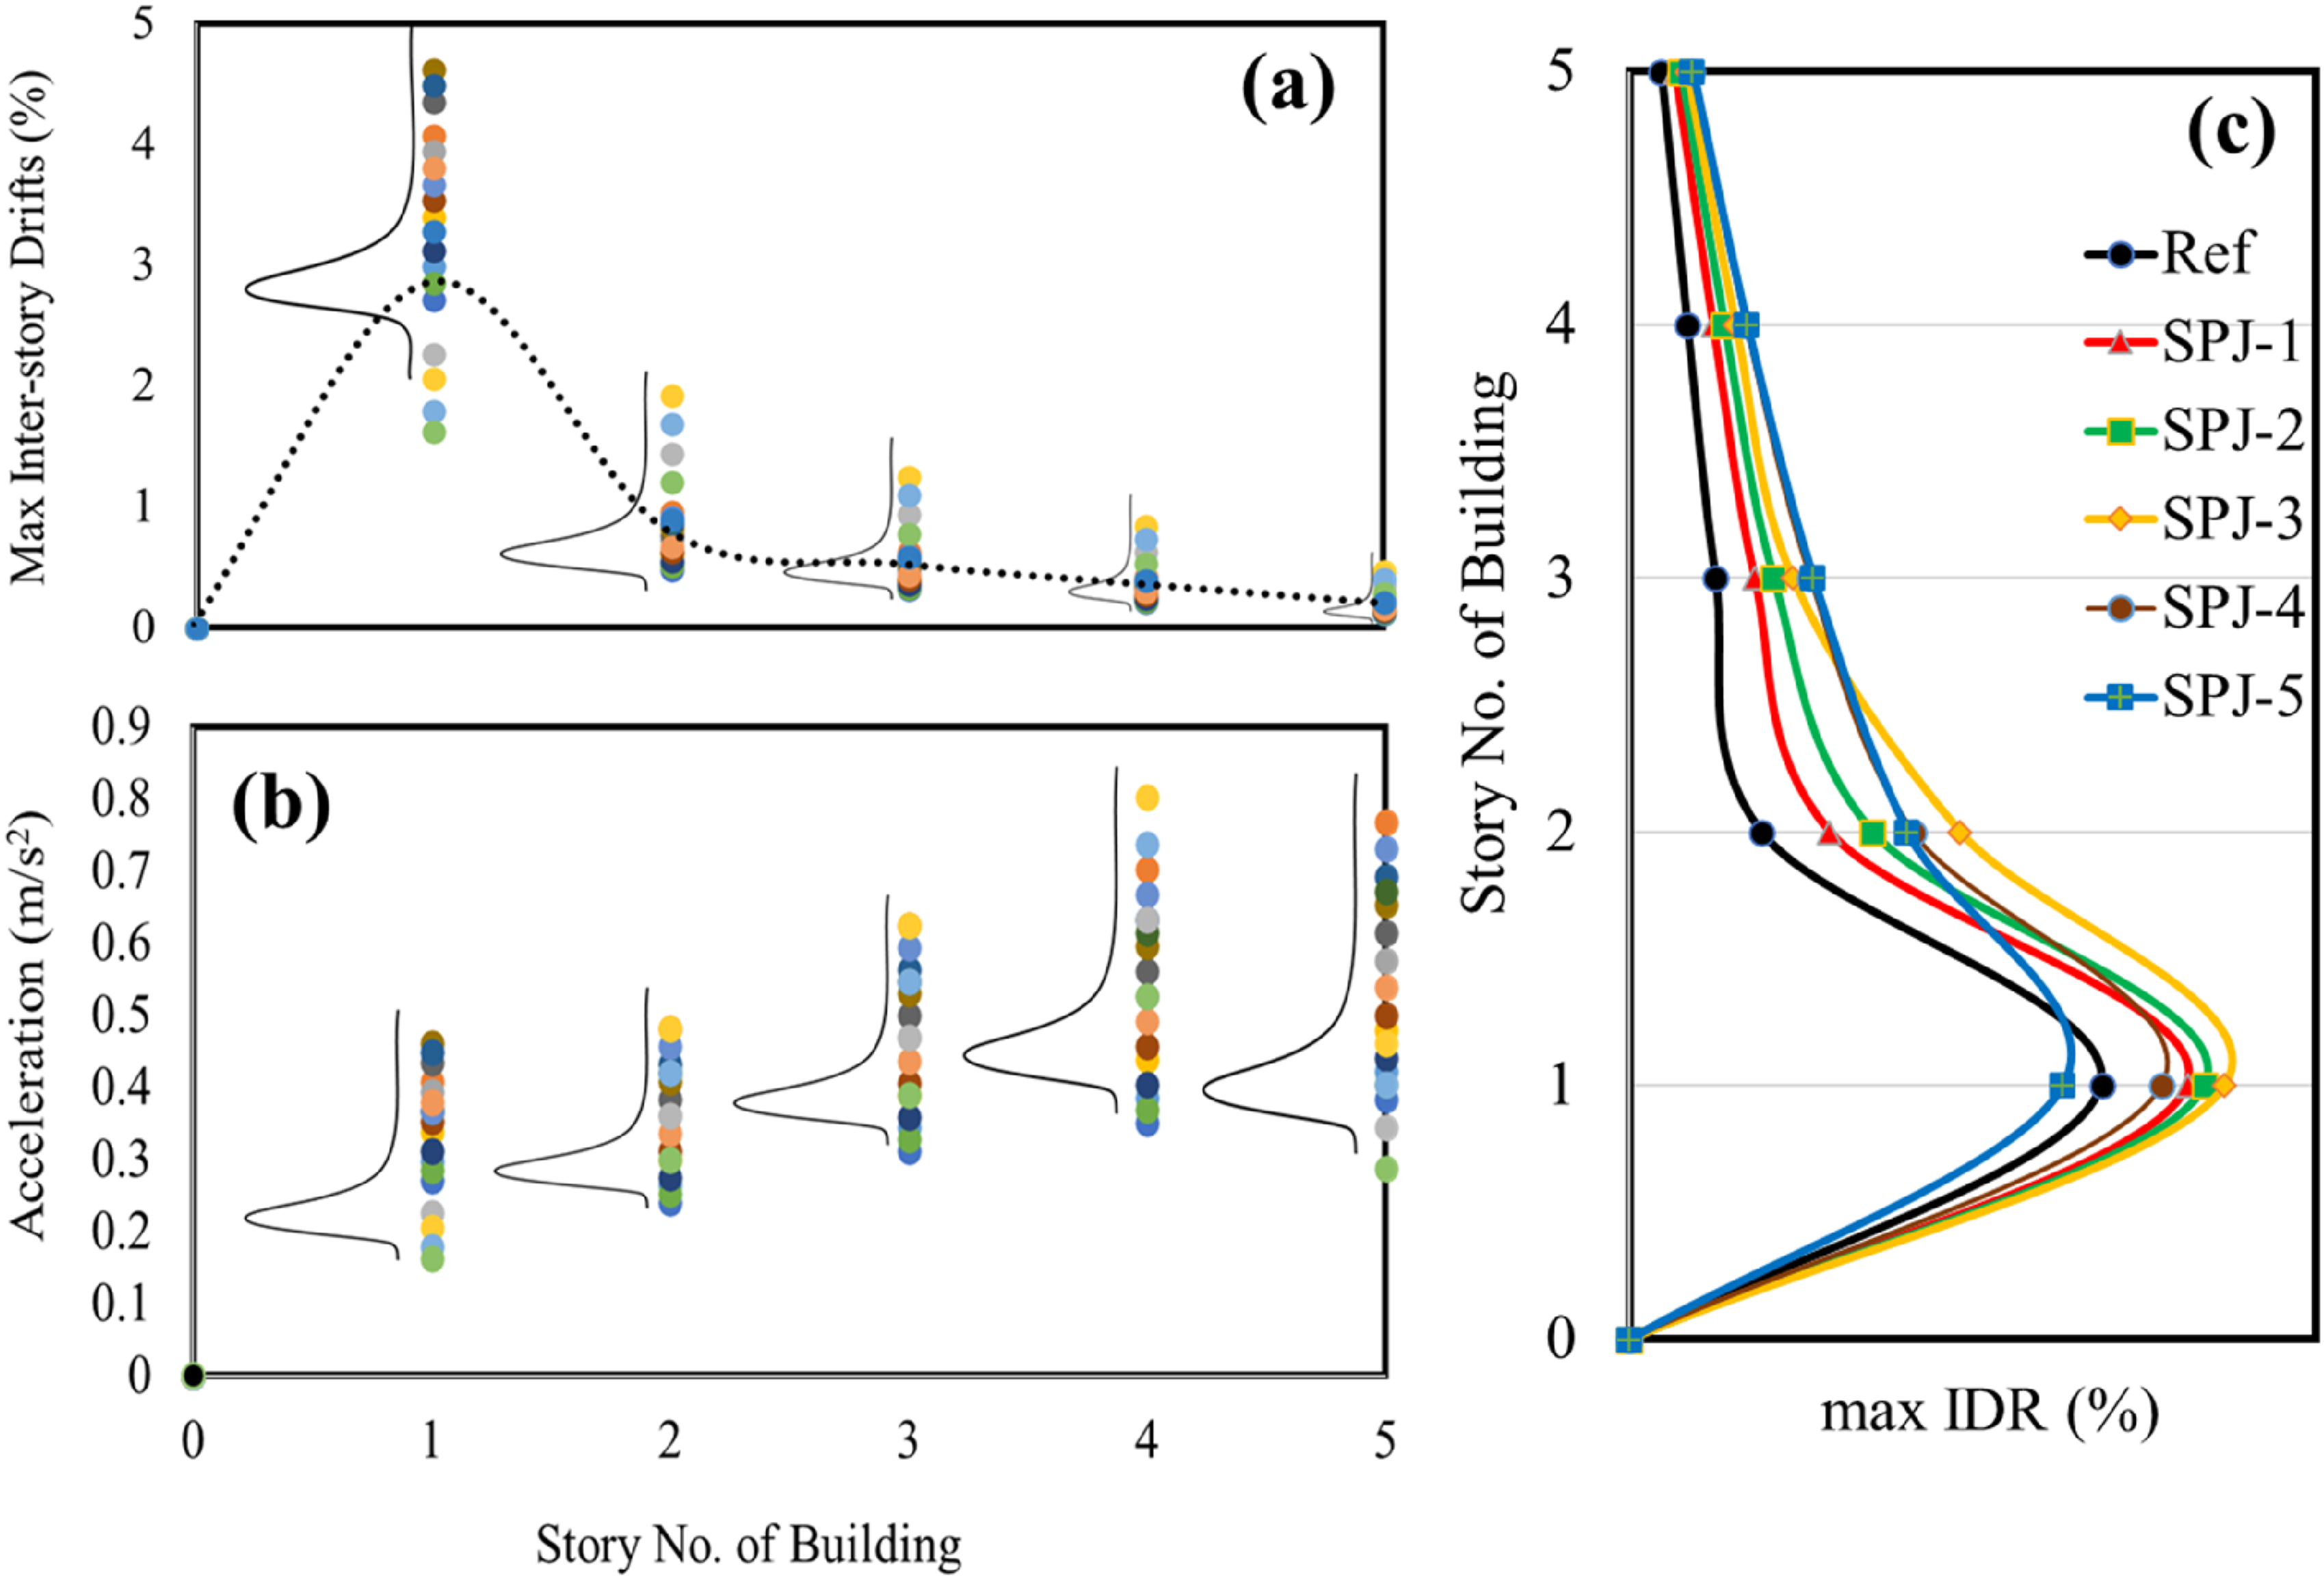
Figure 12(a) presents the results of IDA conducted on the reference model, focusing on various IMs up to the specified PGA of 2g, considering the 22 earthquake scenarios. This analysis assumes that the structure may collapse due to two main factors: numerical instability encountered during the analysis process and significant drift experienced by the structure. The findings indicate that as the levels of IMs increase, there is a corresponding rise in the collapse ratio. This suggests that higher-intensity measures contribute to a greater likelihood of structural failure. Notably, the reference model exhibits the highest collapse ratio compared to other evaluated configurations. However, when various retrofit strategies are implemented, there is a marked reduction in the number of collapses, demonstrating that specific retrofitting techniques can effectively enhance the structural resilience, although the extent of this reduction varies with each retrofit option applied. Furthermore, a lognormal cumulative distribution function is constructed to statistically characterize the collapse behavior based on the total number of collapses analyzed for the different IMs. This statistical representation utilizes the maximum probability method, as detailed in equations (1) and (2). This method calculates fragility curves for each of the retrofit models examined, representing the relationships between the IMs and the probability of collapse. The results of these calculations are visually summarized in Figure 12(b)–(e), which provide further insights into the performance of the retrofitted models under varying levels of seismic intensity. For the five-story case study building, (a) incremental dynamic analyses results, and collapse fragilities for all retrofitting alternatives (b) steel plate jacketing, (c) steel angle jacketing, (d) RC jacketing, and (e) ECC jacketing, compared to reference model.
Before proceeding to the estimation of component level damages, it was decided to select one optimal case out of five options for each retrofit alternative. Therefore, the cost of retrofit along with CO2 emission are evaluated for all the retrofit materials with selected thicknesses.
Retrofit cost and CO2-emission comparison
To compute the installation costs of each retrofitting option, the local market rate system (MRS) MRS-2022 (Bi-Annual) from Pakistan (MRS, 2022) was utilized, and the results were subsequently converted into USD for a broader understanding of the cost impact. The analysis included the costs associated with concrete and steel for reinforced concrete (RC) jacketing, as well as all related services. Additionally, it factored in the costs of steel plates along with welding and associated services, using data from MRS-2022 directly. It is important to highlight that this analysis was carried out in 2024, considering inflation rates.
Cost comparison of all retrofit strategies (in USD).

Kg-CO2 emission of all retrofit strategies.

Quantification of component level damages
After generating the collapse fragilities for the building, the following phase is to establish a performance model of the building that contains collapse fragility (of structure) and damage fragility (of component) functions, population models, estimate of total SCs and NSCs, and consequence functions of the distinct SCs and NSCs of the building and are obtained from relevant studies (Mitrani-Reiser, 2007; Mitrani-Reiser et al., 2012). For example, FEMA (FEMA, 2012) gives a wide database of the damage fragility of several SCs and NSCs that has been employed in this study to evaluate the component level damage provided by specific global responses of the structure. The studied SCs are drift-sensitive and the NSCs include HVAC, sprinklers, ceiling, access floor, lighting, partitions, and curtain walls and that includes both acceleration- and drift-sensitive functions (as shown in Figure 13). Fragility curves for various NSCs, i.e., acceleration-sensitive (a) HVAC, (b) sprinkler, (c) ceiling, (d) access floor, (e) pendant lighting, (f) control panel, and drift-sensitive (g) curtain walls, (h) partition walls.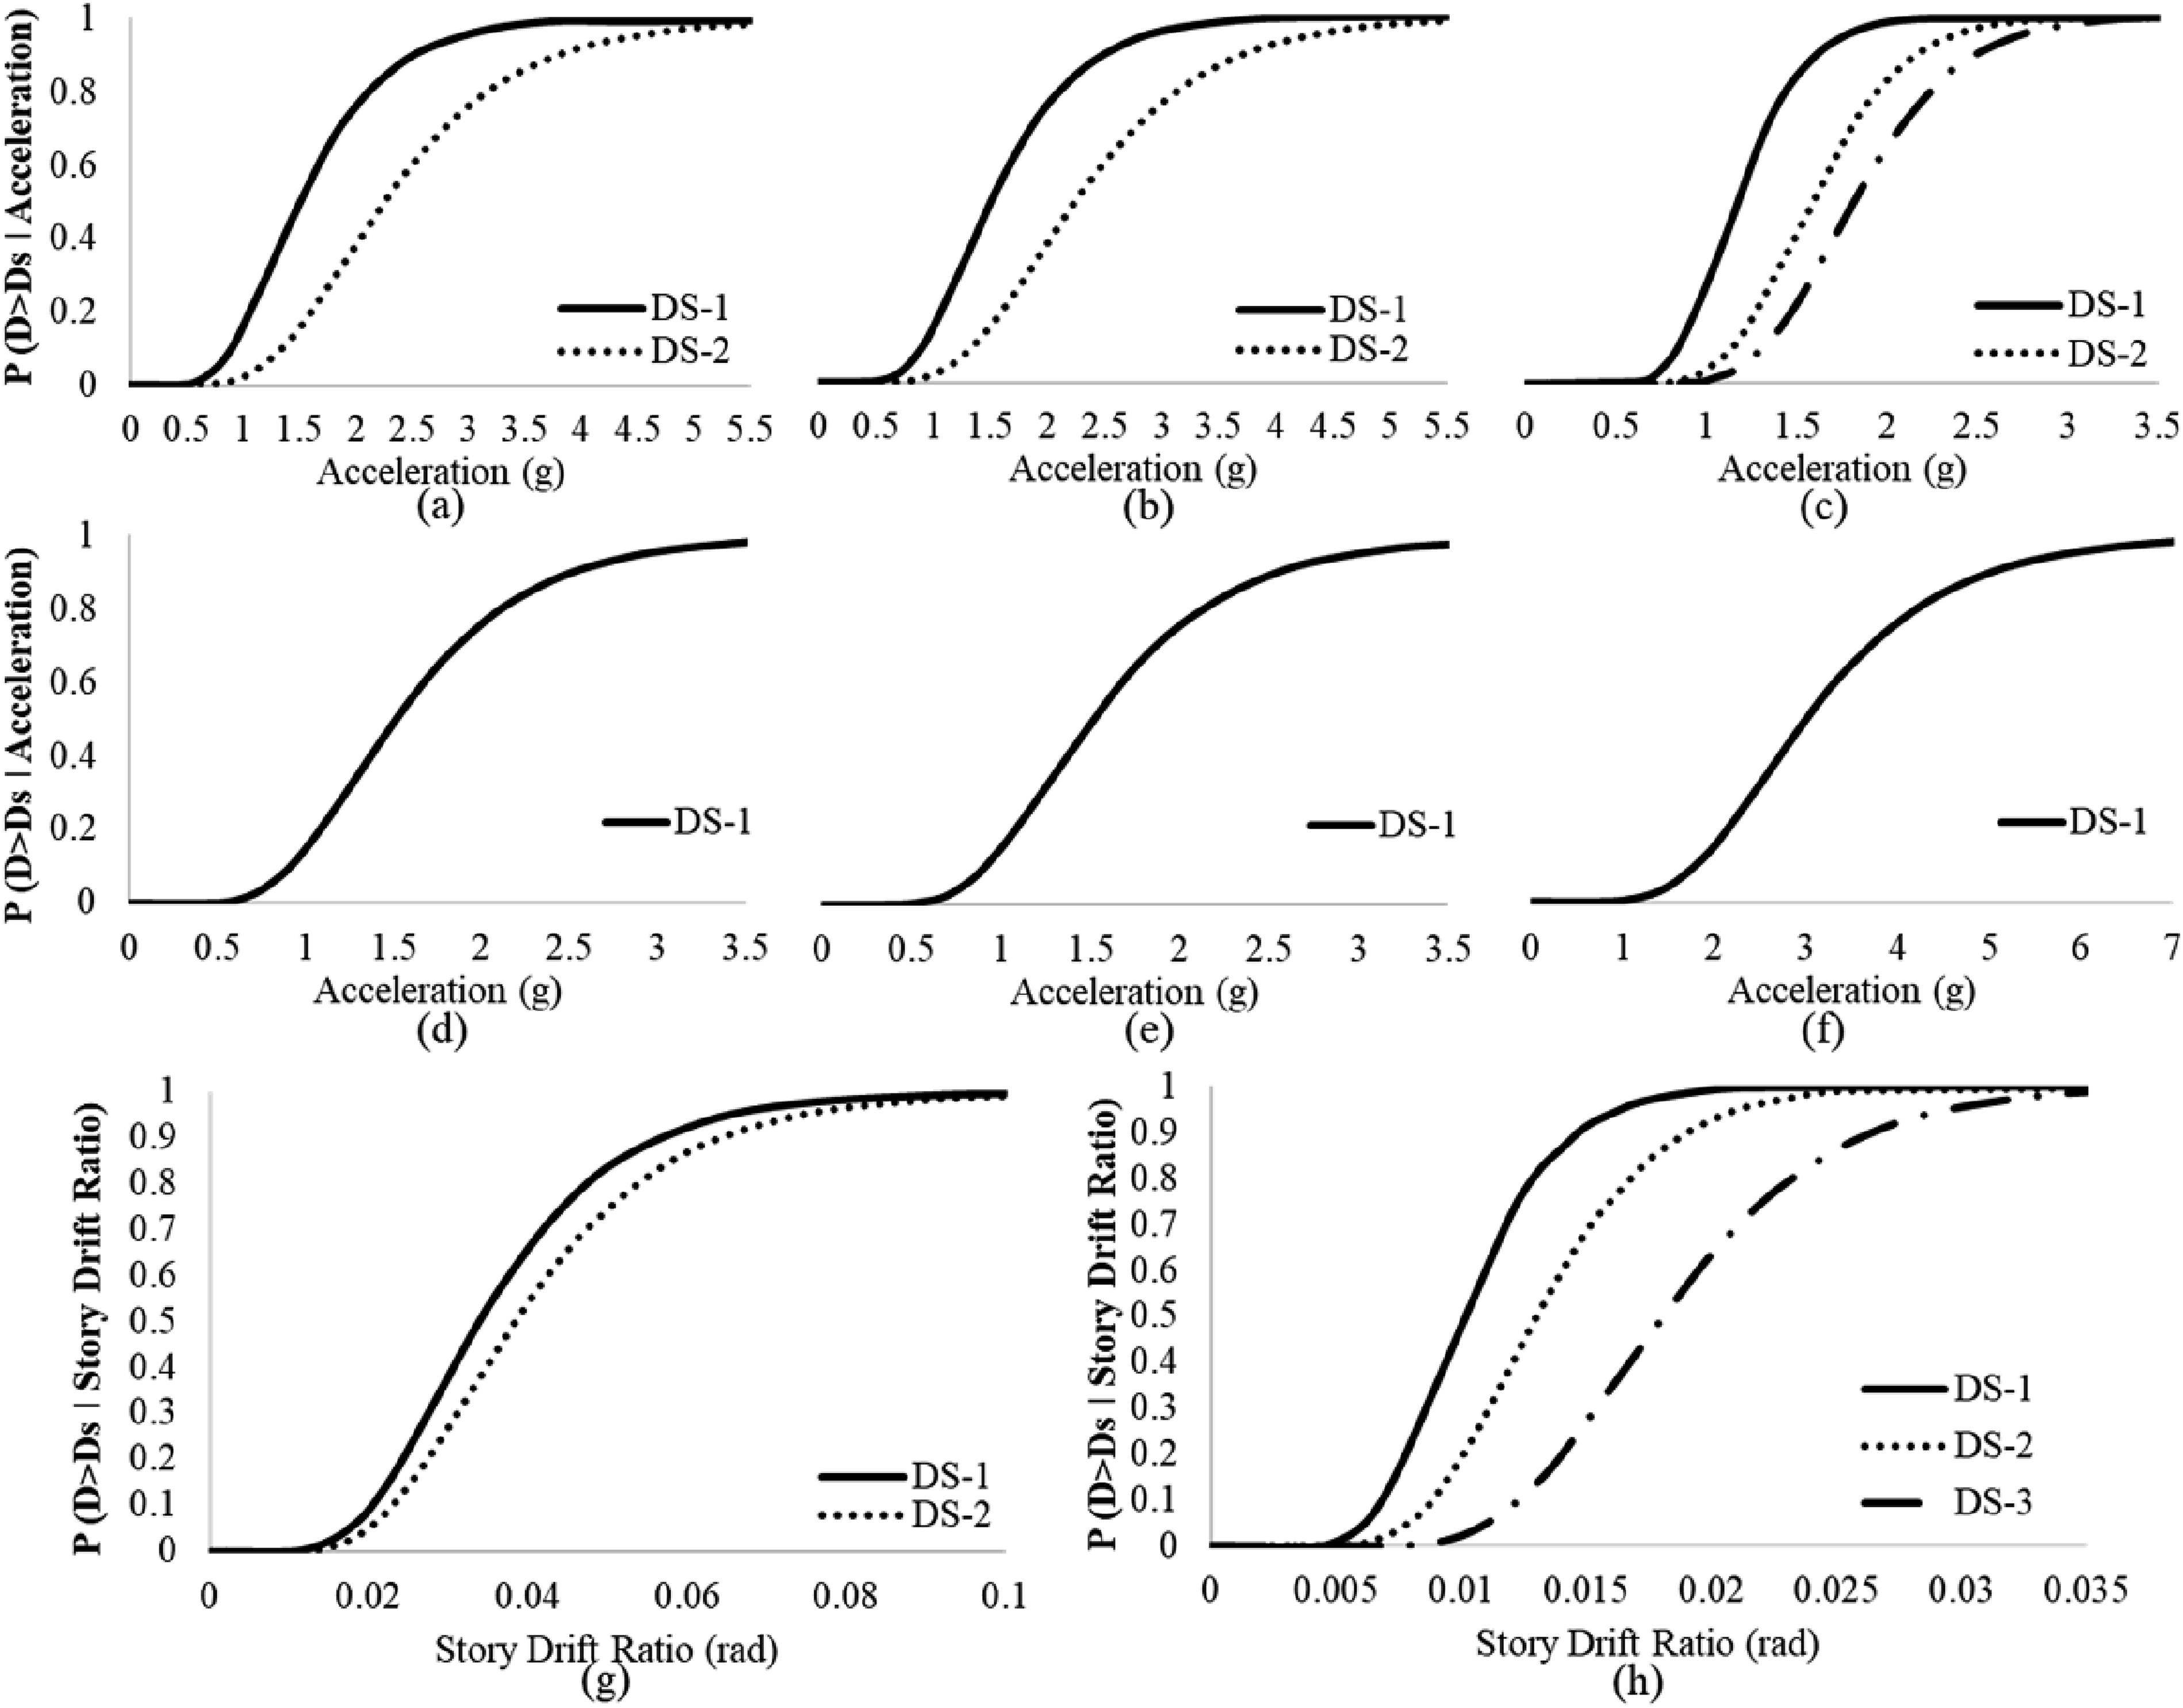
List of seismic hazard details used for the consequence assessment.

The component level damages, i.e., damage/collapse of SCs or NSCs, are presented in Figure 14. Details of damage states for NSCs are shown in Table A2. At lower values of Sa, approximately all the damages are due to NSCs since they are more vulnerable for the non-retrofitted case. As the intensity level rises, the ratio of structure to non-structure damages also increases, reaching the maximum threshold value at Sa of 0.861 g for the reference structure. However, for the retrofitted case, the threshold value does not reach until the last considered intensity level i.e., 1.156 g, thus indicating that all the structural elements do not completely damage. Thus, it can be concluded that NSCs are vulnerable components that can be damaged at even low-intensity levels and can cause disruption of the functionality of the building. Economic losses due to SC and NSC damage (as a percent of total economic loss) at each intensity level, for (a) reference (un-retrofitted) structure and, (b) retrofitted structure.
In addition to the distribution of components in SC and NSC categories, the NSCs were further distributed into drift- and acceleration-sensitive elements. The damages associated with the non-structural elements only are presented in Table A3 where story-wise % damages of each category (i.e., drift-sensitive, and acceleration-sensitive) of NSCs are determined for various intensity levels (i.e., Sa (g)). For example, on the 1st floor with Sa of 0.71 g, 100% of story drift-sensitive NSCs were damaged, 53.85% of acceleration-sensitive NSCs were damaged, and 75% of all NSCs on that floor were damaged considering both drift- and acceleration-sensitive elements. A relation of non-structural damages with the Sa is shown in Figure A2.
Loss analysis
The building performance model contains fragility curves that associate certain demands with the damage probability. Then, consequence functions interpret those damages into losses. Thus, social, economic, and environmental losses are estimated using collapse fragilities (global response) along with damage fragility (component response) and consequence functions following equations (6)–(9). The consequence functions opted for the case study are given in Table A4. The fatality rate and injury rate for the proposed RC frame was 0.9 and 0.1, respectively, which specifies that 90% will endure fatalities during the failure, and the remaining 10% will face major injury (FEMA, 2012).
Direct (economic, social, and environmental) losses
The normalized economic losses (LC) for the reference structure are presented in Figure 15(a). LC increases with the increase of Sa, and the rate of increment becomes smaller beyond 0.566 Sa. By increasing the Sa (g), the damage also increase, thus, causing an increase in economic loss. For instance, the LC are 0.75 and 0.99, respectively, when the Sa (g) are 0.419 g and 0.714 g. The economic losses for all the models with and without retrofitting, are presented in Figure 15(b). As seen, the repair cost for the reference building is always higher than the retrofitted ones, as also predicted by (ASCE, 2014; Desprez et al., 2015; Gaetani d’Aragona et al., 2018). Up to Sa of 0.566 g, the retrofit structures offer a reduction in losses, as the SEs are intact and not damaged completely. However, at Sa of 0.861 g and beyond, the economic losses of retrofitted models also become equal to the reference model, the retrofitting is effective till 0.714 g. Among the retrofit alternatives, the difference is not substantial, and the reduction in losses is almost similar for all the retrofit solutions. (a) Normalized economic losses (considering the direct repair costs only) for reference structure at various intensity levels, and (b) direct economic losses for reference structure along with four retrofit alternatives, for various intensity levels.
The direct social losses computed in terms of fatalities (i.e., deaths only) using equation (8), are presented in Figure 16. The normalized social losses (Ls) for the reference structure are presented in Figure 16(a). Ls is nearly zero at lower Sa values i.e., at 0.1 g and less, signifying that the losses are low enough to be ignored, as compared to the losses at higher Sa values, as also reported in the literature (Gencturk et al., 2016; Ozturk et al., 2023). Figure 16(b) presents the social losses along with the considered retrofit solutions for various intensity levels. The casualties encountered for the reference building are always higher than the retrofitted ones, as also predicted by (Ahmed et al., 2021; Gentile and Calvi, 2023; Rossi et al., 2022). The social losses can be considerably reduced by applying proper retrofit action. For example, at Sa of 0.419 g, the number of fatalities is 48, whereas SPJ, SAJ, RCJ, and ECJ show 69%, 65%, 65%, and 60% reduction in the total fatalities, respectively. (a) Normalized social losses (considering the fatalities only) for reference structure at various intensity levels, and (b) no. of casualties for reference building along with four retrofit alternatives, for various intensity levels.
The direct environmental losses computed using equation (9) are presented in Figure 17. The normalized values of environmental losses (LE) for the reference structure are presented in Figure 17(a). The direct environmental losses also increase by increasing the Sa, and a quick growth rate can be seen in relatively lower Sa (i.e., 0.124 g to 0.566 g). At Sa of 0.714 g, the LE value reaches 0.96 and beyond that point, it tends to become flat and becomes 1. The environmental losses for retrofitted and non-retrofitted structure cases are presented in Figure 17(b). The CO2 emission for the reference building is always higher than the retrofitted ones, as also shown by (Imperiale and Vanclay, 2021; Siddika et al., 2020). For Sa up to 0.419 g, the retrofitting offers a considerable reduction in the environmental losses. For instance, at 0.419 g, the reduction by SPJ, SAJ, RCJ, and ECJ are 23%, 21%, 21%, and 19%, respectively. (a) Normalized environmental losses (considering the CO2 emissions only) for reference structure at various intensity levels, and (b) CO2 Emission (in tons) for reference building along with four retrofit alternatives, for various intensity levels.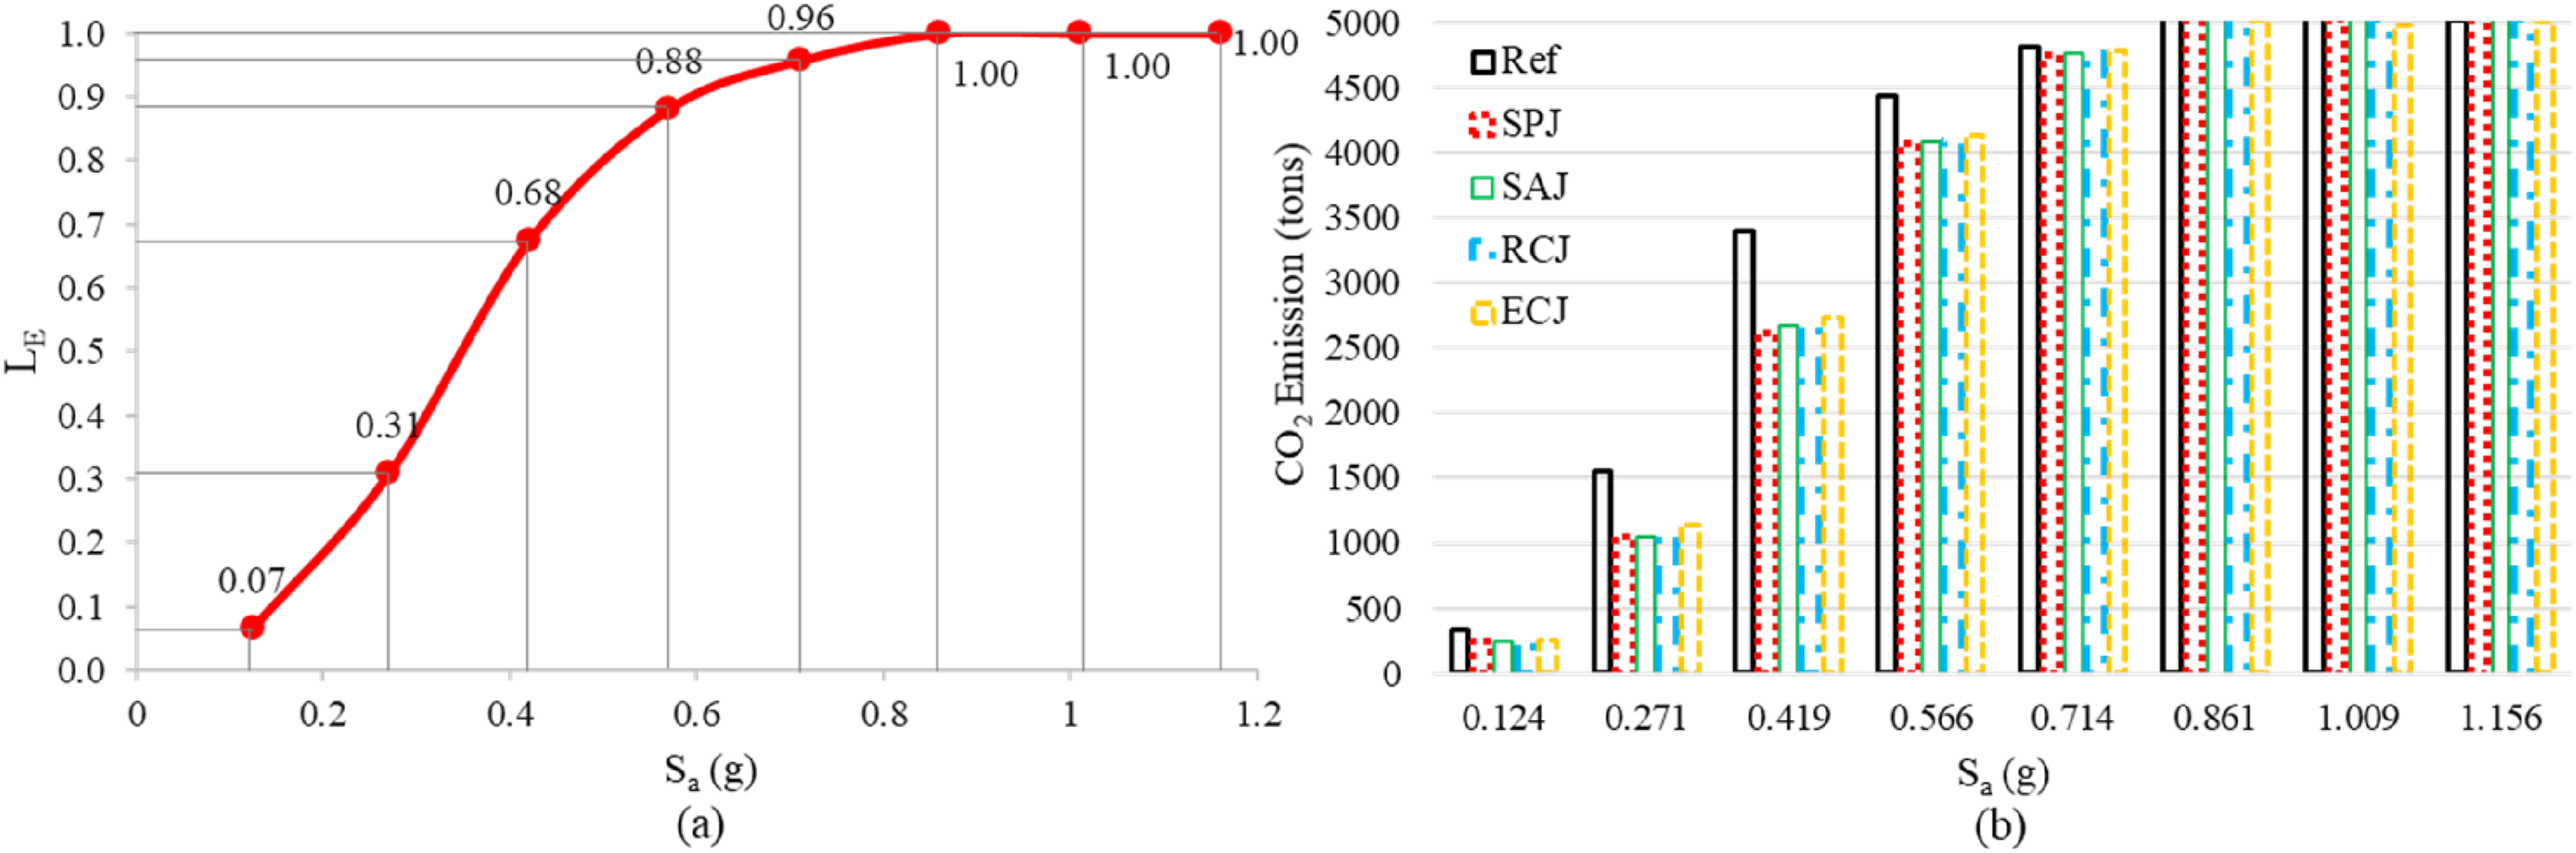
The social and environmental losses were also converted to monetary values and added with the direct economic losses using equation (10). This study takes the value of $0.2 million as VSL (Muhammad, n.d) and CP value of USD 0.2/kg of CO2 and the results are added with the economic losses to determine the total direct losses. The breakdown of total direct losses into economic, social, and environmental terms is presented in Figure 18(a) for the reference building. A comparison of total direct losses of reference building with the retrofit cases at all the hazard levels is presented in Figure 18(b). (a) Distribution of Total Direct losses for reference building considering various intensity levels, and (b) direct losses in terms of USD for reference building along with four retrofit alternatives, for various intensity levels.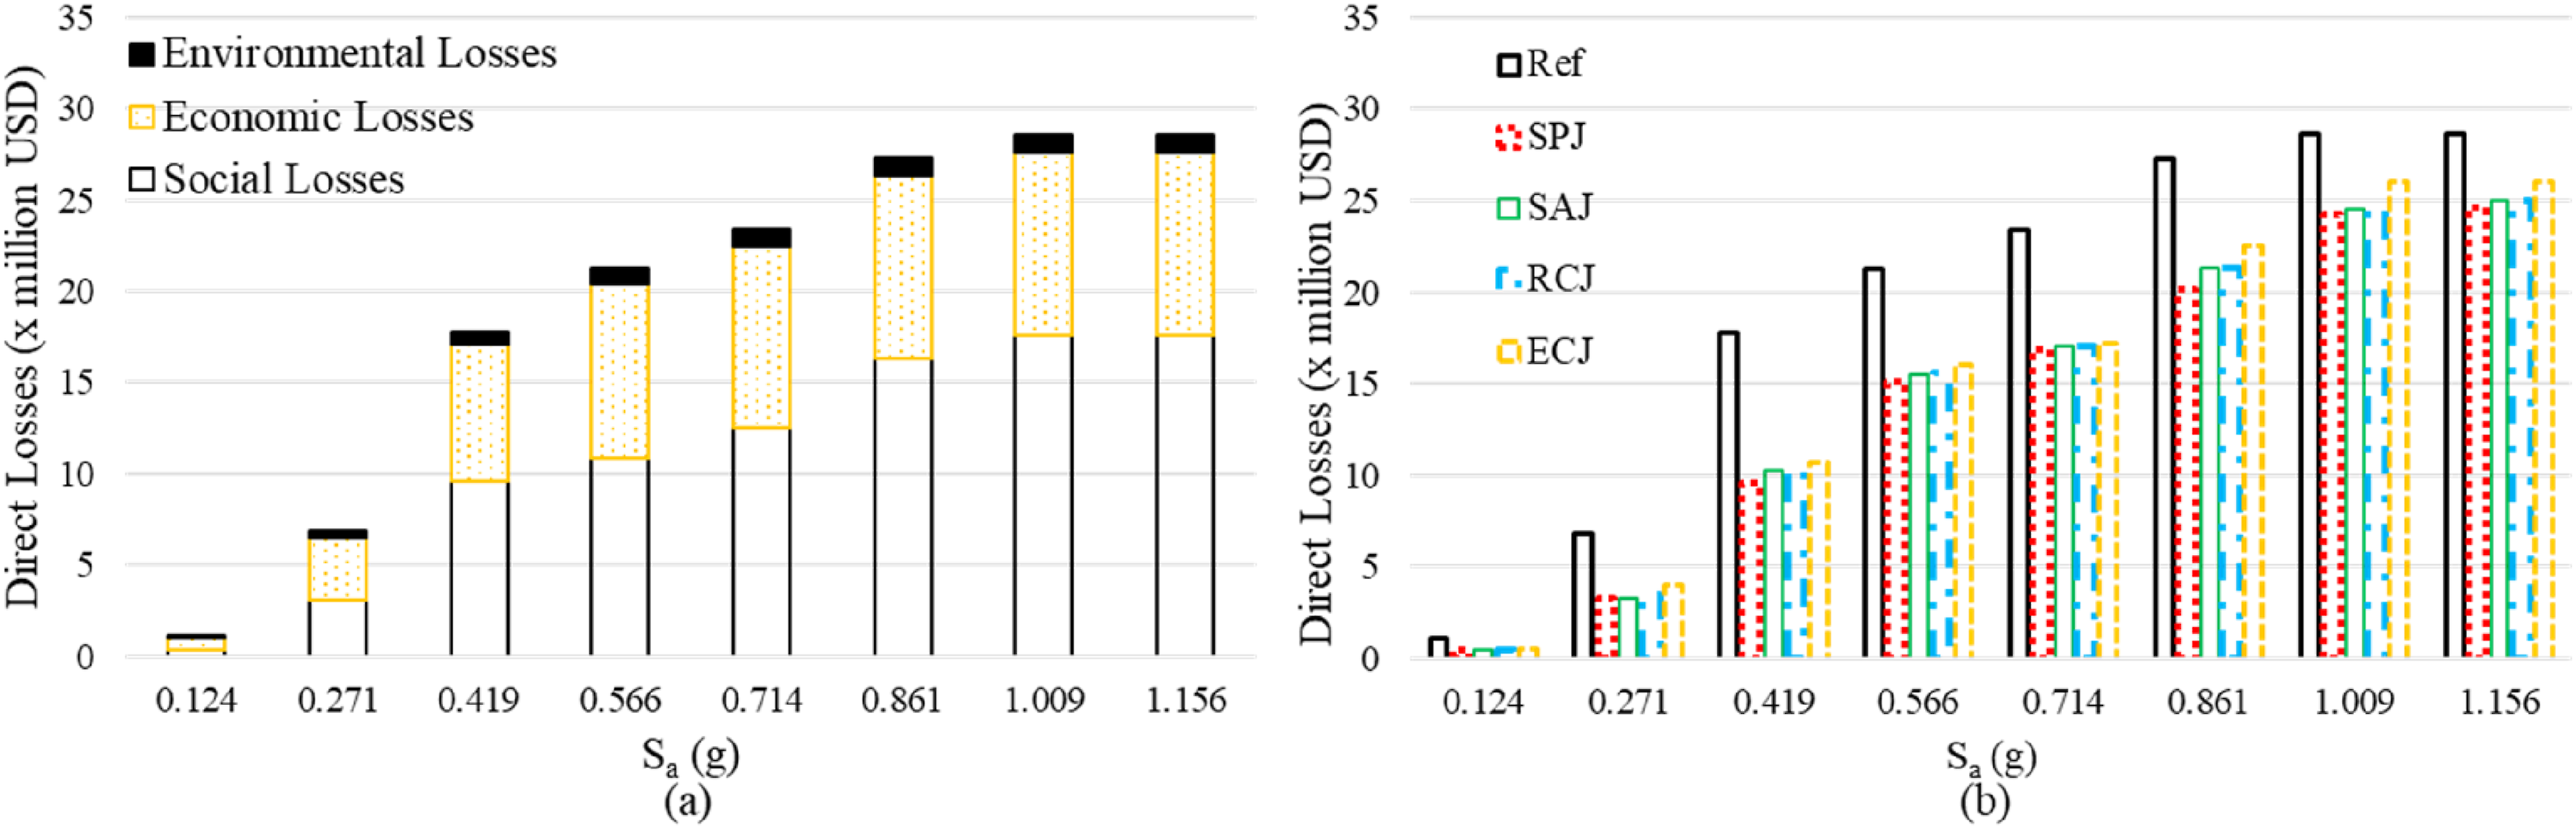
Quantification of indirect losses
To estimate the indirect losses, the initial step is to obtain the downtime for every damageable assembly in a structure. The downtime estimation is divided into coherent and incoherent components. Equation A2 through A9 are used to estimate the total downtime of the structure, which is then used in equation (A1) to quantify the indirect losses in the form of monetary values. The results are presented in Figure 19, for the reference structure and the considered retrofit solutions. The retrofit solutions offer almost similar reductions in the indirect losses in terms of reduction in indirect losses. The difference in the indirect losses is more obvious for Sa between 0.271 g and 0.861 g where around 40% to 60% reduction in indirect losses can be achieved through retrofitting. However, the indirect losses after 1g also rise for the retrofitted cases although the losses are less than the reference structure, still they are considerably high. The indirect losses in terms of USD for reference building along with four retrofit alternatives, for various intensity levels.
Total losses
The total losses obtained from equation (11) consist of both direct and indirect losses for reference structure and the assumed retrofit solutions and are presented in Figure 20. The distribution of total losses (i.e., direct loss and indirect loss) for the reference (non-retrofitted) structure is presented in Figure 20(a). The major part of total losses is comprised of the social losses followed by the economic losses and then the indirect losses. For instance, at Sa of 1g, the social, economic, indirect, and environmental losses comprise 49%, 28%, 21%, and 3% of the total losses, respectively. The environmental losses are the least one in this case as compared to the other losses, in terms of monetary values. This could be due to the weightage given to the CP, which is very low as compared to the other parameters, for example, VSL, which was given a value of 0.2 million USD. A similar distribution of losses (direct and indirect) is obtained for the retrofitted structures as well. (a) Distribution of total direct losses for reference structure considering various intensity levels, and (b) the total earthquake-induced losses in terms of USD for reference building along with four retrofit alternatives, for various intensity levels.
To compare the impact of retrofitting, in terms of total losses (considering all the direct and indirect losses), Figure 20(b) provides the results for retrofitted and non-retrofitted structures. By retrofitting the structure, the total losses can be reduced to more than 50% up to Sa of 0.419 g.
Quantification of seismic resilience
Figure 21(a) presents the resilience of the reference structure for the various intensity levels, where the structure exhibited better performance in terms of resilience when Sa is small. However, when the Sa tends to increase, the structure exhibited deprived performance as resilience is considered. A very similar response was obtained for the retrofitted cases as well. The trigonometric model was selected among the three recovery models due to its suitability to predict the field scenario more precisely, as also verified by (Prasanth et al., 2023). (a) Functionality curves of reference building with different recovery functions, and (b) resilience for reference building and considered retrofit solutions.
The resilience index quantified for the reference model and various retrofit solutions at different intensity levels are presented in Figure 21(b). It is seen that retrofitting decreases the damages, hence enhancing the resilience of the structure. The enhancement in seismic resilience for ECJ intervention is less as compared to the other strategies, whereas substantial enhancement is noted for the SPJ, SAJ, and RCJ retrofit alternatives. It is concluded that SPJ is the most effective retrofitting alternative followed by SAJ and RCJ. The ECJ also enhances the seismic resilience considerably but its impact is relatively limited. Figure 22 presents the seismic resilience quantification for reference and retrofitted models. The impact of non-structural damages is substantial and these damages should be considered in the resilience quantification, as ignoring them can be misleading, particularly at lower intensity levels, when almost all the damages are due to NSCs. In both cases of retrofitted and non-retrofitted models, the resilience index drops considerably, when the non-structural damages are considered. Seismic resilience considering structural damage and non-structural damage for reference and retrofitted cases.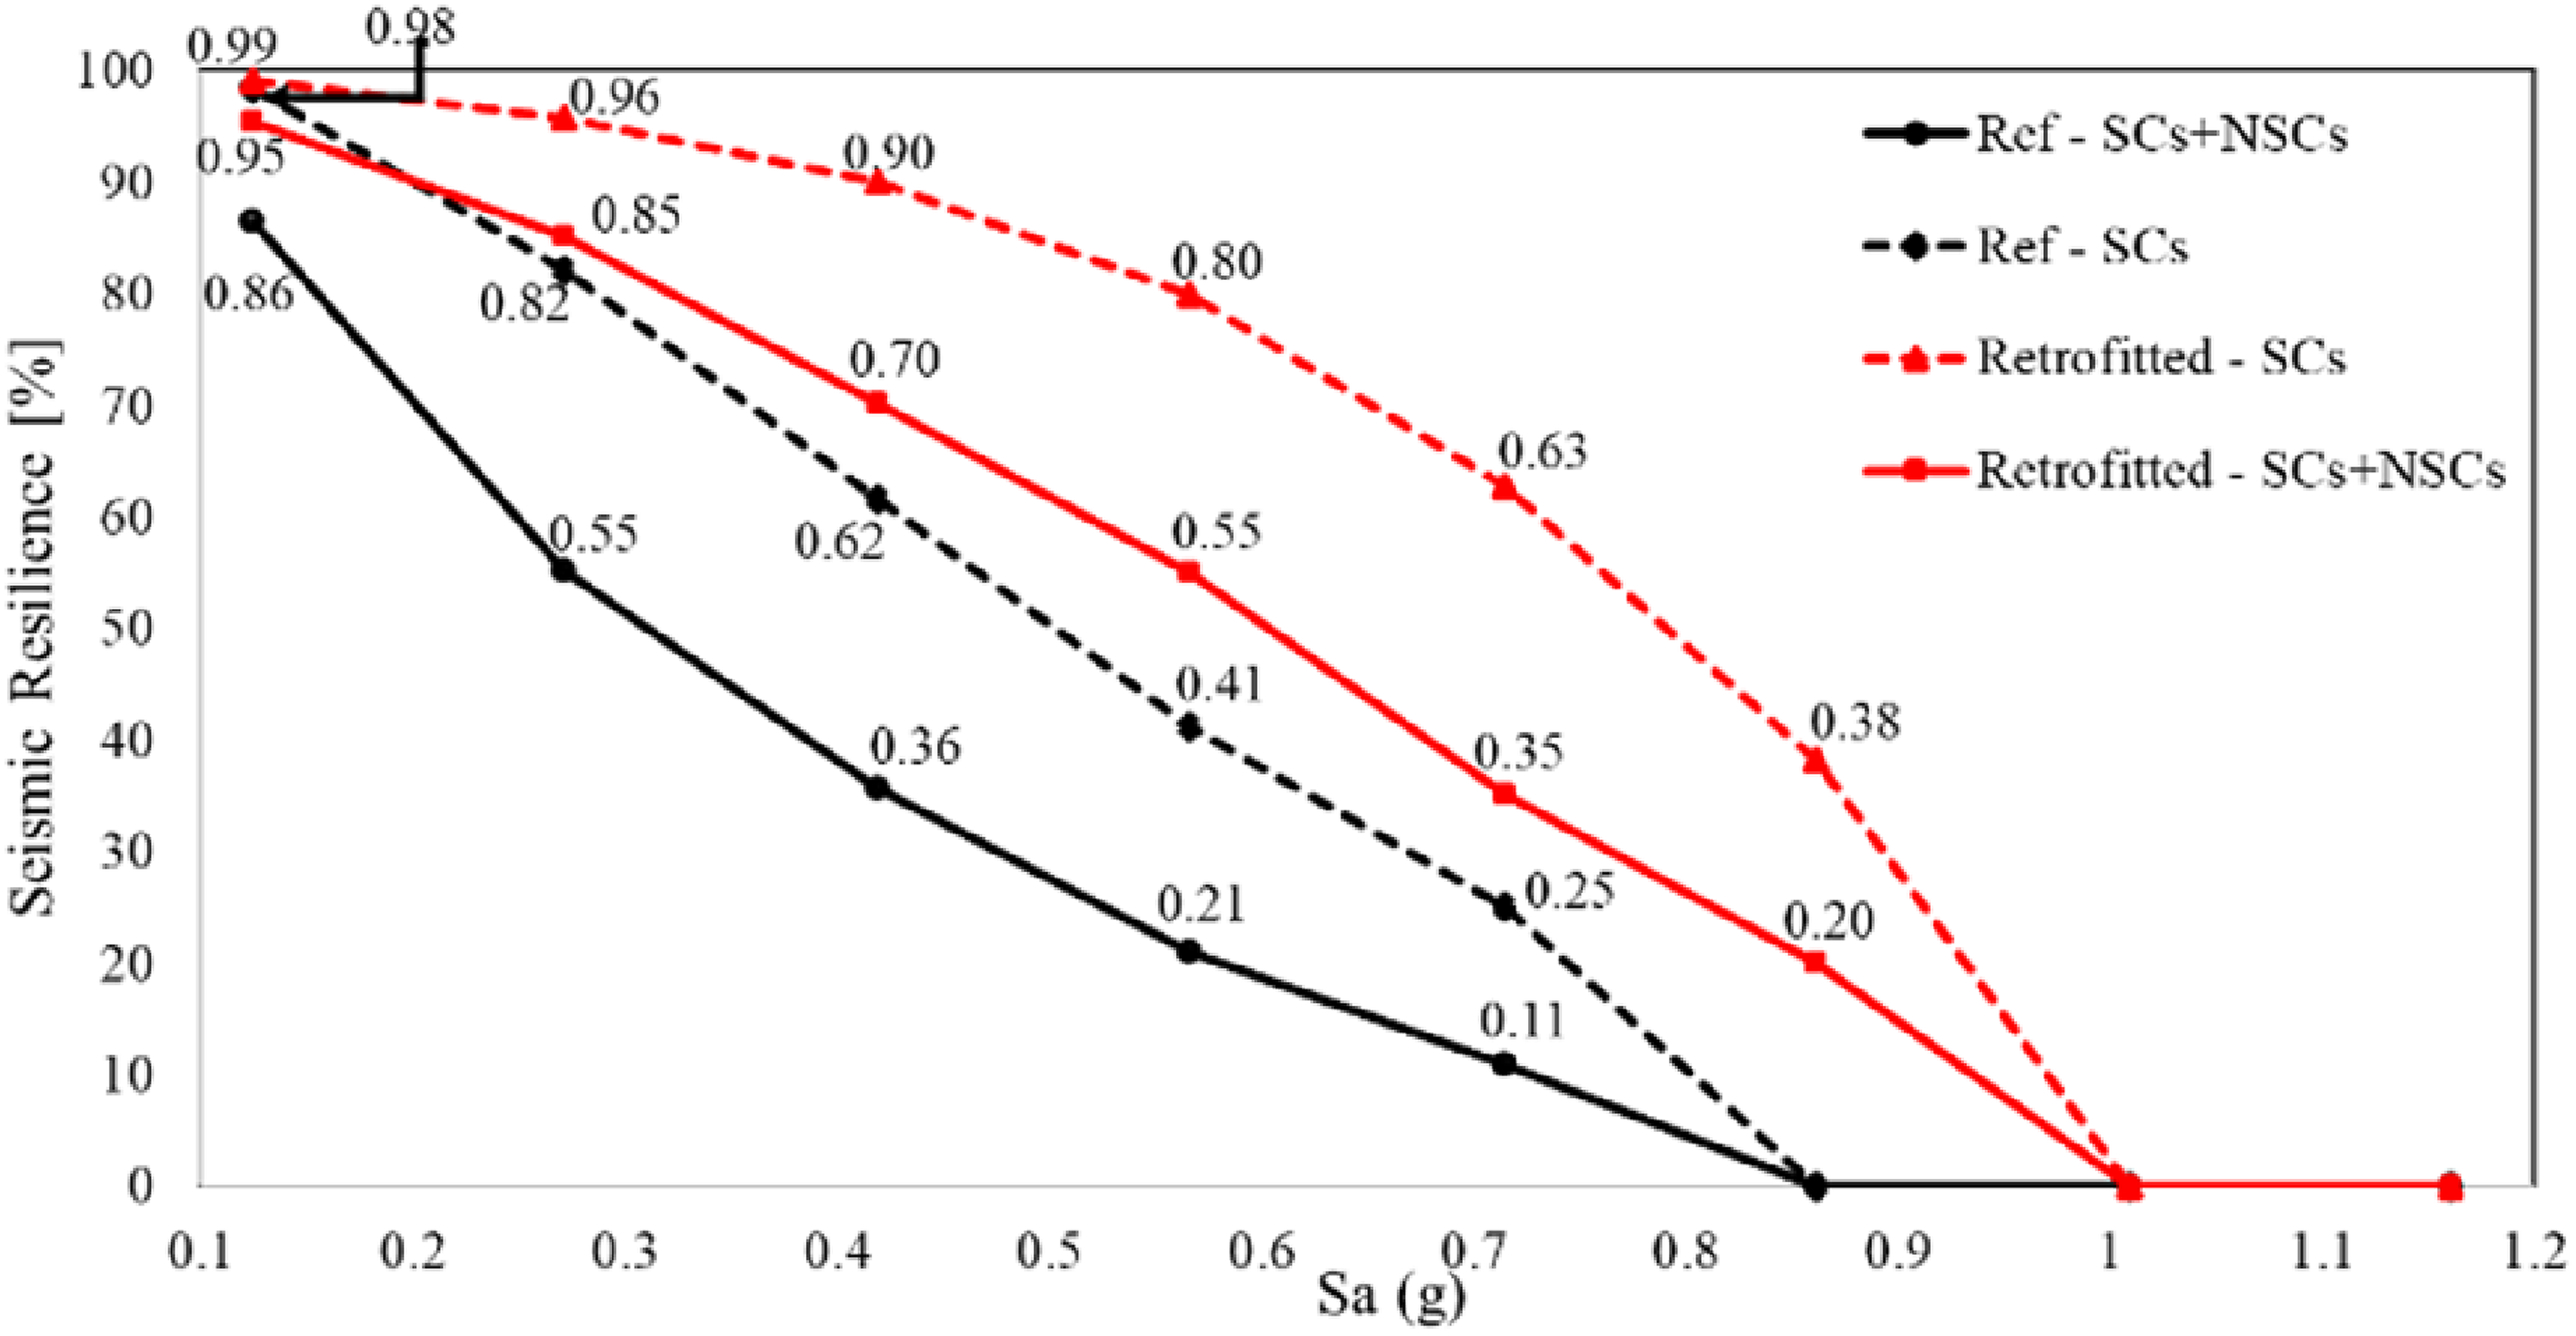
However, the damage to the property such as equipment inside the building is not considered in this study. Also, the NSCs are taken as un-retrofitted, which leads to huge non-structural damages. Further research is needed on the generation of fragility functions for the retrofitted NSCs.
Conclusions
This study proposes a performance-based method for estimating direct and indirect losses based on both structural and non-structural damages. It considers various retrofitting alternatives to reduce damages and enhance performance in terms of vulnerability, risk, and resilience. The economic, social, and environmental losses and downtime are estimated in monetary values and compared for the reference structure before and after the retrofitting.
Based on the study performed, the following conclusions are made: 1. The proposed framework can efficiently assess the resilient enhancement of structure for various retrofit alternatives. Retrofitting has proved very effective in enhancing the structural global performance. In terms of global response quantification, the SPJ alternative showed the most effective performance, followed by SAJ, RCJ, and ECJ. 2. The quantification of component-level damage reveals that non-structural damages constituted a major portion of the total losses and should be considered in damage and loss analysis. At the intensity levels of 0.12, 0.27, 0.42, and 0.57 g, the non-structural damages comprise 98%, 75%, 66%, and 61%, respectively, for the reference model, and 100%, 83%, 75%, and 69%, respectively, for the retrofitted model. 3. The loss analysis study reveals that indirect losses are also very important to consider, as they comprise a substantial portion of the total loss. At an intensity level of 0.714 g and beyond, direct economic loss and indirect loss comprise about 28% and 21% of the total loss, respectively, thus indicating that ignoring the indirect loss in the loss assessment can be misleading. 4. In quantifying resilience, all the retrofitted alternatives showed better resilience as compared to the reference structure. For example, at the intensity level of 0.566 g, the resilience index for the reference model, SPJ-3, SAJ-5, RCJ-3, and ECJ-3 is around 21%, 65%, 55%, 50%, and 40%, respectively. 5. It is also demonstrated that non-structural damages are very important to be considered in the quantification of resilience. At the intensity level of 0.714 g, the resilience index of the reference model was around 25% and 11% when non-structural damages were ignored and considered, respectively.
Supplemental Material
Supplemental Material - Performance-based seismic retrofitting and resilience assessment for RC buildings considering direct and indirect losses
Supplemental Material for Performance-based seismic retrofitting and resilience assessment for RC buildings considering direct and indirect losses by Hafiz Asfandyar Ahmed and Yaohan Li in Advances in Structural Engineering
Footnotes
Declaration of conflicting interests
The author(s) declared no potential conflicts of interest with respect to the research, authorship, and/or publication of this article.
Funding
The author(s) disclosed receipt of the following financial support for the research, authorship, and/or publication of this article: The work described in this paper was supported by the Hong Kong Metropolitan University Research Grant (No. RD/2022/1.3), and by the Research Grants Council Faculty Development Scheme of Hong Kong SAR (Project No. UGC/FDS16/E08/23). The opinions and conclusions presented in this paper are those of the authors and do not necessarily reflect the views of the sponsoring organizations.

Supplemental Material
Supplemental material for this article is available online.
References
Supplementary Material
Please find the following supplemental material available below.
For Open Access articles published under a Creative Commons License, all supplemental material carries the same license as the article it is associated with.
For non-Open Access articles published, all supplemental material carries a non-exclusive license, and permission requests for re-use of supplemental material or any part of supplemental material shall be sent directly to the copyright owner as specified in the copyright notice associated with the article.
