
Abstract
Accurately evaluating the probability of damage and the resilience of RC frame structures is essential for developing resilient city systems. In this paper, a quasi-static test on three RC frame specimens is carried out to analyze the characteristics of the damage development and performance degradation, as well as the improvement aspects of the performance indexes. Based on that, a damage index, which considered the influences of the differences in component locations and the damage of components on the overall structure, was proposed. And a probabilistic seismic performance assessment method of RC frame structures, including the determination of the limits of the performance indexes and the assessment of the probability of damage and resilience, was developed. The results demonstrate that the proposed damage index offers superior accuracy in predicting the damage degree of the structure. Moreover, the developed assessment method exhibits good agreement with the observed seismic performance of the tested RC frame structures.
Introduction
As urbanisation continues to advance, the impact of earthquake damage on buildings and their functional stability becomes increasingly critical. Consequently, the development of resilient city systems (Desouza and Flanery, 2013; Patel and Nosal, 2016), where the original functions of buildings is required rapidly restored, has become particularly important. Accurately assessing the probability of damage and the resilience of structures under a given ground motion intensity is essential for post-earthquake recovery and reconstruction efforts. This assessment plays an important role in the development of resilient city systems.
Numerous seismic performance assessment methods exist in the literature, ranging from simple statistical analyses of data to comprehensive vulnerability assessments. FEMA 154 (1988) and Sucuoglu et al. (2007) proposed a straightforward seismic safety assessment procedure primarily achieved via street surveys. Its goal is to quantify and rank the seismic hazard posed to buildings. Further research has also explored inelastic displacement demands and probabilistic approaches (Chandler and Mendis, 2000; Iervolino et al., 2007; Priestley, 1997; Ruiz-Garcia and Miranda, 2010), necessitating various input parameters at different levels of detail. Huang (2008) developed a new seismic performance assessment method that integrates existing seismic probabilistic risk assessment procedures (Smith et al., 1981) and tools currently in development for performance-based design of buildings. Jeong et al. (2012) used fragility analyses to evaluate the relative seismic safety margins of buildings designed according to seismic codes. Vamvatsikos and Allin (2006), and Pepe et al. (2019) predicted the structural performance using probability matrix analysis, capacity spectrum analysis, and numerical simulations. Lu et al. (2020) established the SimCenter Workflow to assess the damage in urban architectural complexes. Ditommaso et al. (2021) assessed structural damage through modal curvature evaluation. Shan et al. (2023) developed a rapid seismic performance evaluation framework based on field data and time-history analysis, which can accurately predict the peak displacement. Kazemi et al. (2023) devised a seismic response and performance assessment method based on machine learning techniques implemented in Python software.
In additional, quantitative damage assessment using damage index is essential during seismic performance assessment for a structure. Park and Ang (1985) first proposed an evaluation model for the seismic damage of reinforced concrete (RC) structures using a linear function of the maximum deformation and the effect of repeated cyclic loading. Since then, researchers have dedicated themselves to developing novel evaluation models for seismic damage (Ghobarah et al., 1999; Huang et al., 2018; Rodriguez and Padilla, 2009). Samimifar and Massumi (2018) evaluated the modal-based story damage index performance based on an analytical study on seismic responses of some RC frames subjected to a set of earthquake records. Hait et al. (2019) presented a new damage index based on a combination of different structural response criteria which provided accurate results compared to the Park & Ang damage index. Wang et al. (2020) designed a damage index for RC members based on energy dissipation capability degradation. Mazloom and Fallah (2023a) introduced a Stiffness Based Damage Index based on the pushover analysis output, which only involved the capacity curve and simple calculations. Mazloom and Fallah (2023b) developed a new damage index based on flexural stiffness variations for damage detection in structure.
The performance degradation of a structure is the result of the damage on the components. Even though the structure can continue to bear the load, some individual components inside that have failed. The structure in this state is practically unusable (Su et al., 2020). While the above studies did not provide a clear indication of the relationship between individual structural components and the overall structure, which may lead to inaccurate evaluation results.
RC frame structures represent a common structural form that is widely used in densely populated places such as shopping malls, schools, and hospitals. In this study, a subassemblage-based probabilistic damage and resilience assessment method for RC frame structure was developed. First of all, a quasi-static test was conducted on three RC frame specimens was conducted to analyze the characteristics of the damage development and performance degradation, as well as the improvement aspects of the performance indexes and their limit values. Then, a damage index, which considered the influences of the differences in component locations and the damage of components on the overall structure, was proposed. The limit values of the proposed index and interstory drift ratio at different performance levels were also given. Subsequently, a probabilistic seismic performance assessment method of RC frame structures, including the assessment of the probability of damage and resilience, was developed.
Experimental investigations
Experimental program
Design parameters of specimens.
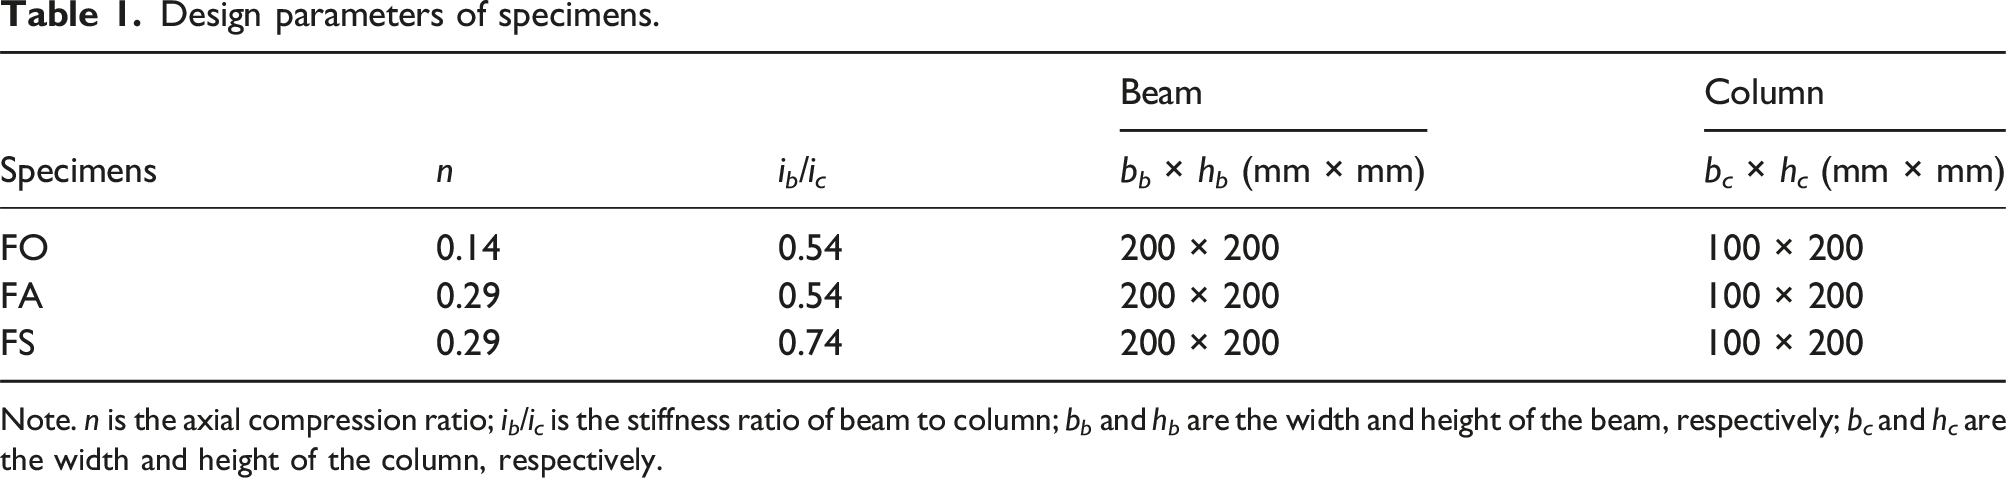
Note. n is the axial compression ratio; i b /i c is the stiffness ratio of beam to column; b b and h b are the width and height of the beam, respectively; b c and h c are the width and height of the column, respectively.
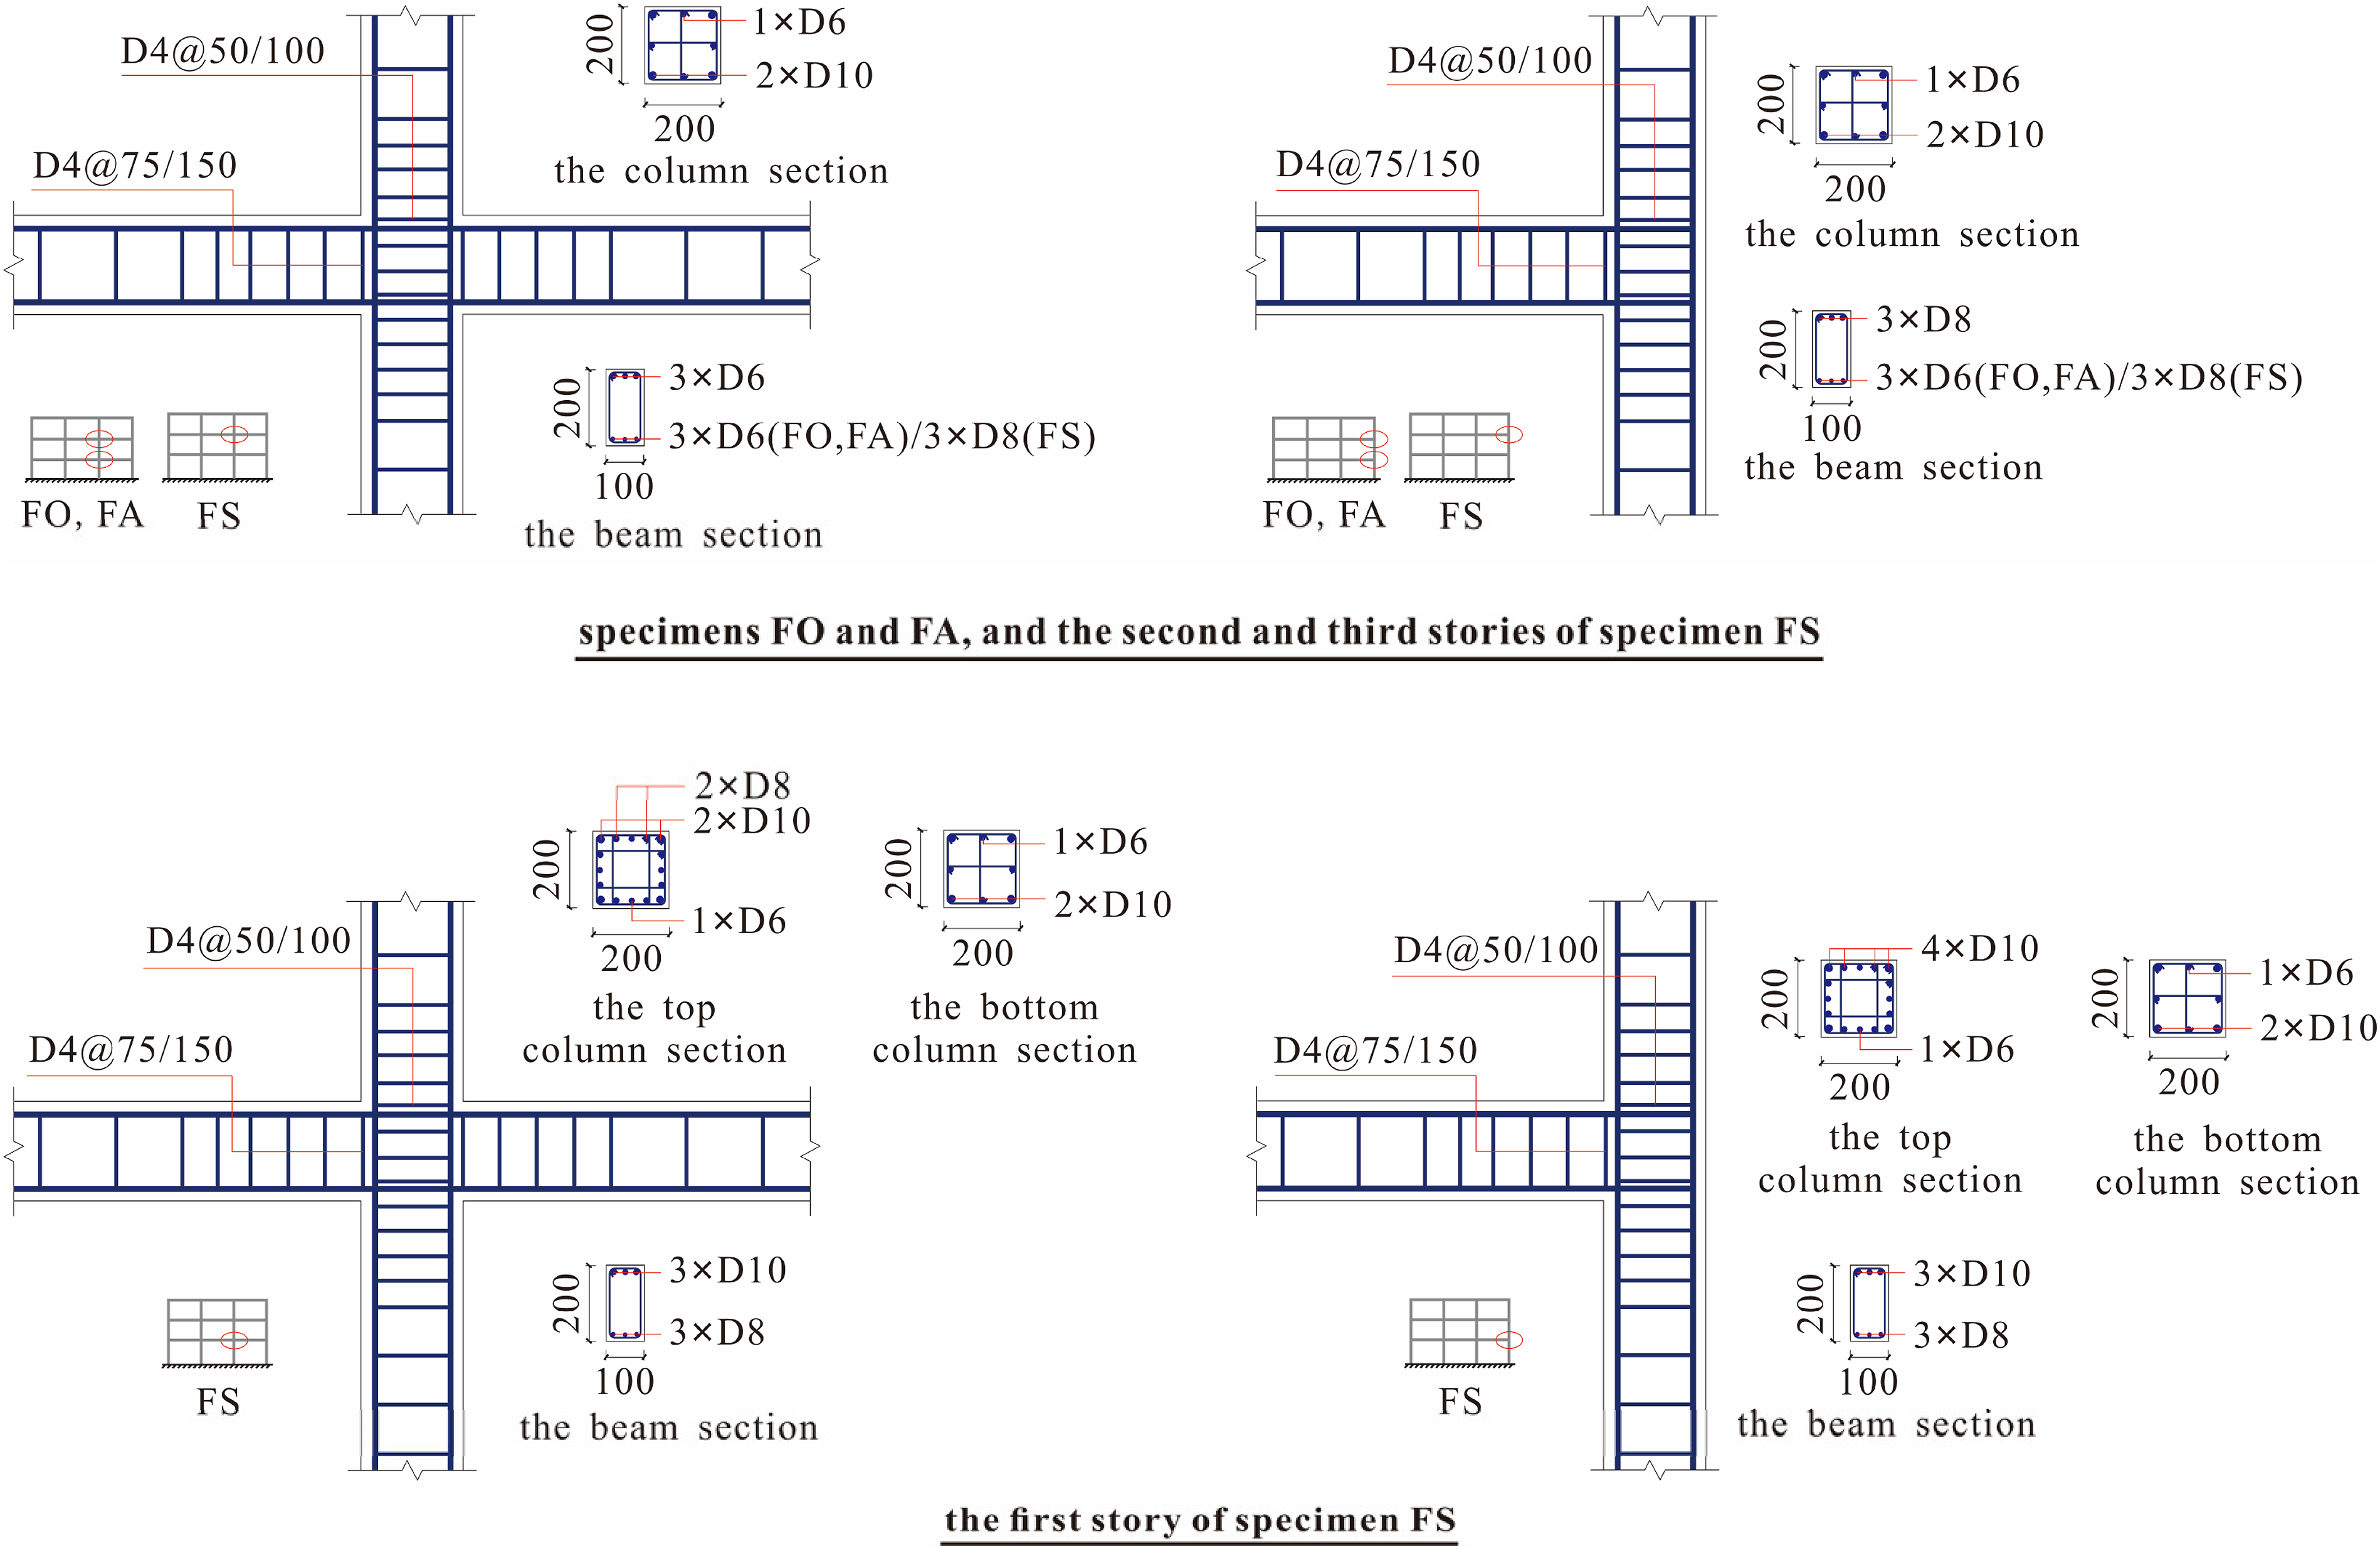
Reinforcement details of specimens.
Mechanical properties of steel reinforcement.
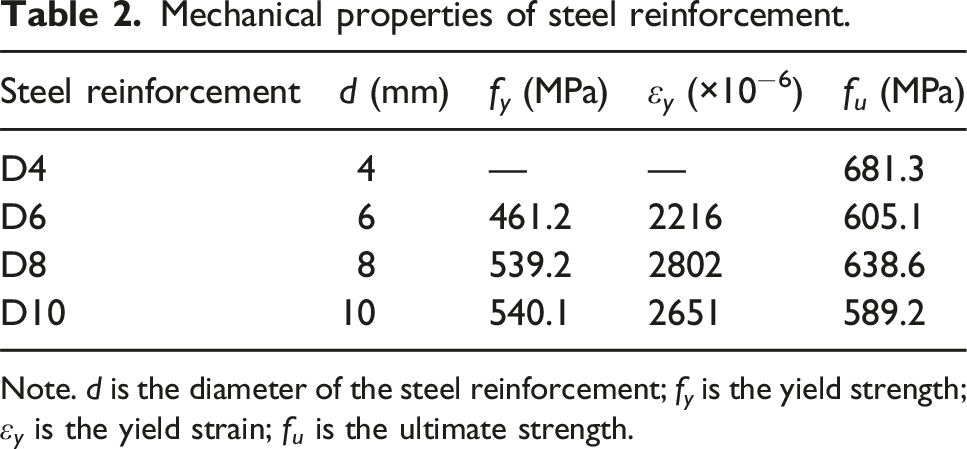
Note. d is the diameter of the steel reinforcement; f y is the yield strength; ε y is the yield strain; f u is the ultimate strength.
The test setup is shown in Figure 2. A hydraulic jack and MTS were used to apply vertical and lateral loads, respectively. The lateral load was applied in a displacement-controlled mode. Before the specimens yielded, the displacement was increased by 3 mm in each loading step, and one cycle was adopted. Subsequently, the displacement was increased by 9 mm in each loading step, and three cycles were adopted. Test setup.
The instrumentation used is illustrated in Figure 3. The horizontal load and displacement at the loading point were recorded using the MTS. Additionally, the horizontal displacements of each story were measured using linear variable differential transducers (LVDTs). Furthermore, the relative shear distortions in the joints were measured using two diagonal LVDTs, and the displacements at the tips of the beams were recorded using LVDTs. Strain gauges were used to record the strains in the reinforcements. Instrumentations. (a) Layout of LVDTs. (b) Layout of strain gauges.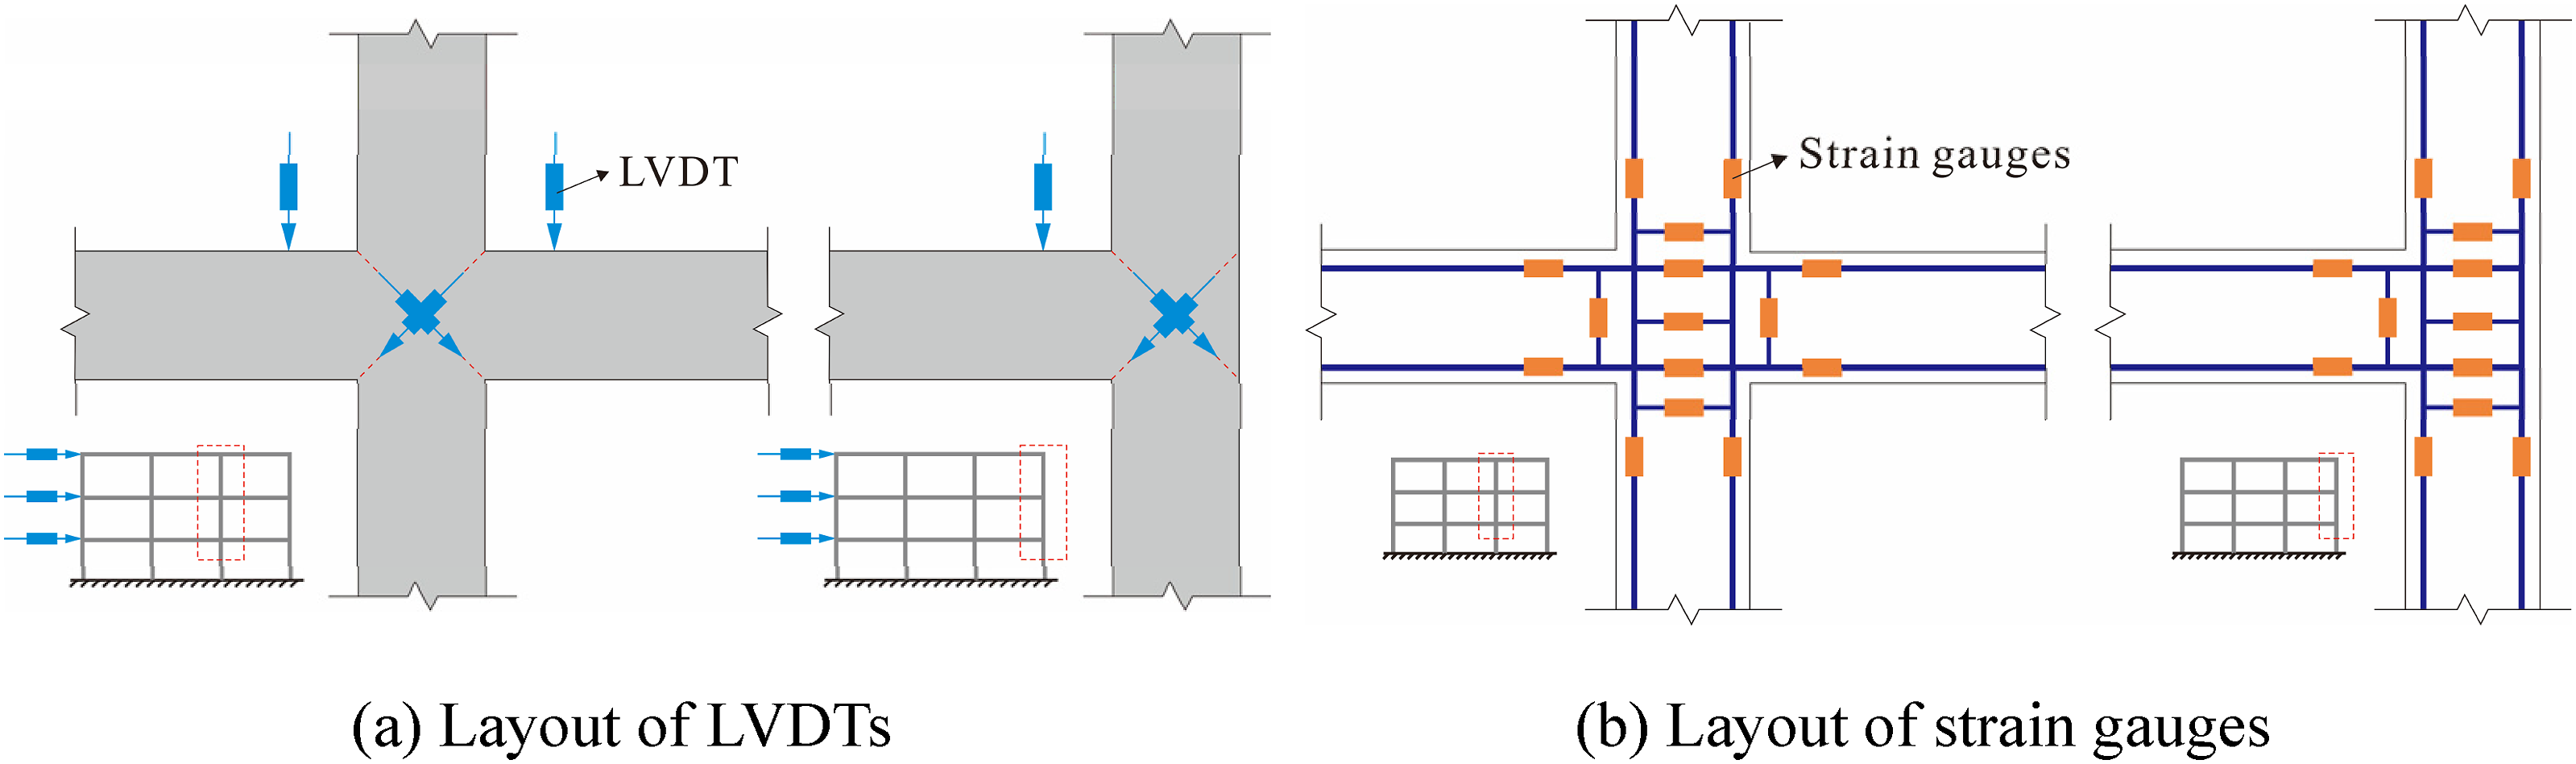
Experimental results
Failure modes
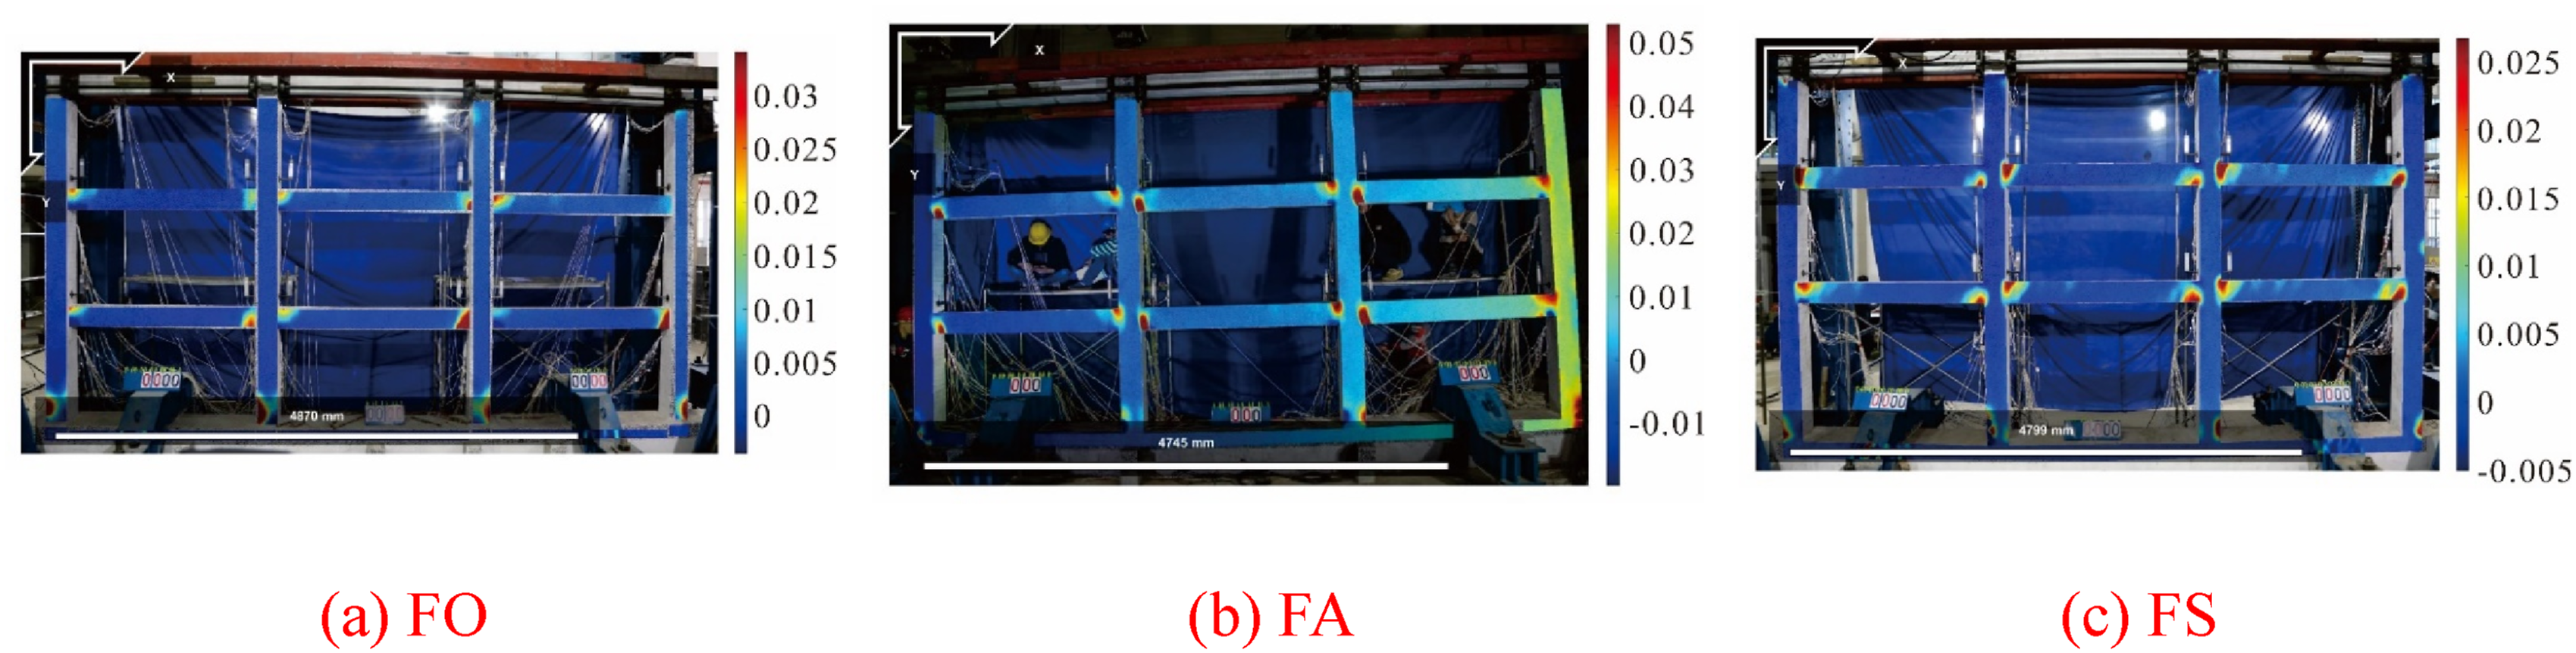
All specimens show the failure mode of strong columns-weak beams, the failure modes and strain nephogram are shown in Figures 4 and 5, respectively. Specimen FO showed widely spaced hairline cracks on the beams in the initial loading stage. With the load further increased, the cracks on the beams propagated constantly, but only microcracks were observed on the column bottoms at first and second story. As the loading proceeded to the displacement of 27 mm, individual beam ends show slight concrete peeling, and horizontal penetrating cracks formed on an exterior column bottom at first story. As the displacement increased to 63 mm, the compression crushing of concrete occurred at most of the beam ends, and a small portion of the concrete was crushed on the column bottoms at first story. As the ultimate displacement reached, large areas of concrete spalling were observed on the beam ends and the column bottoms at first story. During the whole loading process, only microcracks appeared on the columns at second and third storys and the joints. Failure modes of specimens. (a) FO. (b) FA. (c) FS. Strain nephogram of specimens. (a) FO. (b) FA. (c) FS.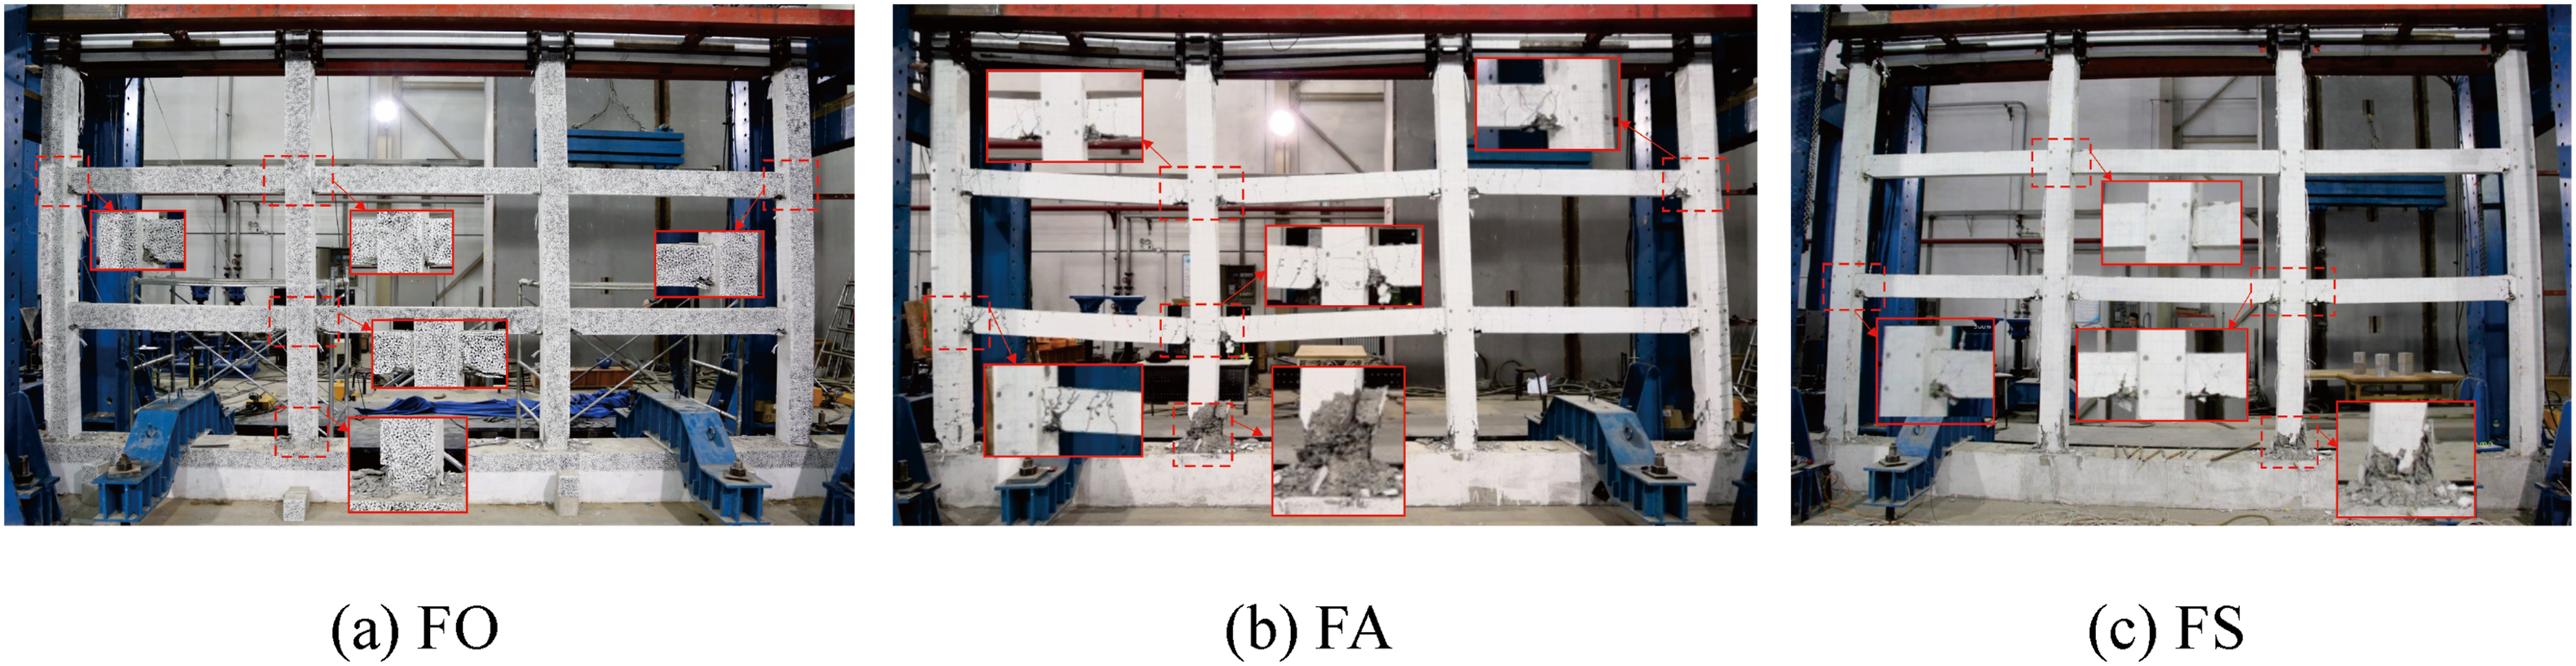
The failure process of specimens FA and FS are similar with that of specimen FO. It should be noted that the specimen FA showed narrow and shorter cracks on the beam ends, and the cracks on the columns at first story developed faster in width and length for the specimen FS. What’s more, when the specimens failed, the damage of the components at the lower storys is generally more severe than that at the upper storys, and the damage of the internal components is slightly higher than that of the external components, but the difference is not significant. It may be caused by differences in the loads borne by the components and their inherent mechanical properties. This should be considered in the quantitative characterization of structural damage degree. The development of component-based damage index is necessary.
Load-displacement response
The load-displacement curves of all specimens are shown in Figure 6. The initial slope of the curve of specimen FA is the highest, and that of specimen FO is higher than that of specimen FS. The initial stiffness would be improved when the axial compression ratio increased or the stiffness ratio of beam to column decreased. In addition, although the individual local areas of the specimens have suffered severe damage, their curves decreased gently after the peak point, especially a more gradual descent stage can be observed for specimen FS. It should be noted that the drops in the bearing capacities of all specimens are the results of the damage development at beam ends. Load-displacement curves of specimens.
Bearing and deformation capacities of the specimens.
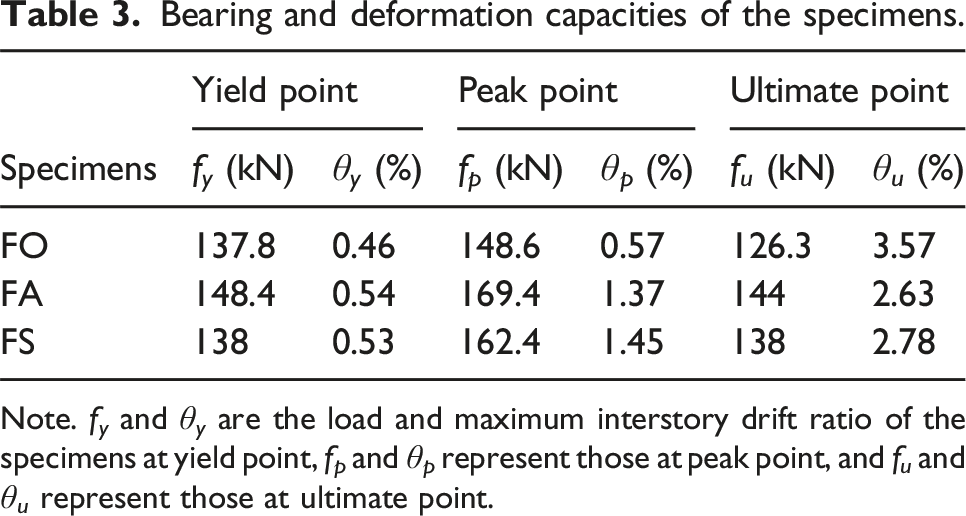
Note. f y and θ y are the load and maximum interstory drift ratio of the specimens at yield point, f p and θ p represent those at peak point, and f u and θ u represent those at ultimate point.
Development of interstory deformation
The performance levels of a structure have been classified in current codes, guidelines and relevant studies. According to Chinese Code (GB 50010-2010, 2015; GB 50011-2010, 2016), FEMA 351 (2000), and the studies by Ghobarah et al. (1999) and Wang et al. (2011), five performance levels are chosen, including immediate occupancy (IO), damage control (DC), life safe (LS), collapse prevention (CP), and collapse (CO). The interstory drift ratios of all specimens at these performance levels are shown in Figure 7. The interstory drift ratios of each story are similar for specimen FO at the performance levels of IO and DC, but that of second story increases obviously at the other performance levels. The development of interstory drift ratios for specimens FA and FS are similar, and the interstory drift ratios of third story is significantly higher than that in the other storys. At the performance level of CO, the maximum interstory drift ratio of specimens FA and FS are similar, about 4.76%; but that of specimen FO is 5.88%, increasing by 23.5%. The stiffness ratio of beam to column has little effect on the development of interstory deformation for the frame structures with same failure mode. Interstory drift ratios of specimens at different performance levels. (a) IO. (b) DC. (c) LS. (d) CP. (e) CO.
The maximum interstory drift ratio of the specimens is about 1/620 at the performance level of IO. However, the corresponding limiting value in current codes is about 1/550. What’s more, the maximum interstory drift ratio of the specimens is about 1/340 at the performance level of DC, but the corresponding limiting value in current codes is about 1/250. The specimens have showed concrete cracking and longitudinal reinforcement yielding when the maximum interstory drift ratio reached 1/340.
The limiting values of the interstory drift ratios for different performance levels in current codes (FEMA 351, 2000; GB 50010-2010, 2015; GB 50011-2010, 2016) cannot accurately match the actual test results. Similar results have also been obtained in previous studies (Acun and Sucuoglu, 2010; Matamoros and Matchulat, 2008; Nakamura and Yoshimura, 2002; Pujol et al., 2006; Sezen, 2008; Zhou et al., 2016). The limiting values of the interstory drift ratios, such as Chinese codes, are derived by the test results on columns. The collaborative effects between components and the influences of the differences in components on the overall structure are not considered, which caused the discrepancies between the test results and the relevant provisions in the code. In additional, the impact of the failure mode is also a potential reason for these discrepancies. The limiting value in current codes can be open to further refinement.
Discussion
The damage degree of different local areas of the specimens is different, which means that the components in different locations have different influences on the structure. In additional, the load of the specimens decreases slowly and this phenomenon continues beyond the ultimate point. However, the individual local areas of the specimens have suffered severe damage at this stage. This means that although the overall structures have a certain bearing capacities, their internal components have failed. The structures have actually failed. The influences of the differences in component locations and the damage of components should be considered in the seismic performance assessment for a structure. In additional, the maximum interstory drift ratio is an easily accessible index and is useful for a rough assessment in emergency situations. However, the maximum interstory drift ratios of specimens at different performance levels are not match the corresponding limiting values in current codes. It is necessary to improve them.
Establishment of the probabilistic seismic performance assessment method
In order to more accurately evaluate the probability of the damage state and resilience of frame structure under a given ground motion intensity, a probabilistic seismic performance assessment method is implemented based on the IDA, where the limiting values of the performance indexes are also provided. Meanwhile, a component-based damage index, which related the damage of the components and that of the structure, is proposed and applied in the seismic performance assessment. The flow chart of this assessment method is shown in Figure 8. Flow chart of probabilistic seismic performance assessment method.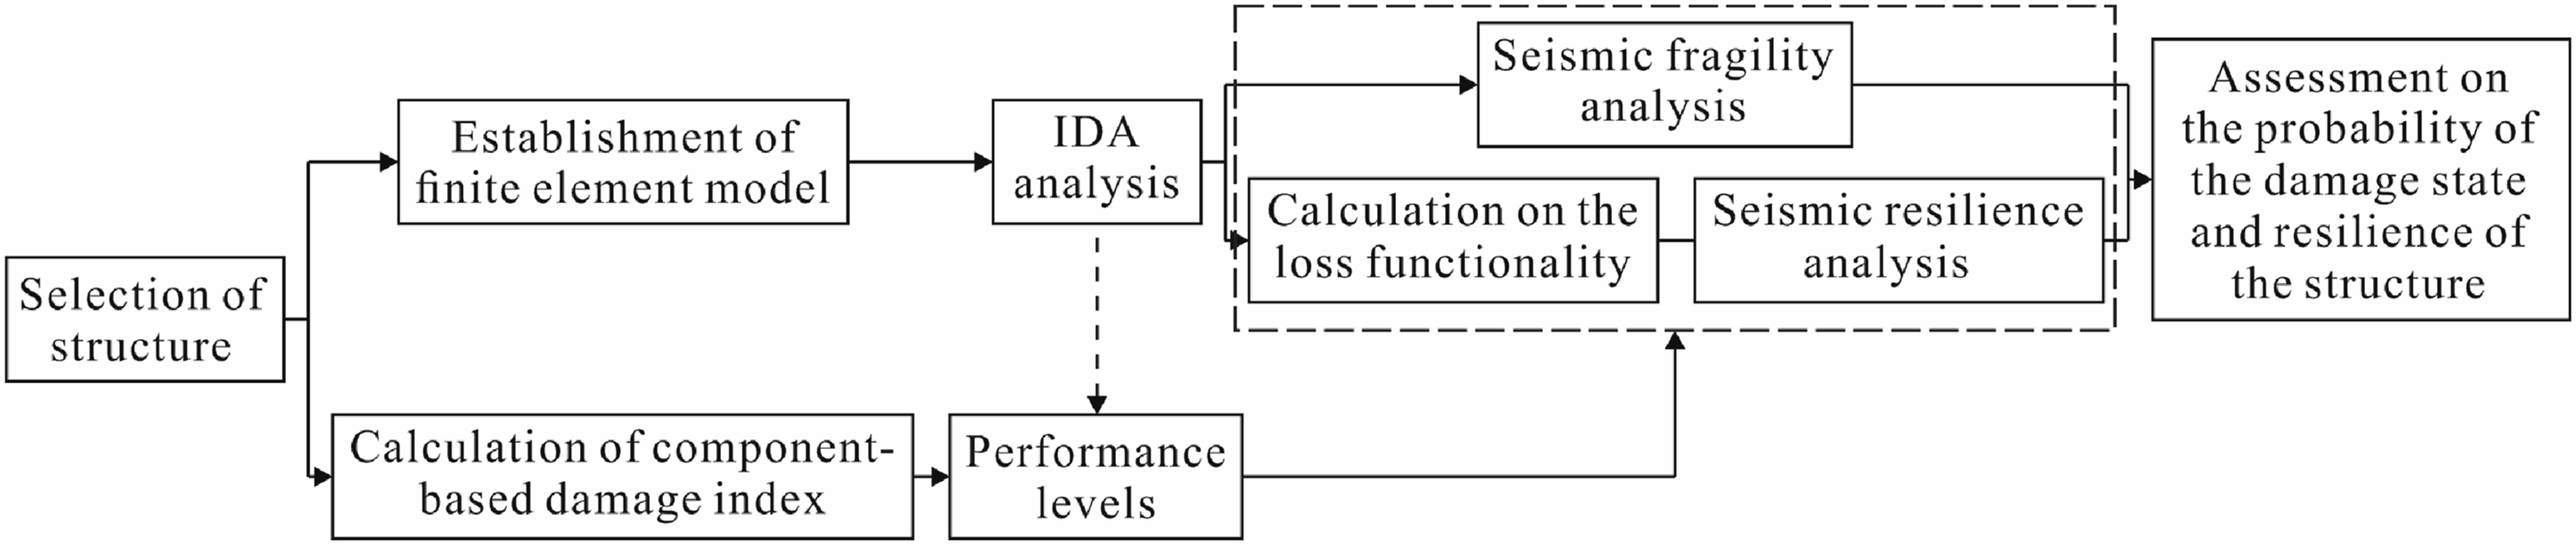
Component-based damage index
The damage state of a frame structure is the sum of the contributions of the local damage at various positions. A beam-column subassemblage is the basic component of a structure, and its damage state can accurately reflect the local damage of a frame structure. In additional, the damage degrees of components at different storys and different positions on the same storys are different according to the test results in Section of “Failure modes”. Hence, a damage index of the frame structure, which is the weighted combination of the damage indexes of the beam-column subassemblages at different axes and stories, is proposed. This damage index relates the damage of the components to that of the structure.
To simplify the analysis process, the drift ratio of a beam-column subassemblage is used to describe the damage state, and the damage index can be expressed as follows (Cao et al., 2014):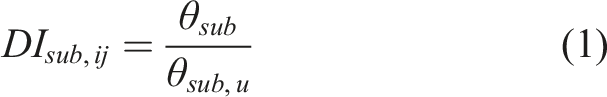
The beam-column subassemblages at different stories and axes contribute differently to the axial and lateral resistances of the frame structure. The damage to these subassemblages also has different effects on the seismic performance of a frame structure. Hence, the axial weight coefficient and lateral weight coefficient are introduced.
The axial weight coefficient represents the contribution degree of a beam-column subassemblage to the axial resistance of a frame structure, which can be expressed as the proportion of the axial load borne by the sub-assemblage, as follows:
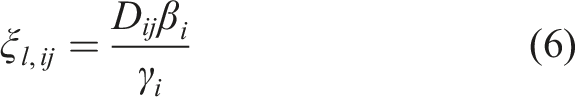
The lateral weight coefficient represents the contribution degree of a beam-column subassemblage to the lateral resistance of a frame structure, which can be expressed as the proportion of the lateral load borne by the sub-assemblage, as follows: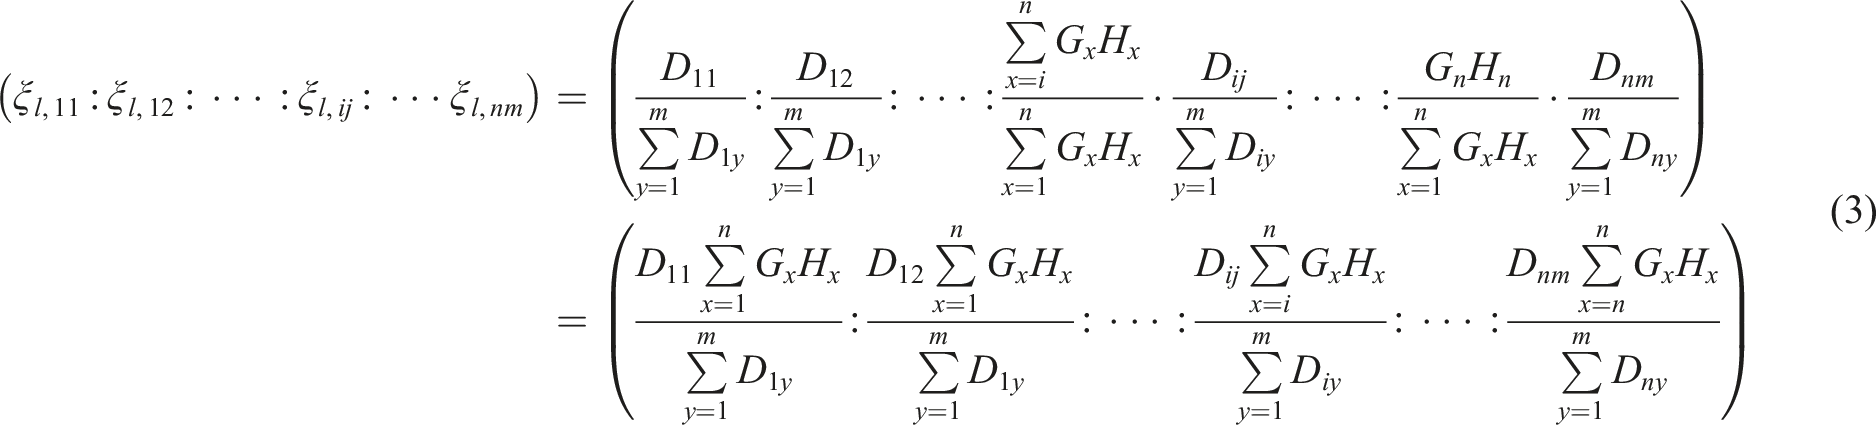
By multiplying the damage index of a beam-column subassemblage with the axial weight coefficient and lateral weight coefficient, and summing these indexes, the damage index of the frame structure can be obtained. The influences of multiple demands among different components are thus considered to some extent. To facilitate comparative analysis, normalization processing is carried out. The damage index of the frame structure can be expressed as follows:


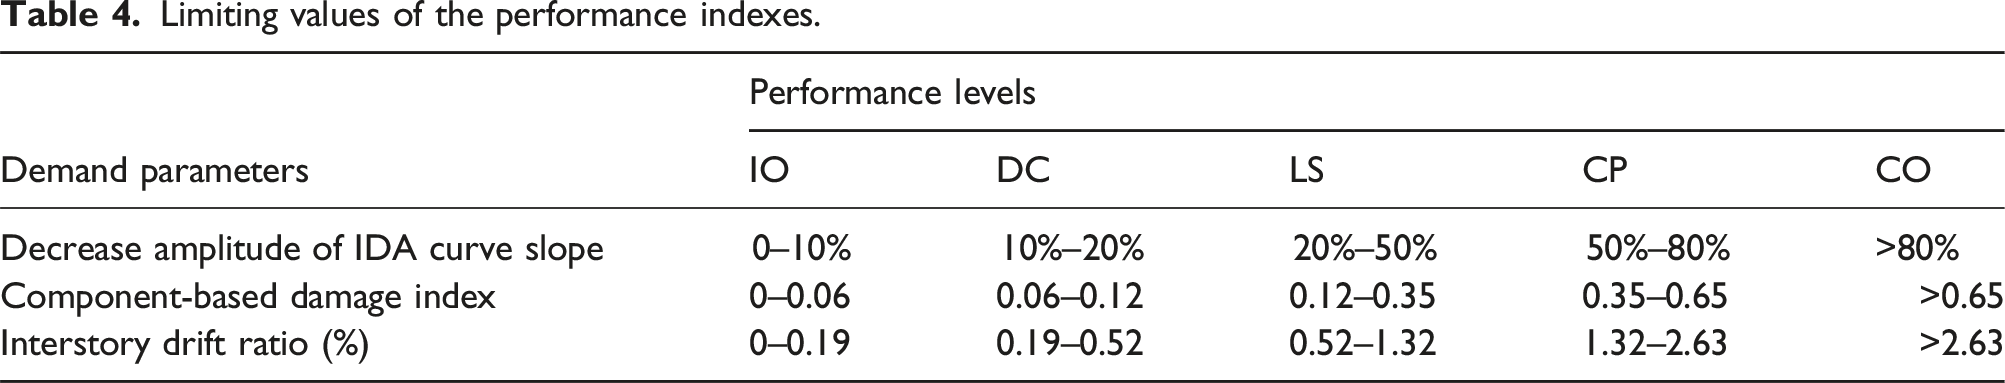
Limiting values of the performance indexes
Limiting values of the performance indexes.
Seismic fragility assessment method
The seismic fragility describes the probability of exceedance certain limit state for specific level of ground motion. In this paper, the seismic fragility assessment is carried out based on IDA. In addition, the rational damage measure (DM) and intensity measure (IM) are also required for the effective implementation of IDA. The peak ground acceleration (PGA) is a simple but robust IM that can characterize the intensity of earthquake ground motions. This is adopted as the IM in this study. The DM should characterize the seismic damage of the structures, which depends on the application and structure itself. In this study, the maximum interstory drift ratio and proposed damage index are adopted as the DMs (the definition of DM in eqs. (10)–(12) is either the maximum interstory drift ratio or proposed damage index).
The probability of a structure exceeding a specified damage state under a given ground motion intensity can be expressed as:
The relationship between IM and DM can be given by (Shome, 1999):

Wen et al. (2004) reported that the DM obeys a normal distribution. Combined with eqs. (10) and (11), the probability of exceedance can be calculated as follows.
The probability for the structure in a specified performance level can be calculated as: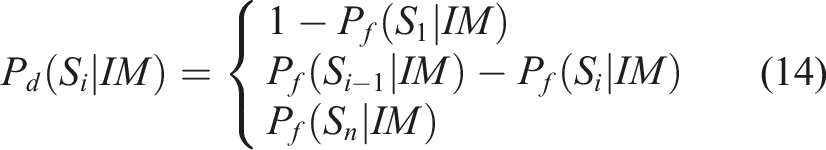
Seismic resilience assessment method
Structural resilience describes a structure’s ability to resist and recover efficiently from an extreme event (Bocchini et al., 2012). It is helpful for preventive assessment for design and maintenance management purposes, and can also assist in the decision-making process after an extreme event occurs.
The expectation of loss functionality is required in this assessment, which is used to evaluate the degradation degree of structural seismic performance under a given ground motion intensity. It can be expressed as:
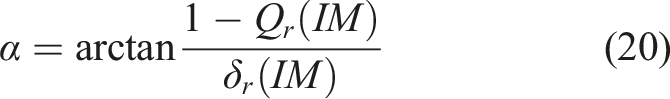
Residual functionality and recovery duration are also required for a resilience analysis to be performed. The residual functionality under a specified ground motion intensity can be obtained as follows.
The recovery duration under a specified ground motion intensity can be expressed as follows (Ghorawat, 2011).

The functionality recovery model is established by a series of functions and six random parameters (Bocchini et al., 2012). It enables the reproduction of kinds of recovery profile shapes that are common in practical applications.
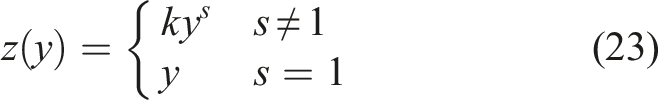
Several functionality recovery models have been proposed (such as Cimellaro et al., 2010; Decò et al., 2013; Padgett and DesRoches, 2007). Linear recovery model is suitable for the cases when the available information is poor. Exponential recovery model is suitable to represent distributed systems, for which it is possible to recover quickly most of the functionality, but the complete recovery requires a long time. Stepwise-to-linear recovery model shows the combination of different trends in the various phases of the construction, which is suitable for the complex situations. As for sinusoidal recovery model, its central part of the intervention is the one that affects the functionality the most, which is suitable for the description of the process of functional recovery of RC frame structure. Thus, a sinusoidal function is selected as the basis of the functionality recovery model, which is given as follows.
Then, the sinusoidal function is rotated, as follows.
Owing to the different recovery speeds in different phases, the location of the sinusoid flex needs to be adjusted.
The functionality level restored at the end of the recovery actions (
The recovery function is finally expressed as:
Values of the parameters A and s in different damage states.

Nonlinear finite element modeling
Constitutive model of material
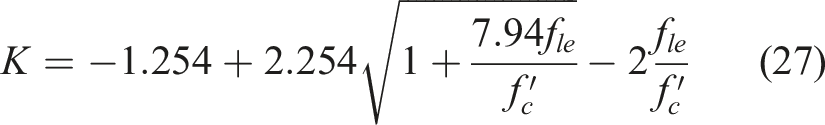
The material “Concrete01” available in OpenSees is used as the concrete. Its constitutive model is expressed as follows: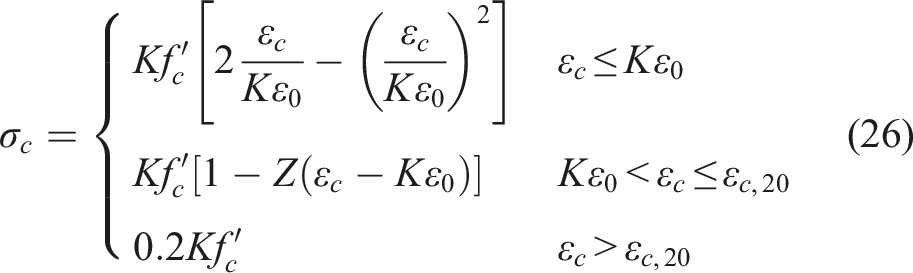

The material “Steel01” available in OpenSees is used to define the steel bar. It is a bilinear stress-strain model that considers strain hardening. The slope of the strain-hardening section, which is the initial slope, is assumed to be 0.01. The tensile and compressive behaviors are the same.
Member modeling
The columns and beams are modeled in OpenSees using a force-based fiber beam-column element. The cross-section of this element is divided into several fibers, each of which follows a uniaxial material constitutive law that ensures that confinement effects caused by stirrup can be achieved. Assume that plastic deformation is possible at any section of the column element and five integration points are arranged along the column element. The fiber sections in the column element are integrated along the element using the Gauss-Labotto integration scheme. A plastic hinge is considered at each end of the beam element. The material nonlinearity is constrained within the plastic hinges, and the interior part of the element is assumed to be linearly elastic. The judgment on whether the components have failed would be made based on the stresses of concrete and reinforcement. The failed components will be deleted, and the calculation program will be continuously executed for the changed models until entire program ends or the calculation is terminated.
Model verification
The modeling method and value of the relevant parameters were verified by comparing with the tested results for specimen FO in Section 2. The results are shown in Figure 9. The stiffness and energy dissipation of the model are slightly lower than that obtained in the test. This may be because the difference between the constitutive model of the material and the actual material properties. But, in general, the differences between the simulation and test results in load and deformation responses are less than 8%, which is acceptable (Huang et al., 2021; Rousakis et al., 2021). The simulation and test results are well agreed with each other. The modeling method and value of the relevant parameters are viable. Comparison of load-displacement curves.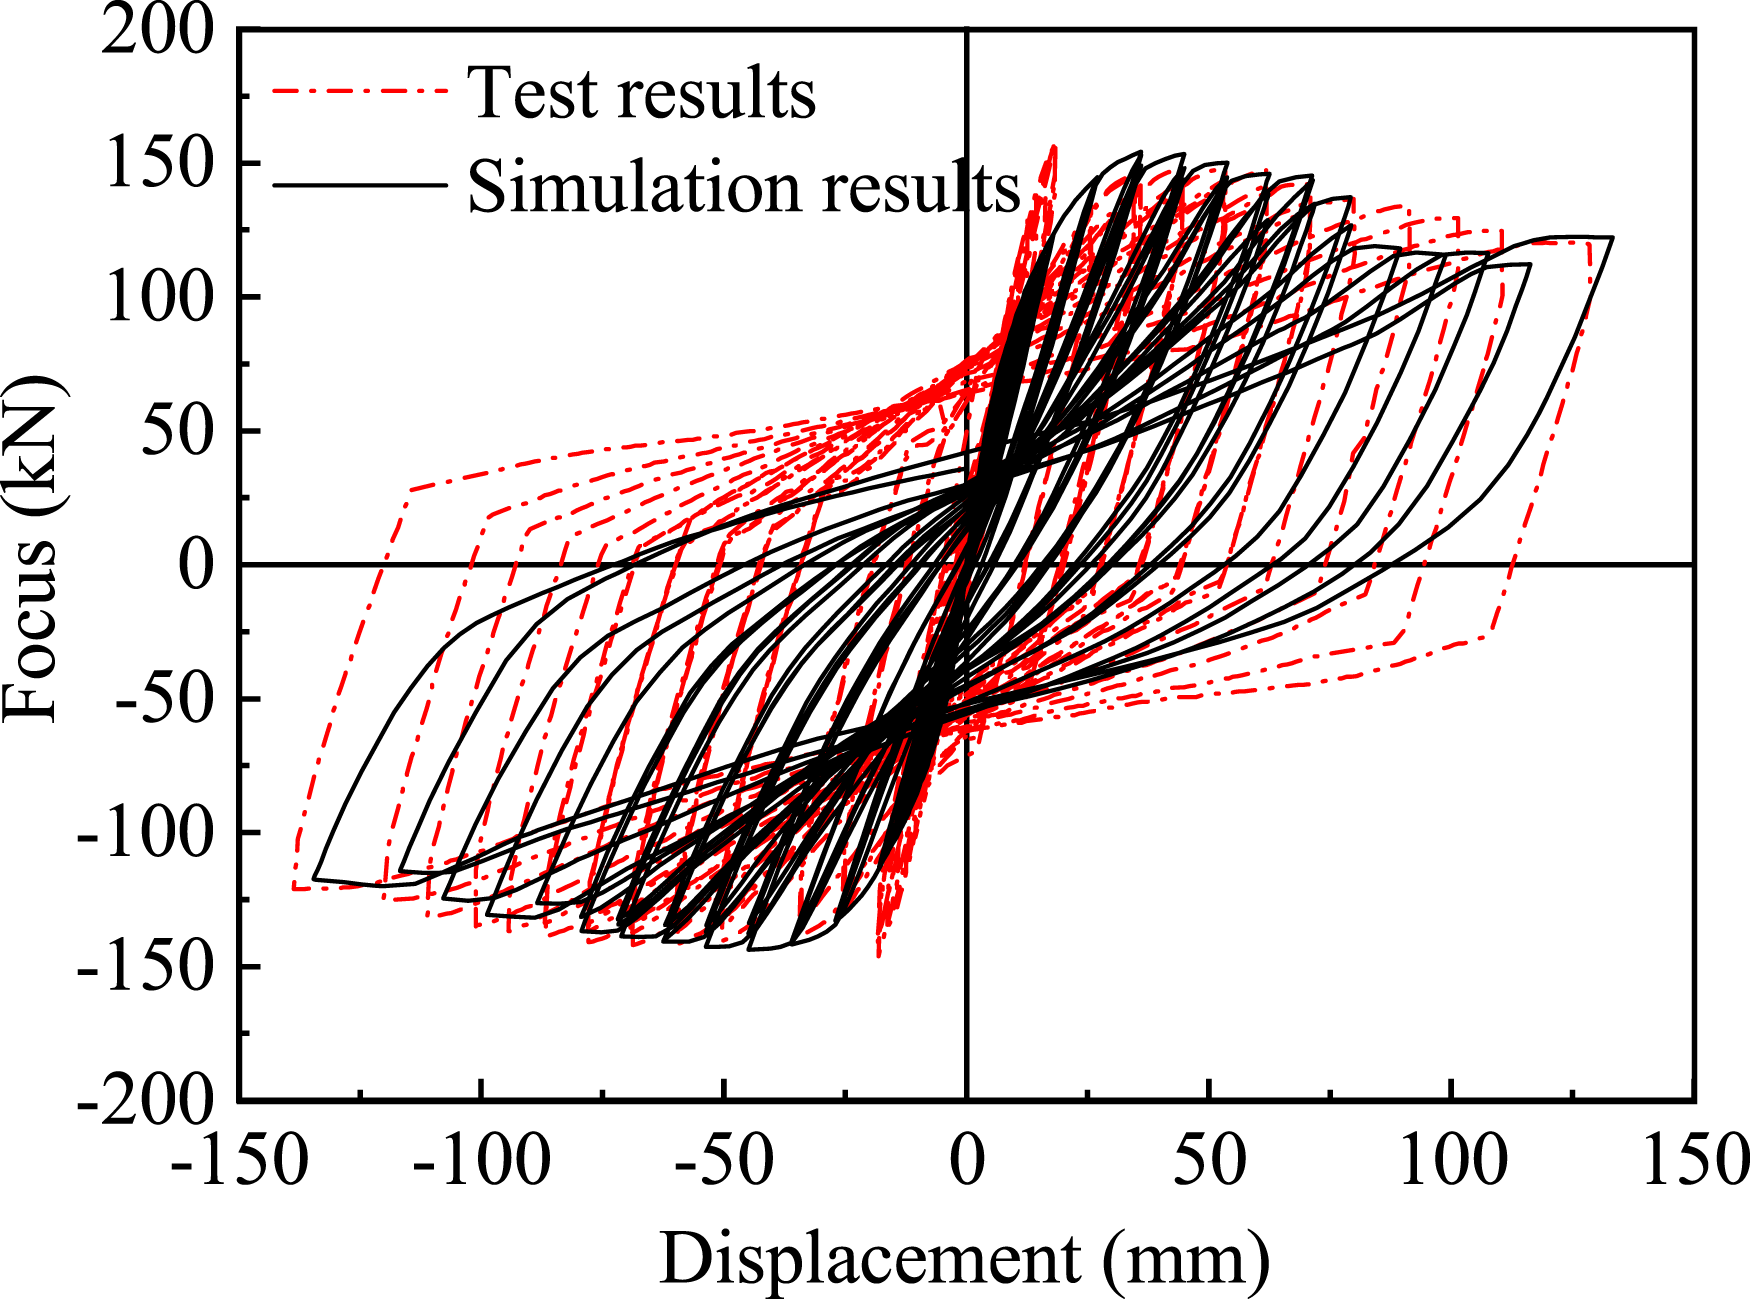
Establishment of the model
A planar frame selected from the prototype structure (designed in Section 2) was adopted for the seismic risk assessment. The seismic design intensity is 8° (the peak ground acceleration for a 10% exceedance probability in 50 years is 0.20 g), and the seismic design group is Group I. The site class of the prototype structure is class II (soil shear wave velocity 500 m/s ≥ v s ≥ 250 m/s). The finite element model for this frame was established using the verified modeling method.
Ten to 20 records are usually enough to provide sufficient accuracy in the assessment of seismic demands for mid-rise buildings (Asgarian et al., 2009; Shome, 1999). Thus, on the premise of ensuring that the magnitude, epicenter distance, site category, and peak acceleration are consistent with the seismic design conditions of the structure, a total of 20 earthquake ground motions were selected, as shown in Figure 10. The differences between the average response spectrum and design response spectrum are 13.33% and 18.92% in the controlling bands of [0.1, T
g
] and [T1 − 0.2, T1+0.5], respectively, which meets the requirements of the dual-frequency-domain controlling method (GB 50011-2010, 2016; Katsanos et al., 2010). Acceleration response spectrums of the earthquake records.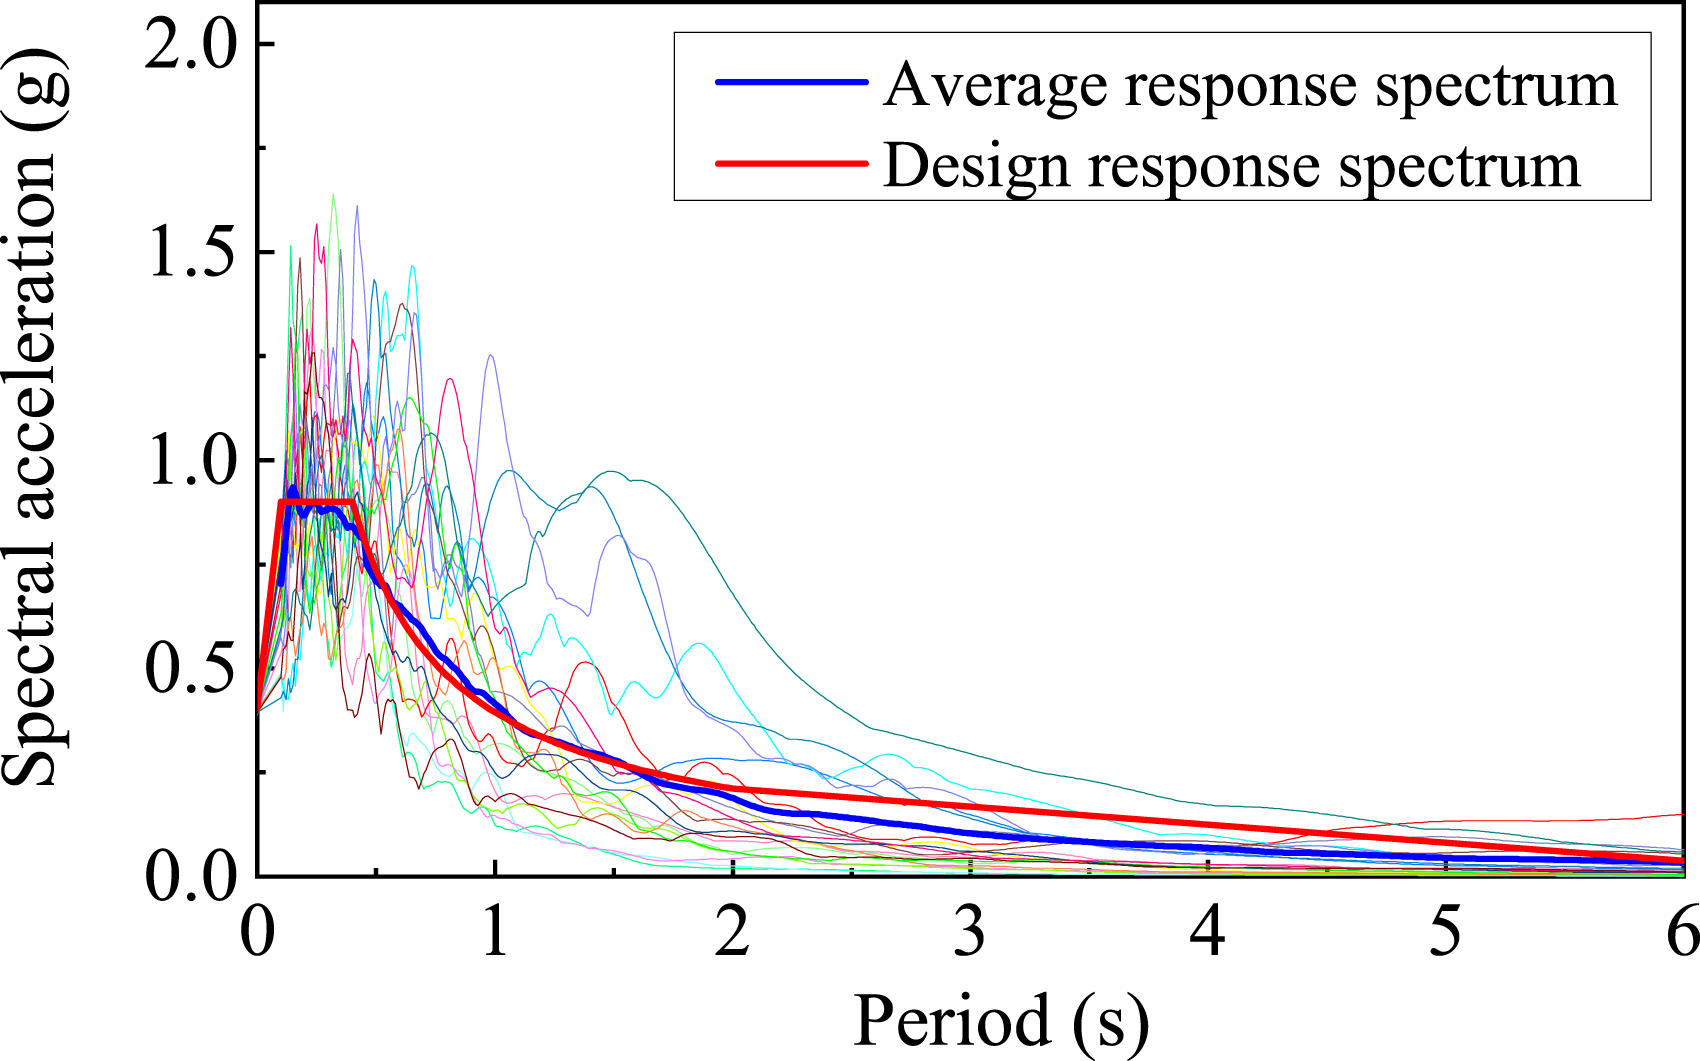
Analysis on the assessment results
IDA-based damage response
The IDA curves of the two DMs are shown in Figure 11. The relevant results will be recalculated when one DM (the maximum interstory drift ratio) is transferred to the other DM (proposed damage index). Meanwhile, the limit values of the two DMs at different performance levels are obtained based on the corresponding decrease amplitudes of IDA curve slope, which means that they have the same basis for taking limit values. Thus, the results from the two DMs in the same performance level can be obtained, and those are comparable to a certain extent. IDA curves. (a) Based on the component-based damage index. (b) Based on the maximum interstory drift ratio.
It can be seen that the curves obtained with different earthquake ground motions are diverse and scattered. However, linear elastic behavior was observed for all curves before the first sign of nonlinearity. The maximum interstory drift ratio and damage index increased with an increase in the intensity of earthquake ground motions, and the slopes of the curves decreased gradually with a limited decreasing rate. In the inelastic region, some curves displayed a softening behavior with a gradual degradation that tended to collapse, while the others displayed a weaving behavior indicating “excessive hardening” and “softening.” When the PGA increased to 1.0 g, the range of the maximum interstory drift ratios was mainly from 2.39% to 3.45%, and that of the damage indexes was mainly from 0.33 to 0.64.
The limits of component-based damage index and maximum interstory drift ratio corresponding to different performance levels are calculated based on IDA, as shown in Table 4. A comparison between the maximum interstory drift ratio and the proposed damage index obtained by the IDA is shown in Figure 12. It indicates that the points are distributed in a triangular area. The two DMs exhibit similar characteristics when describing the damage state of the structure. But the distribution of the points is more concentrated for the component-based damage index in different performance levels. Comparison between the maximum interstory drift ratio and the damage index.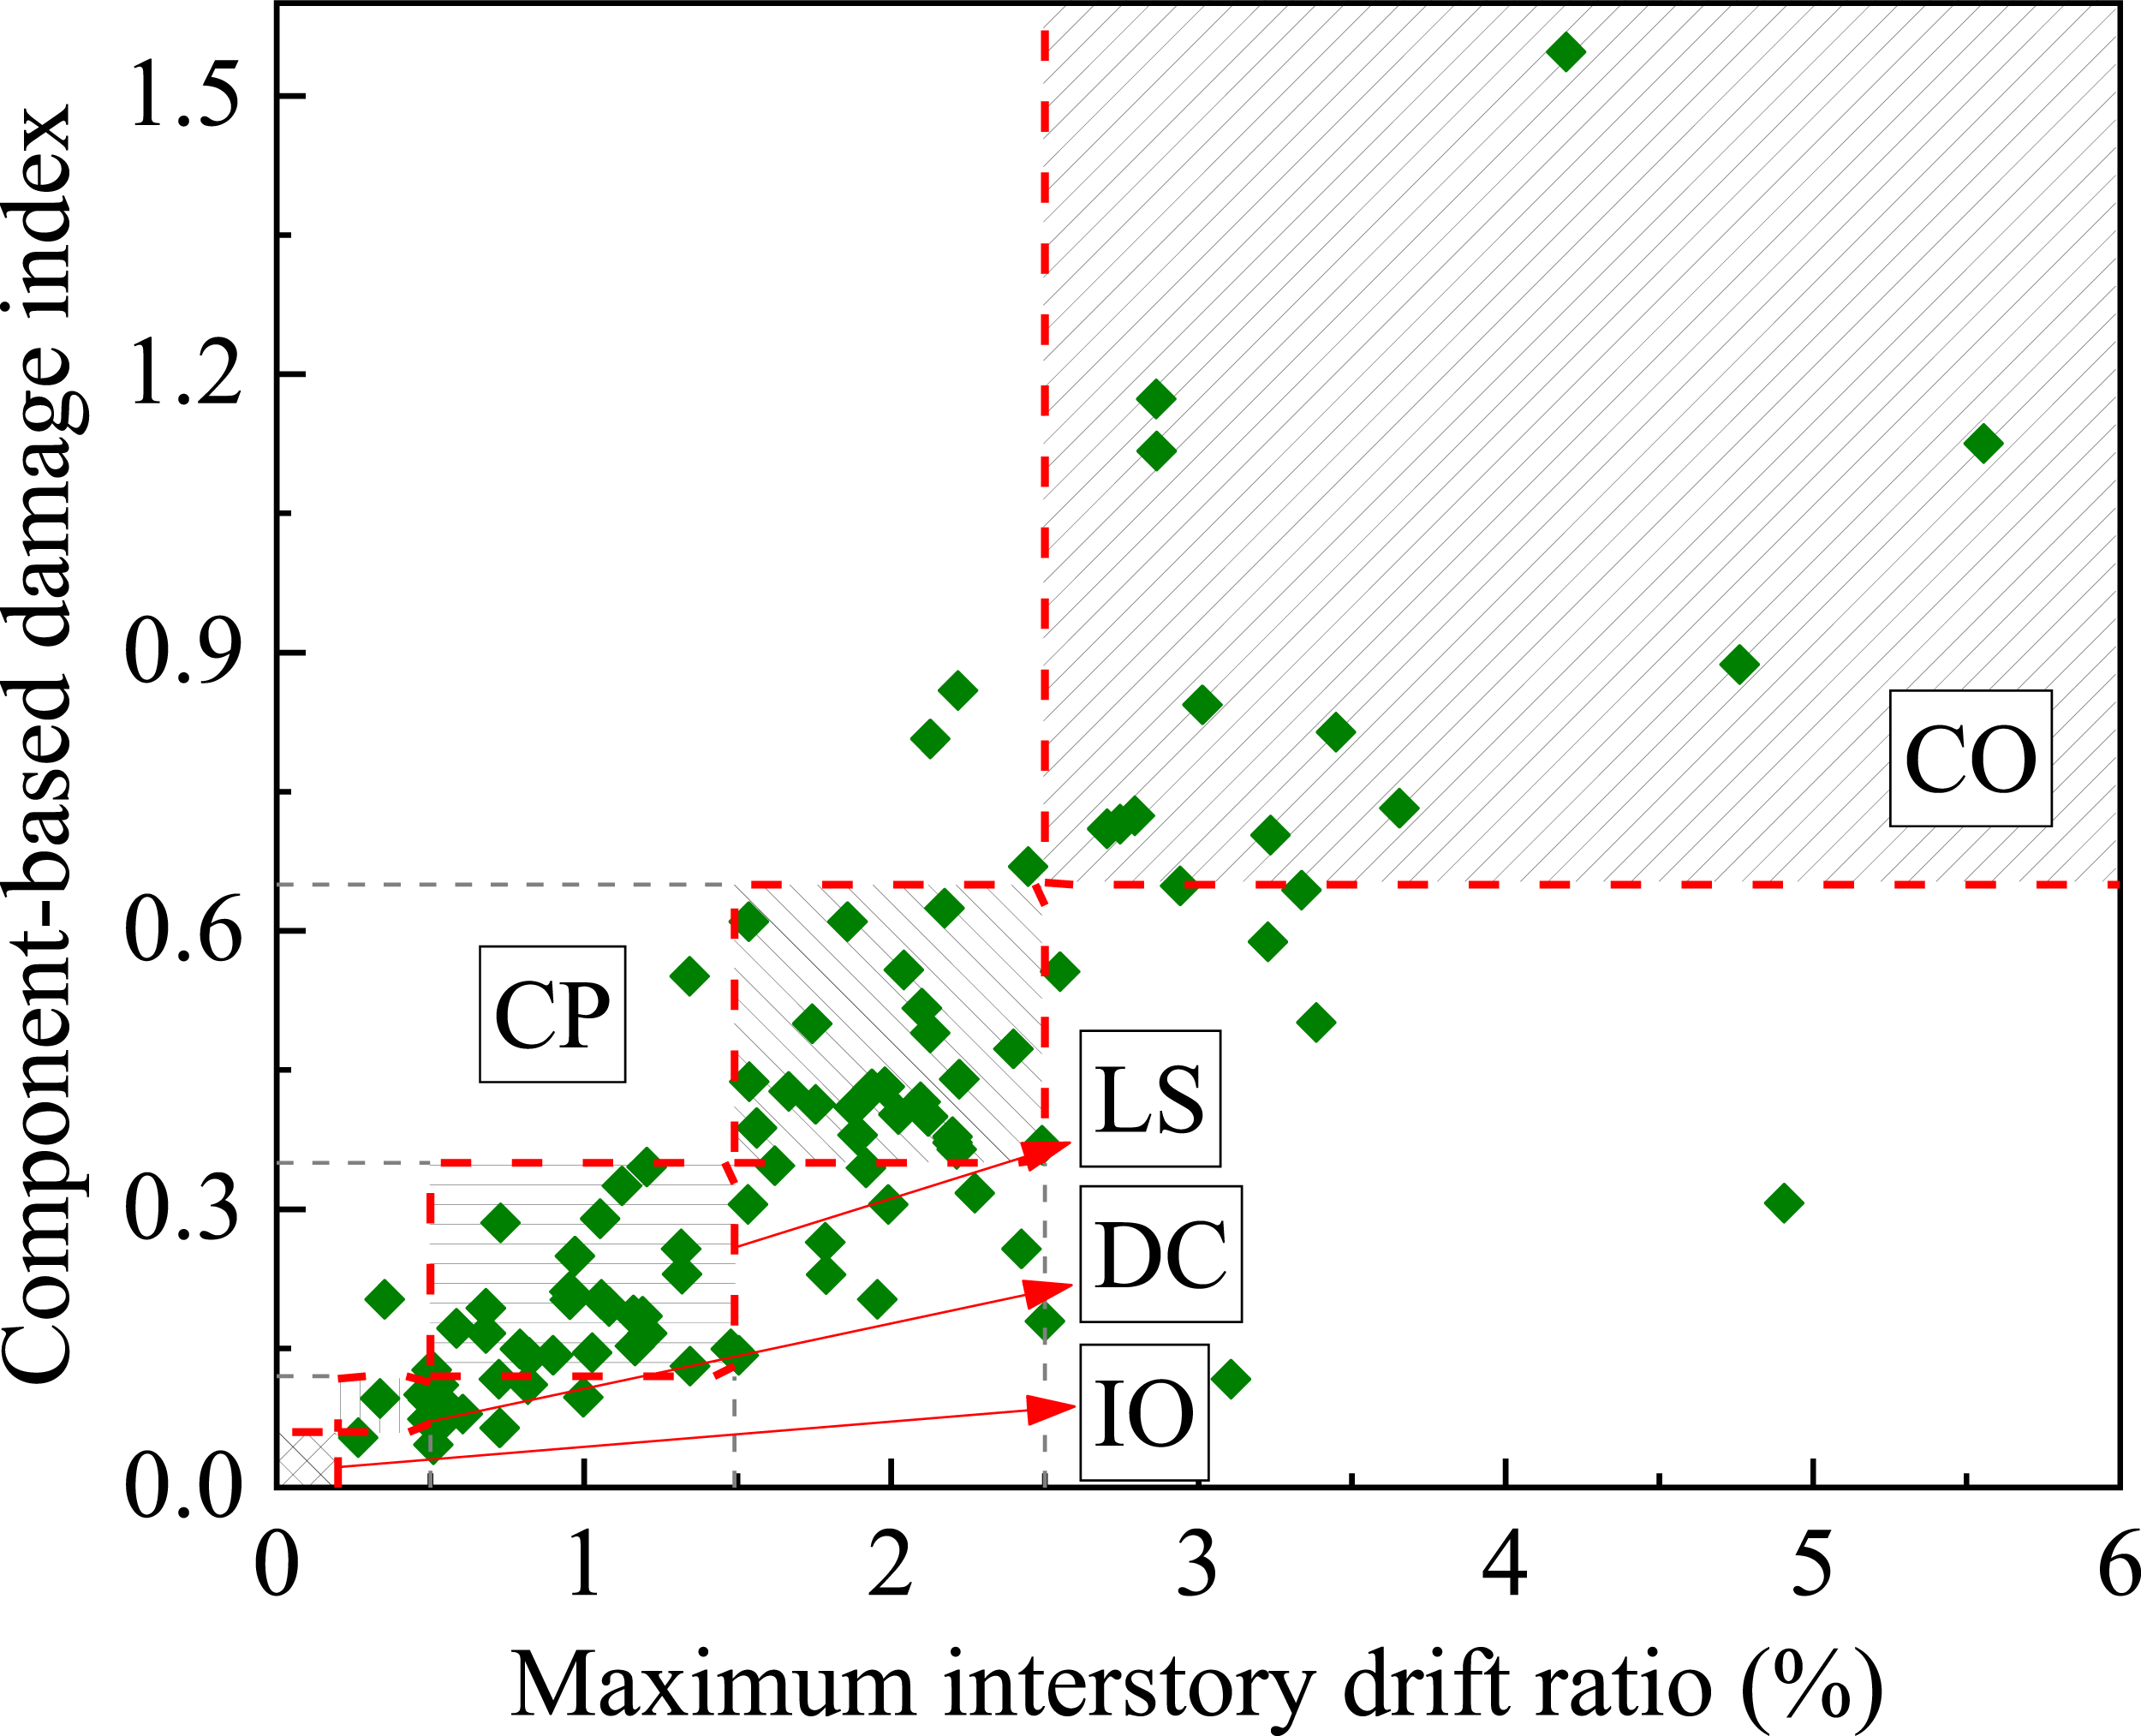
Seismic fragility analysis
The fragility curves are presented in Figure 13. The structure can easily reach or exceed the defined limits for the performance level of the IO in low-intensity earthquake ground motions, and the fragility curves based on the two DMs exhibit a similar trend for this performance level. Fragility curves. (a) Based on the component-based damage index. (b) Based on the maximum interstory drift ratio.
The slopes of the curves for the performance levels of DC and LS are relatively high compared to the full curves when the probability of exceedance is within the rage of 20%–80%. This case for the curves corresponding to the performance level of CO occurs when the probability of exceedance is within the rage of 10%–50%. These slopes based on the component-based damage index for the performance levels of DC, LS, and CO are 405.8, 171.7, and 137.7, respectively. But those based on the maximum interstory drift ratio are 245.4, 124.4, and 103.6, respectively, which is lower. This indicates that the component-based damage index has higher accuracy in predicting the damage degree of the structure.
When a minor earthquake ground motion (PGA is 0.07 g by the Chinese code (GB50011-2010, 2016)) is applied, the exceeding probabilities based on the component-based damage index for IO and DC are approximately 48.35% and 1.95%, respectively. Those based on the maximum interstory drift ratio are approximately 43.71% and 4.55%, respectively. As a moderate earthquake ground motion (PGA is 0.2 g by the Chinese code (GB50011-2010, 2016)) is applied, the exceeding probabilities based on the damage index for DC and LS are approximately 42.15% and 0.05%, respectively. Those for the maximum interstory drift ratio are approximately 28.07% and 0.03%, respectively. This indicates that the structure has good repairability within the seismic intensity range considered in the design.
The exceeding probability based on the maximum interstory drift ratio is higher for the performance levels of LS and CP. When an extremely rare earthquake ground motion (PGA is 0.64 g by the Chinese code (GB50011-2010, 2016)) is applied, the exceeding probabilities based on the maximum interstory drift ratio for LS and CP were 66.08% and 22.08%, respectively. Those based on the proposed damage index are 61.15% and 7.31%, respectively. The failure criterion based on the maximum interstory drift ratio only considers the first transcendental failure based on the displacement. The interaction between the components is not considered in this failure criterion. According to the test results in Section 2, the structure shows excellent ductility, and it still has a sufficient bearing capacity when the ratio reached the stated limit value. The component-based damage index can better reflect the actual damage state of the structure.
The probability curves of the performance levels are shown in Figure 14. The results based on the component-based damage index show several independent hump curves, which can more clearly indicate the performance levels of the structure. When the PGA is less than 0.6 g, the probabilities based on the two DMs exhibit a similar trend. However, the structure is mainly in the performance level of CP for the results based on the component-based damage index as the PGA varies in the range of 0.6–0.95 g. For the results based on maximum interstory drift ratio, the structure is mainly in the performance level of CP when the PGA varies in the range of 0.6–0.82 g, and that transform into the performance level of CO as the PGA increases. Probability curves of the performance level. (a) Based on the component-based damage index. (b) Based on the maximum interstory drift ratio.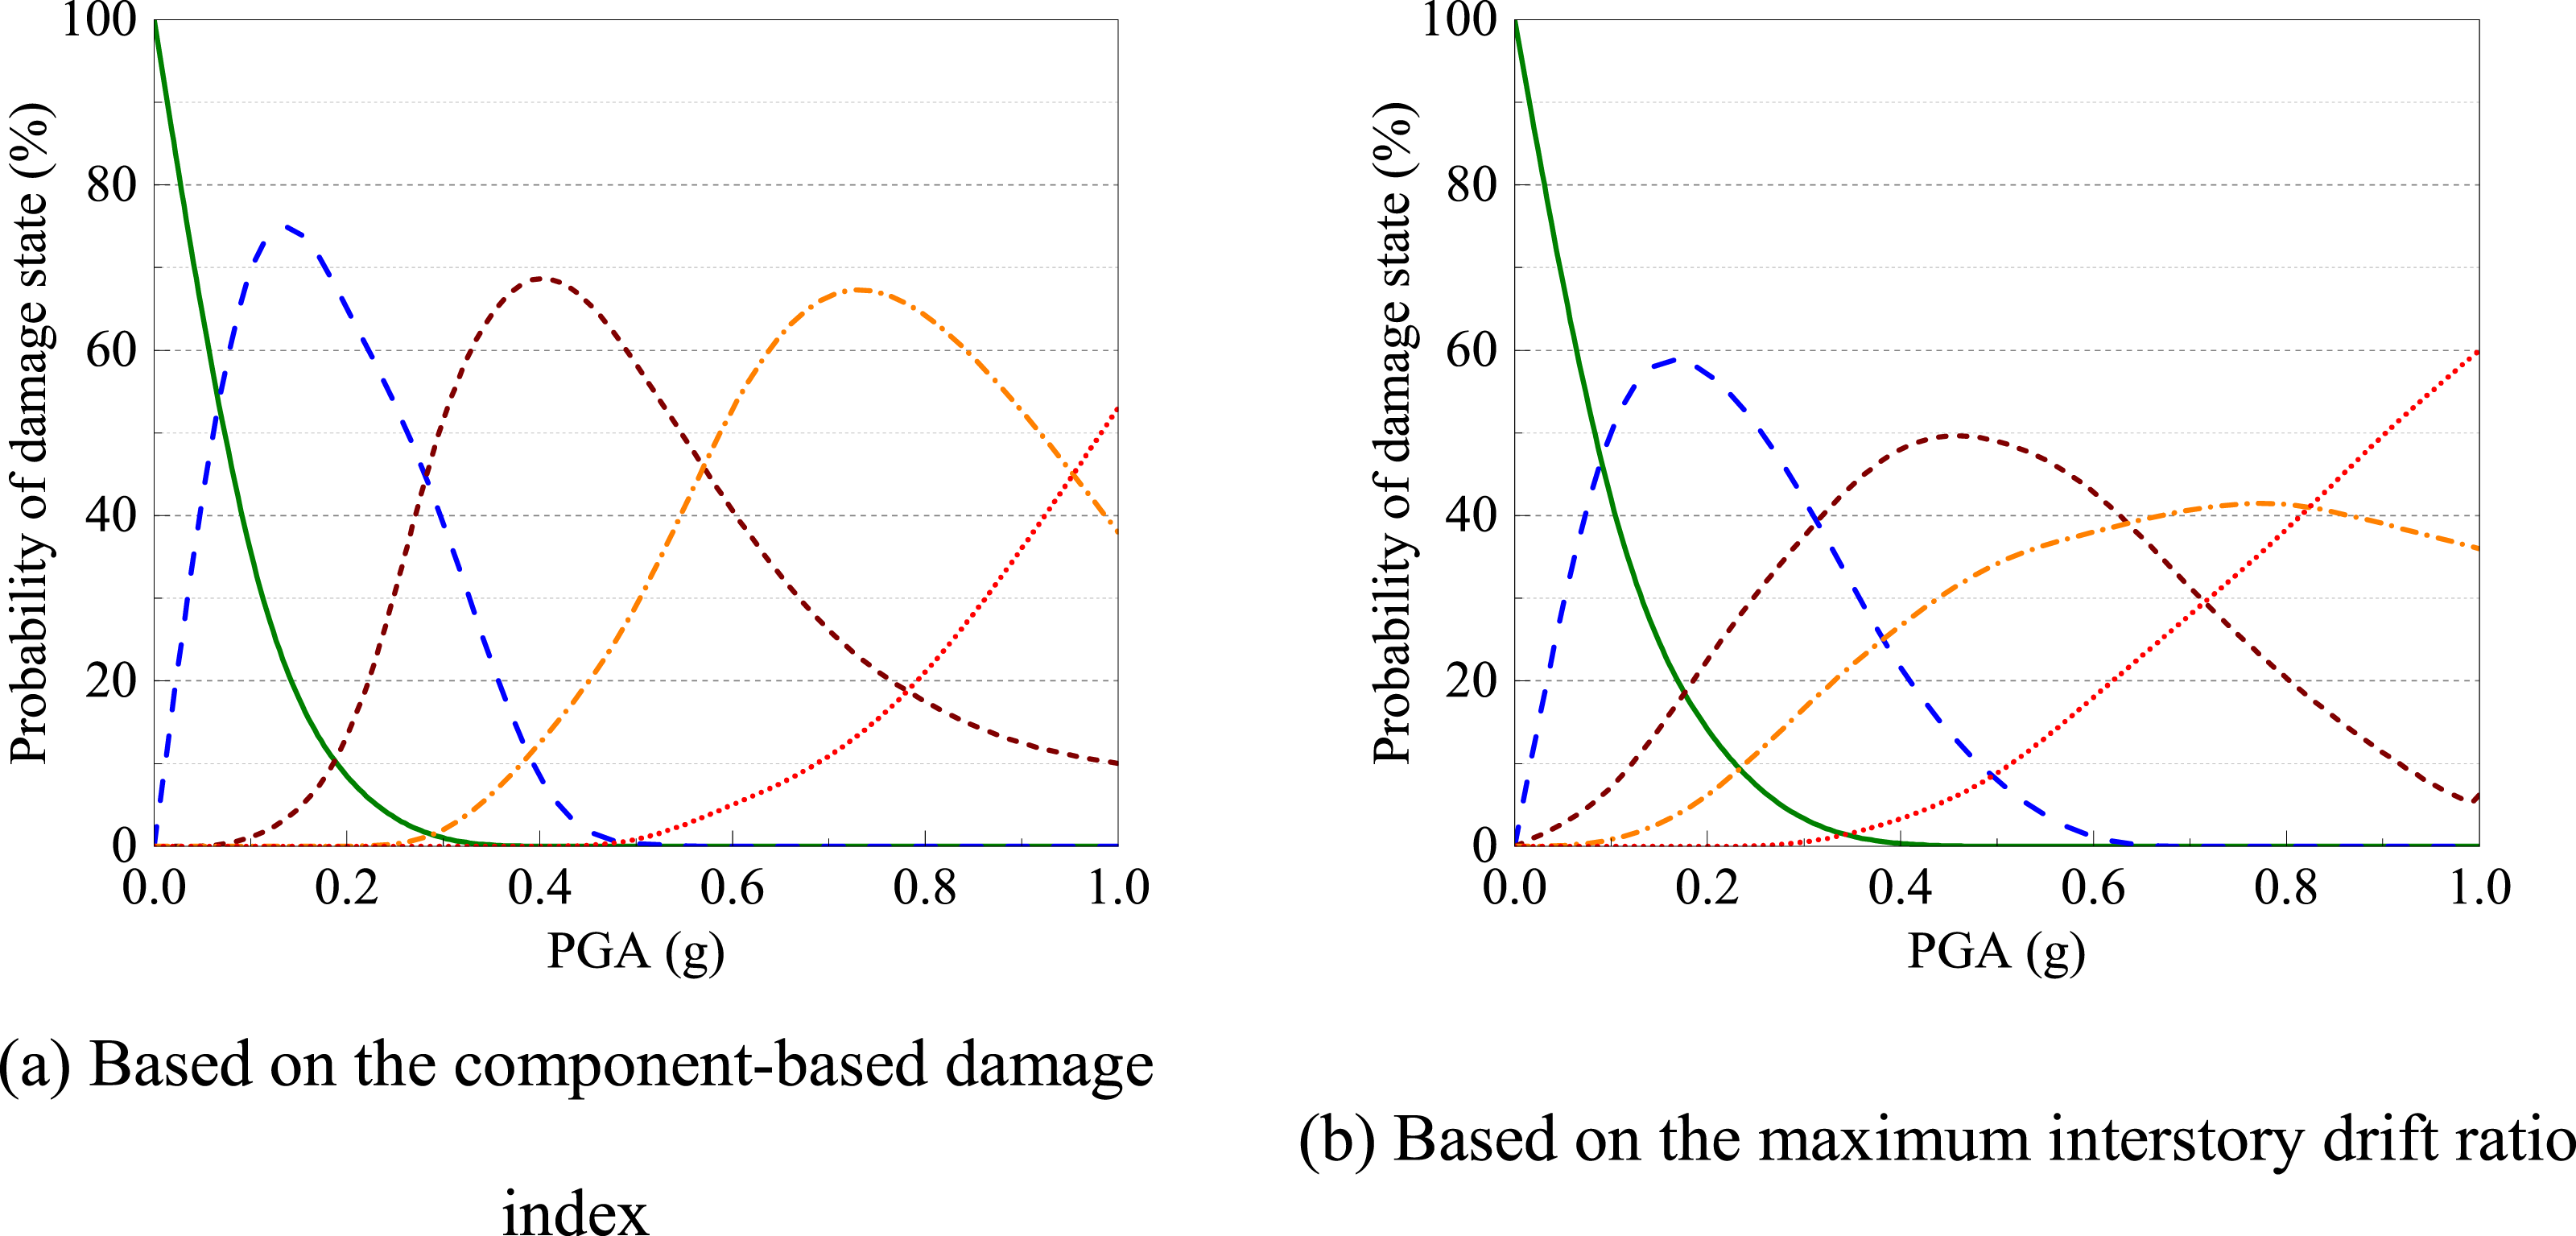
Seismic resilience analysis
The expectation curves of the loss functionality are shown in Figure 15. It can be seen that the loss functionality increases rapidly under a small ground motion intensity. As the intensity increases, the rate of increase gradually decreases. When the maximum interstory drift ratio is selected as the DM, the rate of increase is higher before the PGA reaches 0.25 g. Subsequently, the increase rates of the curves based on the two DMs are similar. The loss functionality based on the component-based damage index is approximately 17.1% lower than that based on the maximum interstory drift ratio. Expectation curves of the loss functionality.
The structure with the performance levels of the IO and DC is repairable (Ghobarah, 2001). The structure achieves these two performance levels when the PGA is less than 0.13 g when the component-based damage index is employed as the DM, and it is 0.08 g when the maximum interstory drift ratio is employed as the DM. Hence, the resilience analysis mainly focuses on a structure subjected to a ground motion with an intensity less than these two values.
The functional recovery curves for different ground motion intensities are shown in Figure 16. The values smaller than zero in the x-axis indicate the recovery has not begun. To simplify the calculation difficulty, the recovery duration is unitized. The curves marked in red are obtained at the performance level of the IO, and the other curves are obtained at other performance levels. It can be seen that the structure with the performance level of IO has a higher repairability, and the recovery rate decreases significantly when 12.6% of the recovery duration passes. The structure with the performance level of DC has a higher repairability in the initial and late phases of the restoration activities. Meanwhile, there is a stasis of functionality recovery with a duration of approximately 62.5% of the recovery duration. Comparing the results based on two different DMs, the results obtained with the maximum interstory drift as the DM exhibit a higher repairability in the initial phases of the restoration activities, but it decreases in the later phases. Functional recovery cures. (a) Based on the component-based damage index. (b) Based on the maximum interstory drift ratio.
Conclusions
This study proposes a damage index and probabilistic seismic performance assessment method with the consideration of the influences of components on the overall structure. The following conclusions were drawn. (1) A quasi-static test on three RC frame specimens was carried out. It was shown that the damage degree of the external components at the lower storys was more severe than that of the internal components at the upper storys. In addition, although the individual local areas of the specimens have suffered severe damage, their curves decreased gently after the peak point, especially a more gradual descent stage can be observed for specimen FS. What’s more, the maximum interstory drift ratios of specimens at different performance levels are not match the corresponding limiting values in current codes. (2) A component-based damage index was proposed, which considered the influences of the differences in component locations and the damage of components on the overall structure. And the limits of that corresponding to different performance levels were provided. Compared with the interstory drift ratio, the component-based damage index has higher accuracy in predicting the damage degree of the structure. It considers the interaction between the components and can better reflect the actual damage state of the structure. (3) The probability of the damage state of a RC frame structure was evaluated through the proposed assessment method. It was indicated that the structure could easily reach or exceed the defined limits for the performance levels of the IO and DC in low-intensity earthquake ground motions. However, there was a high probability that the structure would achieve a performance level of CP when the PGA varied in the range of 0.6 g to 0.78 g. The structure showed satisfactory anti-collapse capacity under rare earthquake ground motions. (4) An analysis method was developed to assess the structural resilience of a RC frame structure. It was shown that, at a performance level of the IO, the structure had a higher repairability. When the structure achieved the performance level of DC, a higher repairability was observed in the initial and late phases of the restoration activities.
Footnotes
Declaration of conflicting interests
The author(s) declared no potential conflicts of interest with respect to the research, authorship, and/or publication of this article.
Funding
The author(s) disclosed receipt of the following financial support for the research, authorship, and/or publication of this article: This work was supported by the National Natural Science Foundation of China No. 51578077, the National Natural Science Foundation of China No. 52408214, and the Special Scientific Research Programme Project of Shaanxi Provincial Department of Education No. 23JK0561.