
Abstract
This paper aims to promote the application of coarse aggregate ultra-high-performance concrete (CA-UHPC) wet joints for precast CA-UHPC bridge decks, advancing lightweight and long-durability bridges using accelerated bridge construction (ABC) technology. To enhance the crack resistance at the precast slab-wet joint interface, a steel-CA-UHPC composite wet joint including an attached steel plate at the end of the precast slab connected with the post-casting CA-UHPC by studs, was proposed. Eight static and one fatigue specimens were tested under negative moments on the effects of steel reinforcement lap-splice lengths and curing methods on failure modes, crack patterns, and load-displacement relationships. The improvements of attached steel plates in flexural strength, stiffness, crack resistance, and anti-fatigue behavior were discussed. The test results showed that the contact lap-splice length of steel bars of 10 d (d is the bar diameter) could provide comparable behavior to the welded reinforcements. The proposed wet joint increased the cracking and peak loads by 32.67% and 8.48%, respectively than those without steel plates. After 2 million cycles the maximum crack width was 0.13 mm and the residual strength was still maintained by 90%. These findings demonstrated that the precast CA-UHPC bridge decks with the composite wet joints had excellent service performance.
Introduction
Steel-concrete composite beams offer significant advantages, such as lightweight, high strength, and superior spanning capabilities (Nie, 2011). To facilitate transportation and installation, the bridge deck of a composite beam bridge was typically constructed by combining prefabrication with on-site assembly (Su et al., 2015; Zhu et al., 2020a). The full-depth precast bridge deck panel (PBDP) has become increasingly popular in accelerated bridge construction (ABC), as it greatly simplifies the construction of superstructures and significantly reduces construction-related pollution (Tan et al., 2022). Compared to traditional cast-in-situ methods, this approach effectively reduced environmental dependency, labor costs, and time-consuming (Hu et al., 2023a). Additionally, using full-depth PBDPs minimized traffic disruptions and lowered life cycle costs (Turmo et al., 2006).
The connections of PBDPs include dry and wet joints. Dry joints, such as the bolted-welded joint (Wang et al., 2019a; Zhao et al., 2019), can significantly speed up construction but consume a lot of steel components, while wet joints provide strong structure integrity, high load-carrying capacity, and low life-cycle maintenance cost. In particular, the wet joints have been widely employed in the PBDP systems to promote the ABC in normal concrete (NC) bridge decks and the connections between two full-depth PBDPs attracted many researchers’ attention. Under the vehicle loads and negative bending moments NC bridge decks were commonly faced with issues such as cracking, water seepage, and the resultant corrosion of the steel reinforcements within wet joint regions (Issa et al., 1995; Li et al., 2013), resulting in the degradation of both structural durability and integrity (Hou et al., 2018; Hu et al., 2023b; Schlafli and Bruhwiler, 1998; Wu et al., 2022). The sudden slippage failure of the steel reinforcements also might occur (Issa et al., 1995) and thus a sufficient wet joint length was required for anchoring the enough long steel reinforcements whereby the too-wide joint would increase on-site labor. Therefore, an innovative bridge slab system with strengthened old-new concrete interface connections was desired to improve structural performance and construction efficiency.
As a cement-based composite material, UHPC possesses higher compressive (>150 MPa) and tensile (>7 MPa) strengths, as well as superior post-cracking behavior due to the dispersed steel fibers (Qi et al., 2017; Zhu et al., 2020b). Replacing the NC with UHPC has the potential to achieve the above-mentioned goal (Lu et al., 2021). The shapes of UHPC wet joints mainly include diamond (Graybeal, 2010; Peng and Yan, 2022), dovetail (Qi et al. 2019, 2020), and plane interfaces (Pan et al., 2016; Peng and Yan, 2022), as well as T-shaped wet joints (Qiu et al., 2022). Different interface shapes have a significant but little effect on crack resistance and ultimate bearing capacity, respectively (Jia et al., 2023). Among these wet joints, rectangular wet joints are popular in engineering projects due to their ease of construction site (Deng et al., 2023; Jia et al., 2024).
Numerous studies have been conducted on the connection performance of UHPC wet joints (Lu et al., 2025). Tayeh et al. (2012) demonstrated that UHPC enhanced the bonding strength and permeability resistances at the new-to-old concrete interface. Arafa et al. (2016) experimentally found that UHPC wet joints maintained the continuity of two adjacent precast panels. Jiang et al. (2022) conducted tests on 13 slabs and found that the ultimate load of the precast slab with UHPC joints decreased by 9% to 22% compared to the cast-in-situ slabs. It was recommended that the width of wet joints and the anchorage length of steel bars be greater than 12.5d and 10d, respectively. Moreover, the fatigue resistance of UHPC wet joints has also been tested. After one million cycles no significant damage was found in UHPC wet joints (Aaleti et al., 2011) while the residual strength of UHPC wet joints was still greater than the requirements of the AASHTO code after two million cycles (Saleem et al., 2015). Graybeal (2014a) found that a lap-spliced length of 9.375d could meet the anchorage requirements under fatigue loading. Graybeal (2014b) also studied the performance of UHPC wet joints for NC bridge panels and revealed that straight-lapped bars ensured superior mechanical properties of wet joints compared to prefabricated slabs, with no debonding observed at new-to-old concrete interfaces under cyclic loading. Additionally, more steel fibers could improve the energy dissipation capacity, crack resistance, and ductility of the beam, with a fiber content of 2.5% offering optimal interface tensile strength and fracture toughness (Yang et al., 2014).
Although the common UHPC (without coarse aggregate, CA) has excellent mechanical properties in wet joints, another issue should be considered in practical bridge engineering that the high autogenous shrinkage (>400 με) of UHPC is at risk of cracking and the higher cost than NC may limit its large-scale application (Xie et al., 2018; Zhu et al., 2021, 2022). One potential solution is to add the CA into UHPC partially replacing binders to develop the CA-UHPC material (Alsomiri et al., 2023). To ensure that CA-UHPC maintained a strain-hardening response, a steel fiber content of 2.5% was recommended (Shi et al., 2023). It has been successfully applied to the bridge deck of the Fifth Nanjing Yangtze River Bridge, China, yielding significant profits (Wang et al., 2019b), in which the CA-UHPC bridge deck was designed as thin as 170 mm fully using both high compressive and tensile strengths, adopted in this study. To develop the precast steel-concrete continuous composite beam bridges with ABC, an innovative steel-CA-UHPC composite wet joint was proposed by connecting two precast slabs using a bottom pre-embedded steel plate with welded studs and the post-casting CA-UHPC, as shown in Figure 1. It has indicated that the high elastic modulus and stiffness of CA helped mitigate the shrinkage of UHPC and correspondingly increased its compressive strength but reduced the tensile strength as well as toughness (Li et al., 2022). Such a wet joint was beneficial in simplifying the construction by using the attached steel plates as the bottom mold of post-casting wet joints and increasing the initial crack strength at the new-to-old CA-UHPC interface by enhancing local stiffness. Steel-CA-UHPC composite wet joint in the PBDP system. (a) Composite bridge system. (b) Details of the proposed wet joints.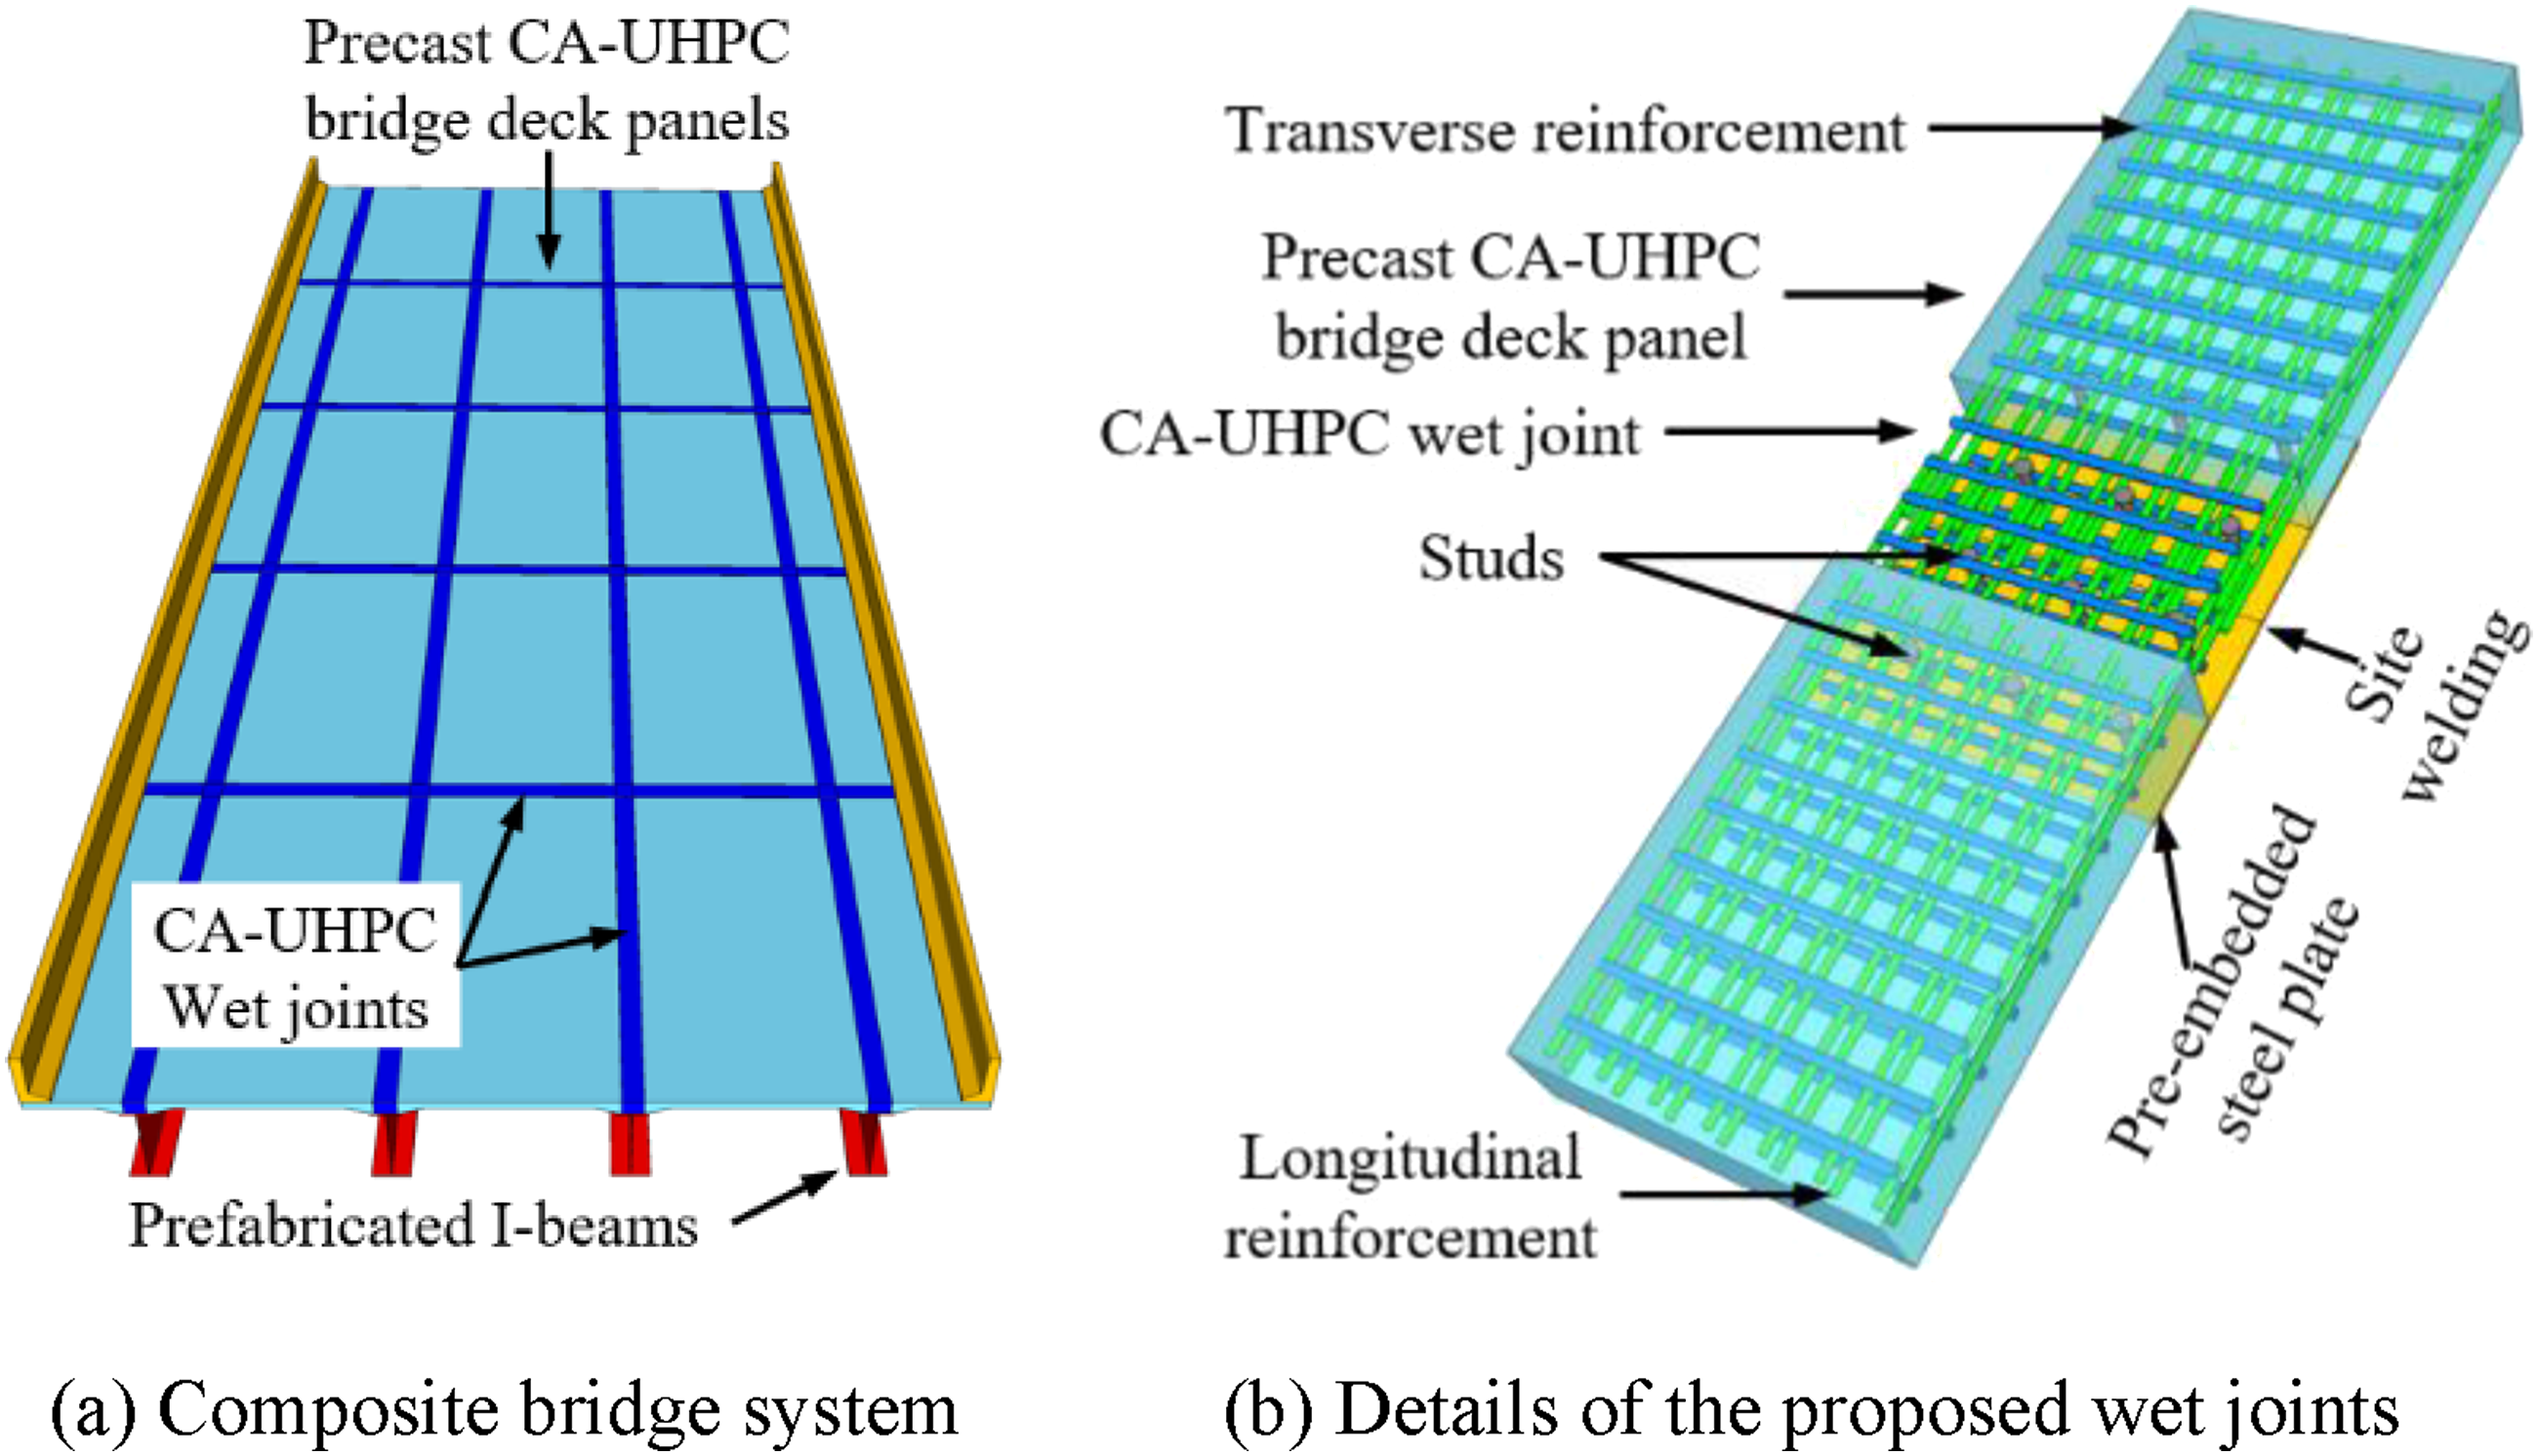
Previous studies focused more on the static performance of precast UHPC slabs with different concrete wet joint constructions but less on the proposed steel-CAUHPC composite wet joints, especially under negative moments. Additionally, steel fibers were considered to extend fatigue life by slowing the fatigue crack propagation due to their bridging crack capacity. However, the inclusion of CA might disrupt steel fiber dispersion, increasing the risk of early fatigue failure (Islam et al., 2025). Therefore, it is of great significance to conduct more tests on the static and fatigue performance of CA-UHPC wet joints.
In this paper, a total of eight static specimens were tested on the effects of lap-splice lengths, connection technologies of steel reinforcements, and wet joint curing methods on failure modes, crack patterns, and load-displacement relationships. The minimum lap-splice length of steel reinforcement was determined and the improvements of steel plate on the static performances of wet joints were discussed in detail. Moreover, one fatigue specimen was tested to evaluate its anti-fatigue behavior including the fatigue strength and stiffness degradation. These results provide valuable insights for promoting the application of precast bridge slabs with steel-CA-UHPC wet joints in composite bridges.
Experimental program
Specimen details
Design of specimens.
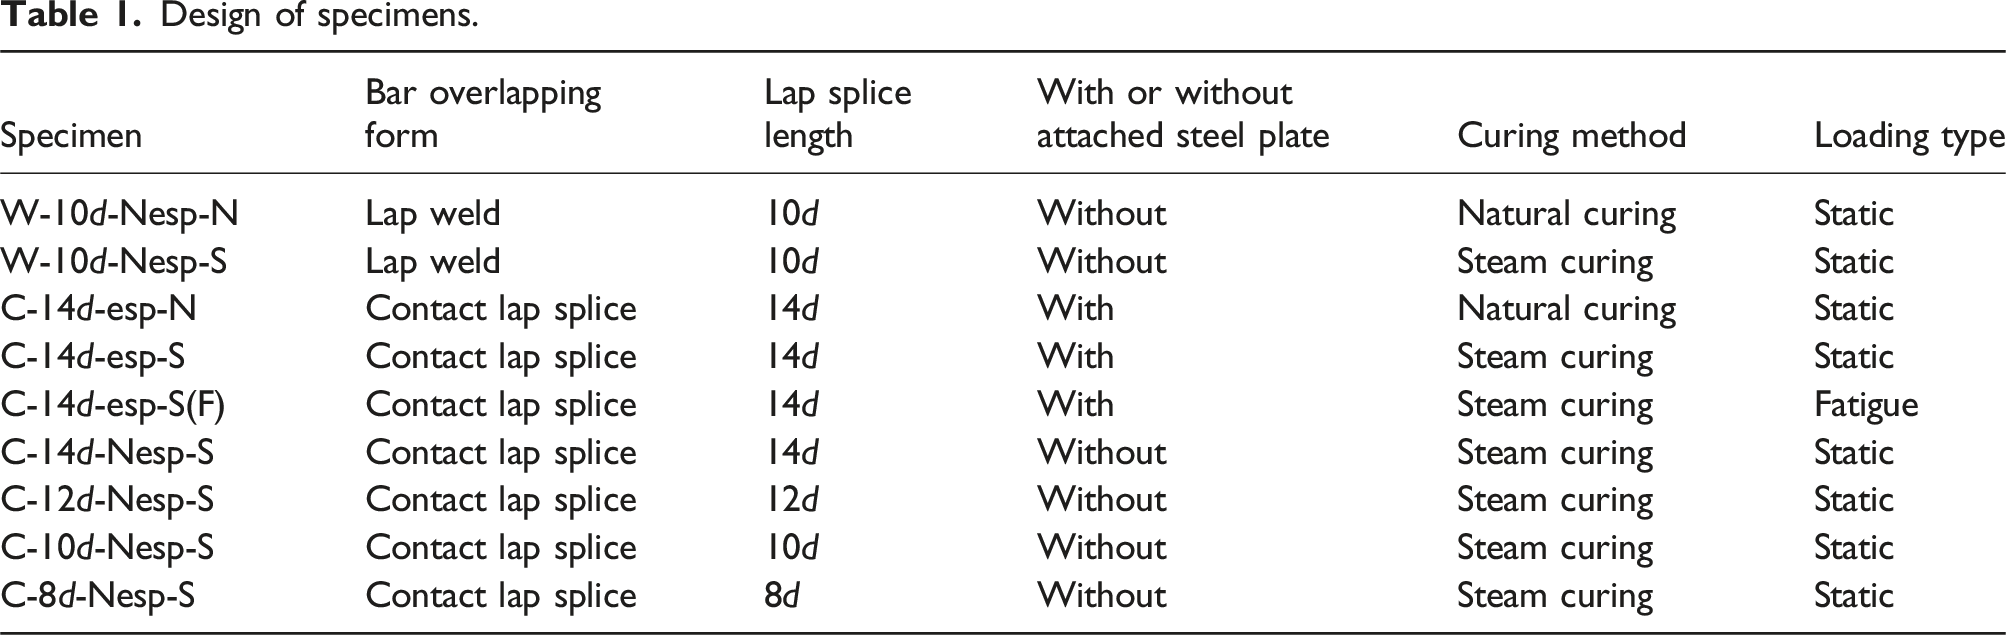
The detailed geometric dimensions and reinforcements of the precast CA-UHPC deck slabs and wet joints are shown in Figure 2. All specimens had the same geometric dimensions with a length of 2430 mm, a width of 670 mm, and a thickness of 170 mm. Each specimen consisted of two precast CA-UHPC panel elements and a 400-mm-length post-casting CA-UHPC wet joint. As illustrated in Figure 2(b), each PBDP had the attached steel plate with a dimension of 200 mm in length, 335 mm in width, and 12 mm in thickness, which was connected with the post-casting wet joints by three 22-mm-diameter and 100-mm-length studs, spaced along the longitudinal slab span and transverse directions at 100 and 200 mm, respectively. The attached steel plates of two adjacent PBDPs were butt-welded together before casting the CA-UHPC. Dimensions and configurations of tested specimens (unit: mm). (a) Specimen without attached steel plate. (b)Specimen with attached steel plate.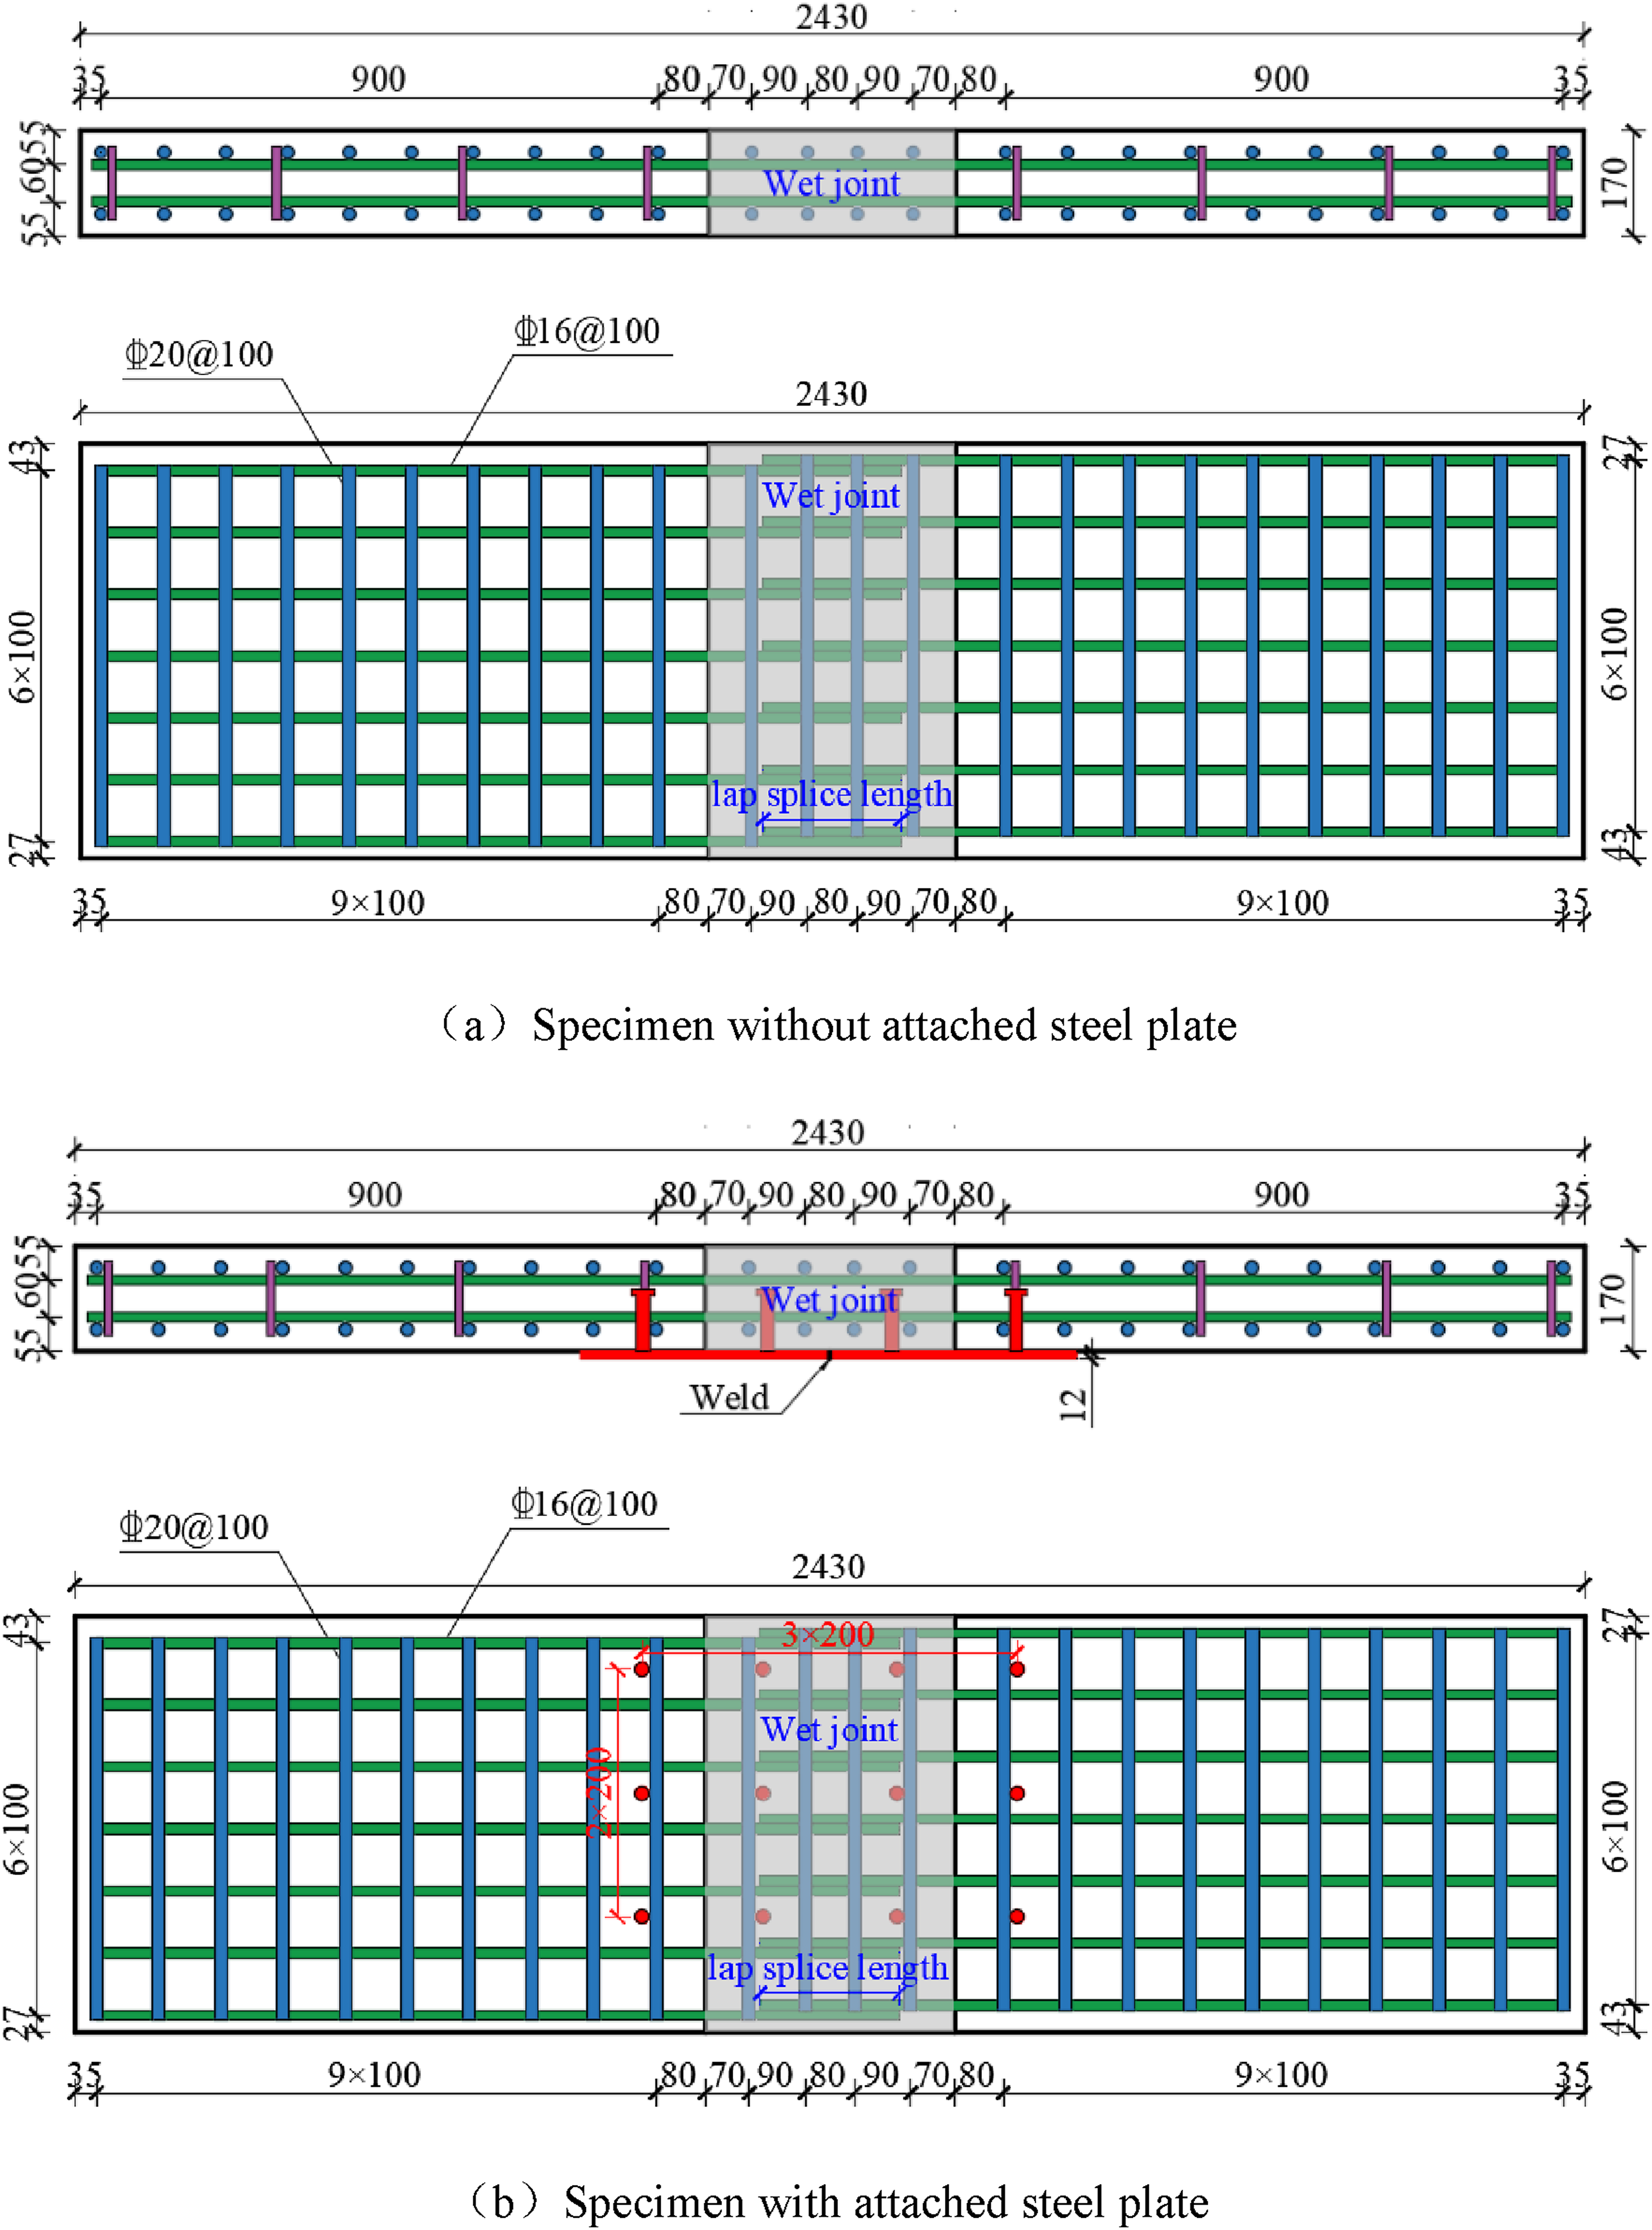
Photographs of the different types of wet joints are shown in Figure 3. The specimens were reinforced longitudinally with 16-mm-diameter bars spaced at 100 mm on both tension and compression areas, and transversely reinforced with 20-mm-diameter steel reinforcements spaced at 100 mm, providing the same longitudinal and transverse reinforcement ratios of 1.83% and 2.29%. The 12 mm diameter stirrups were placed with a cover thickness of 20 mm. Typical photos of wet joints. (a) W-10d-Nsep-N. (b) C-14d-esp-N. (c) C-14d-Nsep-S.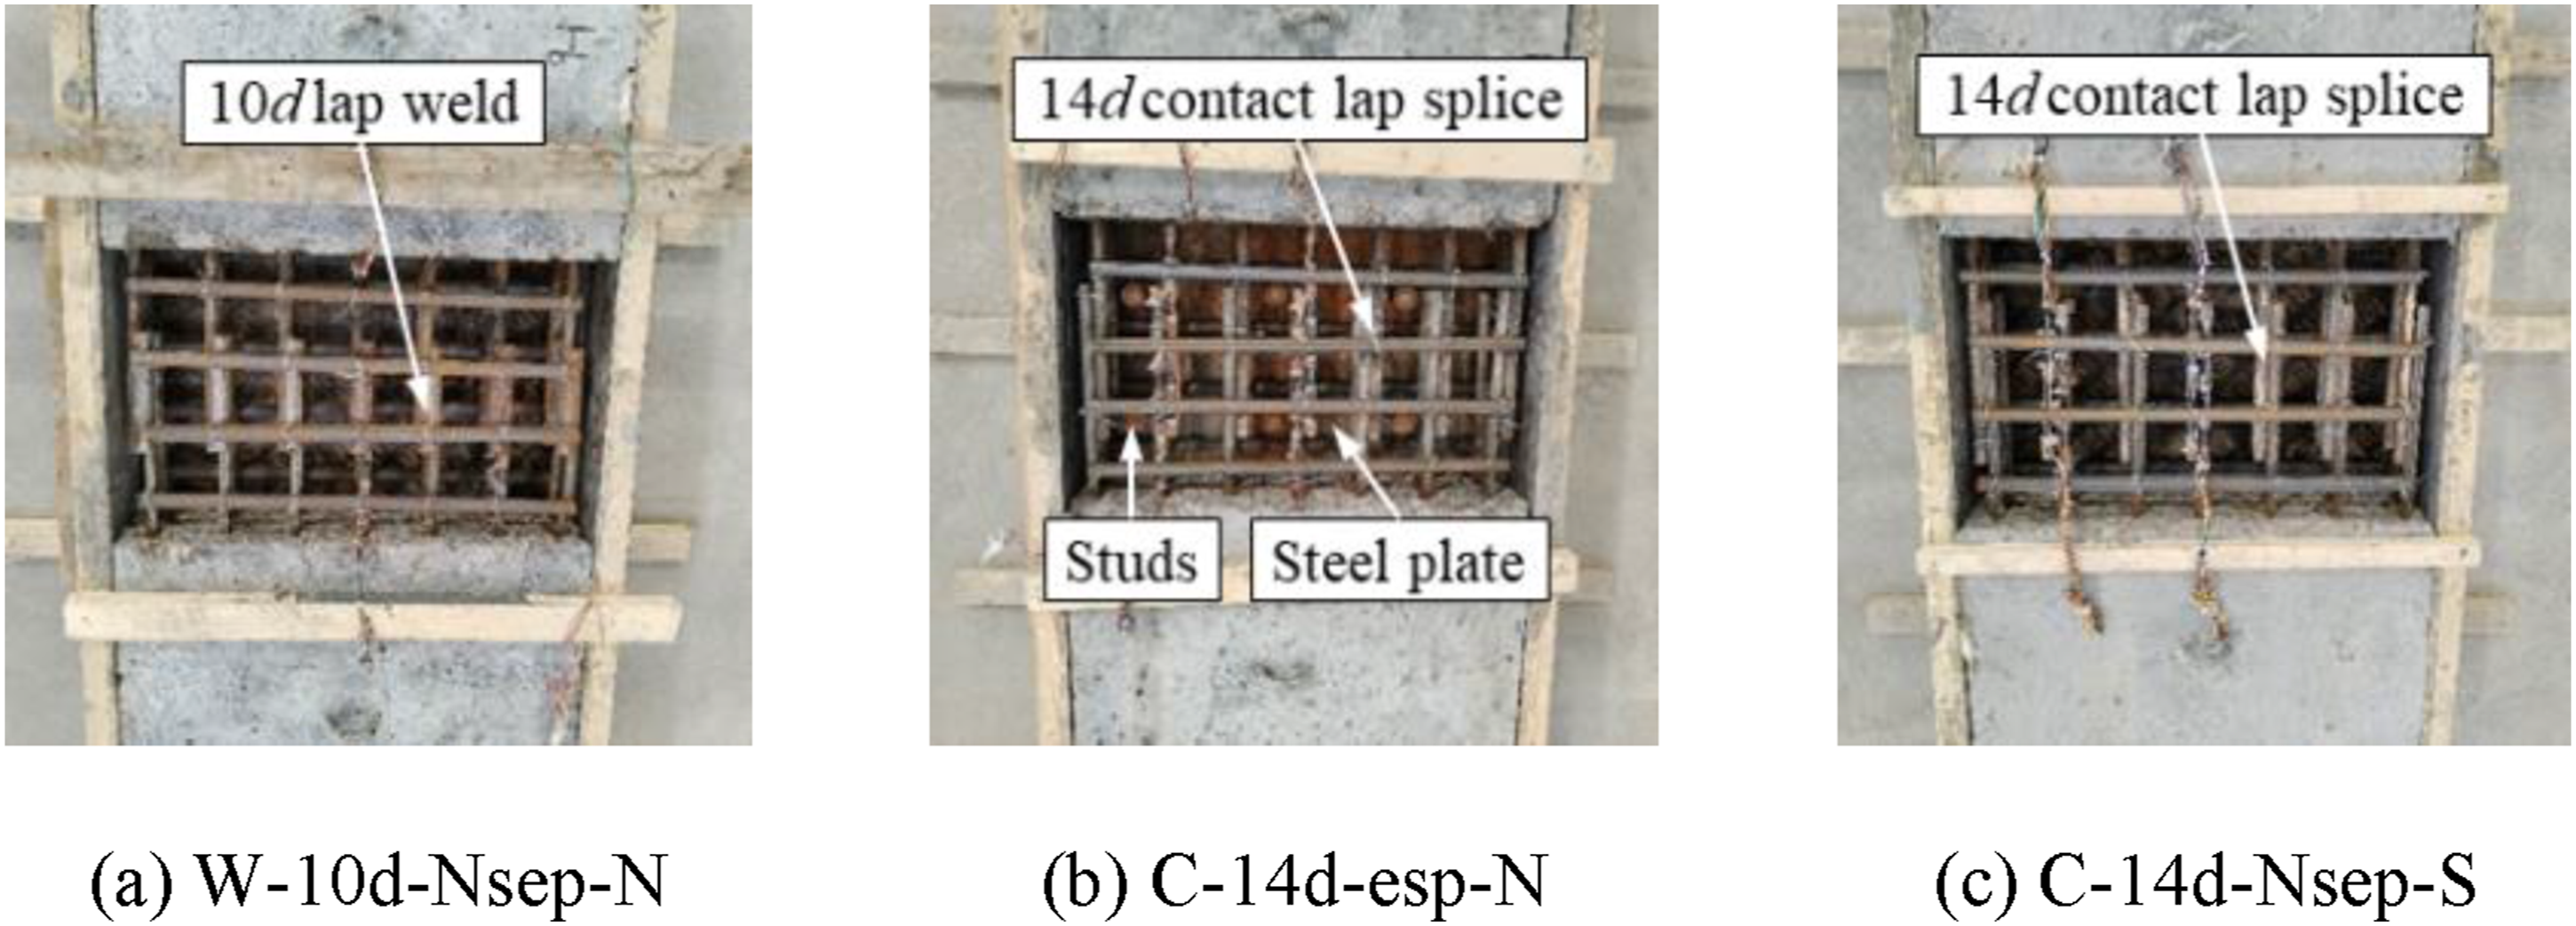
Fabrication of the specimens
The fabrication processes of the specimens are illustrated in Figure 4. First, the CA-UHPC panel elements on both sides were produced. Once the compressive strength reached approximately 15 MPa, the interface was roughened using a water jet. After 2 days of steam curing at 90°C, the wet joints were cast. Construction process of tested specimen. (a) Pouring of PBDP. (b) Water gun chiseling. (c) Pouring of wet joints.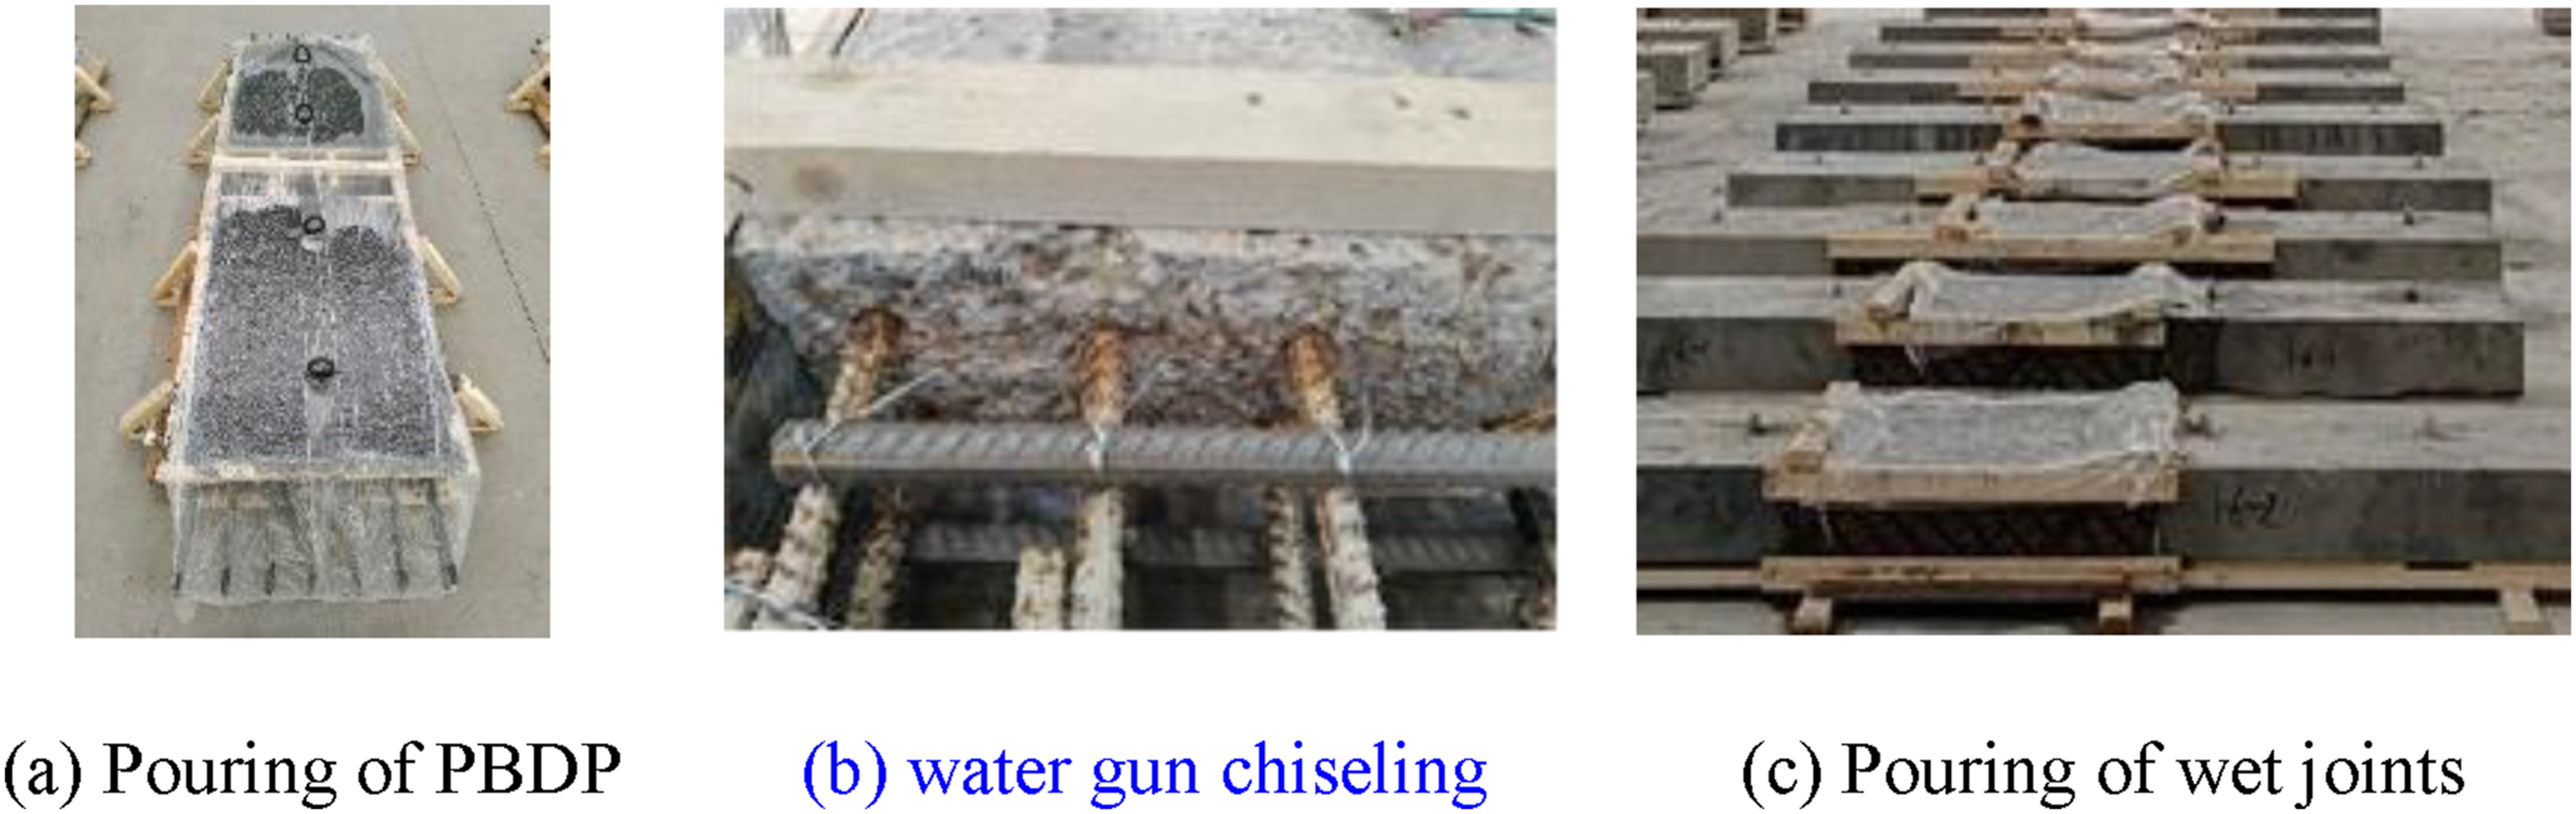
Test setup
The specimen was subjected to four-point bending using a 200-ton MTS hydraulic actuator. The pure bending region of the specimen was measured for 750 mm in length, with the wet joint positioned at the center of this section, as illustrated in Figure 5. During the static test, three loading rates were applied: (1) 5 kN/min before the initial crack, (2) 10 kN/min after concrete cracking, and (3) a displacement-controlled method by 5 mm/min was applied until failure after the yielding of the longitudinal reinforcement. Five LVDTs with an accuracy of 0.01 mm were placed at two supports, two loading points, and the center of the wet joint to measure the mid-span and supporting deflections. Test setup and measurements. (a) Static test setup (unit: mm). (b) Fatigue test setup (unit: mm). (c) Loading phase and procedure. (d) Strain measurements of reinforcement.
As shown in Figure 5(b), the setup for the fatigue test differs from that of the static test. To prevent displacement separation between the actuator and the specimen during cyclic loading due to inconsistent stiffness, a stiffer loading beam was used and connected to both the specimens and the actuator through bolting and welding, as employed in reference (Xu et al., 2024) while the bolts were also used to connect the bearings and specimens. In this study, the fatigue load was determined by reference to the Ningchu Expressway engineering project (JSTI GROUP, 2022), which was a steel-CA-UHPC continuous composite beam bridge with spans of 3 × 35 m using both prefabricated bridge panels and wet joints. Within the negative bending moment zone the tensile force of the wet joint at the serviceability limit state was selected as the upper fatigue limit (Gara et al., 2013), set at 40 kN whereas the lower fatigue limit was determined as 10% of the upper fatigue limit. Figure 5(c) depicts the fatigue loading regime. Load-deflection curves and crack widths were measured at intervals of 0, 10 thousand, 20 thousand, 50 thousand, 100 thousand, 200 thousand, 500 thousand, 1 million, 1.2 million, 1.5 million, and 2 million cycles. After 2 million cycles, the specimen was statically tested to failure to obtain its residual strength. The fatigue loading frequency was set as 3 Hz. As shown in Figure 5(d), five strain gauges were positioned along the length of the tensile steel bar within the wet joint’s center to record its tensile strain. Crack widths were measured using a crack observation instrument with an accuracy of 0.01 mm.
Material proportions and properties
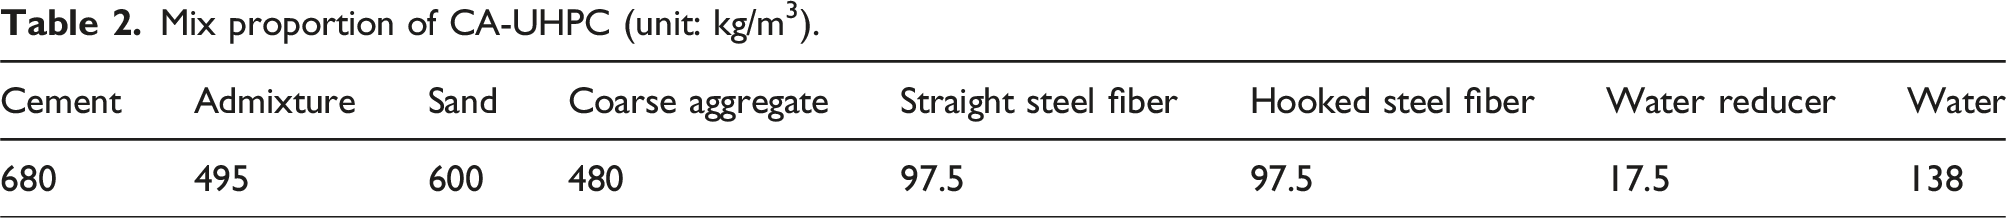
Mix proportion of CA-UHPC (unit: kg/m3).
Mechanical properties of CA-UHPC.

Note. f cu : compressive strength; E c : elastic modulus; f f : flexural strength; Mean: average value; SD: standard deviation.
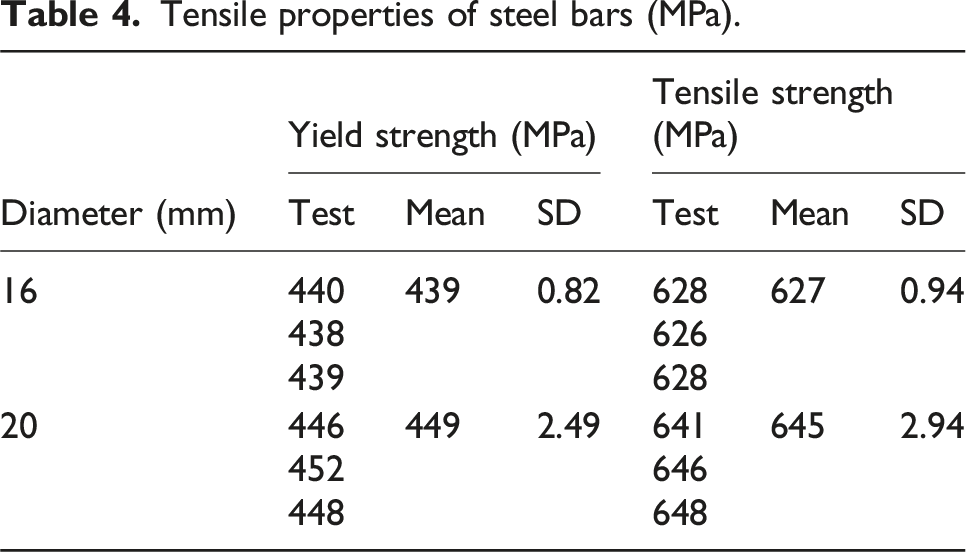
Tensile properties of steel bars (MPa).
Static test results and discussions
Failure modes and crack pattern
Figure 6 shows the failure modes and crack patterns of the eight static specimens. As the load increased, the wet joint-to-prefabricated panel interface began to crack and propagate rapidly. Afterward, cracks appeared within the wet joint, then formed beneath the loading points, and finally developed between two loading points and supports. Especially the crack opened soon when the tensile steel bar within the wet joint yielded. Typical failure modes of the specimens.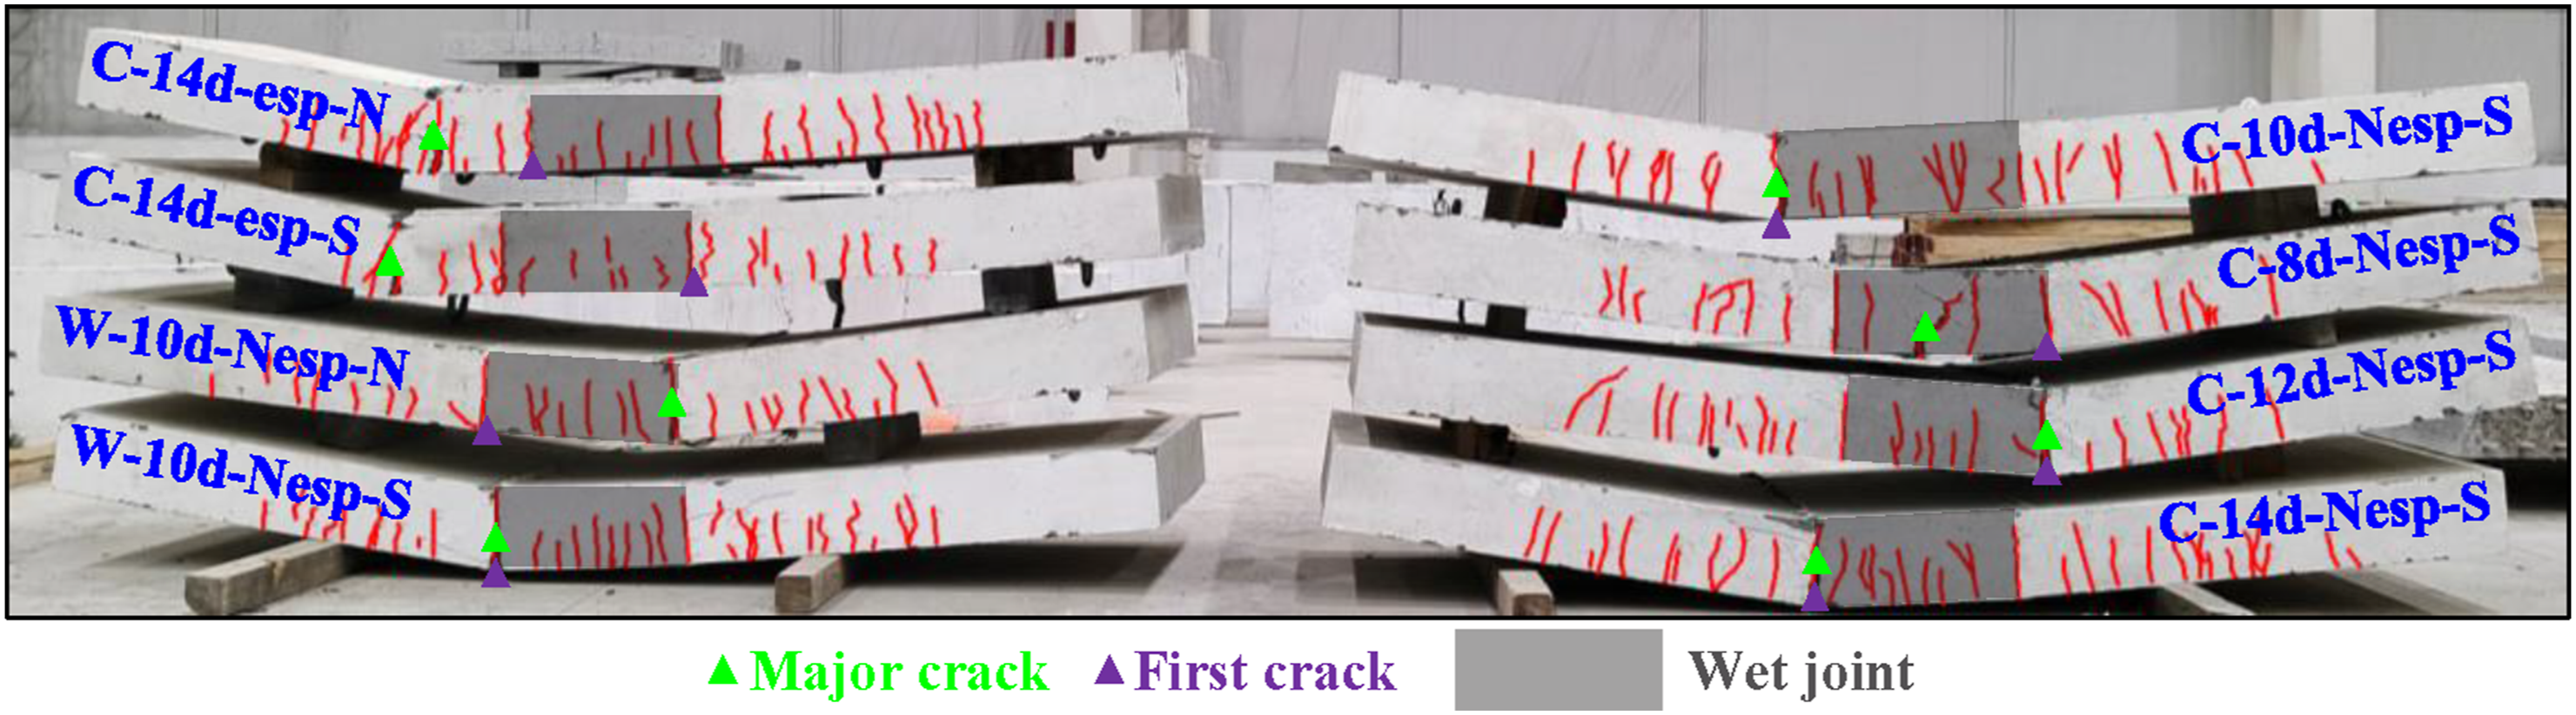
The specimens without attached steel plates failed because of the tensile fracture of steel reinforcement at the wet joint-to-prefabricated panel interface, accompanied by local crushing of the concrete at loading points, except for specimen C-8d-Nesp-S, which failed due to cohesion failure between the lap steel reinforcements and the concrete within the wet joint. In contrast, all specimens with attached steel plates failed due to the tensile fracture of the steel reinforcement at the end of the steel plate.
Load-deflection curves
Figure 7 presents the load-midspan displacement curves of static specimens. In Figure 7(a), the curing method shows little influence on the stiffness and ultimate strength of the specimen while Figure 7(b) indicates that the strength and stiffness of the contact lap-splice specimen were slightly larger than those of the welded specimen, and the attached steel plate can improve the peak load and elastic stiffness by 32.67% and 8.48%, respectively, which confirmed the feasibility of the contact lap-splice scheme and the enhancement effect of the attached steel plate. Along with the failure modes as discussed above, the additional attached steel plate was beneficial in transferring the increasing load from the new-old concrete interface to the end of the attached steel plate by the welded studs in the compression region and by the longitudinal steel reinforcements in the tension region. In addition, the steel plate composited with the concrete improved the local bending stiffness of the wet joint, resulting in a slowly increased load in the concrete and thus a significant increase in cracking resistance. Ultimately, in specimen C-14d-Nesp-S the fracture of longitudinal tensile steel reinforcements occurred at the old-new concrete interface preventing further tensile load transfer. Instead, the steel reinforcement fractured at the end of the steel plate for specimen C-14d-esp-S by transferring the load across the interface through steel reinforcements, resulting in a higher failure load. Load-midspan displacement curves of static specimens. (a) Effect of curing method. (b) Effect of attached steel plate. (c) Effect of lap-splice length.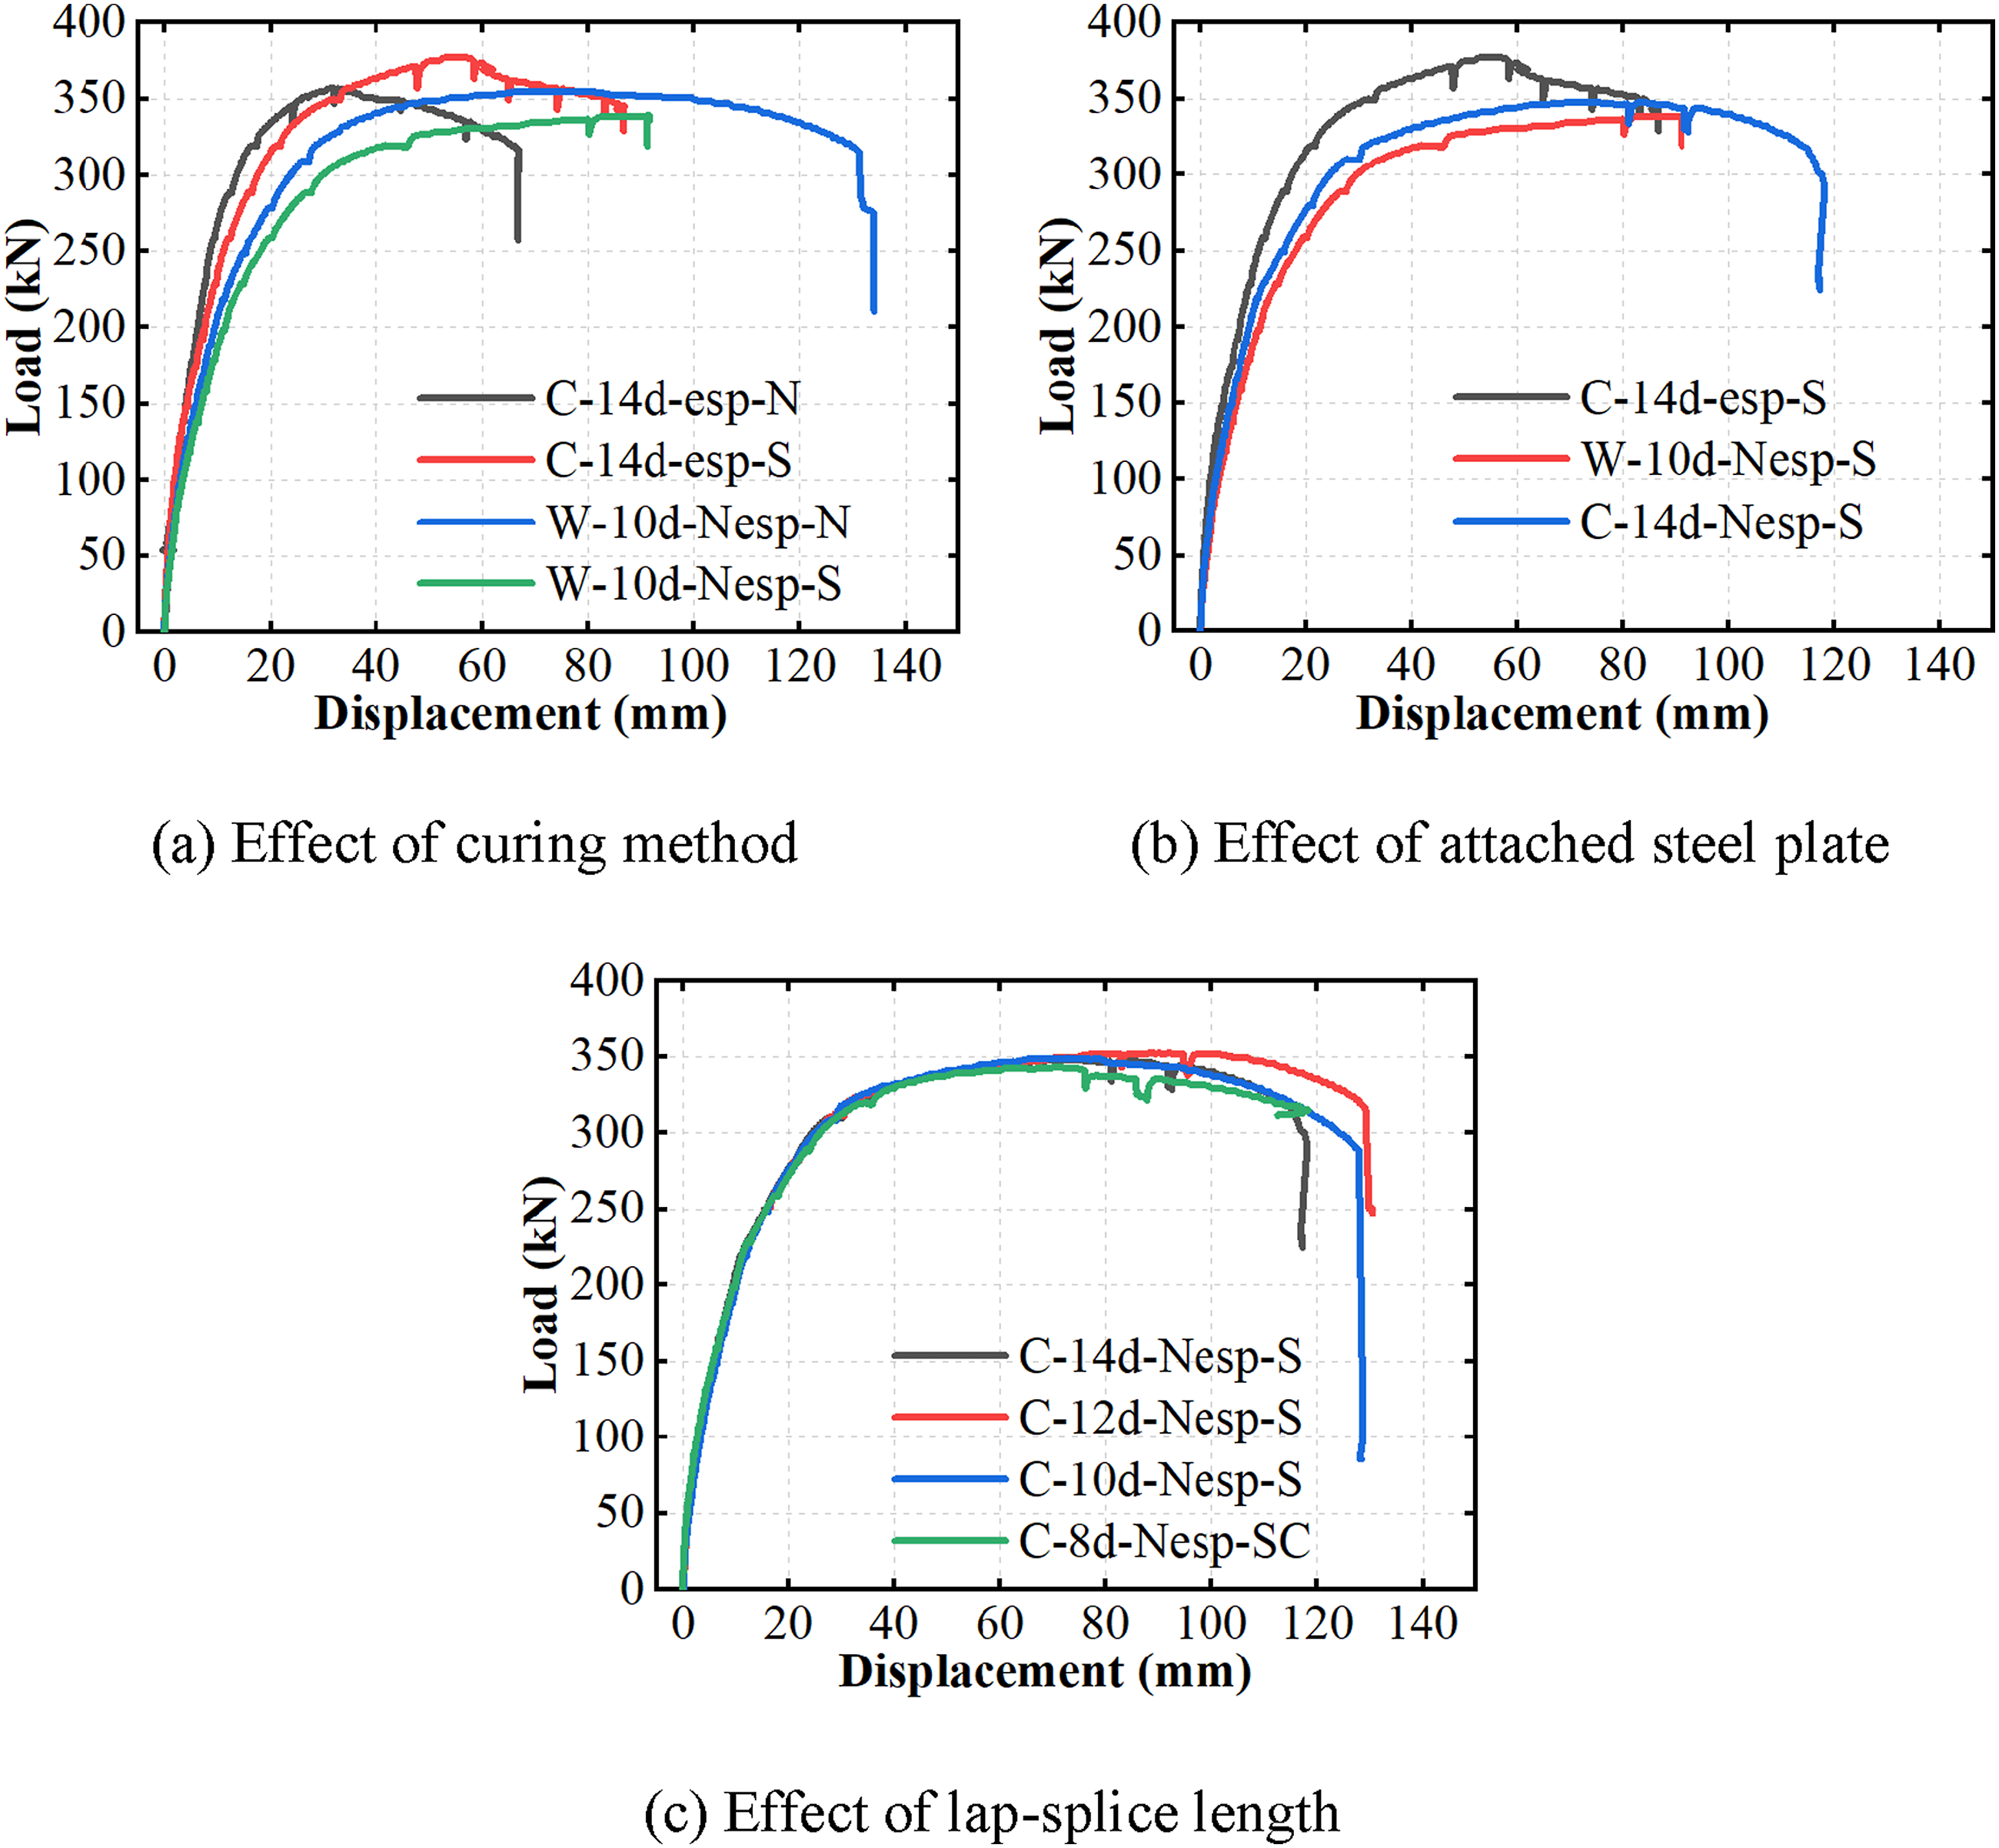
Figure 7(c) shows a marginal influence of lap-splice lengths on the load-displacement curves before the peak load, after which the load of the 8d lap-splice length specimen decreased more rapidly than the other three specimens, which was because the cohesion between the 8d lap-splice length reinforcements and concrete degenerated rapidly incapable of carrying and transferring the further loads. Though a contact lap-splice length of 8d ensured a reliable load transfer within the wet joints at the service, the undesired failure mode required a lap length greater than 8d.
Summary of static test results (unit: kN, mm).
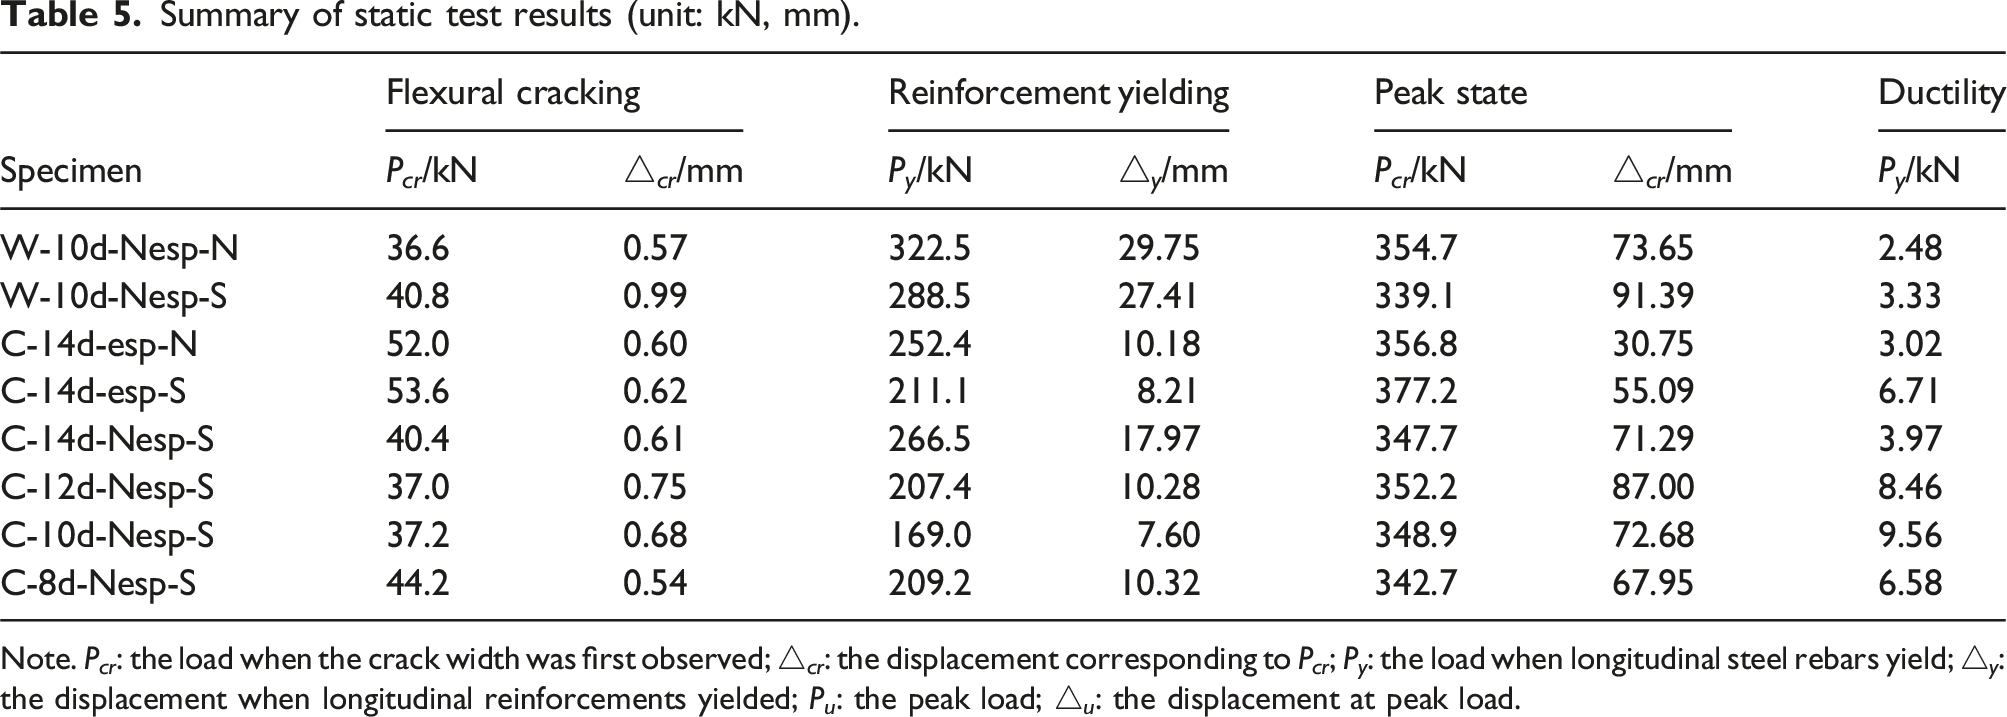
Note. P cr : the load when the crack width was first observed; △ cr : the displacement corresponding to P cr ; P y : the load when longitudinal steel rebars yield; △ y : the displacement when longitudinal reinforcements yielded; P u : the peak load; △ u : the displacement at peak load.
Herein the ratio of ultimate to yielding midspan deflection (△ u /△ y ) was used to evaluate structural ductility. For all specimens in this study, △ u /△ y was above 2.48, which exceeded the obtained values of 1.6–2.4 for the precast UHPC slabs with dovetail wet joint reported by Qi et al. (2019), indicating the excellent ductility of the proposed precast slabs. Comparing specimen W-10d-Nesp-S with specimens C-14d-Nesp-S, C-12d-Nesp-S, C-10d-Nesp-S, C-8d-Nesp-S, it was found that the ductility of all contact lap specimens was at least 19.22% higher than that of the welded specimen, demonstrating the superior deformability of the contact lap constructions.
Load-maximum crack width curves
Load corresponding to the characteristic crack widths (unit: kN).
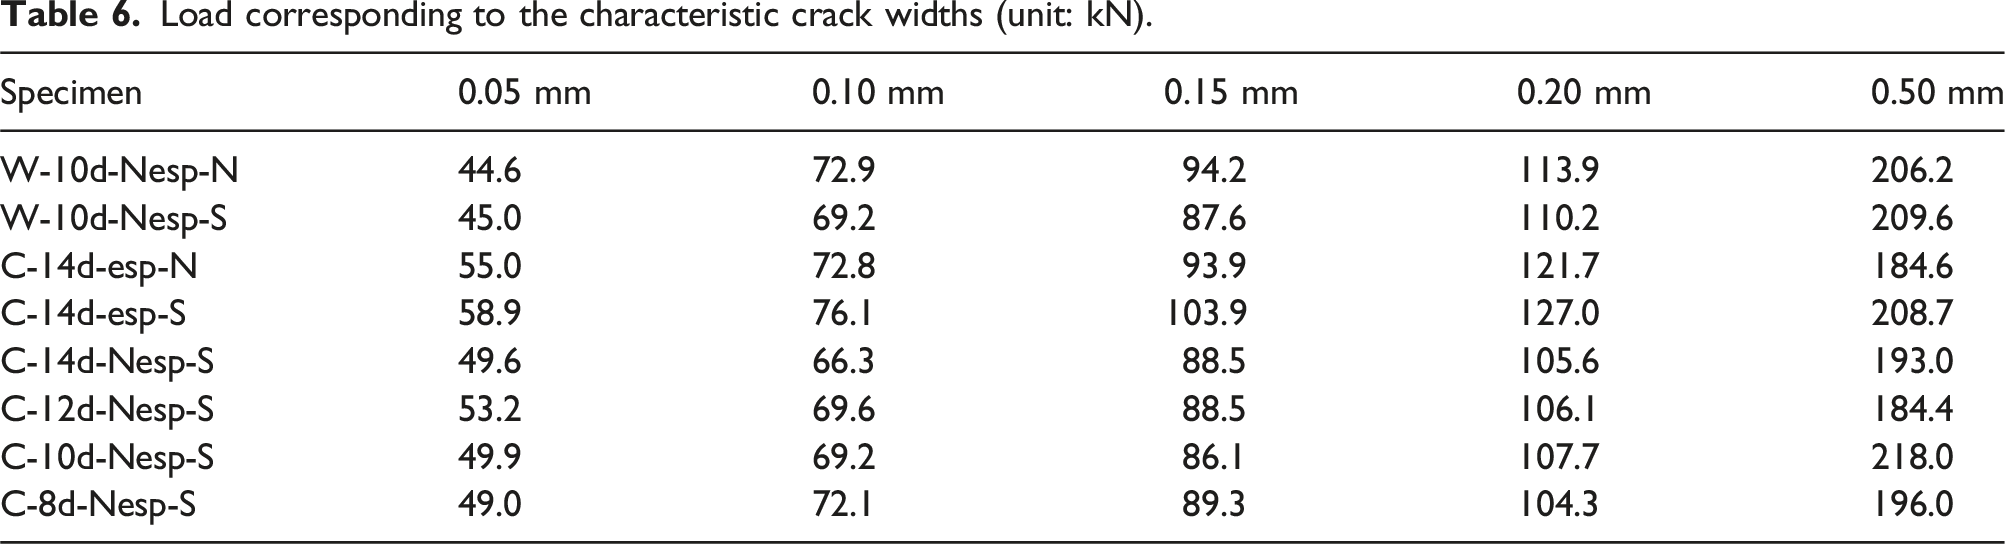
Figure 8 shows the load-maximum crack width relationships. It was seen that the crack width increased sharply once the crack width exceeded 0.50 mm at 60% of the peak load. In Figure 8(a) and (b), at the same crack width the load was the smallest in the contact lap specimens without attached steel plates, followed by the welded specimens, and finally in the contact lap specimens with attached steel plates. In other words, the steel-CA-UHPC wet joint proposed in this study had the best crack resistance. In Figure 8(c), the similar increasing trends of the load-maximum crack width curves showed little influence of lap-splice length on the maximum crack width evolution. Load- maximum crack width curves of static specimens. (a) Effect of curing method. (b) Effect of attached steel plate. (c) Effect of lap-splice length.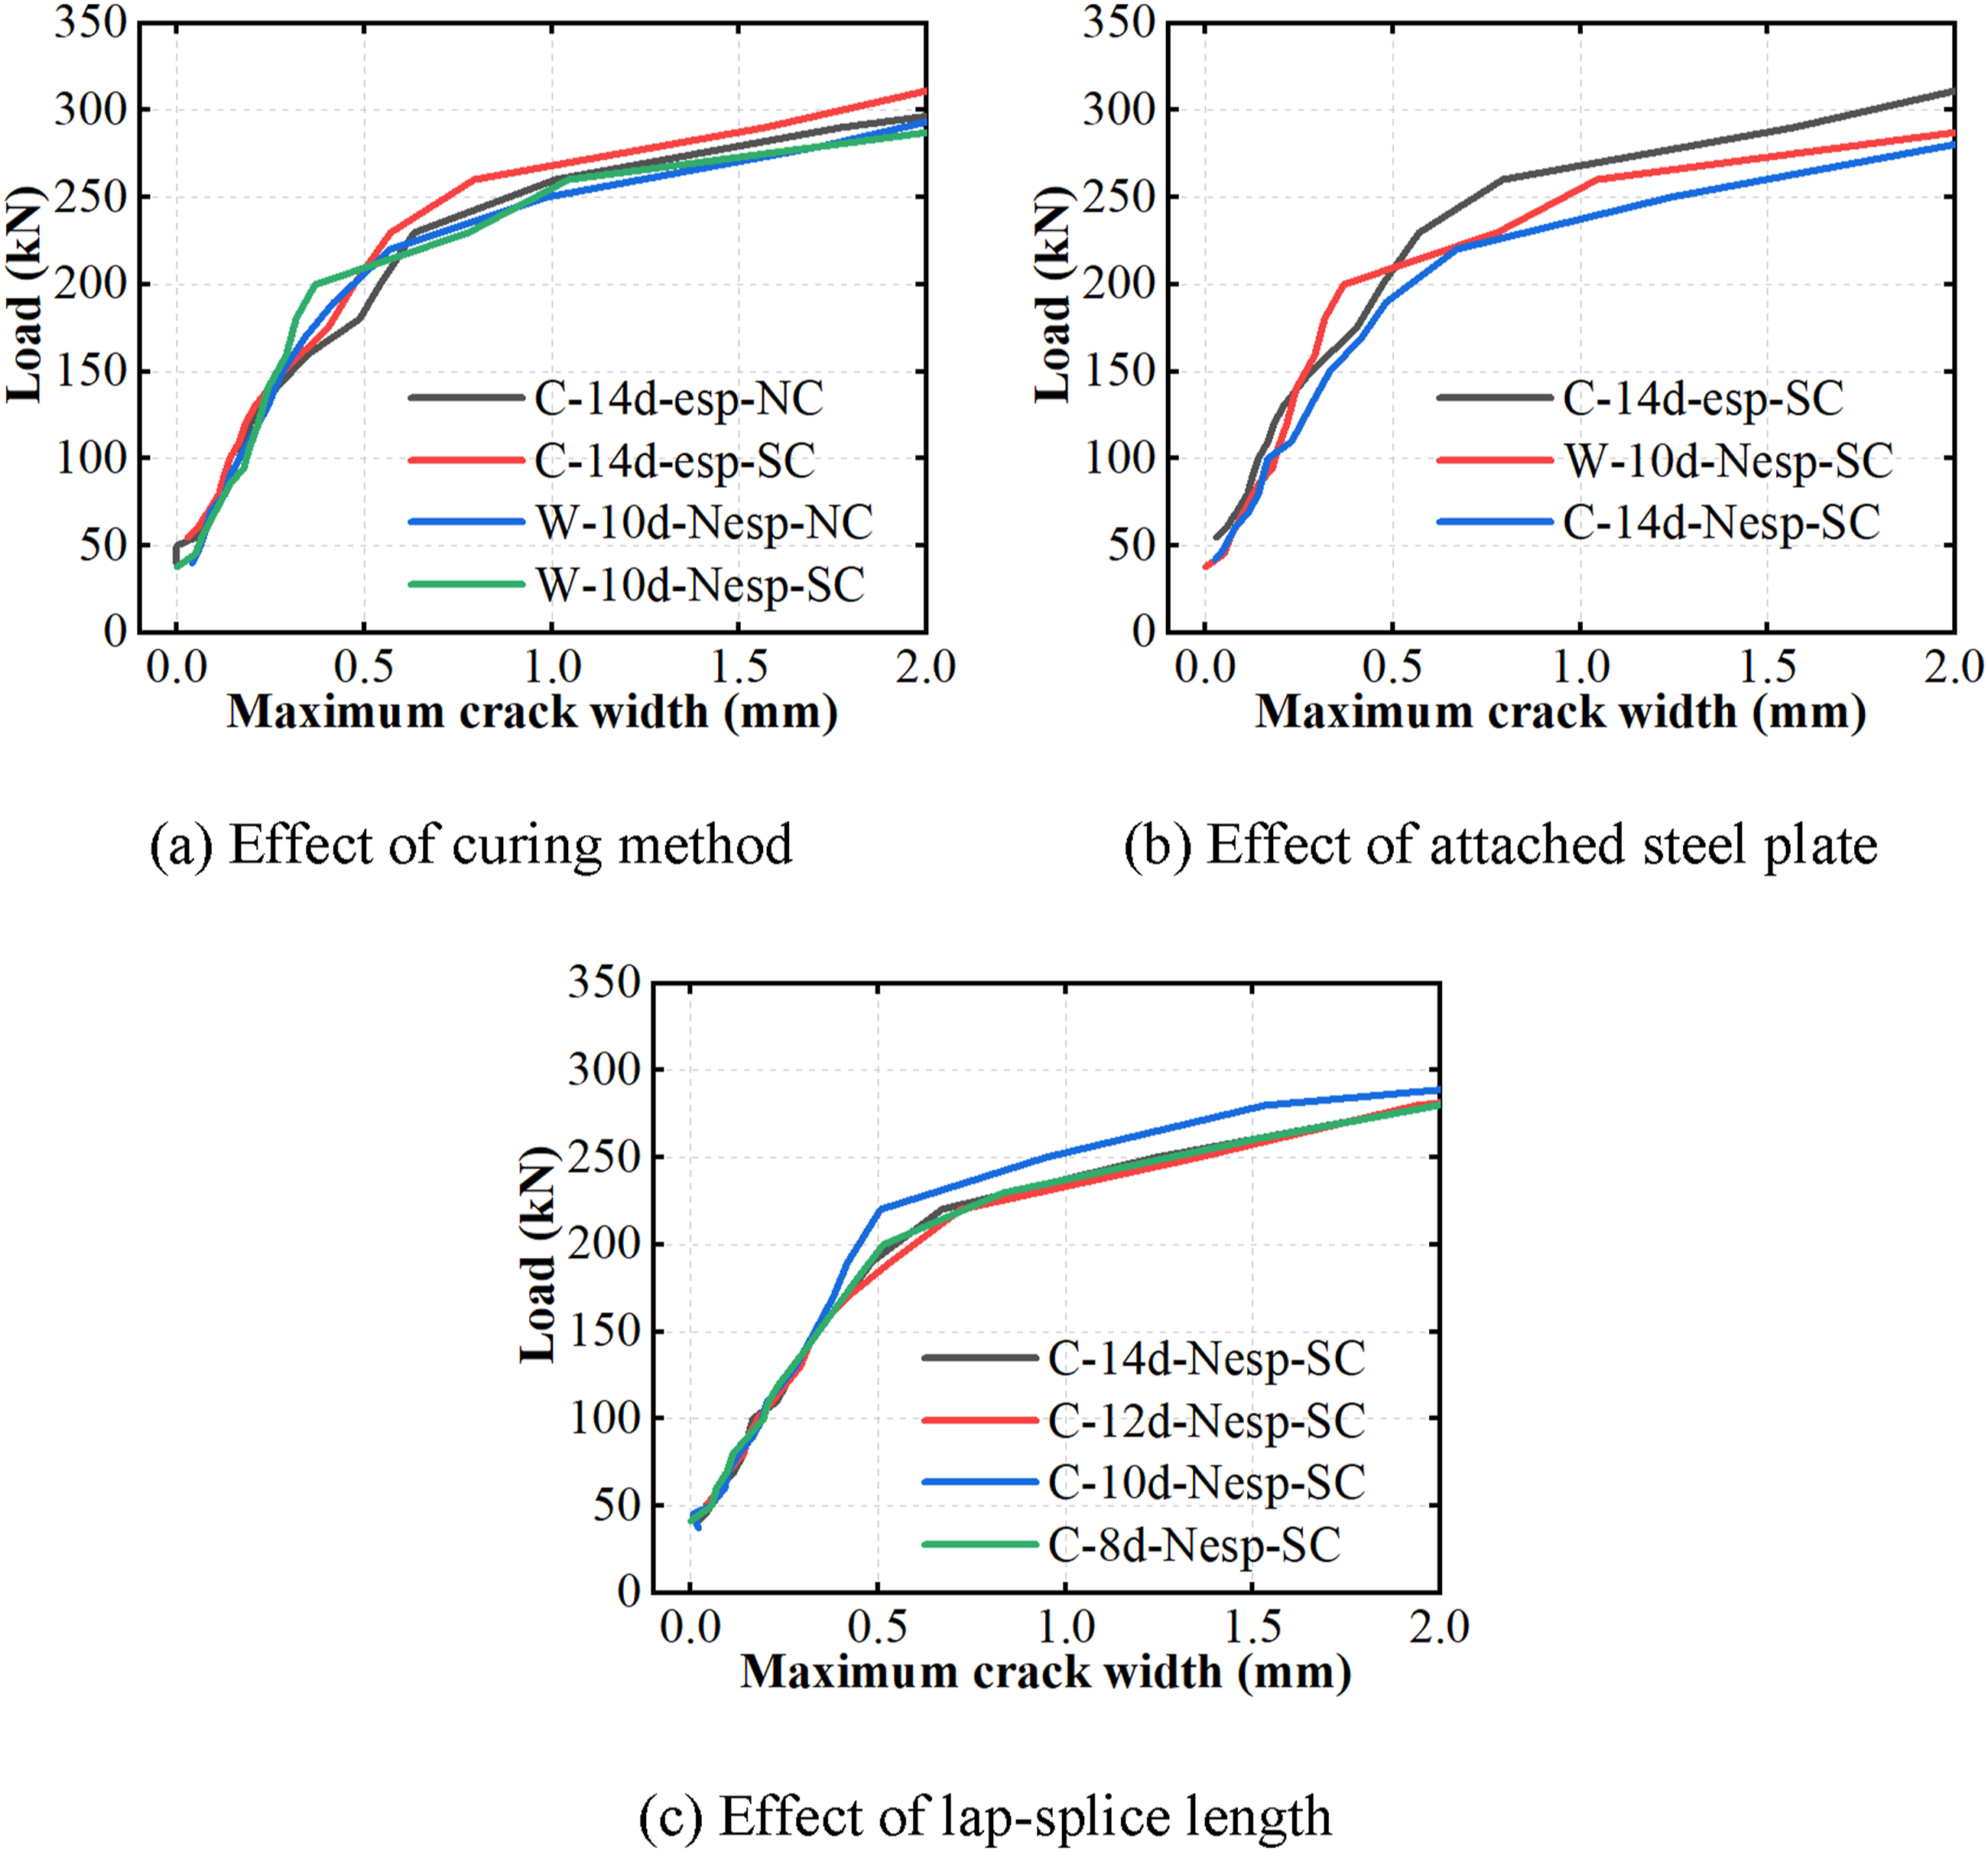
Load versus reinforcement strain
Figure 9 presents the load-longitudinal reinforcement strain curves. The strains of the steel bar within the constant moment region were measured, which was associated with the distance to the new-old concrete interface. The closer to the main crack the measured point was, the larger and more rapid increase the strain was. In Figure 9(a) and (b), after wet joint cracking no obvious increase in the strain of welded specimens. However, for contact lap-splice specimens in Figure 9(c)–(h), an obvious strain increase was observed after concrete cracking, and the increasing rate decreased slowly from S01 to S05 in order. For contact lap specimens without attached steel plates, as shown in Figure 9(e)–(h), the strain growth rate from S01 to S05 increased immediately after the wet joints cracked. As the contact lap-splice length increased from 8d to 14d, the number of the strain gauges reaching the yield strain was reduced from four to three, indicating that increasing the lap-splice length enhanced the bonding effect of reinforced concrete and reduced the stress level in the longitudinal steel reinforcements. Overall, the strains of the longitudinal steel reinforcements in the specimen enhanced with steel plates and studs showed a lower strain compared with the contact lap specimens owing to a smaller section deformation enhanced by the steel plate, meanwhile, which was higher and increased more steeply than the welded specimens indicating an efficient share in loads. Load-longitudinal reinforcement strain curves of static test.(a) W-10d-Nesp-N. (b) W-10d-Nesp-S. (c) C-14d-esp-N. (d) C-14d-esp-S. (e) C-14d-Nesp-S. (f) C-12d-Nesp-S. (g) C-10d-Nesp-S. (h) C-8d-Nesp-S.
Fatigue test results and discussions
Fatigue degradation
Figure 10 provides the fatigue test setup and crack propagation path along the height direction after 1 × 10⁴, 2 × 10⁴, and 5 × 10⁴ cycles. From 1 × 10⁴ to 5 × 10⁴ cycles, the fatigue crack height on the left interface of the wet joint increased from 81 mm to 112 mm, nearly reaching the location of upper longitudinal reinforcements whereas the crack at the right interface moved upward from 25 mm to 50 mm, indicating a rapid increase in the fatigue crack propagation stage. Fatigue test set-up.
Moreover, the midspan deflection, stiffness degradation, and fatigue crack width of the tested specimen during interval static tests are shown in Figure 11, which mostly occurred before 5 × 10⁴ cycles, agreeing with the observations of crack development. Results of fatigue test. (a) Load–midspan deflection relationships. (b) Stiffness degradation. (c) Fatigue crack width evolution.
As presented in Figure 11(a), 200 × 104 cyclic loading resulted in a 0.09 mm increase in the midspan deflection. After 1 × 10⁴, 2 × 10⁴, 5 × 10⁴, 50 × 104, 100 × 104, and 120 × 104 cycles, the midspan deflection increased by 0.03 mm, 0.01 mm, 0.01 mm, 0.02 mm, 0.01 mm, and 0.01 mm, respectively, for which the first 5 × 10⁴ cycles accounted for over 50%. Thus, the specimen experienced a short rapid increase but a long stable stage in the fatigue deflection until 200 × 104 cycles, showing excellent fatigue cracking resistance of the proposed steel-UHPC composite wet joint.
In Figure 11(b), the stiffness on the vertical axis refers to the upper fatigue load-to-midspan deflection ratio at the interval static tests. The stiffness degraded by 4.17%, 6.76%, 9.21%, and 11.54%, respectively, after 1 × 10⁴, 5 × 10⁴, 50 × 104, and 120 × 104 cycles, beyond which no further stiffness degradation was observed. Thus 58.56% fatigue stiffness degradation occurred during the first 5 × 10⁴ cycles under the 200 × 104 cyclic loading, further demonstrating that the proposed composite wet joint had an exceptional anti-fatigue performance at a desired long service life.
As described in Figure 11(c), the black line represents the crack width measured after unloading, while the red line indicates the crack width recorded at the upper fatigue load during the intermediate static test. After 1 × 10⁴ cycles, visible cracks appeared within the wet joints and then propagated rapidly until 5 × 10⁴ cycles. After 1 × 10⁴, 2 × 10⁴, and 5 × 10⁴ cycles, the crack widths were measured for 0.03 mm, 0.05 mm, and 0.09 mm at the end of unloading, while they increased up to 0.07 mm, 0.09 mm, and 0.11 mm at the upper fatigue limit. Note that after 10 × 104 and 120 × 104 cycles, the crack width at the upper fatigue limit increased by only 0.01 mm. The increasing crack width caused during the first 5 × 10⁴ cycles accounted for more than 75% under the 200 × 104 cyclic loading. Furthermore, after 200 × 104 fatigue loading, the maximum crack width of below 0.2 mm satisfied the requirements of the design specification (MOT, 2018). Hence, such a composite wet joint perfectly ensured its static and fatigue behavior in composite bridges.
Residual static strength and stiffness
Summary of results before and after fatigue loading (unit: kN, mm).
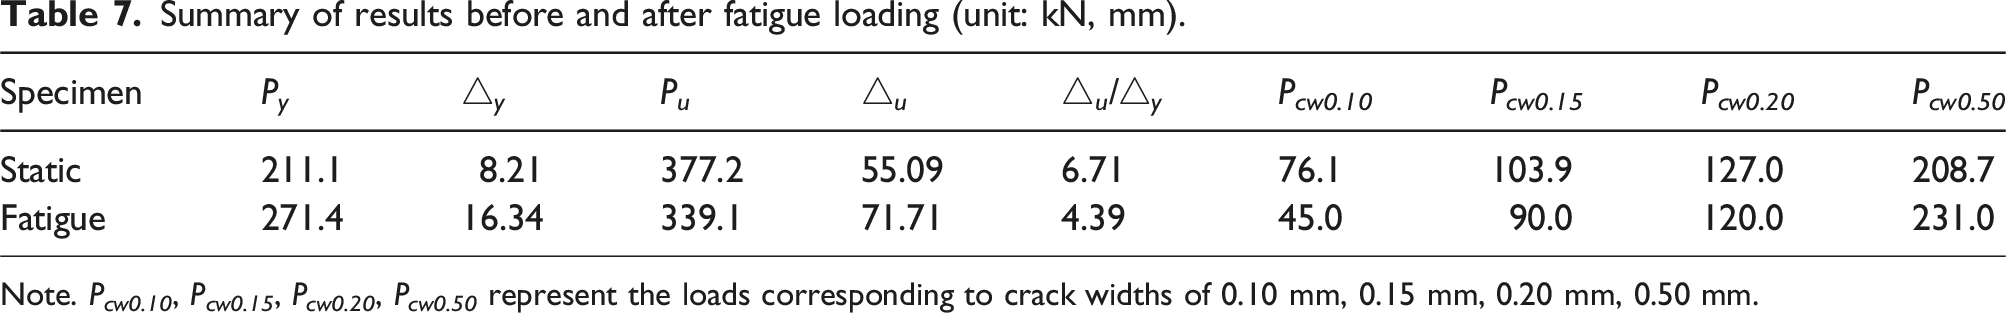
Note. P cw0.10 , P cw0.15 , P cw0.20 , P cw0.50 represent the loads corresponding to crack widths of 0.10 mm, 0.15 mm, 0.20 mm, 0.50 mm.

Comparisons of post-fatigue and static results. (a) Load-midspan displacement curves. (b) Load versus maximum crack width. (c) Load-longitudinal reinforcement strain relationships.
Figure 12(a) shows the residual flexural strength-midspan deflection relationship. At a load of 100 kN, 200 kN, 300 kN, and peak load, the post-fatigue flexural stiffness was reduced by 3.85%, 10.62%, 23.74%, and 30.94%, respectively, compared to the static flexural stiffness. Therefore, the flexural stiffness degradation was more influenced by the fatigue crack propagation than the residual flexural strength, which should be considered carefully in large-scale composite bridges.
Figure 12(b) presents the relationship between the residual load and maximum crack width. When the crack width was smaller than 0.20 mm, the crack of the post-fatigue specimen propagated more rapidly than that of the static specimen. Before the formal residual static strength test, the maximum crack width was over 0.05 mm. During the test, the loads at the crack width of 0.10 mm, 0.15 mm, and 0.20 mm were smaller by 40.87%, 13.38%, and 5.51%, respectively, relative to static specimens’ counterparts. Based on the crack width of 0.2 mm required at service, it indicated that the specimen with steel-UHPC composite wet joints could effectively resist the fatigue load and inhibit crack development.
Figure 12(c) compares the tensile reinforcement strain between two specimens. The reinforcements in the post-fatigue specimen began to resist the load initially due to the generated cracks under the upper fatigue load. When the load reached approximately 100 kN to 150 kN, the strain S01 to S05 in the reinforcement in both specimens began to increase sequentially. Larger strain and wider strain yield domain of the steel reinforcements were found in the fatigue specimen, indicating a wider steel reinforcement and UHPC region participation in resisting the external loads due to the accumulated fatigue damage.
Conclusions
This study focused on the static and fatigue performance of precast CA-UHPC bridge decks with steel-CA-UHPC wet joints under negative bending moments. Eight static specimens were tested on the effects of reinforcement lap-splice lengths and wet joint curing methods on failure modes, crack patterns, and load-displacement relationships. Moreover, one fatigue specimen was tested to validate the anti-fatigue performance of the proposed wet joints. The following conclusions can be drawn: (1) For the precast CA-UHPC slabs with contact lap-splice lengths of 10d, 12d, and 14d, the tensile fracture of the reinforcement occurred at the cast-in-place wet joint-to-prefabricated panel interface. However, for a contact lap-splice length of 8d, failure was caused by the loss of cohesion between reinforcements and concrete within the wet joint. Thus, the contact lap-splice length of the reinforcement was recommended 10d in CA-UHPC bridge decks. (2) The curing method shows little influence on the stiffness and ultimate strength of the precast CA-UHPC slabs. In terms of the same crack width, the load for steam-curing specimens was 13.06% higher at most than that of natural-curing specimens. The lap-splice length over 8d of steel reinforcements had little influence on the crack propagation while the attached steel plate could effectively inhibit the cracking. (3) The precast CA-UHPC slabs enhanced with proposed composite wet joints showed a lower strain in the steel reinforcements, indicating an efficient share in the loads of such a construction. The strength and stiffness of the contact lap-splice specimen were slightly larger than those of the welded specimen, and the attached steel plate can enhance the cracking and peak loads by 32.67% and 8.48%, respectively. Also, the contact lap-splice specimens behaved better ductility than the welded specimens and reported precast UHPC slabs with dovetail wet joints. (4) After 2 million cyclic loadings, 10.10% and 34.58% reductions in flexural strength and ductility were found in the precast CA-UHPC slabs with proposed composite wet joints, during which 50% fatigue mid-span deflection and 58.6% fatigue stiffness degradation occurred before first 5 × 10⁴ cycles. Additionally, the residual crack width was only 0.11 mm, smaller than the required value of 0.2 mm in the design code. It indicates that the proposed steel-UHPC composite wet joint had excellent both static and fatigue performance in the precast CA-UHPC bridge slabs.
In future work, parametric studies on the geometric influence of the proposed steel-CA-UHPC composite wet joints, including the width and thickness of wet joints, as well as the dimensions of the attached steel plate, should be further conducted. Moreover, the layout of studs and the combined behavior of high-strength steel bars and CA-UHPC in wet joints also required more studies to establish detailed wet joint design methods. Additionally, the long-term performance of the composite wet joints should be further experimentally clarified.
Footnotes
Declaration of conflicting interests
The author(s) declared no potential conflicts of interest with respect to the research, authorship, and/or publication of this article.
Funding
The author(s) disclosed receipt of the following financial support for the research, authorship, and/or publication of this article: This research was supported by the National Natural Science Foundation of China (52341802, 52308175, 52378136), Jiangsu Province Key Technology Project of Transportation (2024QD10), Jiangsu Province Basic Research Project (JSTJ-2023-JS002, BK20241872), and China Scholarship Council (202406090223). The authors also acknowledge the support from Nanjing Public Engineering Construction Center and Jiangsu Xingou Intelligent Manufacturing Technology Co., Ltd.