




Abstract
The multi-component long-span bridges are under high-stress state and they are suffering the aging damage caused by adverse environments and loading during the full lifetime. This paper presents a machine learning framework for assessing the reliability of cable-stayed bridge systems. The support vector machine (SVM) method is adopted as a substitute for the complex structural finite element model in reliability analysis. In addition, the GA method is utilized for searching the extreme values of the constrained optimization function, which is used for calculating the time-variant reliability indexes. The β-bound method is adopted to identify failure modes of structural system. The time-variant influence on system failure mode is considered in this framework. A long-span prestressed concrete cable-stayed bridge in service is proposed to illustrate the proposed framework. The results show that the reliability indexes of beams and cables generally decrease with increasing years of service. Specially, beam reliability decreases significantly as the distance from the tower increases, while cable reliability remains relatively consistent. The system reliability indexes indicate that the bridge is relatively safe before degradation and relatively dangerous after 20 years’ service. Therefore, it is imperative to develop an appropriate maintenance strategy based on failure patterns of key components.
Keywords
Introduction
The cables and main beams are the key load-bearing components of cable-stayed bridges, subject to high-stress conditions during their service life (Chen et al., 2022; He et al., 2024; Ma et al., 2020; Wang et al., 2019). With the increasing of traffic volume and axle weight, these components endure fatigue damage caused by repeated vehicle loads (Guo et al., 2020; Liu et al., 2021, 2023; Ma et al., 2023a). In addition, the bridges in service are also exposed to external adverse environment leading to degradation in their loading capacity performance (Chen et al., 2020; Hackl and Kohler, 2016; Ma et al., 2013). The coupled effect of external environment and loading accelerates the aging damage of components and reduces the remaining life significantly. Many researchers have made important efforts in structural reliability and life evaluation, especially considering nonlinear correlation effects of components (Jiang et al., 2024; Ni and Chen, 2021; Ren et al., 2021; Song et al., 2023; Tang et al., 2023a; Wang et al., 2024a). Previous studies have shown that the successive failure of key sub-structures will result in the collapse of the entire structure system (Liu et al., 2016; Tang et al., 2023b; Wang et al., 2022, 2024b). Accurately obtaining the failure mode of a deteriorated bridges system is crucial for timely optimal maintenance throughout its life cycle (Han et al., 2021; Yang and Frangopol, 2020). However, the failure modes of complex cabled-stayed bridges exhibit significant randomness, and huge uncertainties arise from aging materials, increased load and harsh environment.
To do this, structural reliability analysis can be proposed to consider the multi-source uncertainties influence. Reliability analysis methods mainly include analytical methods and simulation methods. Analytical methods can inference the structural reliability index considering the distribution of random variables, such as first/second-order reliability methods (Afshari et al., 2022). While the estimation error of these methods is relatively large for high-dimensional nonlinear systems. The simulation methods can achieve higher accuracy when obtaining large samples for high reliability analysis systems, such as Monte Carlo simulation and importance sampling method (Xu and Saleh, 2021). However, these methods are time-consuming due to the execution of numerous finite element models (FEM). Some researchers proposed machine learning-based surrogate models to replace the finite element (FE) simulation methods (Ji et al., 2023; Li et al., 2016a; Ni et al., 2021). Lehký and Šomodíková (2016) adopted an artificial neural network-based response surface method to calculate the failure probability of post-tensioned composite bridge using a small-sample FE simulation. Peng et al. (2019) developed an effective reliability calculation model based on back propagation neural network surrogate model and sample data clustering technology. However, artificial neural network-based method encounters critical problems such as local optima and over-fitting problems.
Support vector machine (SVM) is a kernel-based machine learning technique and it has been widely used in reliability analysis due to its superior generalization ability (Li et al., 2016b; Pan and Dias, 2017; Roy and Chakraborty, 2020; Roy et al., 2019). Jiang et al. (2015) adopted an effective uniform SVM response surface method to fit implicit structural failure function, significantly reducing the number of samples. Deng et al. (2019) developed a high dimensional random fitting reliability function combining particle swarm optimization and SVM. Lü et al. (2022) established an efficient surrogate model combined with moving least squares technology and SVM model to improve the calculation efficiency of FEM. However, the adjustment of hyper-parameters in SVM predictors may lead to high computational costs due to quadratic programming calculations. Previous studies have shown that genetic algorithm (GA) is effective in reducing the computation time for parameter optimization (Jing et al., 2019; Lu et al., 2017; Lute et al., 2009). As a result, this method can be adopted to assist SVM model to replace the FEM simulation of long-span cable-stayed bridges for reliability assessment.
Reliability assessment of high-dimensional structural systems presents greater complexity compared to individual components. Some researchers have made efforts to search system failure modes based on deterministic methods (Bai et al., 2021; Kim et al., 2013; Mi et al., 2022). Xing et al. (2021) proposed an effective strategy for searching domain failure modes of structural system based on differential evolution algorithm. Jiang et al. (2020) developed an efficient search method of main failure modes by obtaining representative sample sets and combining multiple response surfaces, providing higher search efficiency compared to the branch and bound method. Huang et al. (2019) proposed a dynamic reliability evaluation method for arch bridges using differential equivalent recursive algorithm, and concluded that the durability of the system is lower than that of its individual components. Liu et al. (2016) developed a structural system reliability assessment method based on adaptive support vector regression, and the presented method could identify the main failure sequences of concrete cable-stayed bridges. However, the above studies mainly focus on the system reliability calculation of complex bridges, which still ignore the influence of time-varying effects.
The aging damage has great influence on the failure mode of existing structures (Cui et al., 2023; Song et al., 2021; Yu et al., 2018). Some researchers have made effort to investigate the influence of component deterioration on the structural system failures (Hu et al., 2025; Zhao et al., 2022; Zhou et al., 2017). Wang et al. (2023) proposed a time-dependent reliability evaluation framework based on three deep learning methodologies. Chen et al. (2023) developed a time-variant system reliability approach for bridges network by considering the impact of bridge component deterioration. Liu et al. (2018) studied the influence of cable deterioration induced by corrosion and fatigue on cable-stayed bridges, and pointed out that the system reliability would decrease when the reliability of cable was lower than that of critical beams. Yan and Guo (2020) investigated the effects of the length and quantity on the cable strength based on series-parallel model, and concluded that corrosion fatigue damage had great effect on the system reliability of existing cable-stayed bridges than pure fatigue. Previous studies showed that time-dependent system reliability analysis is much more complicated than that of the individual components. It is desirable to establish an effective time-variant reliability evaluation framework for concrete cable-stayed bridge by integrating with machine learning and deterioration damage information.
This paper developed a machine learning based time-varying reliability assessment method for long-span bridges. The structure of this paper is given as follows. First, considering the impact of girder cracking and cable corrosion on the reliability of cable-stayed bridges, the series and parallel failure modes of complex structures are analyzed. Next, the fundamental principles of support vector machine and genetic algorithm are introduced. A reliability calculation framework of time-varying system is proposed. Then, the reliability of an existing long-span prestressed concrete cable-stayed bridge is analyzed, and the effects of girder cracking and cable corrosion degradation on the reliability of structural system are investigated.
Time-variant system reliability
System reliability
Complex bridge structures generally consist of numerous components. The structural system events can be represented by Boolean functions, which can be described as series, parallel and compound systems (David, 1976; Ditlevsen, 1979; Melchers and Tang, 1984) according to the logical relationship of components. Considering a system event F
sys
composed of n components, the i-th component binary state can be denoted as



For series system, the failure events of all n components can be expressed as (Hohenbichler and Rackwitz, 1982):


For parallel system, the failure events of all n components can be expressed as (Hohenbichler and Rackwitz, 1982):


Assuming that a compound system consists of m
i
elements in series and k subsystems in parallel, the failure events can be expressed as (Hohenbichler and Rackwitz, 1982):



Time-variant system
For a multiple components complex structure, some components are time-variant and some components are time-invariant (Enright and Frangopol, 1999; Sankaran and Qiang, 1995; Song et al., 2021). The states of time-invariant components do not vary over time, while the time-variant components deteriorate gradually during the whole service life (Zhou et al., 2017). Therefore, equation (1) can be transformed as:


Assume that r time-variant components are included. Then, equation (11) can be transformed into:


The system failure probability within the range of time [0,T] based on the equivalent extreme value event (Li et al., 2007) can be expressed as:

Reliability assessment methodology
The calculation framework
The structural reliability index can be calculated by the shortest distance between the limit state surface and the origin of coordinate in the standard normalized space. Assuming that the random variable is

The calculation of reliability index can be transformed into obtaining the minimum value of an objective function subjected to a given constraint. The unconstrained optimization function can be defined as follows:

The entire procedures for calculating the system reliability can be summarized as follows. First, a finite element model (FEM) of cable-stayed bridge is established according to practical engineering. The key parameters of structural systems are selected for reliability analysis. Secondly, the Latin hypercube sampling (LHS) is adopted to generate sample points. The structural response is obtained by performing FEM simulations. Next, the SVM model is used to formulate the optimal regression function. The GA approach is used to obtain the reliability index by optimizing the unconstrained function. Following that, the β-bound method is utilized to search for the potential first and second level of the failure road. The failure modes are updated according to the time-varying degradation effect of main components. The calculation flowchart is shown in Figure 1. Flowchart of time-variant reliability assessment.
Support vector machine
Support vector machine (SVM), a promising kernel-based machine learning algorithm, is widely used to deal with highly nonlinear classification, regression and other issues (Roy and Chakraborty, 2023). SVM has better prediction performance than ANN due to it can overcome the disadvantages of local optima and over-fitting (Roy and Chakraborty, 2023). Linear and nonlinear SVM regression theories are introduced briefly herein. Given a set of training data {(x1, y1),(x2, y2),…,(x
n
, y
n
)}, the optimal fitting function for linear regression can be expressed as f( Support vector regression model.
Supposing that all the training data points can be fitted by the linear function within the range of y
i
±ε, the support vector regression can be formulated as an optimization problem and the objective function is given as follows:




In addition, the product of the dual variables and the constraints should satisfy:

The above optimal function can be transformed into a dual problem, i.e.

The final regression function can be expressed as:

The above equations are presented to demonstrate the calculation process for linear regression, while the linear regression function may be inappropriate for fitting all training data from nonlinear systems. The SVM model should be extended to map the input vector into a high dimensional feature space. The kernel function is introduced to define this mapping relationship as follows:

SVM model can use various kernel functions. The most commonly used types of kernel functions for fitting are polynomial kernel and radial basis function (RBF) kernel. Polynomial kernel is difficult to model the nonlinear relationship of the high-dimensional space while RBF kernel can capture the non-linear characteristics accurately. RBF kernel mainly includes exponential and gaussian type. Gaussian RBF kernel is a preferrable choice and it can be expressed as:

Genetic optimization algorithm
The genetic algorithm (GA) can be used to optimize the parameters in support vector machine (SVM) and calculate the reliability index of unconstrained function. The GA method is an optimization algorithm and it has been widely used in engineering fields (Xing et al., 2021). For parameters optimization, the parameters should be encoded by the gene group including penalty parameter c and kernel parameter g. The prediction accuracy of SVM is regarded as the fitness function of the GA parameter optimization. The individuals are then proposed to undergo the selection, crossover, mutation according to fitness function. The suitable individuals are retained, and unsuitable individuals are eliminated. The new species group inherited the previous information will be superior to the previous generation. Figure 3 shows the flowchart of the GA algorithm. Flowchart of GA algorithm.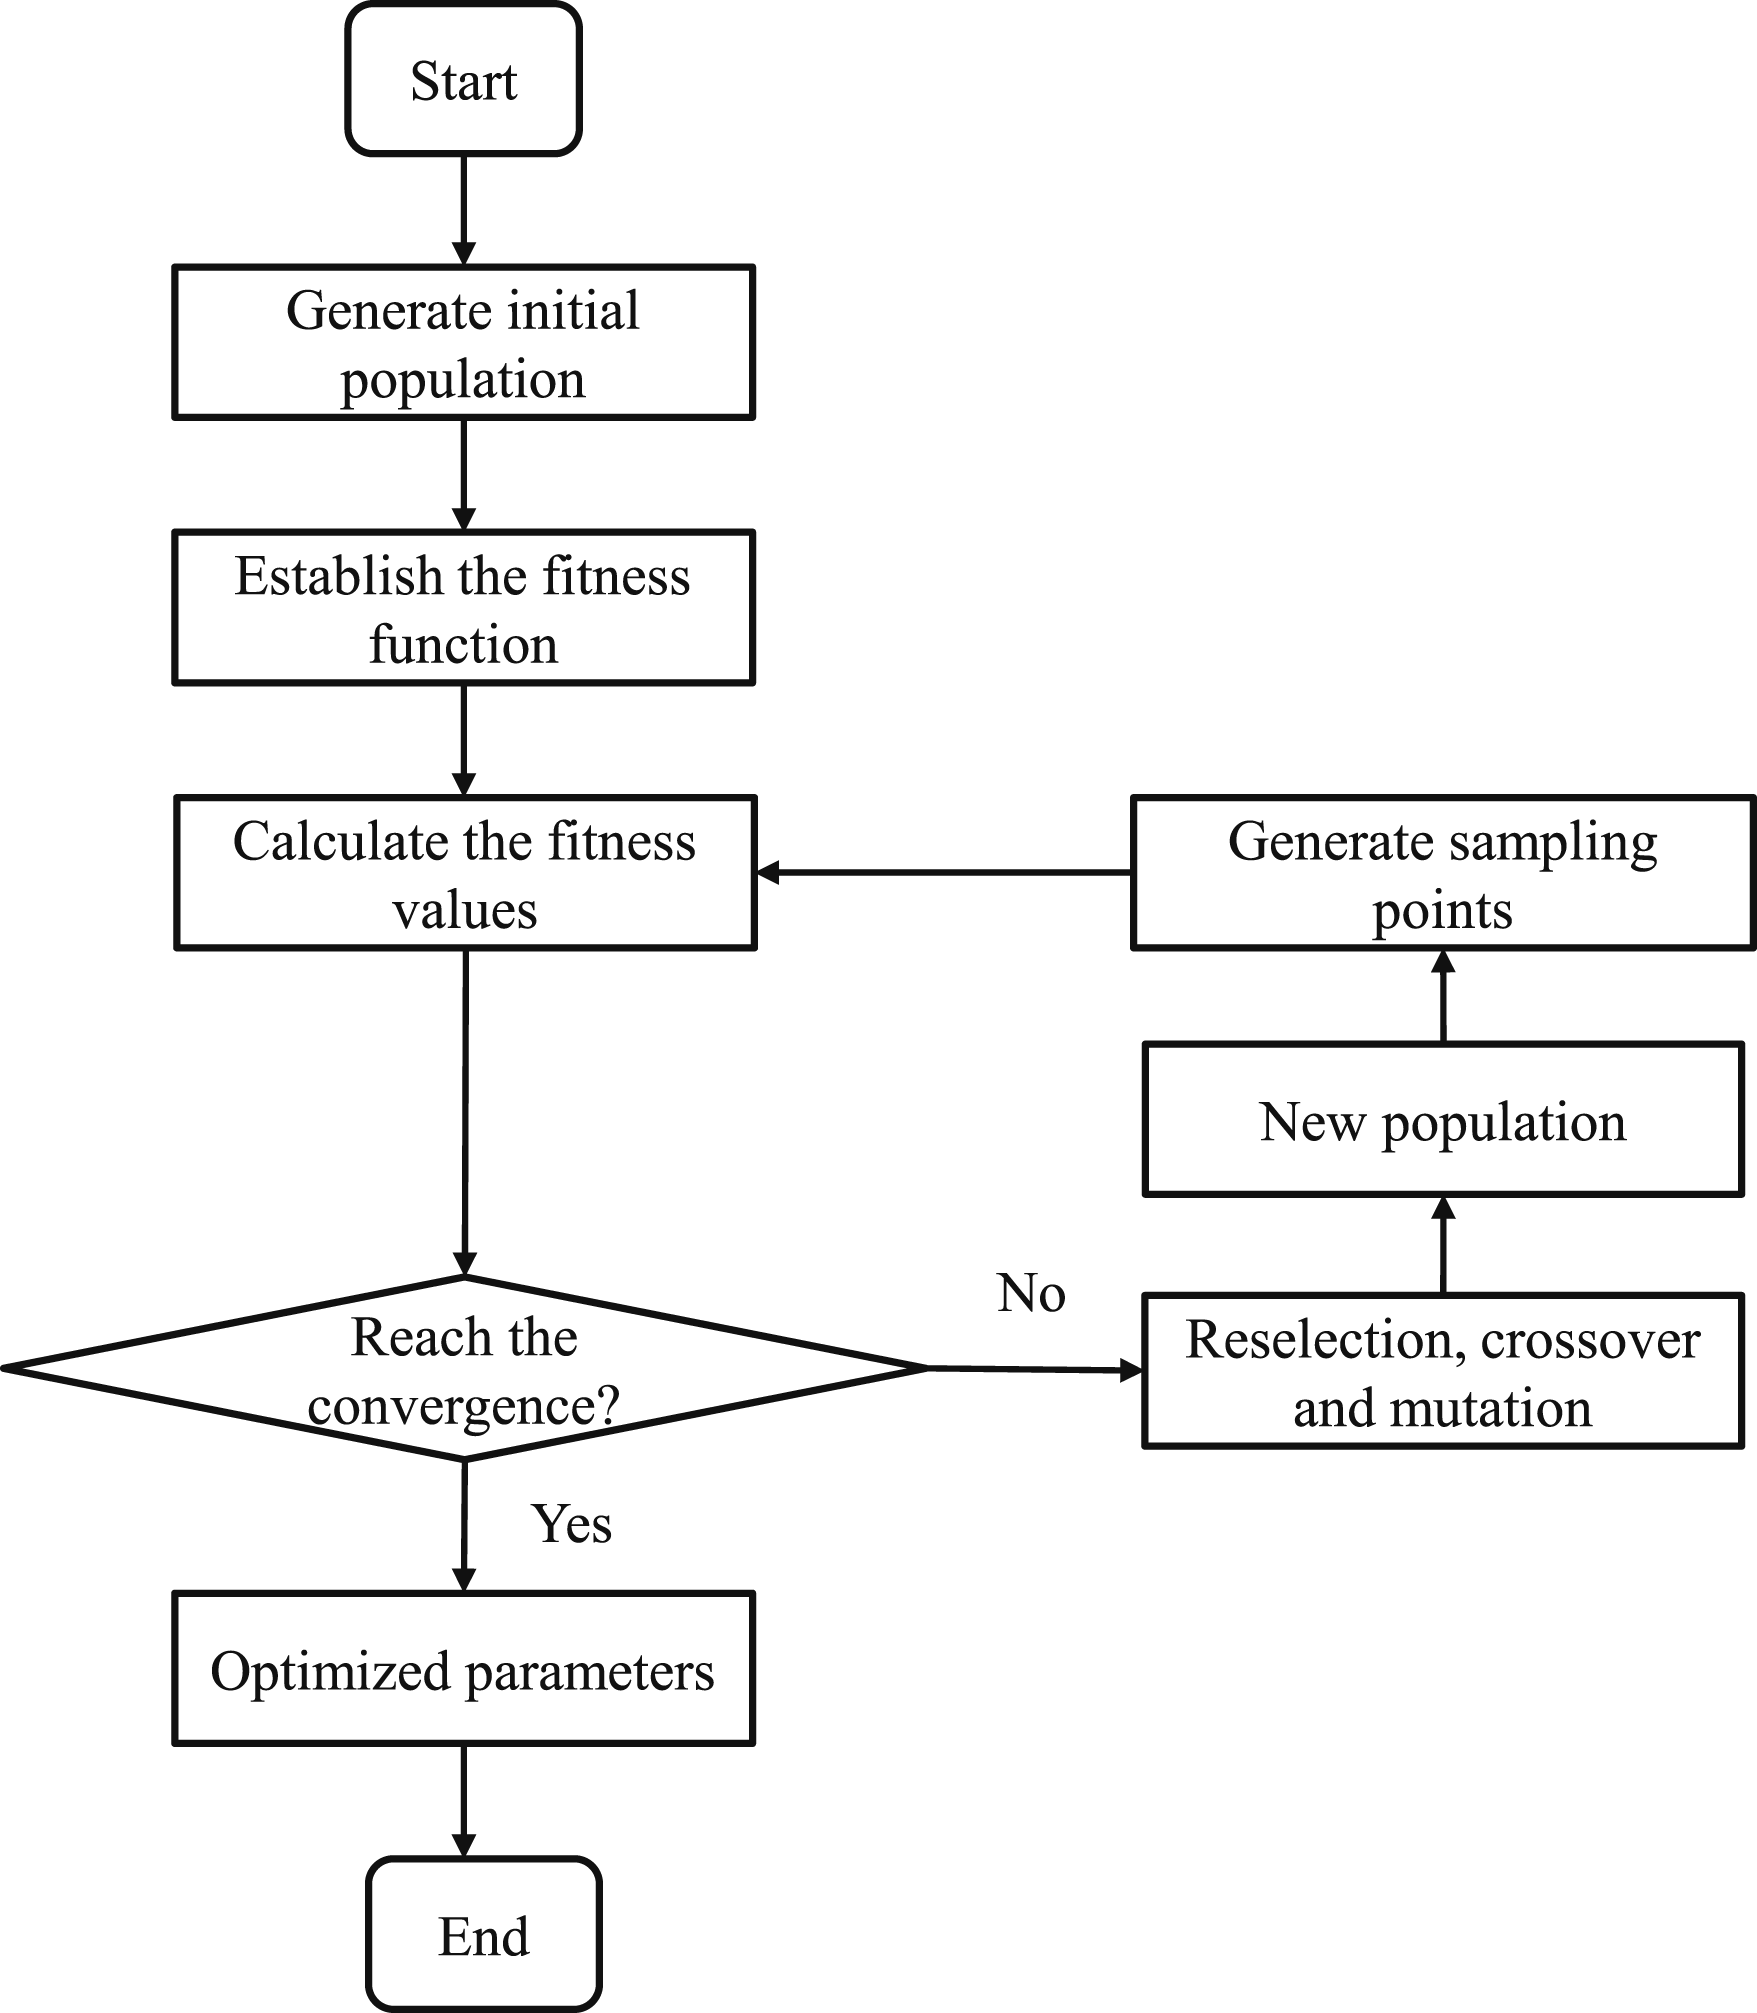
For structural reliability index calculation, the shortest distance between the limit state surface and the origin of coordinate in the standard normalized space can be obtained by the GA method. The constraint optimization function can be transformed into unconstrained optimization function by penalty factor. The fitness function can be regarded as the unconstrained optimization function. The proposed GA optimized method can be used to calculate the reliability indexes for both explicit and implicit functions effectively.
Numerical demonstration
To demonstrate the proposed reliability calculation method, a numerical simulation example is shown here. A function is considered
The input variables X and output variables Y were normalized into the range of [0, 1]. The RBF kernel function was selected for SVM model. Genetic algorithm (GA) was adopted to obtain the optimal parameters c and g. The optimization process of the genetic algorithm is shown in Figure 4(a). The comparison between the prediction value and the actual value of the training set data is shown in Figure 4(b). The fitting result of the binary function is shown in Figure 4(c). The results show that the total number of iterations is 50, and the population is 20. The optimized parameters c and g are 278.35 and 0.49162, respectively. The meaning square error (MSE) between the predicted and real values is 0.00033148. Numerical example: (a) GA parameters optimization; (b) Training and testing results; (c) Function surface fitted; (d) Reliability calculation.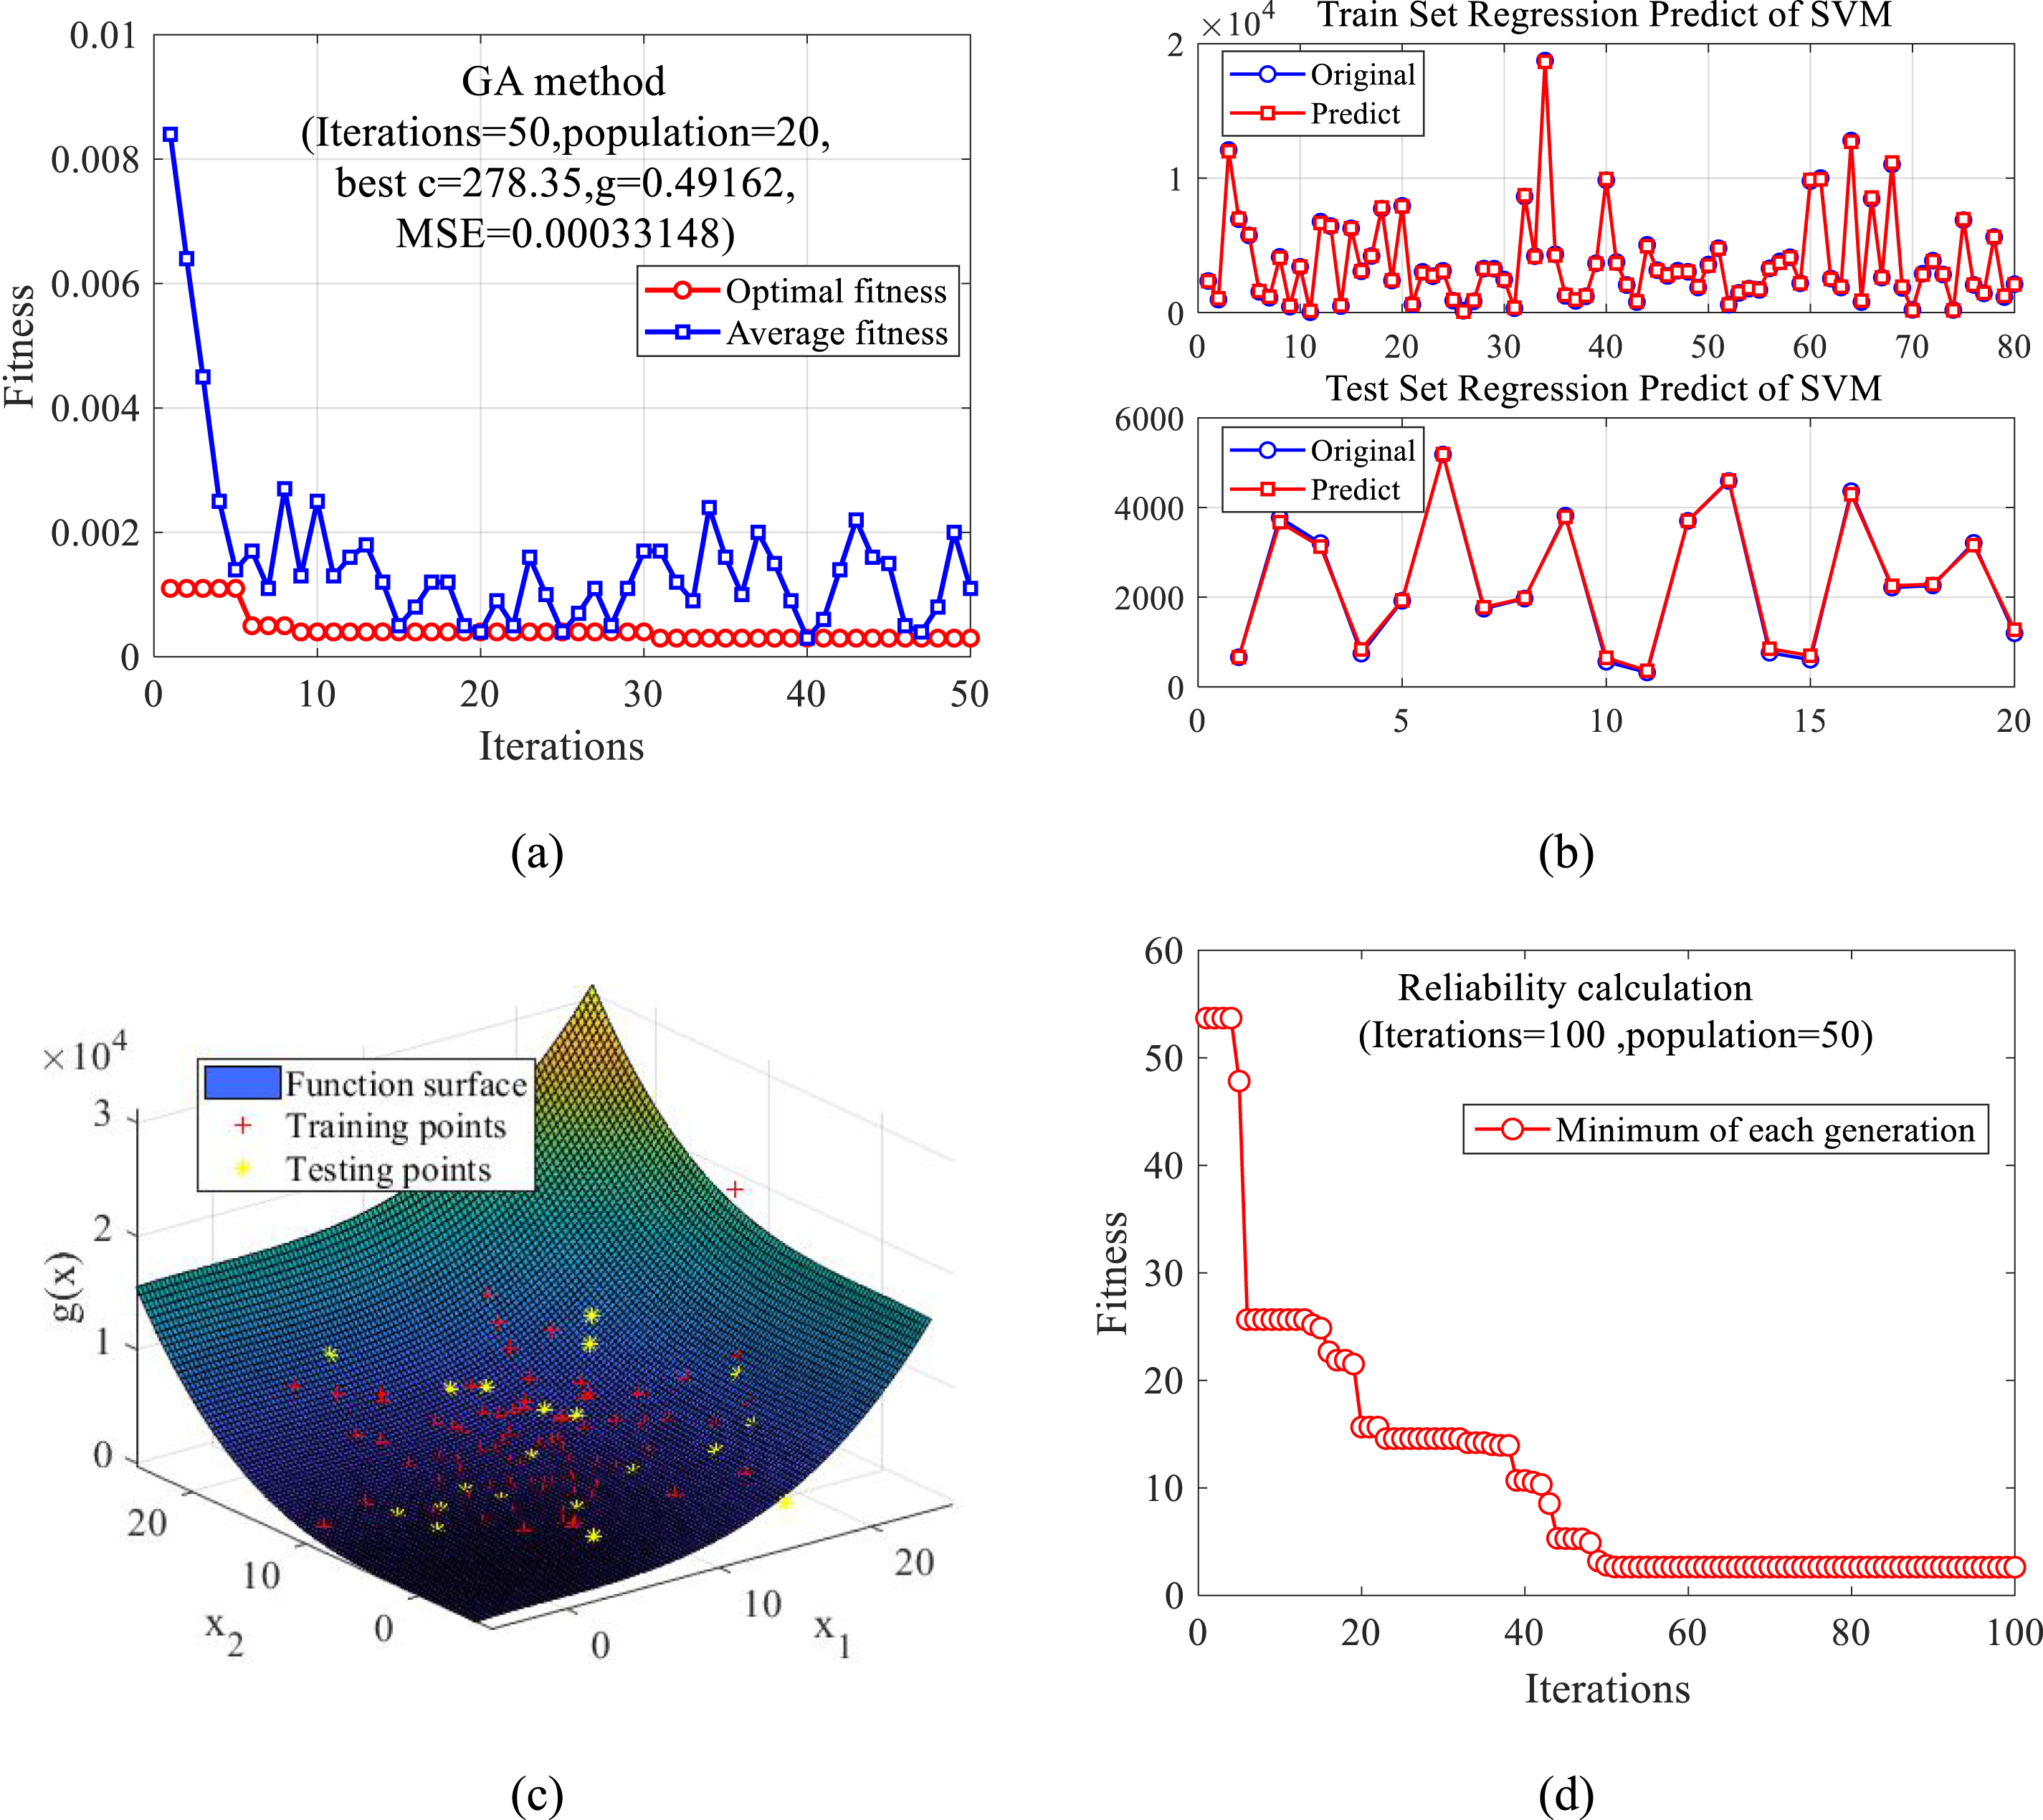
The genetic algorithm was also adopted to calculate the reliability index by minimizing the unconstrained optimization function, as shown in Figure 4(d). For comparison, the Monte Carlo (MC) method was also proposed to calculate the reliability. The failure probability of GA-SVM model is 5.1e-3. The reliability index is 2.57. The failure probability and reliability index using the MC method are 5.7e-3 and 2.53, respectively. The numerical calculation results show that the SVM learning can substitute the explicit limit state function effectively, and the GA method can be used to search the minimum value of the unconstrained optimization function. Furthermore, the verified reliability calculation framework can be adopted to perform the components implicit reliabilities analysis of complex bridge systems.
Model demonstration and application
Long-span cable-stayed bridge
The Kangbo Bridge is the second Yangtze River Bridge in Hejiang County, Sichuan Province of China (Ma et al., 2023b). The bridge tower is double H-shaped concrete pylon. The height of each tower is 146.3 m. Each tower is installed with 34 pairs of cables, which are symmetrical sector in double densely planes. The stay cables are made of high-strength steel wires. The elastic modulus is 2 × 10⁵ MPa and the Poisson’s ratio is 0.3. The π-shaped main beam is made of C60 prestressed concrete, and it consists of three spans (210 + 420 + 210 m). The elastic modulus is 3.46 × 10⁴ MPa and the Poisson’s ratio is 0.3. The height and width of the girder are 3 m and 30 m, respectively.
The finite element (FE) model is established using Midas Civil 2020 software (Ma et al., 2022), as shown in Figure 5. 470 beam elements are used to simulate the main beam and tower. 272 truss elements are adopted to simulate the stay cables. The initial tension is solved by the initial strain, and the sag effect is simulated by equivalent elastic modulus. It should be noted that the most unfavorable situation of the bridge is different when adopting various living loads (Zhu et al., 2007). In this study, the mid-span uniformly distributed load is regarded as the unfavorable load for the reliability analysis of the main beams and cables in the middle of the span. The selected main beam units are numbered from the left tower to the middle span as L1, L2, and…, L34. The cables units are numbered from the left tower to the middle span as S1, S2, …, S34, as shown in Figure 5. FE model of a cable-stayed bridge.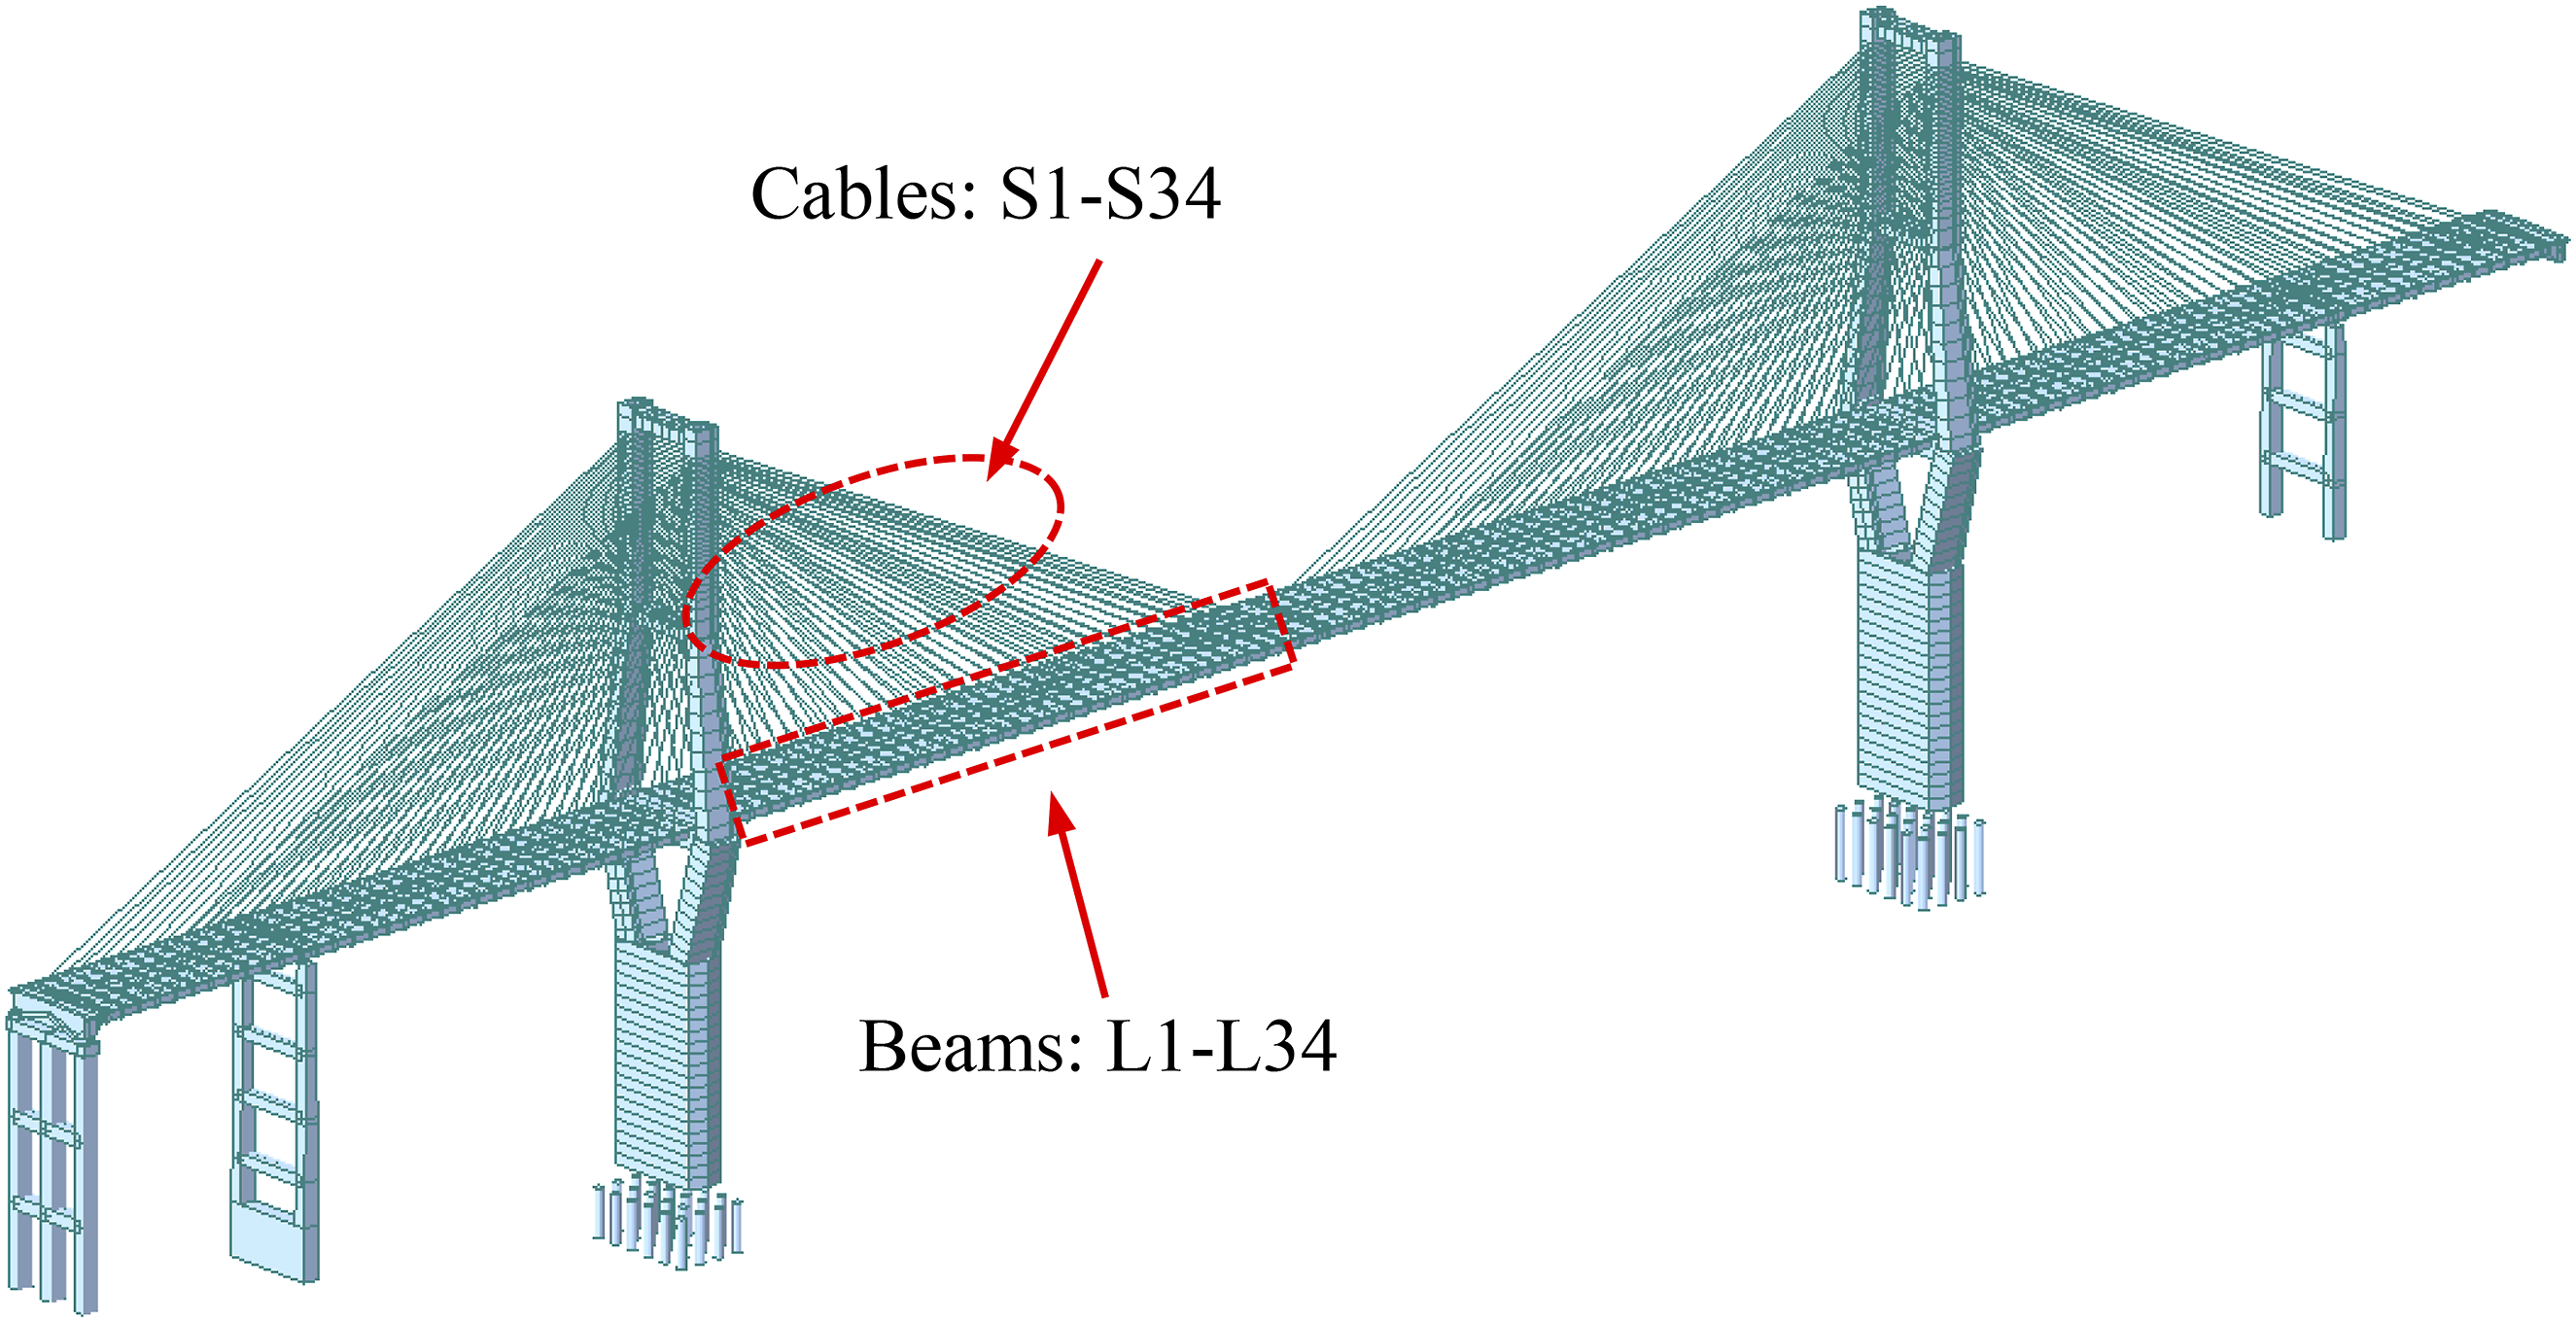
The statistical parameters of random variables (Liu et al., 2016).

SVM based surrogate model
In this section, the support vector machine (SVM) learning model is adopted to substitute the finite element model (FEM). The genetic algorithm (GA) is used to obtain the optimal hyperparameters of SVM modelling. Figure 6 shows the flowchart of the proposed framework. The proposed FEM simulation in Figure 5 was utilized to generate the training samples for GA-SVM model. The hidden relationship of the input and output variables can be captured by the proposed machine learner. The trained GA-SVM model can be utilized to obtain the structural response of the FEM model for reliability analysis. In this research, the 6-dimensional input random variables were regarded as X = [E1, E2, A1, A2, I, Q]T. The calculated structural response values were used as the output variables. The input and output values were normalized into [−1,1], respectively. A total number of 40 normalized samples were used as the training set and 20 samples were used for the test set. The RBF kernel was selected as kernel function. To obtain the optimal fitting performance, the hyperparameters c and g were optimized by the GA algorithm. The cross validation (CV) method was used for comparison. SVM surrogate FEM model.
To evaluate the prediction accuracy of the proposed GA-SVM model. The root meaning square error (RMSE) is adopted to describe the deviation between GA-SVM predicted values and FEM calculated values. The decision coefficient (R2) is used to indicate the correlation degree between the predicted and calculated values. The mean absolute error (MAE) is utilized to reflect the real error of the predicted values. The correlation efficient (ρ) is adopted to describe the proximity between the predicted and the calculated value vector. These indexes are given by:



Figures 7 and 8 show the parameter optimization results of girder and cable using CV-SVM and GA-SVM method, respectively. It is seen from Figure 7, for the main beam L34, the MSE errors of the two models are 6.6926e-4 and 6.7612e-4, respectively. The GA based method has a smaller MSE prediction error. Table 2 lists the indexes introduced in equations (26)–(29) of the two methods. In the GA based method, the values of RMSE and MAE are 0.0162 and 0.0120, respectively, indicating relatively lower values compared with CV based method. In addition, the values of R2 and ρ are 0.9951 and 0.9990, respectively, indicating relatively larger values compared with CV based method. Therefore, it implies that the GA based method is applicable for parameter optimization. The optimization results of the parameters are obtained as: penalty factor c = 26.4338 and kernel parameter g = 0.0155. Parameter optimization for L34: (a) GA method; (b) CV method. Parameter optimization for S34: (a) GA method; (b) CV method. Indexes of two methods.
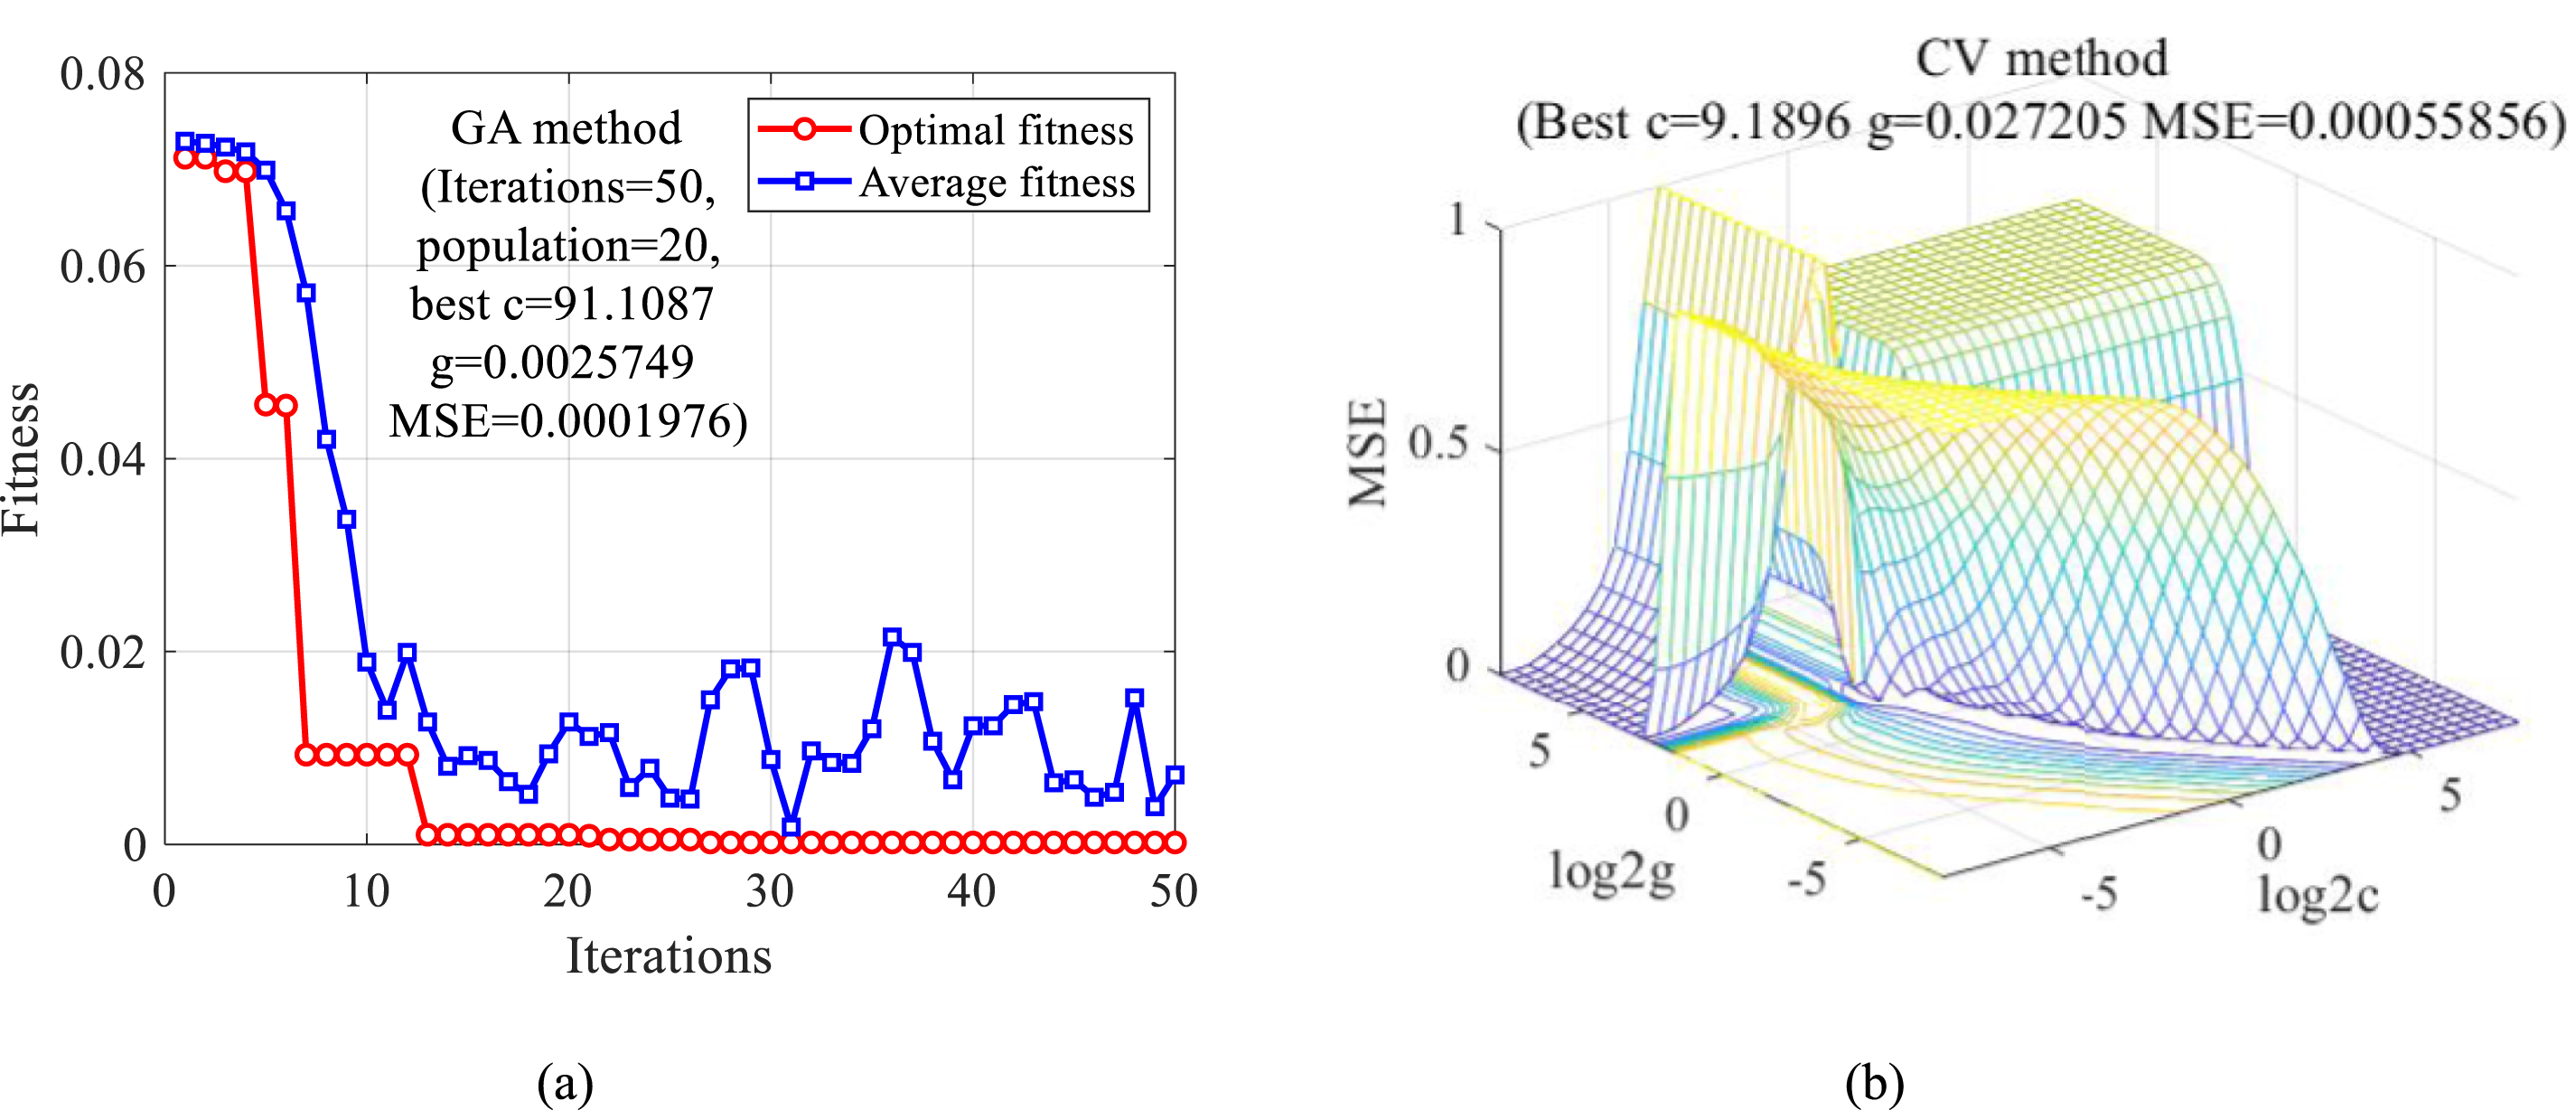

It is seen from Figure 8 and Table 2, the indexes introduced in equations (26)–(29) show the similar trend for cable S34. In particular, the values of MSE, RMSE and MAE by using the GA based method are smaller than those obtained by using the CV based method. On the other hand, the values of R2 and ρ by using the GA based method are slightly larger than those obtained by using the CV based method. Therefore, the GA method is preferable for parameter optimization. The optimized parameters are given as: penalty factor c = 91.1087, kernel parameter g = 0.0026, and MSE = 2.0e-4.
Time-variant reliability
This section introduces the limit state function and the time-variant effect of beam and cables. The limit state equations of the girder stress failure under the action of compression and bending can be written as follows:

The service concrete bridges are suffering the aging damage such as concrete cracking, expansion and falling block (Šomodíková et al., 2016). The cracking of the main beam significantly reduces the cross-sectional area, thereby negatively impacting its mechanical performance. The degradation damage can be quantified as:

The cables are also subjected to diseases, such as stress corrosion, fatigue damage and coupled damage. The diseases will accelerate the deterioration of bridge cables. The cable resistance degradation under adverse environment can be modeled as:

To calculate the initial reliability index at 0 years, the GA method is used to find the extremum of unconstrained optimization of fitness function. The parameters of GA method are set as follows: iterations = 100; population = 50. Figure 9 shows the reliability calculation results for beam L34 and cable S34. In Figure 9, it is seen for L34 beam, the fitness function converges around 50 generations. The reliability index is 5.41, and the corresponding failure probability is 1.3737e-7. For S34 cable, the fitness function converges around 40 generations. The reliability index is 5.81, and the corresponding failure probability is 3.1236e-9. Reliability calculation results: (a) beam L34; (b) cable S34.
After 20 years’ service, the area degradation coefficient of main beams L30-L34 in equation (42) is 0.86, and the strength degradation coefficient of cables S30-S34 in equation (44) is 0.75. The finite element model can be updated and the input-output samples are obtained after degradation of beams and cables. The SVM-based surrogate model is then retrained to calculate the reliability indexes after 20 years’ degradation. Figure 10 shows the reliability comparison based on 0 and 20 service years. As Figure 10 shows, the reliability of beam and cable generally decrease with the increasing number of years. The cross-sectional area decreases by 14% and the corresponding reliability decreases by 28.3% on average. The reliability decreases greater with the distance far away from tower. The effect of the mid-span of the girder is far greater than that near the tower. The cable resistance decreases by 25%, and the corresponding reliability decreases by 37.2% on average. The decrease of cable reliability is relative average, which has no obvious relationship with the distance from the tower. Reliability comparison of 0 and 20 years: (a) L1-L34 main beams; (b) S1-S34 main cables.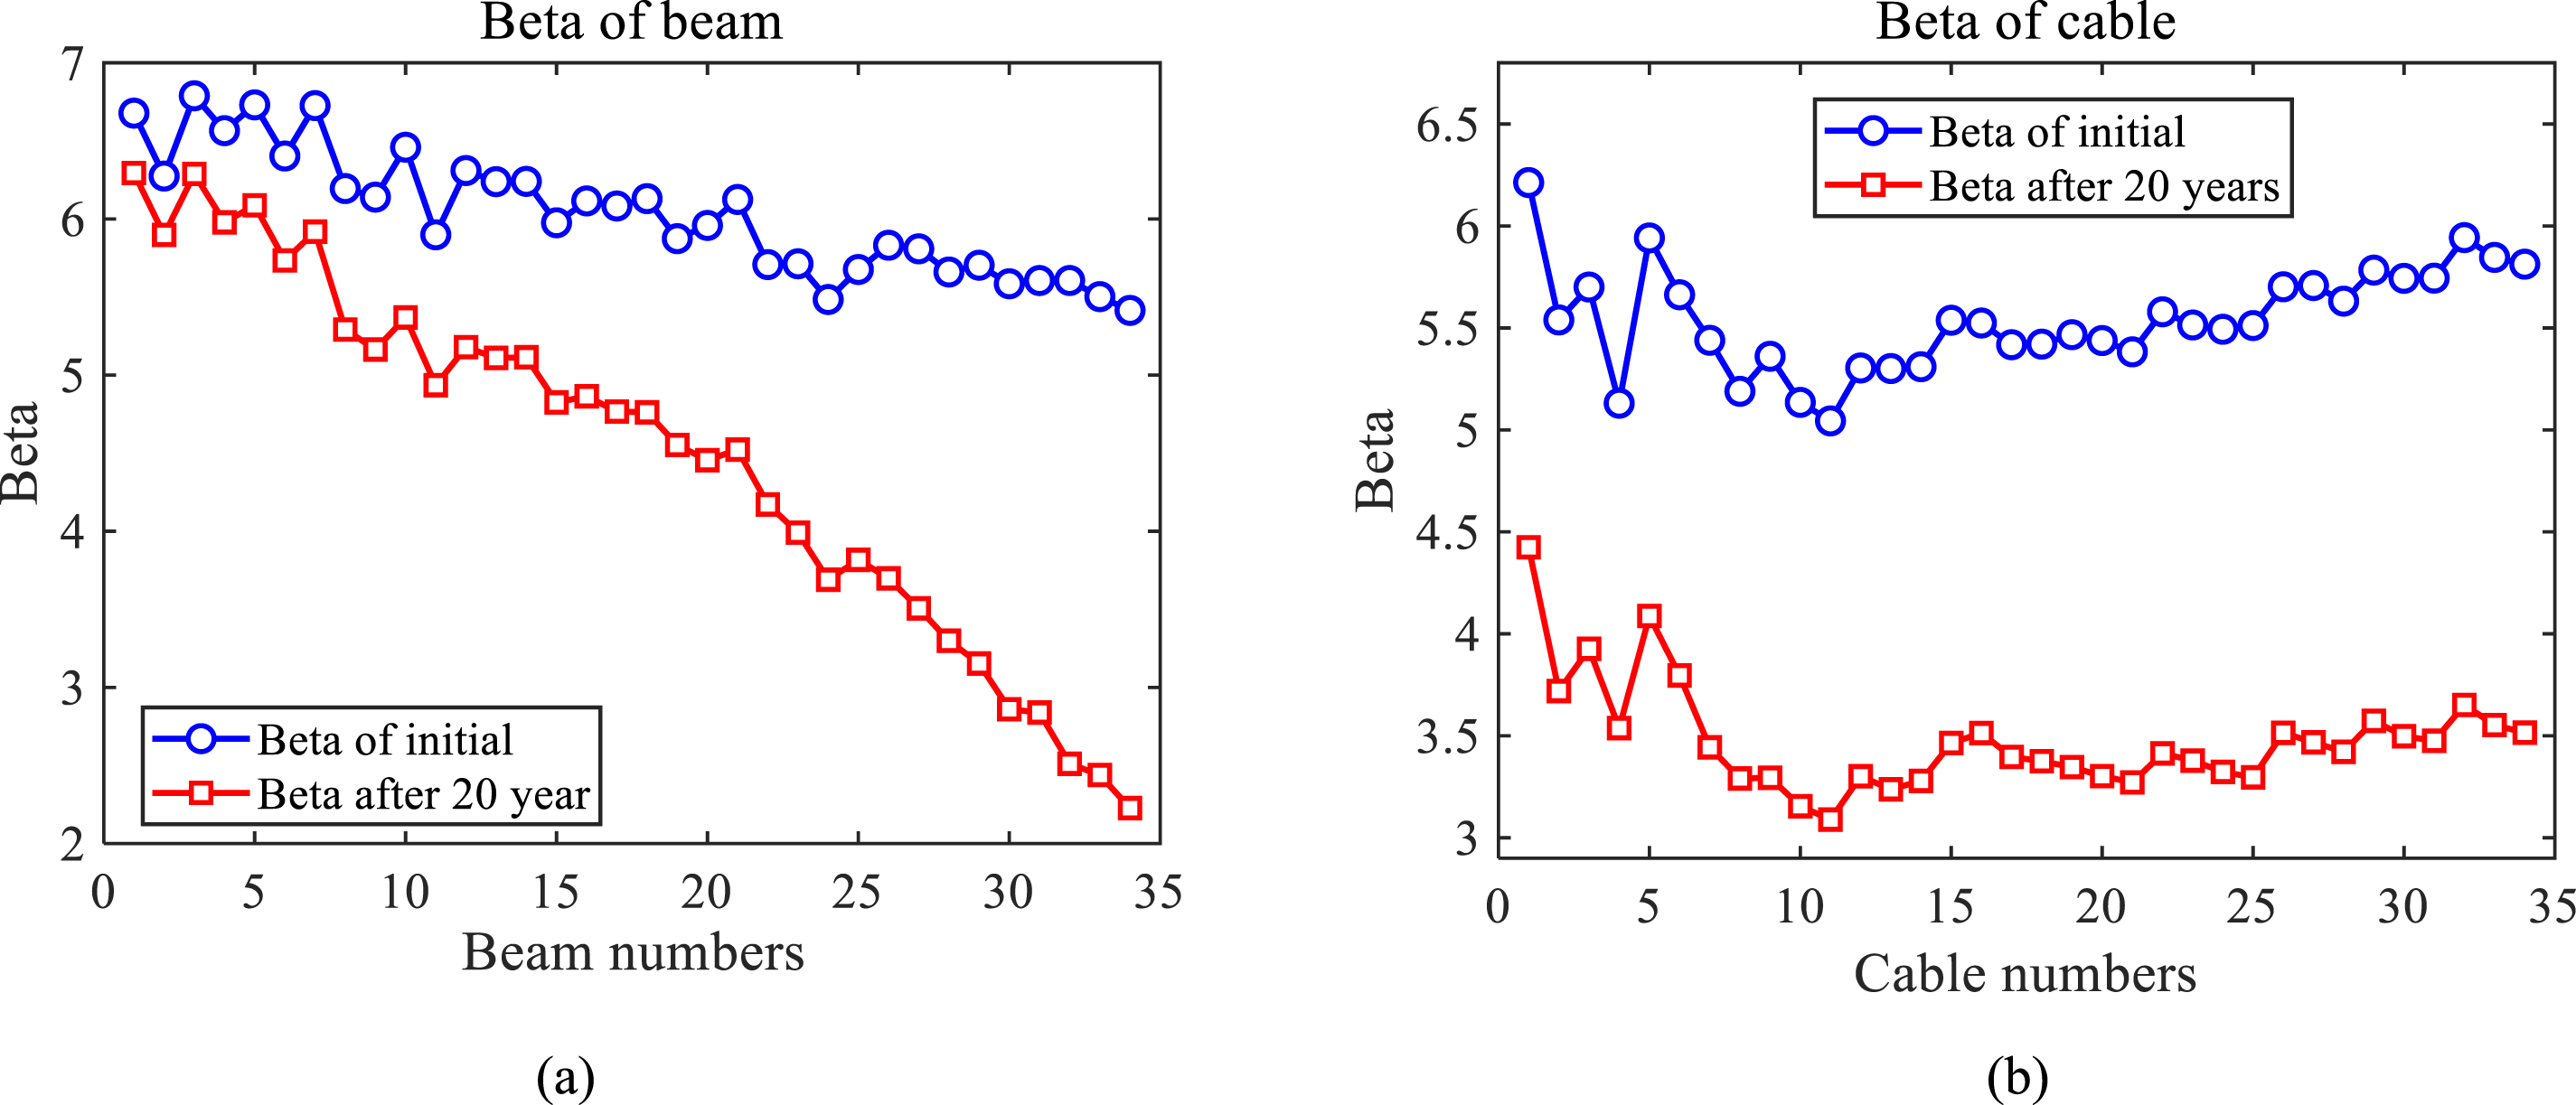
System reliability evaluation
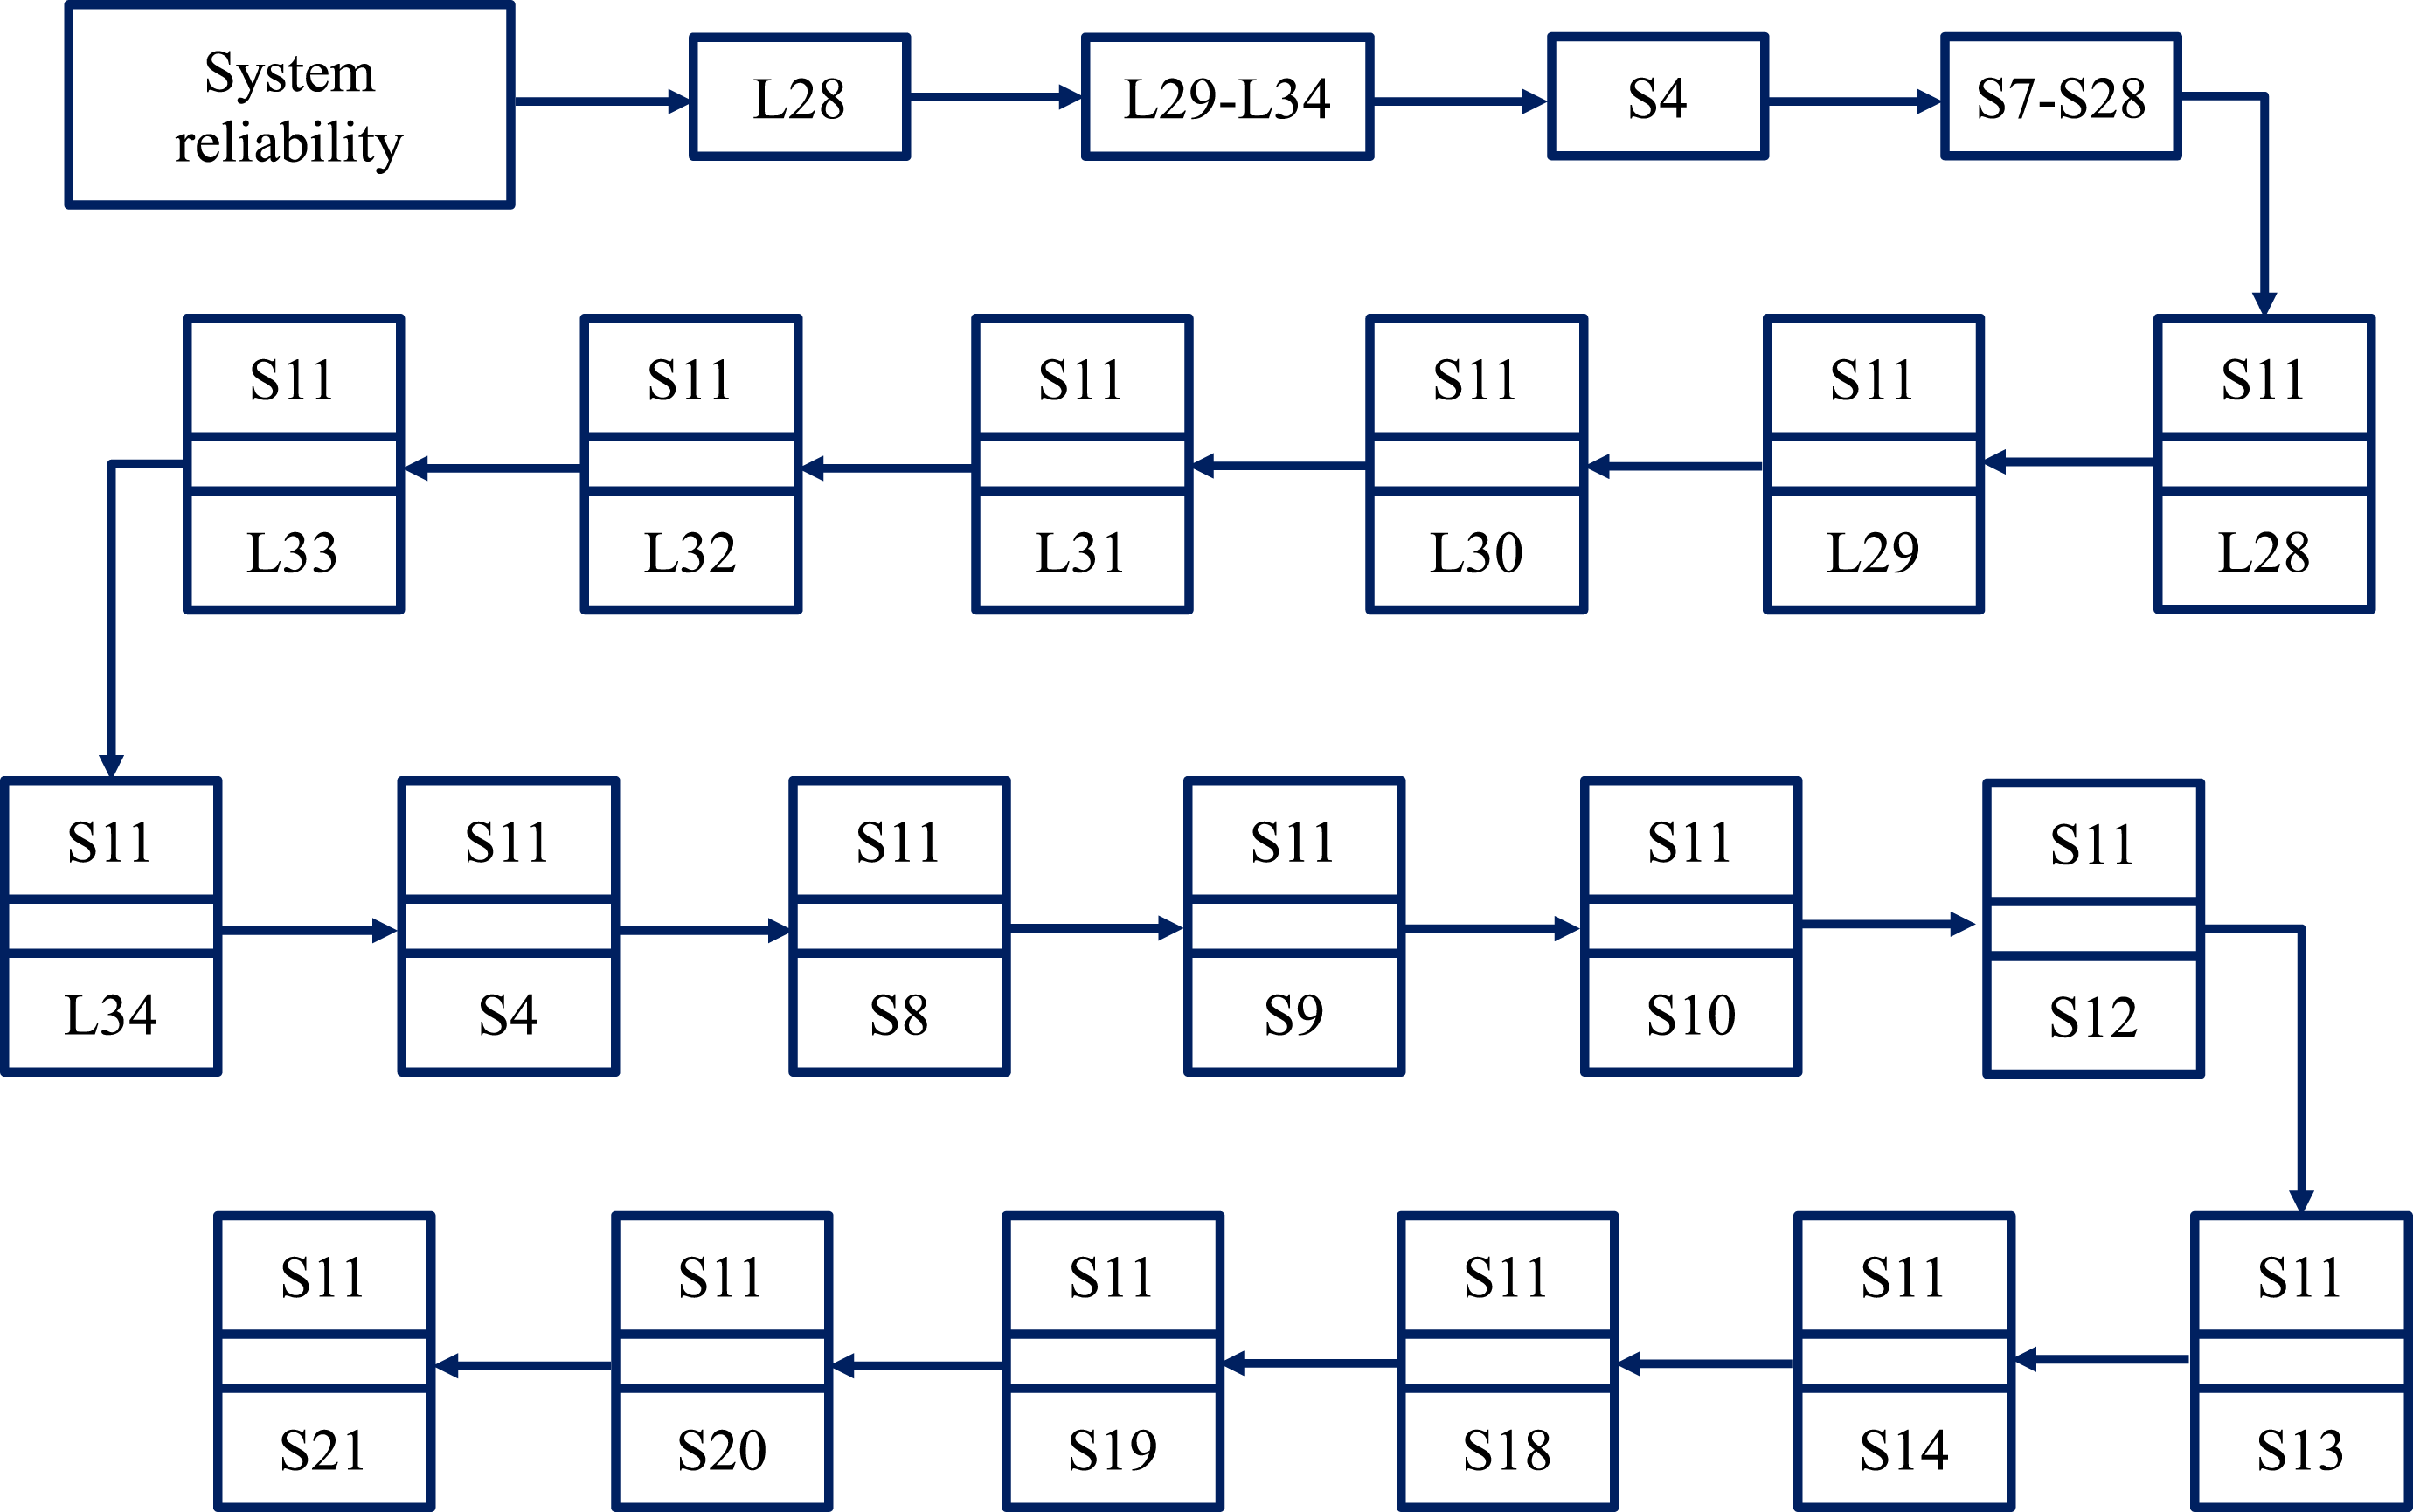
The system failure modes should be searched after the components reliabilities are obtained. It should be noted that correlation among different system elements can affect system reliability analysis results. For complex bridges, the failure of single main beam is assumed as the one of the system failure modes. The other failure mode occurs once any component (beam or cable) failure after the failure of single cable. The β-bound method is adopted for the system failure road recognition in this section. The reliability indexes of components are regarded as the search criterion. Firstly, the minimum value
It should be noted that different width criteria can be adopted to search the failure components. To balance the efficiency and accuracy, the search width Δβ(1) and Δβ(2) are both assumed as 0.5 in the first and second level stage. Figure 11 shows the components reliabilities at 0 year. The minimum reliability unit is cable S11, and its value Components reliabilities at 0 year: (a) L1-L34; (b) S1-S34. The first and second potential failure components at 0 year.

Figure 13 shows the components reliabilities after 20 years. After 20 years, for the first level, the search width Δβ(1) is also set as 0.5. The minimum reliability unit is cable S11, and its value Components reliabilities after 20 years: (a) L1-L34; (b) S1-S34. The first and second potential failure components after 20 years.
Conclusions
This paper proposes a time-variant system reliability calculation framework based on GA method and SVM approach. The parameters of the SVM model are optimized by the GA method. The GA-SVM model is used to substitute the FEM model for reliability calculation. Component reliability indexes are calculated using the GA methodology. The β-bound method is adopted for searching system failure modes. The time-variant influence of the components for system reliability is considered in this study. The proposed framework is illustrated using a long-span cable-stayed bridge. The results show that the proposed GA-SVM method achieves more accurate results compared with CV-SVM. The reliabilities of beams and cables generally decrease over time. The cross-sectional area decreases by 14% and the average reliability indexes decrease by 28.3%. Reliability indexes decrease more prominently with increased distance from the tower. The cable resistance decreases by 25%, and the corresponding average reliability indexes decrease by 37.2%. The decline in cable reliability is relatively consistent across distances from the tower. The reliability of the second level of the system is 6.47 before degradation, while 4.12 after 20 years. The potential failure components are increased after degradation, which leads to the increasement of the system failure modes. The results show that the bridge is relatively safe before degradation while the safety performance is relatively poor after degradation. It is necessary to replace the potential failure components to conduct a timely maintenance.
The geometrical nonlinear correlation effects are not explicitly taken into consideration in this study. The interaction mechanism of multiple natural hazards also needs to be further studied including dynamics characteristics, earthquakes impact, and strong winds. The time-variant system reliability methods should be developed for complex system, including advanced optimization algorithms, Bayesian updating approach and deep reinforcement learning. The plastic collapse mechanisms and the nonlinear correlations of the bridge components need to be considered for the ductile system reliability analysis. More random variables and a comprehensive sensitivity analysis should be proposed to perform the accurate reliability evaluation, including materials and loads. The mathematical statistical characteristics of assumed random variables should be verified by actual inspection data and failure modes in the further study.
Footnotes

Funding
The author(s) disclosed receipt of the following financial support for the research, authorship, and/or publication of this article: This work is conducted with the financial support from the Guangxi Science and Technology Program (AD25069101), the Research Foundation Ability Enhancement Project for Young and Middle Teachers in Guangxi Universities (2025KY0304), the National Natural Science Foundation of China (52178107), National Science Foundation for Distinguished Young Scholars of Hunan Province (2024JJ2003), and the Initial Science Foundation of Guilin University of Technology (GUTQDJJ 2024054). The support is gratefully acknowledged.
Declaration of conflicting interests
The author(s) declared no potential conflicts of interest with respect to the research, authorship, and/or publication of this article.