



Abstract
In this paper, the quasi-static tests were carried out for RC retaining wall strengthened with diagonal bracing. Behavior assessment of retaining walls included failure mode, hysteretic response, stiffness degradation, energy dissipation and shear deformation. In addition, the strut-and-tie calculation model is proposed to calculate the bearing capacity. Compared with the unstrengthened retaining wall, the compressive failure of the wall panel and concrete spalling failure were less pronounced for the diagonal bracing strengthening wall due to the diagonal bracing sharing a portion of the shear force. And the stress concentration at the four corners of the opening can be relieved. The RC retaining wall strengthened with diagonal bracing experiences a significant increase of 141% in the cracking load and 21% in the peak load, compared to the unstrengthened retaining wall. And the shear deformation of the retaining wall strengthened with diagonal bracing contributes to over 50% of the total lateral deformation. Furthermore, the strut-and-tie calculation model proposed in this paper can effectively predict the bearing capacity of the strengthened and unstrengthened retaining wall.
Introduction
In recent years, the use and functional needs for underground space has changed, so as to increase expansion and laying new pipelines. As a result, it has become increasingly common to create openings in the retaining walls of underground buildings and high-rise building basements (Li et al., 2023; Shariati et al., 2019; Zhang et al., 2022). However, such openings weaken the axial bearing capacity, in-plane horizontal bearing capacity, and lateral stiffness of the retaining wall. In addition, retaining walls with opening are more susceptible to stress concentration near the opening, which can lead to local damage (Bastami et al., 2023; Mosallam and Nasr, 2017; Mosoarca, 2014; Zhai et al., 2019). Therefore, designing a reasonable opening range and implementing strengthening measures to prevent local damage due to stress concentration at the weak part of the opening has become a critical issue, so as to minimize the degradation of seismic performance of the wall.
It is widely acknowledged that opening in the wall have a significant impact on its bearing capacity, energy dissipation capacity, and stiffness. Various countries’ current codes impose specific restrictions on the allowable range of opening and the required strengthening measures for walls. Per ACI 318 (2019), reinforcement in the form of anti-seismic hook ends or U-shaped steel bars should be used when the steel bar is cut due to the creation of an opening in the wall. Similarly, JGJ 3-2010 (2010) specifies that when the opening length does not exceed 800 mm, steel bars with a minimum diameter of 12 mm should be arranged around the opening. In addition, seismic design GB 50011-2010 (2010) emphasize the importance of appropriately limiting the opening area and implementing necessary strengthening measures around the opening.
Numerous studies have been conducted to investigate the impact of opening area, number, and arrangement on the seismic performance of walls. Hosseini et al. (2019) found that the wall with openings experienced an average decrease of 45% in horizontal bearing capacity, a two-thirds reduction in energy dissipation performance, and an average stiffness decrease exceeding 50% compared to the complete wall. In a quasi-static cyclic test performed by Yu et al. (2019) on five shear walls with small openings, it was observed that when the opening area was small and located away from the compression zone of the shear wall, the effect on bearing capacity and stiffness was minimal. Xu et al. (2023) revealed that the shear wall without openings exhibited shear failure, whereas those with openings were more susceptible to bending failure, with a bending deformation rate ranging from 49.66% to 58.99%. In cases involving multiple openings, cracks primarily concentrated in the connection area between the two openings. Kim et al. (2023) studied the seismic performance of four wall with opening. The results indicated that the vertical reinforcement of the wall broke prematurely, the lateral stiffness was significantly reduced, and the energy consumption was limited. The maximum crack width of the wall was affected by the opening type and the reinforcement ratio. Additionally, research by Ali Blash et al. (2024) demonstrated that double-opening walls exhibited distinct failure modes such as vertical cracking, working face spalling, and block fracture, which differed from those observed in non-opening walls. Zhang et al. (2022) conducted that the impact of opening width on the bearing capacity of shear walls exceeded that of opening height. Mosoarca et al. (2014) carried out a comparative test on multi-opening shear walls with both vertical and staggered openings, revealing distinct variations in bearing capacity and failure modes among these walls.
To alleviate stress concentration at the four corners of openings, many scholars have utilized carbon fiber-reinforced polymer (CFPR) sheets and steel plates with high tensile strength to reinforce walls with openings. For instance, Todut et al. (2023) investigated the seismic performance of pre-damaged walls with openings reinforced using CFRP. The results showed that the bearing capacity of the wall was partially restored, and the bearing capacity of the wall was improved. Nonetheless, sudden debonding failures of CFRP often occurred, leading to a substantial decrease in ductility (Foret and Limam, 2008; Limam et al., 2005). Recognizing the limitations of CFRP strengthening in form and effectiveness, scholars have turned their attention to studying walls strengthened with steel plates. Liu et al. (2023) applied steel plates around openings for strengthening, resulting in an increased ductility coefficient of the strengthened wall by 5.6%–58.1%. The bearing capacity of the wall with opening was significantly enhanced through the bonding of steel plates, typically accomplished using bolts and structural adhesives to ensure their efficacy during earthquakes (Li et al., 2023; Terzioglu et al., 2018; Özdemir et al., 2021). In comparison to CFRP strengthening, the use of bonded steel plates demonstrated superior effectiveness in limiting structural crack development, as well as enhancing the yield and ultimate load capabilities of the walls.
Given the aforementioned background, it is evident that bonded steel plates positively contribute to restoring the seismic performance of walls with openings. Nevertheless, there is a scarcity of studies on reinforcing walls with openings using diagonal bracing. It is crucial to comprehensively assess the impact of various strengthening methods on the seismic performance of walls with openings in order to offer insights for reinforcing walls with diverse opening backgrounds and methods. Moreover, in the case of basement side walls with relatively small shear spans, the internal stress field exhibits discontinuous characteristics, rendering the plane section assumption inapplicable. The predominant failure modes involve baroclinic and shear-compression failures, with the failure of the wall with openings primarily attributed to the diagonal strut failure.
Therefore, this paper designs a strengthening scheme with diagonal bracing. By analyzing the failure mode, hysteretic response, stiffness degradation, energy dissipation and shear deformation of the wall, the seismic performance of RC retaining wall strengthened with diagonal bracing was evaluated. In addition, the strut-and-tie calculation model is proposed to calculate the bearing capacity. The conclusions drawn from this paper serve as a valuable reference for the seismic safety evaluation of wall strengthened with diagonal bracing, as well as the design of corresponding strengthening schemes with diagonal bracing.
Experimental program details
Mechanical characteristics of the materials
The properties of steel bars.

Preparation of the test specimen
Based on the actual engineering cases of the underground retaining wall, RC retaining walls unstrengthened and strengthened with diagonal bracing with a scale of 1:2.5 were designed. Figure 1 illustrates the dimensions and reinforcement details of these two retaining wall specimens. The wall measures 120 mm × 1600 mm × 2000 mm, with an opening that is 1280 mm in height and 500 mm in width, situated at the center of the wall panel’s bottom. The reinforcement ratio of vertical and horizontal steel bars in the wall panel is 0.87% and 0.42%, respectively. Additionally, the longitudinal steel bars and the stirrup of the boundary element have reinforcement ratios of 2.36% and 0.34%, respectively. The inclusion of boundary elements in walls is crucial for enhancing seismic performance. The unstrengthened RC retaining wall and RC retaining wall strengthened with diagonal bracing are named ORW and S-ORW, respectively. Details of all RC retaining wall.
For the diagonal bracing, longitudinal reinforcement with 3C14 (reinforcement ratio of 4.44%) and C60 grout was selected. The diagonal bracing used pre-embedded steel bars to arrange the grouting material. Initially, a hole was created on the formwork according to the position of the pre-embedded steel bar, and the embedded bars were deeply extended into the hole for 100 mm on both sides, with a length of 300 mm. After pouring the concrete for the wall panel and removing the formwork, the longitudinal reinforcement was bound. Subsequently, the longitudinal bar was bent inward and welded at the lap, resulting in the same effect as a U-shaped planting bar, as shown in Figure 2. The details of pre-embedded steel bars.
The strengthened RC retaining wall was strengthened using grouting material and longitudinal reinforcement, which was symmetrically arranged on both sides of the wall panel, with a thickness of 40 mm. Figure 1(b) illustrates the details of the strengthening retaining wall. Upon reaching the specified strength, the initially cast retaining wall undergoes surface roughening treatment at the interface. The treated area corresponds to the contact surface between the grouting material and the retaining wall. This roughening process, which exposes coarse aggregates, enhances the bond strength between the two materials. The production process of the retaining wall specimen is shown in Figure 3. Fabrication process of retaining wall.
Test setup and loading protocols
The quasi-static tests were conducted at the earthquake test center of Tongji University, utilizing a 1000 kN electro-hydraulic servo static loading test system to apply horizontal load. The RC retaining wall was anchored to the static pedestal using anchor bolts, as depicted in Figure 4. Strain gauges were installed on the longitudinal and vertical distributed reinforcement of the wall panel, as well as on the corner reinforcement above the opening, as shown in Figure 4(a). Measurements were taken and recorded using linear variable differential transformers (LVDTs) to capture the lateral displacement of the loading beam and wall panel, as well as the slip of the foundation beam relative to the foundation pedestal. The displacement recording data of LVDTs is collected by the connected data acquisition system. The lateral load (push and pull) on the retaining wall was obtained by the built-in sensor of the actuator. Two LVDTs were arranged along the diagonal of the retaining wall to measure the shear deformation of the specimen. Test setup and the picture of the test site.
During the retaining wall test, a displacement-controlled stepwise loading protocol was used to apply cyclic loads. Prior to reaching the yield load, cyclic loading was applied with a displacement increment of 1 mm per step, performing one loading cycle at each displacement level while recording test observations. After reaching the yield load, the displacement increment was increased to 3 mm per step, with three loading cycles performed at each displacement level. The yield load was determined based on characteristic points identified in the load-displacement curve obtained from the test. The progression of wall cracks was observed and recorded during the final cycle to aid in assessing the failure mode of the retaining wall. Loading was halted once the peak load of the specimen dropped below 0.85 times the peak load. The loading system is depicted in Figure 5. Loading patterns.
Experimental results and discussion
Damage sequences and crack fracture
Experimental observation
For specimen ORW, initial oblique cracks emerged at the corner of the opening when subjected to a lateral load of 51.4 kN, resulting in a displacement of 0.38 mm (equivalent to a drift ratio of 0.02%). When the load reached 196.5 kN, horizontal cracks with a spacing of 150 mm were observed on both sides of the wall panel adjacent to the opening. The cracks extended to the edge of the opening and wall panel. The drift ratio reached 0.17% (equivalent to a displacement of 2.78 mm). The occurrence of oblique cracks on the wall panel were increasing, and oblique cracks with 45° angels appeared at the top of opening when the load reached 381 kN (9.56 mm). As the displacement increased, noticeable stiffness degradation was observed in the retaining wall with an opening, accompanied by the yielding of longitudinal reinforcement. Additionally, the number and width of oblique cracks on the wall panel progressively increased. When the drift ratio reached 1.05% (equivalent to a displacement of 16.87 mm), the crack width around the upper corner of the opening rapidly expanded, ultimately reaching its peak load of 459.9 kN. At the load of 406.2 kN, the concrete at the bottom of the boundary element was crushed, causing the longitudinal reinforcement to bend and bulge outward. In addition, concrete spalling was observed at the corner of the opening. The results indicated that the ORW specimen exhibited flexural and shear failure. The crack development pattern and concrete crushing location of the ORW specimen are illustrated in Figure 6. Crack development and failure modes of specimen ORW.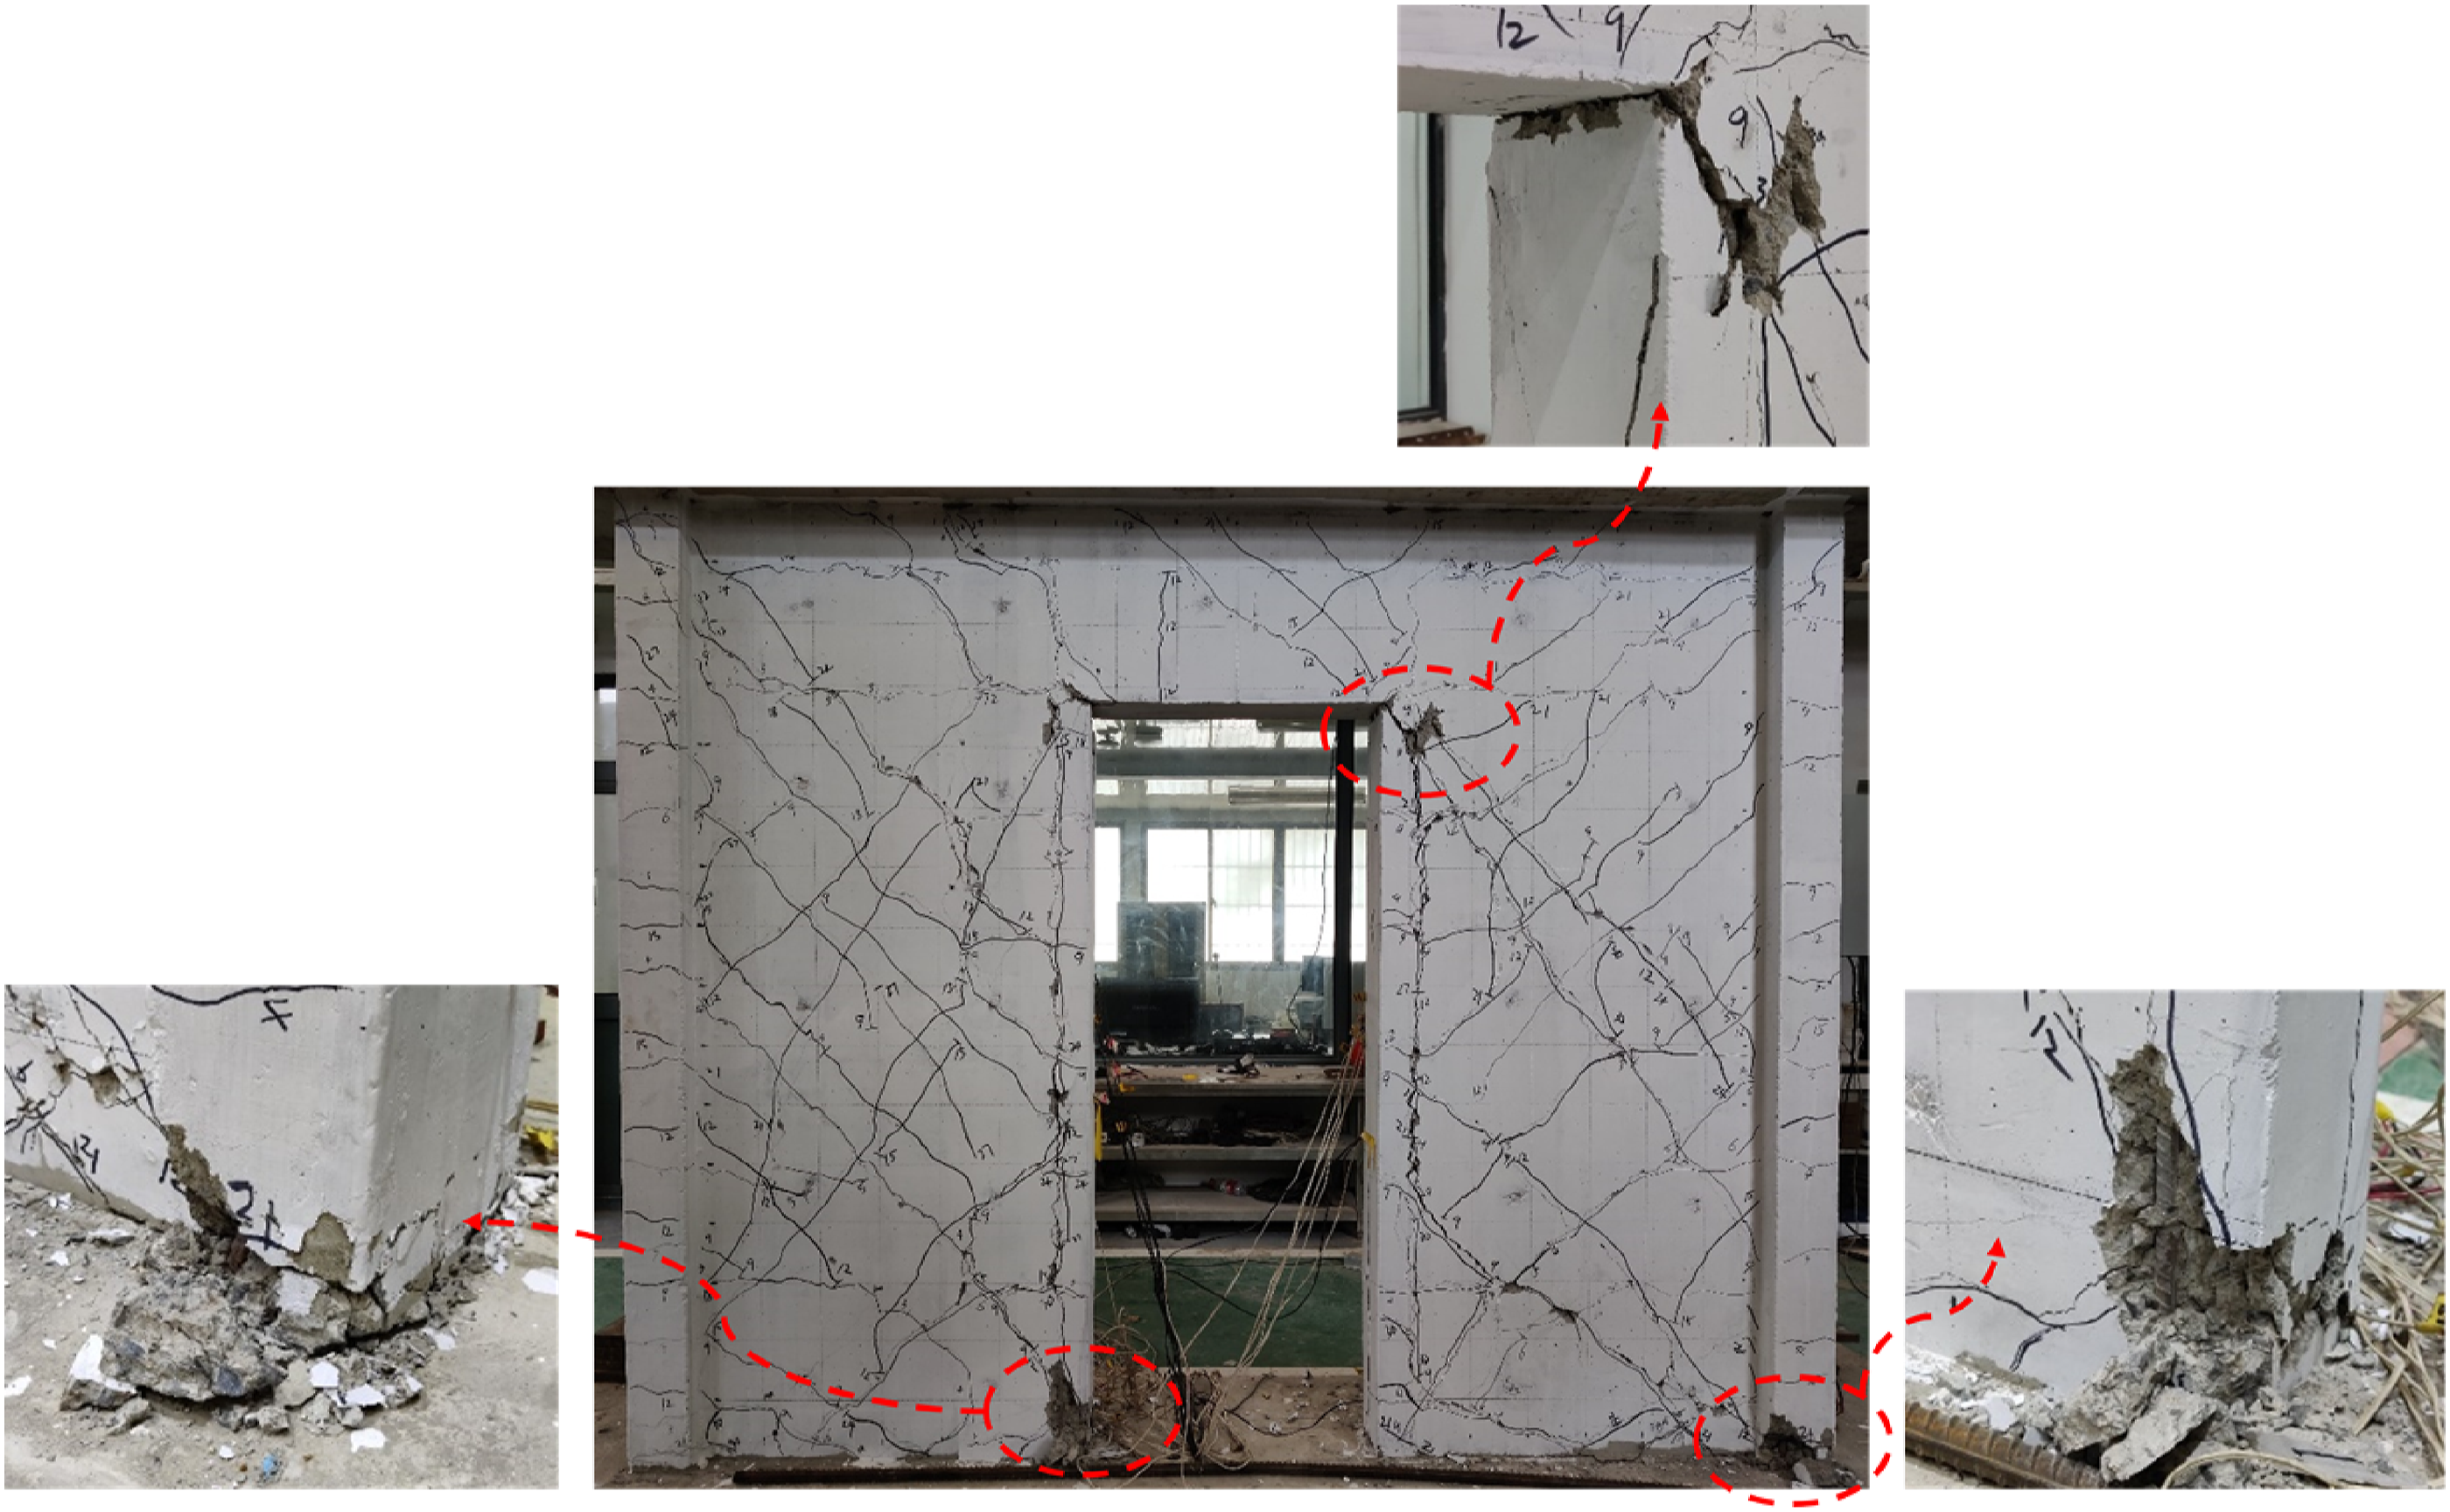
For specimen S-ORW, the initial 45° oblique crack occurred at the upper corner of the opening at the load of 123.7 kN, resulting in a drift ratio of 0.05% (equivalent to a displacement of 0.74 mm). Upon lateral loading of 170.3 kN, the oblique crack at the upper corner of the opening extended outward and took on a horizontal orientation on the diagonal bracing and wall panel. In addition, a horizontal micro-crack emerged at the bottom of the wall panel and propagated towards the diagonal bracing, resulting in a drift ratio of 0.07% (equivalent to a displacement of 1.18 mm). When subjected to a lateral load of 439.1 kN, the stiffness degradation of the retaining wall with opening was obvious and the longitudinal reinforcement yield. At a drift ratio of 0.45% (equivalent to a displacement of 7.24 mm), vertical intersecting oblique cracks appeared at the bottom of the wall panel. The crack width on the wall panel rapidly expanded, and no new cracks formed when the drift ratio increased to 0.79% (equivalent to a displacement of 12.61 mm). The load reached its peak value of 558.7 kN. The bearing capacity of specimen S-ORW was compromised due to crushing of the concrete at the root of both sides of the wall panel. In general, the retaining wall strengthened with diagonal bracing exhibited the flexural and shear failure. The crack development pattern and concrete crushing location of the S-ORW specimen are depicted in Figure 7. Crack development and failure modes of specimen S-ORW.
Failure modes
Based on the aforementioned analysis, it is concluded that both retaining walls exhibit elastic deformation prior to yielding and elastic-plastic deformation after yielding. Cracks appeared in the wall with opening after the horizontal load of 51.4 kN, while cracks appeared in the retaining wall strengthened with diagonal bracing when the load was 123.7 kN. Failure occurred in both retaining wall specimens, with concrete crushing at the bottom of the wall panels and yielding of the longitudinal reinforcement in the boundary elements. In addition, the stress concentration at the four corners of the opening resulted significant damage to the concrete.
Notably, the concrete crushing location differed between the retaining wall strengthened with diagonal bracing. For specimen ORW, the upper corner of the opening experienced concrete crushing as there was no lateral constraint. However, for specimen S-ORW, the compressive failure of the wall panel and spalling failure of the concrete were less pronounced due to the diagonal bracing sharing a portion of the shear force. The results demonstrate that the diagonal bracing strengthening outlined in this paper effectively mitigates damage to the wall panel and reduces concrete damage in the vulnerable corner region.
Hysteretic response
The hysteresis curves of the unstrengthened and strengthened retaining wall are shown in Figure 8. Both retaining walls exhibit the elastic deformation stage, followed by an elastic-plastic deformation stage during the loading process. In the elastic deformation stage, the loading and unloading stiffness demonstrate similarity, resulting in a small hysteresis loop area and a linear hysteresis curve. The deformation of the specimen rapidly recovers, and residual deformation remains minimal. As loading progressed, the specimen’s stiffness gradually diminished until reinforcement yielding occurred. Subsequently, the specimen transitioned into the elastoplastic deformation stage, demonstrating distinct nonlinear behavior. Hysteresis curves.
The specimen S-ORW demonstrate a higher initial stiffness compared to the specimen ORW. Additionally, owing to the diagonal bracing, S-ORW exhibits a smaller residual deformation under similar displacements. With the increase of displacement, the degradation rate of both stiffness and strength in S-ORW was slower than that of ORW. The results showed the effective mitigation of concrete damage under cyclic loading through the implementation of strengthening measures. Notably, these results align with the failure phenomena and modes observed throughout the testing process.
The skeleton curves of the two specimens are shown in Figure 9. Up to a load of 100 kN, both specimens exhibit similar stiffness. However, as the displacement increases, the slope of the skeleton curve undergoes significant changes. In the elastic-plastic stage, it can be seen from the slope of the skeleton curve that the S-ORW specimen exhibits superior lateral stiffness and crack resistance compared to the ORW specimen. The results indicate that the diagonal bracing can improve the bearing capacity and stiffness of the wall with opening, and can effectively reduce the damage of concrete under cyclic loading. Skeleton curves.
Displacement and load values.

Wall stiffness degradation
The internal material damage of RC retaining wall specimens is more and more serious under cyclic loading, which leads to the gradual decrease of stiffness. The lateral stiffness of the retaining wall is described by the secant stiffness of the positive and negative extreme points of each loading step in the load-displacement curve, see equation. (1). Stiffness degradation curves.

Stiffness coefficient of specimens.

Energy dissipation capacity
The energy dissipation performance of RC members is a crucial indicator of seismic performance, as it measures the ability to absorb energy via plastic deformation during earthquakes. Typically, the energy dissipation value of walls is calculated using the cumulative enclosed area of the hysteresis curve. The curve depicting the accumulated energy dissipation of the retaining walls is shown in Figure 11. During the loading process of each specimen, with the increase of displacement, the plastic deformation develops continuously, and the energy dissipation capacity of the specimen is continuously improved. However, in almost all cases, the energy dissipation of specimen ORW is higher than specimen S-ORW. It shows that the RC retaining wall strengthening by diagonal bracing has higher energy dissipation capacity. Notably, the energy dissipation capacity of a specimen is quantified by measuring the equivalent damping coefficient (ξ ): Accumulated energy dissipation in both retaining wall.

A
h
and A
e
is the area of the hysteresis curve and the sum of area of the triangle AOC and DOE, respectively, as sown in Figure 12. Schematic diagram of equivalent damping coefficient calculation.
The curve depicting the ξ of the retaining walls is shown in Figure 13. The results reveal that as displacement increases, both walls exhibit a gradual growth in ξ. During the initial loading stage, plastic deformation occurs in certain areas of the concrete, thereby enhancing the energy dissipation capacity of the wall. Subsequently, as concrete cracking ensues, the ξ tends to stabilize. Upon entering the yield stage, the number of yielding steel bars inside the specimen gradually rises, resulting in a rapid increase in the ξ. Damping coefficient for different cycles.
Strain analysis
The strain distribution along the length direction of the retaining wall specimen of the vertical reinforcement is shown in Figure 14. The results reveal that the strain distribution of the vertical reinforcement adheres to the expected pattern observed in RC flexural members. Specifically, under the cracking load, the strain distribution of the bottom vertical steel bar within the wall panel remained limited due to the relatively small applied load at this stage. During the yielding phase, the reinforcement strain in both strengthened and unstrengthened walls reached the yield strain, indicating that the specimens entered the yielding stage. However, due to the diagonal bracing carrying a portion of the shear force, the reinforcement strain in specimen S-ORW was smaller compared to that in the ORW specimen. Notably, the retaining wall specimen is divided into two sections by the opening, and each section having its own tensile and compressive zones. On both sections of the retaining wall, the compressive strain of the vertical steel bar at the bottom of the boundary element in the compression zone is greater than the compressive strain observed at the bottom edge of the opening. Similarly, the tensile strain of the steel bar in the tensile zone follows the same pattern. Vertical strain of rebars along wall length. Schematic diagram of shear deformation calculation.

Shear deformation
During the loading process, the lateral deformation of the retaining wall specimen can be segregated into two distinct components (Figure 15): flexural deformation and shear deformation, which are indicative of the flexural stiffness and shear stiffness, respectively. It is imperative to consider the impact of shear deformation during cyclic loading. Consequently, measuring and analyzing the shear deformation of the retaining wall is essential. The shear deformation (Δs) can be calculated using equation (3).
The shear deformation calculation results for both retaining walls are presented in Figure 16(a). The results indicate that the shear deformation of both walls is nearly identical when the displacement is less than 4 mm. As the lateral displacement increases, the shear deformation of the S-ORW specimen experiences a rapid increase after cracking. However, this rapid development of shear deformation in the S-ORW specimen occurs later than it does in the ORW specimen. In general, the total shear deformation observed in the S-ORW specimen is smaller than that of the ORW specimen under the same horizontal displacement. Shear deformation of retaining wall.
During the loading process, the total lateral deformation of the specimen can be decomposed into bending deformation and shear deformation. The total lateral deformation was obtained by subtracting the LVDT values at the center points of the loading beam and the foundation (the difference between D 3 and D 7 ). The shear deformation ratio of both specimens at the peak load is shown in Figure 16(b). The results show that the shear deformation of both retaining walls contributes to over 50% of the total lateral deformation, primarily due to the presence of the opening, which disrupts the flow of shear stress across the wall panel. In addition, the diagonal bracing plays a significant role in enhancing the shear stiffness of the wall, leading to a reduced proportion of shear deformation compared to the wall with the opening alone.
Theoretical prediction of peak load
The prevailing softened strut-and-tie calculation model presumes that the concrete crushing leads to wall failure. Consequently, it proceeds to compute the shear contributions of the diagonal mechanism, horizontal mechanism, and vertical mechanism based on the deformation coordination condition (Hwang and Lee, 2002; Kassem, 2015), as depicted in Figure 17. However, with the opening of the wall, the oblique and horizontal mechanisms become disconnected due to the opening, leaving only the vertical mechanism to counteract horizontal load. If the existing calculation method is employed for retaining wall with opening, the outcomes will be inherently inaccurate. To address this issue, this paper presents a calculation model for assessing the horizontal bearing capacity of retaining wall strengthened with diagonal bracing. Furthermore, experimental data is utilized to validate the accuracy of this proposed calculation model. Softened strut-and-tie model.
Unstrengthened retaining wall
For specimen ORW, the oblique and horizontal mechanisms become disconnected due to the opening, leaving only the vertical mechanism to counteract horizontal load. Therefore, the author proposes a method to simplify both sides wall of the opening into equal-section strut-and-tie elements. By considering the strain in the vertical direction of the concrete and the alignment of the strut-and-tie, the strength of the concrete in the strut-and-tie is reduced. The reduction method is to multiply the compressive strength of concrete by the softening strut-and-tie coefficient. The resulting softened strut-and-tie model for walls with opening and the calculation of each size parameter are shown in Figure 18. The strut-and-tie model of unstrengthened retaining wall.
Based on the research by Hwang and Lee (2002), Hwang et al. (2001), this paper proposes the calculation method for the compressive strength (Fs1 and Fs2) of concrete struts on both sides of the opening, as shown in equation (4). The regions on both sides of the opening form typical bottle-shaped struts. For compressive capacity calculation, these struts may be treated as prismatic members, with the concrete strength reduced based on the transverse strain in the wall perpendicular to the strut axis. In the softened strut-and-tie model, this reduction is achieved by multiplying the axial compressive strength of concrete by the softening coefficient (ζ). The calculation method of the softening strut-and-tie coefficient is shown in equation (5).


Based on the test results and failure modes of the retaining wall, it can be seen that the stress concentration at the four corners of the opening resulted significant damage to the concrete. Consequently, when calculating the resistance of the edge strut rod (Fbt) and the vertical strut rod (Fzt), it is imperative to consider the contributions from the longitudinal reinforcement of the boundary element, the vertical distribution reinforcement of the wall panel, and the axial load at the top of the opening. The point at which the strut rod resistance is determined by the intersection of the 45° oblique crack and the loading beam at the upper corner of the opening. The calculation method for determining the strut rod resistance is provided in equations (6) and (7).


Further, the horizontal bearing capacity Vkd of the unstrengthened retaining wall can be calculated according to the plastic deformation conditions, see equation (8).

The calculation method of the shear resistance of the strut rod is shown in equation (9).


Retaining wall strengthened with diagonal bracing
It is observed that the concrete strut rod yields before the tie rod for the wall with opening alone, thereby limiting the vertical mechanism from fully fulfilling its shear role. To address this limitation and enhance the bearing capacity of the wall with opening, the concrete strut rods are reinforced to delay their yielding in comparison to the tie rod. For specimen S-ORW, the diagonal bracing is symmetrically arranged on walls, and only the effect of reinforcement on the concrete strut rod is considered in the calculation, as shown in Figure 19. The calculation method of the strengthening concrete strut is shown in equation (10). The strut rod is reinforced by diagonal bracing.


When calculating the horizontal bearing capacity Vjg of the wall strengthened with diagonal bracing, it is necessary to consider the combined action of the strut rod and the vertical tie rod at the same time. The calculation method is shown in equation (11).


Model verification
The strut-and-tie model proposed in this paper is used to calculate and compare the test results of Ref. (Hosseini et al., 2019; Kim et al., 2023; Xu et al., 2023). The size, reinforcement and opening information of the wall specimen are referred to the paper, so it is not repeated here. The results indicate that the average ratio of the experimental value to the calculated value is 0.98, as shown in Figure 20. Most of the results have errors less than 10%. The results demonstrate that the effectiveness of the proposed calculation model in accurately predicting the bearing capacity of walls strengthened with diagonal bracing. Notably, the theoretical model provides a certain safety margin since the calculated results are generally lower than the experimental values. Comparison of calculation with experimental values.
Conclusion
In this paper, quasi-static tests were carried out on two 1:2.5 scale RC retaining wall strengthened with diagonal bracing. The failure mode, hysteretic response, stiffness degradation, energy dissipation and shear deformation of retaining wall were compared and investigated. The main conclusions are as follows: (1) The stress concentration at the four corners of the opening can be reduced by diagonal bracing strengthening to reduce the damage of the wall panel and the vulnerable corner region. (2) The retaining wall strengthened with diagonal bracing experiences a significant increase of 141% in the cracking load and 21% in the peak load, compared to the unstrengthened retaining wall. The energy dissipation capacity of unstrengthened retaining wall can be improved by diagonal bracing. (3) The shear deformation of the retaining wall strengthened with diagonal bracing contributes to over 50% of the total lateral deformation. The diagonal bracing plays a significant role in enhancing the shear stiffness of the wall, leading to a reduced proportion of shear deformation compared to the wall with the opening alone. (4) The strut-and-tie calculation model proposed in this paper can effectively predict the bearing capacity of the retaining wall strengthened with diagonal bracing.
Footnotes

Funding
The authors disclosed receipt of the following financial support for the research, authorship, and/or publication of this article: The authors gratefully acknowledge the funding supports of National Key Research and Development Program of China (2022YFC3801800) and National Natural Science Foundation of China (Grant No. 52038010 and 52078368).
Declaration of conflicting interests
The authors declared no potential conflicts of interest with respect to the research, authorship, and/or publication of this article.