
Abstract
This paper delves into the flexural behavior of reinforced concrete (RC) two-way slabs strengthened with basalt fiber reinforced polymer (BFRP) grid and engineered cementitious composite (ECC). Building upon a prior comprehensive experimental investigation on slabs strengthened with BFRP-ECC composites, this study focuses on developing reliable strength models through the proposal of accurate finite element (FE) models. By meticulously comparing failure modes, load–deflection responses and strain developments of steel reinforcements and BFRP grids between FE predictions and experimental observations, the efficacy of the FE model in accurately predicting test results is demonstrated. The average ratio of the predicted to experimental ultimate load is 1.02, with a coefficient of variation of 0.041. A subsequent parametric study shed lights on key factors influencing the flexural performance of these strengthened slabs. It turned out that increasing ECC thickness significantly enhanced the flexural capacity, with an improvement ranging from 30.2% to 140.2%. Furthermore, a design-oriented model, incorporating the development of yield line and uniformity of BFRP strain is introduced, effectively capturing the ultimate load and moment of strengthened slabs. This research not only advances the understanding of the strengthening mechanism but also offers practical insights for designing and assessing such composite systems.
Keywords
Introduction
Reinforced concrete (RC) slabs serve as commonly used floor and roof structures due to their well-established construction methods and excellent performance. However, these slabs are susceptible to damages such as cracking, sudden stiffness reduction, and even potential collapse during their service life (Daneshvar et al., 2021; Noël and Soudki, 2013). Such problems arise from material deterioration, seismic activities, explosions, and other related factors (Al-Rousan et al., 2024; Han and Li, 2010; Ren et al., 2019). Consequently, investigating efficient reinforcement methods becomes crucial in enhancing the mechanical resilience of RC slabs.
Fiber-reinforced polymers (FRP) are a favored choice for strengthening RC structures due to their lightweight nature, high strength, corrosion resistance, and longevity (Harle, 2024; Nie et al., 2022; Siddika et al., 2019). The use of externally bonded FRP for reinforcing RC structures has been extensively researched (Abed et al., 2022; Mater et al., 2022; Moshiri et al., 2023; Tang et al., 2024). However, challenges exist with organic adhesives like epoxy resins, particularly in maintaining durability in high temperatures and humid conditions (Fang et al., 2022; Moudood et al., 2019; Wu et al., 2010), leading to potential FRP debonding (Mazzotti and Savoia, 2009; Min et al., 2024; Xue et al., 2024). In contrast, inorganic cementitious materials such as engineered cementitious composites (ECC) offer superior resistance to heat and moisture, along with excellent compatibility with concrete substrates (Gou et al., 2023; Huang et al., 2024; Ma et al., 2024; Shabakhty et al., 2024). Additionally, ECC also possess a notable tensile strain capacity (typically 3%–8%), aiding in crack control and self-healing (Hu et al., 2024; Ji et al., 2023; Lin et al., 2023; Yu et al., 2017). To bolster traditional concrete’s tensile strength to match that of FRP, integrating ECC with FRP as a composite layer for strengthening RC structures has been proposed.
Current research indicated that the predominant form of an FRP-ECC composite system involves embedding FRP grids or bars within ECC to establish a composite reinforcement layer attached to the concrete substrate (Qian et al., 2024; Su et al., 2024; Yang et al., 2025; Yuan and Hu, 2021). In a study by Zheng et al. (2016), the flexural performance of RC beams strengthened with a BFRP mesh-reinforced ECC matrix was examined, showing no debonding of the composite layer during the test. Another investigation by Zheng et al. (2020) implemented a BFRP grid-ECC composite for shear reinforcement on both sides of RC beams, revealing debonding within the inner concrete rather than at the ECC-concrete interface, indicating a strong bonding between the composite layer and concrete. Hou et al. (2020) suggested that the modest increase in flexural capacity of strengthened beams may be due to the limited cross-sectional area of the FRP grid. Consequently, BFRP bars were used for beam reinforcement, with steel bolts for anchoring. Their findings demonstrated a maximum 48% increase in the ultimate load of the strengthened beam. Yang et al. (2018) emphasized the effectiveness of utilizing prefabricated ECC in conjunction with epoxy resin at the ECC-concrete interface to prevent debonding. Chen et al. (2021) conducted a comparative study on the compressive properties of concrete columns reinforced with the BFRP grid-ECC system and textile-reinforced mortar. Additionally, they developed a FE model for a parametric study on the spacing and number of BFRP grid layers. The BFRP grid-ECC system was also applied to enhance the compressive performance of corroded RC columns (Zhang et al., 2023a). Zhou et al. (2023) explored the behavior of cantilevered RC square cylinders covered with CFRP grid-ECC composite under lateral low-velocity impact loads, finding that the CFRP grid-ECC can reduce the lateral displacement, alter the damage modes, and limit shear crack development in strengthened columns. The FRP-ECC composite system presents a promising approach for enhancing the flexural and shear capacities of RC structures. However, extant research on FRP-ECC composite layers predominantly focuses on the reinforcement of beams and columns, with a notable paucity of studies on RC slabs, particularly two-way slabs. Moreover, the mechanism and flexural behavior of the composite layer under biaxial bending moments remain inadequately understood, and there is an absence of quantitative analysis regarding the flexural capacity enhancement of such a strengthened slab. Consequently, a numerical investigation into the FRP-ECC system’s responses to bi-directional bending moment is of paramount importance. For this investigation, BFRP was selected as the fiber material in the FRP-ECC composite system due to its: superior mechanical compatibility with ECC (Li, 2003; Yu et al., 2018), cost-effectiveness relative to performance (Jamshaid and Mishra, 2016; Monaldo et al., 2019), and enhanced environmental resilience (Tang et al., 2010; Wu et al., 2025).
This study developed and validated multiple FE models against experimental results. A parameter analysis was subsequently conducted using the validated model to explore the effects of key factors on mechanical performance of strengthened slabs. These factors encompass concrete strength grades (C25–C55), ECC strength grades (C30–C60), ECC thickness (15 mm–55 mm), BFRP grid thickness (1 mm–5 mm), ECC-concrete interface bonding degree (20%–100%), and corrosion rate of the steel reinforcement (0%–80%). Finally, a design-oriented model was formulated to predict the ultimate moment and load of strengthened slabs, demonstrating good accuracy through validation against experimental and FE results.
Experimental database and finite element procedures
Design of specimens
Specimen details.
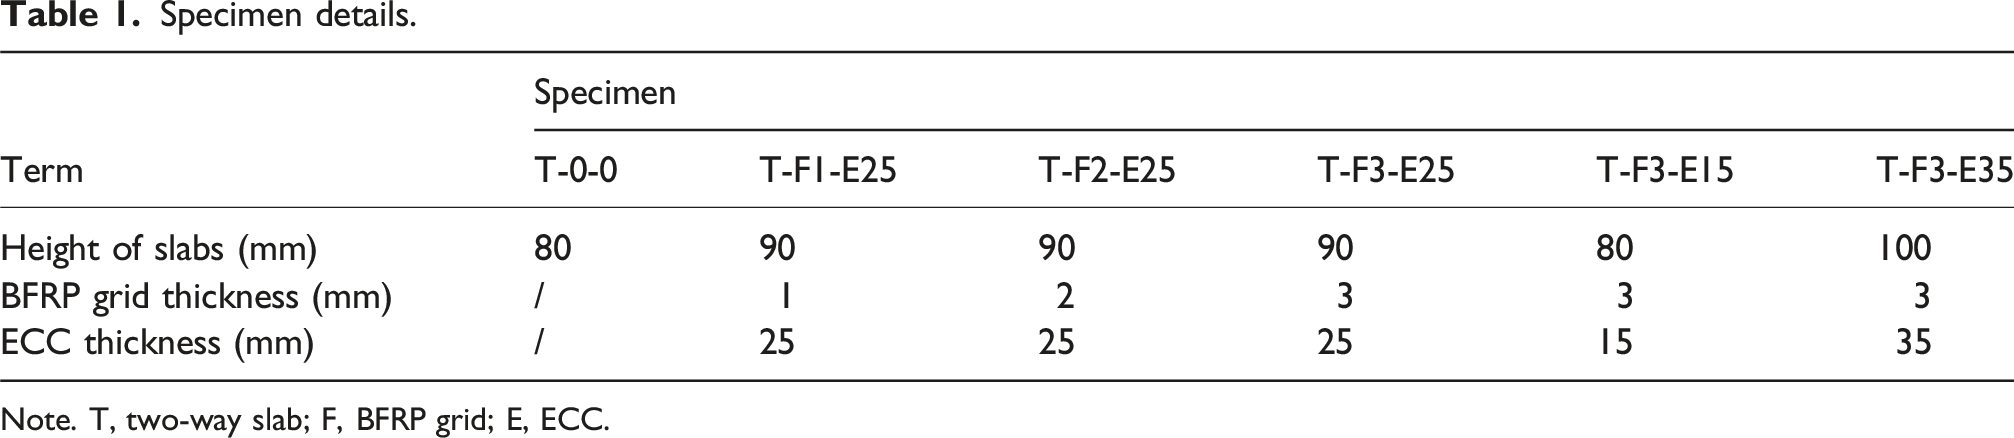
Note. T, two-way slab; F, BFRP grid; E, ECC.
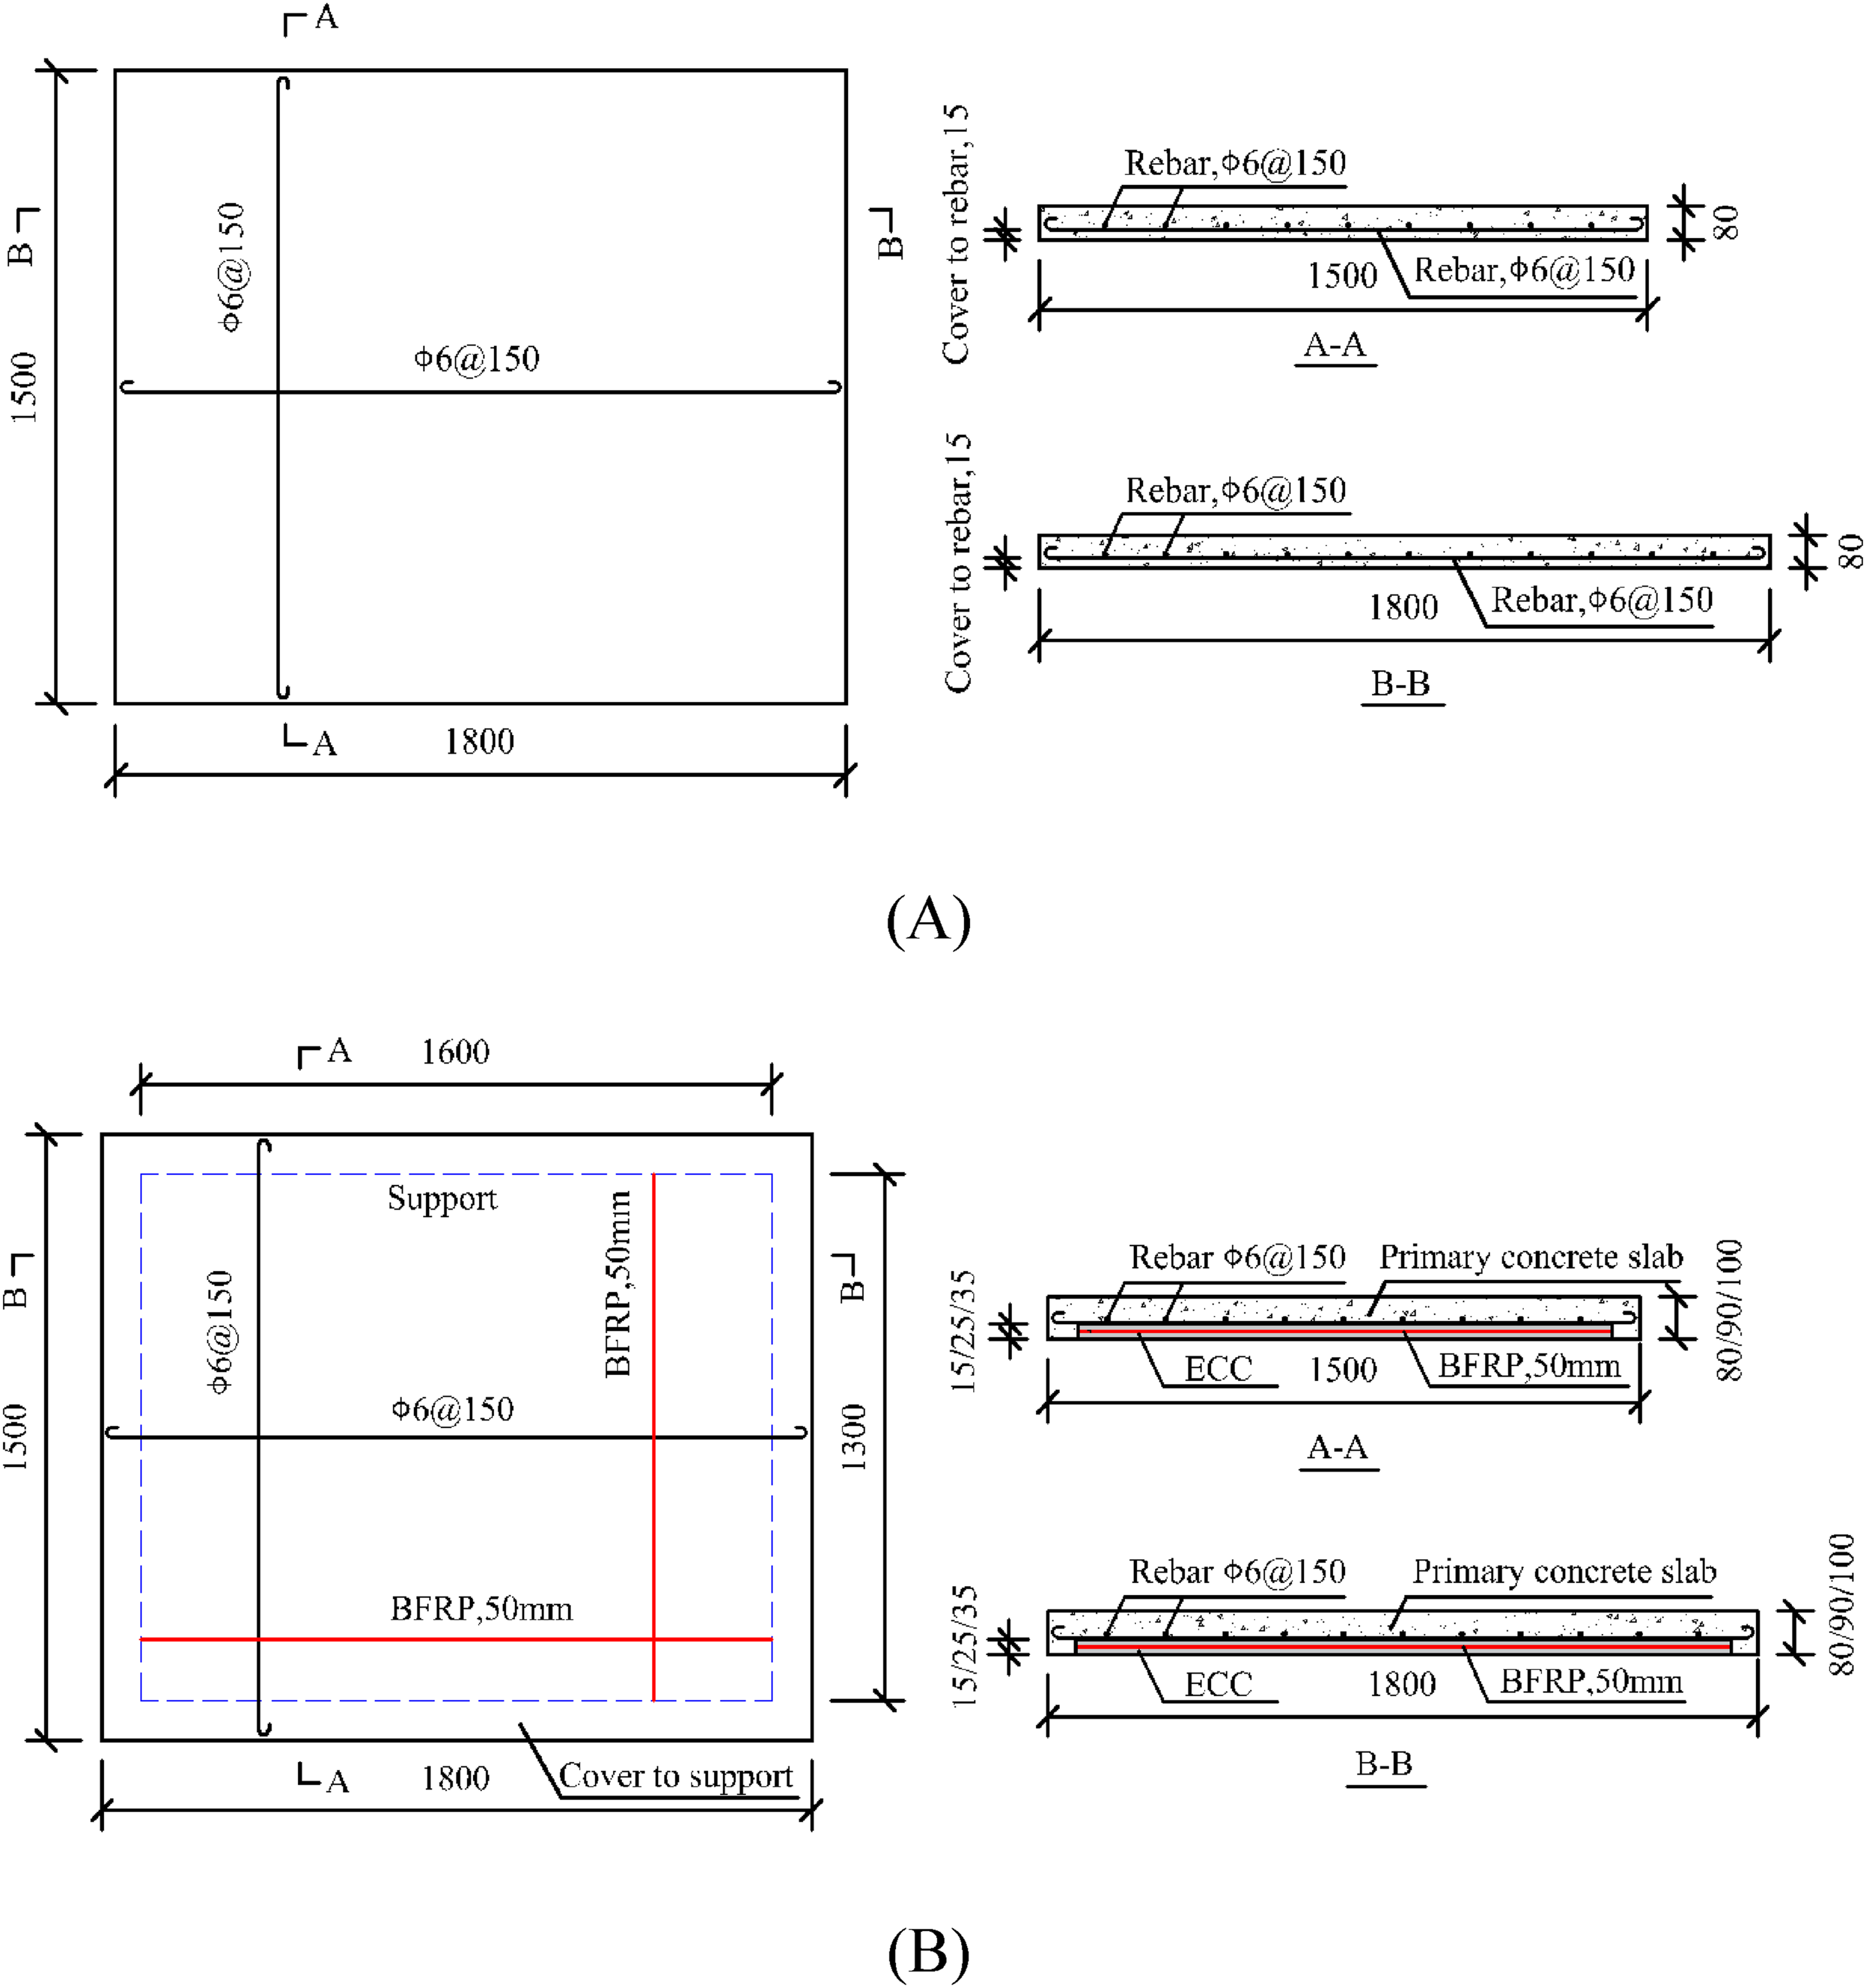
Geometry of tested slabs (dimensions in mm): (A) Reference slab, (B) BFRP grid-ECC strengthened slabs.
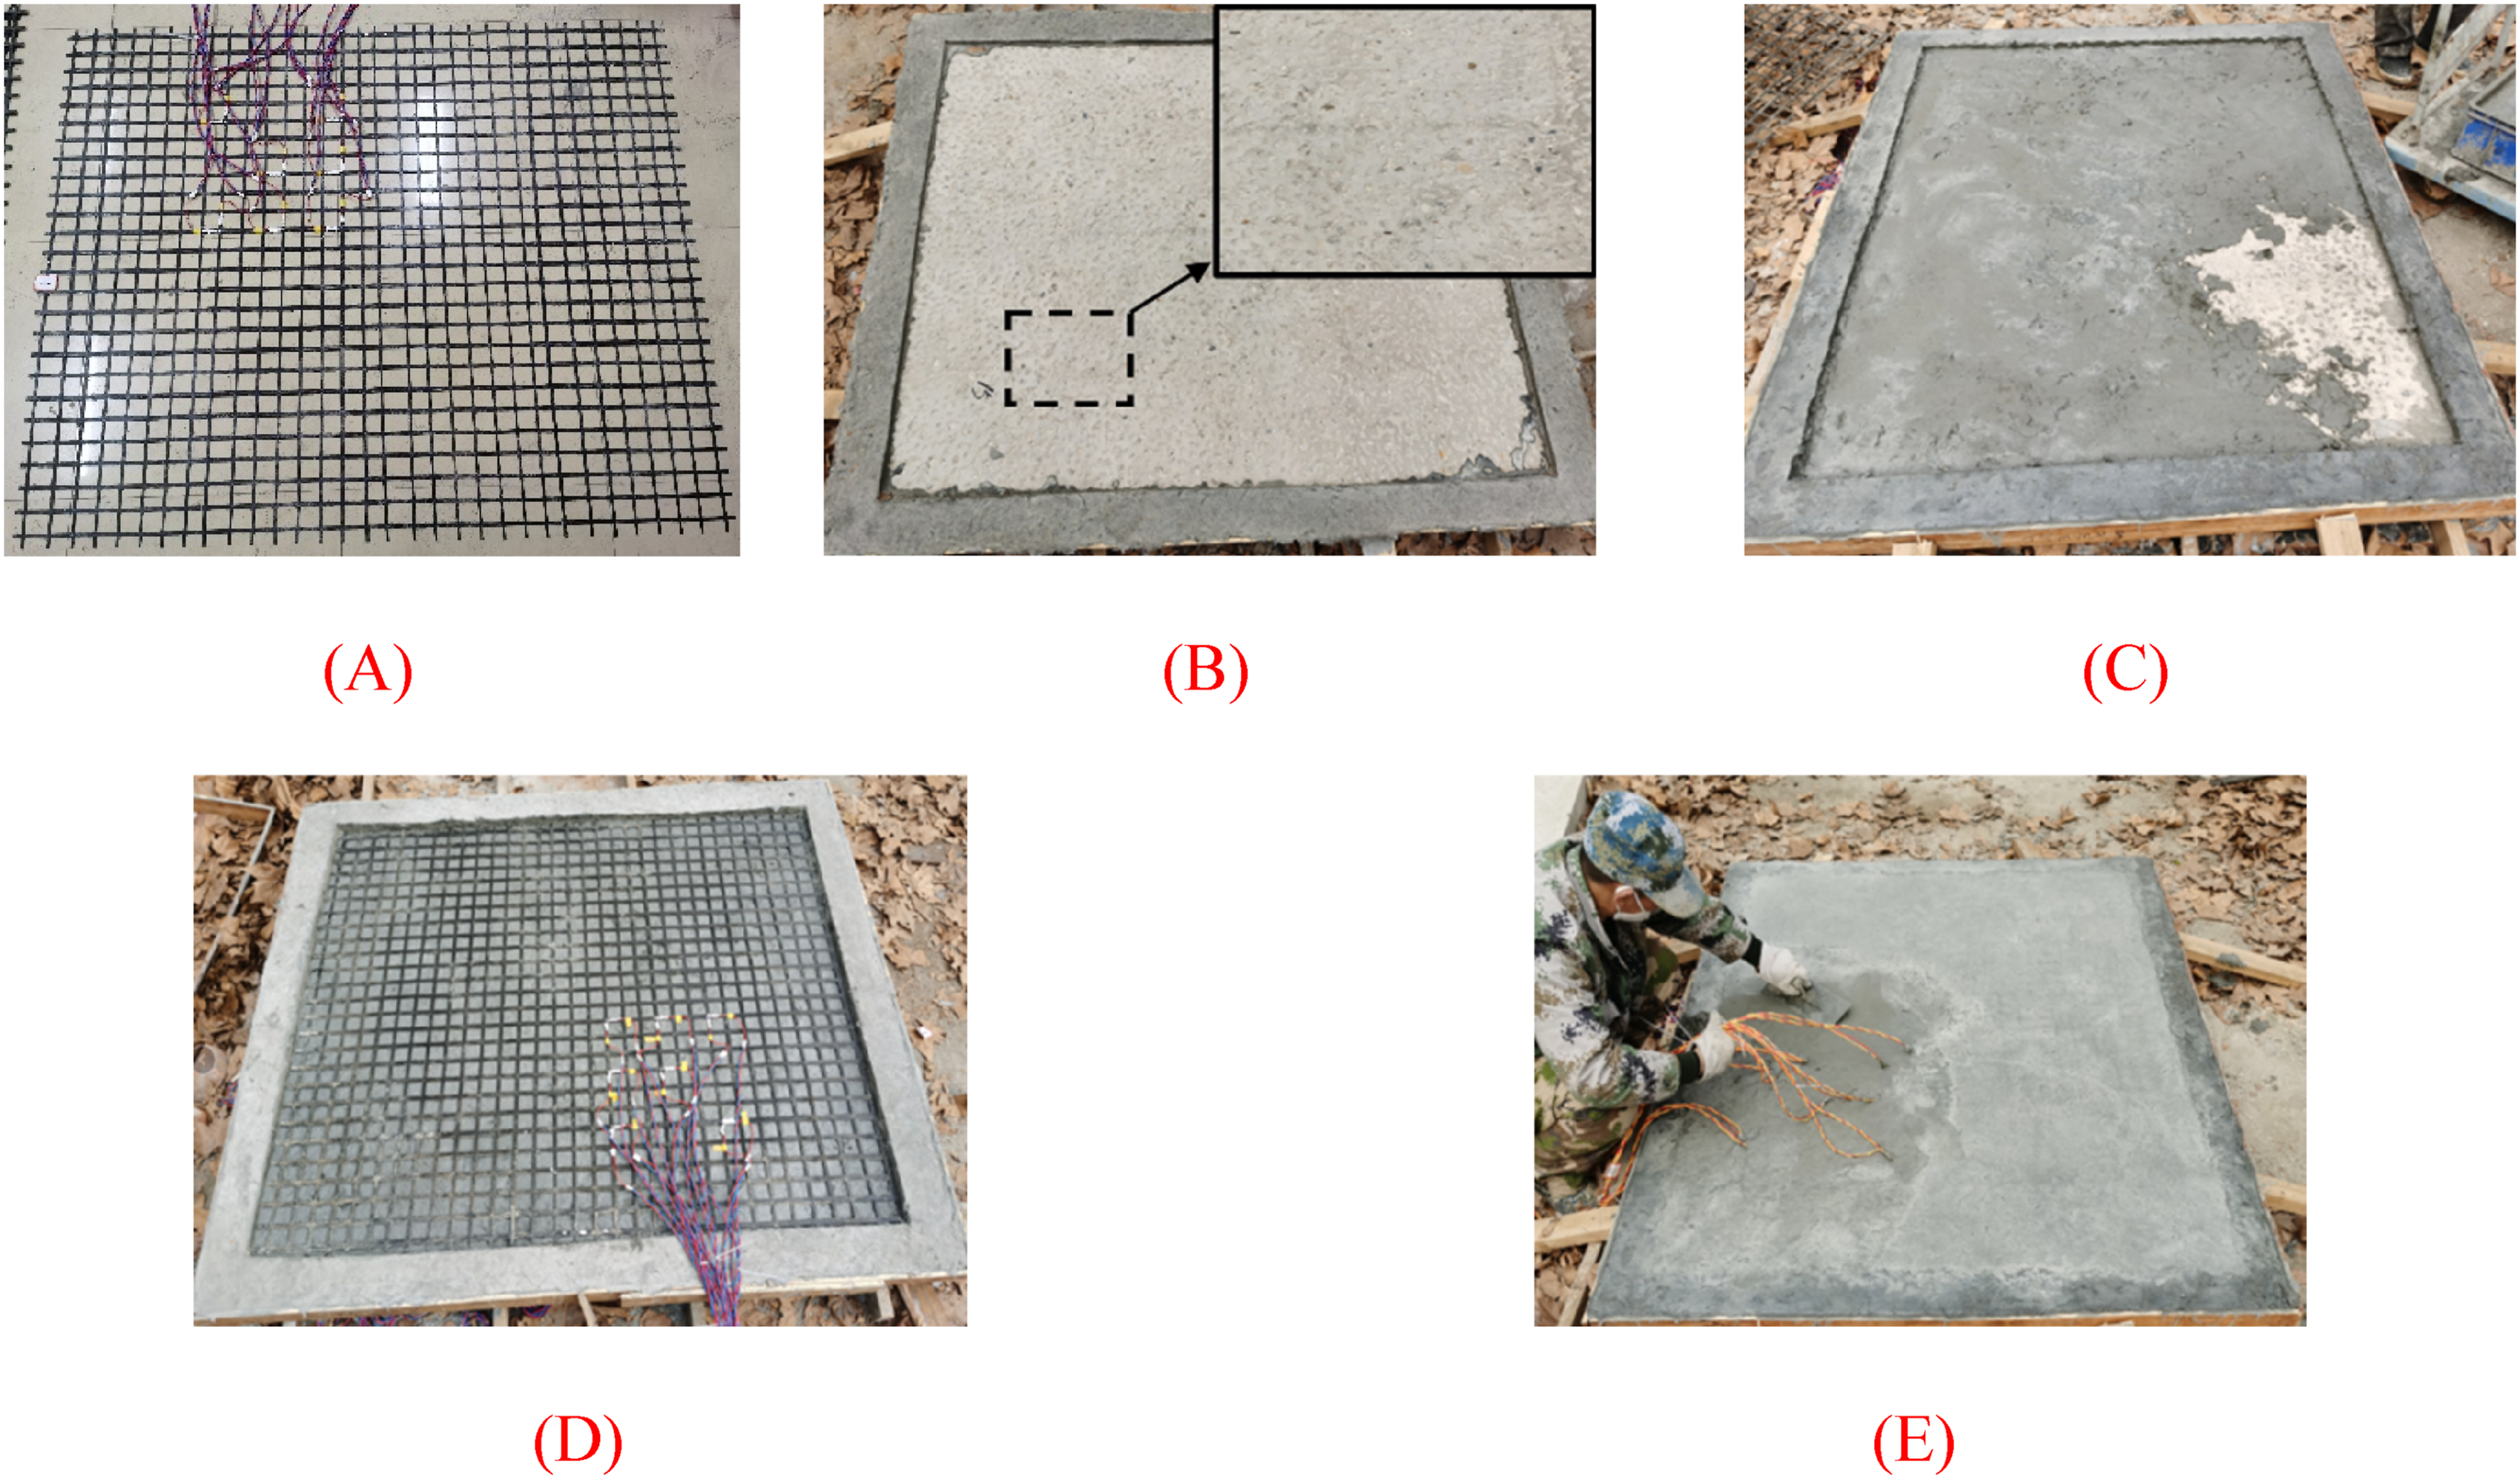
The strengthened slabs are fabricated from the original RC slabs with the cover to support, as illustrated in the Figure 2. (1) Preparation of BFRP mesh: First, cut the BFRP mesh to the predetermined dimensions. Clean the surface at the strain gauge locations, and bond 3 mm strain gauges using adhesive. Then, apply silicone sealant for protection. (2) ECC-concrete interface treatment: Uniformly roughen the RC slab bottom surface to a maximum depth of 2 mm using an angle grinder. Carefully grind the surface to avoid creating initial defects, then thoroughly clean the prepared surface. (3) ECC casting: Cast the ECC in two equal-thickness lifts. After placing the first lift, position the BFRP grid at the mid-height of the composite layer. Cover the ECC surface with a waterproof film after pouring, remove the formwork after 48 hr of curing. Maintain moist curing conditions with regular watering for the full 28-day curing period. Fabrication procedure of strengthened slabs: (A) Preparation of BFRP mesh, (B) ECC-concrete interface treatment, (C) ECC casting, (D) Placing the BFRP grid, (E) Curing the ECC.
Single-point flexural test program
The instrumentation for the flexural tests is depicted in Figure 3(A). Each test slab underwent loading via a single-point load on a rigid 200 mm × 200 mm × 20 mm loading plate. The slabs were simply supported on all four sides, with supports located on an I-shaped ring beam. Moreover, the I-shaped ring beam was reinforced by four concrete piers. Flexural test diagram: (A) Loading instrumentations, (B) Locations of SGs on BFRP gird, (C) Locations of SGs on steel reinforcement.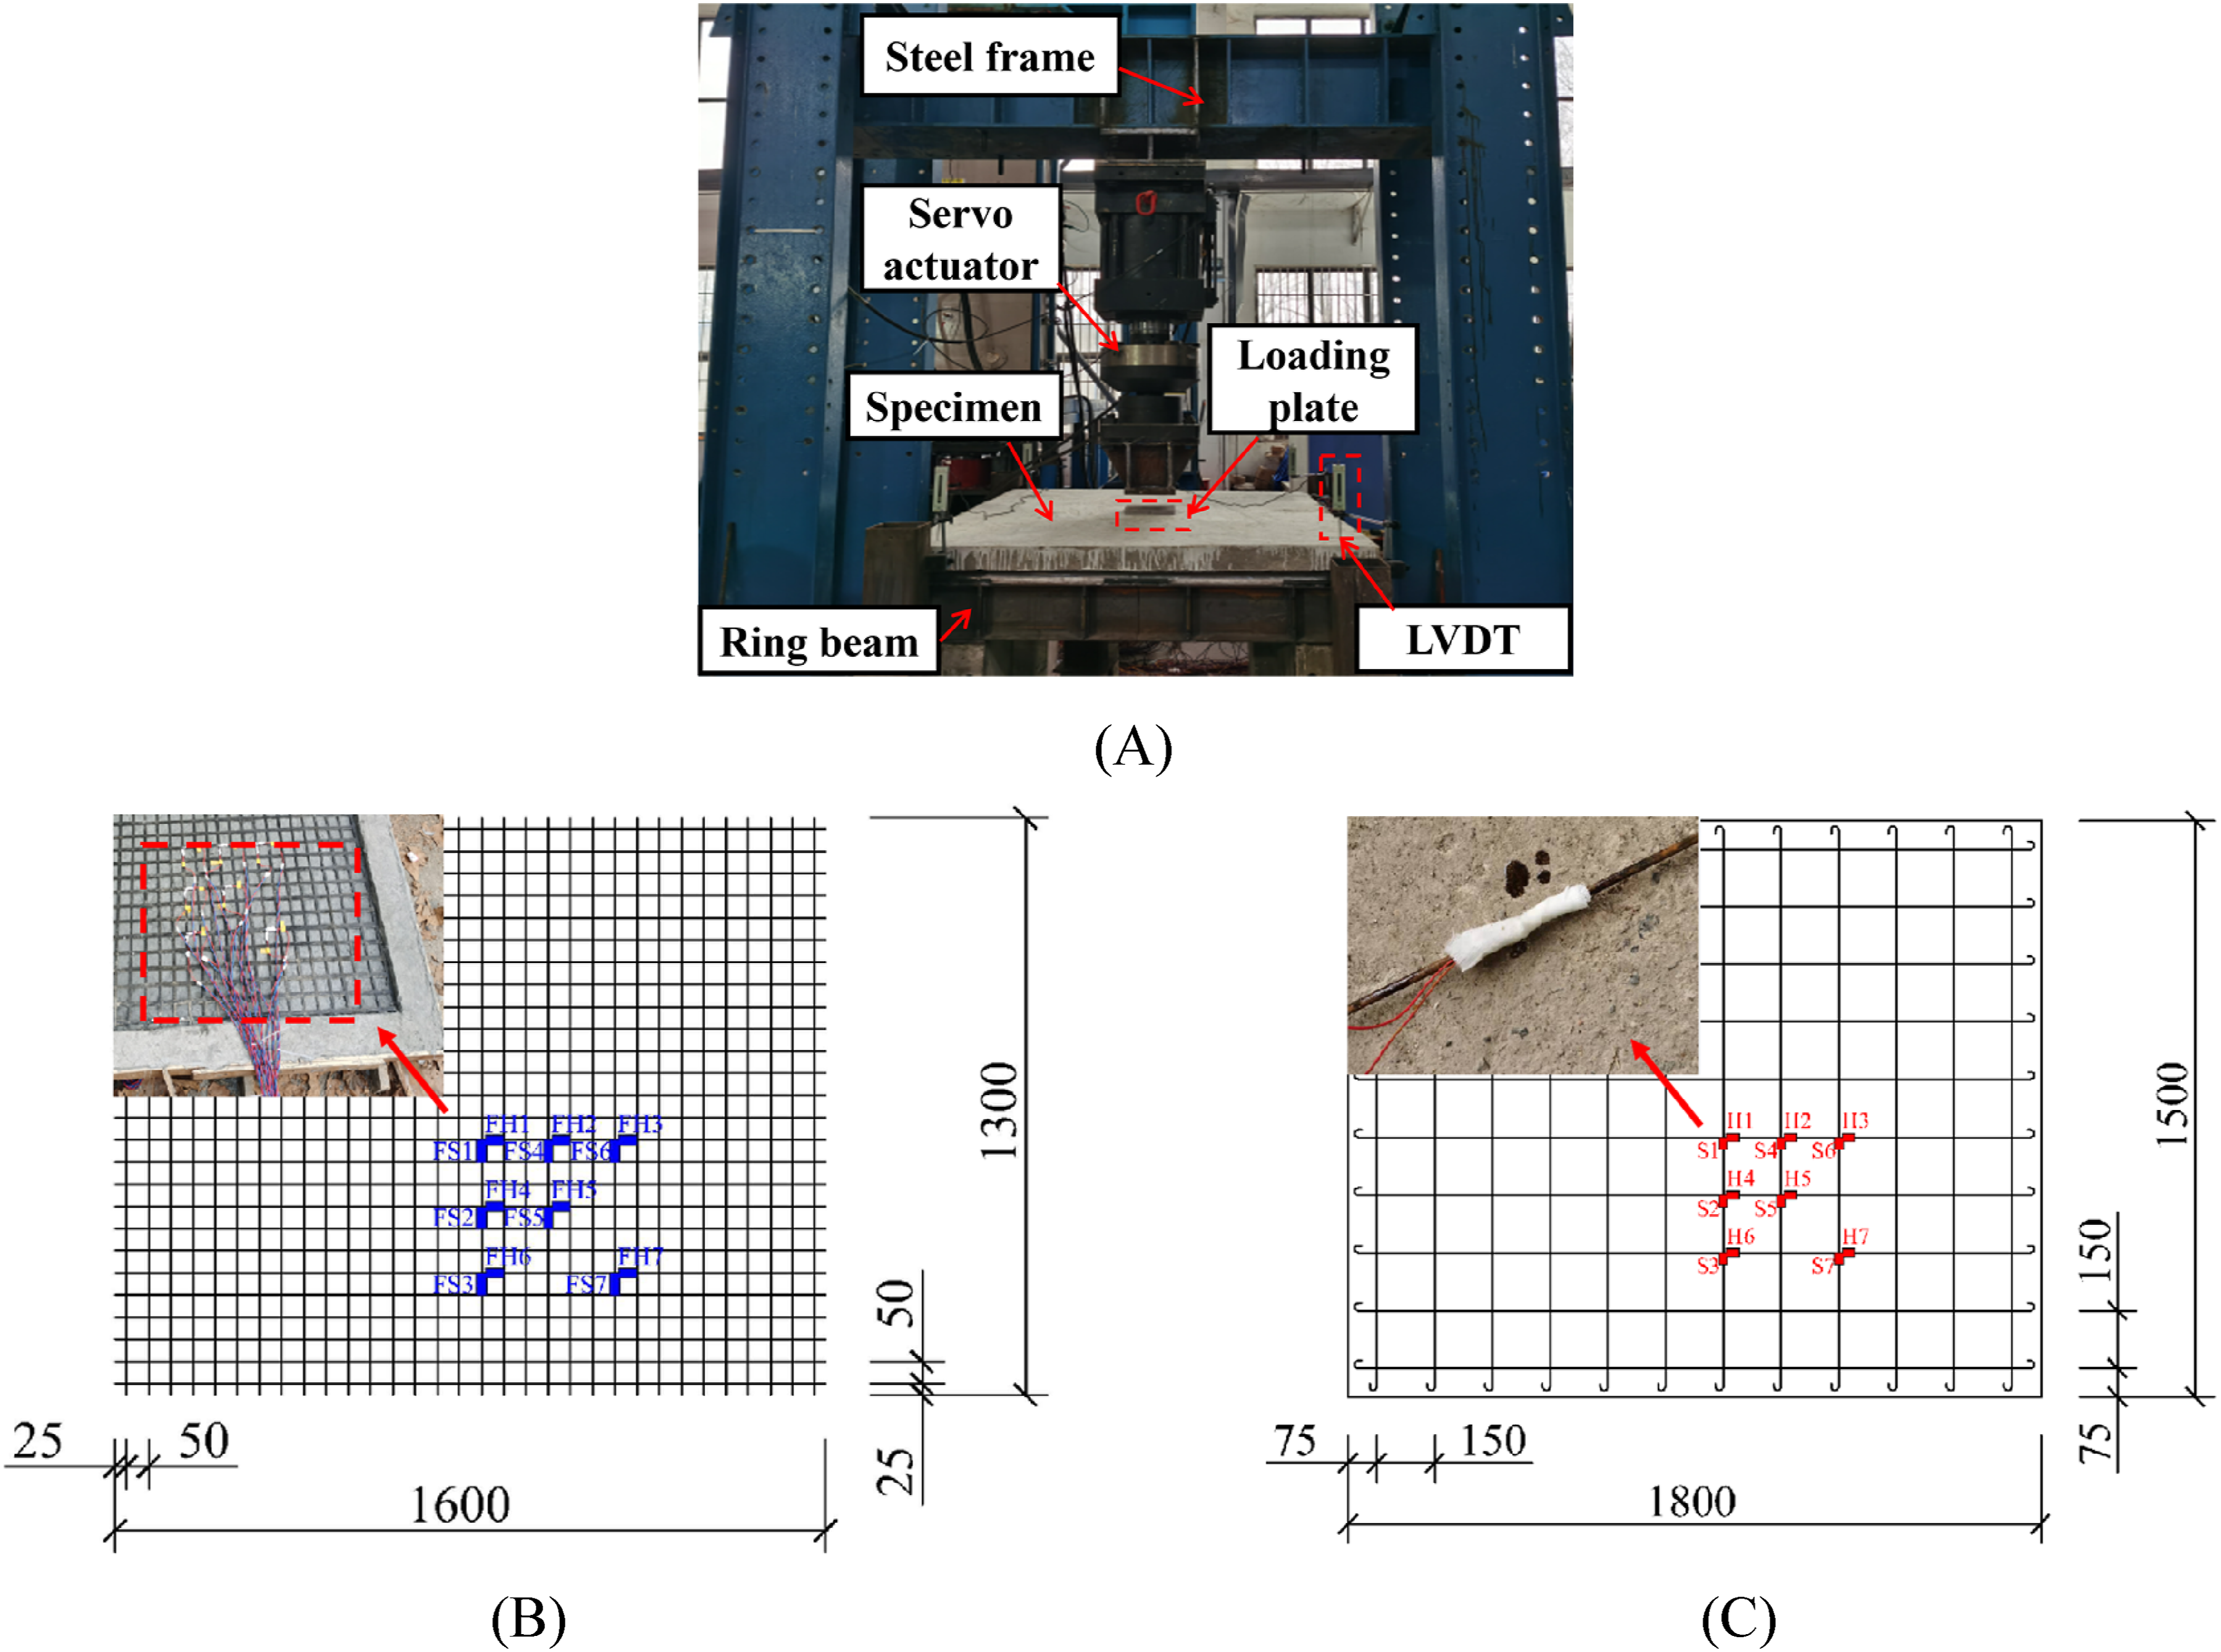
The tests were conducted under displacement control at a loading speed of 0.2 mm/min. The loading protocol involved grading the displacement: every 0.2 mm was designated before cracking at the tensile surface, every 2 mm until yielding, and then every 1 mm until failure. Loading duration was set at 5 min per grade before cracking, and 10 min per grade post-cracking. Measurements included crack width at the bottom, load applied, corner and mid-span deflections, and strain in the steel reinforcement and BFRP grid. Numbers of electrical resistance strain gauges (SGs) were used to measure strain in both the steel reinforcement and the BFRP grid. These gauges were strategically positioned along the longitudinal, transverse, and diagonal symmetry axes. The strain measurement points on the BFRP grid aligned with the reinforcement locations, which were placed in areas of high stress and potential yield lines. The specific positions and identification numbers of the strain gauges are demonstrated in Figure 3(B) and (C).
According to the Chinese code (GB 50152-2012, 2012), the nominal limit state for the test slab were defined as follows: (1) Failure due to main steel reinforcement snapping in tension or exceeding a strain of 0.01; (2) Concrete crushing on the compressive surface of the slab; (3) Mid-span deflection surpassing 1/50 of the span (28 mm in this test); (4) Maximum crack width exceeding 1.5 mm; (5) Abrupt failure of the BFRP grid; (6) Debonding failure of the composite layer.
Material properties and models
Plastic parameters for CDP model.
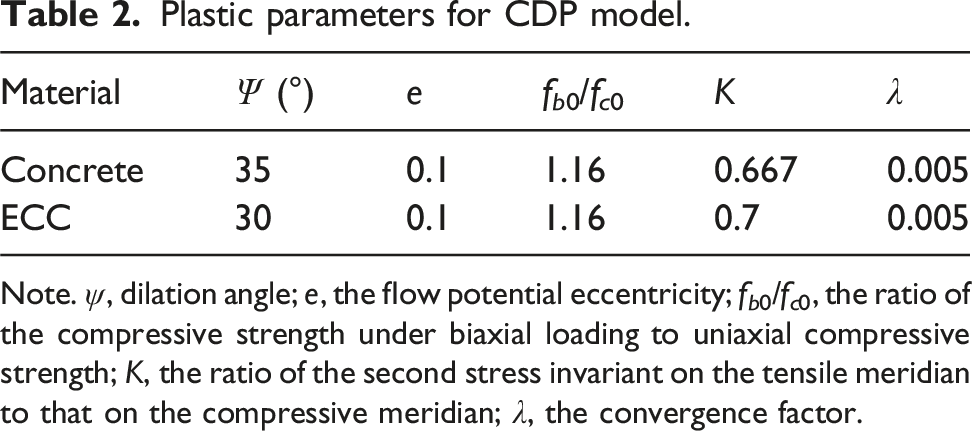
Note. ψ, dilation angle; e, the flow potential eccentricity; fb0/fc0, the ratio of the compressive strength under biaxial loading to uniaxial compressive strength; K, the ratio of the second stress invariant on the tensile meridian to that on the compressive meridian; λ, the convergence factor.


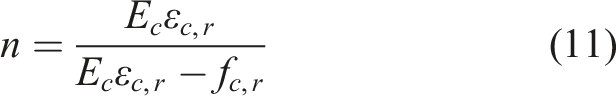
The compressive model of concrete was listed as follows:


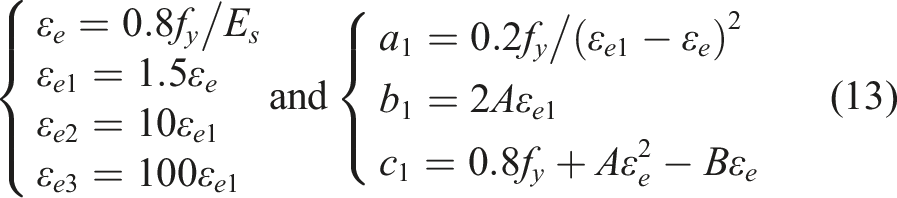
The steel reinforcement comprised HPB300 plain round bar with a 6 mm diameter, exhibiting an average yield strength of 353 MPa and an ultimate strength of 514 MPa. To simulate the stress-strain response of reinforcing bars under tension and compression, the five-stage model proposed by Han (Liu and Han, 2006) was employed. The elastic modulus and the Poisson’s ratio of the steel reinforcement were defined as 206 GPa and 0.3, respectively. The yield strength and ultimate strength sourced from material tests were respectively 353 MPa and 514 MPa.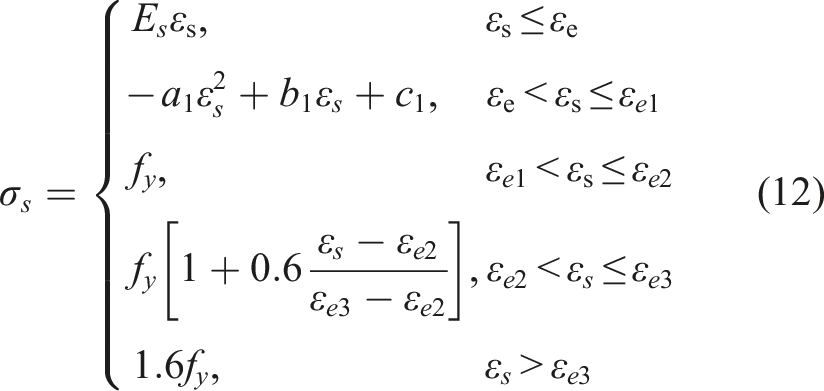

BFRP grid properties.

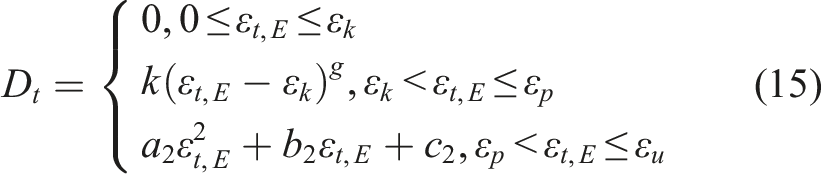
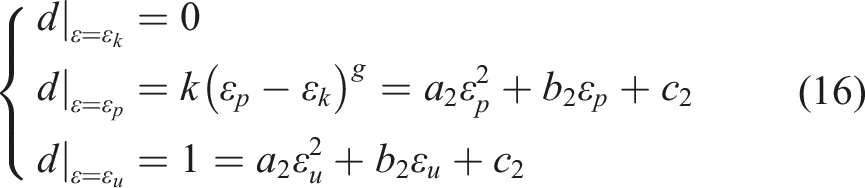
The following compressive model of ECC was adopted according to the study by Huang (2021):


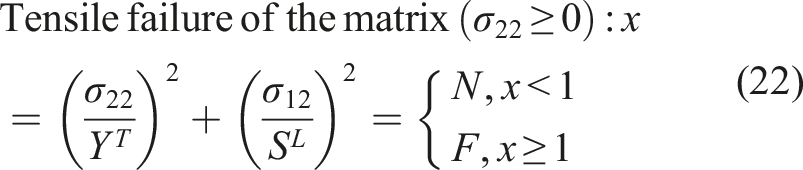
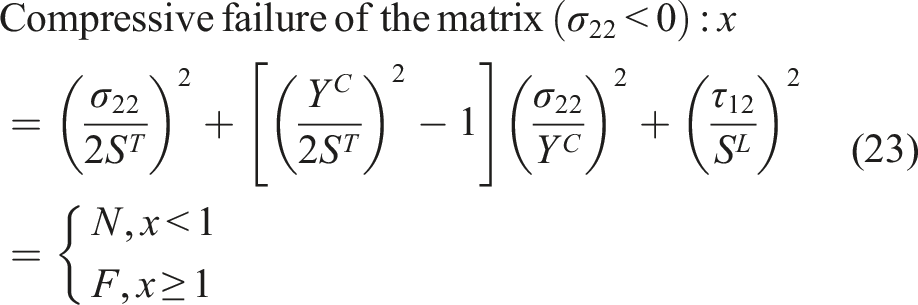
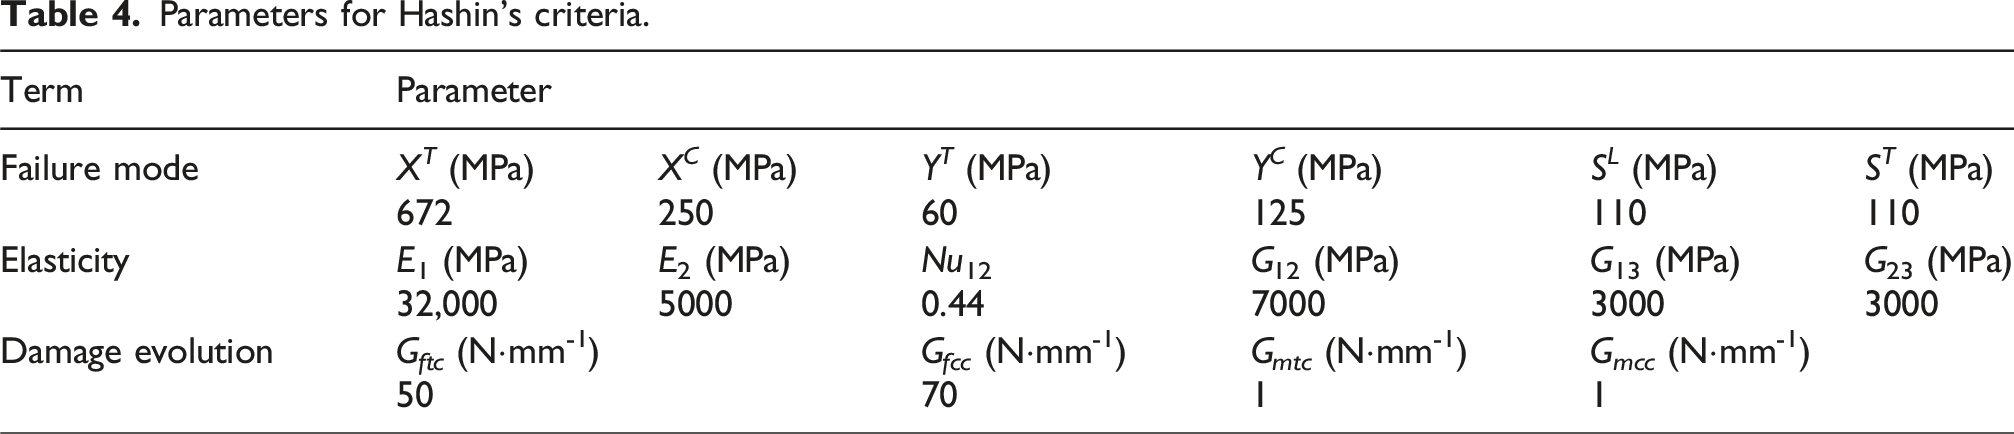
The BFRP grid, sourced from Jiangsu Green Materials Valley New Material T&D Co., Ltd., China, was spaced 50 mm center-to-center to reinforce the ECC. Nine unidirectional specimens measuring 25 mm × 200 mm were fabricated for axial tensile testing. The properties of the BFRP grid are detailed in Table 3. The Hashin’s criteria was employed to detect the initial damage of the BFRP fabric (Hashin, 1980). The criteria encompasses four damage initiation mechanisms: tensile failure of the fiber, compressive failure of the fiber, tensile failure of the matrix, and compressive failure of the matrix, detailed in equations (20) to (23). In which, 
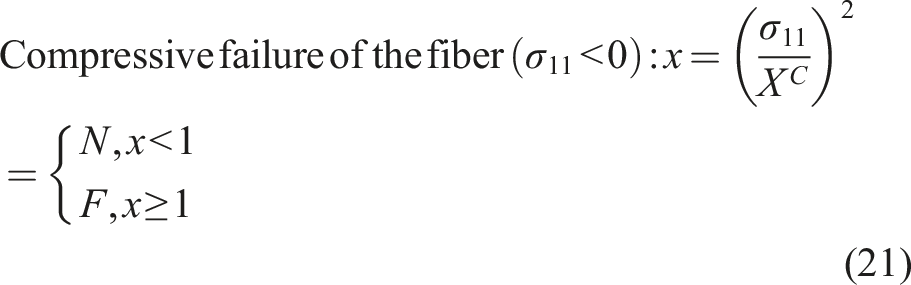
The damage of FRP is defined as the deterioration of the material stiffness until failure. This degradation process necessitates linear elastic behavior before damage occurs, characterized by six parameters: Young’s modulus in the tensile direction of the fabric E1, Young’s modulus in the transverse direction of the fabric E2, in-plane Poisson’s ratio Nu12, in-plane shear modulus G12, and out-of-plane shear modulus G13 and G23.
Parameters for Hashin’s criteria.
Mesh and interaction
To ensure the accuracy and computational efficiency in FE analysis, a convergence study was performed, indicating that a mesh size of 25 mm offered suitable resolution for each material component. The selection of element type should align with the material properties and loading conditions of the components.
In the modelling process depicted in Figure 4, concrete, loading plate, and ECC defined as homogeneous solid were simulated using 8-node reduced integration 3D hexahedral solid elements (C3D8R). The steel reinforcement experiences various internal forces such as axial forces, shear forces, and bending moments, necessitating the use of the B31 element type, a 2-node linear beam element capable of accommodating shear deformations. Considering the thinness of the BFRP grid in the thickness direction, leading to negligible stresses in this orientation, a 4-node doubly curved shell element (S4R) was selected to model a single BFRP strip effectively. The connection between the loading plate and slab was established using a tie constraint. The steel reinforcement and BFRP grid were integrated into the matrix material employing embedded region functions. Finite element model of strengthened slab.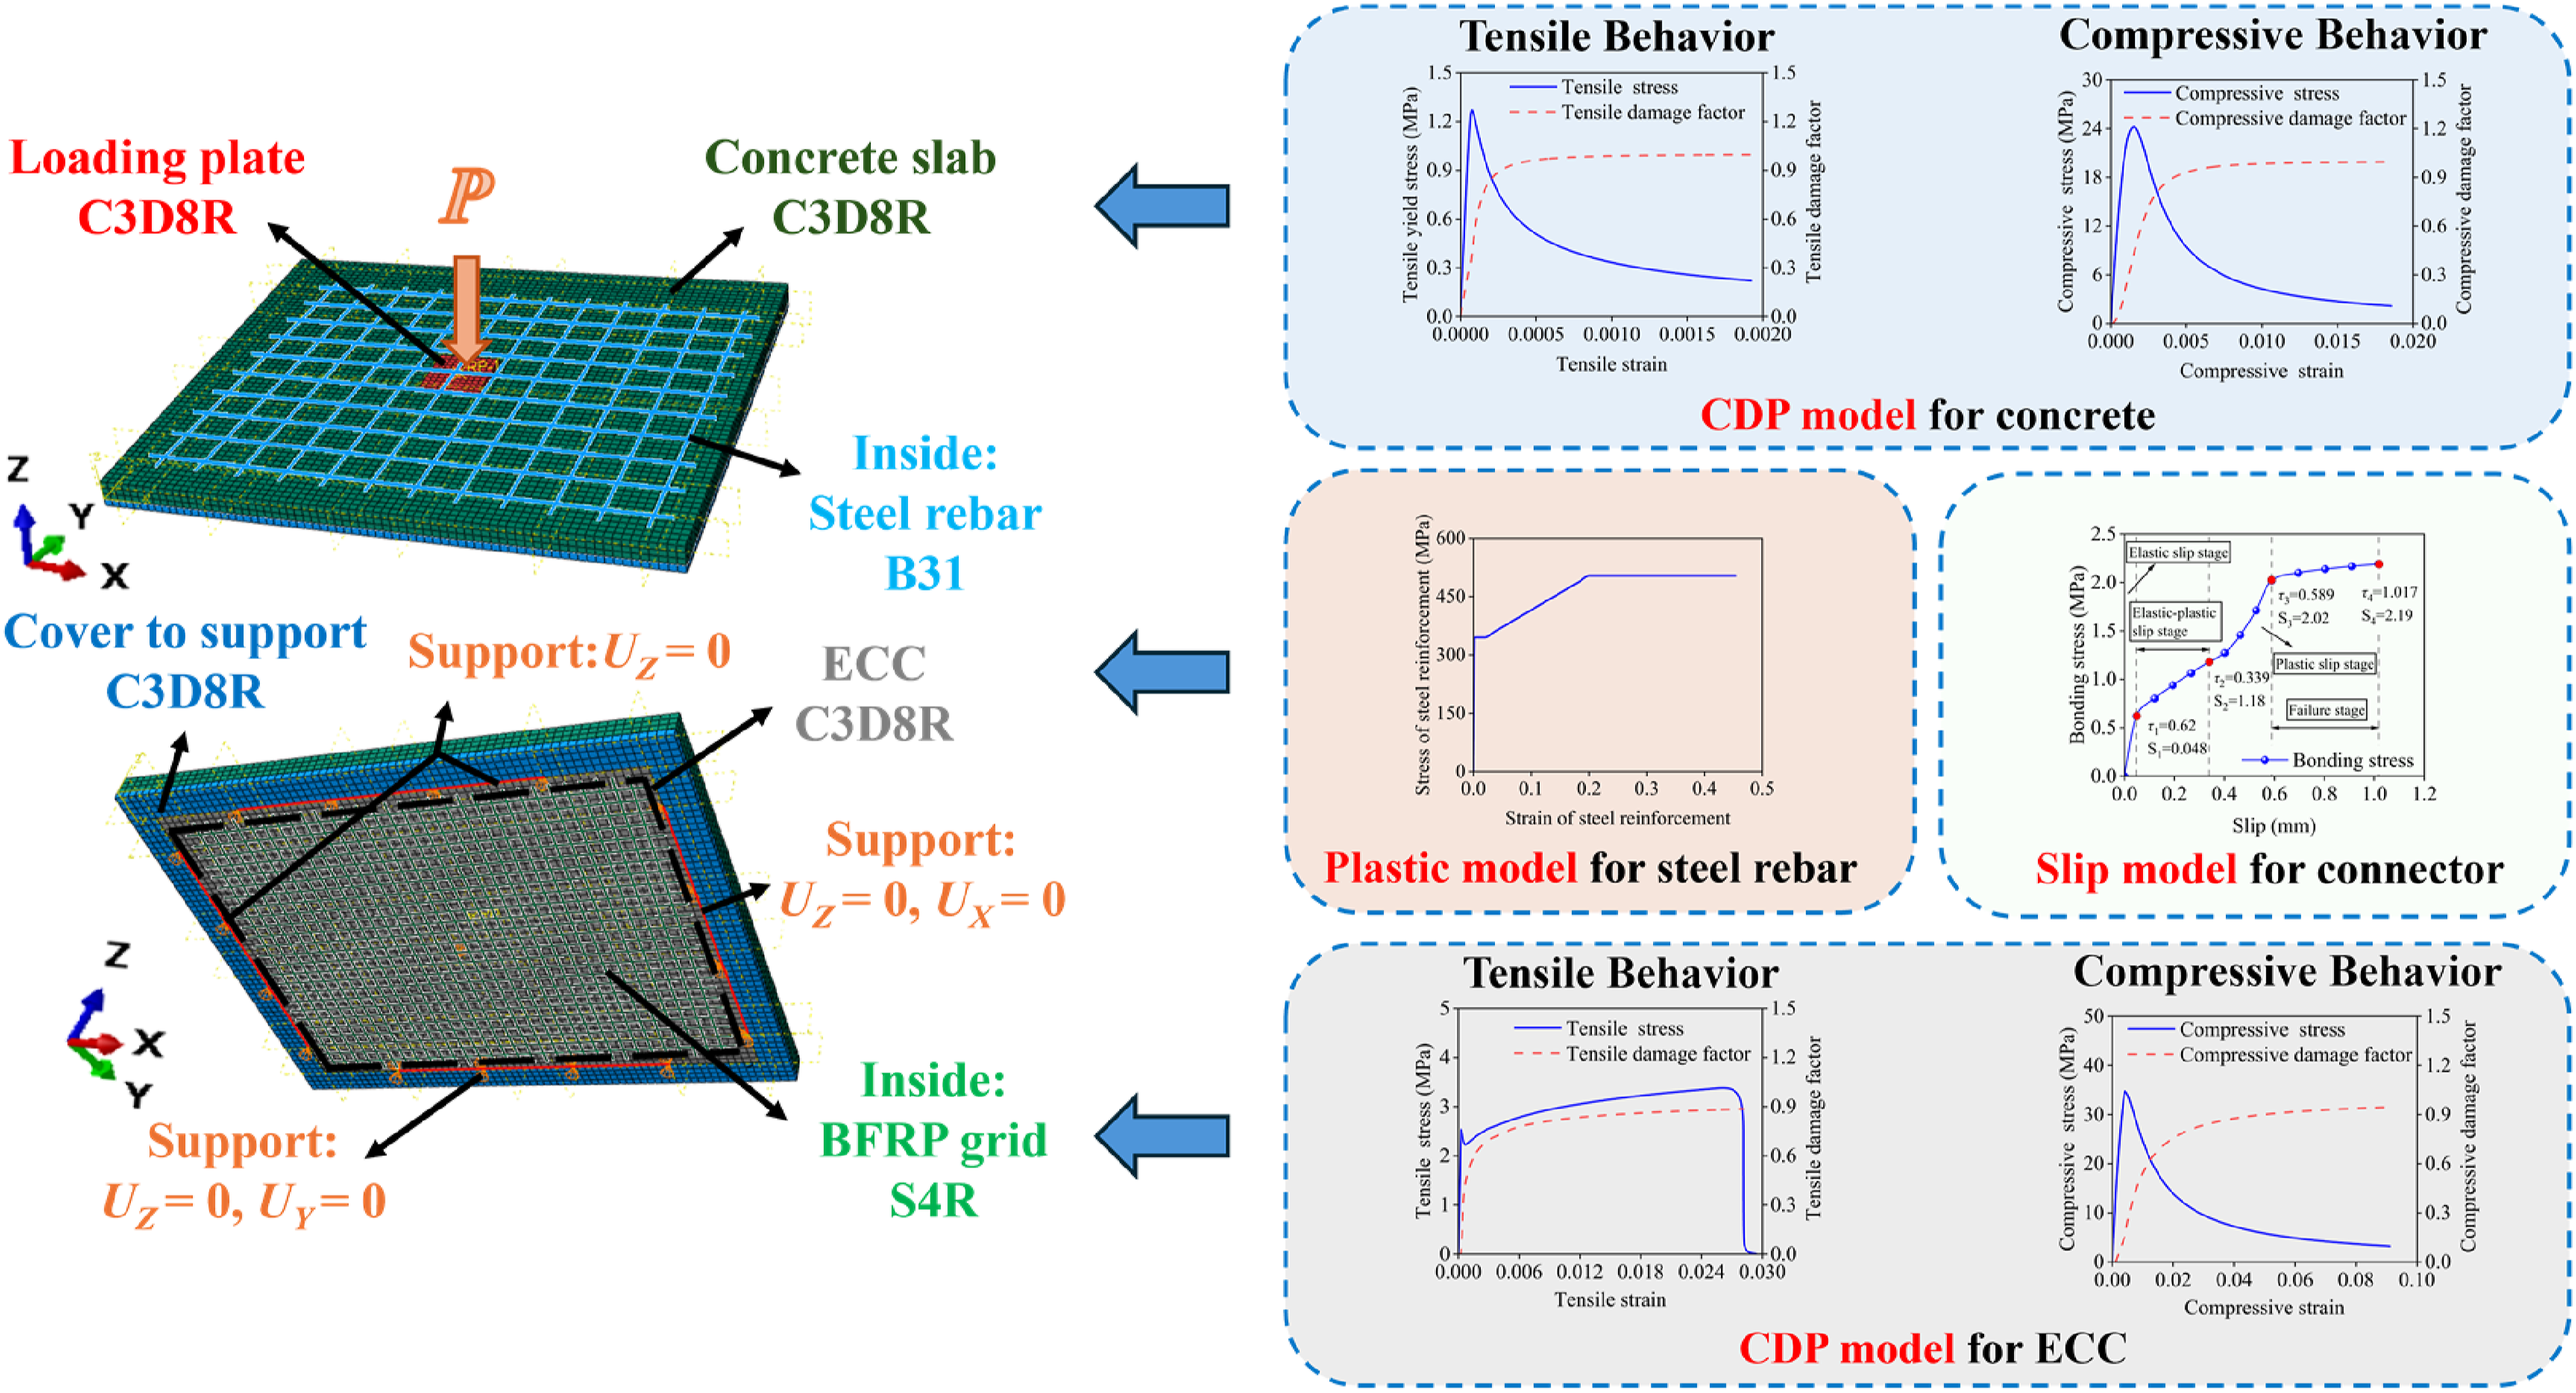
To model the bond-slip behavior at the ECC-concrete interface, thousands of nonlinear connector elements were utilized. The grid nodes on the upper surface of the ECC and the concrete substrate corresponded to each other, allowing for efficient establishment of connector elements between the nodes of the two materials. The ECC-concrete interface comprised 3445 pairs of connector elements, with the element type selected as Bushing. Since the ring concrete cover could effectively constrain the displacement of the ECC layer in both the x and y directions, the bond stress of the ECC was considered only along the z direction. It is assumed that the bond stress is uniformly distributed within region of the interface, and the total interface bond stress can be considered as the integral of the bond stress at each node element. It can be indicated that the distributed bonding force for each connector element was calculated as the ratio of the total bonding force to the number of elements. The total interface bond stress was facilitated by the adoption of four-stage bond-slip model proposed by Wang (2018).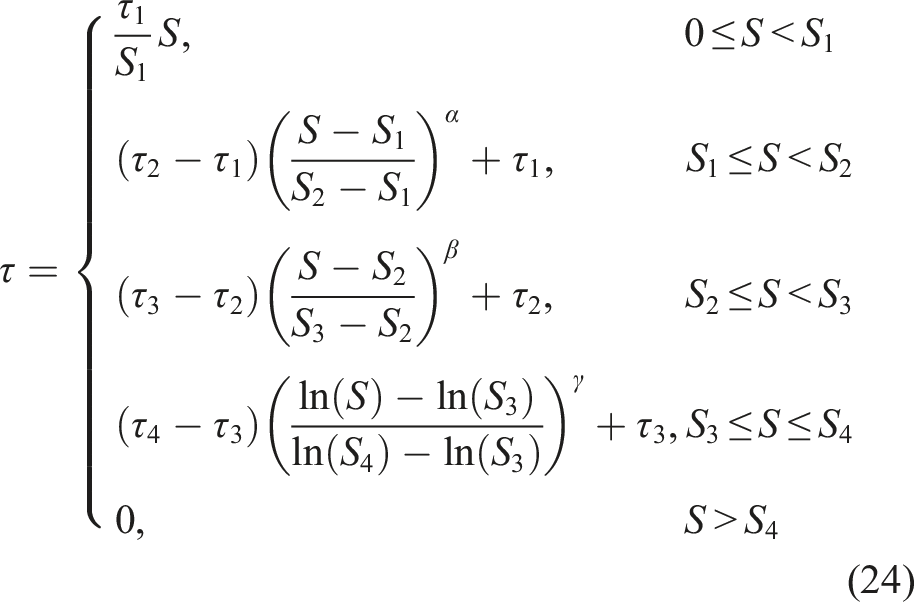
Results and discussion
Failure modes and cracking pattern
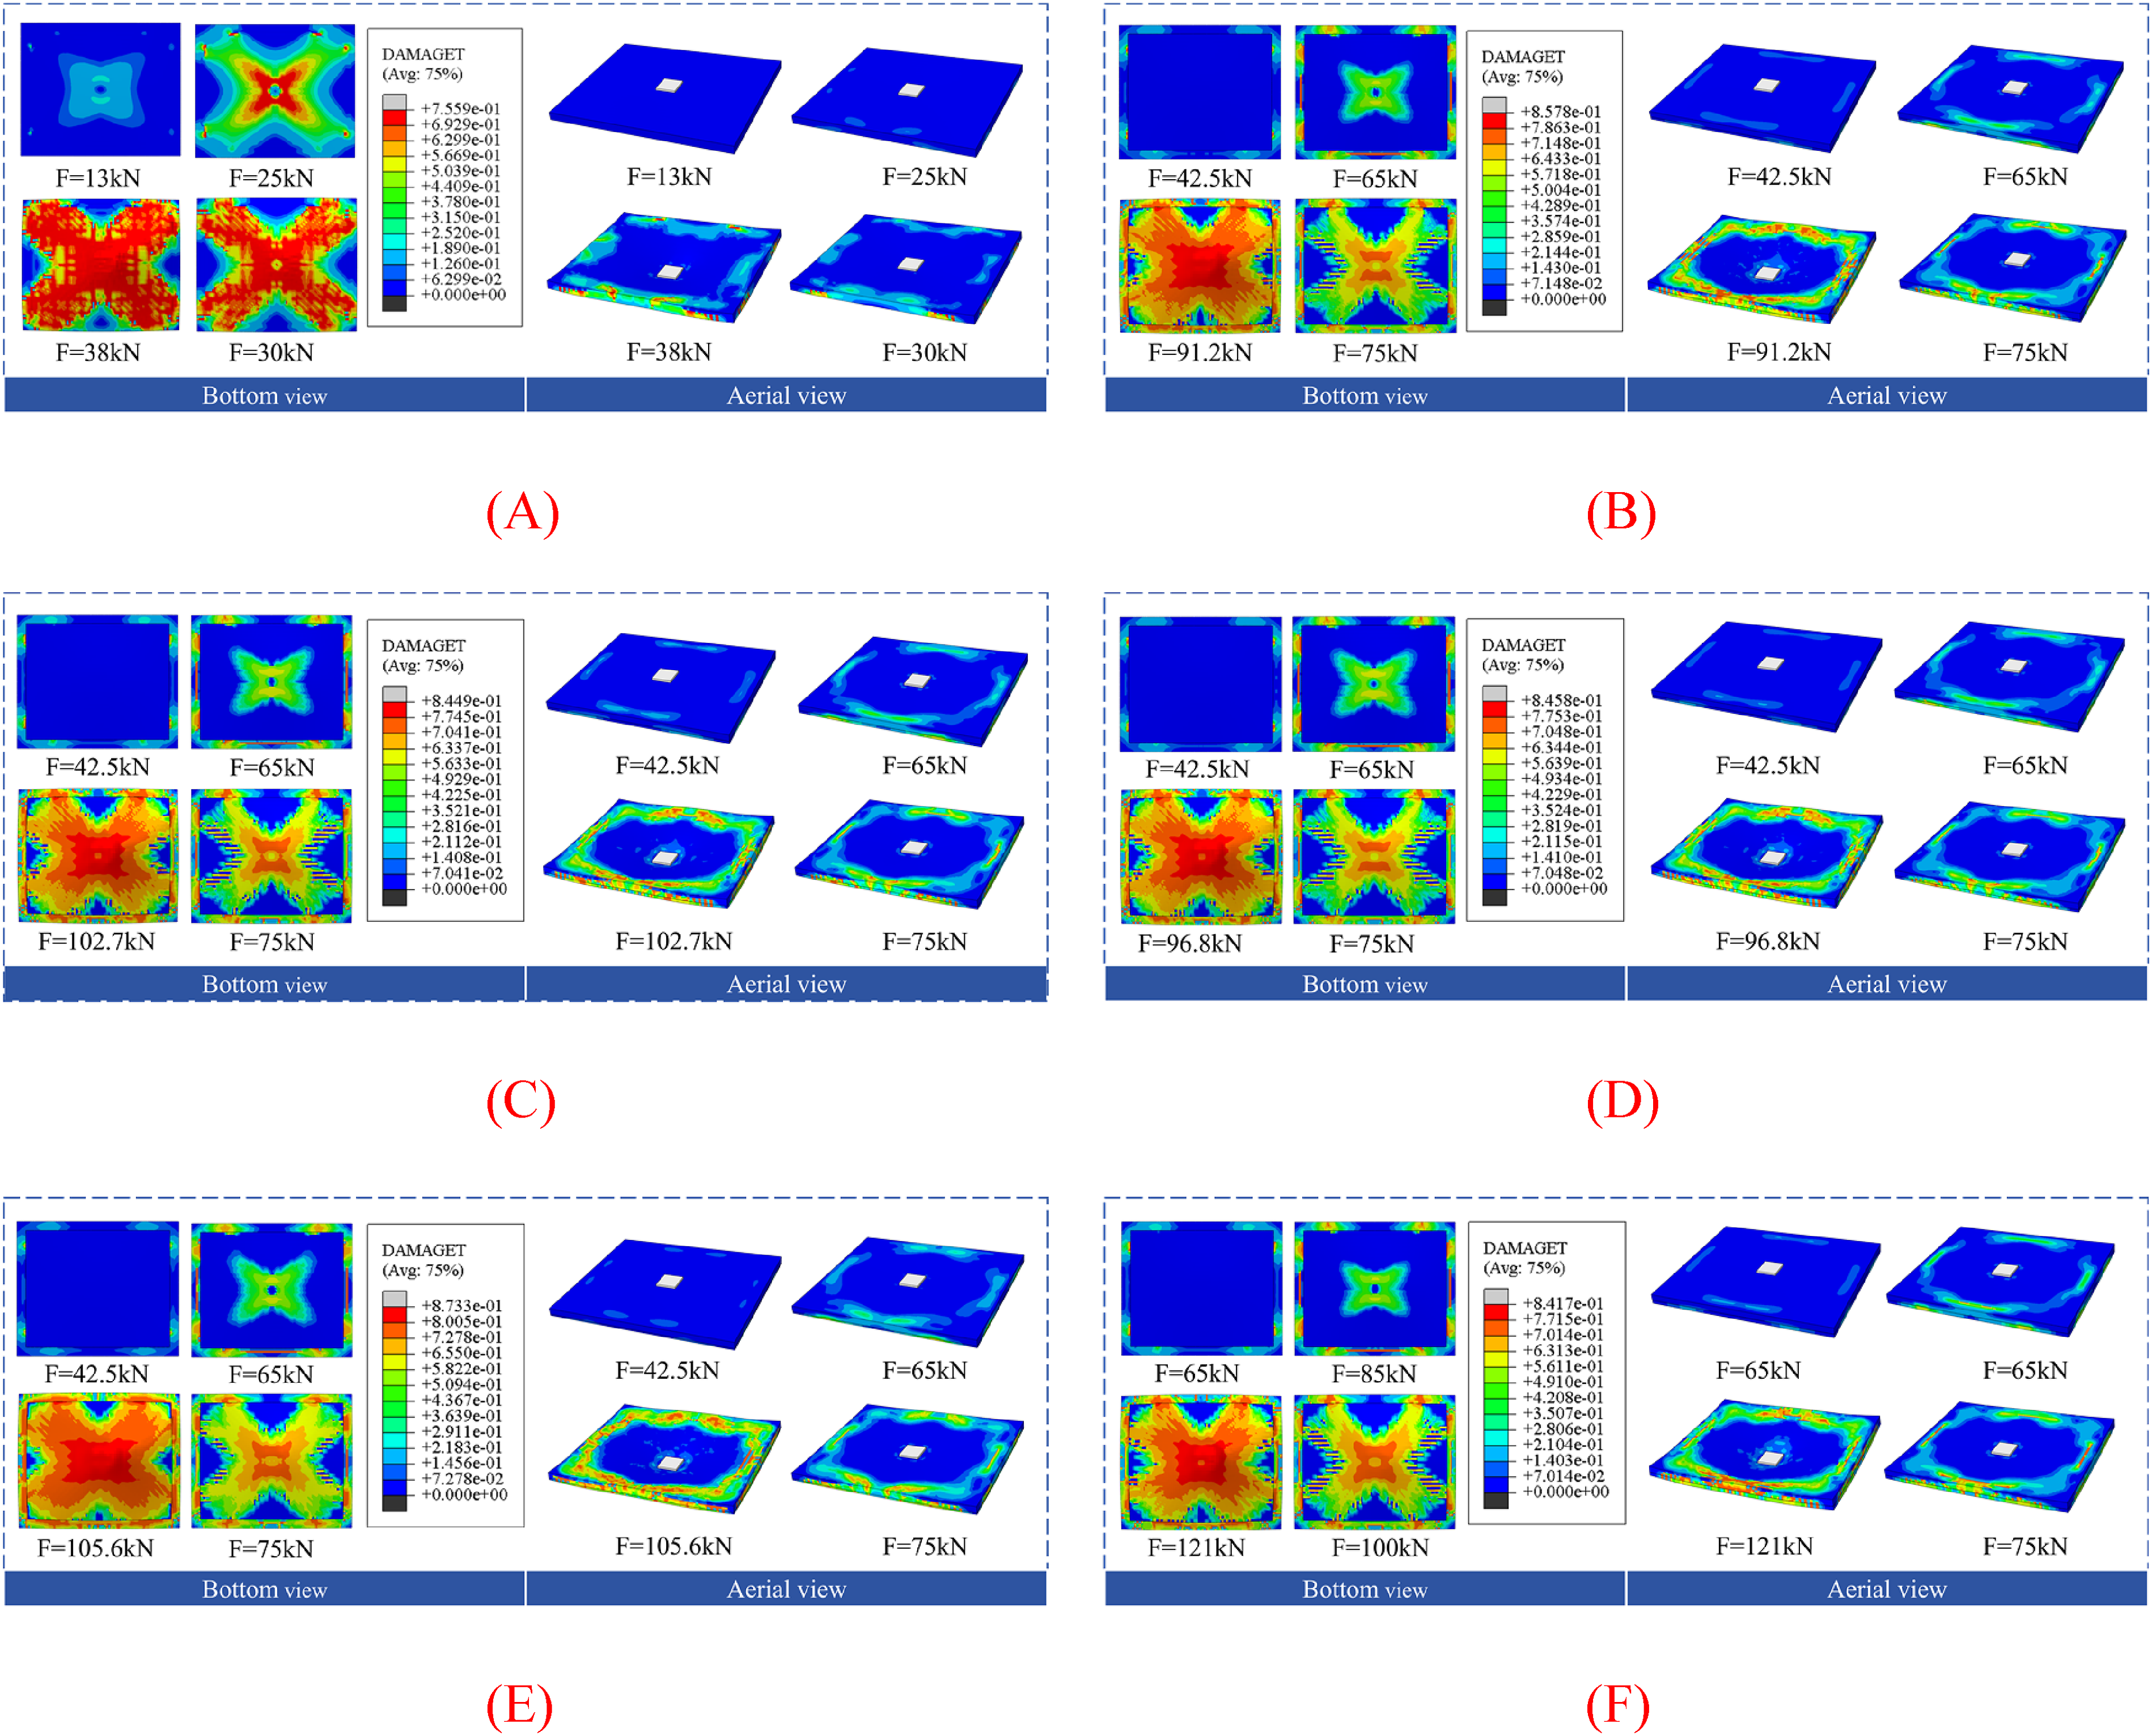
The investigation of tensile damage within the FE model aimed to track the progression of tensile cracks and the failure point is defined as the displacement value corresponding to the experimental results. Based on experimental and FE results, all six two-way slabs exhibited bending failure due to tensile material cracking (crack width >1.5 mm). In reference slab, extensive areas of reinforcement yielded, and cracks in the tensile zone concrete exceeded the prescribed limit. In strengthened slabs, substantial areas of reinforcement yielded in the loading region, the BFRP grid remained intact, and crack width in the tensile zone ECC surpassed the specified limit. Although the BFRP grid-ECC reinforcement layer did not alter the failure mode, it enhanced crack development in the tensile zone. In the case of the unreinforced slab T-0-0, flexural cracks originated in the proximity to the loading area. As deflection increased, damage extended towards the corners, leading to the gradual formation of X-shaped cracks. Upon reaching failure, the damage was notably severe and uniformly distributed, aligning with experimental findings where continuous cracks extended from the loading area to the corners, as depicted in Figures 5(A) and 6(A). For the strengthened slabs depicted in Figures 5(B)–(F) and 6(B)–(F), initial damage initially manifested at the bottom of the concrete cover. Subsequently, damage in the ECC layer near the loading area was observed. At failure, the reinforced slabs exhibited various levels of damage, resulting in discontinuous short X-shaped cracks, consistent with the experimental observations. Cracking patterns and failure modes from test specimens: (A) T-0-0, (B) T-F1-E25, (C) T-F2-E25, (D) T-F3-E25, (E) T-F3-E15, (F) T-F3-E35. Cracking patterns and failure modes from FE models: (A) T-0-0, (B) T-F1-E25, (C) T-F2-E25, (D) T-F3-E25, (E) T-F3-E15, (F) T-F3-E35.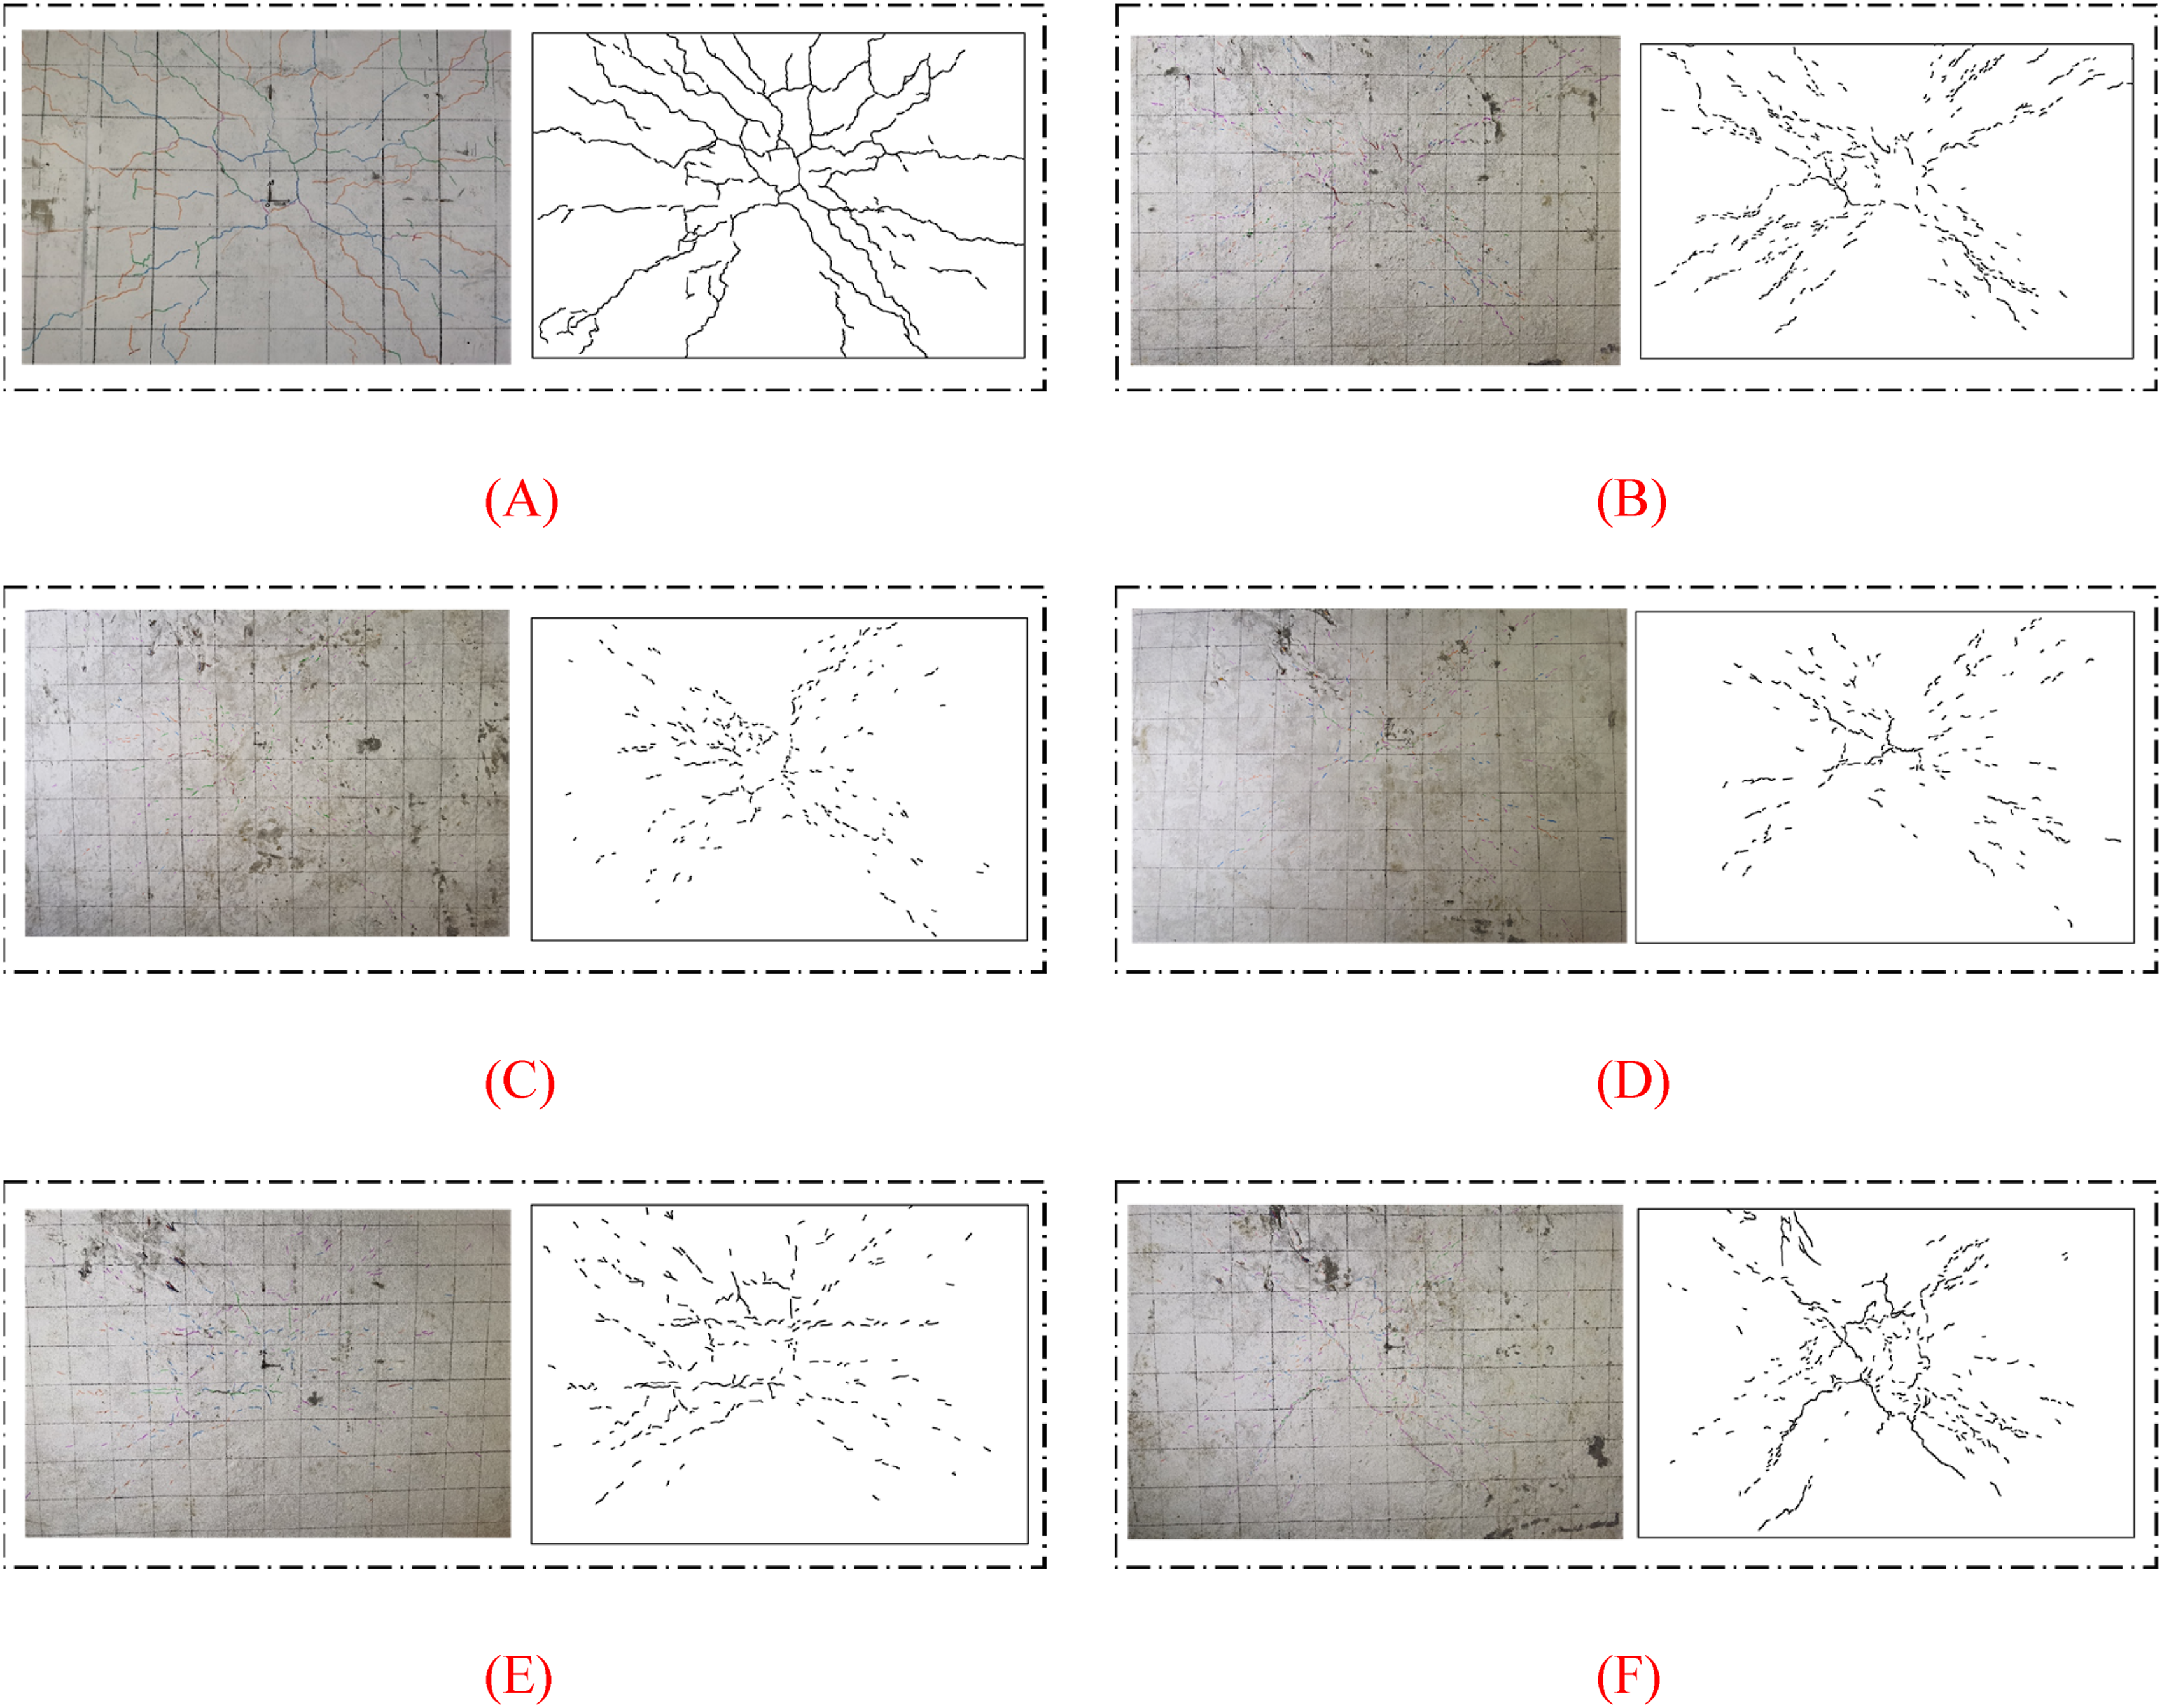
Load-deflection responses
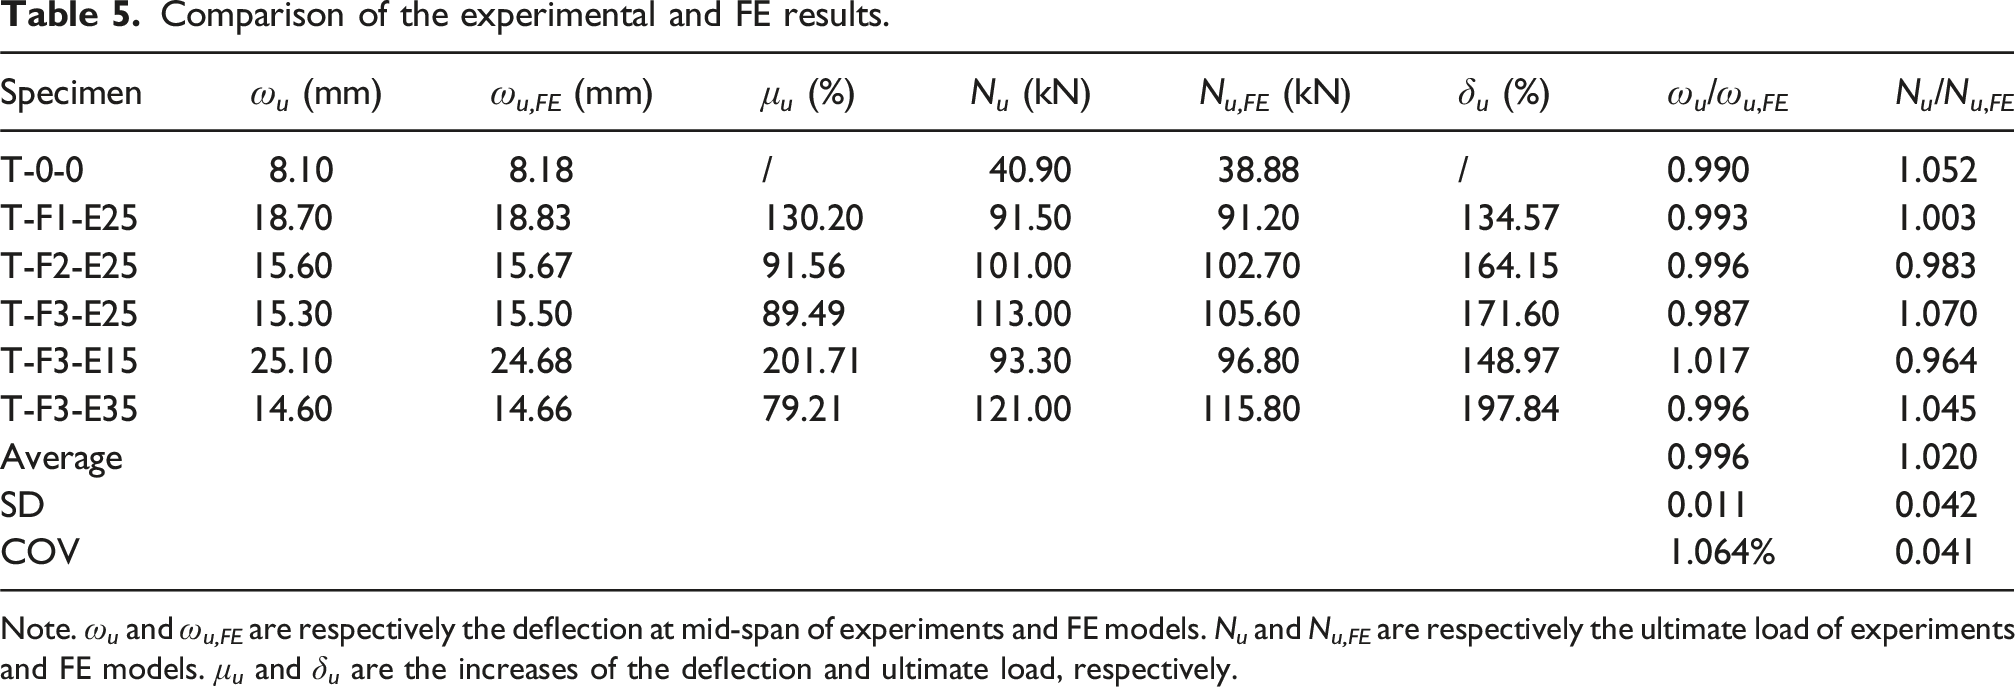
According to Figure 7(A)–(F), the load-displacement curves obtained from the FE models closely align with experimental results in terms of trends and ultimate loads. Discrepancies observed in the elastic phase (particularly in specimen T-F3-E35) may be attributed to diverse initial defects in test specimens, leading to greater mid-span deflection of experimental specimens compared to the FE model under identical loading condition. As damage progressed, the stiffness of the FE specimens deteriorated further. The experimental load-displacement curve values exhibited strong consistency with the FE values during the hardening stage. Moreover, at failure, ultimate load values from both experimental and numerical results closely matched. The mean and coefficient of variation (COV) of N
u
/Nu,FE are 1.020 and 0.041, respectively, as indicated in Table 5. Based on this verification, it can be inferred that the FE models can effectively predict the flexural performance of the tested slabs. The comparison of load-displacement curves between FE and experimental results. (A) T-0-0, (B) T-F1-E25, (C) T-F2-E25, (D) T-F3-E25, (E) T-F3-E15, (F) T-F3-E35. Comparison of the experimental and FE results. Note. ω
u
and ω
u,FE
are respectively the deflection at mid-span of experiments and FE models. N
u
and N
u,FE
are respectively the ultimate load of experiments and FE models. μ
u
and δ
u
are the increases of the deflection and ultimate load, respectively.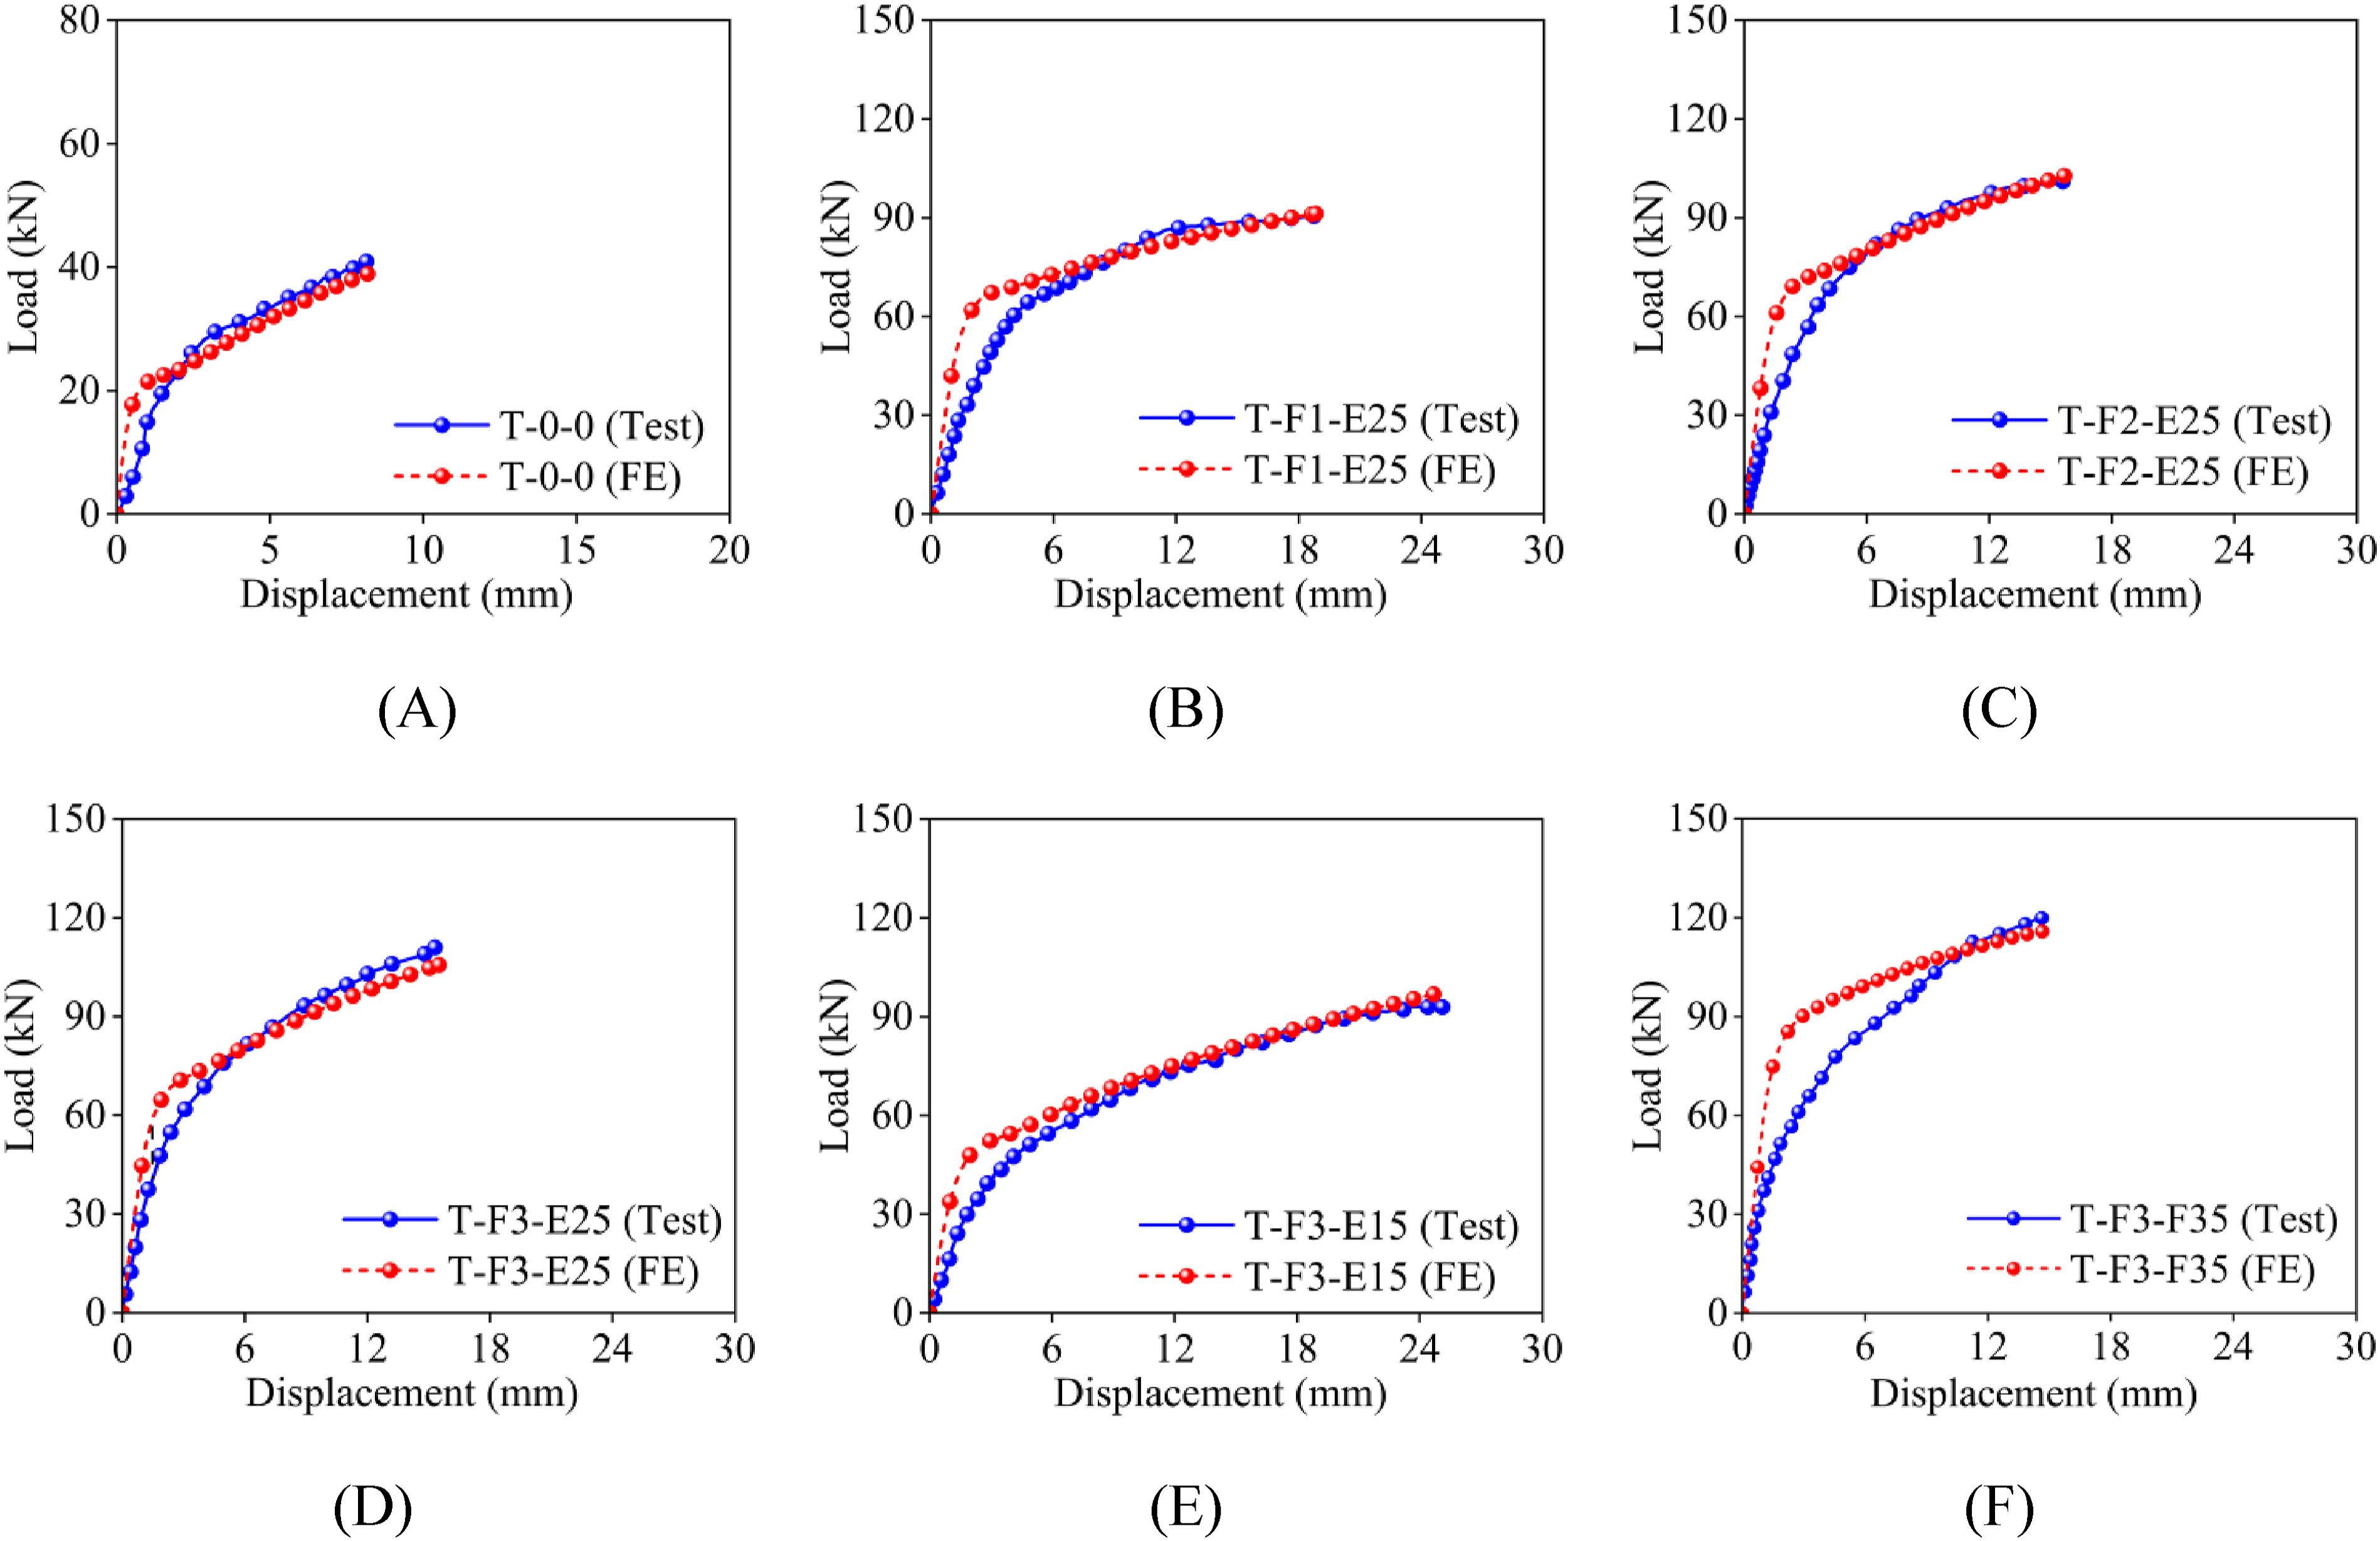
Load-strain responses of steel reinforcement and BFRP grid
In Figure 8(A)–(F), a comparison of load-strain curves for steel reinforcement and BFRP grid at midspan and diagonal positions between the experimental and FE models is depicted. Strain results for SGs S1 and FS1 were selected to validate the model’s prediction of steel reinforcement and BFRP strains at mid-span, while S7 and FS7 data were used to assess strain variation along the diagonal. It becomes apparent that for the strengthened slab, the maximum strain of the steel reinforcement experienced a great enhancement. This enhancement can likely be attributed to the increased overall deformation capacity resulting from the composite layer. The correspondence between the load-strain curves of steel reinforcement and BFRP grid obtained from the experimental tests and the FE results suggests that the FE model developed in this study adeptly captures the material strain behaviors of both the control slab and the strengthened slab. The comparison of load-strain curves. (A) T-0-0, (B) T-F1-E25, (C) T-F2-E25, (D) T-F3-E25, (E) T-F3-E15, (F) T-F3-E35.
The strain distribution patterns reveal distinct behaviors between steel reinforcement and BFRP grid, as depicted in Figure 9. The steel reinforcement exhibits concentrated strain within the loading area, forming a roughly rectangular distribution. Notably, the two central transverse bars demonstrate dual high-strain zones (red regions), indicating their greater strain contribution compared to longitudinal reinforcement. The BFRP grid displays diagonal strain propagation originating from the loading area, with intensity decreasing with distance and forming an X-shaped pattern. Importantly, the transverse BFRP elements show both higher strain magnitudes and broader high-strain zones near the loading area than their longitudinal counterparts, confirming their dominant role in load resistance. These observations demonstrate that: steel reinforcement strains localize primarily within the loaded region, while BFRP strains develop along diagonal paths. In both materials, transverse components exhibit more extensive high-strain distributions than longitudinal elements. Strain distribution of steel web and BFRP grid: (A) T-0-0, (B) T-F1-E25, (C) T-F2-E25, (D) T-F3-E25, (E) T-F3-E15, (F) T-F3-E35.
Mechanism analysis
The validated FE models are utilized to delve deeper into the flexural behaviors of strengthened slabs through an analysis of stress distribution at various stages. In this section, the exemplary FE model T-F1-E25 is explored. Figure 10 illustrates the load/moment-displacement curve featuring five key points—O, A, B, C and D—representing the initiation of loading, concrete cracking over the composite reinforced layer, concrete stress redistribution, steel reinforcement yielding near loading area, ECC cracking, and the failure point of the strengthened slab, respectively. The loading sequence of the strengthened slab is segmented into four stages: elastic (OA), elastic-plastic (AB), plastic (BC) and hardening (CE). Figure 11(A)–(D) display the stress evolution in each section of the slab at the different key points mentioned earlier. The flexural behavior of model T-F1-E25. Stress development of different material at different stage: (A) Max tensile stress of the concrete, (B) Max tensile stress of the ECC, (C) Mises stress of the steel reinforcement, (D) Mises stress of the BFRP grid.
Stage Ⅰ (Points O-A): Elastic stage. In this stage, the load/moment-displacement curve shows stable linear growth with elastic deformation across all components until the concrete cracks emerge around the loading area at point A. Figure 11(A) and (C) indicate stress responses in the concrete and ECC ranging from 1.2 MPa to 1.7 MPa and from 1.6 MPa to 2.3 MPa, respectively. Conversely, steel reinforcement and BFRP grid remain stress-free, suggesting their non-involvement in the elastic stage. As loading processes, concrete cracking expands, rendering a significant portion of the concrete ineffective in bearing loads, gradually shifting the load to the reinforcement. In this stage, concrete and ECC predominantly contribute to the flexural capacity of strengthened slab.
Stage Ⅱ (Points A-B): Elastic-plastic stage. The load-displacement curve slope slightly decreases, indicating a minor stiffness reduction in the reinforced slab, accompanied by X-shaped cracks in the concrete along the diagonal. Severe diagonal cracks appear at the tensile zone of the concrete at point B. Stress redistributes as the load shifts to the reinforcement, with ECC and reinforcement stresses increasing at the mid-span. ECC stress ranges from 1.9 MPa to 2.4 MPa, and reinforcement stress from 88.2 MPa to 117.7 MPa. As displacement rises, the stress redistribution zone in concrete expands. Here, ECC and steel reinforcement bear the primary responsibility for flexural capacity.
Stage Ⅲ (Points B-C): Plastic stage. Yielding of steel reinforcement causes a rapid decrease in the load/moment-displacement curve slope, signifying reduced slab stiffness. At point C, concrete completes stress redistribution, ECC stress at the mid-span rises to approximately 3.8 MPa, and reinforcement stress hits yielding strength (Figure 11(B)). The BFRP grid shows stress from 145.3 MPa to 174.3 MPa, indicating load transfer to the grid.
Stage Ⅳ (Points C-E): Hardening stage. Point D marks failure, and point E marks ECC cracking. The load/moment-displacement curve gradually rises until significant ECC damage occurs. At 10 mm displacement, diagonal cracks form at the ECC base, and substantial reinforcement yielding is evident. BFRP grid stress peaks at 348.7 MPa within the ultimate strength. BFRP grid and steel reinforcement are crucial contributors to flexural performance in the hardening stage. Moreover, as observed in Figure 11(D), the stress in the BFRP grid at the crack locations was substantially higher than at other locations, indicating that the BFRP grid in these areas was not optimally utilized. Consequently, for strengthened slabs subjected to concentrated loads, reinforcing the BFRP grid in a diagonal configuration might enhance its utilization efficiency.
Parametric analysis
Specimen details in parametric study.
Note. SGC, strength grade of the concrete; SGE, strength grade of the ECC; E, ECC thickness; F, BFRP thickness; BD, bonding degree of ECC-concrete interface; CR, corrosion rate of steel reinforcement; UL, ultimate load.
Figure 12(A) depicts the influence of the concrete grade on the load-displacement curves of the strengthened slab, with ultimate loads for the four models at 70.5 kN, 67.6 kN, 69.7 kN, and 70.2 kN. The flexural capacity of the slab shows no significant alterations as the concrete strength grade increases from C25 to C55. Hence, boosting concrete strength grade may not effectively enhance the flexural performance of the reinforced slab. Notably, compared to model F-Z, models F-C-35, F-C-45, and F-C-55 exhibit a yield platform after the elastic-plastic stage, possibly due to the increased concrete grade impacting deformation coordination between concrete and steel reinforcement, necessitating a transition platform for load transferring. Load-displacement curves of the strengthened slabs with different parameters: (A) Concrete strength grade, (B) ECC strength grade, (C) ECC thickness, (D) BFRP grid thickness, (E) Bonding rate, (F) Corrosion rate.
Regarding ECC strength grade, Figure 12(B) displays load-displacement curves for the reinforced slab with varying ECC strength and the correlation between ultimate load and ECC strength. Elevating ECC strength positively impacts the flexural load-bearing capacity. With ECC strength progressing from C30 to C60, the strengthened slab’s flexural capacity increases by 6.7%, 18.4%, and 21.1%, respectively. Enhancing ECC strength grade emerges as a potential means to improve the reinforced slab’s flexural performance, albeit with potential significant material cost escalation.
Figure 12(C) illustrates the load-displacement curves and the trend of flexural capacity variation for reinforced slabs with different CRL thicknesses. Notably, with a well-bonded interface between the CRL and concrete, a substantial enhancement in flexural capacity is evident with increasing CRL thickness. Specifically, as the CRL thickness increases from 15 mm to 55 mm, the ultimate load of strengthened slabs improves by 30.2%, 63.1%, 101.7% and 140.2%, respectively. Thus, augmenting the ECC thickness can effectively boost the flexural performance of the reinforced slab. Nevertheless, ensuring strong bonding at the ECC-concrete interface with increasing CRL thickness will necessitate specific anchoring or surface treatment measures for optimal performance.
The load-displacement curves and flexural capacity trends of strengthened slabs with varying BFRP grid thicknesses are presented in Figure 12(D). Increasing BFRP grid thickness from 1 mm to 5 mm enhances flexural capacity by 4.8%, 9.0%, 12.9% and 16.6%, respectively. While this factor contributes modestly to flexural capacity compared to ECC thickness, it may significantly raise the BFRP grid costs. A linear function effectively models this relationship, indicating that prioritizing BFRP grid thickness may not be the optimal strategy for enhancing slab’s flexural capacity.
Key bonding stress value of FE models.


Parameters of corroded reinforcement.
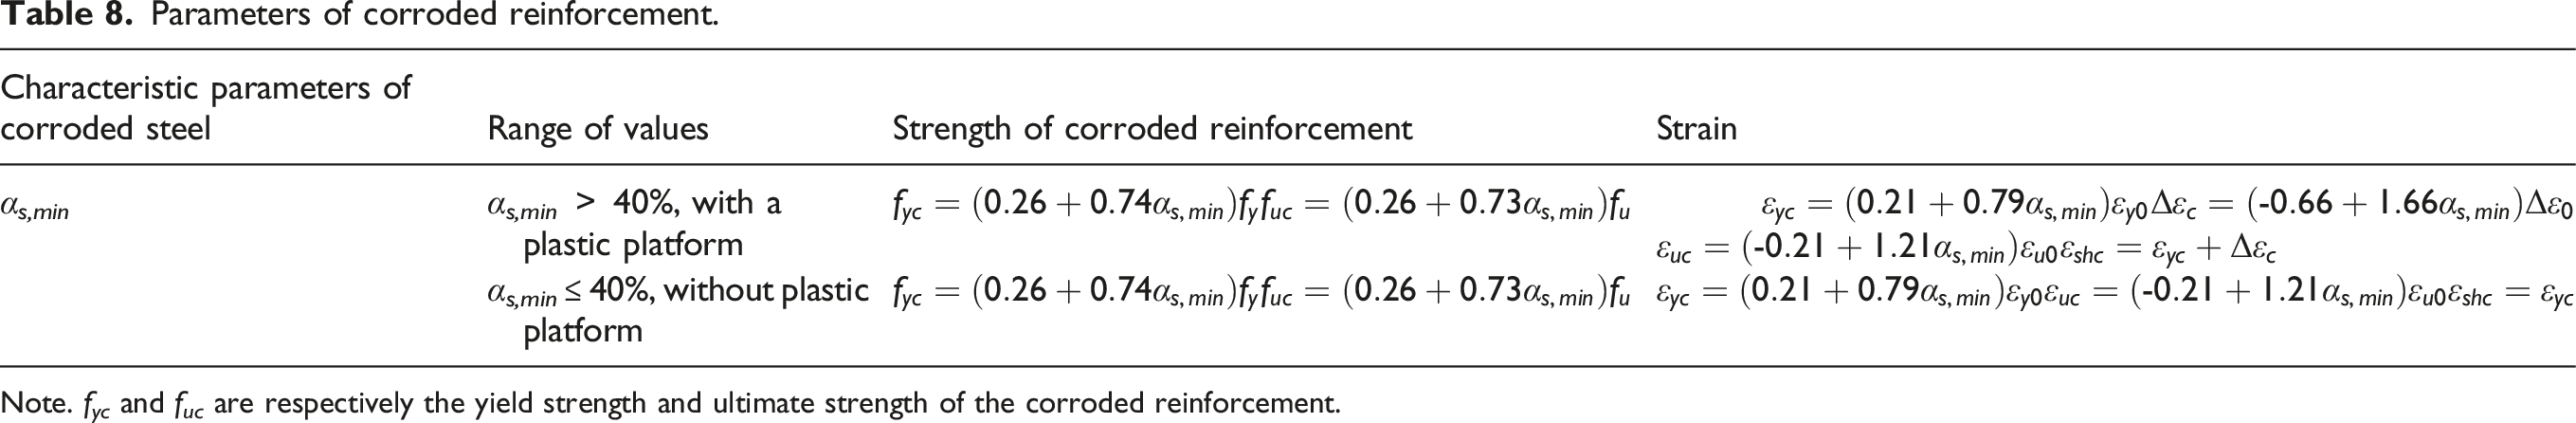
Note. f yc and f uc are respectively the yield strength and ultimate strength of the corroded reinforcement.
Figure 12(F) illustrates the load-displacement curves and the variation of ultimate load for reinforced slabs with different degrees of steel corrosion. It is observed that as the corrosion level of the reinforcement increases from 20% to 80%, the flexural capacity of the slab decreases by 3.2%, 7.0%, 10.6%, and 13.1%, respectively. Therefore, steel corrosion is one of the contributing factors to the reduction in the flexural capacity of the reinforced slab.
Theoretical analysis
Basic assumptions
This section introduces theoretical models for predicting the flexural capacity of RC two-way slabs strengthened with the BFRP grid-ECC composite reinforcement layer. First, a numerical model based on sectional analysis method was established to assess the ultimate moment of the normal section. The following key assumptions guide the analysis: (1) The normal section strain in the BFPR grid-ECC reinforced slab satisfies the plane-section assumption. (2) At the ultimate limit state, the concrete and ECC are not subjected to tensile forces. (3) The slip behavior between the steel reinforcement and concrete, as well as between the BFRP grid and ECC, is disregarded. (4) The compressive model of concrete and the stress-strain response of steel reinforcement in Chinese code (GB 50010-2010, 2010) are selected. In addition, a linear elastic model for the BFRP grid is applied, with f
fd
and εfe,md representing the ultimate tensile strength and tensile strain of the BFRP grid, respectively.


Ultimate moment in the normal section
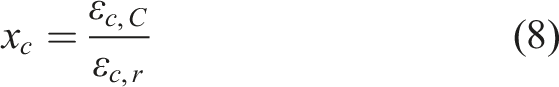
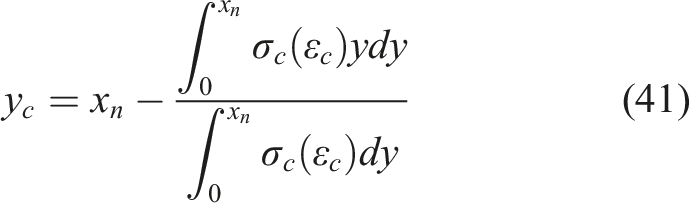
The calculation of the ultimate resistance moment of concrete slabs is predominantly based on cross-sectional analysis similar to beams (Chen et al., 2025; Torabian and Mostofinejad, 2024; Zhang et al., 2022). It is posited that at the ultimate limit state, all steel reinforcement within the cross-section reaches yield strength and the concrete in the compression zone attains ultimate compressive strain. However, the FE results indicate that only the steel reinforcement in proximity to the loading area yielded, and the concrete in other regions of the top surface remained below the ultimate compressive strain. This observation suggests that the existing method might lead to a conservative overestimation of the ultimate flexural resistance. Therefore, this study divides the cross-section into two types of one-way slab strips, calculating the moment of each type separately to achieve a more accurate total flexural moment. Figure 13 illustrates two types of cross-sections, delineating the neutral axis and distinct zones marked by patterns. Where x
n
is the neutral axis height, x is the depth of the equivalent rectangular compression zone, h is the total height of the slab, h0 denotes the distance from the centroid of steel reinforcements to the upper surface of the slab, h
fe
is the distance between the BFRP grid and the concrete’s upper surface, a indicates the cross-section width of short span, c is the width of loading plate, αⅠ and βⅠ are coefficients of the concrete’s equivalent compression block, and α can be taken as 1.0 according to GB50010 (2010). Stress and strain distribution at the ultimate state.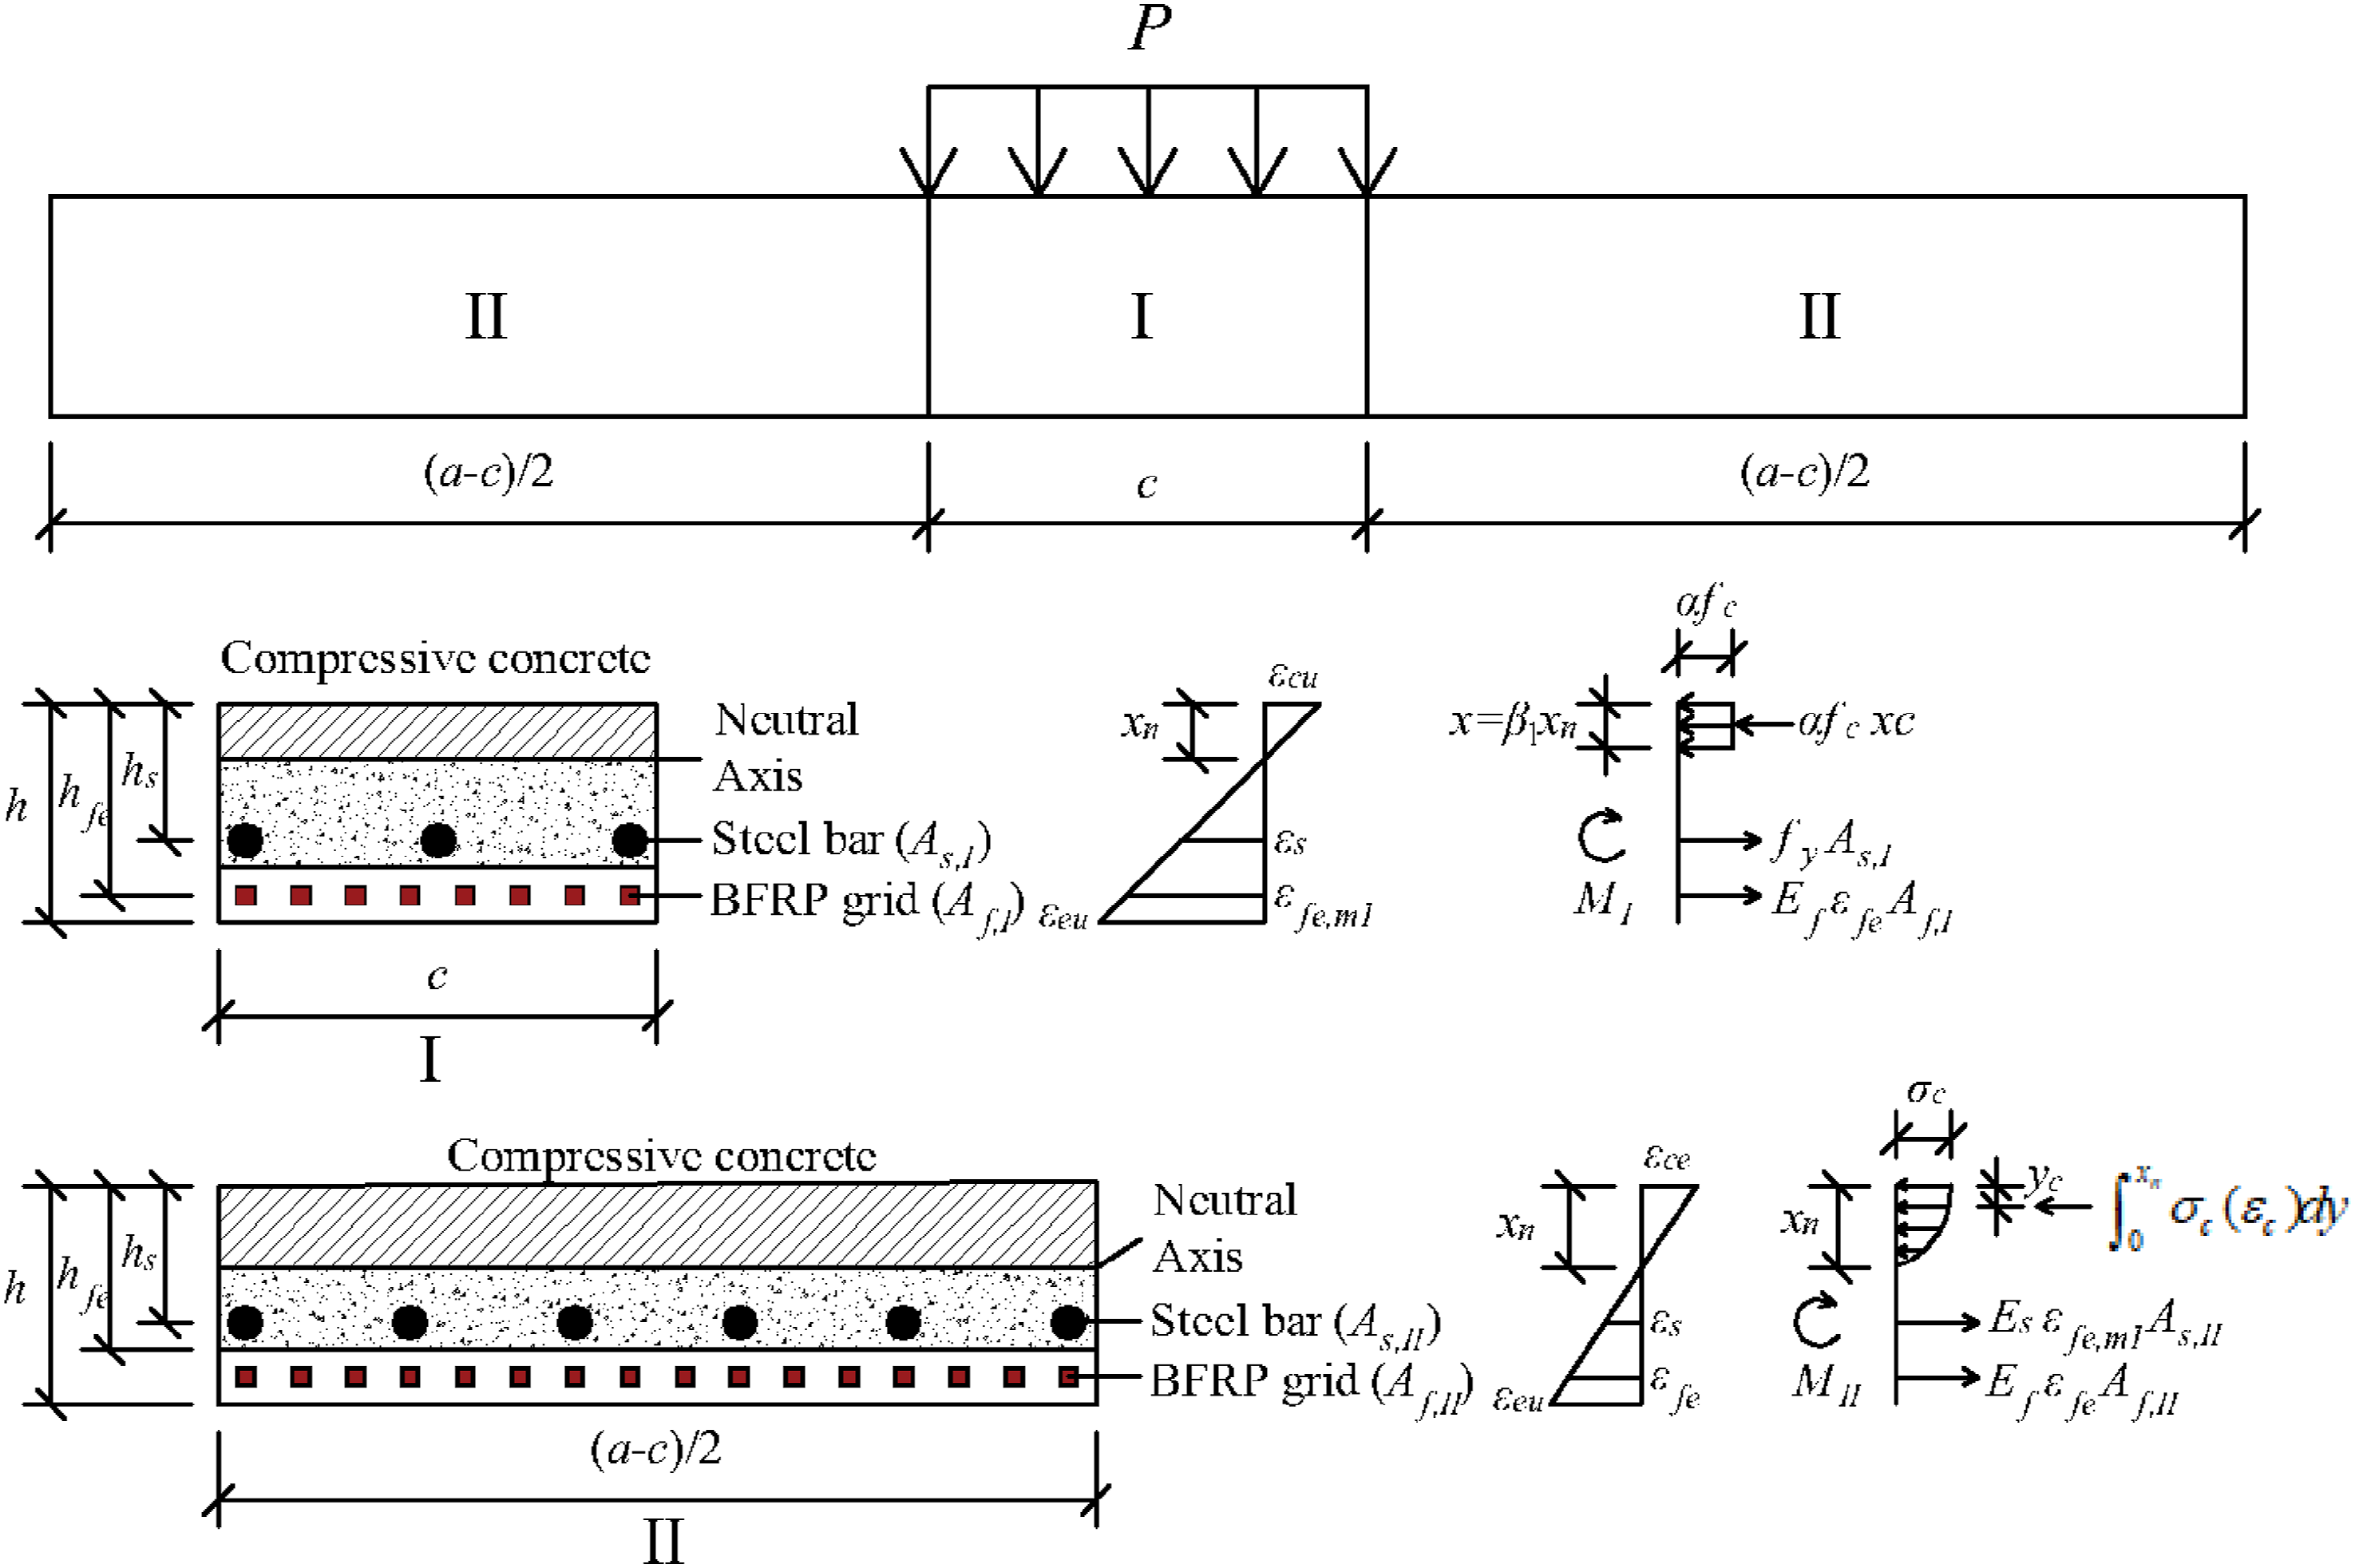
For cross-section I near the loading area, it is assumed at the ultimate limit state where the concrete in the compression zone reaches its ultimate compressive strain, the steel reinforcement in the tension zone reaches yield strength, and the ECC in the tension zone reaches cracking tensile strain. Based on the plane section assumption, the strain distribution is linear, leading to equation (31):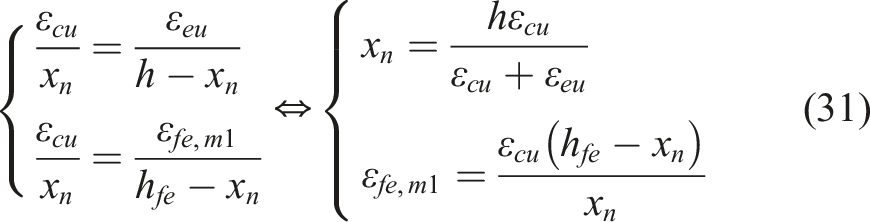
The equilibrium conditions of the cross-section lead to the equations (32) and (33):

Based on moment equilibrium at the resultant force location in the equivalent compression zone concrete, the ultimate moment MⅠ in the normal section of the strengthened slab is described by equation (34):
For cross-section II, it is assumed that the compressive strain in the concrete is less than the ultimate compressive strain, the strength of the steel reinforcement is less than the yield strength, and the tensile ECC reaches the tensile cracking strain ε
ec
. Similarly, based on the plane section assumption, equation (35) are derived: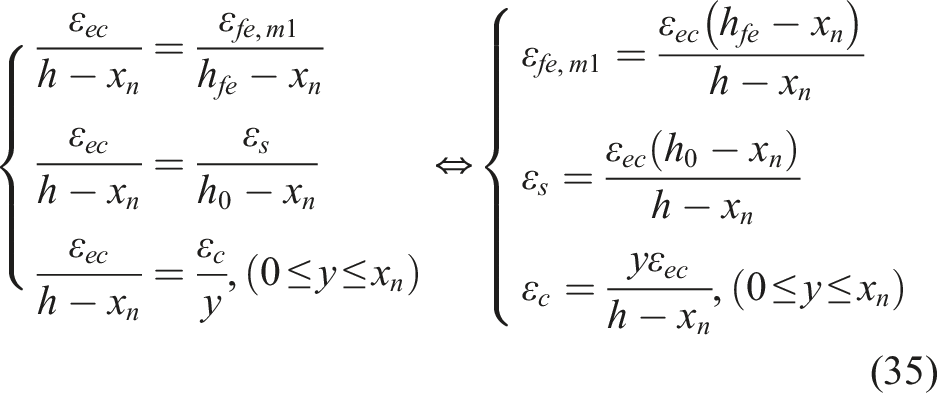
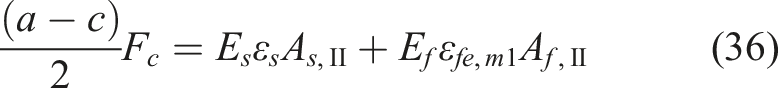

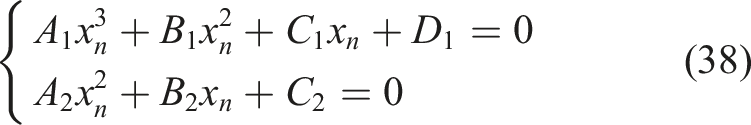
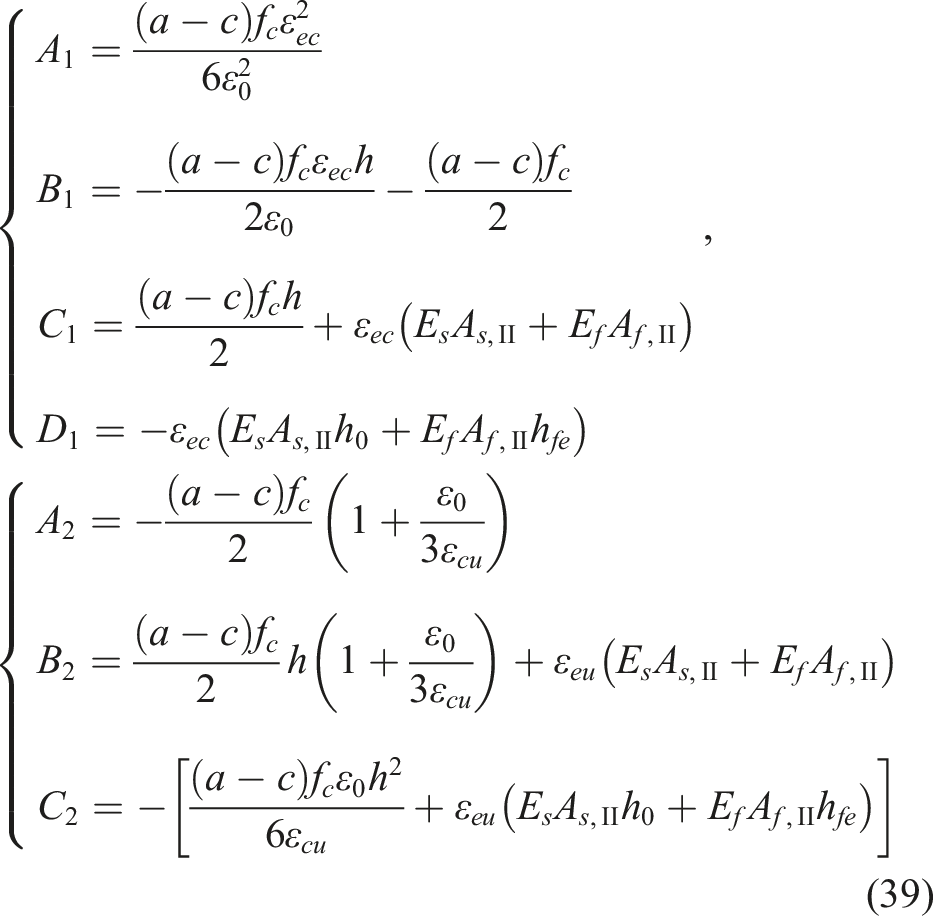
Subsequently, based on moment equilibrium at the resultant force location in the equivalent compression zone concrete, the ultimate moment MⅡ in the normal section of the strengthened slab is described by equation (40):

Yield-line theory
In the determination of the ultimate load of the reinforced slab, an analytical model was constructed utilizing yield-line theory and the virtual work method. Yield line theory defines the failure mode of the slab, where the structure is segmented into rigid regions by a systematic pattern of plastic hinges after cracking. These rigid regions progressively pivot around the yield lines, rendering the entire slab an unstable mechanism, as depicted in Figure 14. Within loading region, the slab undergoes an arbitrary infinitesimal displacement towards the external load p, termed as virtual displacement s. Following the principle of virtual work, the external virtual work W
e
executed by the external load p in the direction of the virtual displacement s equals to the internal virtual work W
i
performed by each rigid region around the yield lines. The equation for the external load p can be expressed as equations (43) to (45): The Y-shaped yield line pattern.

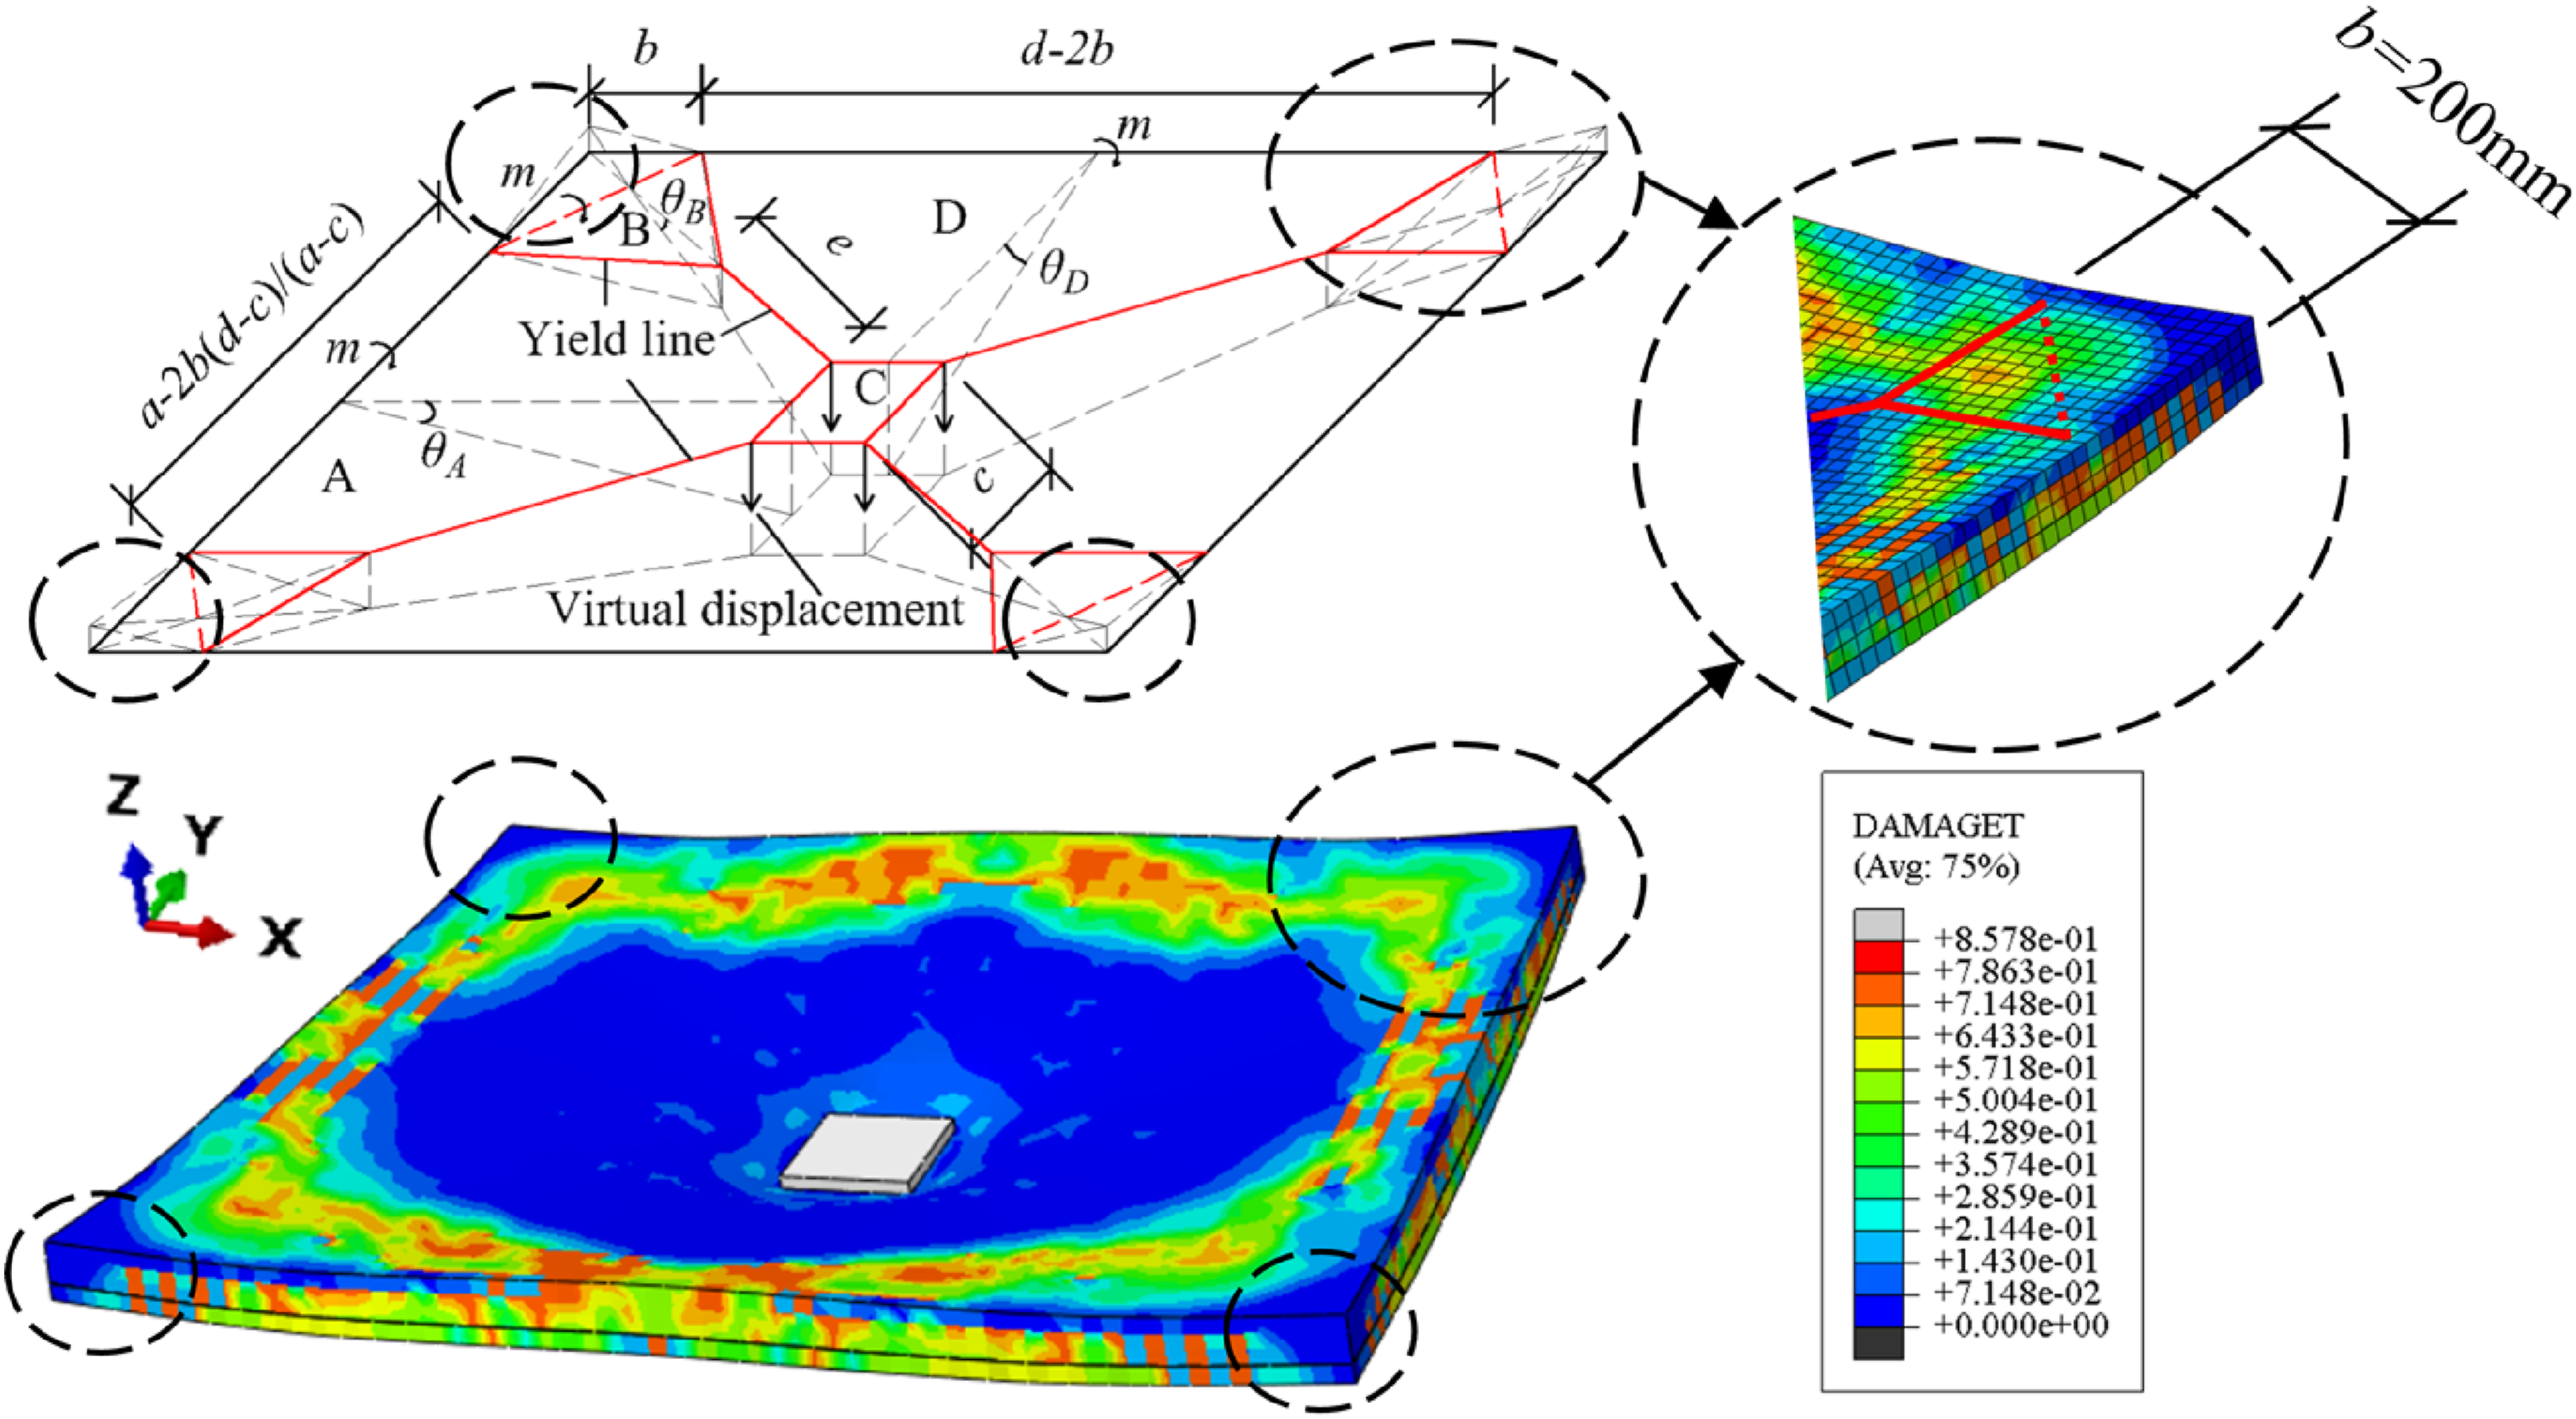
For precise determination of the ultimate load, it is crucial to establish the appropriate positions of the yield lines. During experimentation, as the four corners of the slab were unrestrained, the yield lines bifurcated before reaching the edge (Park and Gamble, 1999). Notably, the corners exhibited an upward deflection when rotating around the virtual axis, aligning with findings from the FE analysis. Consequently, this study introduces a potential Y-shaped mode to describe the development of yield lines in the reinforced slab.
The central planes of the four rigid regions (A–D) are selected for analysis, as illustrated in Figure 14. By adhering to geometric deformation compatibility conditions, the rotation angles (θ
A
to θ
D
) are determined as follows:
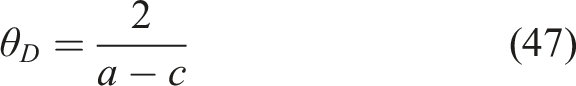
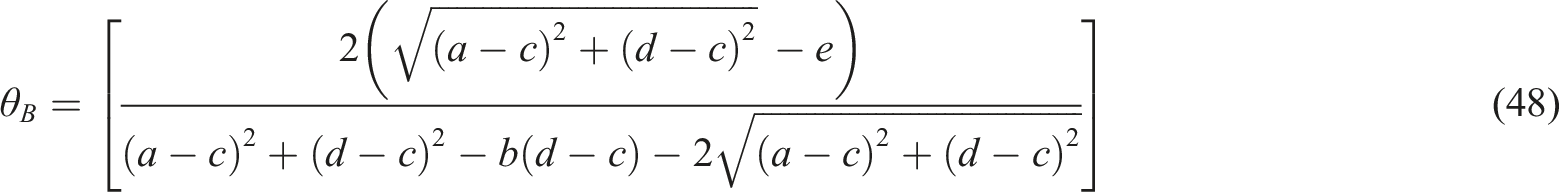
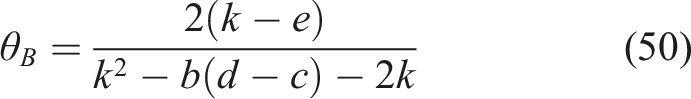
For the convenience of representing θ
B
, the variable k is introduced: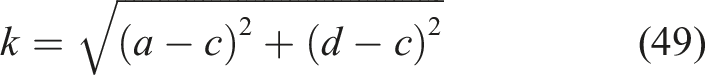
Upon substituting equations (46), (47), and (50) into equation (45), the internal virtual work from each rigid area (WA, WB, and WD) and the total internal virtual work W
i
are expressed as:
In accordance with the principle of virtual work, the total virtual work caused by external forces equal that from internal forces. Substituting equation (51) into equation (45), the ultimate load F
u
can be described as:
Validation of formula
To ascertain the precision of the formula, the calculation results are juxtaposed with experimental results and the FE results in Figure 15. Upon examination, it is evident that the results from both testing and the FE model closely align with the trends predicted by the theoretical formula for the ultimate load of strengthened slab. As per Table 9 and 10, the average and COV of Fu,F/F
u
are 0.997 and 3.483%, respectively, while the average and COV of Fu,F/Fu,M are 1.018 and 3.431%, respectively. Hence, the formula adeptly predicts the flexural capacity of the strengthened slabs. Validation of formula for the flexural capacity: (A) Comparison of results from formula and experiment, (B) Comparison of results from formula and FE model. Comparison of formula results and experimental results. Note. Fu,F and F
u
are respectively the results of formula and experiment. Comparison of calculated results from formula and FE model. Note. Fu,M is the results of FE model.
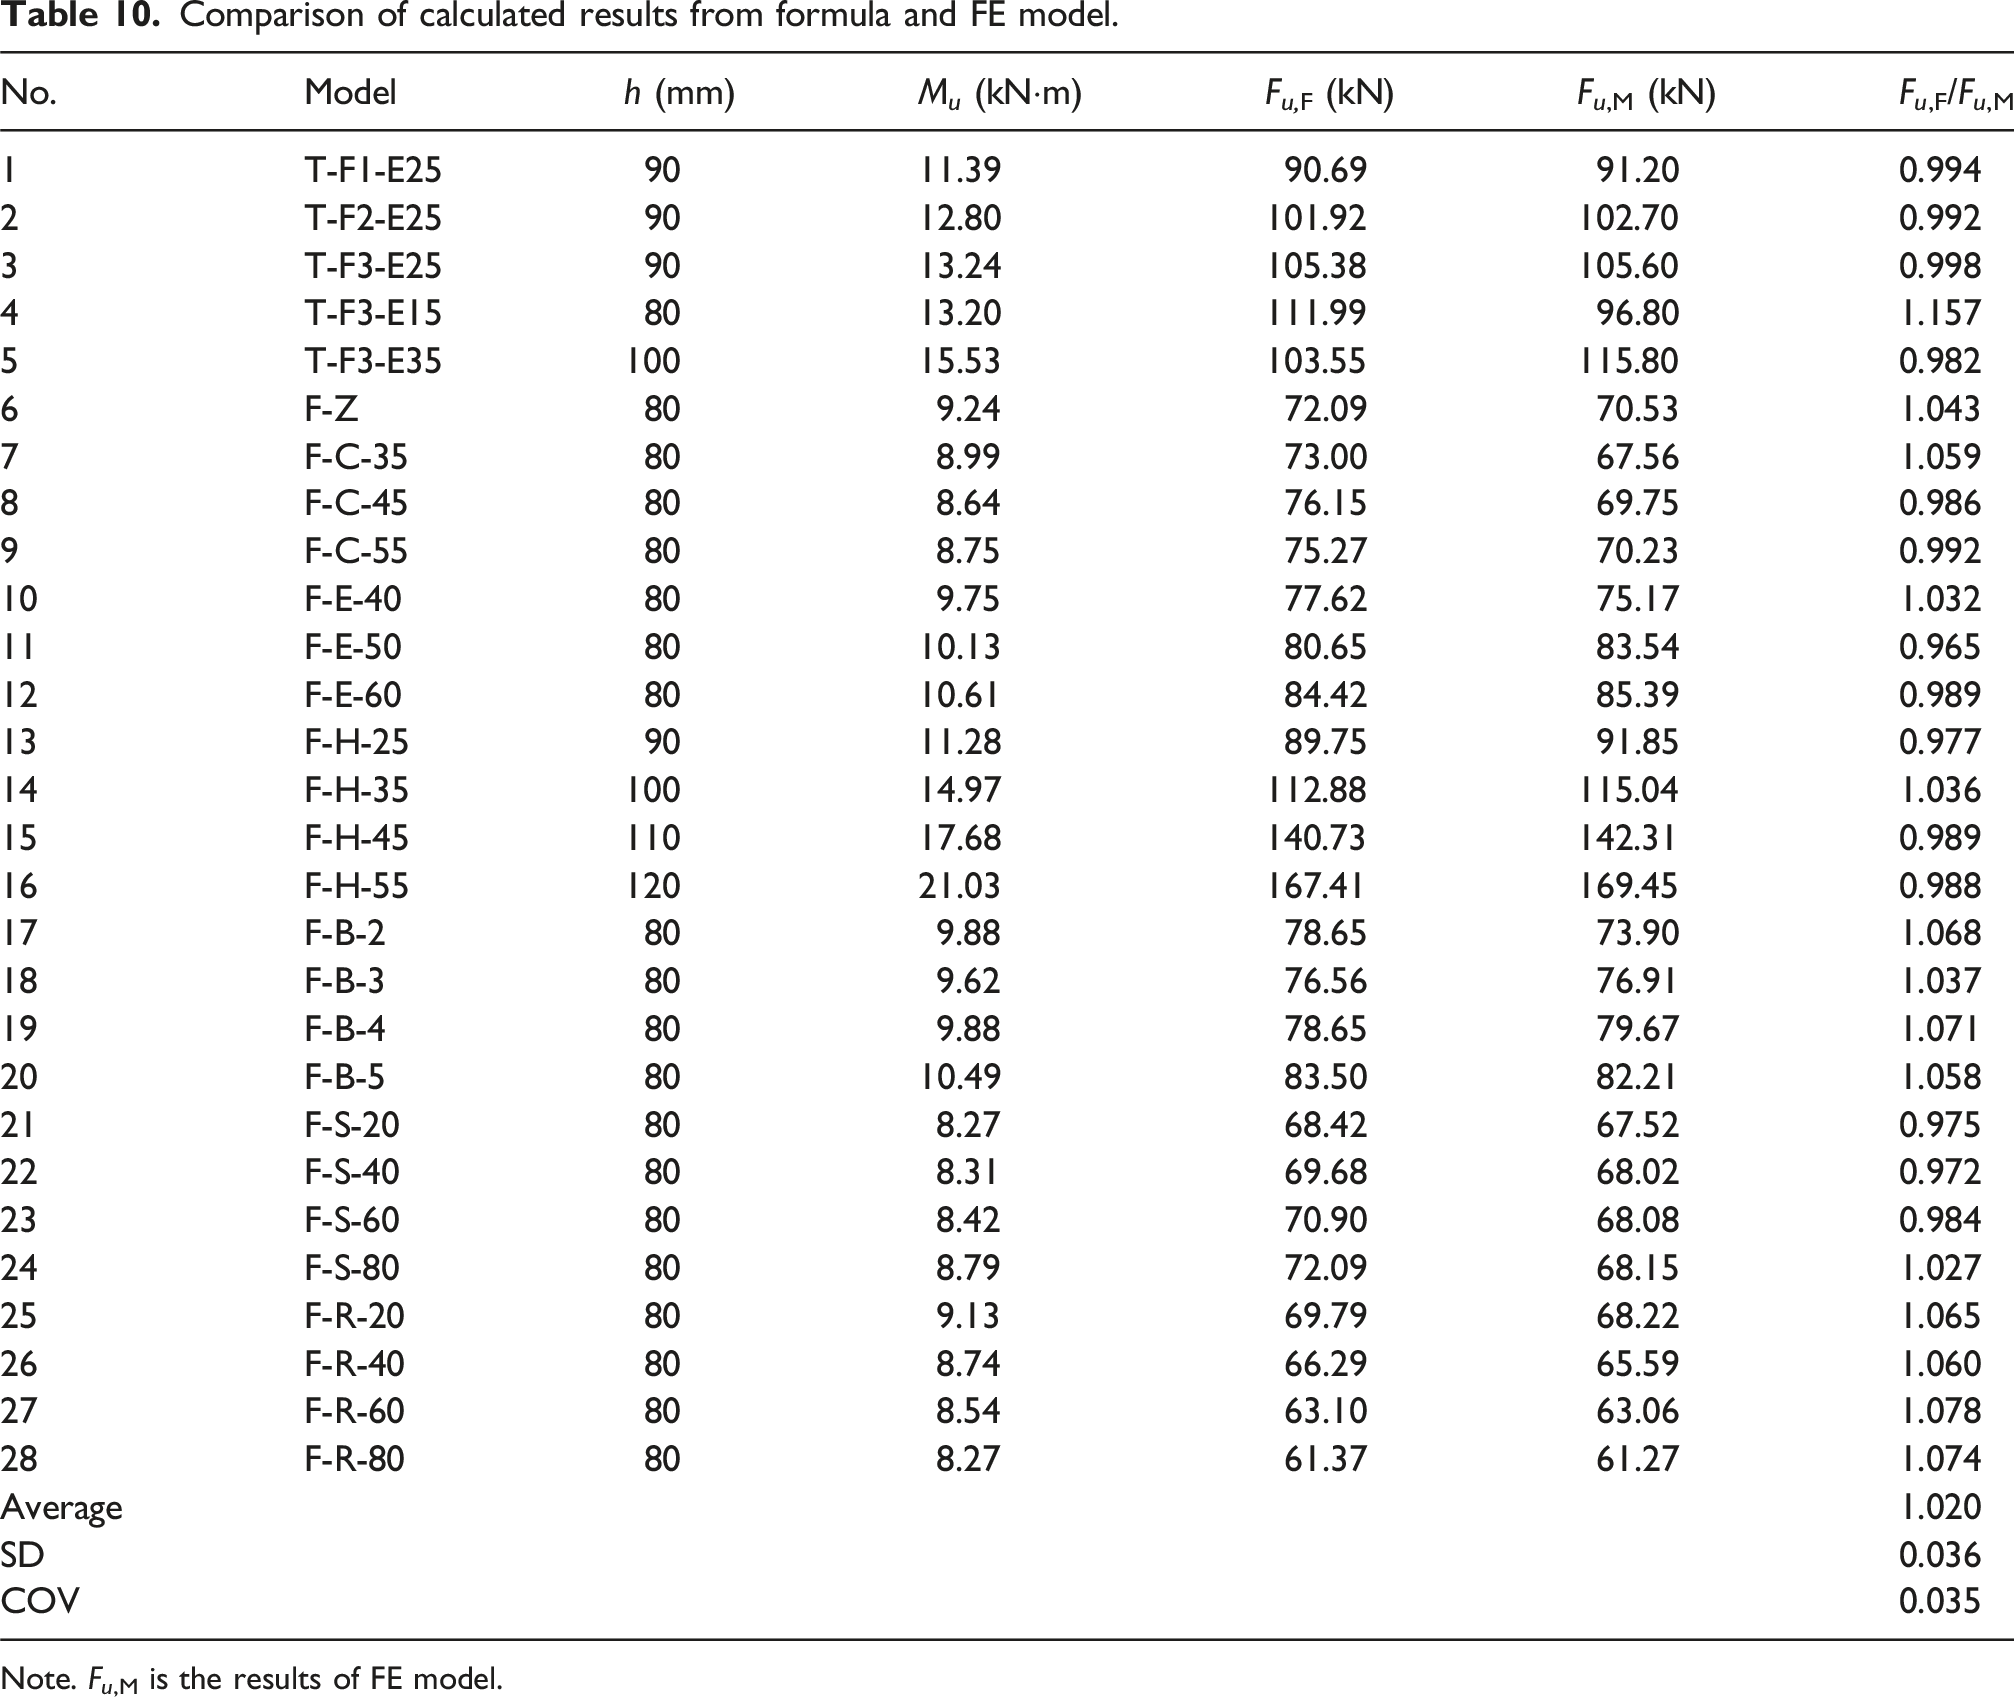
Based on the above discussion, the theoretical model proposed in the study is applicable to strengthened two-way slabs with compressive strengths of concrete ranging from 25 MPa to 55 MPa and compressive strengths of ECC ranging from 30 MPa to 60 MPa. Moreover, it is advisable to ensure the bonding strength of the ECC-concrete interface with anchor measures when increasing the thickness of ECC to enhance the flexural performance of the slab.
Conclusions
This paper presents a thorough numerical exploration of the flexural performance of RC two-way slab strengthened with a BFRP grid-ECC composite layer. Key parameters, including concrete strength, ECC strength, ECC thickness, BFRP grid thickness, ECC-concrete interface bonding degree, and corrosion amount of steel reinforcement, are scrutinized using a validated FE model. Subsequently, a design-oriented model is formulated for determining the ultimate load and moment. The following conclusions emerge: (1) The proposed FE model adeptly replicates cracking patterns for both strengthened and unstrengthened slabs, accurately predicting ultimate load and strain distributions in the BFRP grid and steel reinforcement of such strengthened slabs. (2) Analysis of the strengthening mechanism reveals the sequential load-bearing contributions: concrete and ECC initially support the load, followed by stress redistribution leading to steel reinforcement becoming the primary load-bearing element, subsequently shifting the load to the BFRP grid. (3) Parametric investigation underscores the significant impact of ECC thickness on flexural performance. Increasing ECC thickness from 15 mm to 55 mm boosts flexural capacity by 30% to 140.42%, though excessive thickness may compromise the ECC-concrete interface, necessitating a judicious selection of ECC thickness based on project specifics. (4) This study introduces a design-oriented calculation model integrating yield line development from FE analysis. Validation using test and FE model data confirms the model’s precision in predicting the ultimate load of strengthened slabs, underscoring its reliability in practical applications.
Footnotes
Funding
The author(s) disclosed receipt of the following financial support for the research, authorship, and/or publication of this article: The research described in this paper was financed by the National Natural Science Foundation of China with Grant No. 51978539.
Declaration of conflicting interests
The authors declared no potential conflicts of interest with respect to the research, authorship, and/or publication of this article.
Data Availability Statement
The data used in this study are available from the corresponding author by request.