
Abstract
This study presents an integrated framework for bridge inspection that combines multiple non-destructive testing (NDT) technologies with artificial intelligence (AI) and immersive visualization. The proposed system integrates, and fuses unmanned aerial vehicles (UAV)-based LiDAR point clouds, photogrammetry, infrared thermography (IRT), and phased-array ultrasonic tomography (UT) to generate a comprehensive, bridge-scale 3D inspection model with specific application to bridge decks. A fine-tuned Grounding DINO object detection model, trained on 10,500 infrared images, is used to automatically identify suspicious thermal patterns. The AI achieved 90% precision, 90% recall, an F1 score of 0.90, and a mean average precision (mAP@0.5) of 0.80 on held-out test data. These detections are exported as geo-referenced waypoints to guide targeted UT scans, which confirm and characterize subsurface defects such as delamination and voids. All sensing outputs are aligned within a unified coordinate system and visualized inside a virtual reality (VR) environment. Users can interact with 3D geometry, thermal overlays, and depth-resolved UT slices, and annotate defects in context. By replacing manual IRT interpretation and full-grid UT scanning with AI-guided anomaly detection and selective validation, the proposed workflow has the potential to reduce inspection time, lowers labor costs, and minimizes subjectivity in data interpretation. This system also provides a centralized, interactive 3D record that supports efficient decision-making and long-term maintenance planning.
Introduction
Bridges are vital components of transportation infrastructure, but many are aging and deteriorating under increasing traffic loads and environmental stressors, creating growing safety and economic risks. In the United States, over 9.6% of bridges are classified as structurally deficient, including 17% of steel bridges and 6.1% of concrete bridges, with average deficient bridge ages below the 75-year design expectancy (Farhey, 2018). These issues are especially prevalent in regions with dense populations and severe climates, where deterioration accelerates and usage is intense (Farhey, 2018). Traditional inspection methods, such as biennial visual checks and sounding techniques, often fail to detect subsurface or early-stage damage and rely heavily on inspector expertise (Chang et al., 2003; Rizzo et al., 2021). As a result, unexpected failures still occur during service life (Wardhana and Hadipriono, 2003), underscoring the need for continuous monitoring and predictive tools to ensure safety and extend bridge longevity (Brownjohn, 2007; Plevris and Papazafeiropoulos, 2024).
Traditional bridge inspections, typically performed through visual checks or tactile methods such as chain-drag or sounding tests, are often time-consuming, limited in scope, and reliant on the expertise of inspectors (Catbas, 2009). While these methods can detect superficial anomalies, they are often inadequate for identifying subsurface or hidden defects. NDT methods such as infrared thermography (IRT) and ultrasonic tomography (UT) have been introduced to mitigate these limitations. IRT enables rapid detection of delaminations by identifying thermal gradients across the bridge deck surface (Sanderson et al., 2022), while UT allows inspectors to capture detailed internal conditions, including crack depths and voids (Sun et al., 2018). However, each technique has intrinsic limitations and must be precisely timed, calibrated, and interpreted.
As infrastructure systems age and become increasingly complex, the demand for more comprehensive and efficient inspection strategies has intensified. Environmental challenges such as increased temperature fluctuations, freeze-thaw cycles, and rising humidity levels can exacerbate existing structural vulnerabilities especially for concrete structures. Among these, concrete bridge decks often require the highest priority and attention due to their direct exposure to traffic loads, weather conditions, and de-icing salts, which can accelerate deterioration. Additionally, increased traffic loads from modern transportation networks exert greater stress on bridge decks and supporting elements, accelerating fatigue and wear. As a result, infrastructure owners and regulatory bodies are compelled to shift toward efficient and more adaptive monitoring approaches. This transition underscores the need to employ multiple sensing and data analytics tools within a unified framework to ensure continuity and clarity in decision-making (Luleci and Catbas, 2023).
Prior efforts relevant to this study have (i) used AI to analyze IRT offline after data collection, (ii) fused multimodal sensing for digital twins or VR/XR viewing, or (iii) paired IRT screening with follow-up UT—but typically without live AI assistance inside the immersive environment and without geo-referenced UT evidence co-located with the thermal/RGB/LiDAR layers. In contrast, the present framework (a) performs real-time, in-headset AI inference on IRT imagery while the inspector explores the model, (b) aligns LiDAR, RGB, IRT, and UT in a common UTM frame so that UT B/C/D-scans appear exactly where the AI-flagged hotspot is viewed, and (c) exports AI-derived, geo-referenced waypoints that guide targeted UT in lieu of exhaustive grid scanning. Practically, this enables single-session screening and confirmation within VR, with measured interaction latency on commodity hardware on the order of ∼650 ms for AI feedback, and supports inspector decisions using surface (IRT/RGB) and subsurface (UT) evidence that is spatially co-registered. This study therefore builds on prior AI-IRT, multimodal fusion, and VR/XR inspection work, but specifically advances the field by embedding AI-guided IRT and geo-referenced UT confirmation directly inside the immersive workflow rather than treating them as separate, post-hoc steps (see next Section for closest related systems and explicit contrasts).
Related work on using novel technologies for bridge assessment
To enhance the effectiveness of bridge condition assessments, numerous studies have explored the integration of complementary sensing and modeling technologies. Unmanned aerial vehicles (UAVs) equipped with high-resolution cameras and advanced sensors enable imaging and scanning from otherwise inaccessible locations (Panigati et al., 2025). Light Detection and Ranging (LiDAR) and photogrammetry, particularly when deployed via UAVs, allow inspectors to generate accurate three-dimensional (3D) models of existing infrastructure even in the absence of design drawings (Abdel-Maksoud, 2024). These 3D reconstructions have shown strong agreement with traditional plan data, confirming their reliability for both inspection and analytical modeling. Furthermore, combining photogrammetry and LiDAR captures both texture-rich visual information and high-precision spatial geometry, a prerequisite for developing realistic digital twins (Luleci et al., 2024b).
LiDAR and photogrammetry are now standard tools for creating accurate 3D bridge models. UAV-mounted LiDAR produces high-precision point clouds even under challenging environmental conditions, while photogrammetry provides detailed surface textures at lower cost (Abdel-Maksoud, 2024; Acero Molina et al., 2024; Castellani et al., 2024; Gaspari et al., 2022). Combining both methods improves model fidelity through cross-validation and error reduction and supports digital-twin development for remote inspection and maintenance planning (Chen et al., 2019; Riveiro et al., 2013).
Terrestrial and UAV-based LiDAR scanning has demonstrated millimeter-scale precision in capturing complex bridge geometries (Catbas et al., 2024). The resulting dense point-cloud data can be used not only to create detailed surface models but also to monitor displacement, deformation, and long-term movement trends (Catbas et al., 2024; Plevris and Papazafeiropoulos, 2024). When combined with photogrammetry, which adds color and texture, these datasets provide an enriched basis for assessing both surface and structural integrity. Periodic re-scanning of LiDAR and photogrammetric data further enables consistent tracking of bridge condition over time, facilitating the detection of progressive deterioration and supporting routine monitoring and maintenance planning (Ye et al., 2018).
AI for infrared thermography (IRT)–based defect detection
IRT has emerged as a rapid, non-contact method for detecting subsurface delamination and voids in reinforced-concrete bridge decks. When integrated with UAVs, IRT enables full-deck scanning without interrupting traffic or requiring direct access to the structure (Alqurashi et al., 2024a; Ellenberg et al., 2016; Omar and Nehdi, 2019). Field evaluations have shown that UAV-mounted IRT systems can reliably identify thermal gradients associated with air gaps and deteriorated areas, achieving accuracy comparable to hammer-sounding and half-cell potential tests (Ahearn et al., 2023; Omar and Nehdi, 2017). Both passive and active IRT modes have been explored, with active approaches demonstrating improved performance under variable field conditions (Merkle and Reiterer, 2021; Zhang et al., 2025).
Recent advances in AI and deep learning (DL) have significantly improved the automation and accuracy of IRT analysis. AI-based models trained on thermal imagery can detect delaminations and cracks with high precision, reducing inspector subjectivity and post-processing time (Aljagoub, 2025; Zhang et al., 2023). Studies such as (Aljagoub and Puleo, 2022; Ichi and Dorafshan, 2022) have integrated DL models into UAV-based inspection workflows, demonstrating strong potential for near-real-time defect identification. These developments position UAV–IRT systems as essential components of modern bridge assessment strategies, supporting data-driven maintenance and digital documentation of deterioration.
Coupled infrared–ultrasonic (IRT–UT) inspection frameworks
UT plays a critical role in detecting internal defects in concrete bridge decks, particularly subsurface delamination. Common UT approaches include ultrasonic surface waves (USW), pulse velocity, and tomography, which identify anomalies based on variations in acoustic wave propagation (Alqurashi et al., 2025b; Gucunski et al., 2006; Shokouhi et al., 2013). In contrast to IRT, UT provides reliable depth information but remains more time-consuming due to the need for surface contact or coupling agents (Li et al., 2016; Petro and Kim, 2012).
Recent advancements have introduced robotic platforms such as RABIT and AI-driven analytical models that automate data collection, processing, and defect interpretation, improving the efficiency of large-scale bridge inspections (Alqurashi et al., 2025a; Choi et al., 2016; Garcia et al., 2017; Gucunski et al., 2015). Despite being slower than optical or thermal methods, UT remains indispensable for validating defect depth, severity, and extent, especially when coupled with IRT data to form a complementary, multi-modal assessment framework (Sanderson et al., 2022).
Immersive and digital-twin-based bridge inspection systems
UAVs have transformed bridge inspection by providing a safe, rapid, and cost-effective alternative to traditional hands-on methods (Feroz and Dabous, 2021; Panigati et al., 2025). Equipped with high-resolution cameras and LiDAR, UAVs enable the generation of comprehensive 3D models and the detection of surface defects, without interrupting traffic (Abdel-Maksoud, 2024; Gaspari et al., 2022). UAV-based photogrammetry captures fine surface textures for crack and spall mapping, while LiDAR provides accurate geometric point clouds even in complex or shadowed areas (Acero Molina et al., 2024; Castellani et al., 2024). Recent advances highlight the benefits of multi-sensor fusion—integrating LiDAR, RGB, and IRT data—to support condition tracking and predictive maintenance within digital-twin environments (Lee, 2025; Zhu et al., 2024). Although challenges such as GPS signal loss under bridges and limited UAV flight duration persist, the incorporation of workflow automation and machine learning continues to enhance data fidelity and operational efficiency (Perry et al., 2020; Toriumi et al., 2022). Consequently, UAV inspection has been integrated into modern bridge management systems, strengthening data-driven decision-making and long-term maintenance planning (Feroz and Dabous, 2021; Xu and Turkan, 2020).
Integrated 3D inspection platforms represent a significant evolution in civil-infrastructure monitoring, providing a virtual replica of physical structures that continuously updates based on sensor data (Chen et al., 2024a). These dynamic digital twins enable engineers to simulate load conditions, assess deterioration scenarios, and visualize the evolution of damage over time. Early implementations, such as those demonstrated by (Luleci et al., 2024b), have shown the utility of digital twins for real-time risk assessment and collaborative decision-making, particularly in regions exposed to natural hazards. Unlike static BIM, which primarily serves design and planning purposes, immersive inspection environments integrate real-time sensor inputs, AI-based predictions, and 3D visualization, enabling lifecycle-based assessment and maintenance optimization (Girardet and Boton, 2021; Santos et al., 2025).
VR has also emerged as a powerful tool for bridge operations and maintenance, providing immersive environments that enhance spatial awareness, safety, and collaborative analysis (Sadhu et al., 2022; Zhang et al., 2020). VR systems allow inspectors to navigate 3D reconstructions derived from LiDAR, photogrammetry, or BIM data, facilitating hazard-free, remote evaluations (Du et al., 2017; Nguyen et al., 2022). These systems can integrate laser scans, imagery, and sensor data such as strain or displacement time histories to support data-informed decision-making (Savini et al., 2022; Wang et al., 2023b). Compared with conventional inspection methods, VR enhances user engagement, communication, and workflow efficiency, particularly in multi-disciplinary or geographically distributed teams (Omer et al., 2019; Shi et al., 2018). Beyond inspection, VR applications extend to diagnostics, training, and SHM, allowing engineers to visualize performance indicators in rich spatial context (Luleci et al., 2022; Veronez et al., 2019). Some studies have also coupled VR with robotic systems for remote inspection of inaccessible bridge components (Attard et al., 2018; Halder and Afsari, 2022).
However, despite rapid progress, most immersive systems remain limited to visual or geometric data. Few implementations incorporate NDT datasets such as IRT or UT, which are essential for subsurface assessment. Moreover, AI-driven defect recognition tools are often deployed as separate, post-processing steps rather than integrated modules within the immersive environment (Omar and Nehdi, 2017). Immersive 3D inspection models have also proven valuable for evaluating structural response and supporting collaborative decision-making, particularly when physical access is limited (Catbas et al., 2022; Luleci and Catbas, 2024; Sampaio et al., 2010; Tadeja et al., 2021). By embedding AI-guided IRT and geo-referenced UT confirmation within such environments, bridge inspection can evolve toward intelligent, unified, and field-ready systems that enable efficient, accurate, and collaborative maintenance workflows (Luleci et al., 2024a).
Closest related work and positioning
AI, particularly DL and Transformer-based architectures, has substantially advanced defect detection by automating image analysis and anomaly recognition in bridge inspection data (Wang et al., 2023a). Models trained on raw and labeled infrared thermography (IRT) images have achieved accuracy exceeding 90%, demonstrating strong potential for identifying and localizing delamination and cracking (Alqurashi et al., 2024b). Approaches such as Grounding DINO further enable real-time object detection, offering practical alternatives to manual visual interpretation, especially in field or edge applications that demand responsive and efficient systems (Ren et al., 2024). Transformer-based frameworks are particularly effective for civil infrastructure because they capture contextual relationships across large visual regions, an advantage for distinguishing subtle or diffuse anomalies spanning multiple components (Chen et al., 2024b).
Recent advances have also emphasized multimodal AI fusion, integrating complementary data sources to improve detection robustness. Fusing thermal imagery with visible-light and LiDAR data allows cross-verification of anomalies across modalities, reducing false positives and negatives by leveraging each sensor’s unique strengths—thermal cameras detect subsurface features, visible imaging captures surface characteristics, and LiDAR provides precise geometric detail (Nooralishahi et al., 2022; Pozzer et al., 2025; Zhang, 2022). Studies have shown that multimodal training improves segmentation and classification of delamination, cracking, and corrosion (Ameli, 2024; Yang et al., 2023). Drone-based frameworks combining RGB, thermal, and LiDAR sensing enhance spatial coverage and minimize operator bias (Lee, 2025; Ma et al., 2025). Furthermore, continuous learning has improved generalization across structure types and environmental conditions. The integration of these data-driven models with building BIM supports long-term monitoring and predictive maintenance (Malihi et al., 2025; Pozzer et al., 2025), positioning multimodal AI as a key enabler for automation and data integrity in future bridge management.
Parallel progress in immersive and NDT integration is reshaping bridge inspection workflows. DL models have achieved reliable interpretation of LiDAR, IRT, and UT datasets even under noisy field conditions (Kulkarni et al., 2023; Sabato et al., 2023; Zhang, 2020). VR-based systems increasingly combine IRT and UT data with LiDAR-derived geometry to create digital twins that facilitate collaborative and remote diagnostics (Karaaslan, 2019; Rakoczy et al., 2024; Samuel, 2023; Wakabayashi et al., 2025). More recent frameworks extend this concept through multimodal AI and extended reality (XR), embedding laser scanning, GPR, and thermal imagery for real-time visualization and risk prioritization (Ameli, 2024; Catbas et al., 2022; Ibrahim et al., 2024).
Despite these advances, several limitations persist. Most prior systems analyze IRT or UT data as offline processes, lacking real-time AI inference or in-situ fusion of subsurface and surface datasets within immersive environments. Similarly, few implementations achieve geo-referenced alignment of LiDAR, RGB, IRT, and UT data in a unified spatial frame. As a result, inspectors must rely on separate tools for detection, verification, and visualization, increasing latency and uncertainty.
In contrast, the present study directly addresses these gaps by embedding AI-guided IRT analysis and geo-referenced UT validation within an immersive VR inspection workflow. The proposed framework performs real-time AI inference inside the headset, aligns multimodal datasets (LiDAR, RGB, IRT, and UT) in a common coordinate system, and enables inspectors to verify subsurface defects interactively at the exact spatial locations of detected anomalies. This integrated approach advances beyond previous multimodal or AI-assisted systems by enabling synchronous, field-ready bridge inspection that unifies detection, confirmation, and visualization in one interactive environment.
Gaps and target contributions for bridge assessment
Despite the growing use of LiDAR, photogrammetry, IRT, UT, and AI in bridge inspection, a major challenge persists—the absence of a unified, field-ready workflow that integrates all sensing modalities into a single coherent system. Most existing studies isolate these technologies, applying AI only after data collection or using UT and IRT separately without spatial alignment. VR-based tools also rarely incorporate live anomaly detection or enable seamless switching between surface and subsurface datasets. Moreover, current approaches often require labor-intensive processing, expert interpretation, or highly curated datasets, limiting scalability for real-world deployment.
To overcome these limitations, this study introduces an integrated framework that combines UAV-based LiDAR and photogrammetry for 3D geometry capture, AI-driven IRT analysis for anomaly detection, targeted UT for defect confirmation, and immersive VR visualization for collaborative decision-making. By aligning all sensing outputs within a common coordinate frame and enabling real-time interaction, the proposed system offers a practical and scalable advancement toward intelligent and efficient bridge inspection.
The integration of structural health monitoring (SHM), NDT, AI, and extended reality (XR) into a unified workflow directly addresses the fragmentation of current inspection practices, in which data streams remain siloed across visual records, thermographic scans, and ultrasonic measurements (Chang et al., 2003; Rizzo et al., 2021; Wardhana and Hadipriono, 2003). Such integration has the potential to enhance infrastructure operations, accelerate assessments, and strengthen data-driven decision-making. In this context, resilience can be improved not only through faster defect detection but also through smarter asset management supported by continuous data synthesis.
The principal challenges currently facing bridge-inspection processes include: • • • •
To address these challenges, this study proposes an integrated bridge-inspection framework that merges UAV-based LiDAR, photogrammetry, IRT, UT, AI, and VR visualization within a single workflow. The novelty of this framework is articulated through four key contributions: • • • •
Through these innovations, the proposed methodology unites rapid remote sensing, intelligent defect analytics, and interactive visualization into a single, cohesive workflow. The overall concept and relationships among the identified challenges, enabling technologies, and intended outcomes are illustrated schematically in Figure 1, which summarizes the proposed integrated bridge-inspection ecosystem. The expected outcome is a more efficient inspection process that enhances both defect-detection accuracy and communication among engineering teams. This integrated approach aligns with the emerging paradigm of digital twins in infrastructure management, leveraging continuously updated virtual replicas to improve understanding, optimize maintenance, and enable proactive preservation. Proposed workflow for an integrated bridge inspection ecosystem, outlining the key challenges driving innovation, the enabling technologies applied, and the expected improvements in efficiency, reliability, and decision-making.
Study objectives and scope
The primary objective of this study is to develop and validate an integrated, multimodal inspection framework that leverages UAV-based LiDAR, photogrammetry, IRT, AI, and UT to comprehensively assess bridge structures. This framework aims to enhance the efficiency, accuracy, and safety of bridge inspections by providing a unified platform for data collection, analysis, and visualization, as illustrated in Figure 2. By integrating these technologies within an immersive VR environment, the study seeks to enable more informed and data-driven decision-making processes for maintenance and repair planning. Overview of current inspection challenges, proposed objectives, and expected outcomes.
Based on preliminary field trials and controlled experiments, the proposed framework is expected to reduce detailed NDT inspection time using UT by approximately 70–75%, while increasing defect localization accuracy by an estimated 15–20% compared with conventional full-grid scanning. These estimates are derived from comparing the time required to perform a complete UT scan and data analysis across an entire bridge deck with the targeted, AI-guided approach developed in this study. For instance, scanning the full deck of the test footbridge (≈300 m2) at a grid spacing of 100 mm in the x-direction and 20 mm in the y-direction would require approximately 15–16 hours of UT acquisition, plus 4–5 hours of post-processing and interpretation. In contrast, the AI-guided workflow restricted UT scanning to only ∼25–30% of the surface area, reducing acquisition time to about 4–5 hours and data analysis to under 2 hours, while still ensuring that all AI-flagged thermal anomalies were examined in detail. These efficiency gains—combined with more precise targeting of defect-prone regions—support faster turnaround times, reduced labor costs, and more consistent defect detection.
The specific objectives of this study are as follows: • • • •
By achieving these objectives, the proposed framework aims to streamline bridge inspection workflows, reduce reliance on manual interpretation, and provide a unified, interactive inspection dataset to support ongoing SHM and maintenance planning.
Methodology
Before applying the full-scale inspection workflow, a controlled experiment was conducted to evaluate and optimize the ability of UAV-acquired IR data to detect shallow delaminations in concrete and to confirm these findings using UT. A concrete sample with embedded voids was surveyed using the same UAV platform employed in the main study. To determine the optimal operational altitude for thermal anomaly detection, the UAV was flown at multiple heights (5 m, 10 m, 15 m, 20 m, and 30 m). This allowed assessment of how altitude affected thermal resolution, anomaly visibility, and image coverage area. Based on this evaluation, 20 m was selected as the primary test height because it provided the best balance between thermal detail and field coverage.
The drone was equipped with both an RGB camera for surface documentation and a radiometric thermal sensor for subsurface detection, ensuring direct correlation between surface appearance and thermal response. The IRT imagery captured from the selected 20-m altitude revealed thermal anomalies consistent with delamination, and subsequent phased-array UT scans verified the presence of subsurface defects at the flagged locations. This test also served as a calibration stage to verify sensor performance, optimize flight parameters (speed, overlap, camera angle), and confirm geo-referencing accuracy before deployment on a full bridge.
This process is illustrated in Figure 3, which demonstrates the integration of visual, thermal, and ultrasonic data on a known defect scenario. Validation of UAV-based IRT and UT on a controlled concrete sample: (a) RGB image captured at 20 m altitude, (b) thermal anomaly detected via IRT imaging, (c) UT scan confirming a subsurface delamination. The same UAV platform and sensors used in the main bridge inspection were employed in this preliminary test: a DJI Matrice 300 RTK equipped with a Zenmuse H20T camera (RGB + thermal) for both visual and infrared imaging, and a MIRA A100 phased-array UT system for depth-resolved confirmation of detected anomalies.
Building on this validation, the overall workflow of the proposed methodology can be summarized in six main steps: • Step 1: Remote Geometry Acquisition – Deploy UAVs equipped with LiDAR scanners and cameras to capture the bridge’s geometry and appearance. Generate a precise 3D point cloud and photogrammetric model of the entire structure for a baseline digital representation. • Step 2: Thermal Anomaly Detection – Perform IRT over the bridge deck and critical components to quickly identify “hot spots” that may indicate subsurface defects or areas of concern. • Step 3: AI-Driven Defect Identification – Apply a trained transformer-based AI model to inspection images to automatically detect and localize potential defects such as cracks, spalls, or delaminations. • Step 4: Targeted Ultrasonic Evaluation – Conduct UT scans on the prioritized regions identified by AI and IRT to determine the presence, type, and extent of internal defects. • Step 5: Data Integration and Visualization – Fuse all collected data into a cohesive digital twin of the bridge. Utilize VR visualization to allow engineers and stakeholders to immerse in the integrated model, inspect identified issues, and collaboratively make maintenance decisions. • Step 6: Feedback and Updating – Use insights from the VR-based review to update the inspection records and bridge management plans. The digital model, enriched with inspection data, becomes a living record that can be updated in subsequent inspections, facilitating trend analysis and predictive maintenance planning.
The proposed workflow is summarized in Figure 4. Step 1 employs a single UAV mission to gather all primary inspection data. A Matrice 300RTK carrying a Zenmuse L1 sensor (LiDAR + RGB) and a Zenmuse H20T camera (RGB + thermal) acquire co-registered point-cloud, RGB, and infrared images while real-time RTK corrections ensure centimeter-scale positional accuracy. Five-step workflow: (1) UAV LiDAR/RGB/thermal acquisition; (2) geo-referenced 3-D model generation; (3) AI-based thermal anomaly detection; (4) targeted UT; (5) multi-layer VR review and action export.
In Step 2 the LiDAR data are processed in DJI Terra and the RGB and thermal photographs in Agisoft Metashape, producing a consolidated three-dimensional surface with an orthorectified infrared overlay. Step 3 applies a fine-tuned Grounding-DINO model to this infrared layer to delineate thermally anomalous regions. These regions guide Step 4, where a MIRA A100 phased-array scanner collects volumetric ultrasonic data only at the flagged locations, yielding depth-resolved information on delamination, spalling, and voids. Step 5 integrates all sensing layers in a Unity environment viewed with a Meta Quest 2 VR headset; inspectors can toggle layers, review ultrasonic slices, record annotations, and export a defect list that informs subsequent maintenance activities.
Digitalization: Visual sensing and data integration
A multi-sensor UAV platform was used to collect all primary visual data in the two flights campaign. The drone was equipped with a Zenmuse L1 module (LiDAR + RGB) on the first flight, and a Zenmuse H20T camera (RGB + thermal, 640 × 512 px) on the second flight. Real-time kinematic (RTK) corrections were provided by an Emlid Reach RS2 base station linked to the aircraft through a mobile-hotspot connection, maintaining a fixed-RTK status for centimeter-level positioning during the data collection process. LiDAR scanning was performed manually at approximately 20 m altitude along both nadir and oblique paths to avoid vegetation and built obstructions while achieving full structural coverage. Thermal imagery was acquired about 1 hour before sunset to exploit natural surface cooling; an automated nadir mission assured 90 % frontal and lateral overlap, followed by manually flown oblique passes to improve feature recognition.
All raw data streams—LiDAR point cloud, RGB photographs, and thermal frames—were time-stamped and stored in the same World Geodetic System 1984 (WGS 84)/Universal Transverse Mercator (UTM) Zone 17 N reference frame broadcast by the RTK unit. This common coordinate system allows subsequent processing software to align datasets without additional ground-control points, enabling direct fusion of geometry, color, and temperature information in the later modelling stage.
Virtualization: Model generation
LiDAR point clouds were merged and processed in DJI Terra at full density, then exported in WGS 84/UTM 17 N to retain the centimeter-level accuracy established during the RTK-assisted flight. Two Agisoft Metashape projects were created. The first contained 292 RGB photographs; images were aligned with high-accuracy settings (50 000 key points, 10 000 tie points), followed by dense-cloud generation and model reconstruction from depth maps. The second project combined 338 wide-angle RGB and 338 thermal frames (total = 676). After high-accuracy alignment, 551 images were successfully matched; the RGB layer was disabled and the model was textured solely with the radiometric thermal data, producing an orthorectified infrared surface. This thermal model was rigidly registered to the RGB mesh, and both image-based meshes were subsequently co-aligned to the LiDAR surface via iterative closest-point matching (ICP), yielding a single geo-referenced 3-D model that integrates geometry, color, and temperature information.
Ultrasonic volumes acquired with the MIRA A100 scanner were reconstructed at 2.5 cm voxel resolution, exported as geo-referenced Neuroimaging Informatics Technology Initiative (NIfTI) files, and converted to ASCII OBJ meshes to ensure compatibility with the rendering pipeline. LiDAR geometry, RGB texture, infrared texture, and ultrasonic OBJ meshes were imported into Unity 2022, where custom shaders enable layer toggling, infrared-opacity adjustment, and depth-slice scrolling. The assembled scene was deployed to a Meta Quest headset, providing inspectors with an immersive environment in which all sensing layers can be examined and annotated within the same spatial context.
Intelligence: AI-based thermal-anomaly detection
Infrared anomaly detection in this study was performed using a fine-tuned Grounding-DINO detector (Liu et al., 2023). The network was first pre-trained on the public COCO dataset (Lin et al., 2014; Liu et al., 2023) and then adapted using an external corpus of ≈10 500 annotated raw IRT images that is independent of the present bridge study. Annotations were generated by transferring pixel-aligned bounding boxes from processed thermograms to the corresponding raw frames; the final set was stratified 70%/20%/10% for training, validation, and test splits. Standard data-augmentation techniques (horizontal flip, ±15° rotation, ±10% scale) were applied during training to improve robustness to camera angle, emissivity variation, and ambient-temperature drift.
Fine-tuning was carried out for 100 epochs with the AdamW optimiser, a weight-decay variant of Adam that helps reduce overfitting by decoupling weight decay from gradient updates. The initial learning rate was set to 1 × 10⁻⁴, with a batch size of eight images. On the held-out test subset, the network achieved mAP0.5 = 0.80, Precision = 0.90, Recall = 0.90, and F1 = 0.90. Here, Precision refers to the proportion of predicted anomalies that were correct, Recall to the proportion of actual anomalies that were detected, and the F1 score is the harmonic mean of Precision and Recall. The mAP0.5 metric (mean Average Precision at an Intersection-over-Union threshold of 0.5) summarizes detection accuracy across classes. The training progression of the model is shown in Figure 5, where losses for classification, bounding box regression, and GIoU (Generalized Intersection over Union, an enhanced overlap metric for bounding box regression) decreased steadily across epochs. Training and validation loss curves of the Grounding DINO model for infrared anomaly detection. Classification, bounding box, GIoU, and total losses decrease steadily over 100 epochs, indicating effective learning without overfitting.
The model’s performance improved steadily throughout training, with key detection metrics indicating strong learning behavior. Precision and Recall began around 0.60 and climbed above 0.90 by the 50th epoch, demonstrating increasing accuracy in identifying and capturing true defect regions. The F1 Score also rose consistently, surpassing 0.80 early in training and nearing 0.90 by epoch 70. In parallel, mean Average Precision (mAP) showed a similar trend: mAP@0.5 reached approximately 0.75, while the more stringent mAP@[0.5:0.95] stabilized near 0.65. The Average Intersection-over-Union (IoU) improved from 0.50 to about 0.90, confirming that predicted bounding boxes closely aligned with ground-truth labels. These trends are visualized in Figure 6. Changes in model performance over 100 training epochs, showing improvements in Precision, Recall, F1 Score, mAP, and IoU.
During inference, each raw IRT frame from the bridge inspection was passed through the trained model. Detections were filtered at a confidence threshold of 0.5, converted to the survey’s UTM-17 N coordinate frame, and exported as ESRI shapefiles. These geo-referenced bounding boxes served as waypoints for the MIRA A100 ultrasonic survey, ensuring that volumetric scans were limited to the most critical areas identified by AI. A representative inference output is shown in Figure 7, where green boxes mark the locations flagged as thermally anomalous, with one non-structural false-positive (a pedestrian) removed before ultrasonic follow-up. Left: quantitative performance of the fine-tuned Grounding-DINO detector on the external test set (Precision 0.90, Recall 0.90, F1 0.90, mAP@0.5 0.80). Right: representative infrared frame with model detections; green boxes mark thermally anomalous deck regions, and the single box around a pedestrian represents a non-structural false-positive that is removed before the ultrasonic follow-up stage.
Real-time AI inference
The inference workflow developed in Section 5.1 is embedded directly in the VR environment, transforming the fine-tuned Grounding-DINO detector into an on-demand decision aid that inspectors can invoke interactively while they navigate the thermal model. To avoid duplicating heavy AI code inside the graphics engine, the trained network is hosted in a lightweight FastAPI service that launches automatically when the VR executable starts. At run-time a Unity C# script, Detector.cs, performs a brief handshake with this service, fetching the model signature (input size, class list and default confidence threshold) so that the live inference configuration is guaranteed to match the parameters validated during the model training. All communication occurs over an asynchronous Hypertext Transfer Protocol (HTTP) channel, and the entire AI stack therefore remains decoupled from the rendering loop, preserving frame-rate stability inside the headset.
From the user’s perspective the workflow is straightforward. While examining the geo-referenced infrared layer, the inspector points a handheld controller, presses the trigger, and drags a rectangular region of interest (ROI) across any portion of the deck. The VR client captures that ROI as a PNG, base-64-encodes the image, and posts it (≈30 kB) to the detect endpoint exposed by FastAPI. The server forwards the image through Grounding DINO, filters detections below a 0.50 confidence threshold, and returns the surviving bounding-box coordinates in JSON. Unity instantly converts those pixel coordinates to world space, spawns color-coded outline quads around each thermal anomaly, and logs the prediction bounding boxes, as illustrated in Figure 8. On a laptop equipped only with a mobile CPU (Intel i7-12700H) the full round-trip—from trigger release to on-screen annotation—averages 650 ms, which inspectors perceive as essentially real-time. In this way the detector evolves from an offline post-processor into an interactive companion: inspectors can interrogate any thermal patch they deem, receive AI feedback almost instantly, and either accept the suggestion or redraw a tighter ROI to refine the result. Real-time, in-headset workflow: after the inspector uses their VR controller to draw a Region of Interest (magenta mask) on the live infrared panorama, the embedded Grounding DINO service is called via an asynchronous POST/detect request (green console line). The server returns a 200 OK, and Unity instantly overlays the predicted anomaly boxes (black outlines) within the selected area, confirming end-to-end AI inference and visual feedback inside VR.
Results
Before the full workflow was applied to bridge inspection, the system was validated on a controlled concrete slab with embedded shallow delaminations, as shown in Figure 3.
The study’s goal was to demonstrate an end-to-end, VR-centered inspection pipeline in which AI screening, targeted UT follow-up and multi-modal visualization are delivered in a single immersive session. Results are reported below in the chronological order an inspector would experience them inside the headset; Figures 9–11 illustrate each interaction stage with still frames extracted from the accompanying demonstration video. Model-selection console inside the VR lobby. The user chooses which inspection layer to load by pointing at a thumbnail and pressing the trigger. Context-aware hotspot widgets. AI-flagged deck regions are marked with tags that reveal linked thermal or RGB imagery when touched. On-demand photo pop-up. Selecting RGB IMAGE displays the raw photograph, letting the inspector compare visual texture with the underlying infrared response.
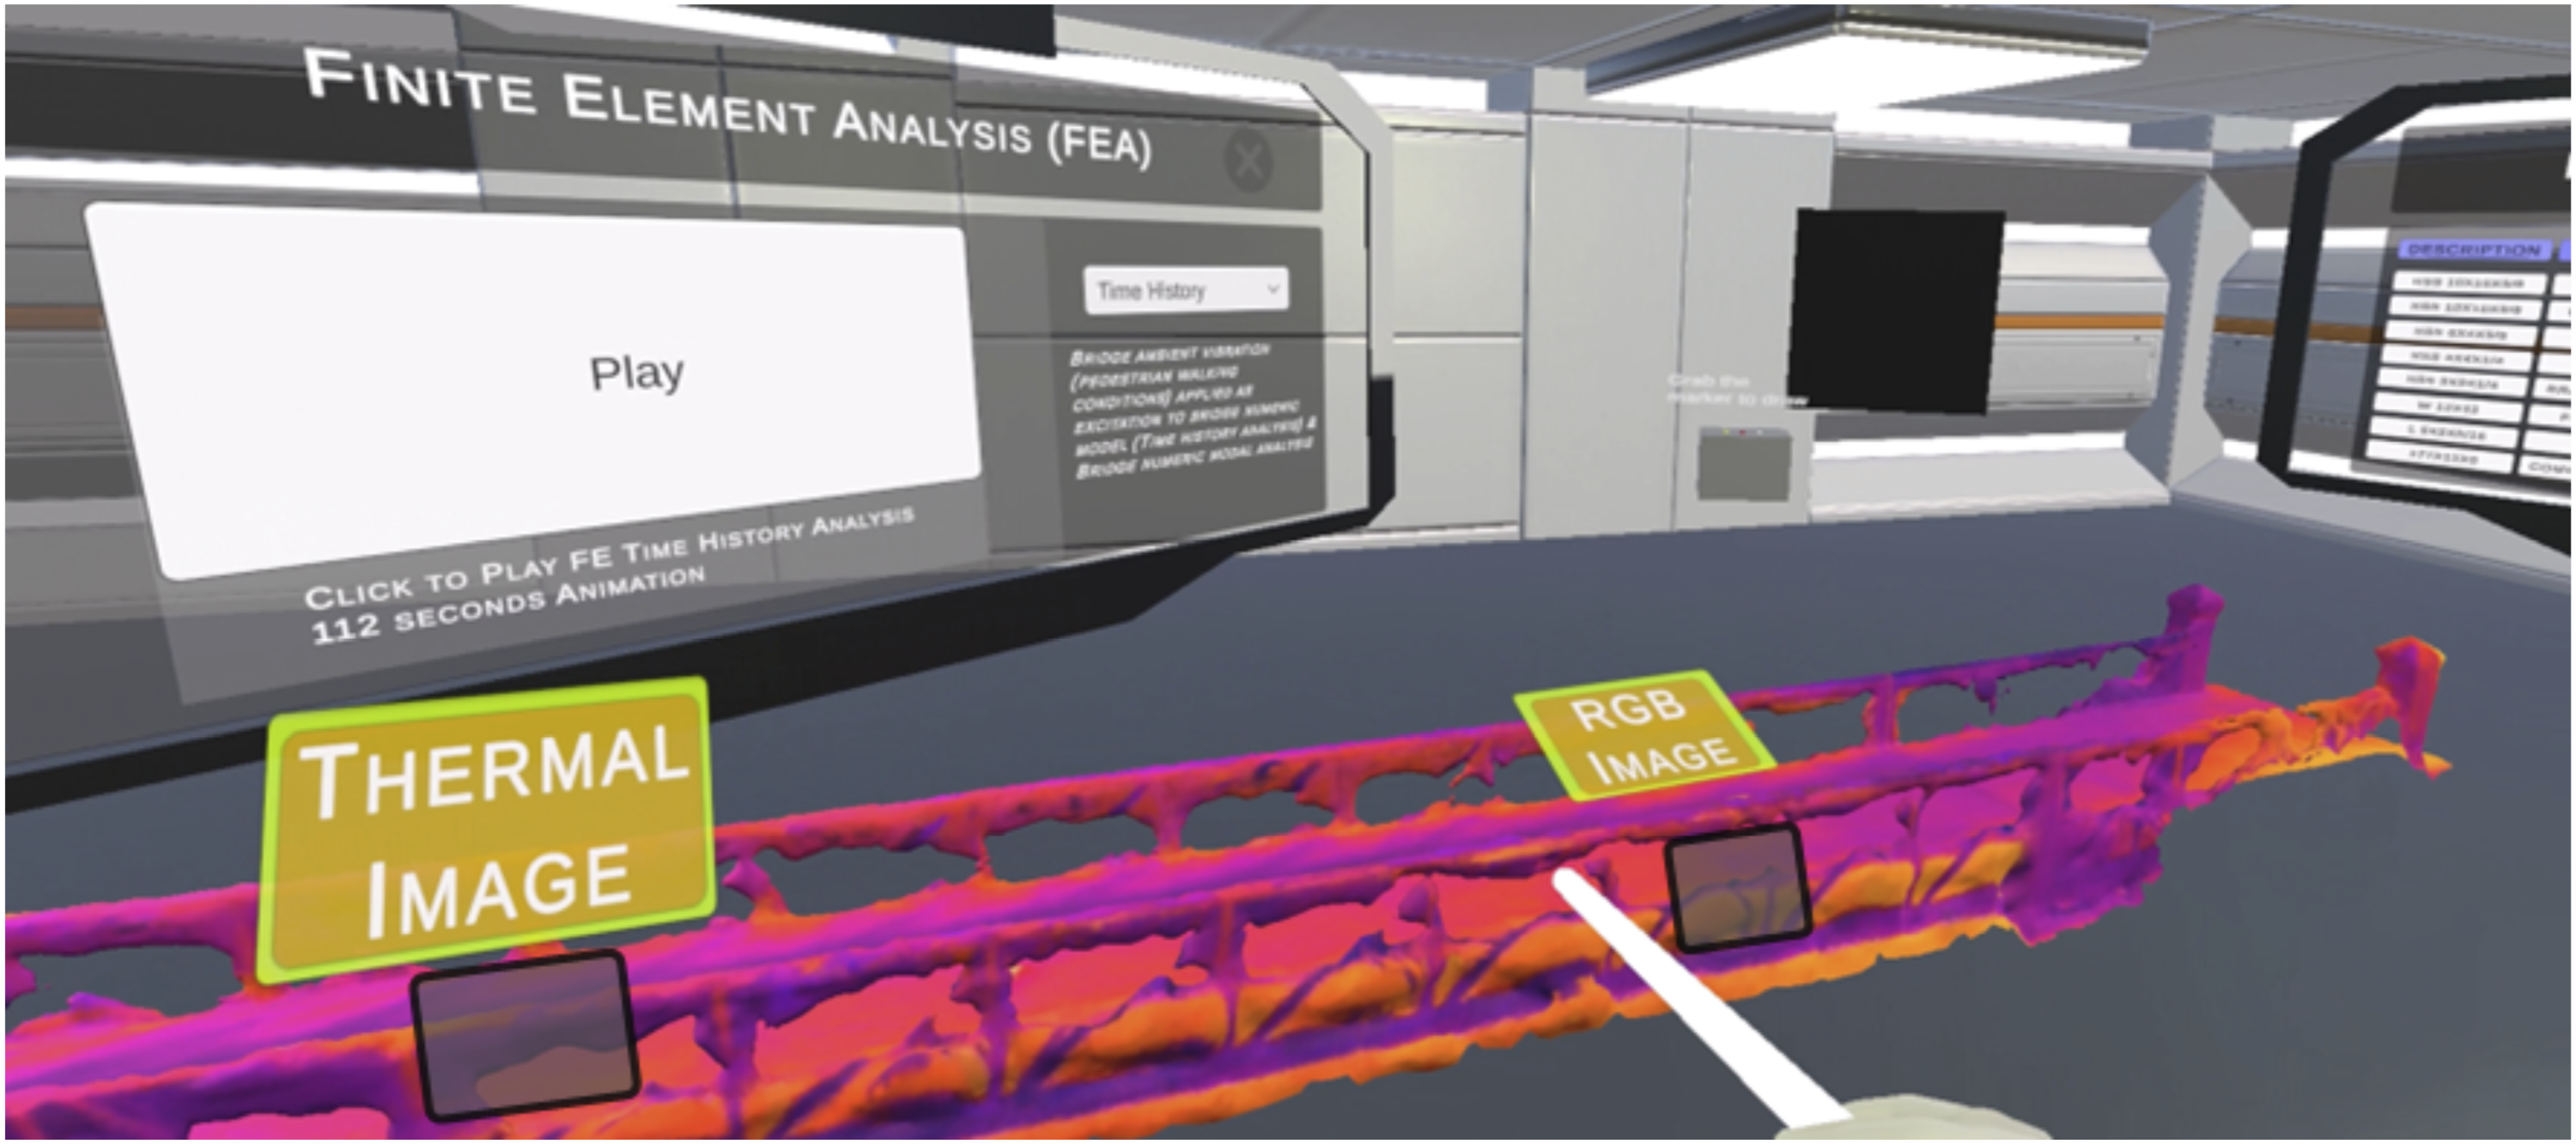

Users begin at a floating “model-selection” dashboard (Figure 9). Each thumbnail represents one of the data layers generated earlier in the workflow—thermal photogrammetry, photogrammetry mesh, LiDAR point cloud, IR-draped point cloud, and the compiled UT volume. A laser pointer emitted from the controller selects a layer with a single click. Tests with the standalone Meta Quest 2 confirmed that all layer’s load in under 3 seconds, after which the scene renders at the headset’s default 72 fps without perceptible judge. No manual alignment is required, because every layer was exported in the same survey coordinate frame during preprocessing.
When the infrared-textured model is loaded, context-aware “hot-spot” widgets appear automatically at every location previously flagged by the Grounding DINO detector (Section 5.3). As shown in Figure 10, hovering over the model reveals thermal image, RGB image and UT image tags that are anchored to the deck surface by their global coordinates. Touching a thermal image or RGB image tag spawns the corresponding inspection photograph on a floating panel (Figure 11). The panel can be resized, pinned, or dismissed with standard VR pinch-and-grab gestures. Informal timing with three test users indicated that raw images appear in 0.8 ± 0.1 s after selection, fast enough to maintain a sense of continuous presence.
Selecting a UT image tag opens the phased-array volume acquired at that exact point (Figure 12). The interface provides three orthogonal B-, C- and D-scans together with a semi-transparent voxel rendering so that depth, lateral extent and reflector amplitude can be judged at a glance. Because each volume was geo-referenced during export, the pop-up is always correctly positioned above the thermal model, making it easy to correlate surface hot spots with subsurface echoes. Evaluators found that the four-view widget reduced the usual back-and-forth between separate UT software and CAD drawings; all verification work could be done in-headset. Depth-resolved ultrasonic panel. A UT image tag opens B-, C- and D-scans together with a voxel view, providing in-situ confirmation of subsurface condition.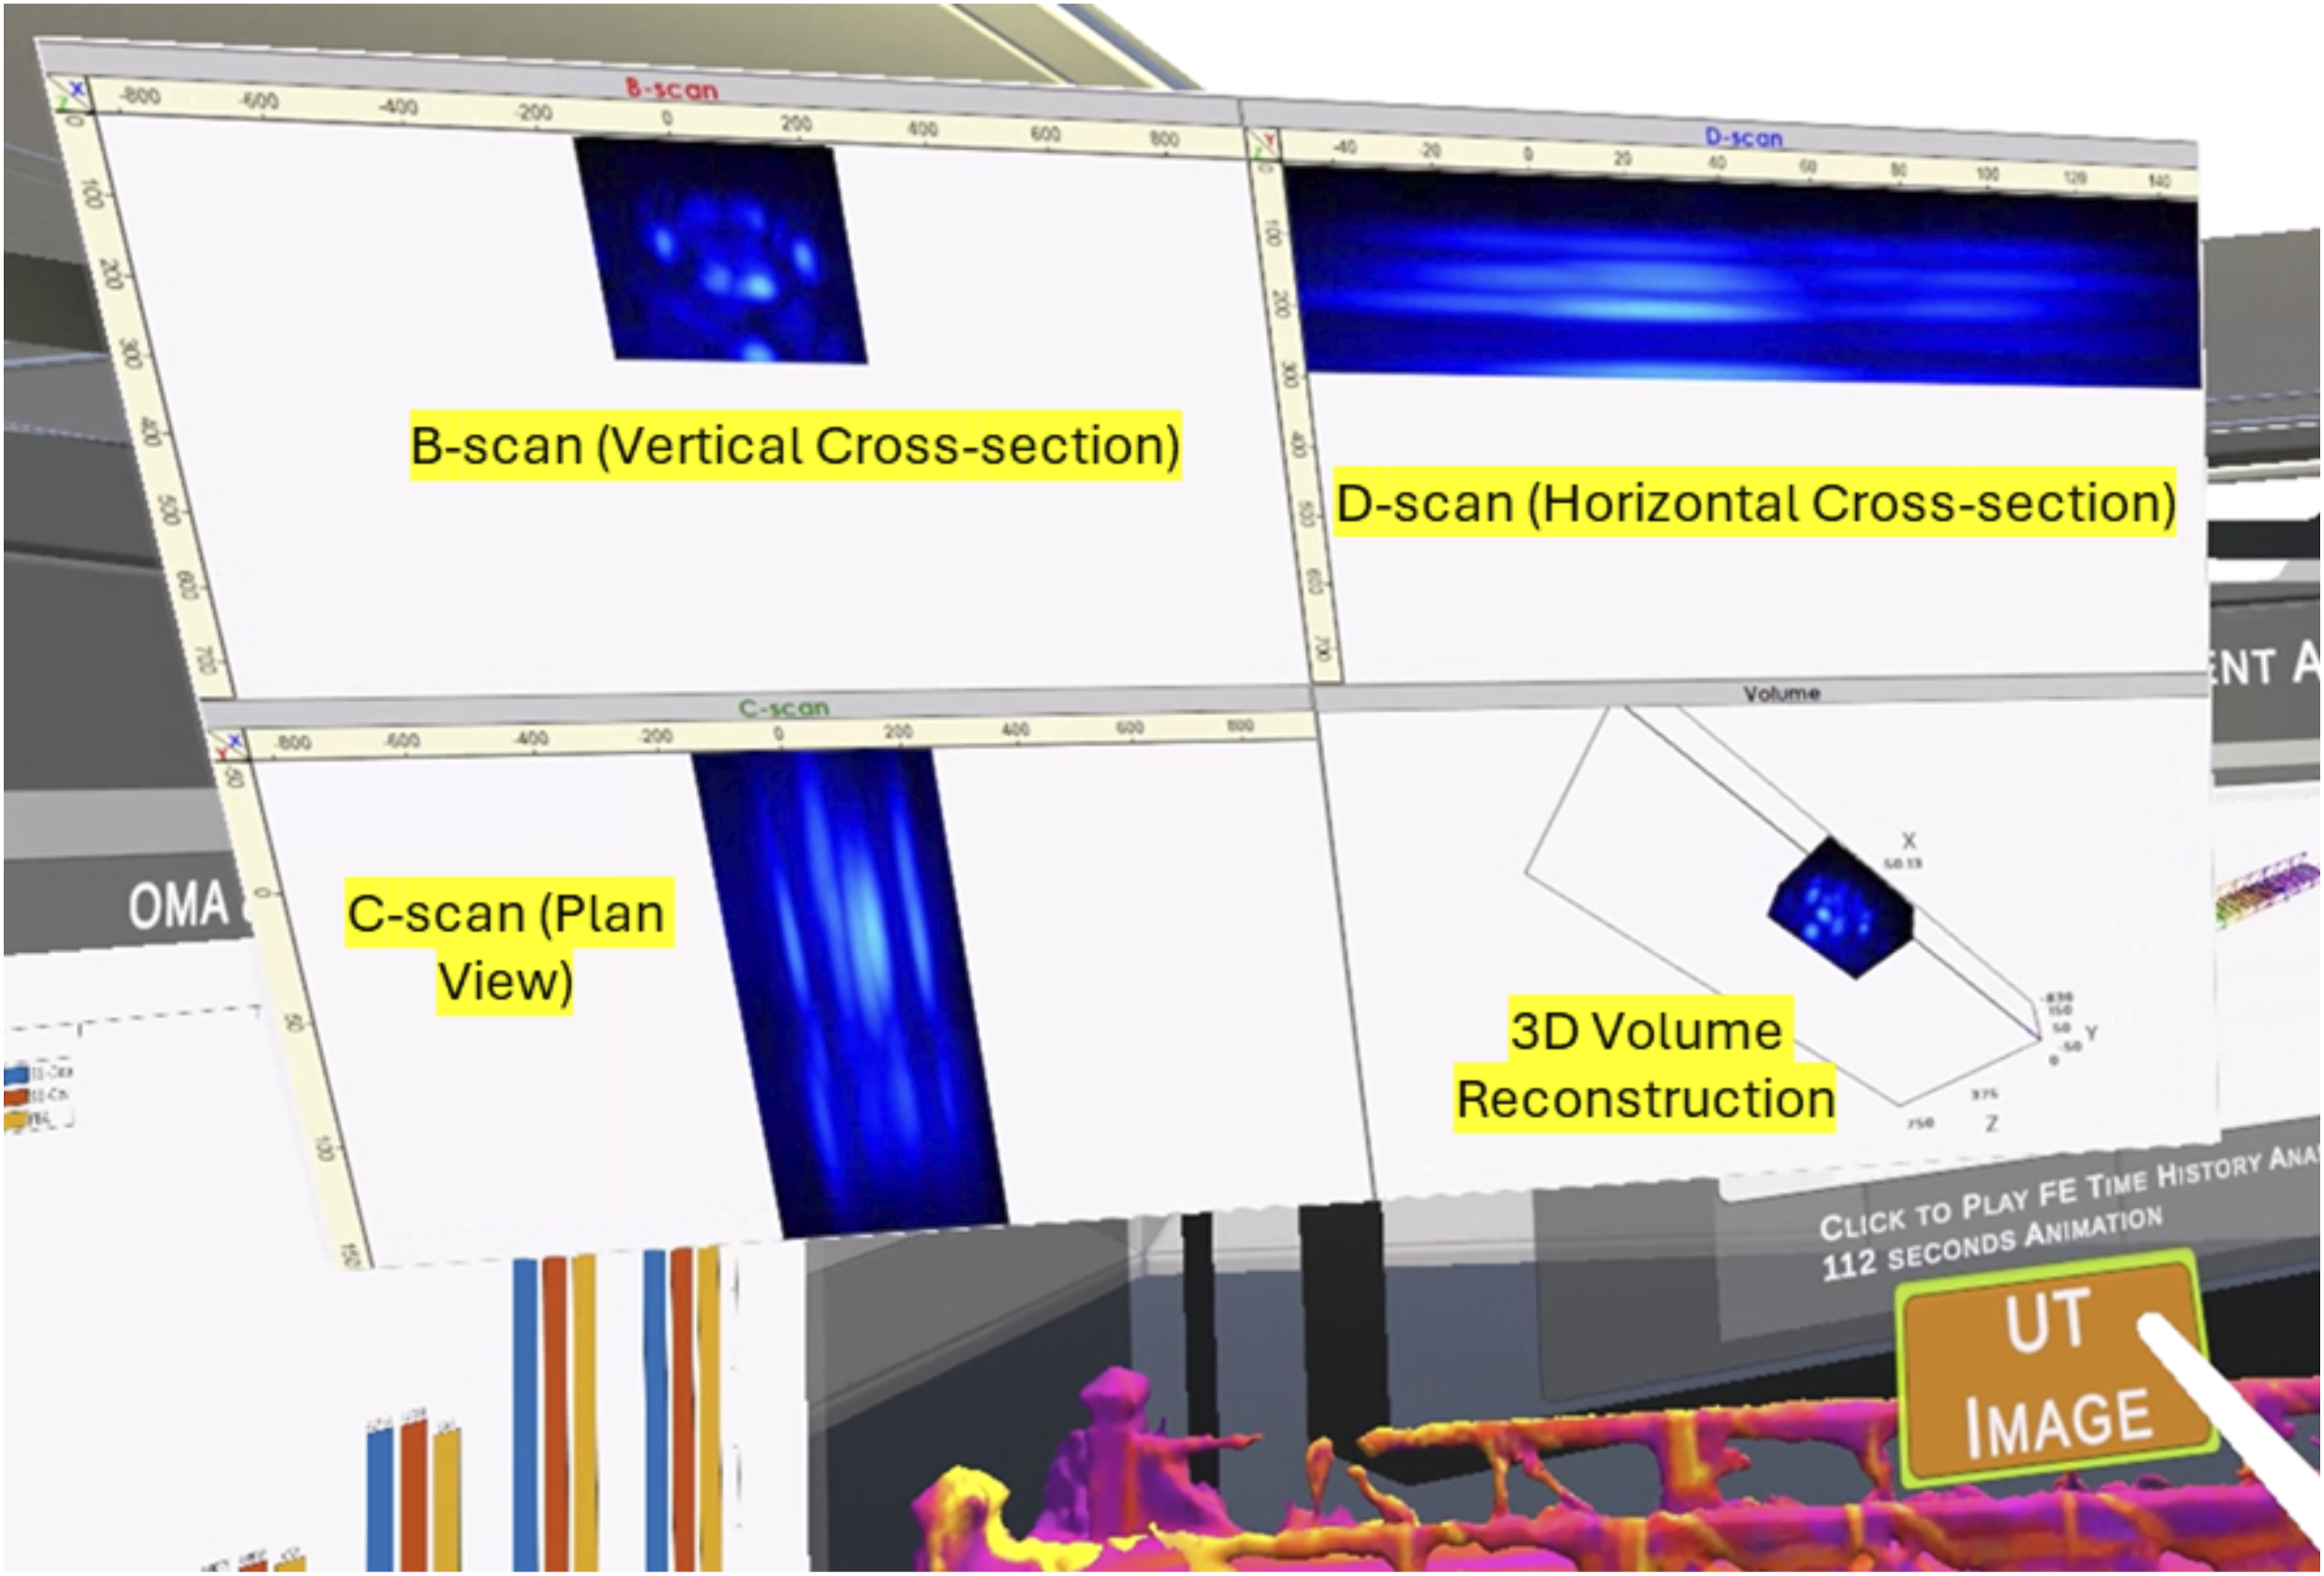
The AI detector’s quantitative performance is summarized in Figure 7 (Precision = 0.90, Recall = 0.90, mAP0.5 = 0.80). While the network occasionally highlighted non-structural elements, for example, a pedestrian visible on the right side of the figure—such false positives were easily dismissed once the linked raw imagery was reviewed. Crucially, every AI-flagged thermal anomaly could be further examined with UT simply by selecting its corresponding UT image tag, eliminating the need for grid-based scanning. This targeted strategy avoided scanning large intact regions of the deck, with exact time savings to be quantified in future field deployments.
To further assess the model’s robustness, IRT images were evaluated under a range of lighting and temperature conditions, including both daytime and nighttime captures. Despite these variations, the Grounding DINO model consistently localized relevant anomalies with high accuracy. As shown in Figure 13, the predicted bounding boxes align closely with expert-verified ground truth in most cases. Occasional false positives or missed detections appear in low-contrast regions, but overall results demonstrate strong generalization and localization performance. These visual results support the model’s practical use for real-world IRT screening, even under variable environmental conditions. Representative AI detection results on infrared thermographic images. The outputs are split into two groups (left and right) for readability only, with both sets showing examples of anomalies detected by the fine-tuned Grounding DINO model across different imaging conditions. Most anomalous regions were successfully identified, while occasional false positives and missed detections are highlighted where present.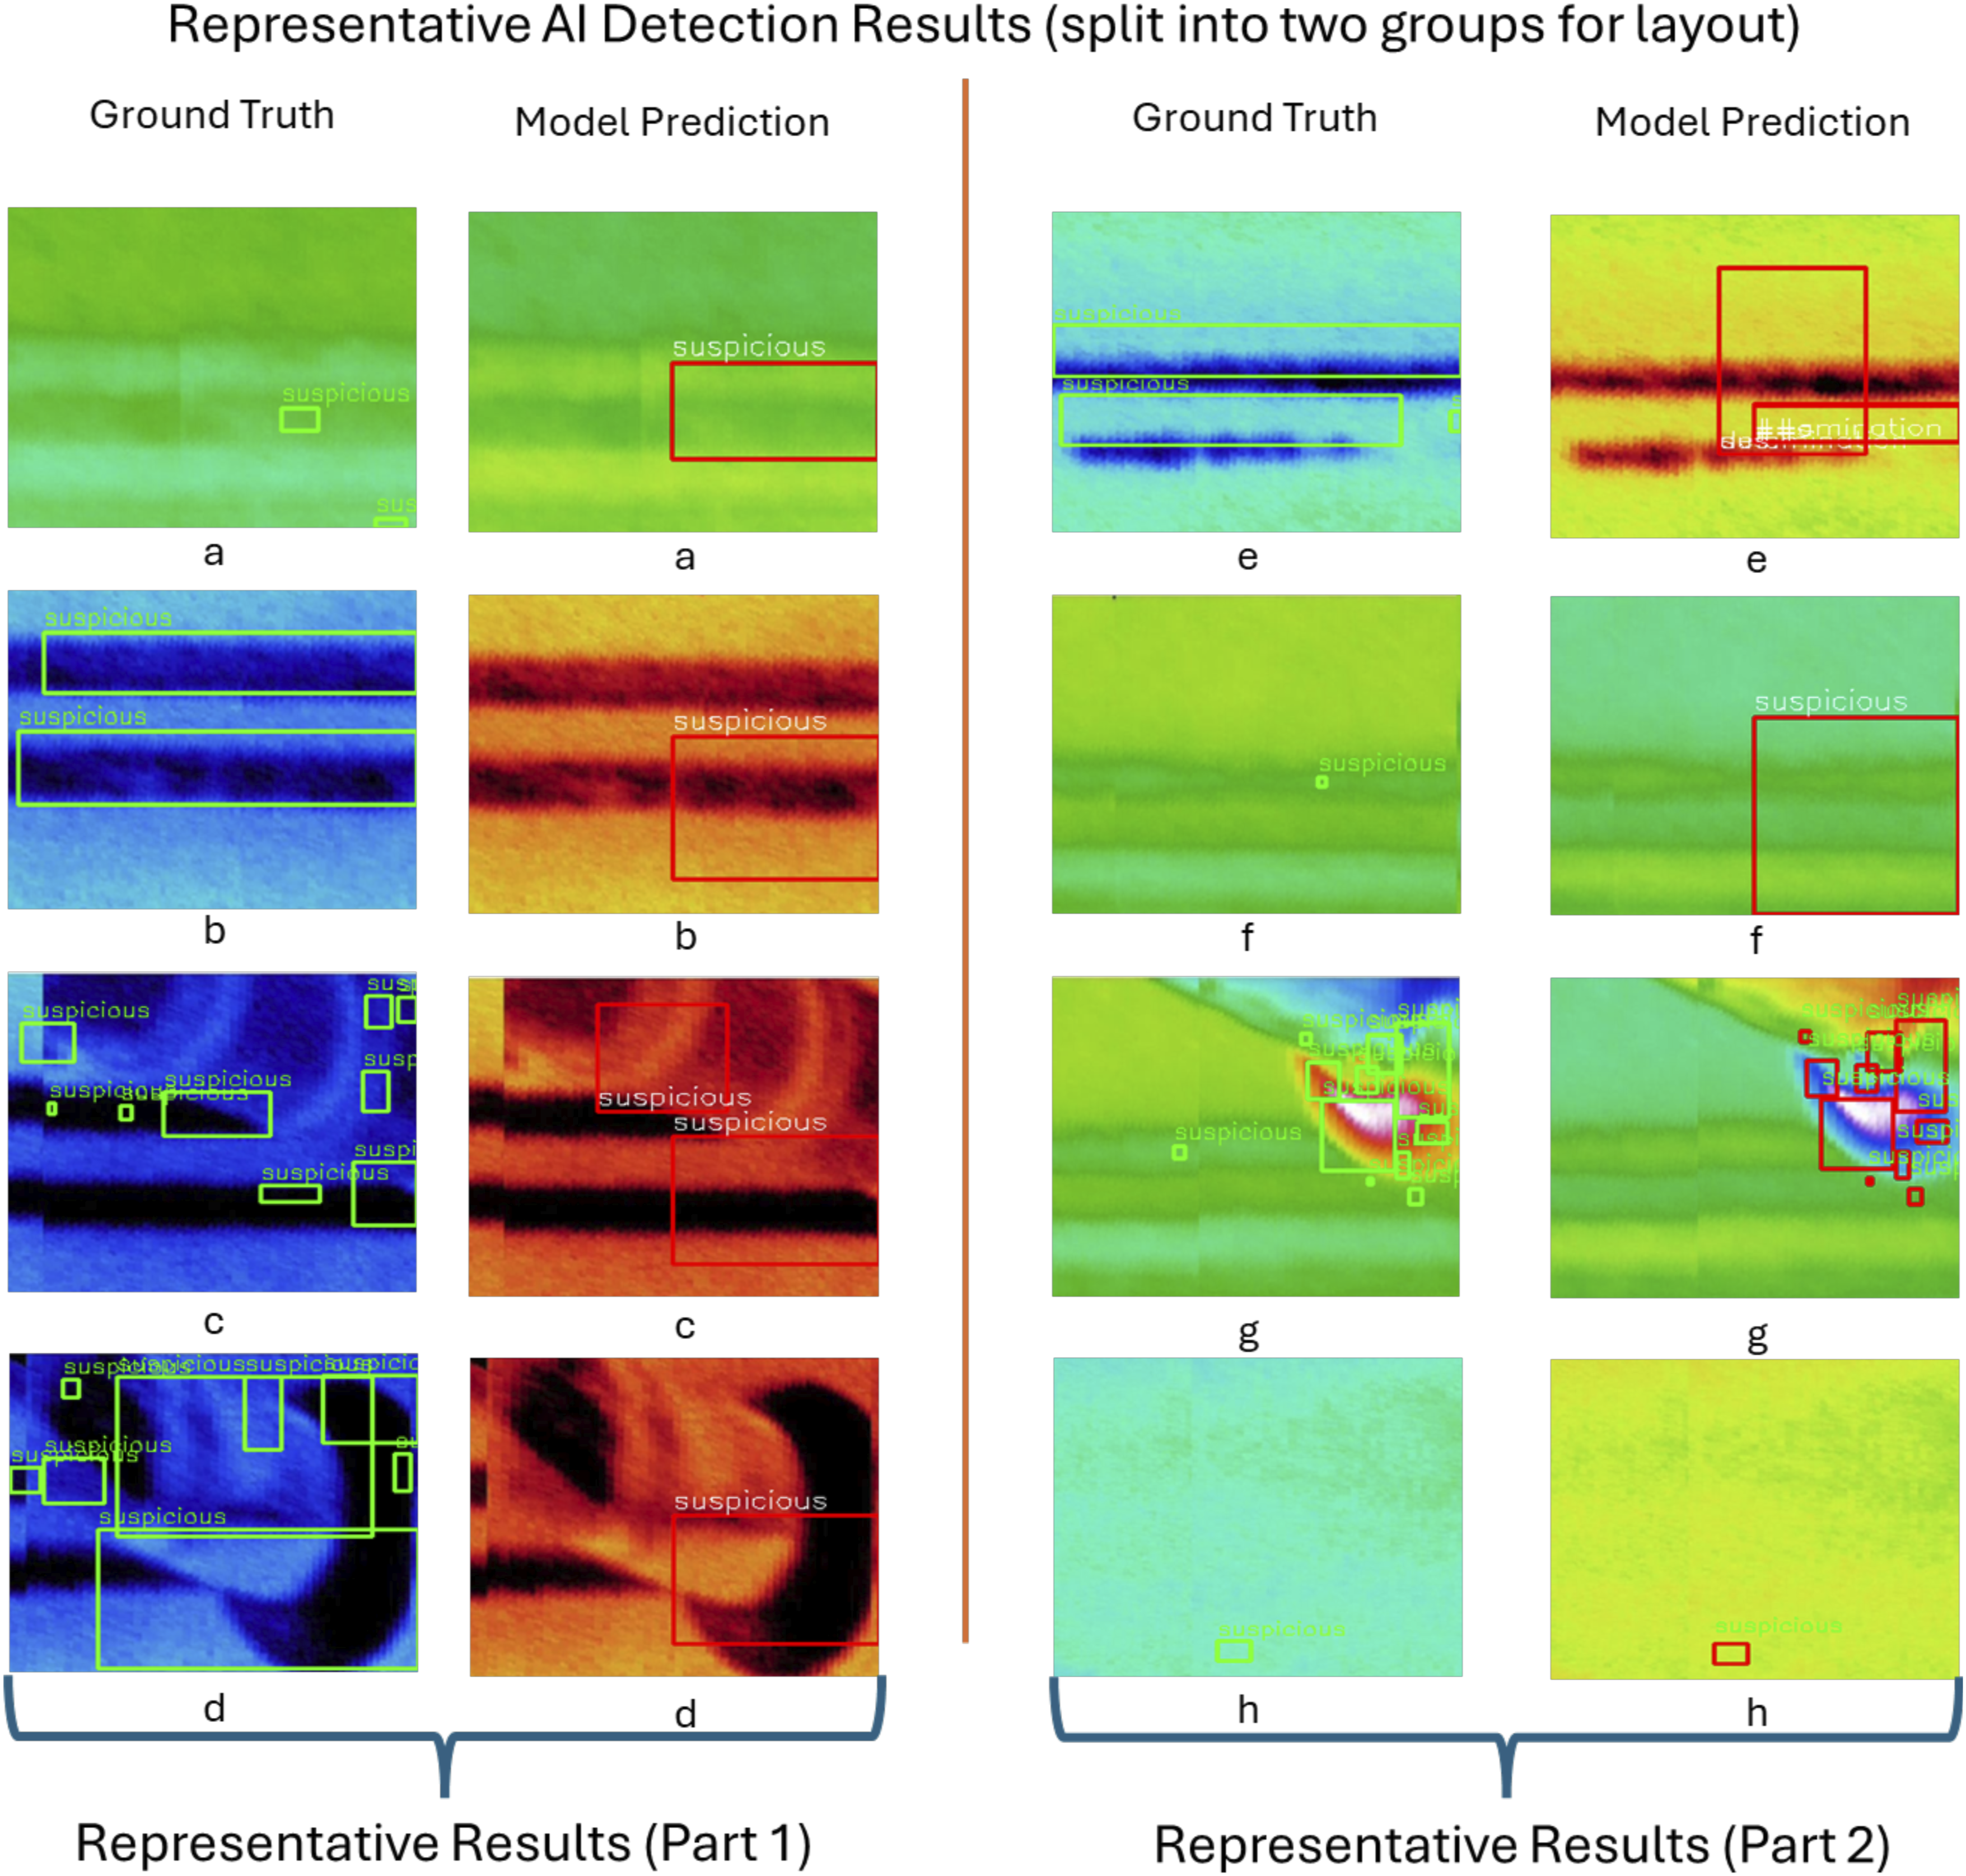
Overall, the demonstration confirms the feasibility and practicality of delivering AI-guided IRT review, selective UT, and multi-layer 3D visualization in a headset. All participants reported that the spatial co-location of photographs, infrared gradients and UT slices improved their confidence in defect interpretation compared with dual-monitor workflows. A controlled user study with practicing bridge inspectors is planned to measure task-completion time, cognitive load and decision accuracy in a larger cohort.
Discussion
The immersive inspection workflow lets inspectors and engineers stand in the same virtual scene, switch instantly among the RGB mesh, LiDAR surface, infrared texture and ultrasonic scans, and decide—together—whether a location needs repair. The Grounding DINO detector operates only on the infrared layer; by clicking or drawing a box on that surface, users ask the network to mark “suspicious” spots that deserve closer study. Those marks guide the MIRA A100 scanner, so ultrasonic effort is limited to a small subset of the deck while every confirmed delamination or void is still captured. Because the linked RGB frame and depth-resolved UT slices open at the exact coordinates of each hot spot, surface clues and subsurface echoes are compared without leaving the headset or aligning separate files. Early demonstrations showed that this tight coupling reduced the time to confirm a defect from several minutes on a dual-monitor setup to about 1 minute in-headset, and it allowed teams to discuss findings while looking at the same evidence.
However, several challenges remain: • The detector recognizes only infrared patterns that resemble delamination or voids; cracks, corrosion and small spalls remain a manual task. • Ultrasonic volumes are displayed raw; an additional model that classifies UT reflections would improve consistency. • All data are pre-processed; live streaming from the UAV and the UT device is not yet supported. • Headset annotations are stored locally and are not linked to an agency database, so inspection history is hard to track. • Results come from one bridge and a small user group; wider testing is needed to measure time savings and decision accuracy.
Looking ahead, future work will focus on the following directions: • Develop a dedicated AI model for UT data to classify reflector patterns automatically and provide objective depth and severity estimates. • Conduct a structured survey and task-based study with experienced bridge inspectors to measure usability, decision confidence, and overall satisfaction with the immersive system. • Extend AI coverage to cracks and corrosion, enable real-time data ingestion, and link annotations to a cloud-hosted asset model to build a complete digital record across inspection cycles.
Conclusions
This study presented and demonstrated an end-to-end inspection workflow that fuses UAV-based LiDAR, photogrammetry, IRT, and phased-array UT inside a single virtual-reality scene. The approach keeps all data layers in a common coordinate frame, applies a fine-tuned Grounding DINO network to highlight thermally suspicious deck regions, and limits ultrasonic scanning to those AI-flagged locations. In the prototype deployment the detector achieved mAP0.5 = 0.80, Precision = 0.90, and Recall = 0.90, while the VR interface let users switch instantly among surface texture, geometry, thermal gradients, and depth-resolved UT slices. Informal trials on one bridge showed that defect verification could be completed in about 1 min per hotspot—considerably faster than the traditional monitor-based workflow—and that stakeholders preferred discussing findings while viewing the same three-dimensional evidence.
The main contribution is therefore a practical blueprint for integrating rapid remote sensing, AI-guided anomaly screening, targeted UT confirmation, and immersive visualization into one coherent pipeline. By reducing full-deck ultrasonic coverage to a set of AI-prioritized waypoints and by co-locating all inspection media in VR, the method addresses long-standing bottlenecks in data volume, spatial registration, and cross-disciplinary communication.
Several challenges remain to be addressed and solved. The detector is tuned only for infrared data; ultrasonic volumes are displayed without automated interpretation. Future work should focus on training an AI model to help inspectors analyzing the UT images and running a structured survey with experienced inspectors to measure usability and decision accuracy. These extensions, together with database synchronization for annotations, will move the workflow toward a fully digital-twin platform for routine bridge management.
Footnotes
Acknowledgments
The authors thank the technical team that supported the acquisition and processing of infrared and high-definition imagery, and the members of the Civil Infrastructure Technologies for Resilience and Safety (CITRS) Research Initiative at the University of Central Florida for their essential assistance. The views expressed are solely those of the authors and do not necessarily reflect those of any collaborators or funding agencies.
Funding
The authors received no financial support for the research, authorship, and/or publication of this article.
Declaration of conflicting interests
The authors declared no potential conflicts of interest with respect to the research, authorship, and/or publication of this article.