
Abstract
The structural integrity of reinforced concrete (RC) bridges is critical to the safety and functionality of transportation infrastructure. This paper presents a field investigation of steel-based strengthening methods for rehabilitating deteriorated RC T-beam bridges, encompassing transverse, shear, and flexural enhancements. Static load testing using four dump trucks was conducted to evaluate the performance of strengthening methods. Finite element (FE) models were developed to analyze structural behavior and complement the experimental investigation. The results show that the transverse strengthening successfully improved transverse load distribution across the beams. A detailed investigation was conducted on three flexural strengthening methods designed to reduce deflection. The steel channel strengthening (SCS) method proved to be the most effective in improving stiffness of the beams, compared to the cover plate strengthening (CPS) and the steel truss strengthening (STS) methods. The SCS method reduced the maximum mid-span deflection by up to 50.7% compared with the unreinforced condition, outperforming the CPS (17.5%) and SCS (19.5%) methods. Strain distribution analysis confirmed effective composite action for the CPS and SCS approaches, whereas the STS method exhibited incomplete composite behavior. The results highlight that achieving effective composite behavior between the strengthening system and the existing concrete member is a governing factor for strengthening performance. Parameter analysis demonstrates that the 16B channel used in SCS practical application provides a cost-effective option. The findings validate the steel-based strengthening methods for deteriorated RC bridges and provide practical guidance for field applications.
Keywords
Introduction
A significant number of reinforced concrete (RC) bridges worldwide are experiencing deterioration due to various factors, including increased traffic loads, environmental conditions, and material aging (ASCE, 2025). Many of these bridges have been in service for over 30 years, during which the volume and weight of traffic have surged significantly beyond the original design specifications. This increase in traffic imposes excessive stress on the structural components, potentially leading to damage (Klym et al., 2025). Additionally, exposure to moisture and temperature fluctuations accelerates the degradation of both concrete and steel reinforcement (Nasr et al., 2021). The natural aging process of construction materials, such as concrete and steel, results in a gradual reduction in strength and durability (Zhang et al., 2022).
The deterioration of RC bridges is typically characterized by various forms of structural damage that compromise their integrity (Enright and Frangopol, 2000). For T-beam bridges, vertical and diagonal cracks are commonly observed in the webs, indicating areas of significant stress. Longitudinal cracks frequently appear near the transverse deck joints. This cracking issue is further exacerbated by spalling, where pieces of concrete detach from the surface, and corrosion of the steel reinforcement, which reduces the cross-sectional area and strength of the steel components. In addition, the steel plates that connect the diaphragms of two adjacent T-beams often show signs of deterioration (Yao and Xu, 2010). This combination of cracking, spalling, and corrosion necessitates rehabilitation and strengthening strategies to ensure the long-term safety and functionality of the bridges.
The deterioration and strengthening demand of reinforced concrete T-beam bridges should be understood in the context of historical design standards. In China, a large number of prefabricated RC T-beam bridges constructed from the 1970s to the 1990s were designed using standard drawings developed under economic and material constraints. Early standard designs emphasized economical member dimensions, reinforcement layouts, and simplified transverse connections, which limited redundancy and constructability. As a result, many bridges have exhibited widespread structural cracking and durability-related damage after decades of service. Subsequent standard drawings introduced improvements, such as increased member dimensions, enhanced reinforcement ratios, and cast-in-place deck connections, while transverse diaphragms were still connected using embedded steel plates and welding, which remained sensitive to construction quality. Although these revisions improved overall stiffness and load-carrying capacity, they did not fully eliminate long-term cracking and durability issues under increasing traffic demands. In contrast, modern Chinese bridge design codes adopt limit-state design concepts and provide comprehensive provisions for the design of new reinforced concrete bridges, comparable to international frameworks such as AASHTO LRFD and British practice transitioning from BS 5400 to Eurocode-based design.
Given the crucial role that RC bridges play in transportation infrastructure, there is an increasing need for effective strengthening methods to ensure their longevity and safety. Various approaches have been proposed to address the degradation of these bridges, including the use of fiber-reinforced polymer (FRP) and steel plates. Recent research has focused significantly on the performance of FRP strengthening methods, leading to numerous practical applications (Allawi et al., 2023; Hu et al., 2020; Majeed et al., 2017; Siddika et al., 2020). Despite the advanced mechanical properties of FRP for strengthening concrete bridges, steel strengthening methods continue to be widely used (Grayson-Wallace et al., 2022; Tang et al., 2020). This preference is primarily due to the cost-effectiveness and proven long-term performance of steel (Jumaat and Alam, 2006). Steel is often more affordable, both in terms of material costs and the labor required for installation. Additionally, the long-term reliability of steel and the availability of comprehensive design codes make it a reliable choice for retrofitting and strengthening RC bridges.
Extensive research efforts have been devoted to strengthening RC beam structures using steel members. This strengthening scheme aims to create a composite section by achieving a bond between the steel members and the concrete, thereby allowing the bonded steel members to act as additional reinforcement (Adhikary et al., 2000). Peng et al. (2017) conducted experimental studies on the mechanical behavior of corroded RC beams strengthened with steel plates, finding that steel plate strengthening significantly improves the strength and ductility of corroded beams, with the ultimate load increasing as the thickness of the steel plate increases. Aykac et al. (2013) conducted an experimental study to investigate the flexural behavior of RC beams strengthened with external steel plates. Their results showed that steel plate anchorage through bolts or side plates significantly improved the load-carrying capacity and ductility of the beams, with perforated plates proving to be especially effective in enhancing ductility and preventing premature plate peeling. There are also various approaches to shear strengthening using external steel plates, such as attaching a continuous horizontal plate along the entire length of the beam, applying it only over the critical shear span, or bonding vertical or inclined strips (Grayson-Wallace et al., 2022). Altin et al. (2005) demonstrated that external bonding of steel plates to RC beams significantly enhances their shear capacity, strength, and stiffness, without any noticeable reduction in ductility. Wang et al. (2018) proposed a simplified design method for the shear capacity of RC beams strengthened with steel plates, which enhances the shear capacity while addressing the common failure mode of peeling at the interface between old and new concrete. Transverse strengthening can also be achieved by steel members through various configurations. Chen et al. (2021) analyzed the parameters influencing the effectiveness of diaphragm transverse connections in strengthening concrete T-beam bridges, including installation location, brace thickness, T-girder height, and spacing, and provides design recommendations for optimal performance. Wang et al. (2017) assessed transverse connectivity in simply supported girder bridges and developed a four-step strengthening strategy involving steel grid reinforcement. It can be known from these laboratory investigations that externally bonded or bolted steel plates can significantly enhance flexural strength and stiffness, although premature debonding, plate peeling, or reduced deformation capacity may occur when composite action is insufficient (Arslan et al., 2008; Su and Zhu, 2005).
However, previous research has been mostly limited to laboratory studies on RC components under controlled conditions. These laboratory investigations may not adequately reflect the actual performance of strengthening methods when applied to aged bridges that have experienced long-term service loading and environmental deterioration. Additionally, few field studies have systematically compared different strengthening schemes on actual bridge structures. Field testing under real-world conditions, in contrast, could provide deeper understanding of how these strengthening techniques perform (Lantsoght et al., 2017; Zhou et al., 2020). To address this gap, the present study conducts an in-situ comparative evaluation of three steel-based strengthening schemes on an existing reinforced concrete T-beam bridge using field load testing combined with finite element analysis.
This research aims to validate the effectiveness of various strengthening strategies using steel members for a multi-span bridge with spans of similar geometry and material properties. To increase transverse stiffness, the flanges and diaphragms between the T-beams were partially recast. To address insufficient shear capacity, diagonal steel plates were installed on the web of the T-beam. For flexural reinforcement, three different strengthening methods were examined and compared. The first method involved installing steel cover plates to the bottom side of the T-beams. The second method built upon the first by adding two steel channel sections to the steel cover plate. The third method enhanced the stiffness and load-bearing capacity by installing a steel truss beneath the web of the T-beams. Bridge load tests were conducted to verify the effectiveness of these strengthening strategies and compare the performance of the three flexural strengthening methods. Field static load testing is particularly useful for identifying issues that cannot be easily resolved through visual inspection or simple analysis and can reveal problems that may not be detected in laboratory tests.
The rest of paper is organized as follows. The Bridge description section describes the representative bridges strengthened by different schemes. The Load testing section covers the load testing procedure and the measurement setup. The Finite element model section presents finite element analysis of the tested bridges. The Results and discussion section discusses the experimental testing and numerical simulation results. In the end, the Conclusion and future work section provides a summary and future work.
Bridge description
General features of the bridge
The bridge examined in this study is a multi-span reinforced concrete (RC) bridge with each span measuring 20 m in length. As shown in Figure 1, each span comprises six prefabricated T-beams spaced at 1.6 m intervals, with a 13.5 cm wearing course and a total bridge width of 11.05 m. According to the original design drawings, the concrete compressive strength of the T-beams was C23, corresponding to a cube compressive strength of Cross section of the test bridge (unit: mm).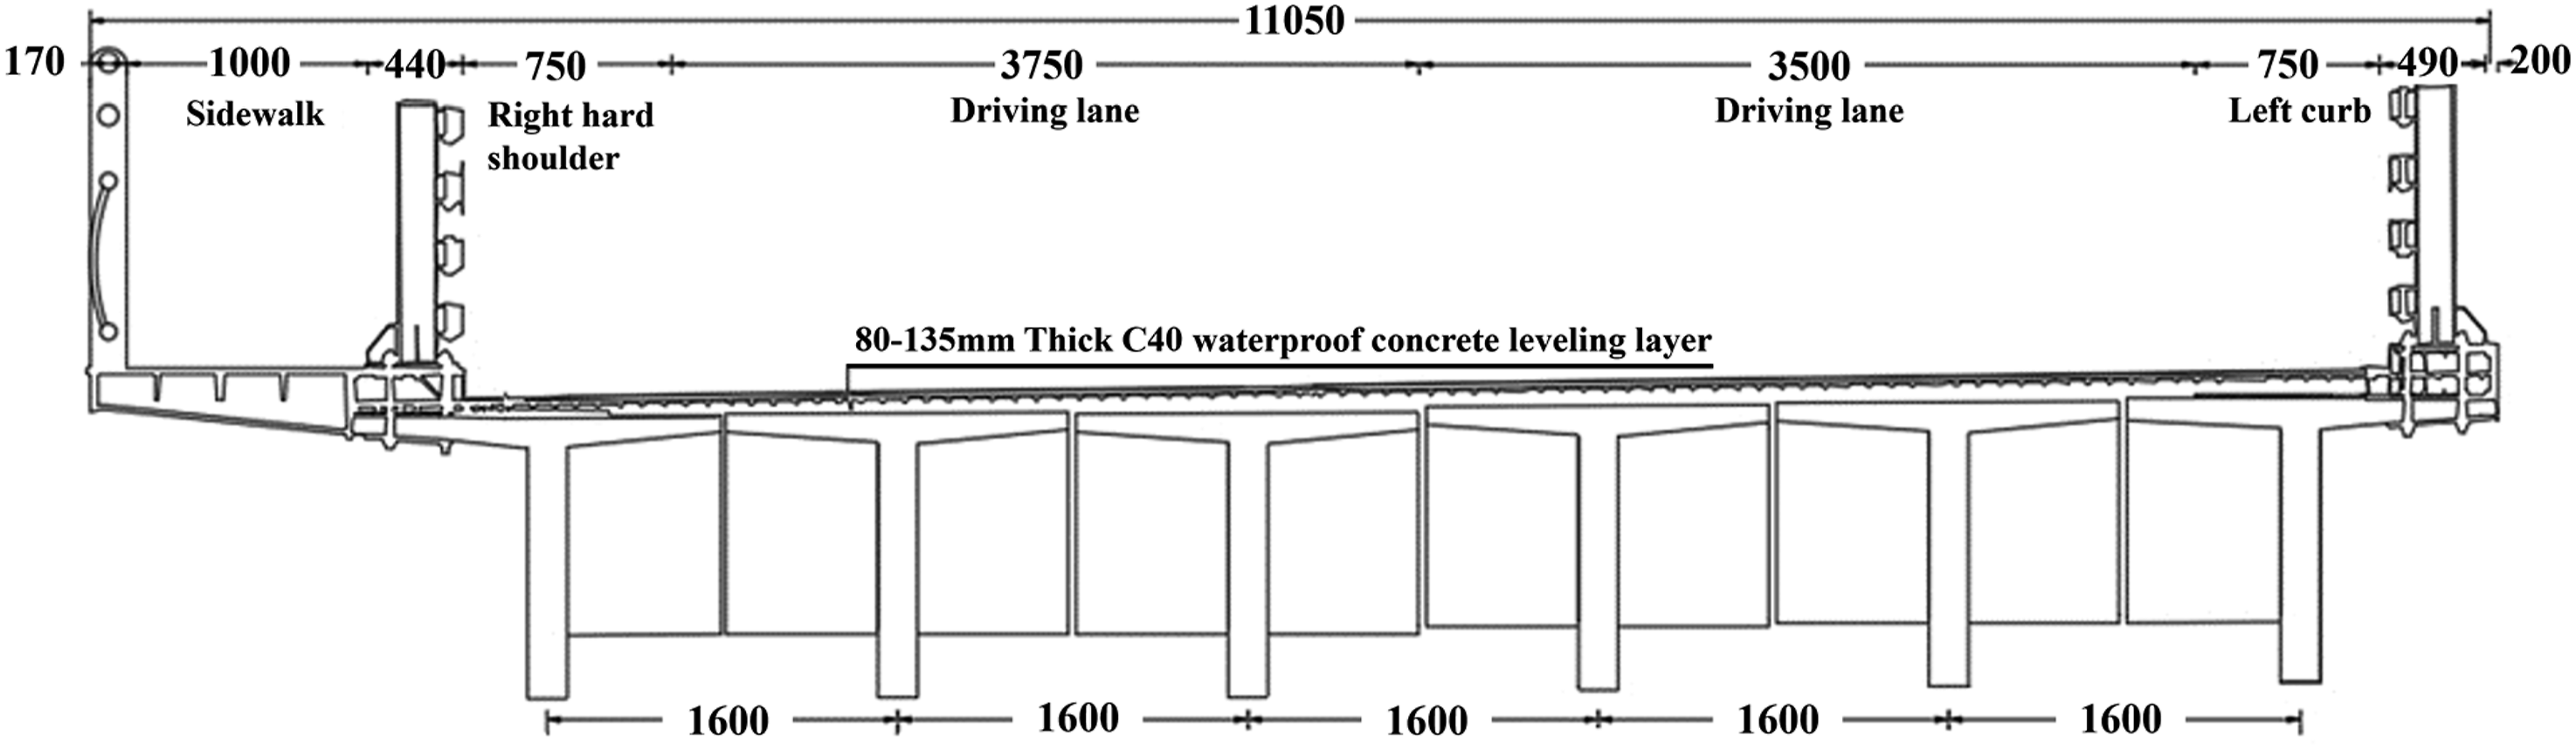
This bridge is representative of prefabricated reinforced concrete T-beam bridges constructed in China during the 1970s to 1990s. According to “General Code for Design of Highway Bridges and Culverts” (JTJ 021-1989), live loads were defined using vehicle convoys. These convoy-based live load levels were classified as Vehicle-10, Vehicle-15, Vehicle-20, and Vehicle-Super 20, among which Vehicle-Super 20 was widely adopted as the design standard for expressway bridges in many regions. The Vehicle-Super 20 convoy consists of multiple axles with prescribed axle loads and spacings, as illustrated in Figure 2(a). With the implementation of “General Code for Design of Highway Bridges and Culverts” (JTG D60-2004), the previous convoy-based live load model was replaced by Highway Class I and Highway Class II loads. In this framework, live loads are represented by a combination of lane load and vehicle load. The lane load consists of a uniformly distributed load and a concentrated load (as shown in Figure 2(b)), and is primarily used for global structural analysis, while vehicle loads are employed for local checks. In the subsequent “General Specifications for Design of Highway Bridges and Culverts” (JTG D60-2015), the Highway Class I and Class II live load system was retained. For Highway Class I loading, the characteristic value of the uniformly distributed lane load remains Live load models (unit: m, kN) (a) Convoy-based live load model (b) Lane load model.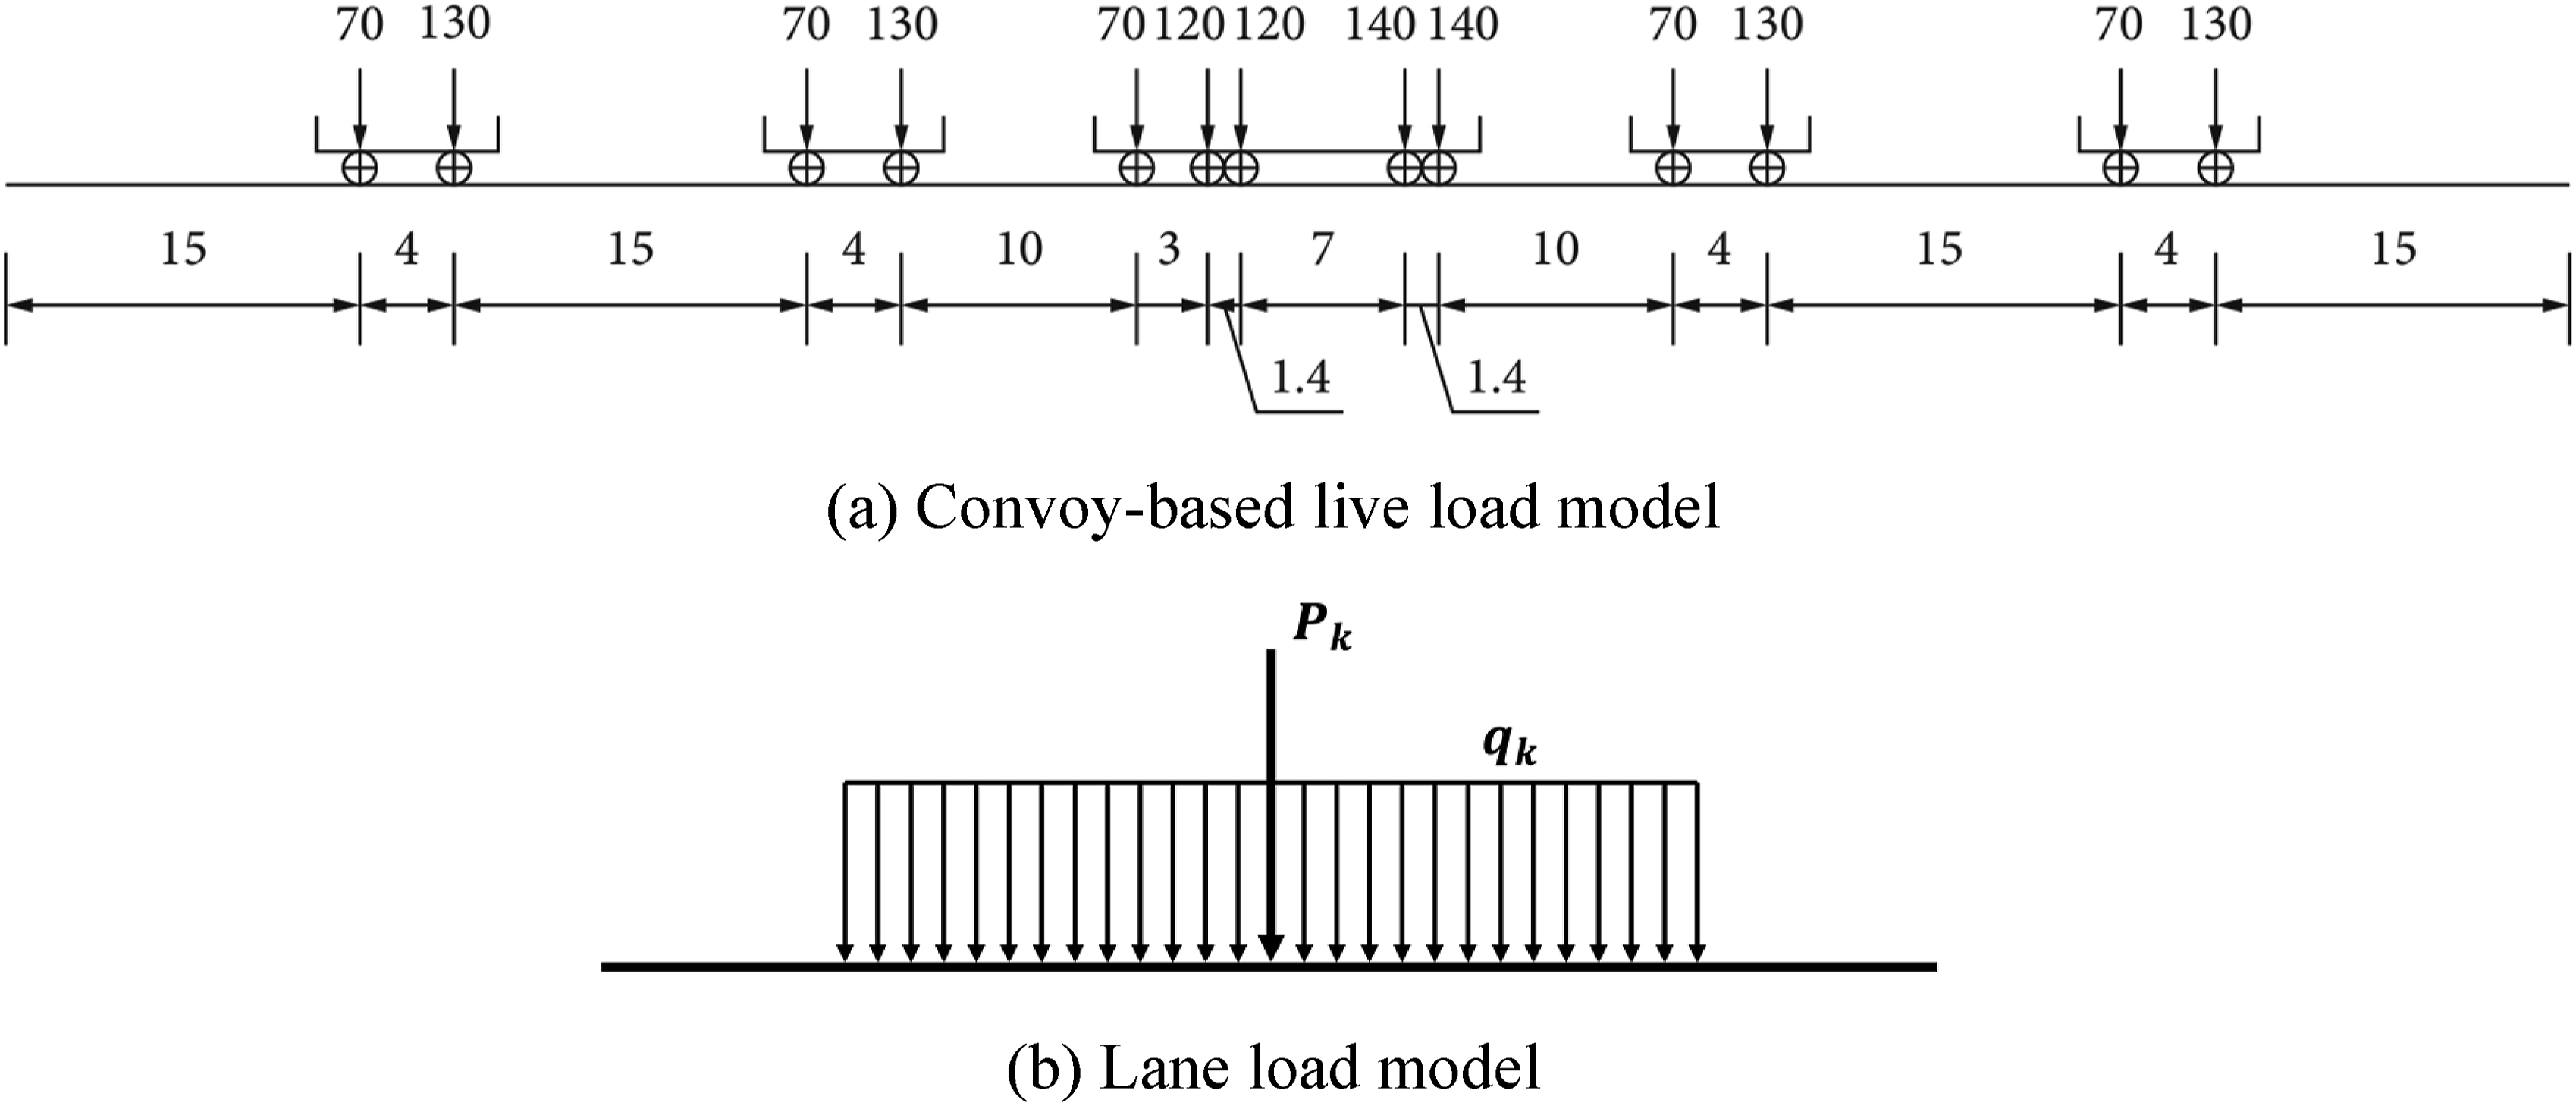
Due to the combined effects of increased traffic loads and environmental deterioration, the aging bridge has sustained various forms of damage that have led to reduced structural capacity. A comprehensive visual inspection was conducted to assess the structural condition of the bridge. The inspection revealed typical damage patterns including beam cracking, spalling in the flanges, and deterioration of transverse joints and diaphragms.
The most prevalent damage observed was extensive vertical and diagonal cracking in the T-beam webs. Vertical cracks were predominantly located within the middle half of each span (from one-quarter to three-quarters of the span length), while diagonal cracks were concentrated near the supports, extending to approximately one-quarter of the span length and exhibiting a regular spacing pattern. A significant proportion of these web cracks propagated through to the bottom surface, forming characteristic L-shaped and U-shaped crack patterns (Figure 3(a)). The frequency of web cracking has increased over time, with extending cracks observed near previously sealed locations. Most cracks extended through the full web height. Longitudinal cracks were also observed in the webs (Figure 3(b)), primarily occurring along the longitudinal reinforcement. Such cracking patterns are commonly associated with reinforcement-related deterioration mechanisms, including corrosion-induced expansion. These longitudinal cracks showed a higher occurrence rate in the exterior webs. The observed crack patterns indicate that the original T-beam design is inadequate for current traffic demands, with insufficient reinforcement cover leading to poor durability and widespread steel corrosion. It should be noted that no electrochemical corrosion measurements (e.g., half-cell potential tests) or chloride/carbonation analyses were conducted; therefore, the corrosion assessment is qualitative in nature. Typical damage patterns of the bridge (a) U-shaped crack at the web (b) Longitudinal crack at the web.
To provide a more intuitive illustration of the typical crack patterns, a representative crack distribution map for an individual reinforced concrete T-beam is presented, as shown in Figure 4. The map summarizes the observed locations of major vertical and diagonal web cracks along the beam span. Vertical cracks are mainly distributed within the mid-span region, while diagonal cracks are primarily concentrated near the beam ends. Several vertical cracks extend to the bottom surface, forming characteristic L-shaped or U-shaped crack patterns. Field measurements indicate that the widths of the observed web cracks mainly range from 0.06 mm to 0.18 mm. The majority of vertical and diagonal cracks exhibit widths below commonly adopted serviceability limits, and no significantly wide cracks were observed. Representative crack distribution map.
The original T-beam flanges employed dry joint construction without cast-in-place concrete. Under service conditions, this detailing resulted in limited transverse load transfer between adjacent beams and promoted joint cracking under repeated traffic loading. Prior to rehabilitation, the dry joints in the flanges commonly exhibited water infiltration, accompanied by longitudinal cracking in the bridge deck. The dry joint configuration created a relatively weak connection with poor transverse load distribution capacity. Under sustained heavy traffic loading, longitudinal cracks developed across the bridge deck, causing the dry joints to open and allowing direct water penetration through the deck onto the structural elements below. Following the retrofit of dry joints to wet joints through concrete recasting, water infiltration issues in the flanges were significantly reduced.
Most bridges showed damage near transverse deck joints, characterized by longitudinal cracks extending across the full span width. These longitudinal cracks were particularly severe in heavy traffic lanes, with multiple instances of concrete spalling and pothole formation. The diaphragms utilized embedded steel plates welded between adjacent beams for connection. Under heavy traffic loading, these connecting steel plates exhibited signs of deterioration, further compromising the structural integrity and load transfer capability of the diaphragm system.
Strengthening schemes
Based on the identified structural damages, a strengthening strategy was implemented to address three primary concerns: inadequate transverse stiffness, insufficient shear capacity, and reduced flexural strength. The strengthening approach was designed to restore and enhance load-carrying capacity of the bridge while ensuring long-term structural integrity.
The dimensions and reinforcement details of the proposed strengthening schemes were determined based on the existing geometry of the bridge components, the observed damage patterns from field inspections, and established engineering experience from similar RC T-beam bridge rehabilitation projects. The selected layouts and detailing were constrained by the original beam dimensions, available installation space, and constructability requirements. Rather than conducting a full parametric optimization at the design stage, practical strengthening configurations were adopted for field implementation.
Increasing transverse stiffness
To improve the overall transverse load distribution and more effectively utilize the collective longitudinal strength of the bridge, portions of the flanges and diaphragms were reconstructed to enhance transverse connectivity. The strengthening procedure involved removing concrete within a 31 cm zone on either side of the flange and diaphragm connections between adjacent T-beams. The removal process was executed manually to minimize damage to the existing reinforcement framework at the bottom of the diaphragms. Following concrete removal, additional reinforcement was installed to strengthen the diaphragm connections, as shown in Figure 5(b). New rebars were positioned at the bottom of the diaphragms and welded to the preserved original reinforcement framework to ensure structural continuity and load transfer capability. Finally, C40 grade concrete was cast to reconstruct these sections, thereby enhancing the structural performance and improving load distribution across the bridge width. This enhancement transforms the original dry joint configuration into a more effective wet joint system, significantly improving the ability to distribute loads transversely among the T-beams. Strengthening methods for enhancing transverse stiffness (a) Strengthening flange (b) Strengthening diaphram.
Shear strengthening
To address insufficient shear capacity and mitigate the propagation of diagonal cracks in the T-beam webs, diagonal steel strip reinforcement was implemented. This approach enhances structural integrity by increasing the shear resistance of the bridge. The shear strengthening involved installing inclined steel strips on the T-beam webs, extending from the supports to one-quarter of the span length on both sides of each beam, as shown in Figure 6. The steel plates were installed at an inclination angle of 45° with respect to the longitudinal axis of the beam. The steel plates, measuring 200 mm in width and 8 mm in thickness, were fabricated from Q355 C grade steel. The plates were secured to the web using M10 through-bolts arranged at a uniform spacing of 250 mm, with an edge distance of 50 mm from the plate edges. No special termination detailing, such as end tapering, was applied. The installation process began with thorough surface preparation of the web to ensure cleanliness and proper bonding conditions. The steel plates were then positioned at the predetermined diagonal orientation, and holes were precisely drilled through both the steel plates and the concrete web to accommodate the M10 bolts. Following bolt installation and tightening, all connections were inspected to verify stability and proper alignment. Shear strengthening method.
Flexural strengthening
Flexural strengthening of the investigated RC T-beam bridges represents the most critical aspect of the bridge rehabilitation strategy, as bending moment capacity typically governs the overall load-carrying performance of simply supported T-beam bridges. The observed crack patterns, particularly the extensive vertical cracks in the middle portions of the spans, indicated that the existing flexural capacity was insufficient to meet current traffic demands. Moreover, the deterioration of reinforcement due to corrosion has significantly reduced the effective steel area, further compromising the flexural strength of the bridge. Three distinct flexural strengthening methods were implemented and comparatively evaluated, as shown in Figure 7. Flexural strengthening methods (a) Cover plate strengthening (b) Steel channel strengthening (c) Steel truss strengthening.
The first method involved installing steel cover plates on the bottom surface of the T-beams, as illustrated in Figure 7(a). This cover plate strengthening (CPS) approach consisted of attaching a primary steel plate (Steel Plate A) to the bottom flange of the T-beam using M10 chemical anchor bolts with a minimum anchorage depth of 100 mm. The bolt spacing is 250 mm from the supports to one-quarter of the span length and 400 mm within the mid-span region. All bolts were installed along the centerline of the plate, providing an edge distance of 110 mm to either side of the plate edge. A 6 mm thick adhesive bedding layer was applied between the steel plate and the concrete surface to ensure uniform contact and load transfer. Additionally, secondary steel plates (Steel Plate B) with dimensions of 200 mm width and 5 mm thickness were installed on the sides of the T-beam, extending from the supports to one-quarter of the span length on both sides. Steel Plate B was welded to Steel Plate A and further secured to the concrete beam using M20 through-bolts to ensure reliable load transfer. All steel plates in this method were fabricated from Q355 C grade steel.
The second method builds upon the CPS approach by incorporating additional structural elements. Two steel channels were welded symmetrically beneath Steel Plate A, as shown in Figure 7(b). This steel channel strengthening (SCS) approach provides enhanced stiffness compared to the CPS approach. The steel channels had the following dimensions: height of 160 mm, flange width of 63 mm, and web thickness of 6.5 mm. To ensure structural stability, gusset plates were welded beneath the steel channels, creating a robust and stable configuration. This approach leverages the foundation provided by Steel Plate A while adding significant flexural strength and stiffness through the incorporation of the steel channel sections and stabilizing gusset plates.
The third method employed a steel truss system installed beneath the T-beam web, as depicted in Figure 7(c). The steel truss measured 1000 mm in height. The truss was connected to the T-beam web through gusset plates. The gusset plates had a thickness of 12 mm and were connected to the concrete web using three M20 through-bolts at each connection node (as shown in Figure 8). Clearance between the truss members and the concrete surface was checked during installation to avoid unintended contact and to ensure proper force transmission through the designed connections. The truss configuration featured diagonal members bolted to lower chord members, with diagonal elements arranged at approximately 45-degree angles to optimize load transfer. The diagonal web members utilized I-beam sections, while the lower chord members were formed from welded U-shaped steel plates. Three transverse steel connections were strategically positioned at quarter-span, mid-span, and three-quarter span locations to ensure lateral stability and load distribution. All steel components were fabricated from Q355 C grade steel. This steel truss strengthening (STS) method was specifically designed to provide substantial improvements in overall structural stiffness and rigidity through the introduction of a comprehensive truss system beneath the existing T-beam structure. Connection detail of STS scheme (unit: mm).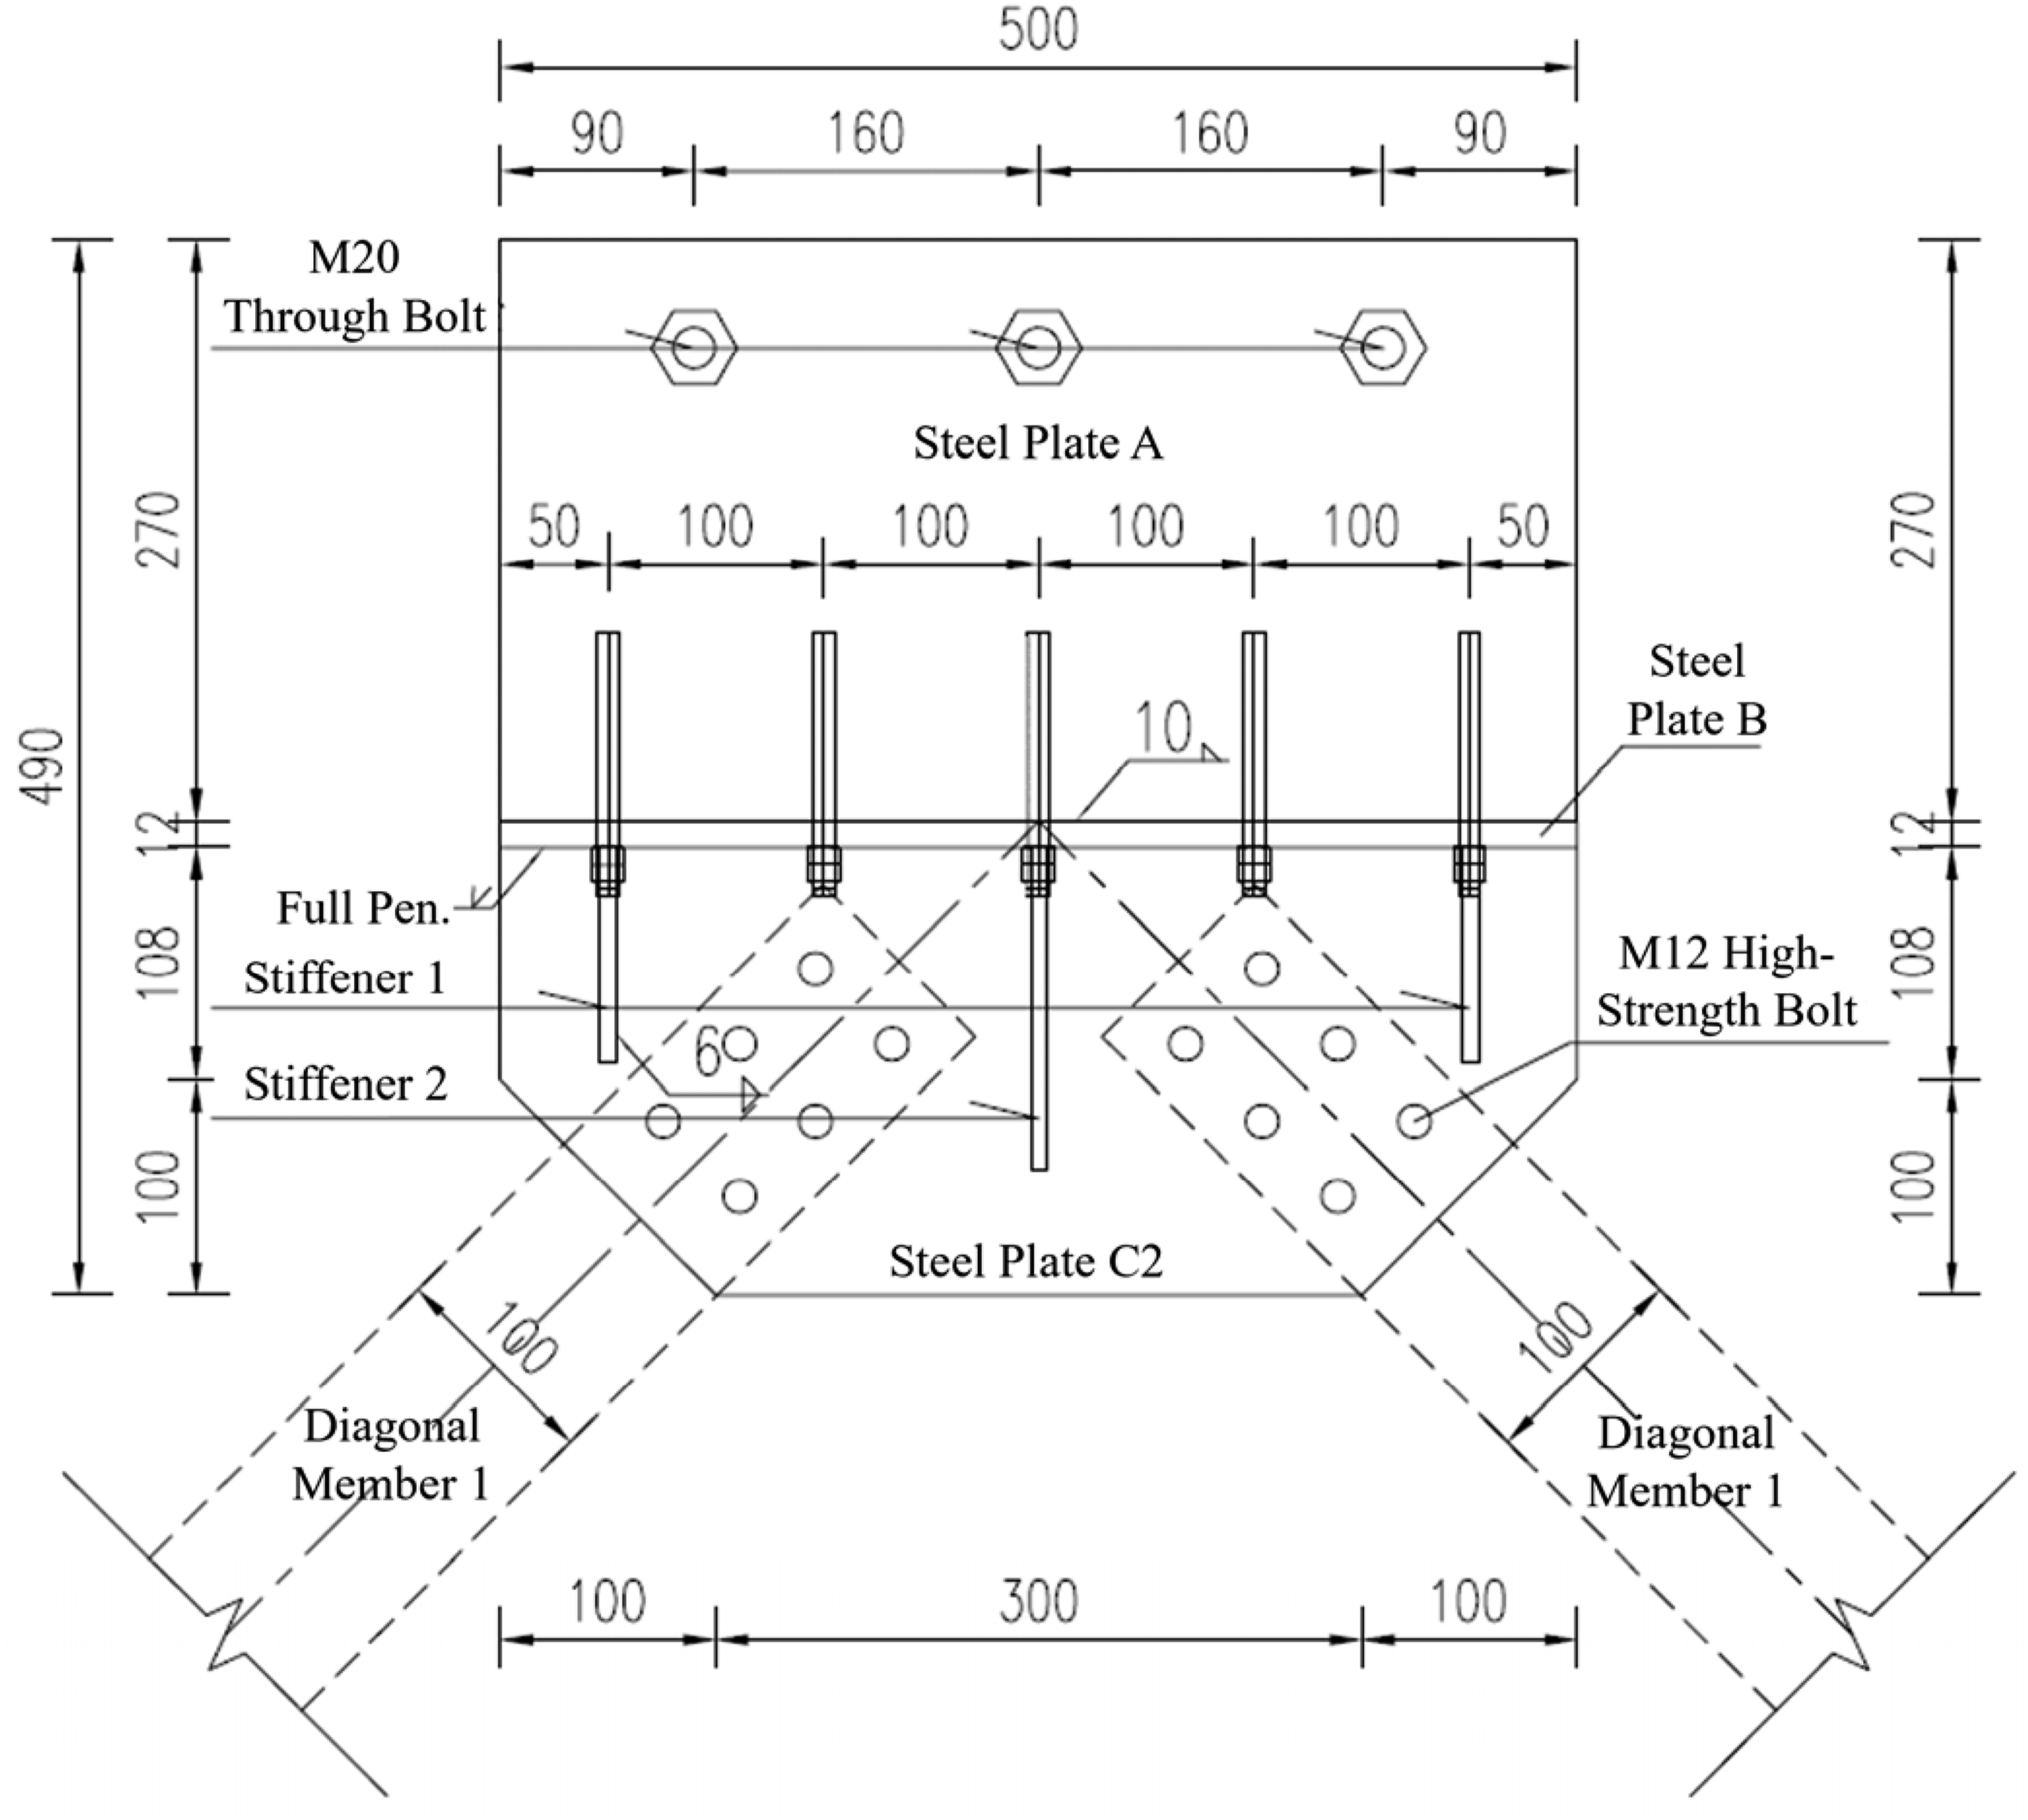
Load testing
To validate the effectiveness of the strengthening schemes and assess the structural performance of the rehabilitated bridge, a comprehensive static load testing program was conducted. The testing program aimed to: (1) assess the improvement in transverse load distribution following the strengthening procedures, and (2) evaluate the relative performance of the three flexural strengthening methods.
Test plan
Static truck loading tests were conducted on the T-beam bridges following the provisions of the Chinese code “Specification for Inspection and Evaluation of Load-bearing Capacity of Highway Bridges” (JTG/T J21-2011). Four dump trucks with known weights were employed to generate maximum bending moments at the mid-span of the bridge, as shown in Figure 9. Each truck had a gross weight of 300 kN. The front axle load was 60 kN, while each of the two rear axles carried a load of 120 kN. The axle spacing and geometric configuration of the truck are illustrated in Figure 10. The tire area was 0.12 m2. The total applied load of 1200 kN represents a significant test load that approaches the upper bounds of expected service conditions. Static load test (a) Loading configuration (b) Photo of static load test. Truck dimensions and axle load configuration (unit: mm).

The test configuration involved arranging the four trucks in two parallel rows, with each row consisting of two trucks positioned longitudinally. The trucks were strategically positioned based on influence-line analysis to generate maximum positive bending moments at the target sections. In particular, the front and rear axles of each truck were placed symmetrically about the mid-span of the bridge to maximize the bending response at the critical section. The loading procedure was conducted in a stepwise and quasi-static manner. Trucks were positioned sequentially according to the predefined loading cases. After reaching the target load configuration, deflection and strain data were recorded to ensure reliable response capture. All static loading tests were conducted under full traffic closure to eliminate disturbances from ambient traffic and to ensure the accuracy and repeatability of the measurements.
Instrumentation program
An instrumentation program was implemented to capture the complete structural response of the T-beam bridge under the applied loads. The measurement system was designed to provide both deflections and strains at critical locations.
Mid-span deflections of each individual T-beam were measured using optical levels, with the instruments installed on an adjacent stable bridge structure to provide a fixed reference and avoid interference from bridge deformation during loading, as shown in Figure 11(a). This external reference system eliminates potential errors that could arise from foundation settlement or movement of the test bridge itself. The deflection measurements were captured for verification of analytical predictions, assessment of load distribution among the T-beams, evaluation of strengthening effectiveness, and detection of any unusual structural behavior. Measurement setup (a) Deflection measurement (b) Strain measurement.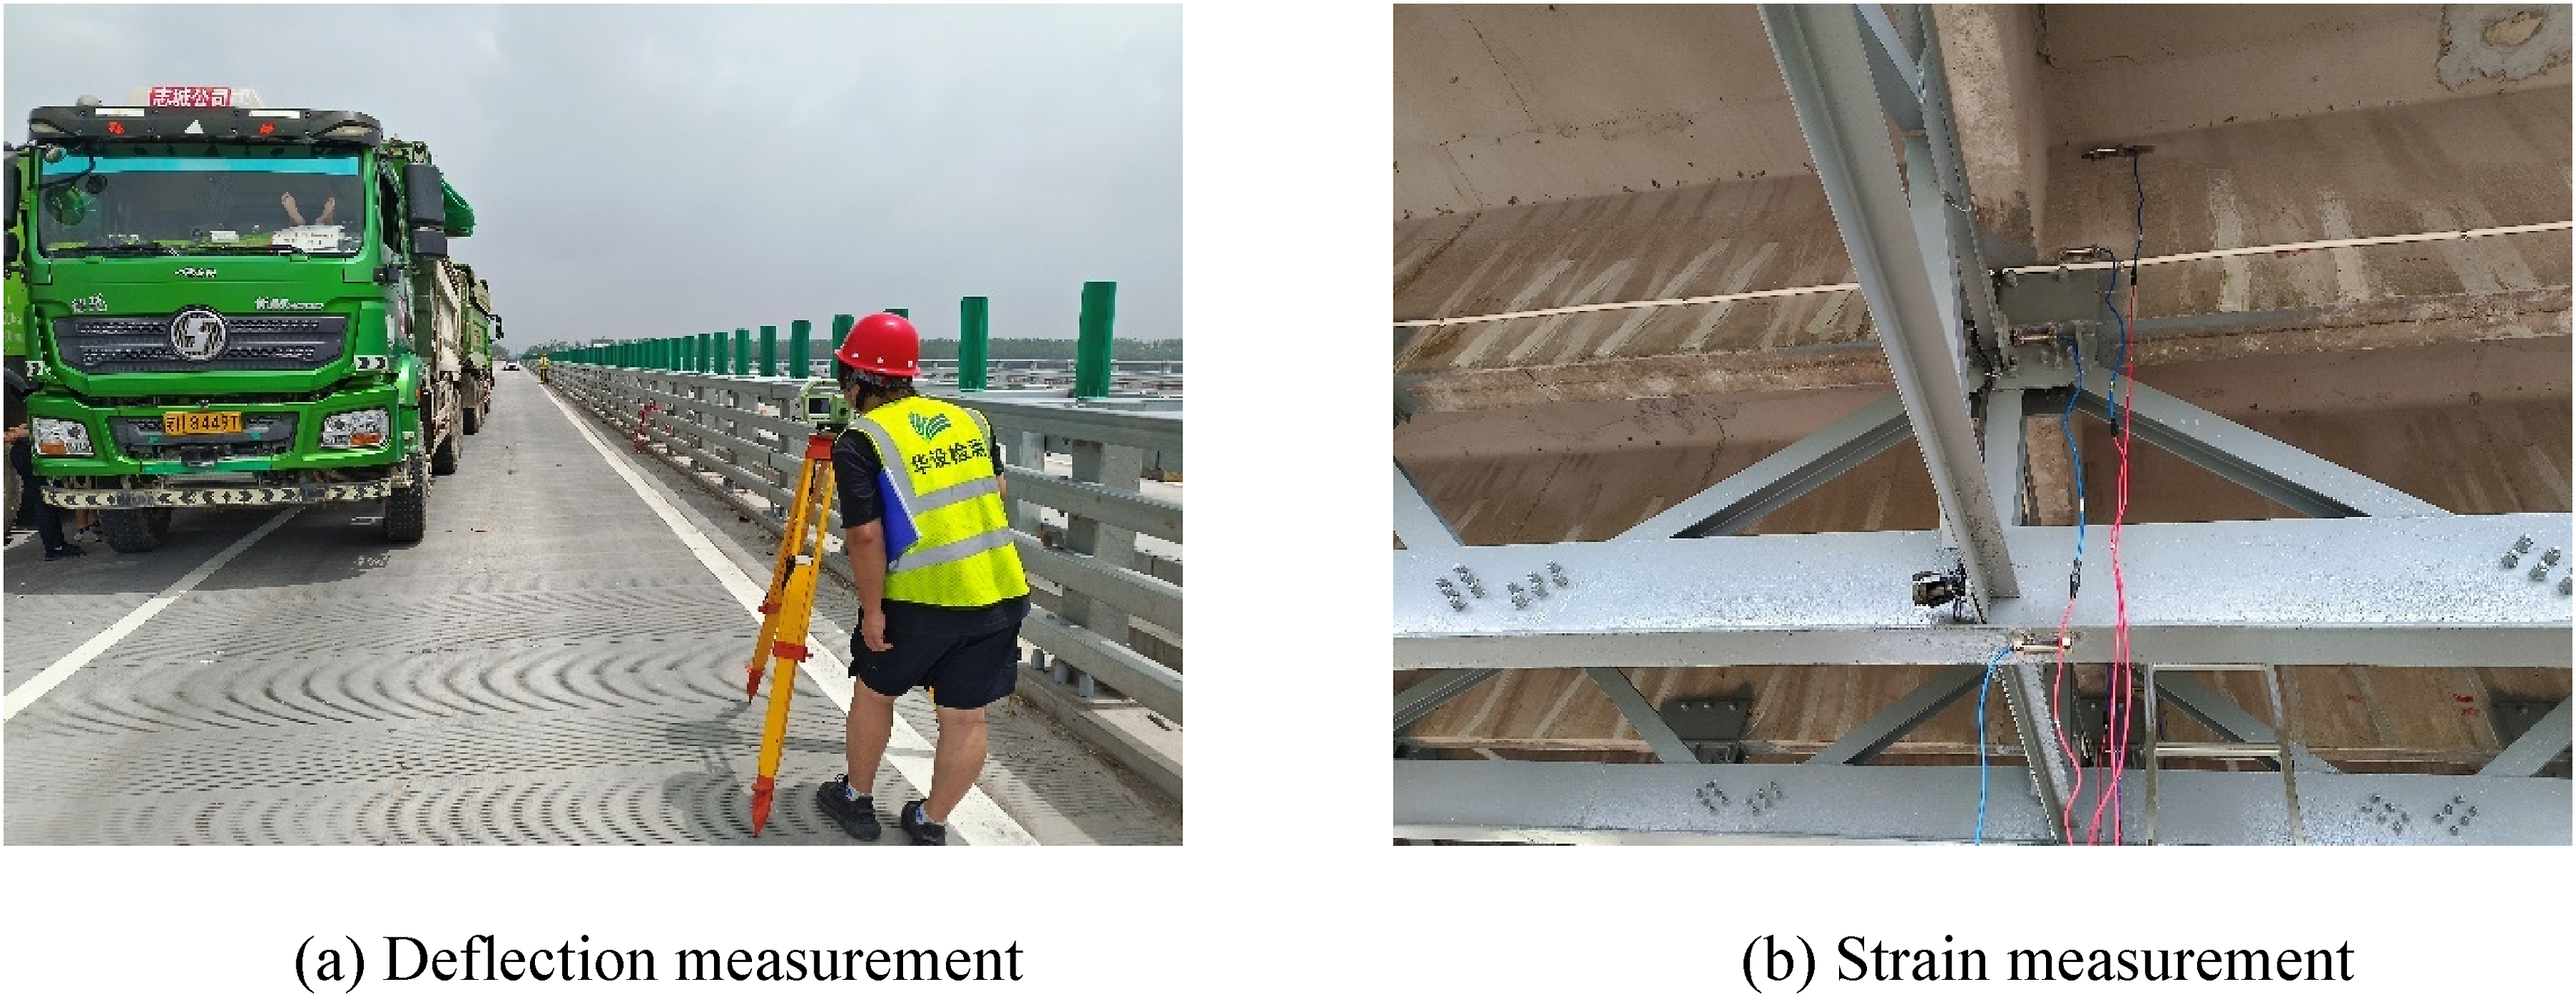
Strain transducers were installed at various heights along the critical mid-span cross-section of each T-beam to capture the complete strain distribution, as illustrated in Figure 11(b). The strain measurement system included multiple measurement points distributed vertically across the T-beam. The strain transducers were bonded to both concrete surfaces and steel strengthening elements using high-strength epoxy adhesive, ensuring they accurately follow the deformations of both concrete and steel components. Special attention was given to surface preparation to ensure reliable bond between the sensors and the structural elements.
Finite element model
To complement the experimental investigation and provide deeper insights into the structural behavior of the strengthened bridge, finite element (FE) models were developed using ANSYS for each strengthening configuration, as shown in Figure 12. According to the as-built bridge drawings, the deck slab thickness was taken as 80 mm. The finite element models utilized different element types optimized for their respective structural components. The concrete T-beam structure was modeled using SOLID185 elements, which are three-dimensional 8-node structural solid elements suitable for modeling irregular meshes and complex geometries. Steel strengthening components were modeled using SHELL181 elements, which are 4-node shell elements with six degrees of freedom per node. This element type is suitable for modeling thin steel plates and sections where the thickness is small compared to the other dimensions. The interaction between existing concrete elements and newly added steel components was modeled using contact elements to capture the load transfer mechanisms accurately. TARGE170 target elements and CONTA173 contact elements were employed to establish binding constraints between steel strengthening elements and concrete surfaces. Finite element models.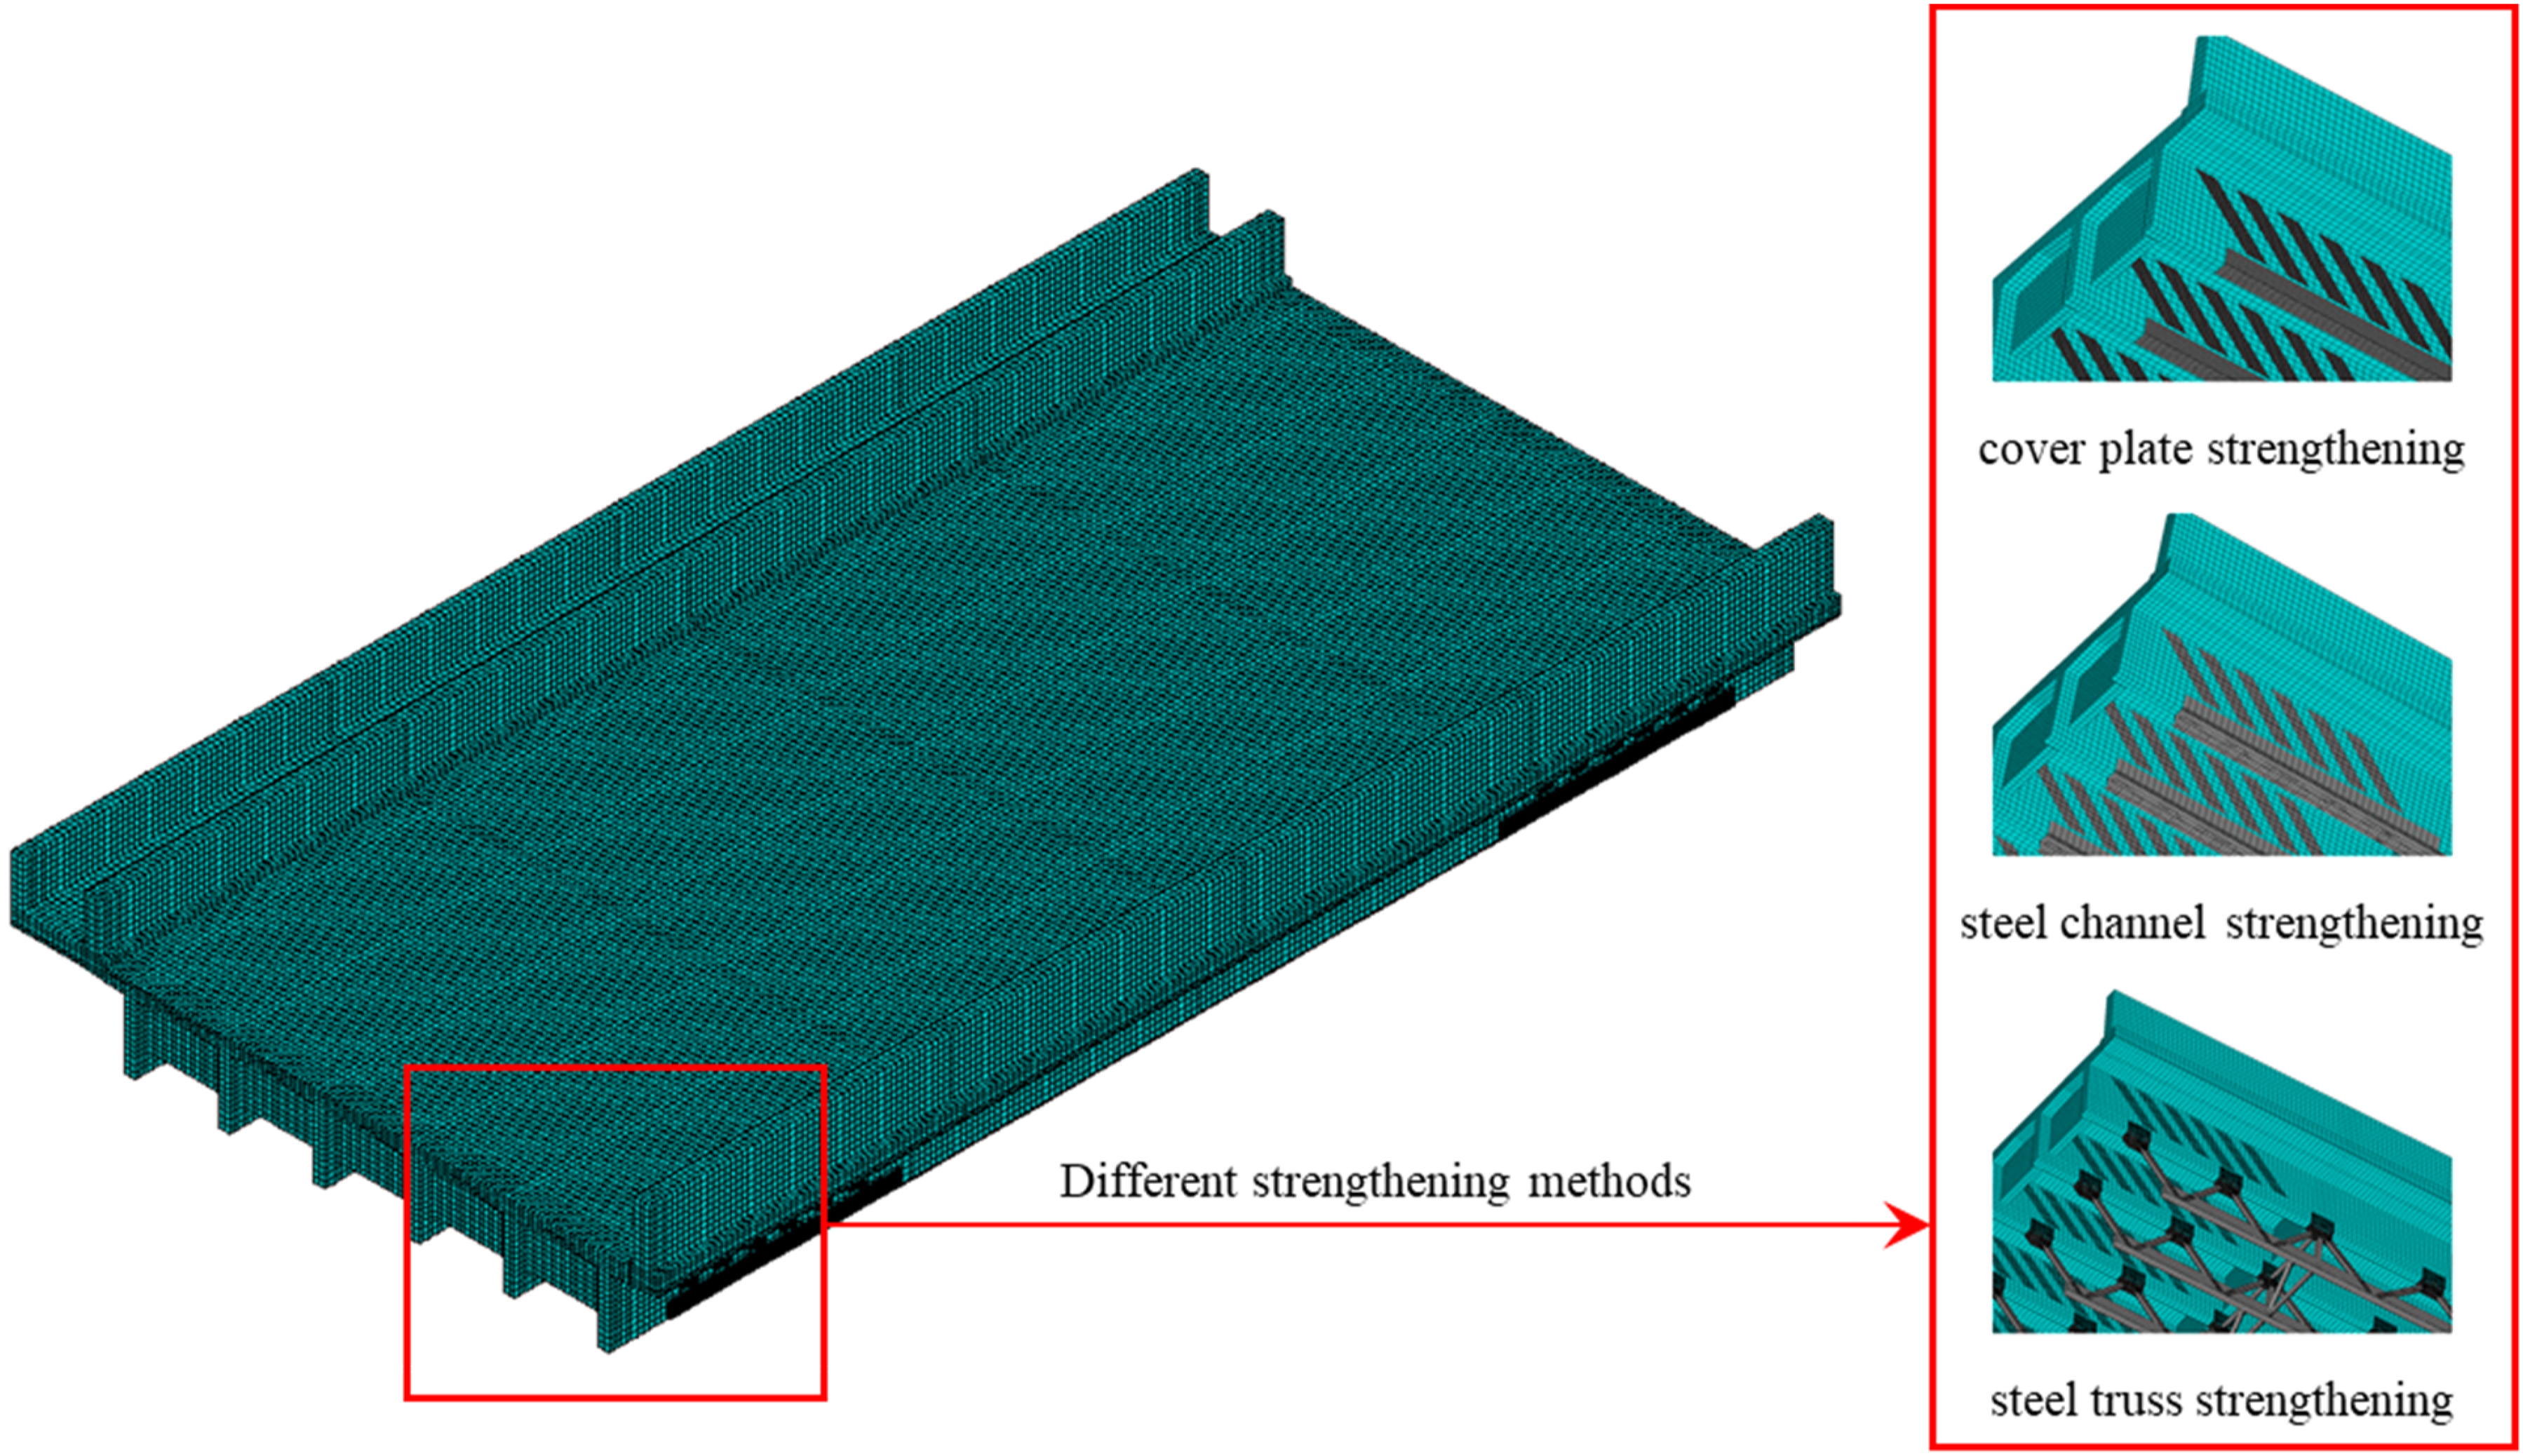
The CPS model incorporated steel plates bonded to the bottom surface and sides of the T-beam using contact elements to simulate the adhesive bond and mechanical anchoring system. Steel Plate A was modeled as a continuous shell element extending across the bottom flange, while Steel Plate B elements were positioned on the beam sides extending from the supports to quarter-span locations. The connection between Steel Plate A and Steel Plate B was modeled using shared nodes to represent the welded connection. The anchor bolt connections were simplified as rigid connections between the steel plates and concrete elements, representing the case of effective load transfer through properly installed chemical anchors.
The SCS model built upon the CPS configuration by adding steel channel sections beneath Steel Plate A. The steel channels were modeled using shell elements with appropriate cross-sectional properties corresponding to the 160 mm height, 63 mm flange width, and 6.5 mm web thickness specifications. The channels were connected to Steel Plate A through shared nodes representing the welded connections. Gusset plates were modeled as additional shell elements providing lateral stability to the channel sections. The connection between the channel system and the T-beam was achieved through the underlying Steel Plate A, ensuring proper load transfer from the concrete beam to the composite steel strengthening system.
The STS model represented the most complex strengthening configuration, incorporating a complete steel truss system beneath the T-beam web. The truss members were modeled using beam elements with appropriate cross-sectional properties for the I-beam diagonal members and the welded U-shaped lower chord members. Transverse steel connections at quarter-span, mid-span, and three-quarter span locations were modeled as beam elements providing lateral stability to the truss system. These elements ensure that the truss acts as a coherent structural system rather than independent planar frames.
In the finite element analysis, both concrete and steel were modeled as linear elastic materials. No nonlinear material behavior, such as concrete cracking, damage evolution, or steel plasticity, was considered. As a result, concrete compressive strength
The boundary conditions were defined to replicate the simply supported configuration of the actual bridge spans. For each T-beam, one end was modeled as a fixed bearing by restraining longitudinal, transverse, and vertical displacements, while the opposite end was modeled as an expansion bearing by restraining transverse and vertical displacements only. This arrangement prevents rigid body motion while allowing longitudinal movement to accommodate thermal effects and structural deformations. The finite element analysis was performed using a load-controlled static analysis. The loading configuration in the finite element models matched the experimental test setup. For numerical implementation, the wheel loads of the four test trucks were transferred into the model through the bridge deck. Each wheel load was applied as an equivalent uniformly distributed pressure over a group of deck slab nodes corresponding to the tire–pavement contact area (0.12 m2), rather than as a concentrated nodal force. This load application approach represents the actual tire contact conditions and allows the deck slab to distribute the wheel loads to the underlying T-beams, thereby avoiding unrealistic local stress concentrations.
The finite element analysis in this study was intended to evaluate the structural response under service-level static loading and to compare the relative effectiveness of different strengthening schemes. Accordingly, no explicit material failure criteria or ultimate limit state modeling was incorporated into the simulations. Linear elastic material behavior was assumed for concrete and steel to focus on stiffness characteristics and load-sharing mechanisms.
Results and discussion
Deflection
Mid-span deflection measurements reveal the structural behavior transformation of the T-beam bridge following various strengthening approaches. Figure 13 shows the deflection of the bridge under static truck loading. The FE results exhibit strong correlation with experimental measurements across all strengthening configurations, confirming the validity of the FE analysis. The deflection results show significant differences in structural behavior before and after strengthening approaches. The deteriorated bridge exhibited non-uniform load distribution, with maximum deflection (−12.21 mm) occurring at Beam 3 and progressively smaller deflections toward the exterior beams (−6.51 mm at Beam 1 and −2.23 mm at Beam 6). This pattern demonstrates inadequate load sharing prior to strengthening. Following strengthening, all three methods demonstrated improved performance with varying degrees of effectiveness. The CPS method reduced the maximum deflection to −10.07 mm at Beam 1, representing a 17.5% improvement. The SCS method achieved the most significant reduction, with maximum deflections of −6.02 mm at Beam 1, corresponding to a 50.7% improvement over the unreinforced condition. The STS method showed more modest improvements, with maximum deflections of −9.83 mm at Beam 1, achieving a 19.5% reduction. Notably, all strengthening methods resulted in a shift of the maximum deflection location from the interior Beam 3 to the exterior Beam 1, indicating improved transverse load distribution and enhanced collaborative behavior between T-beams. Deflection of the bridge before and after strengthening.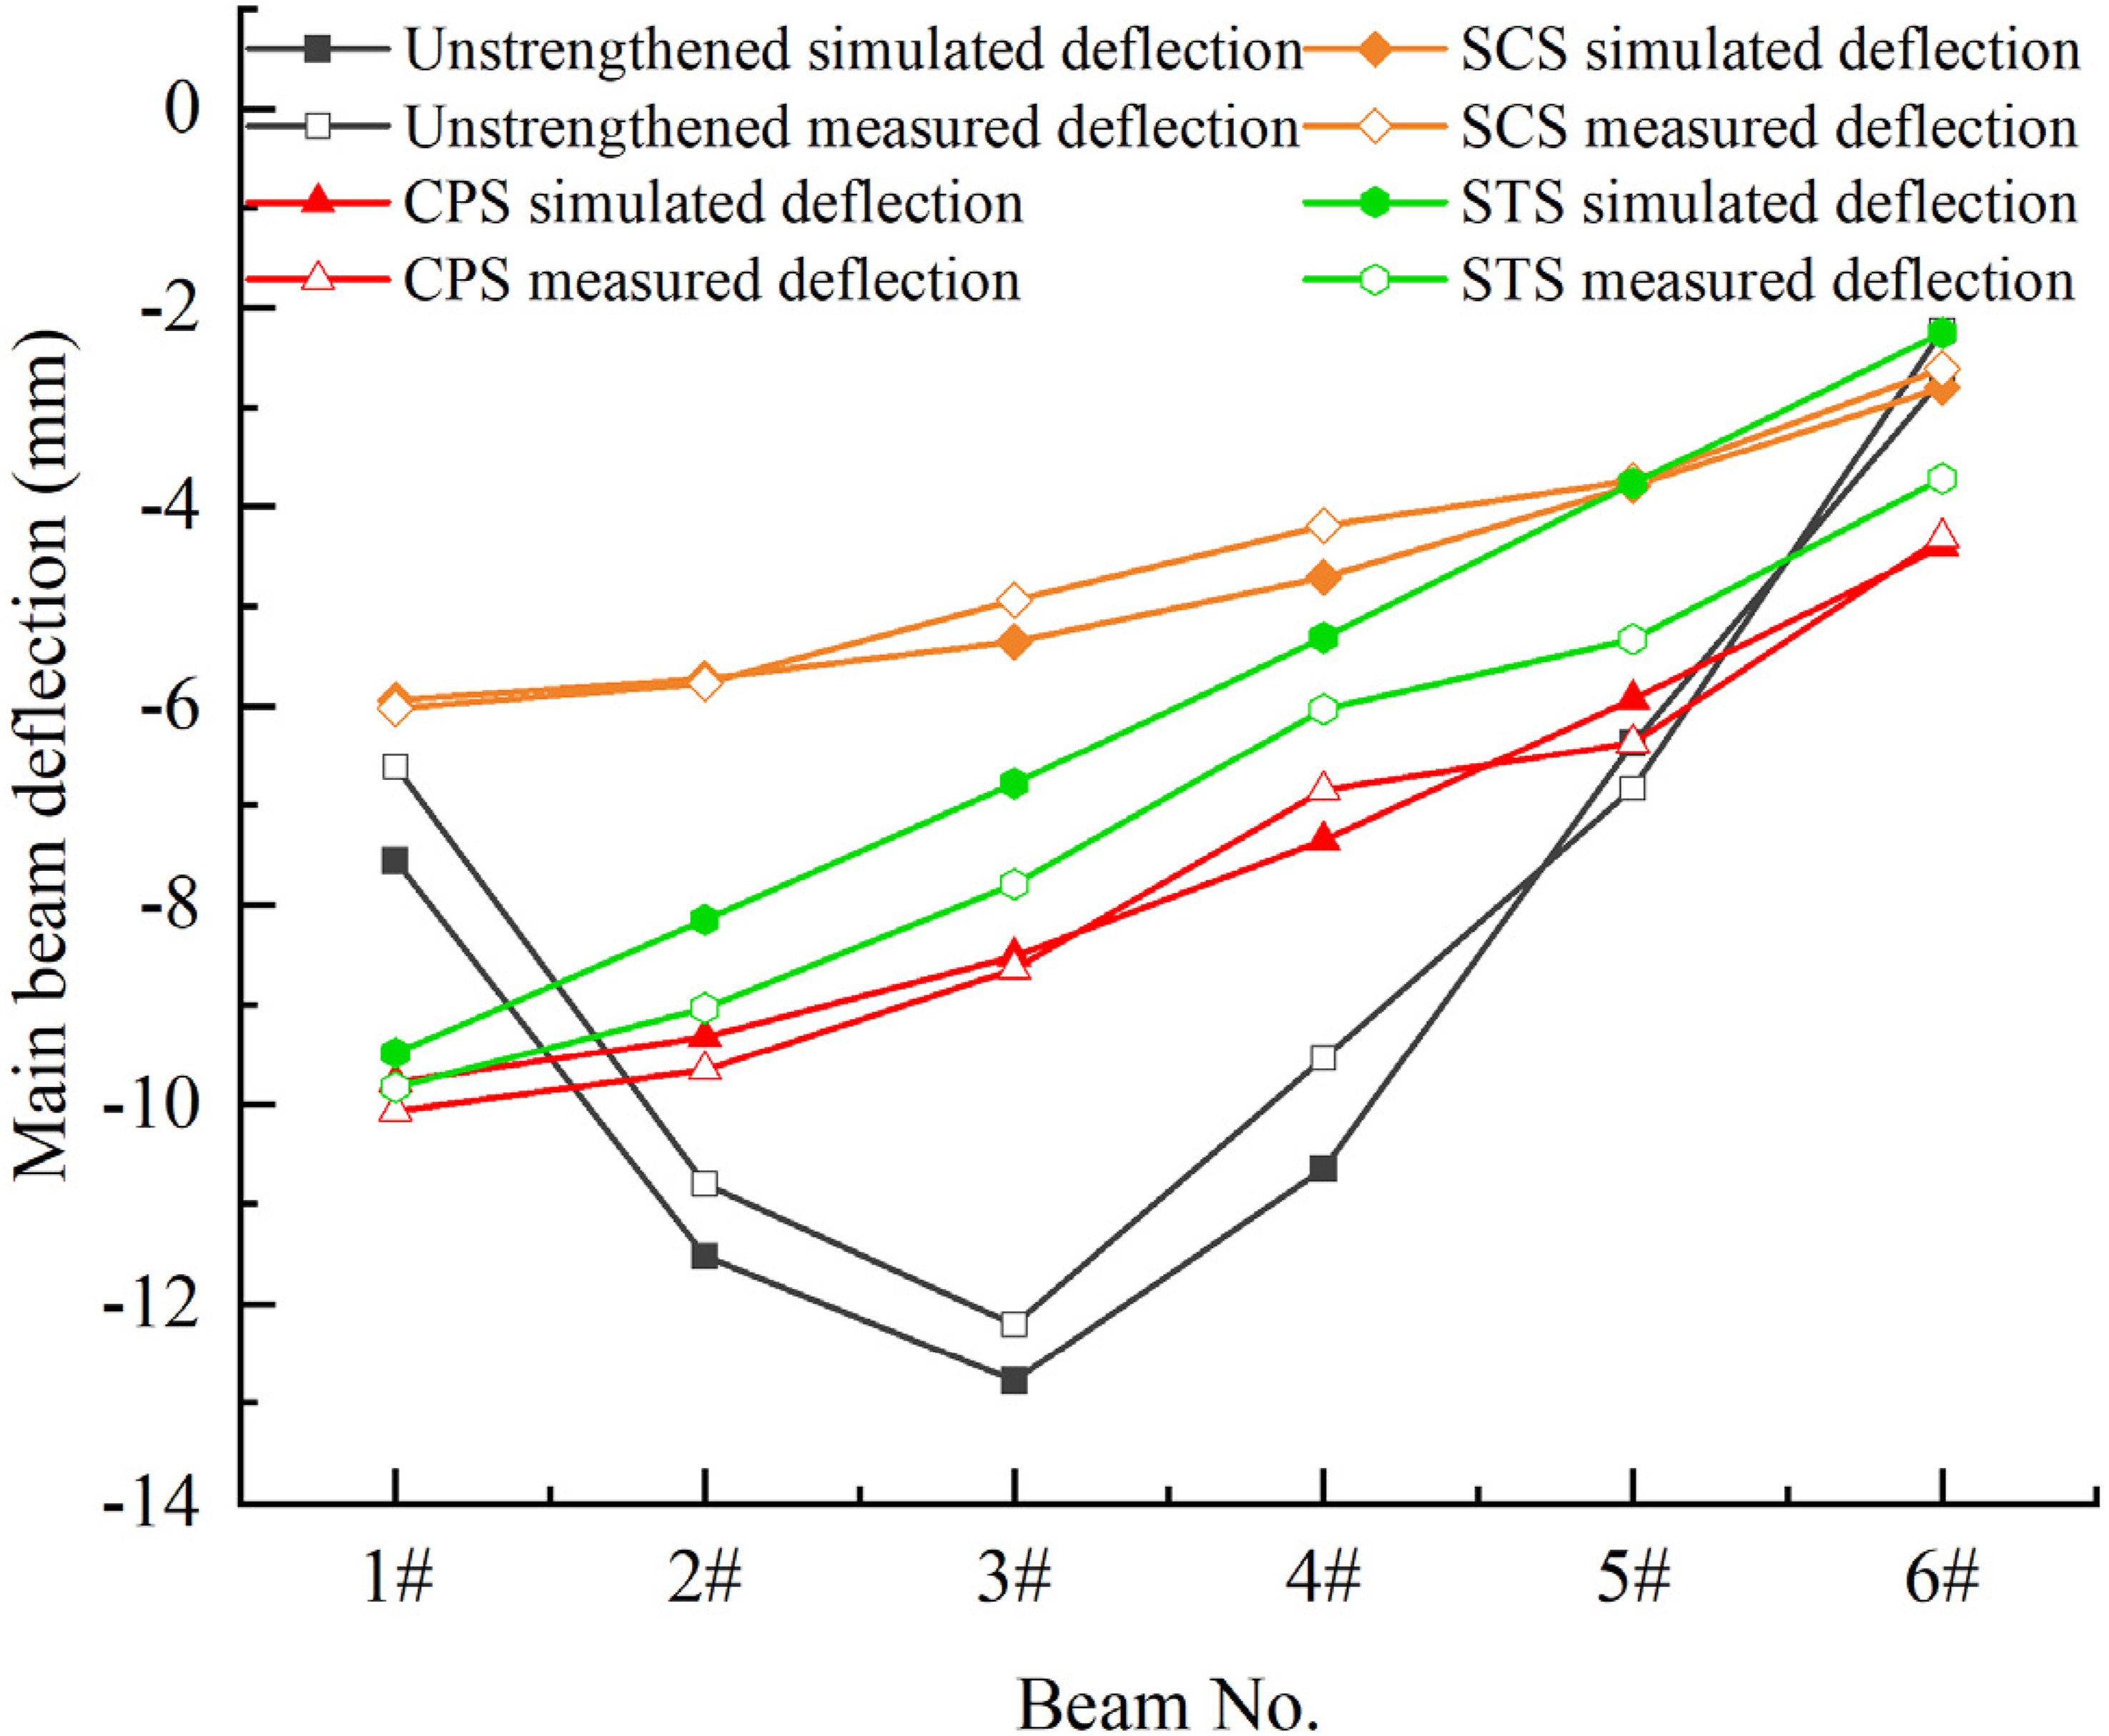
For the L = 20 m span considered in this study, a commonly adopted serviceability deflection limit of L/800 corresponds to 25.0 mm. The maximum measured mid-span deflection before strengthening was 12.21 mm, and after SCS strengthening it reduced to 6.02 mm. Therefore, the deflections are within the L/800 serviceability limit, while the strengthening schemes provide a substantial stiffness enhancement.
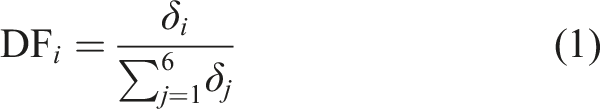
Based on the measured deflections of the bridge, the load distribution factor (DF) can be calculated as the ratio of individual beam deflection ( Distribution factor.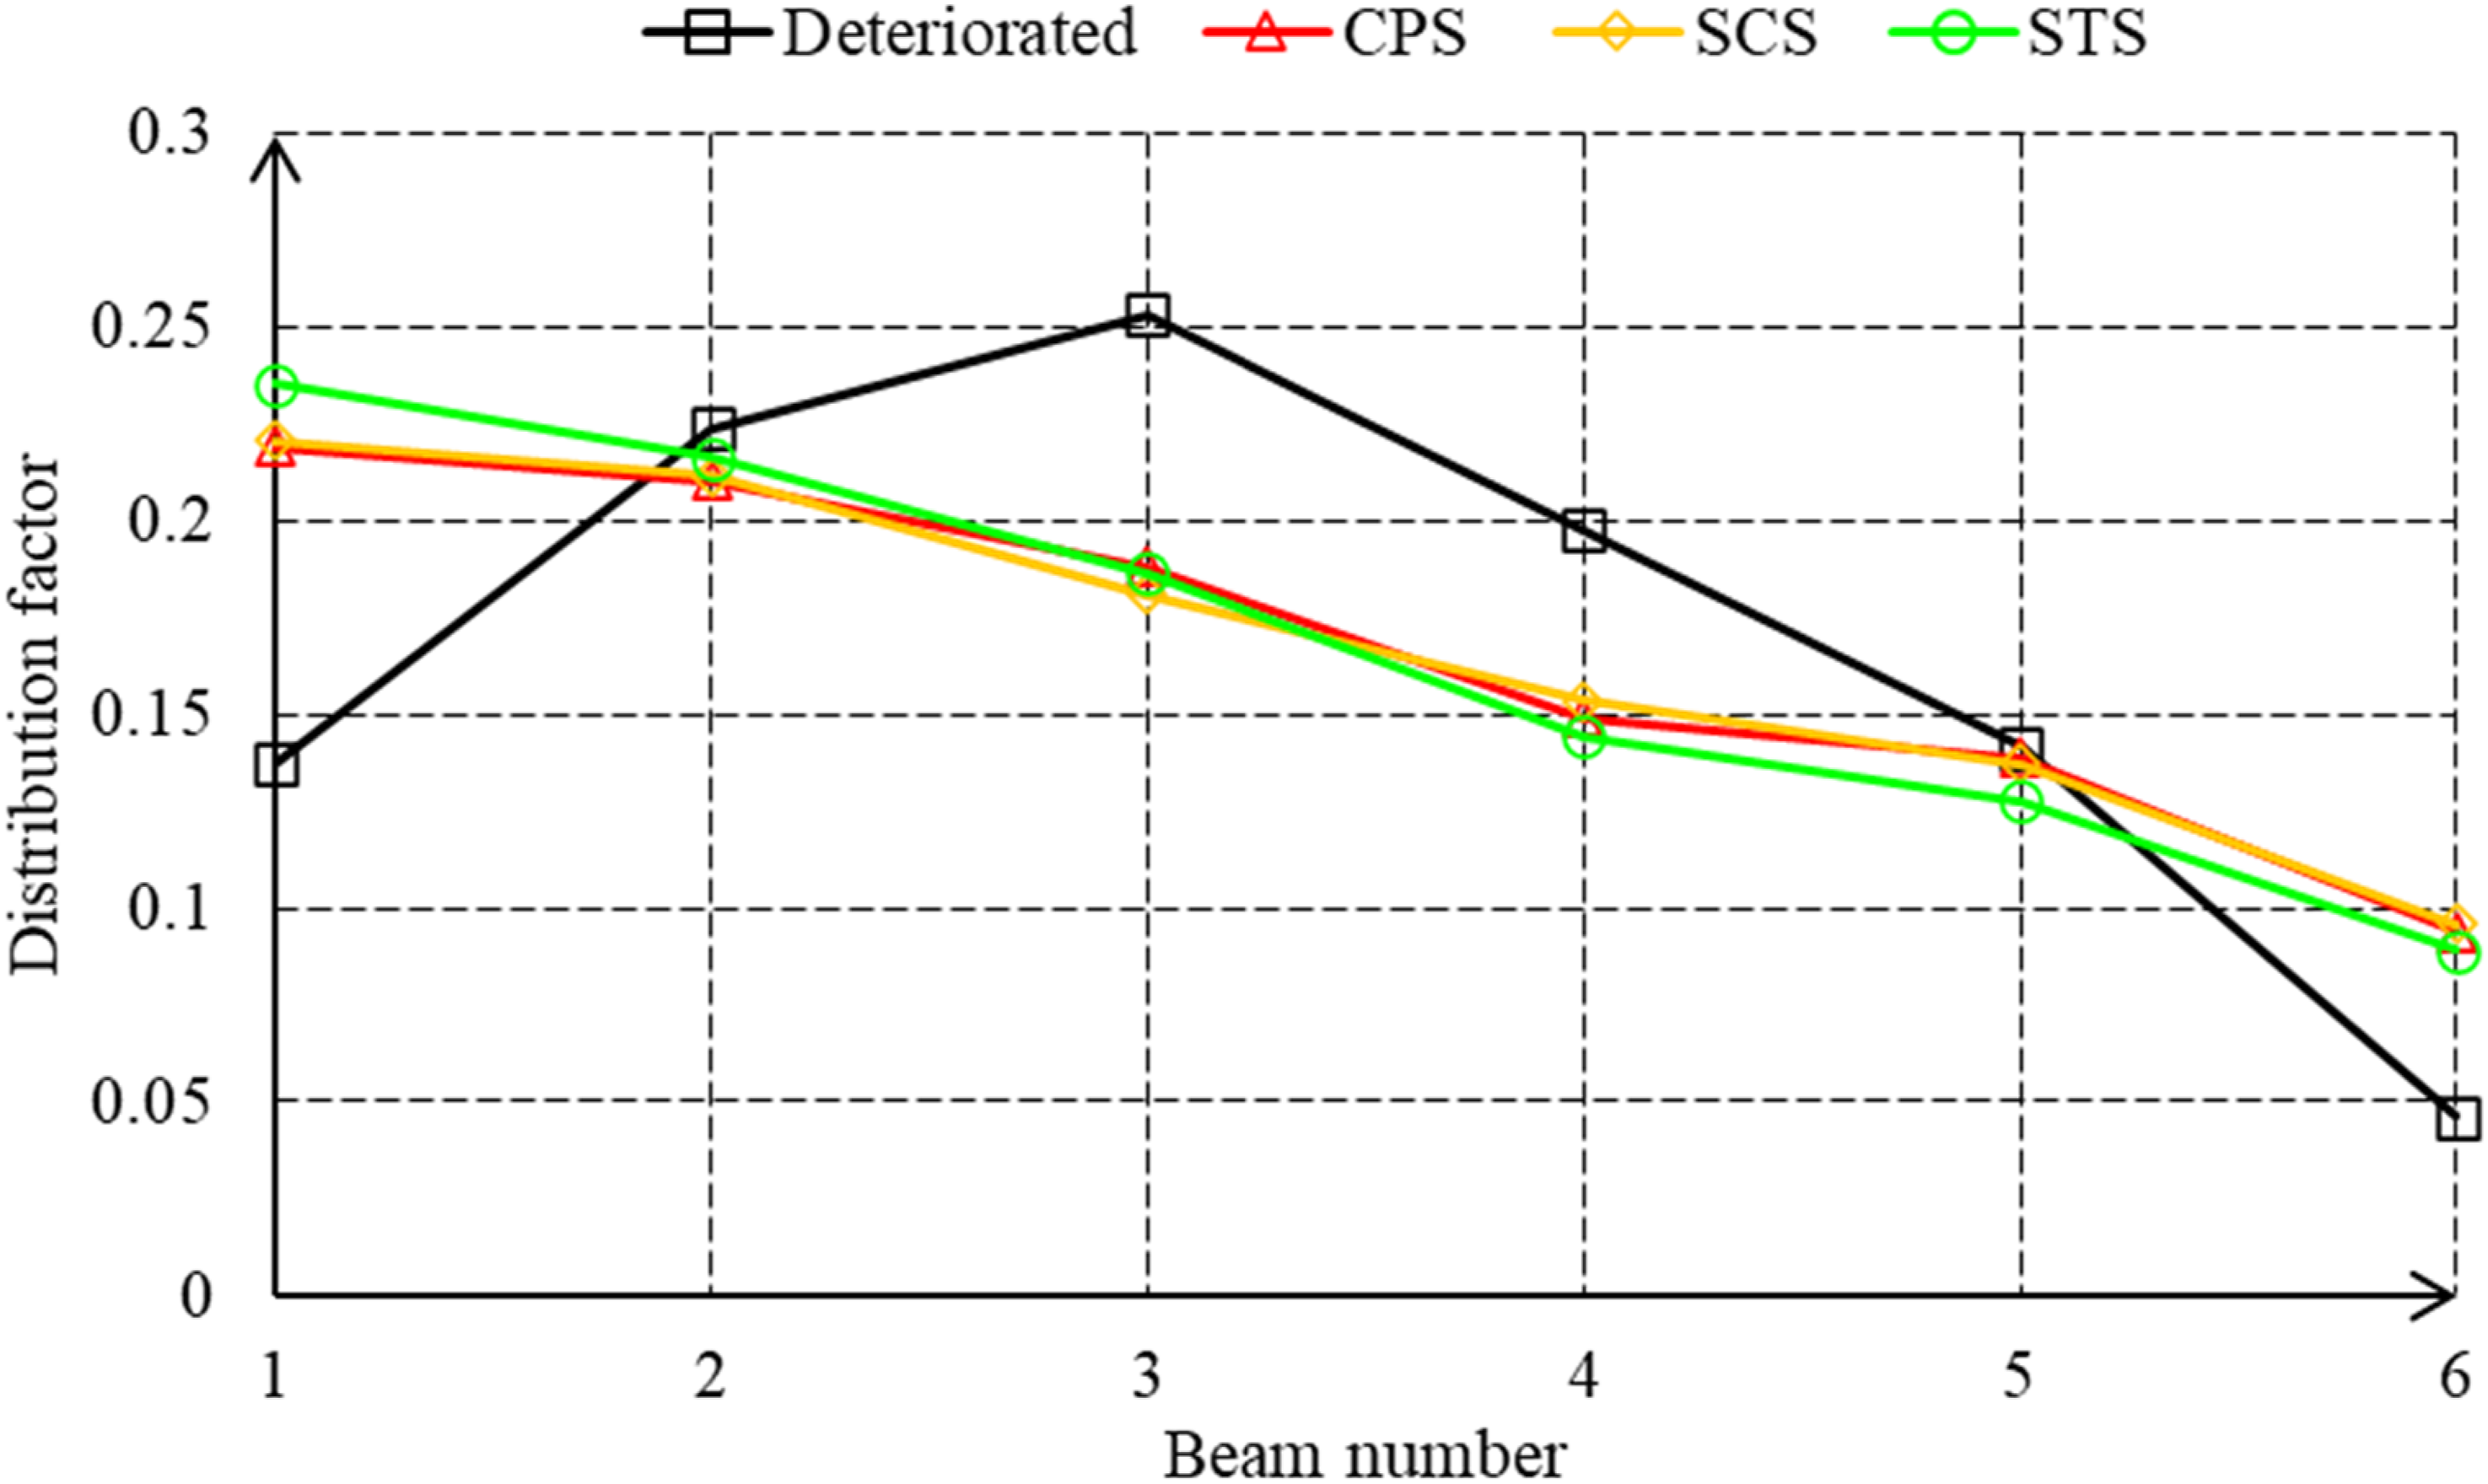
Strain distribution
To further investigate the performance of the strengthening methods, the longitudinal strain at mid-span were measured. Figure 15 presents the strain measurements and corresponding numerical predictions. The longitudinal strain results at mid-span reveal the effectiveness of composite action between the strengthening elements and the concrete T-beams, as evidenced by the approximately linear strain distribution across the section depth. It can be observed that both the CPS approach and SCS approach demonstrated effective composite behavior, since the strain distribution follow the plane section assumption. The strain distribution maintains approximate linearity across the entire cross-section height, indicating effective load sharing between the concrete beam and strengthening elements. Longitudinal strain at mid-span of the bridge under different strengthening approaches (a) CPS approach (b) SCS approach (c) STS approach.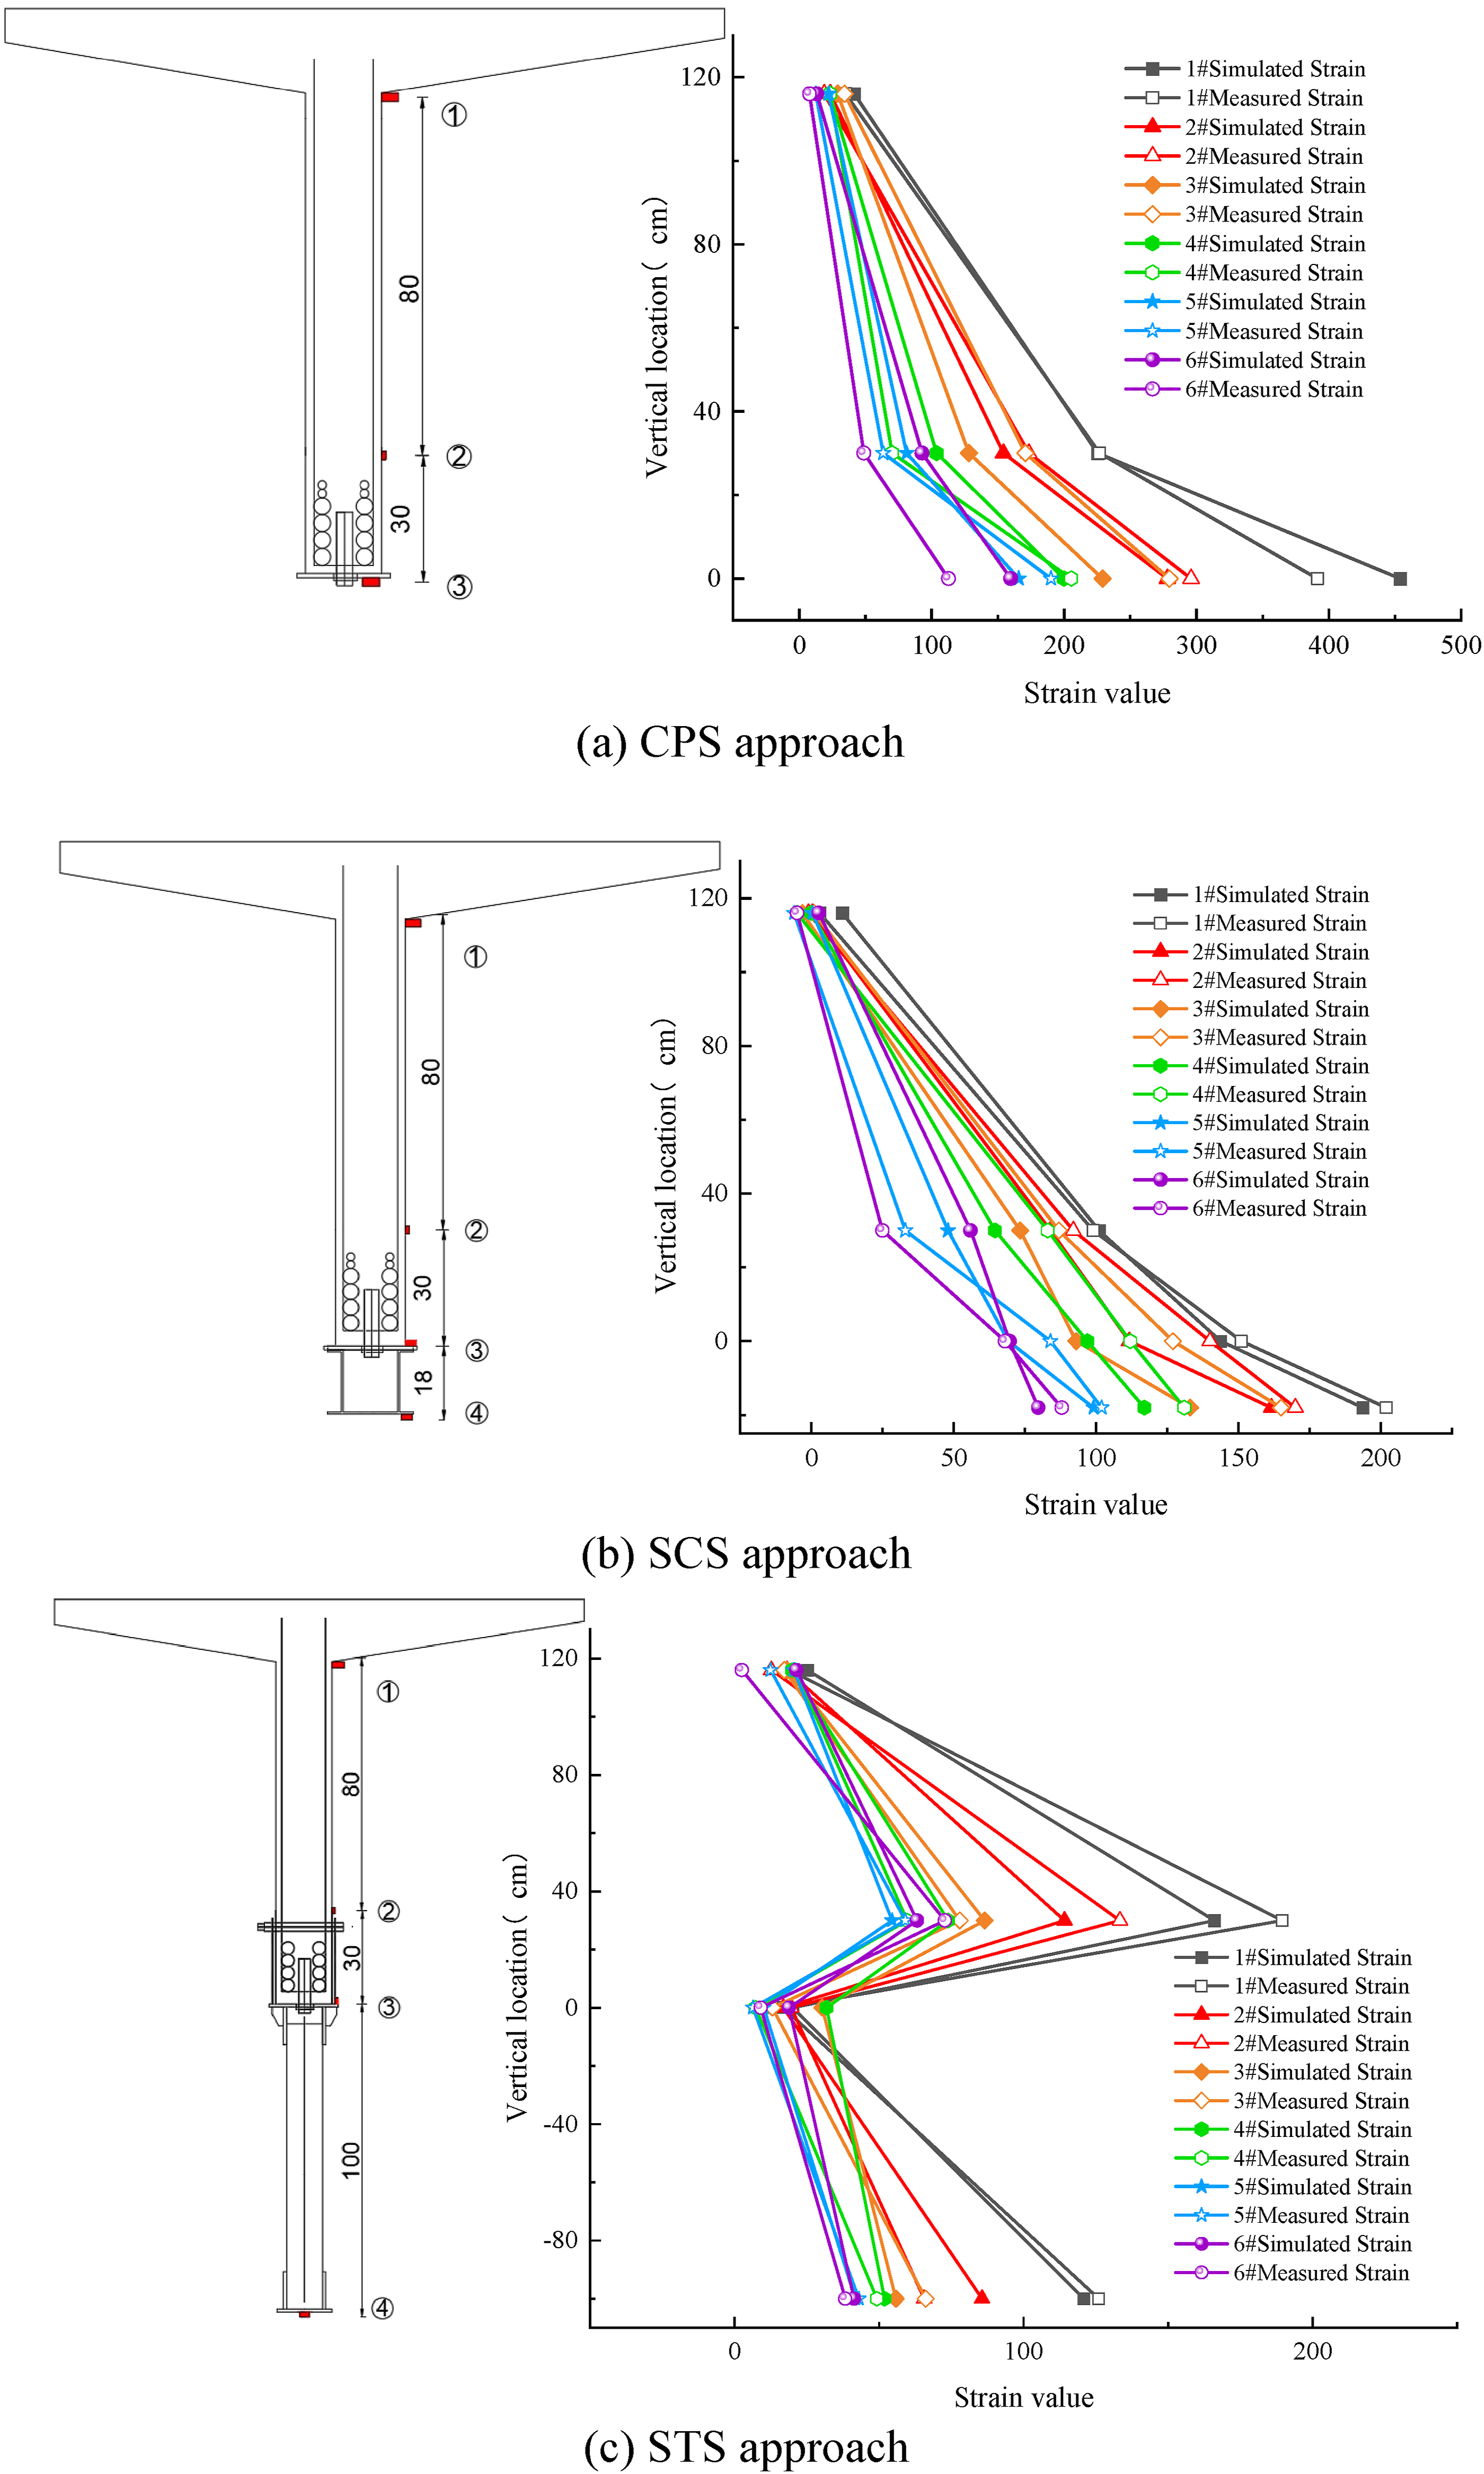
In contrast, the beams reinforced with the STS approach show a different strain distribution pattern. Under load, the strain values along the height of these beams form a three-segment line, deviating from the linear pattern expected for composite. While both the concrete T-beam and steel truss components individually demonstrated relatively linear strain distributions, the discontinuity between these elements indicated incomplete composite behavior. The strain measurements confirmed inadequate interaction between the steel truss and concrete T-beam in the STS configuration, resulting in limited enhancement of the overall structural performance.
Parametric analysis
Dimensional properties of the channels.

The deflection analysis reveals a clear correlation between channel size and structural performance, with larger channels providing progressively better stiffness characteristics. Figure 16 illustrates the mid-span deflection results for each channel configuration under the truck loading arrangement. The 16 B channel configuration achieved maximum deflections of −5.93 mm, representing the baseline performance for the smallest channel section. Progressive improvements were observed with larger sections, with the 18B configuration reducing deflections to −5.71 mm (3.75% improvement over 16B), the 20B configuration achieving −5.65 mm (6.20% improvement), and the 22B configuration reaching −5.43 mm (8.43% improvement). On the other hand, steel material costs increased approximately linearly with channel size, with the 18B, 20B, and 22B configurations requiring 16.44%, 30.48%, and 44.05% more steel than the 16B baseline, respectively. Comparison on mid-span deflection of different strengthening channels.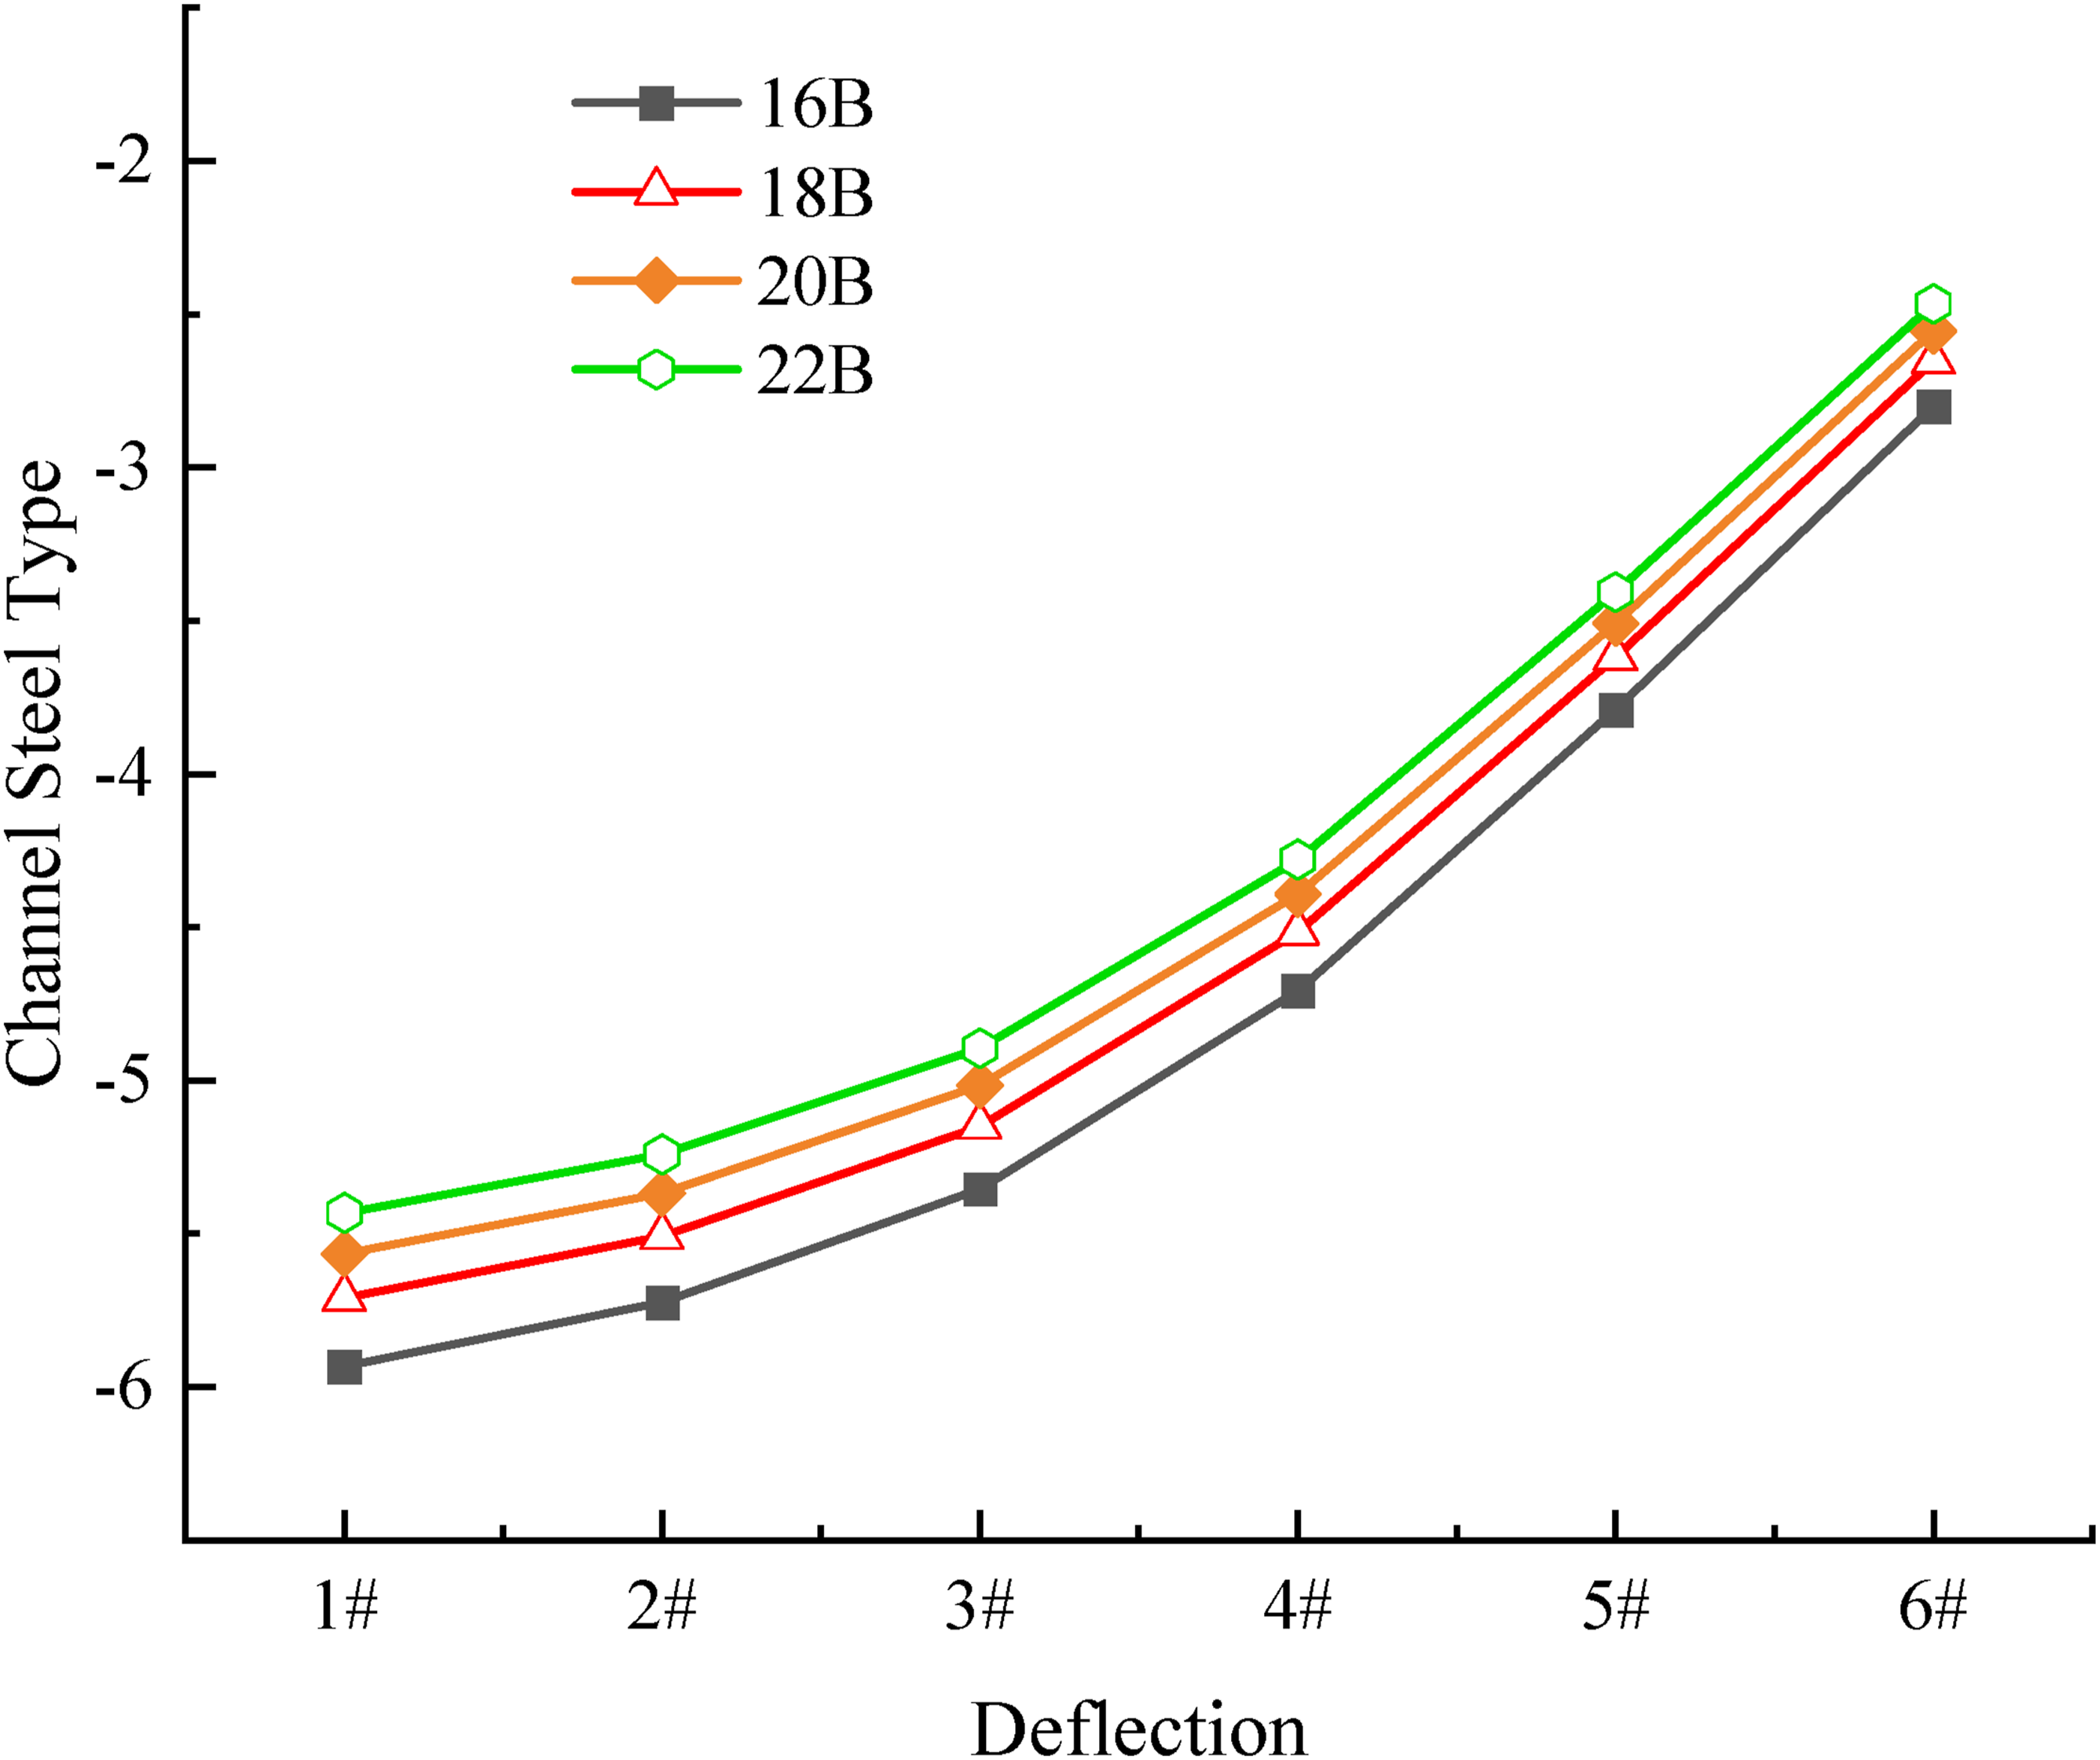
While the 16B section exhibits the highest deflection among the analyzed configurations, the marginal improvements achieved by larger sections demonstrate rapidly diminishing returns relative to their substantial cost penalties. Furthermore, the absolute deflection values for all configurations remain within typical serviceability limits for bridge structures, suggesting that the 16B section provides adequate structural performance while maintaining the most economical material utilization. This finding supports the adoption of 16B channels for similar structural applications, particularly in projects where cost optimization is a primary design criterion without compromising safety or serviceability requirements.
Conclusion and future work
This research investigates various steel-based strengthening strategies for deteriorated RC T-beam bridges through field testing and numerical analysis. The following conclusions can be drawn from this investigation: 1. The strengthening approach addressing transverse stiffness, shear capacity, and flexural strength proved highly effective in rehabilitating the deteriorated RC T-beam bridges. The reconstruction of flanges and diaphragms from dry joints to wet joints significantly enhanced transverse load distribution capabilities. The installation of diagonal steel strips successfully addressed shear deficiencies in the T-beam webs, providing additional resistance against diagonal crack propagation. 2. Among the three flexural strengthening methods examined, the steel channel strengthening (SCS) approach demonstrated superior performance. This method exhibited excellent composite behavior with the existing concrete structure, as evidenced by the linear strain distribution across the cross-section height. The cover plate strengthening (CPS) method provided improvements while maintaining effective composite action. The steel truss strengthening (STS) method, despite its substantial material requirements, achieved only moderate improvement due to incomplete composite behavior between the truss system and the concrete T-beam. The analysis highlights that achieving effective composite behavior is a governing factor for strengthening performance, and should be prioritized over increasing material quantity or structural complexity in practical strengthening design. 3. The FE models developed showed excellent correlation with experimental measurements across all strengthening configurations, confirming the validity of the numerical approach for predicting structural behavior. The parametric analysis of the SCS approach identified the 16B channel configuration is enough to reliably enhance the stiffness of T-beams, providing practical guidance for implementation in bridge strengthening projects.
While this research provides valuable insights into steel-based strengthening methods for RC T-beam bridges, several areas warrant further investigation to advance the field of bridge rehabilitation. Future research should focus on long-term performance monitoring to assess durability under extended service conditions, fatigue performance evaluation under repeated traffic loading, and development of advanced connection technologies to improve load transfer mechanisms. Additionally, comprehensive cost-benefit optimization considering life-cycle costs would facilitate broader implementation of these strengthening technologies.
Footnotes
Funding
The authors disclosed receipt of the following financial support for the research, authorship, and/or publication of this article: This research is financially supported by the National Key R&D Program of China (No. 2024YFC3810500), the National Natural Science Foundation of China (No. 52378289), and Research Fund for Advanced Ocean Institute of Southeast University (No. KP202407). Any opinions, findings, and conclusions or recommendations expressed in this publication are those of the authors and do not necessarily reflect the view of the sponsors.
Declaration of conflicting interests
The authors declared no potential conflicts of interest with respect to the research, authorship, and/or publication of this article.
Data Availability Statement
Some or all data, models, or code that support the findings of this study are available from the corresponding author upon reasonable request.