



Abstract
The challenge in applying machine learning for rapid structural seismic response prediction lies in establishing a reliable mapping between seismic intensity measures (IMs) and damage indicators. Current IMs are often inadequate due to the complex, non-linear interaction of multiple seismic factors, including intensity, source mechanism, and pulse effects, making single-indicator quantification difficult. This study addresses this gap by considering three distinct seismic wave types (near-field, far-field, and pulse waves) and establishing six multiple degrees of freedom (MDOF) structural models with varying periods in OpenSees. We selected maximum inter-story drift and maximum floor acceleration as critical damage indicators. An Extremely randomized trees (ET) algorithm was then utilized to develop the structural response prediction model. Through feature importance ranking, shapley additive explanations (SHAP) value analysis, and sensitivity analysis, the key IMs governing the structure’s maximum response were systematically identified. The efficacy of the proposed IMs was subsequently validated using three steel frame structures with different periods. The results demonstrate a significant improvement in the accuracy of the machine learning prediction model. The proposed IMs can achieve the same or higher prediction accuracy with fewer parameters. The prediction accuracy of the interstory drift ratio is improved by 34.87%, while the prediction accuracy of floor acceleration is enhanced by 26.58%, compared to previous studies using the same number of IMs. These findings provide crucial guidance for the selection of optimal IMs in machine learning applications for structural seismic response prediction.
Keywords
Highlights
• A comprehensive IM–response database is built using three ground-motion types and six structural periods • Machine-learning interpretability (SHAP, feature importance) is used to identify key IMs for different structural periods • The prediction accuracy of the interstory drift ratio is improved by 34.87%, while the prediction accuracy of floor acceleration is enhanced by 26.58%, compared to previous studies using the same number of IMs.
Introduction
Earthquakes are sudden, destructive, and unpredictable events that pose serious threats to human safety and economic stability worldwide. Rapid assessment of building damage shortly after an earthquake is essential for governments to formulate effective disaster relief strategies. In recent years, the rapid prediction of structural responses using machine learning algorithms has become a research hotspot in the field of earthquake engineering. The key to accurately predicting structural response lies in establishing a robust mapping relationship between seismic intensity measures (IMs) and structural responses. Existing studies primarily use inter-story drift (Ahmad and Phillips 2022), floor acceleration, and component deformation (Yan et al., 2024) as damage indicators to quantify the degree of structural damage, and these have been incorporated into design specifications (Fang 2021; Han et al., 2019). However, due to the high complexity of ground motion characteristics, it is difficult to quantify seismic actions using a single or even multiple parameters, making the selection of IMs particularly critical. Choosing appropriate IMs is therefore essential for accurately predicting the seismic performance of structures. Numerous scholars have carried out extensive studies on IM selection, which can generally be classified into two main approaches: the correlation coefficient method and machine learning-based methods.
Kostinakis et al. (2015) analyzed the correlation between 19 IMs and the damage states of high-rise frame structures under 64 seismic motions using the Spearman correlation coefficient. The results indicated that the spectral acceleration parameter (Sa) exhibited the highest correlation with structural damage, followed by the velocity spectrum intensity (VSI). Pinzón et al. (2020) evaluated the correlation between various IMs and the maximum inter-story drift of a two-dimensional steel frame based on the determination coefficient (R2), and found that the correlation between peak ground acceleration (PGA) and structural response was the weakest. They also proposed a new parameter that simultaneously considers peak ground velocity (PGV) and energy duration. Other researchers have similarly investigated the relationship between commonly used seismic parameters and structural responses through correlation analysis to identify effective IMs (Yakut and Yılmaz 2008; Yang et al., 2019; Zhai et al., 2013).
Xu et al. (2022a) employed support vector machine (SVM), logistic regression (LR), and decision tree algorithms to develop predictive models and identify optimal IMs for different building types. Morfidis and Kostinakis (2017) applied neural network algorithms to predict the maximum inter-story drift of structures, from which the damage states of reinforced concrete buildings were determined, and the most suitable IM combinations were recommended. Zhang et al. (2023a) selected five IMs to predict maximum inter-story drift and compared the prediction accuracy of an active learning algorithm with that of the Gradient Boosting Trees algorithm. Nguyen et al. (2022) used three different machine learning algorithms to predict the seismic responses of steel frame structures. Ding et al. (2023) considered five seismic parameters: PGA, PGV, acceleration spectrum intensity (ASI), effective peak acceleration (EPA), and Sa, and applied the NGBoost algorithm to predict structural seismic losses. Vazirizade et al. (2017) established a mapping relationship between maximum inter-story drift and component cross-section using an artificial neural network (ANN). Karbassi et al. (2014) employed a decision tree algorithm to predict the structural damage index and assess the damage state. In addition, many other scholars have carried out related studies (Bhatta et al., 2024; Gharagoz et al., 2023; Park et al., 2025; Shen et al., 2025; Xu et al., 2022b; Zhang et al., 2023b; Zhu et al., 2024).
At present, although many researchers have investigated the impact of different IMs on the prediction accuracy of structural seismic response, several research gaps remain: (1) The influence of different ground motion types on IM selection is not adequately differentiated. When predicting structural seismic response, different IMs should ideally be selected for various types of ground motions (such as near-field, far-field, and pulse-like), yet current research often overlooks this distinction. (2) Insufficient consideration of the structural period’s effect on the selection of IMs. While existing studies may conduct nonlinear time-history analyses on structures with various periods to build response databases, the final recommendations for IMs often lack a systematic classification or targeted advice based on these structural periods. (3) Lack of interpretability analysis for the selection of different IMs. Current research primarily emphasizes the predictive performance of machine learning models, neglecting in-depth investigation and interpretability analysis of the underlying mechanisms that justify the choice of one IM over another.
This paper systematically investigates the effects of near-field pulse-like ground motions, near-field non-pulse ground motions, and far-field ground motions on the prediction accuracy of structural seismic responses for short-, medium-, and long-period structures. First, correlation analysis and machine learning techniques are employed to identify key IMs influencing structural responses from an initial set of 25 commonly used IMs. Next, a structural response database was established through nonlinear time-history analysis of six steel frames with different fundamental periods. Multiple machine learning algorithms were then evaluated, and a high-precision prediction model was developed using key IMs as inputs. Subsequently, interpretability analysis using feature importance and SHAP values identified the most influential IMs for different structure types and ground motion categories. Finally, validation on three steel frames with distinct periods confirmed the effectiveness and generalizability of the proposed IMs for predicting seismic responses.
Selection of seismic intensity measures
Selection of ground motion
Significant distinctions exist between near-field and far-field ground motions. The velocity time histories of near-field ground motions typically exhibit distinct pulse characteristics, and their spectral properties differ substantially from those of far-field ground motions, often resulting in more severe structural damage. In the selection of ground motion records, this study divides the seismic waves into three categories: near-field non pulse ground motions, near-field pulse-type ground motions, and far-field ground motions. Far-field ground motions are defined as those with a magnitude greater than 6.5 and an epicentral distance greater than 30 km. The selection follows three main criteria: (1) Site type; (2) Whether the epicentral distance exceeds 30 km; (3) Whether the record contains a clear pulse. Based on these criteria, a total of 900 horizontal ground motion records were randomly selected from the pacific earthquake engineering research (PEER) center database, comprising 300 near-field pulse-type ground motions, 300 near-field non-pulse ground motions, and 300 far-field ground motions. The spatial distribution of the selected IMs is presented in Figure 1. Spatial distribution of IMs.
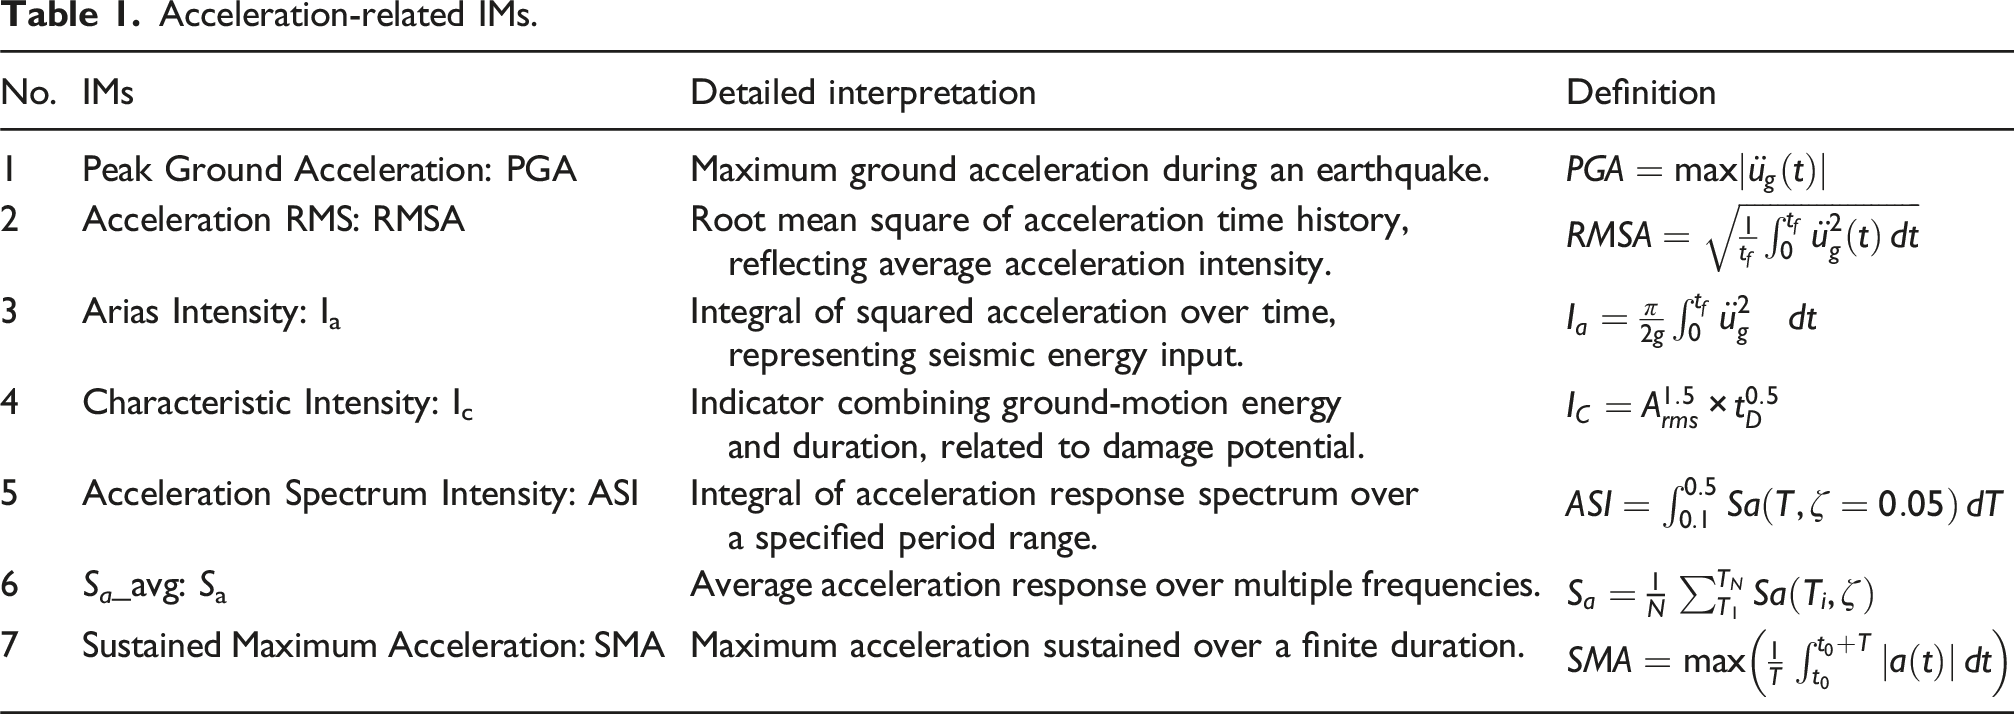
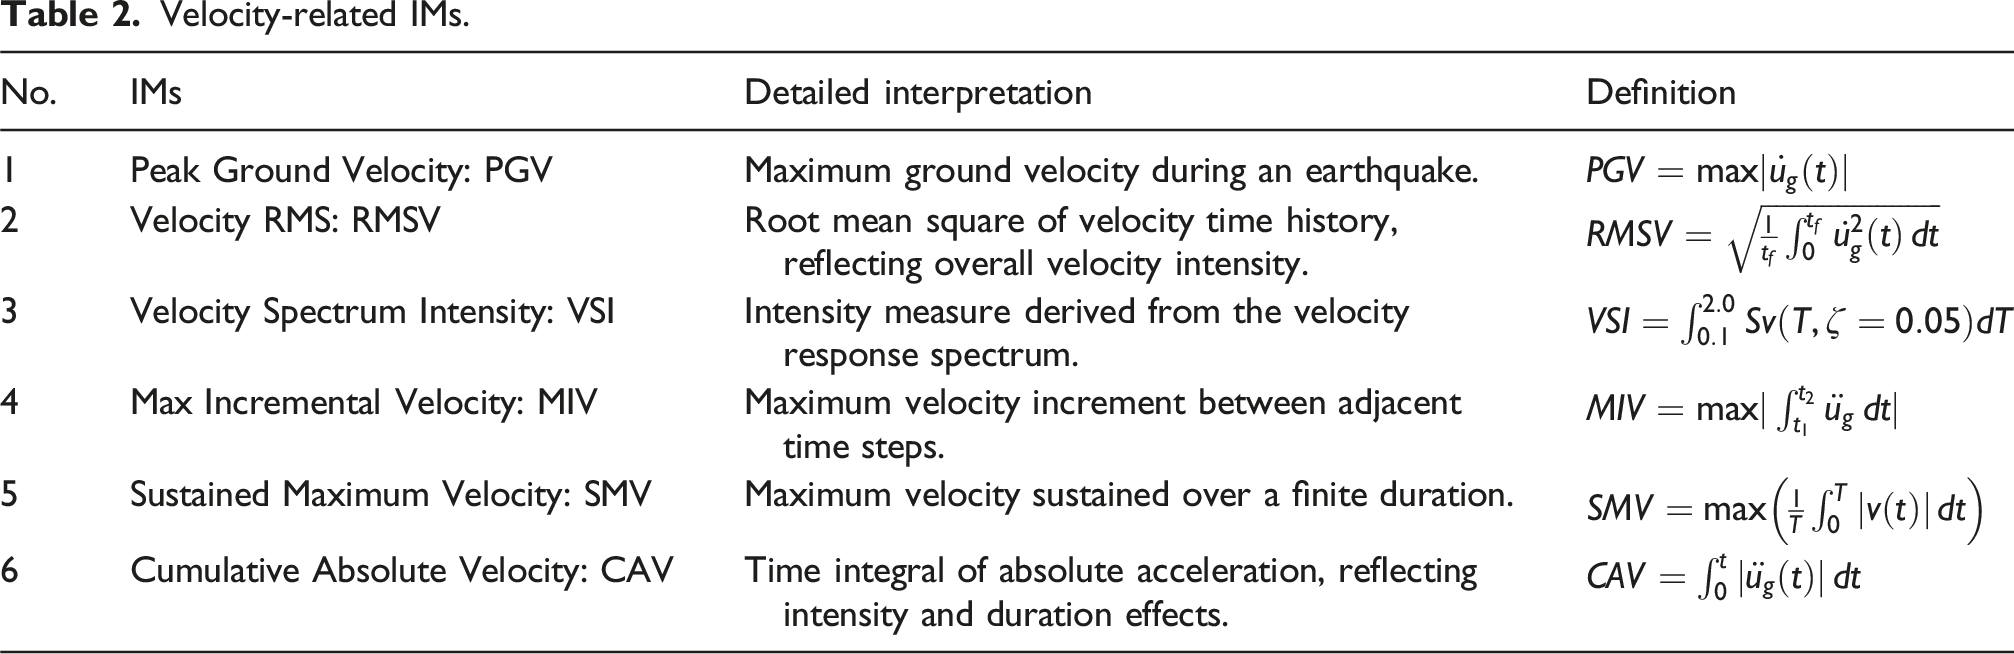
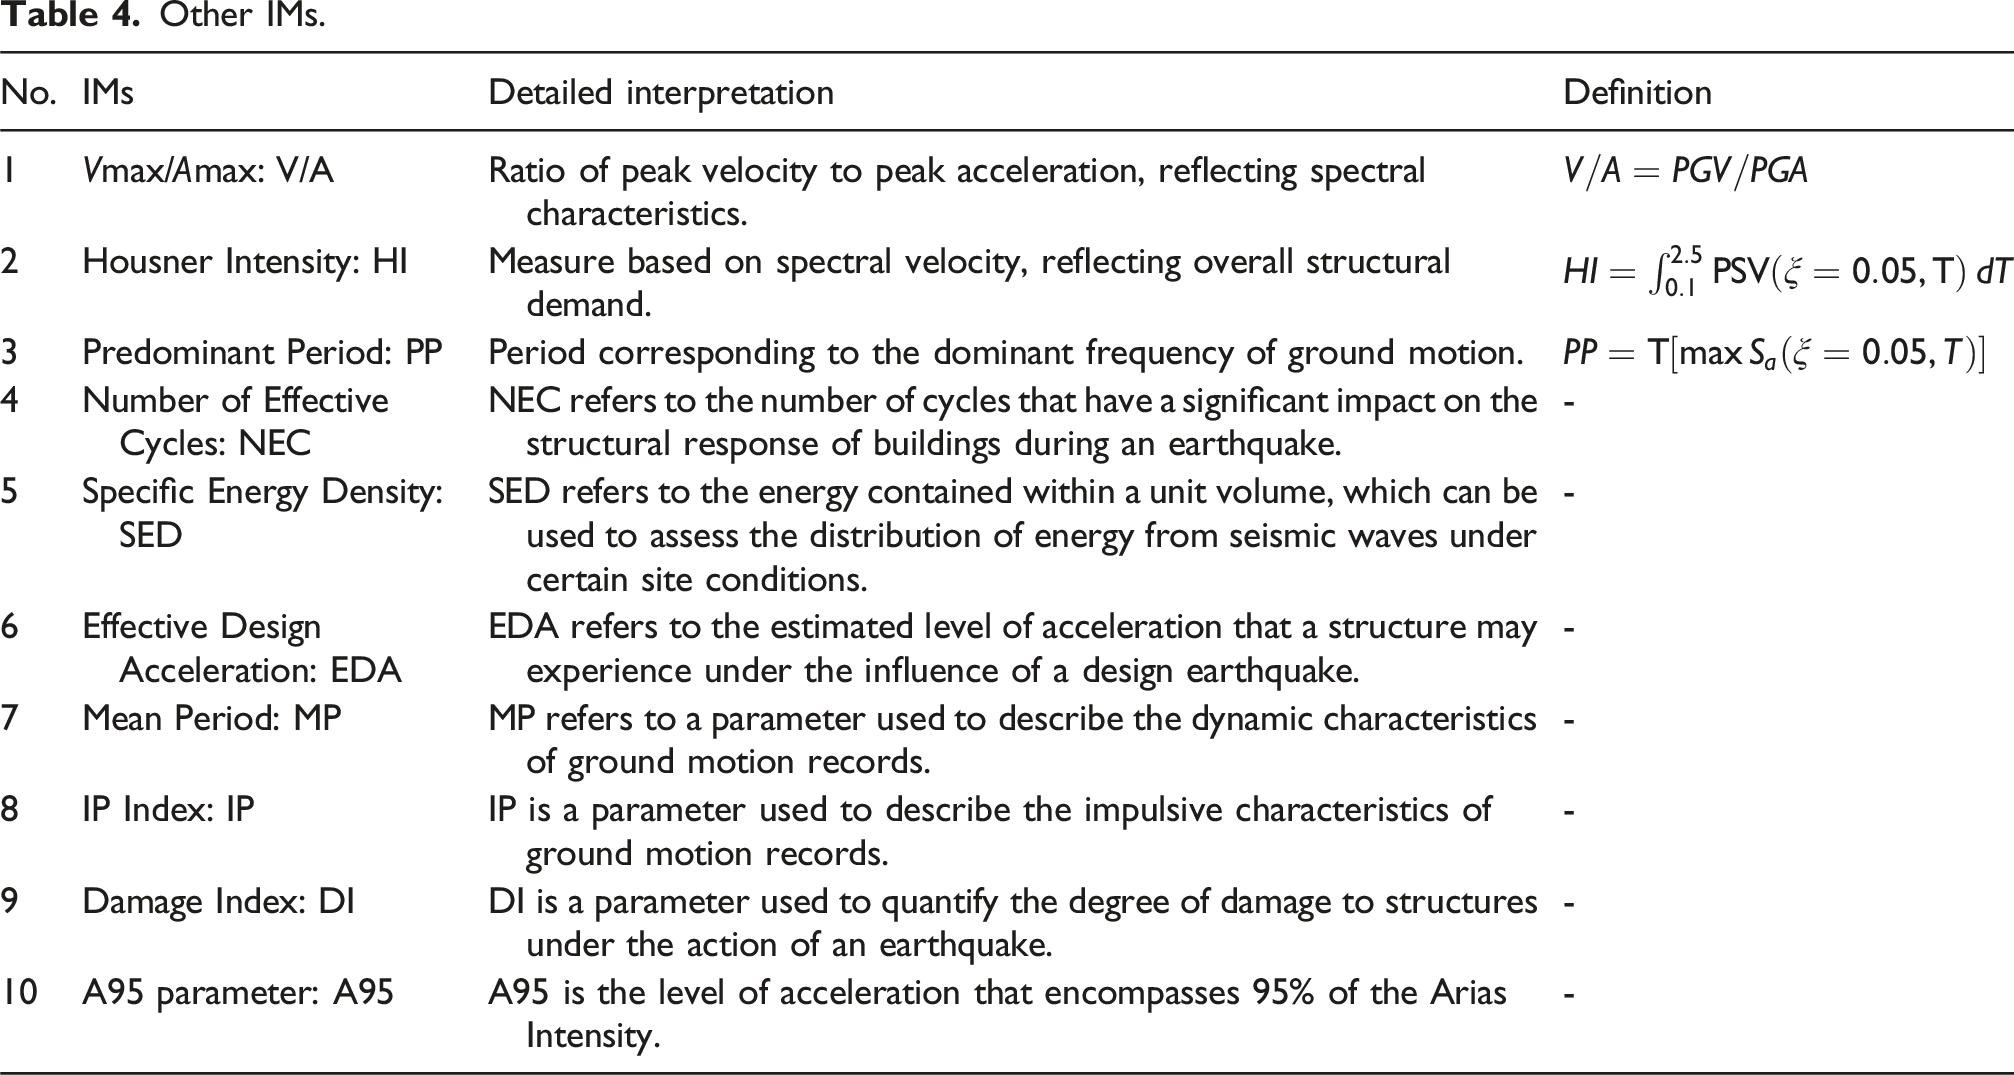
Selection of IMs
Acceleration-related IMs.
Velocity-related IMs.
Displacement-related IMs.

Other IMs.
Correlation analysis of seismicmotion parameters
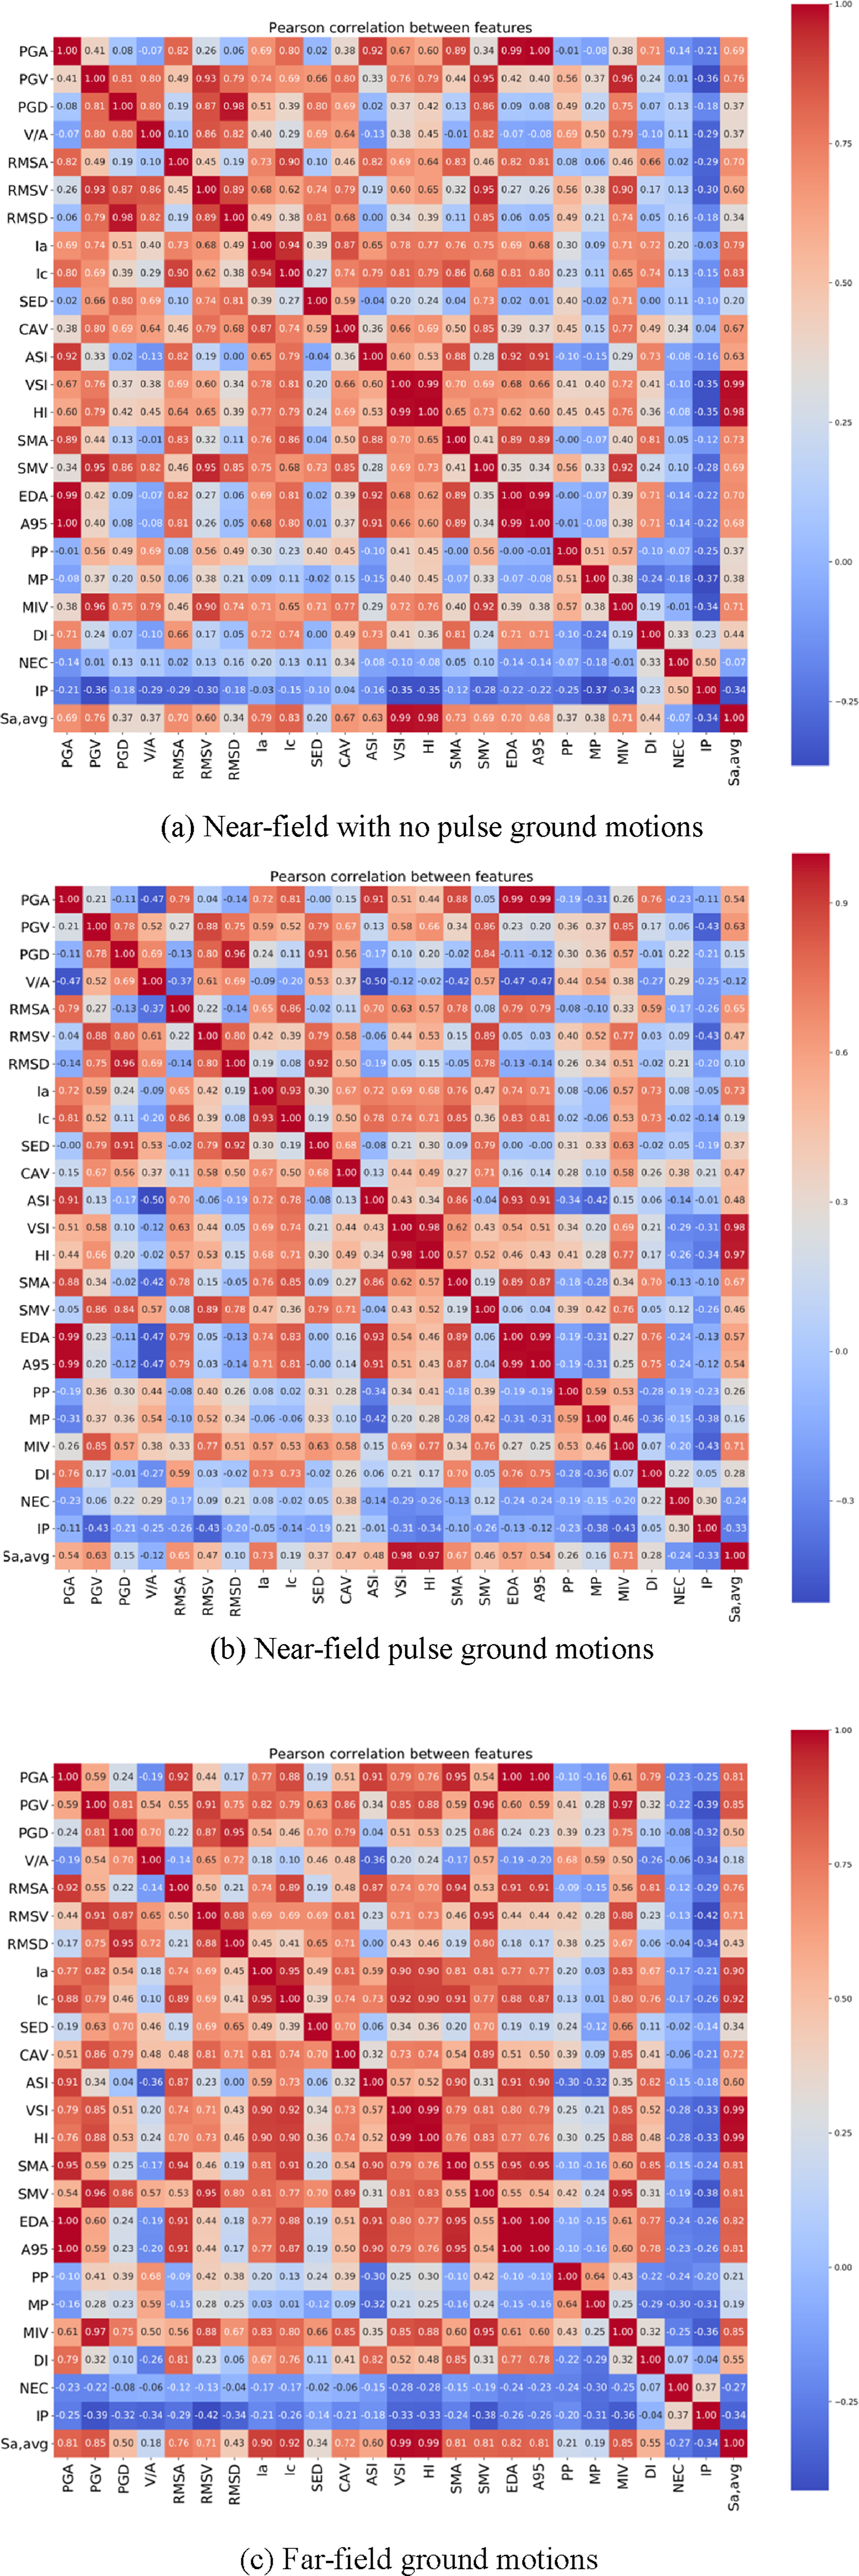
All IMs were computed using the SeismoSignal software. To quantitatively evaluate the correlations among IMs, the Pearson correlation coefficient was calculated between each IM and the remaining 24 IMs. The Pearson coefficient quantifies the linear relationship between two variables and is defined as the ratio of their covariance to the product of their standard deviations, as expressed in equation (1). The Pearson correlation coefficient heatmap among the IMs is shown in Figure 2, where both the horizontal and vertical axes represent IMs. The colour of each grid cell corresponds to the correlation coefficient between a pair of IMs, as indicated by the accompanying colour scale. Pearson correlation coefficient heatmap of IMs.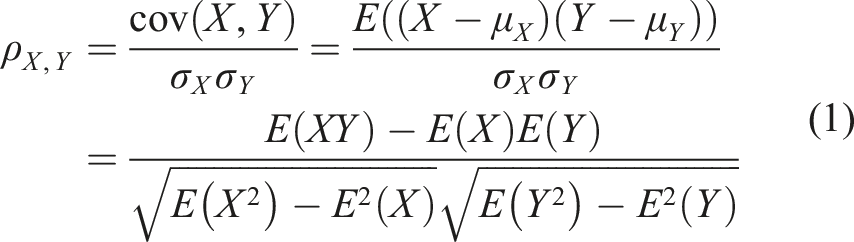
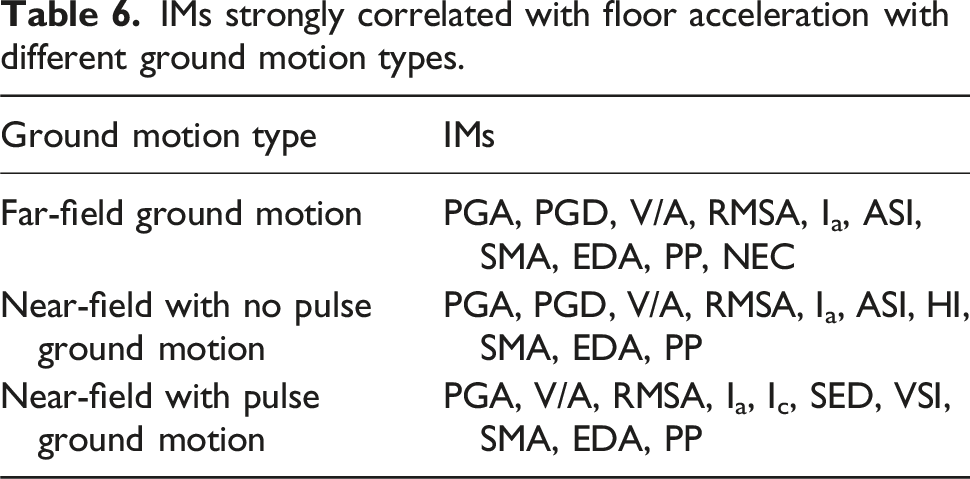
After obtaining the Pearson correlation coefficients among all parameters, the first round of data dimensionality reduction was conducted following the procedure illustrated in Figure 3. In this study, IMs with a Pearson coefficient greater than 0.8 were considered strongly correlated. To determine which highly correlated parameters should be retained, based on the assumption that ground motion parameters and structural responses exhibit an approximately log-linear relationship, the dataset was transformed into the logarithmic scale. The correlation coefficients between the IMs and two structural response indicators (maximum inter-story drift and maximum floor acceleration) of the two-story MDOF structure were calculated and further screened. Finally, the remaining IMs were identified as the input parameters for subsequent machine learning models. The IMs retained for the three types of ground motions after correlation analysis are summarized in Tables 5 and 6. Flowchart of IM screening. IMs strongly correlated with inter-story drift with different ground motion types. IMs strongly correlated with floor acceleration with different ground motion types.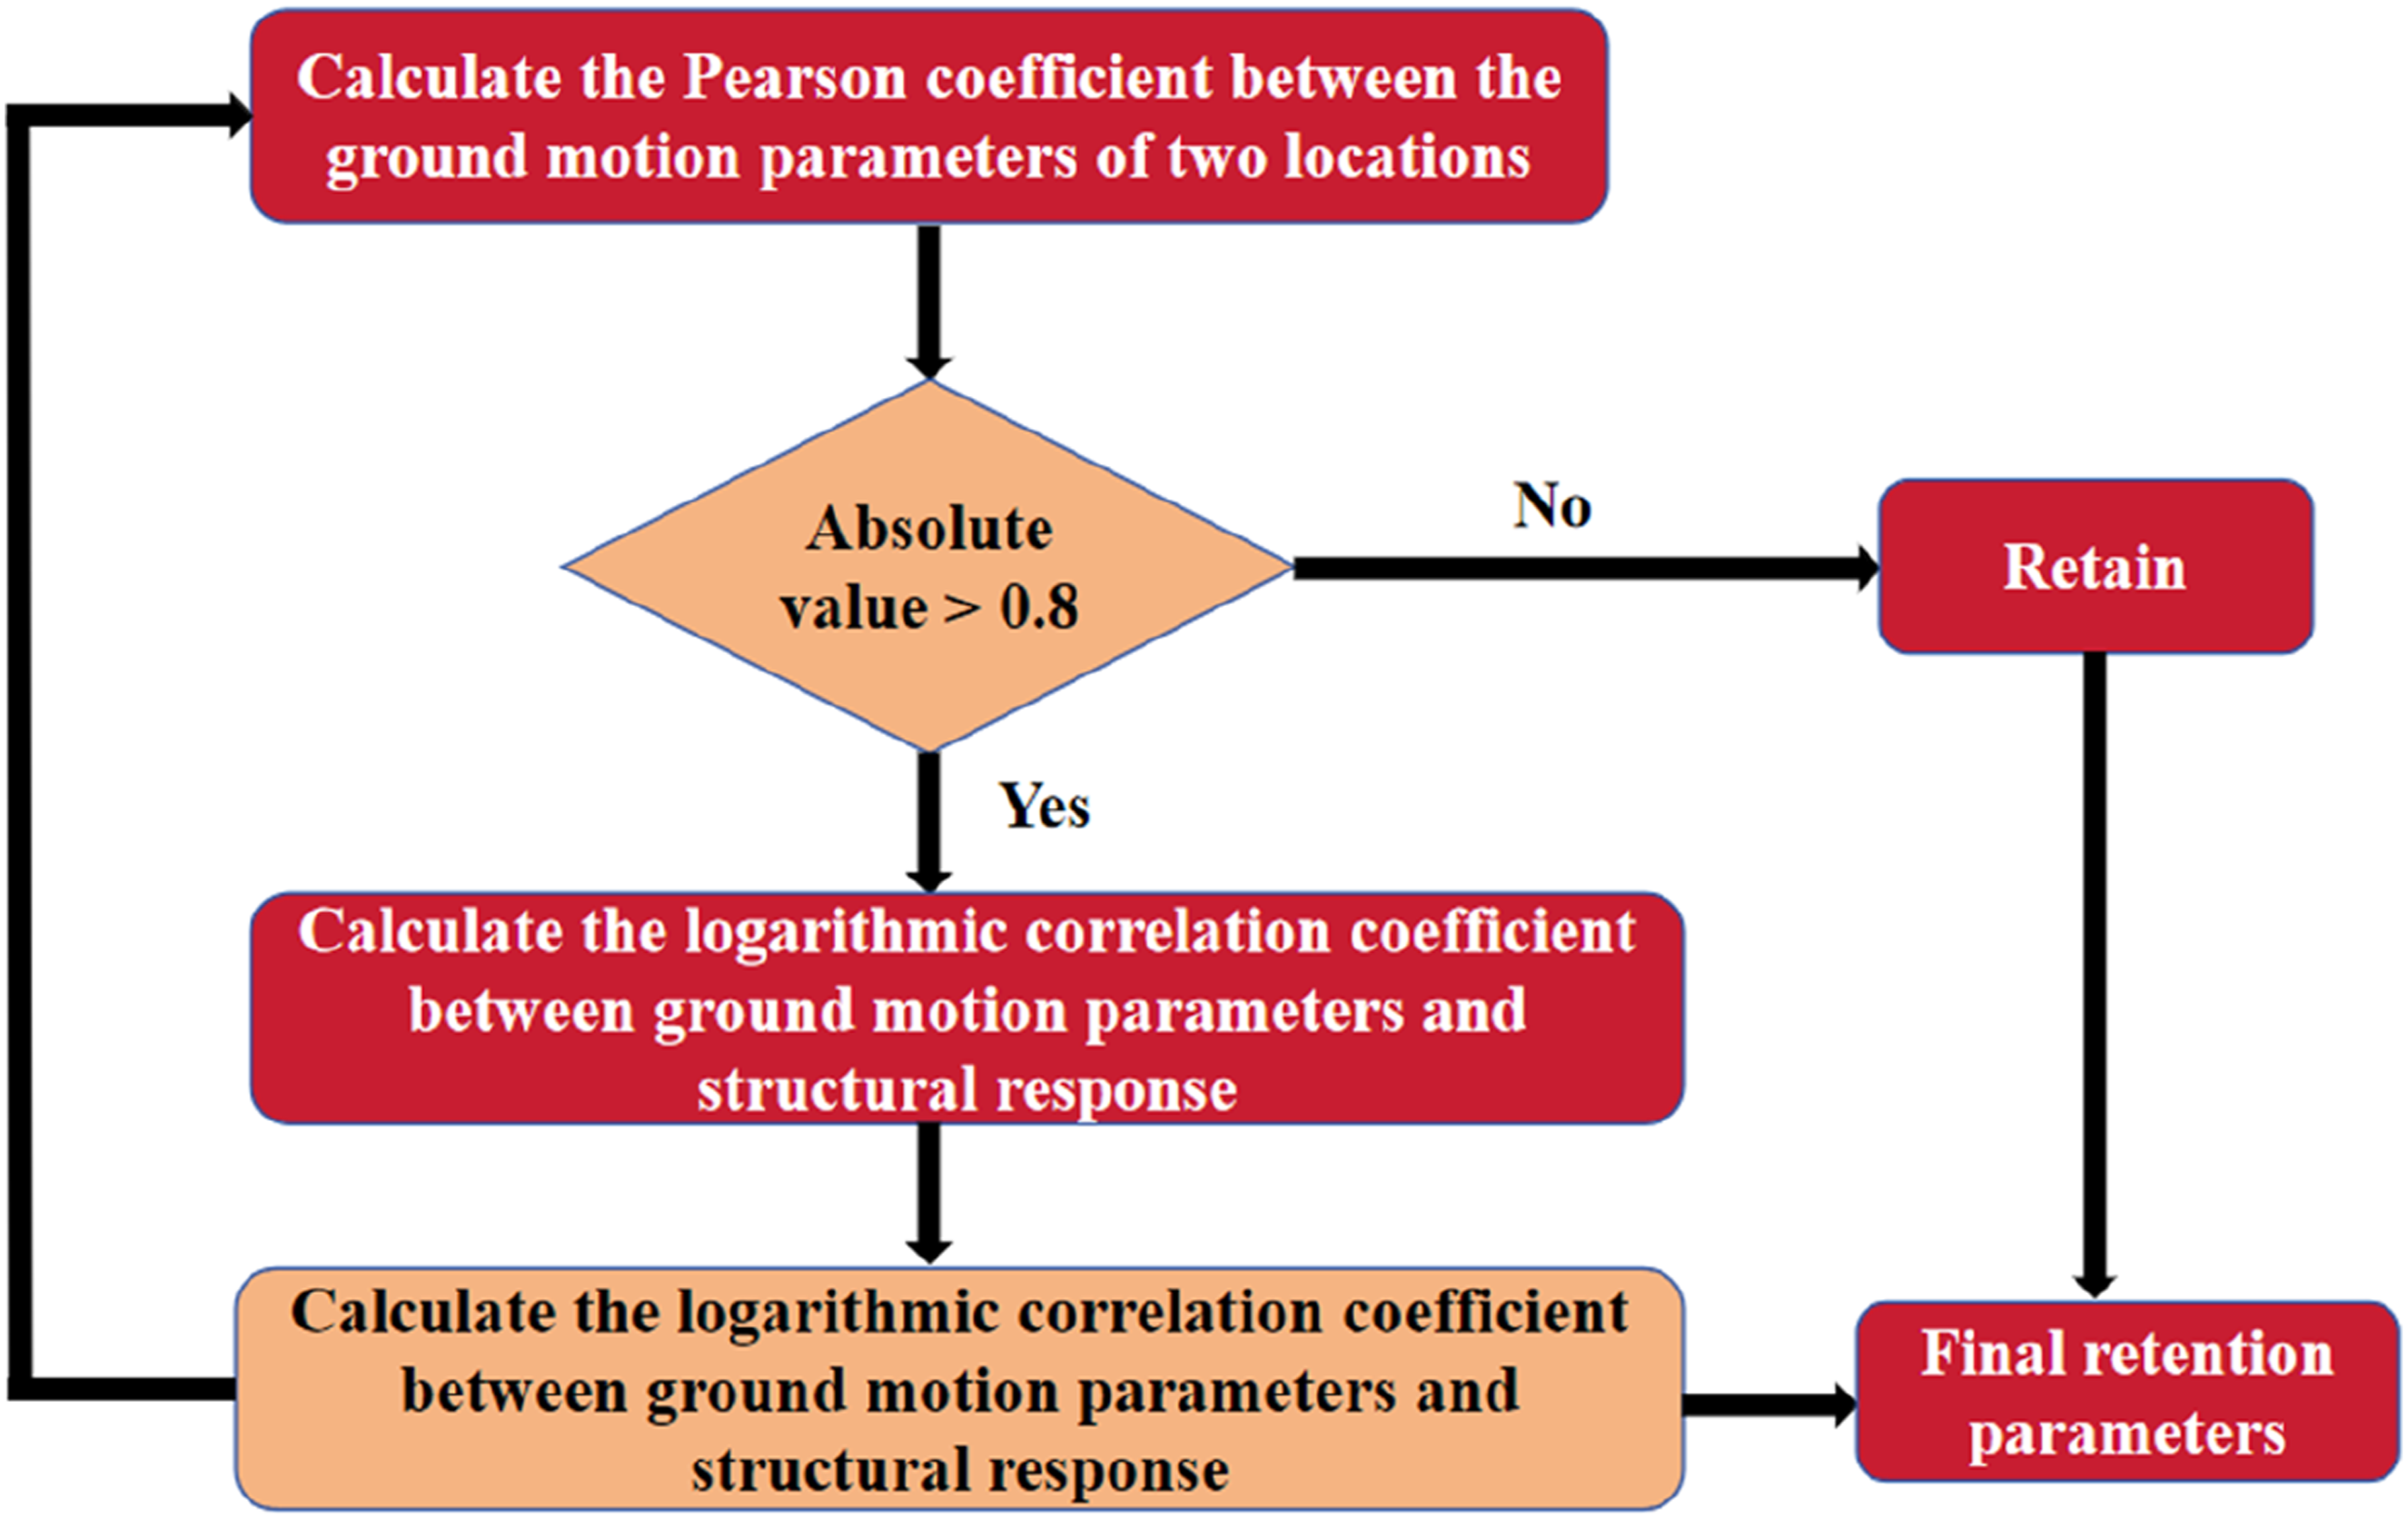

Construction of a structural response database
Establishment of numerical model
This study employed OpenSees to develop the numerical models. Considering that building structures are typically MDOF systems exhibiting higher-order mode effects, the definition of the elastic-plastic MDOF system adopted in this study follows the approach proposed in (Ye et al., 2009), as illustrated in Figure 4. In the MDOF analytical model, the inter-story shear force and inter-story drift are described using a bilinear hysteretic constitutive relationship, as shown in Figure 5. All stories in the MDOF system are assumed to have identical story height, mass and lateral stiffness. The mass of each story is taken as 600 t. The initial story stiffness is set to 106 KN/m. The post-yield stiffness ratio is defined as 0.1. Rayleigh damping is adopted to represent structural damping, with a damping ratio of 5%. The material behavior is defined using the Steel01 model. The fundamental period of the structure is varied by changing the number of stories. A total of six MDOF models are established, with 2, 4, 8, 10, 15, and 20 stories. The corresponding fundamental periods are 0.18 s, 0.41 s, 0.89 s, 1.44 s, 1.87 s, and 2.28 s, respectively. These models represent structures with short-, medium-, and long-period characteristics in seismic analysis. MDOF system. MDOF bilinear hysteresis constitutive model.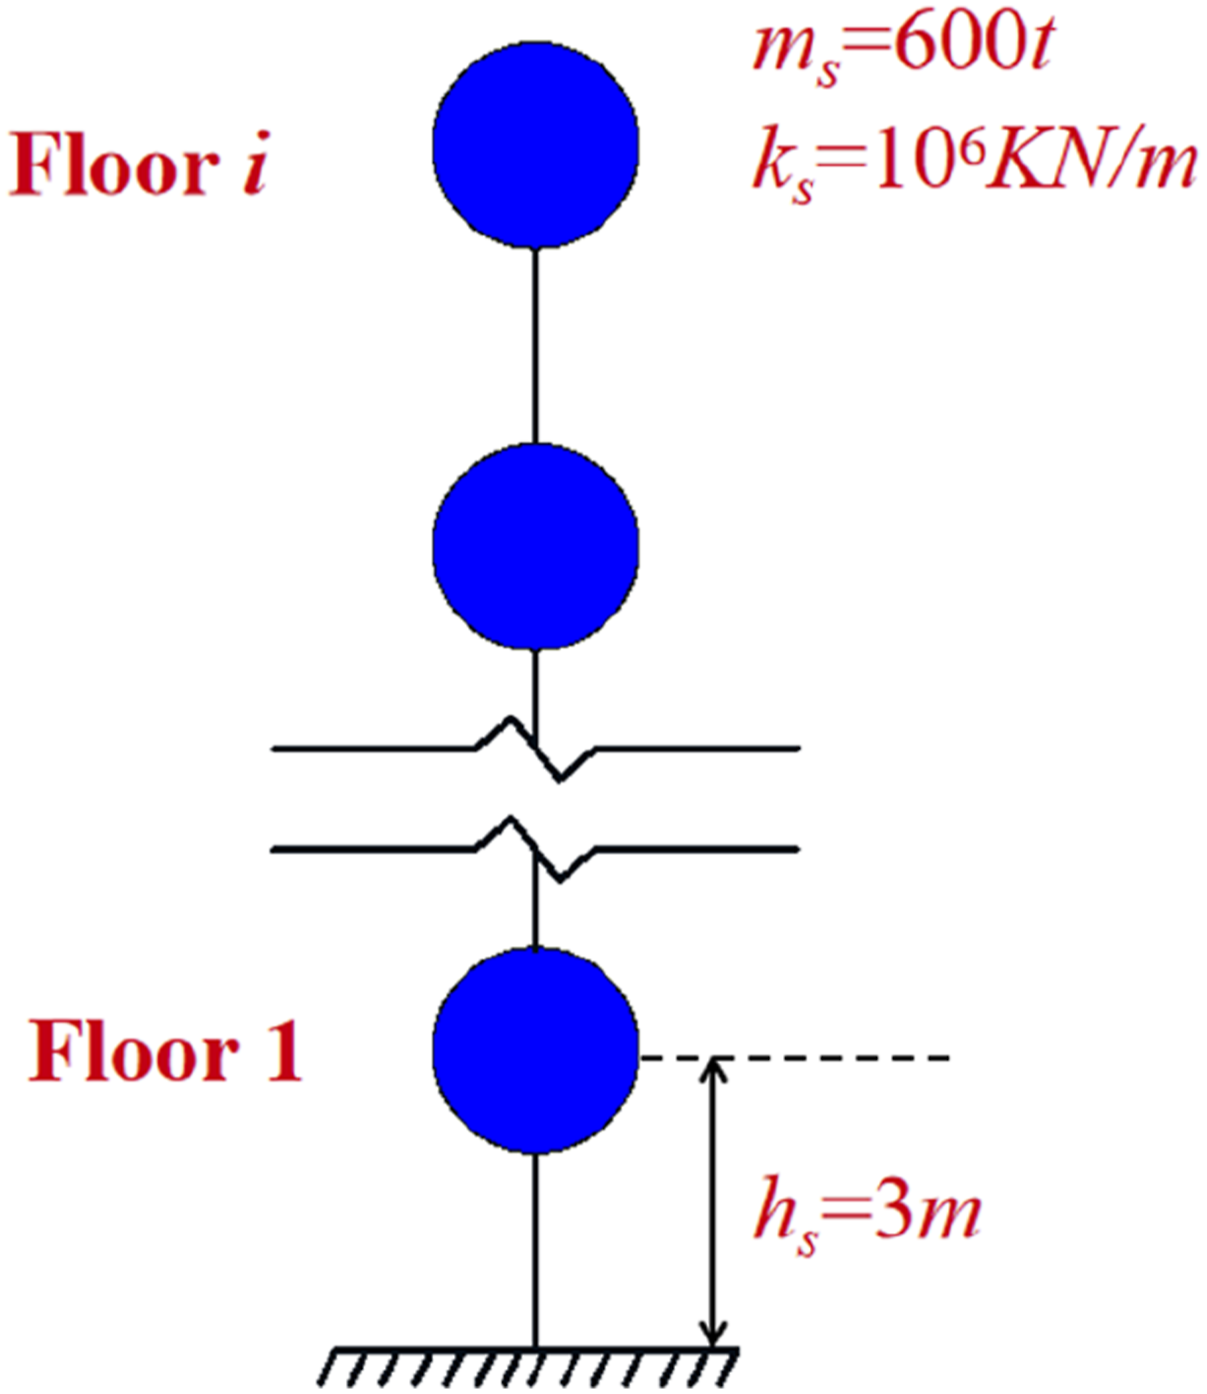

Structural seismic response database
In this study, the inter-story drift and floor acceleration were selected as the damage indices of structural response (Wang and Luo, 2025; Tao et al., 2024; Kaya and Binici, 2025). According to the Code for Seismic Design of Buildings (China), an inter-story drift of 1/50 was adopted as the collapse criterion. The 900 ground motion records documented in the foregoing discussion were used to perform nonlinear time-history analyses of the MDOF structures, resulting in a total of 10,800 data sets of inter-story drift and floor acceleration. The maximum inter-story drift and maximum floor acceleration were extracted as representative damage indices to construct the structural response database. The distributions of these two indices under different types of ground motions are illustrated in Figure 6. As shown in the figure, 6.96% of the maximum inter-story drift data exceed the 1/50 limit, and 26.35% of the maximum floor acceleration data exceed 0.4 g, indicating that the structures experienced significant damage. Distribution of maximum structural response.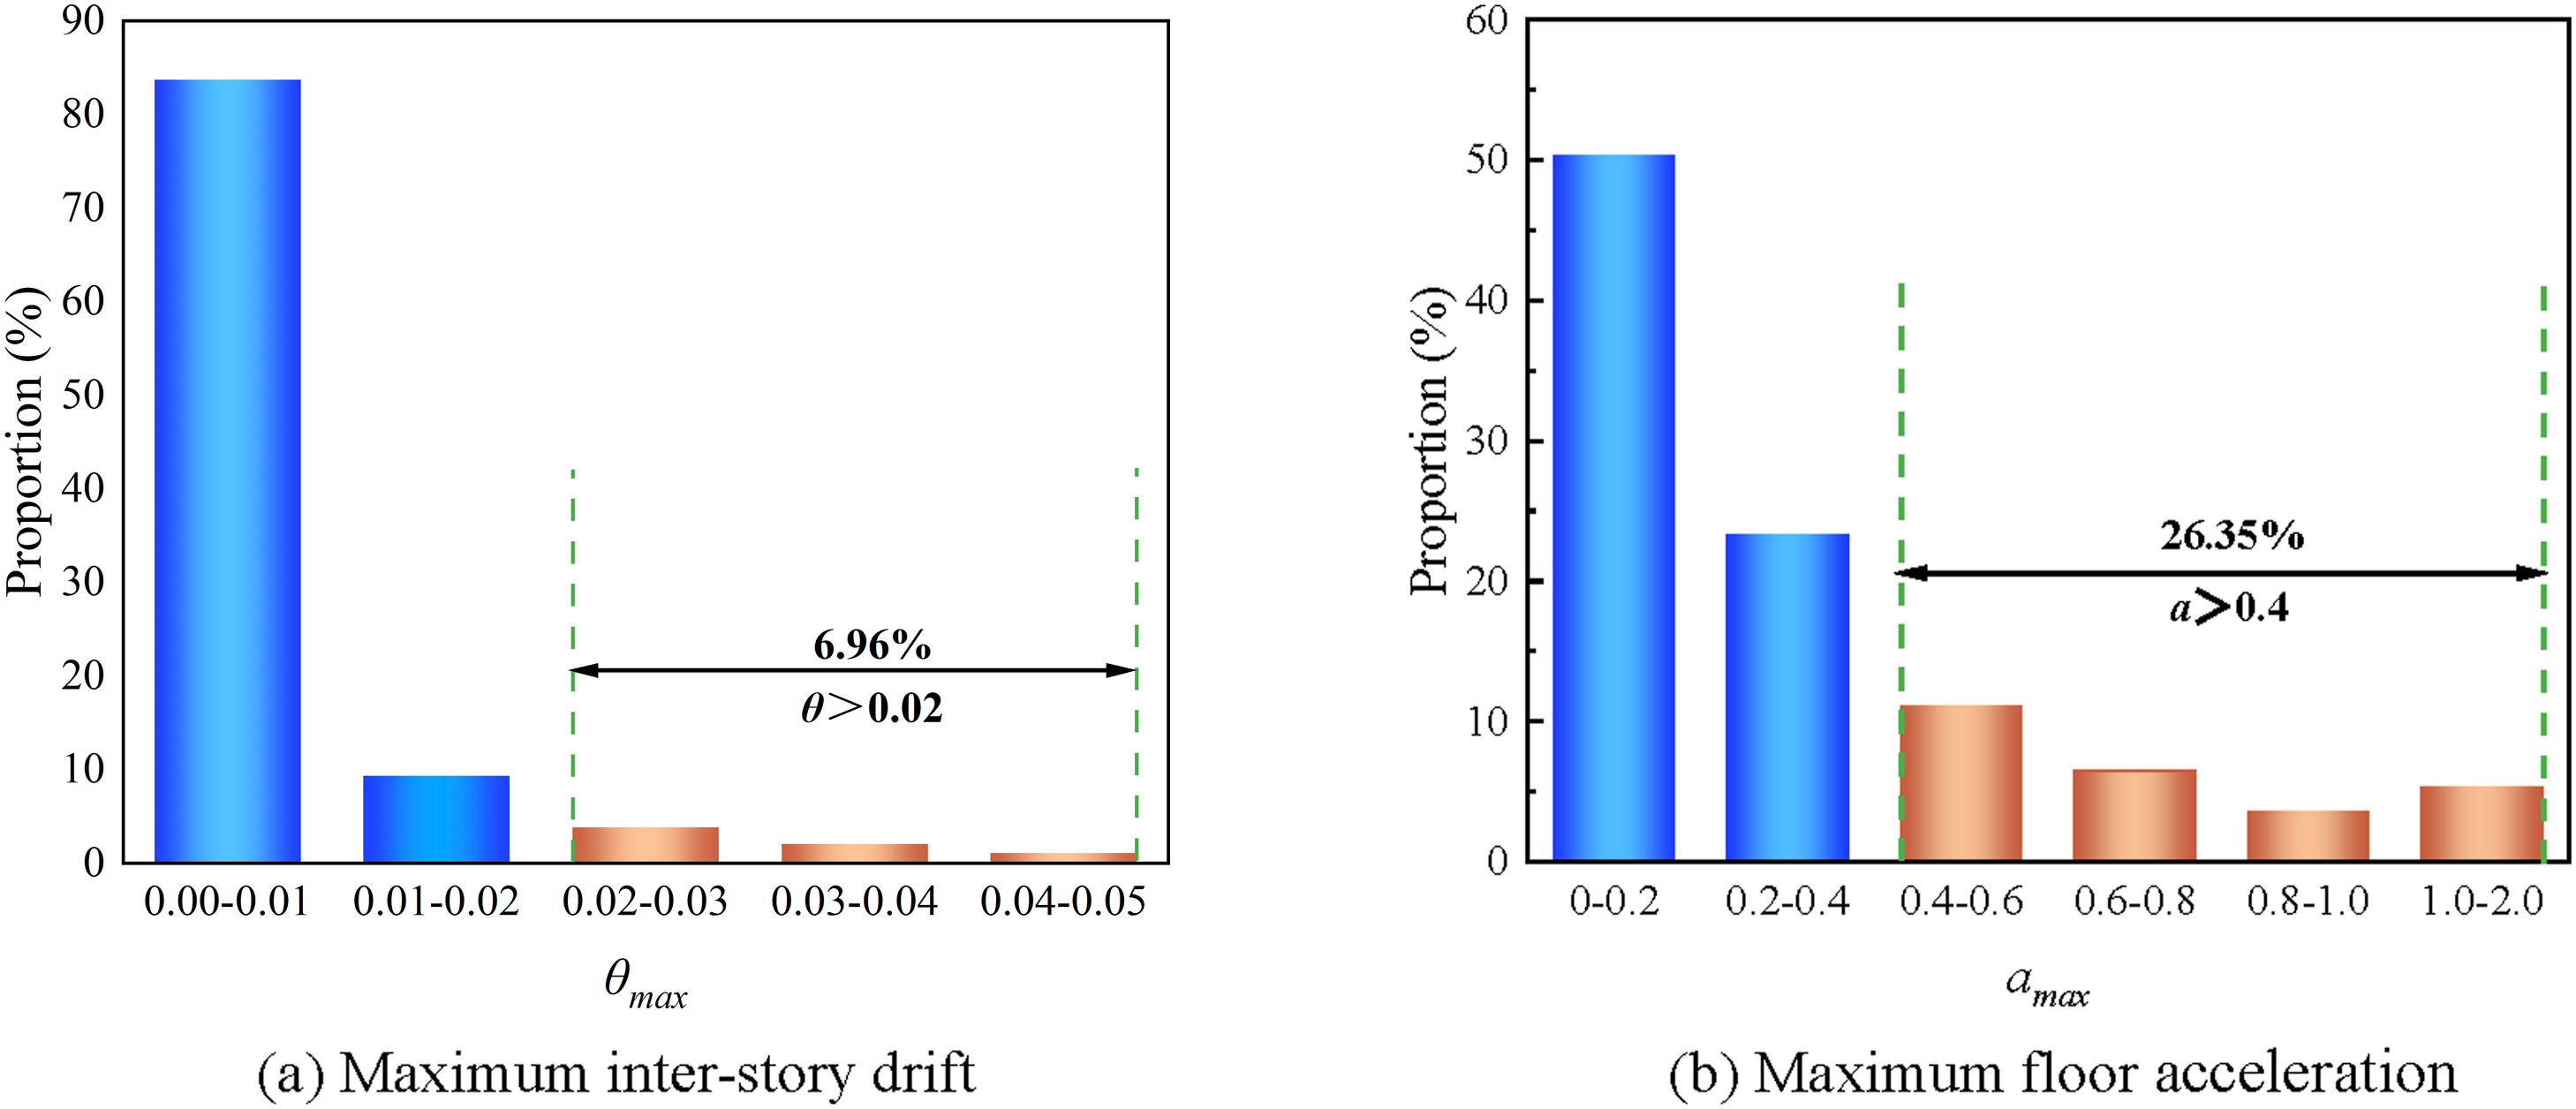
Establishment of machine learning prediction model
Overview of integrated algorithms
This study employed three commonly used ensemble algorithms as candidate models: Random forest (RF), ET, and AdaBoost. Both RF and ET are bagging-based algorithms that use multiple decision trees for prediction but differ in tree construction. RF randomly selects a subset of features for node splitting to enhance model diversity and generalization, whereas ET introduces additional randomness by selecting both features and split points at random, further improving diversity. AdaBoost, a boosting-based algorithm, iteratively adjusts sample weights according to the performance of weak learners, emphasizing previously misclassified samples to enhance overall model accuracy.
Selection of machine learning model
Comparison of model performance in predicting inter-story drift.

Comparison of model performance in predicting floor acceleration.

Although different machine learning models exhibit high correlation in prediction results, comparative analysis among models remains necessary. On the one hand, high prediction accuracy is achieved based on dataset expansion and systematic data preprocessing, while under limited sample sizes or varying structural conditions, noticeable differences in prediction performance still exist among algorithms. On the other hand, models differ in error magnitude, stability, and generalization capability. Through comprehensive evaluation using multiple metrics, models with lower errors and stronger robustness can be identified. In addition, model comparison provides methodological support for subsequent ground motion parameter importance analysis, contributing to the development of a seismic response prediction framework with both high accuracy and interpretability.
It can be seen that the ET algorithm achieved the best overall performance among the three models. It yielded the highest R2 value, while the MAE, MSE, RMSE, and MAPE values were all comparatively lower. Therefore, the ET algorithm was selected for subsequent model training.
Structural response prediction results based on the ET algorithm
Prediction results
Based on the ET algorithm, the input parameters were constructed from the results of the correlation analysis, while the output parameters were the maximum inter-story drift and maximum floor acceleration. The dataset was divided into training and testing subsets in a 9:1 ratio. The predicted maximum inter-story drift and maximum floor acceleration of MDOF systems with three different fundamental periods are shown in Figures 7–12. Inter-story drift prediction accuracy of short-period MDOF structures. Inter-story drift prediction accuracy of medium-period MDOF structures. Inter-story drift prediction accuracy of long-period MDOF structures. Floor acceleration prediction accuracy of short-period MDOF structures. Floor acceleration prediction accuracy of medium-period MDOF structures. Floor acceleration prediction accuracy of long-period MDOF structures.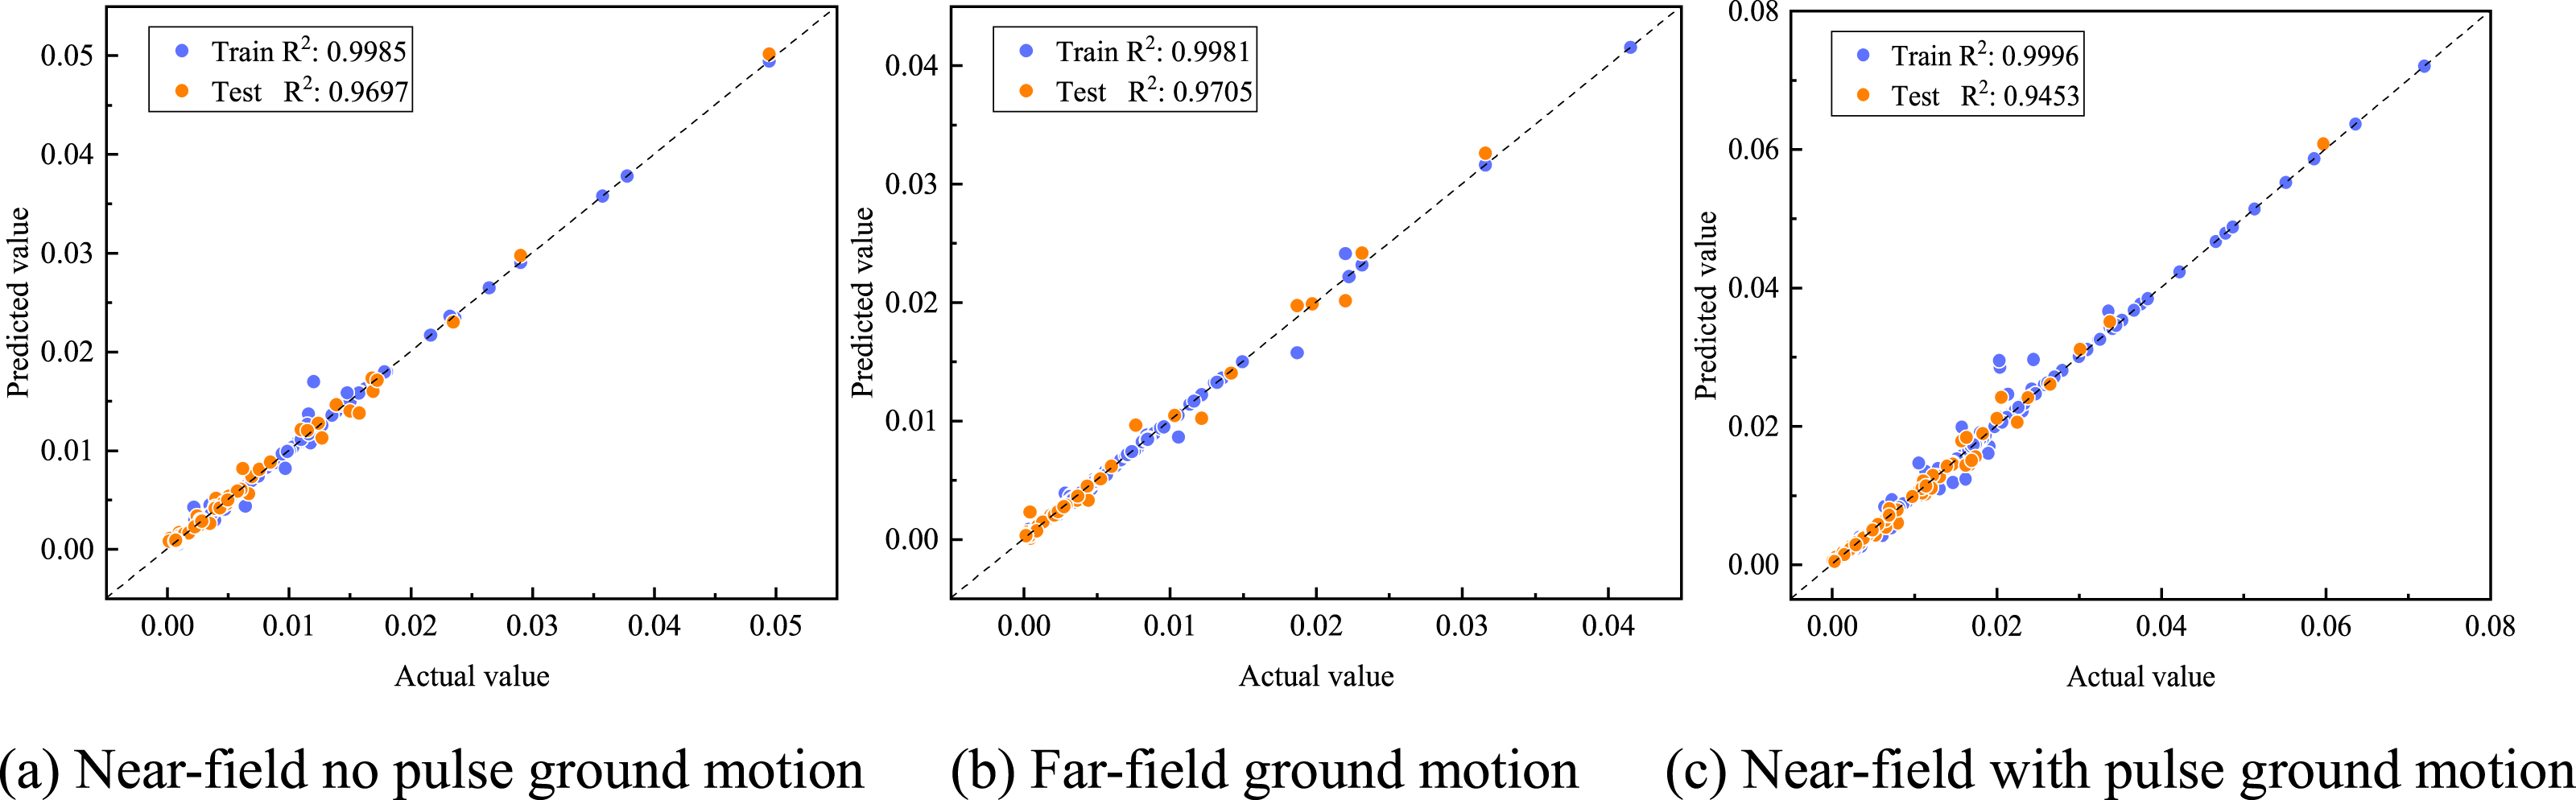
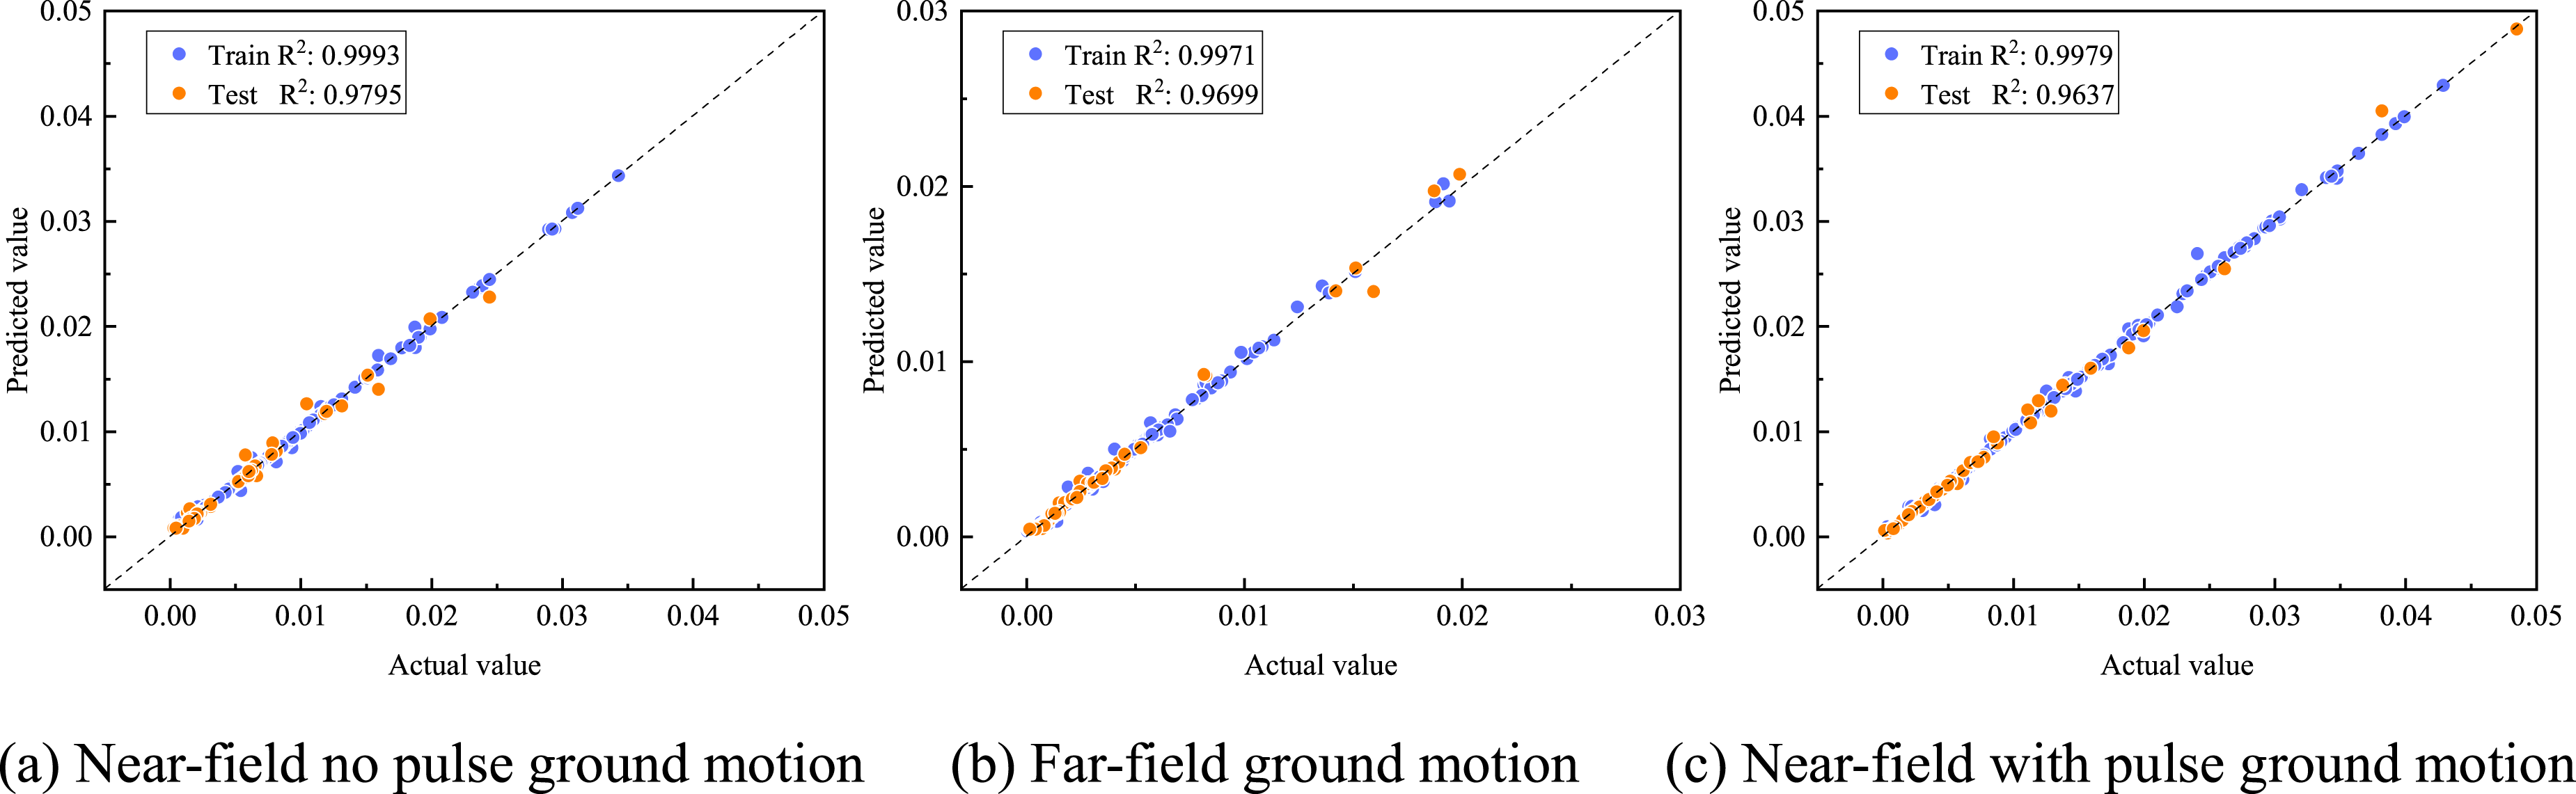
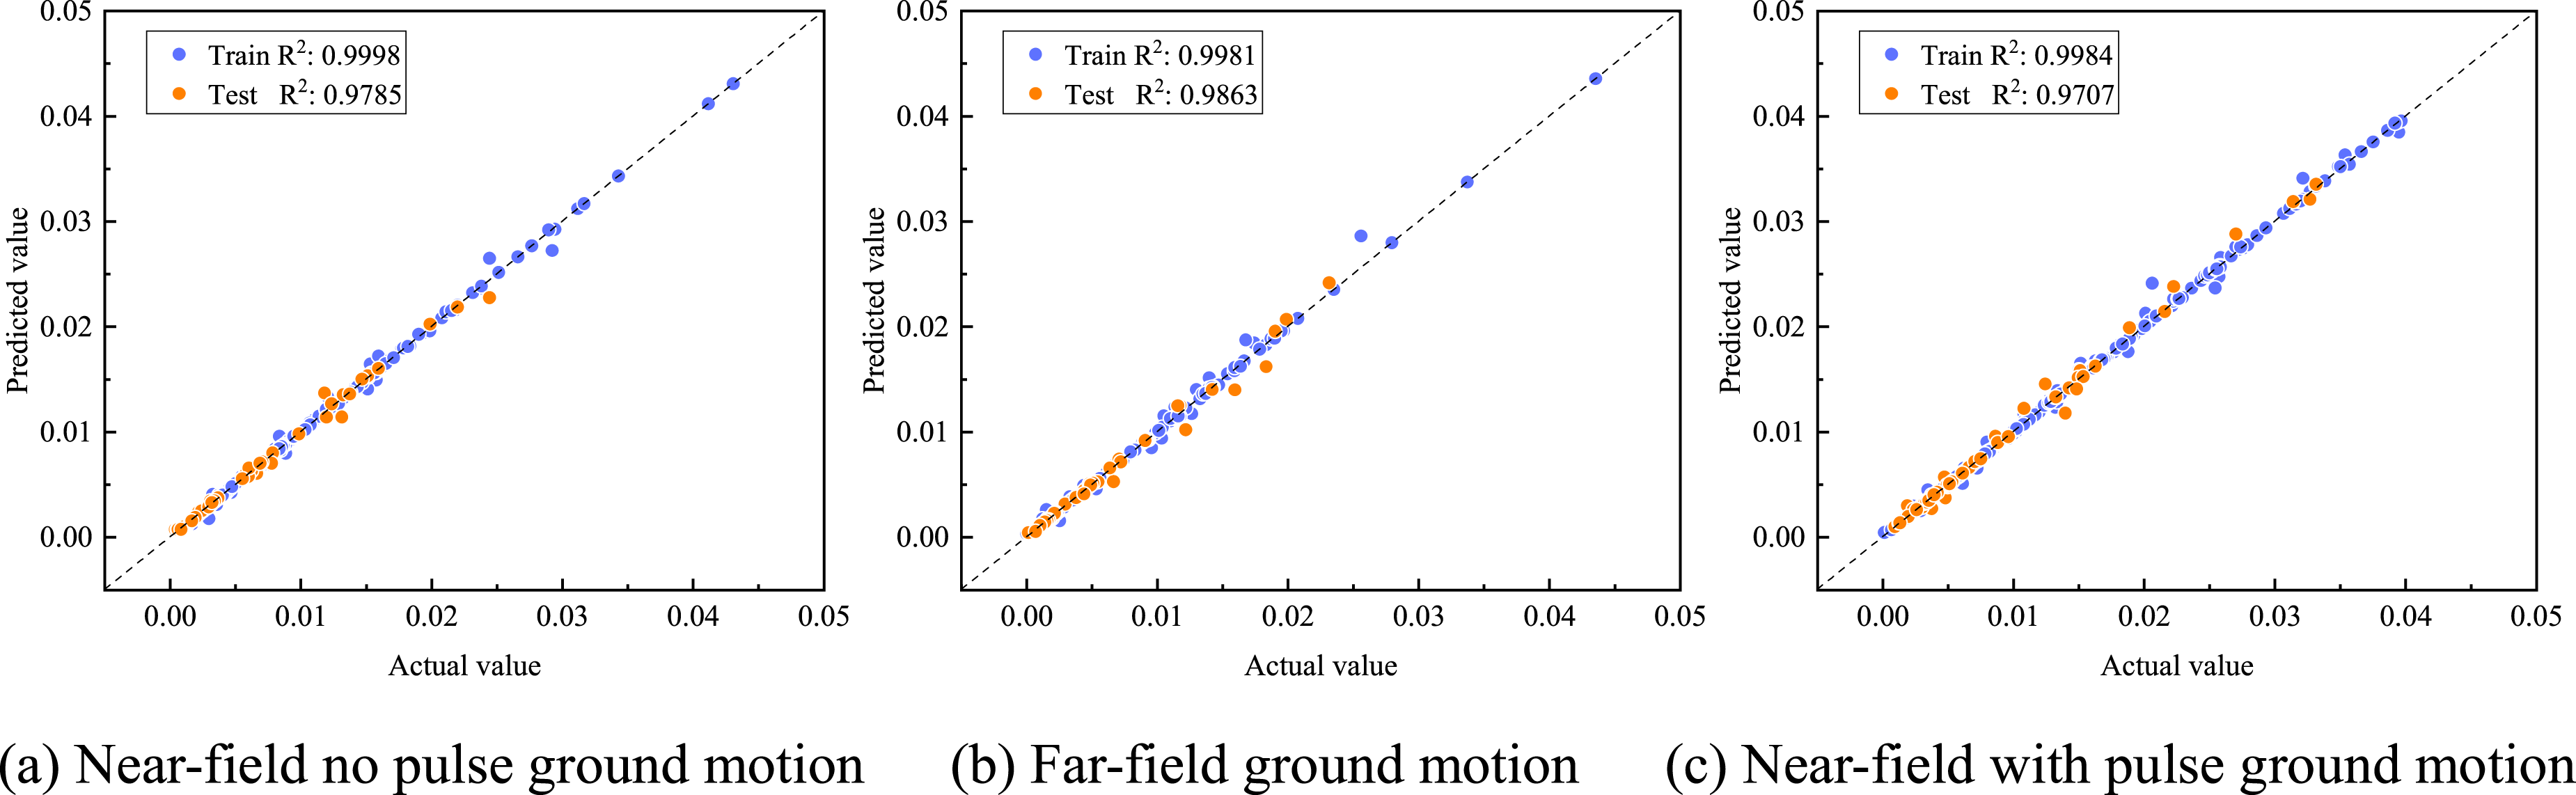
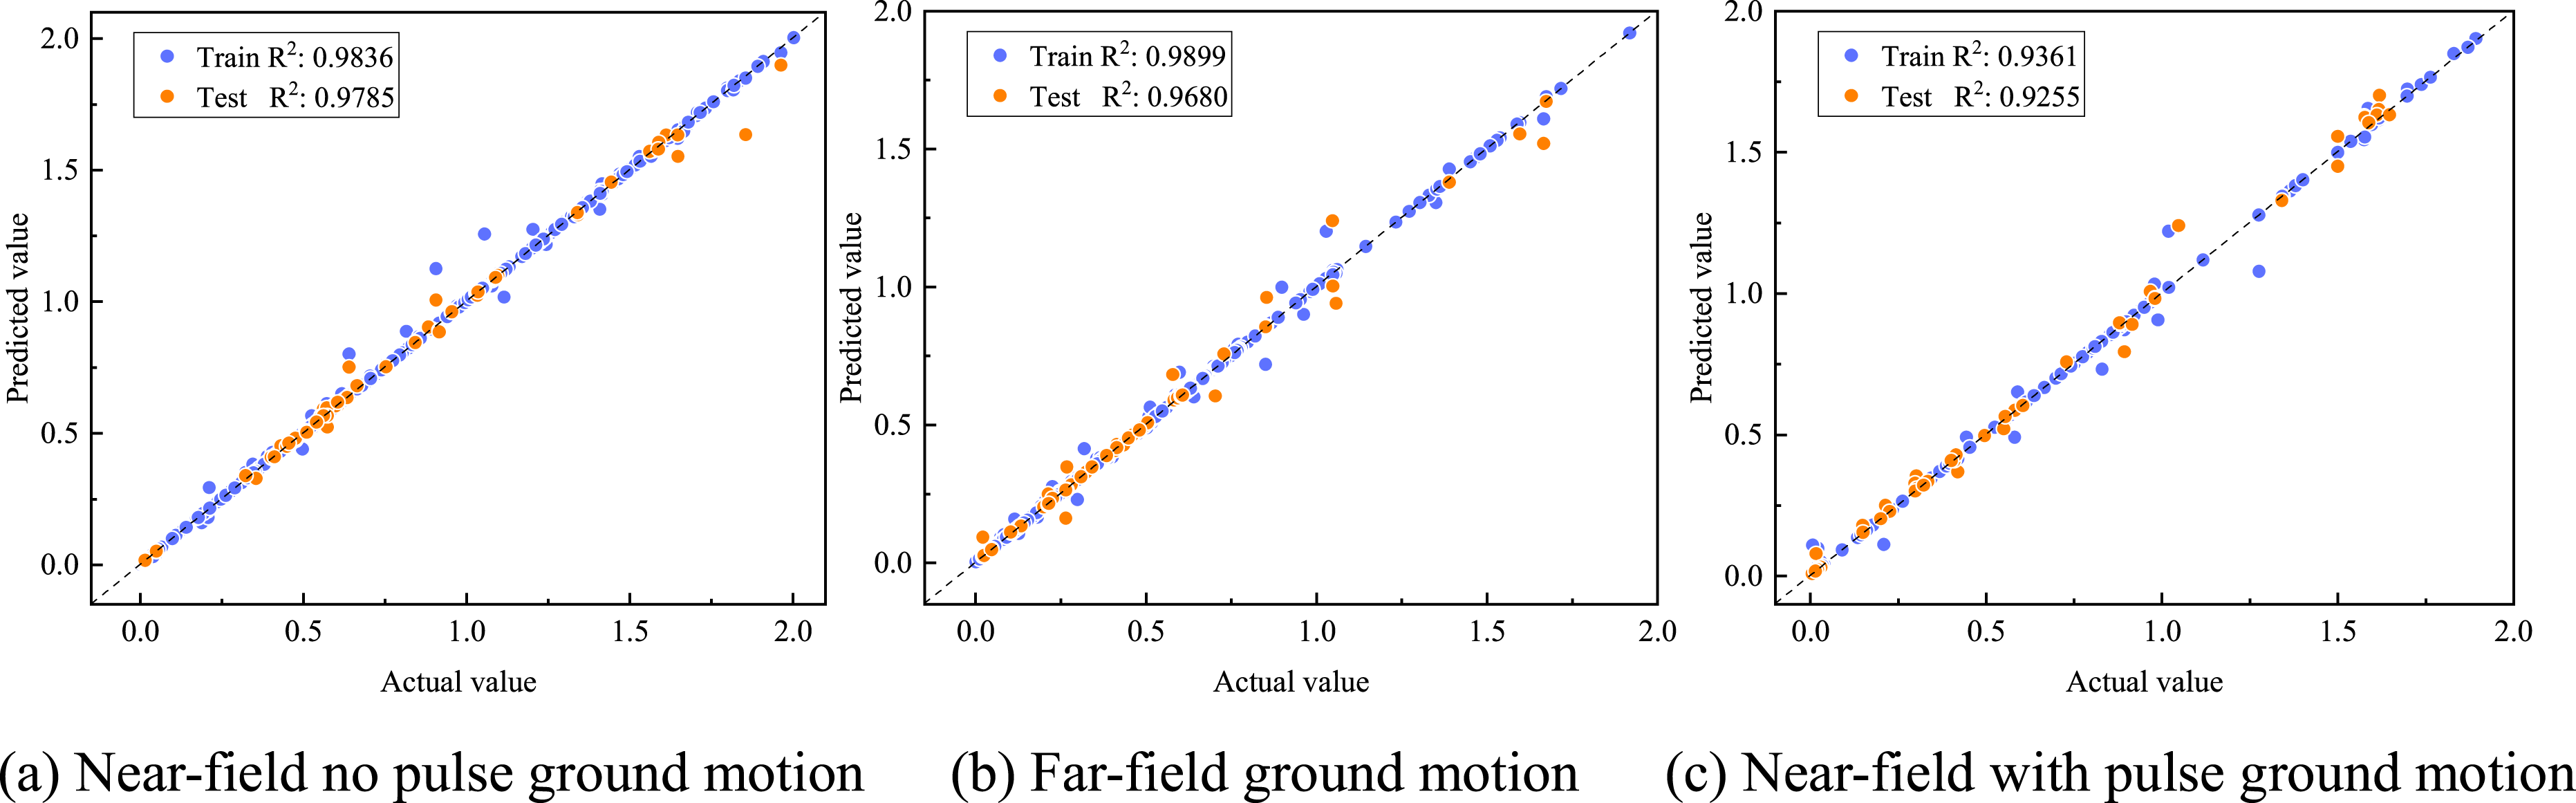


From the distribution of the scatter plots, it can be observed that most data points are concentrated near the y = x reference line, indicating strong predictive consistency. The prediction accuracy for the maximum inter-story drift is higher than that for the maximum floor acceleration. The R2 values for the maximum inter-story drift test set range from 0.9453 to 0.9863, while those for the maximum floor acceleration range from 0.9255 to 0.9787. This difference arises because inter-story drift data are generally smaller in magnitude and more concentrated, leading to better overall prediction accuracy. In contrast, the range of maximum floor acceleration values is wider, with fewer high-value samples, resulting in greater dispersion in the upper-right region of the plots.
K-fold cross-validation
Maximum inter-story drift cross-validation accuracy (mean ± std).
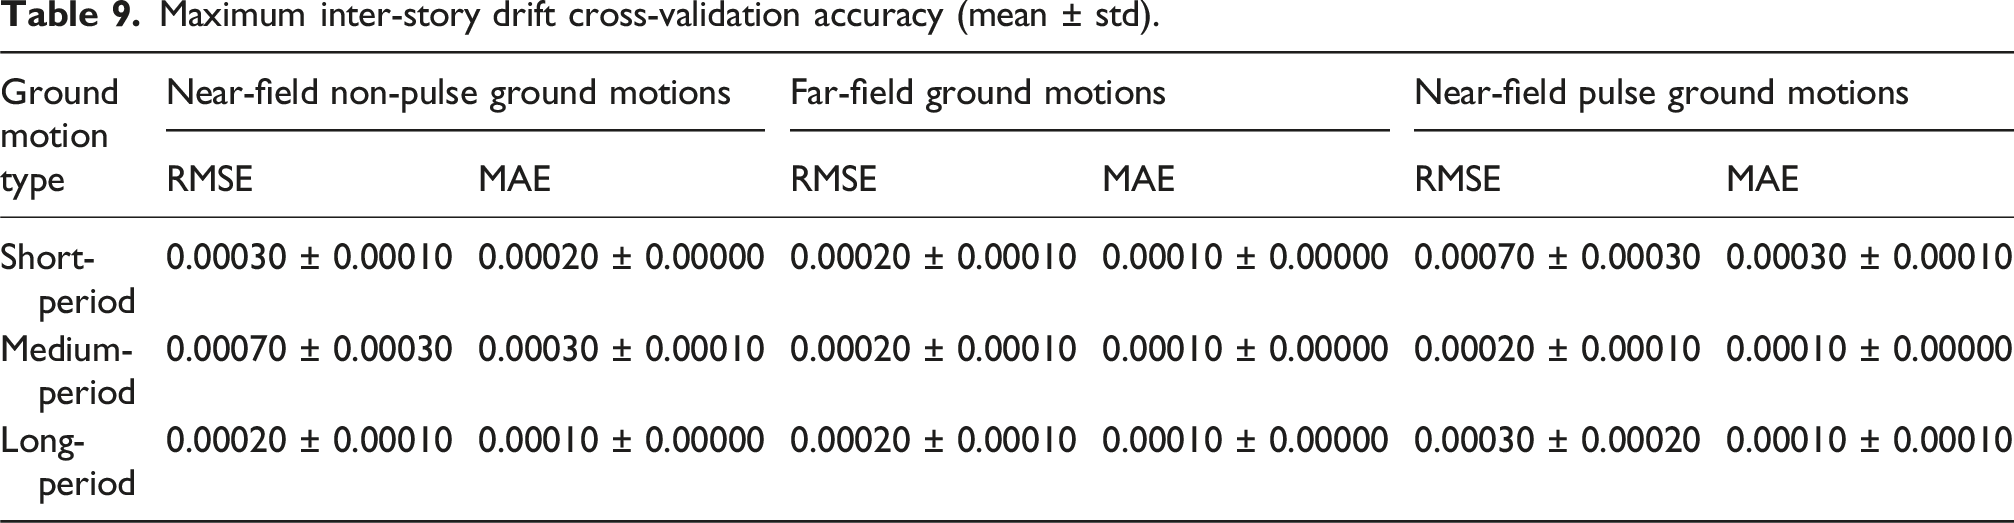
Maximum floor acceleration cross-validation accuracy (mean ± std).

The results of the 10-fold cross-validation indicate that the inter-story drift prediction model achieves high accuracy and good stability across different structural periods and ground motion types. The RMSE and MAE values in all cases are on the order of 10-4, with relatively small standard deviations. This demonstrates that the model performance is stable under different data partitions. For near-field and far-field ground motions, both the mean values and standard deviations of RMSE and MAE remain low. This suggests that the model effectively captures the variation characteristics of inter-story drifts under typical seismic excitations. In contrast, under pulse-like ground motions, especially in short-period cases, RMSE and MAE increase slightly and their standard deviations become larger. This is caused by the non-stationarity and uncertainty brought by the pulse effect.
Compared with the inter-story drift model, the acceleration prediction model exhibits larger errors, with RMSE and MAE values on the order of 10-2 and relatively larger standard deviations. Under far-field ground motions, particularly for long-period cases, RMSE and MAE values are lower and the standard deviation is smaller. This indicates better model adaptability to ground motions with smoother spectral characteristics and stronger stationarity. Under pulse-like ground motions, both short-period and medium-period cases show increases in the mean values and standard deviations of RMSE and MAE. The acceleration prediction model maintains acceptable error levels without significant instability across folds.
Analysis of the interpretability of predictive models
The interpretability analysis of predictive models is carried out from two perspectives: feature importance ranking and SHAP value analysis. The feature importance ranking reflects the sensitivity of input parameters to the model’s outputs, while SHAP values reveal the direction and magnitude of each parameter’s influence. Combining these two approaches helps assess the reliability of the prediction model and determine whether its behavior aligns with structural mechanics principles.
Ranking of feature importance coefficients
The rankings of input parameter feature importance coefficients for the prediction models of maximum inter-story drift and maximum floor acceleration in the MDOF system, are shown in Figures 13–18. Feature importance of maximum inter-story drift under near-field non-pulse ground motions. Feature importance of maximum inter-story drift under far-field ground motions. Feature importance of maximum inter-story drift under near-field pulse ground motions. Feature importance of maximum floor acceleration under near-field non-pulse ground motions. Feature importance of maximum floor acceleration under far-field ground motions. Feature importance of maximum floor acceleration under near-field pulse ground motions.


From Figures 13–15, it can be seen that, for the prediction of maximum inter-story drift, under near-field non-pulse ground motions, RMSA and RMSV have relatively high importance coefficients, significantly affecting the prediction of maximum inter-story drift. PP exhibits higher importance in short- and medium-period structures, while CAV has a higher importance in long-period structures compared to short- and medium-period structures. Under far-field ground motions, RMSD ranks high in short-, medium-, and long-period structures and is the main parameter influencing maximum inter-story drift. PGD has higher importance in short- and medium-period structures, RMSV in medium- and long-period structures, and HI ranks higher in long-period structures. Under near-field pulse ground motions, RMSA and Ia are the dominant parameters for short-, medium-, and long-period structures. Additionally, HI has a higher importance in long-period structures than in medium- and short-period structures, while PGV has higher importance in short-period structures.
Key IMs affecting inter-story drift of structures with different periods.

Key IMs affecting floor acceleration of structures with different periods.

For short-period structures, the overall stiffness is high and the vibration frequency is large. Their dynamic responses are mainly governed by the high-frequency components and instantaneous amplitude of ground motions. Therefore, for floor acceleration responses, peak-based and acceleration energy-related IMs, such as PGA, RMSA, and ASI exhibit high importance.
For inter-story drift responses, RMSA and RMSV dominate under near-field and pulse-like ground motions. This indicates that short-duration and high-intensity pulse inputs significantly increase deformation demand. As the structural period increases to the medium-period range, the sensitivity to velocity-related features and cumulative energy effects becomes more pronounced. In this case, RMSV, EDA, and CAV, which reflect both ground-motion duration and energy input, show higher importance in the SHAP analysis. This suggests that the response of medium-period structures is controlled by both peak effects and the overall energy level of ground motions.
For long-period structures, the deformation capacity is larger and the vibration period is longer. Their inter-story drift responses are more sensitive to low-frequency components and displacement-related IMs. Under far-field ground motions, the importance of RMSD and PGD increases significantly. Under pulse-like ground motions, HI and Ia, which characterize pulse features and energy concentration become dominant. This reflects the amplification effect of velocity pulses on the displacement demand of long-period structures.
Overall, the variation in IM importance across different period ranges originates from the matching between structural dynamic characteristics and ground-motion spectral features. The SHAP results are consistent with the feature importance rankings. This confirms the reliability and physical interpretability of the proposed prediction model in identifying key ground-motion parameters.
SHAP value analysis
The SHAP method is a post-hoc model interpretation technique (Lundberg and Lee 2017) for explaining complex machine learning models. It calculates the contribution of each input feature to the model output (Štrumbelj and Kononenko 2014). The distribution of input parameter SHAP values for the structural seismic response prediction model developed in this study is shown in Figures 19-24. SHAP analysis of maximum inter-story drift under near-field non-pulse ground motions. SHAP analysis of maximum inter-story drift under far-field ground motions. SHAP analysis of maximum inter-story drift under near-field pulse ground motions. SHAP analysis of maximum floor acceleration under near-field non-pulse ground motions. SHAP analysis of maximum floor acceleration under far-field ground motions. SHAP analysis of maximum floor acceleration under near-field pulse ground motions.
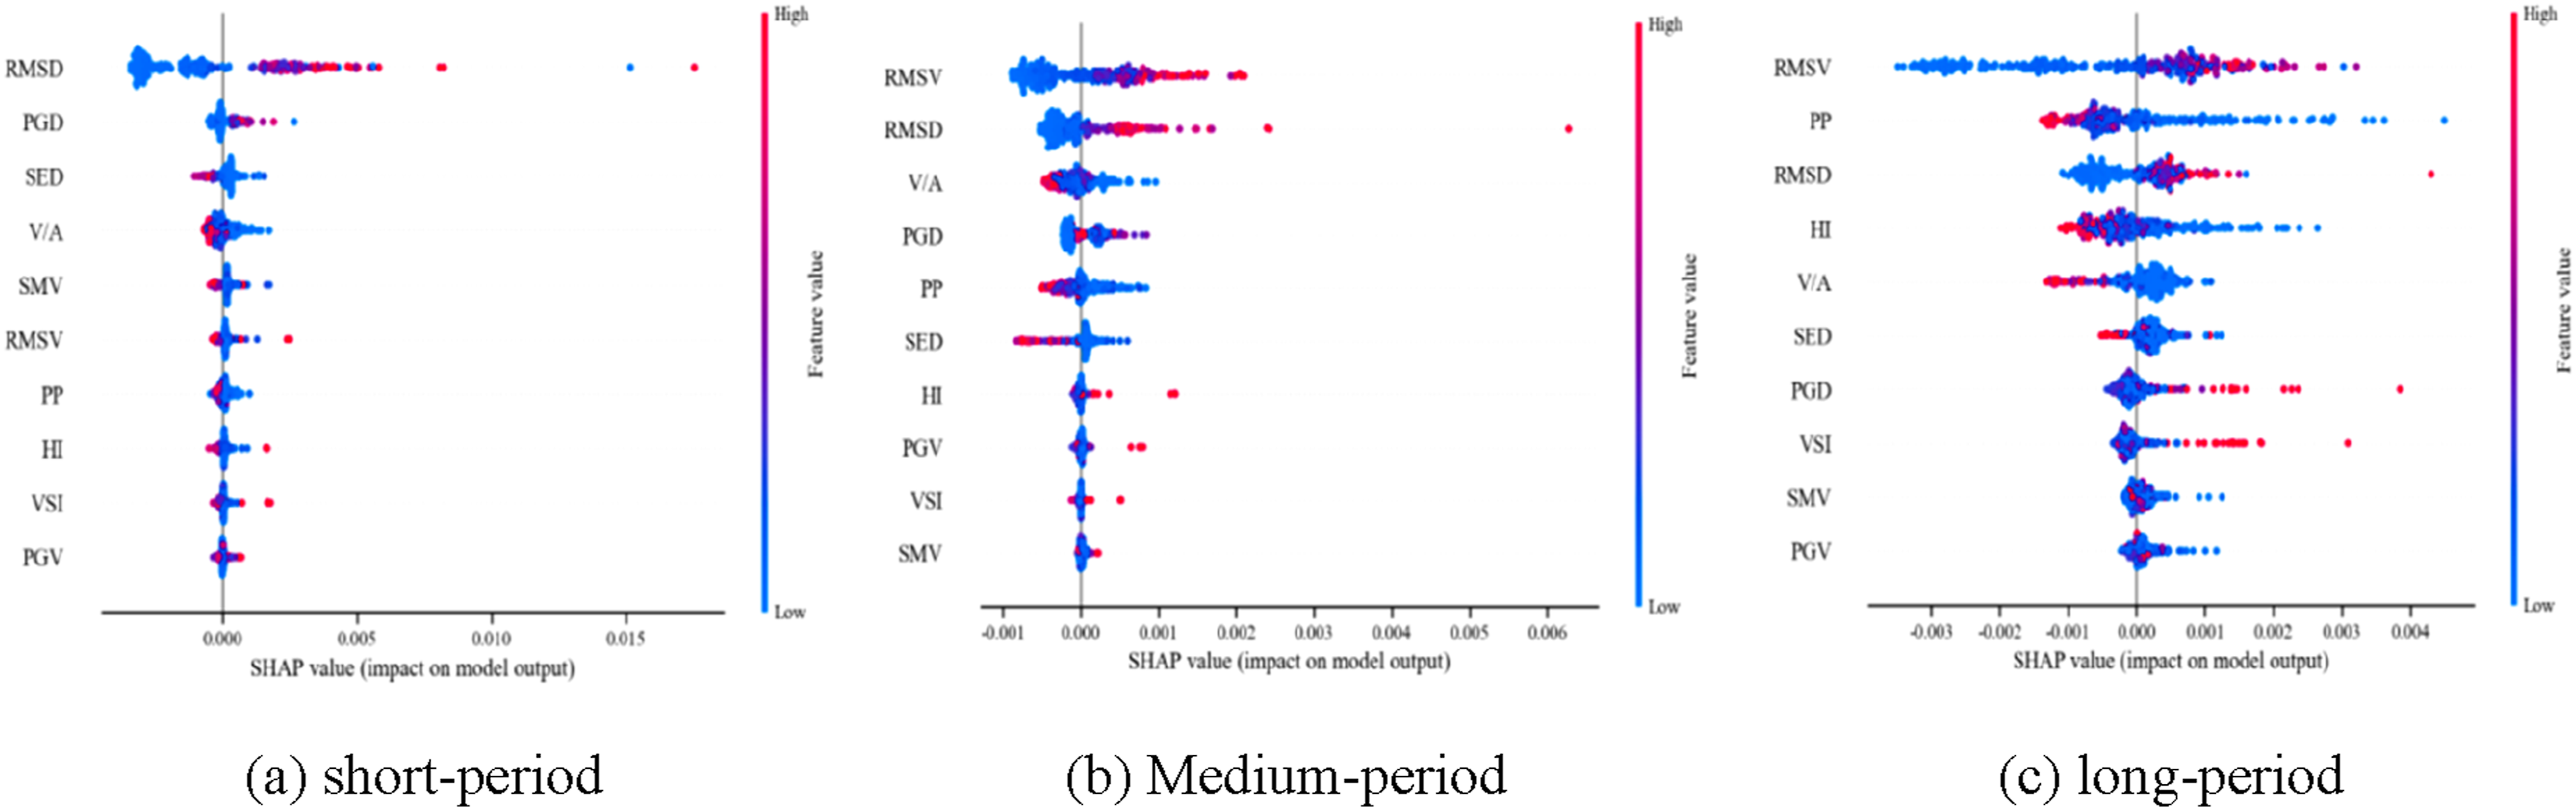
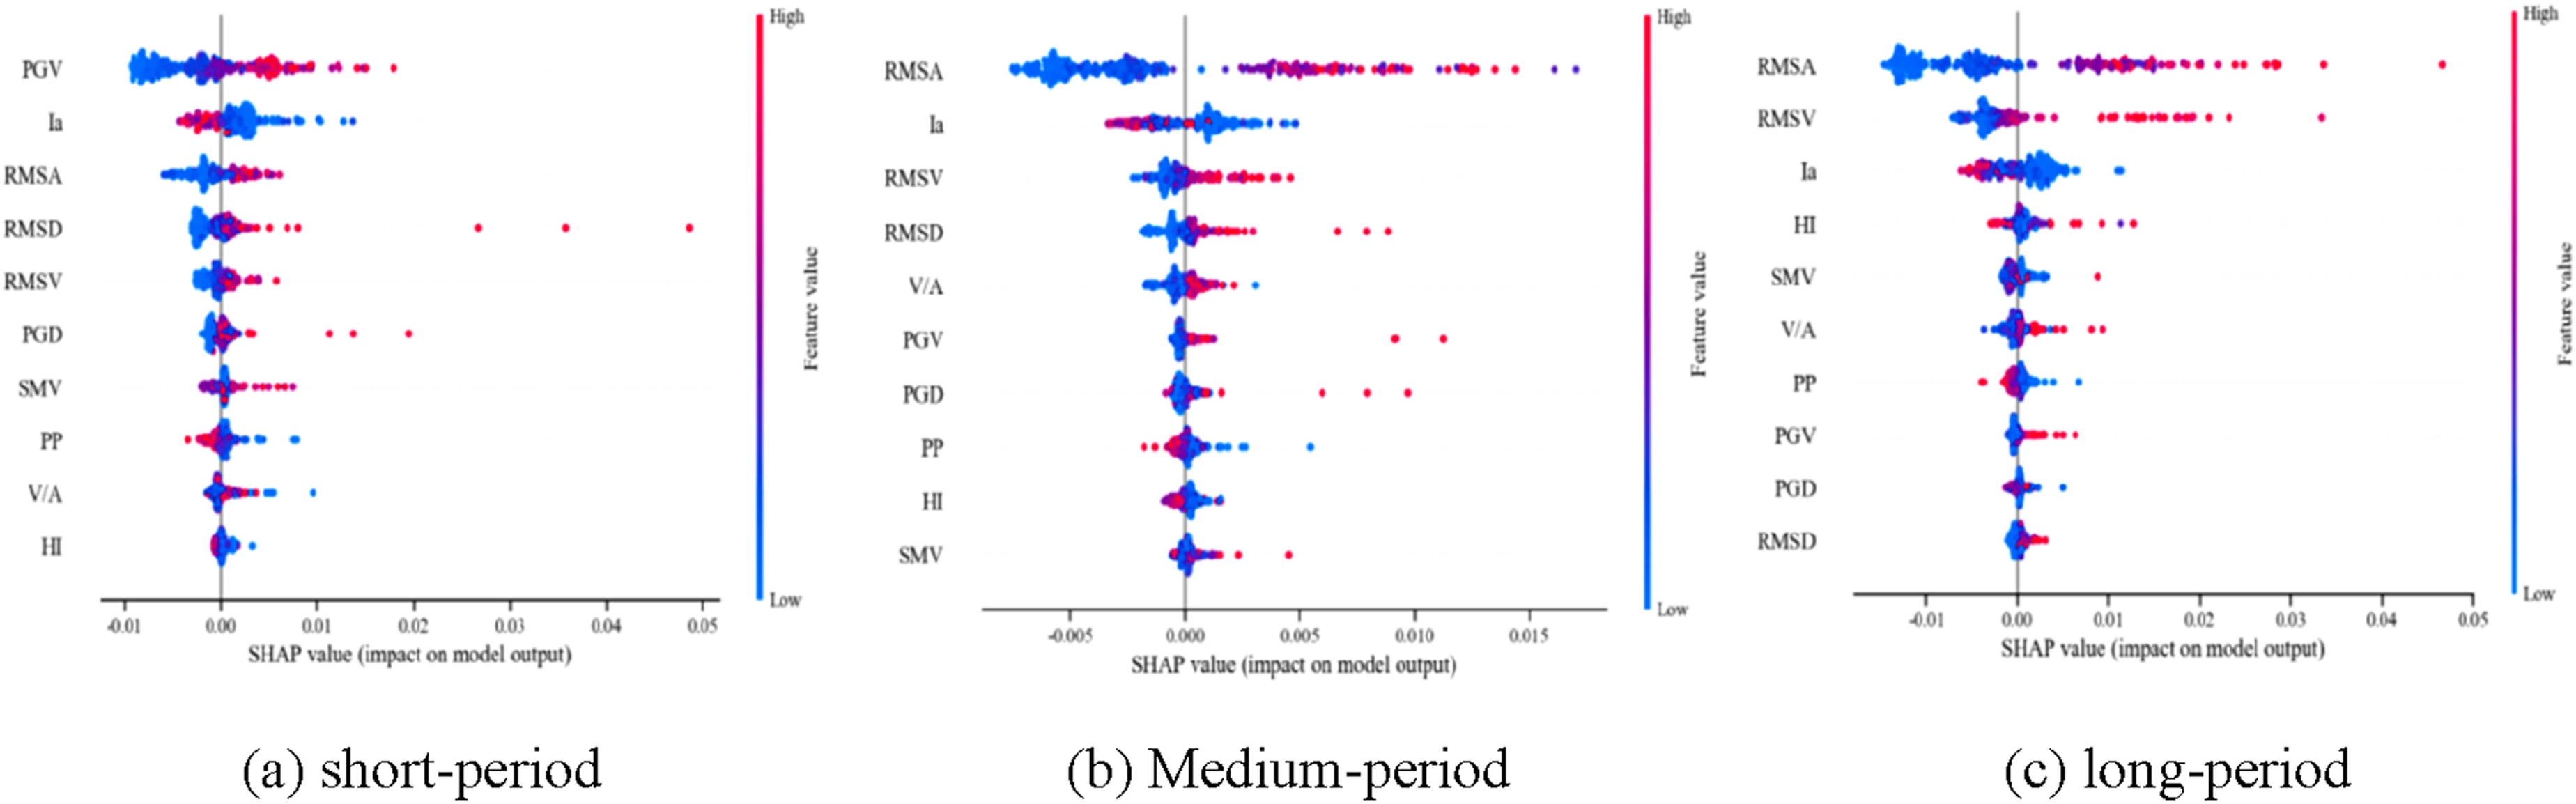


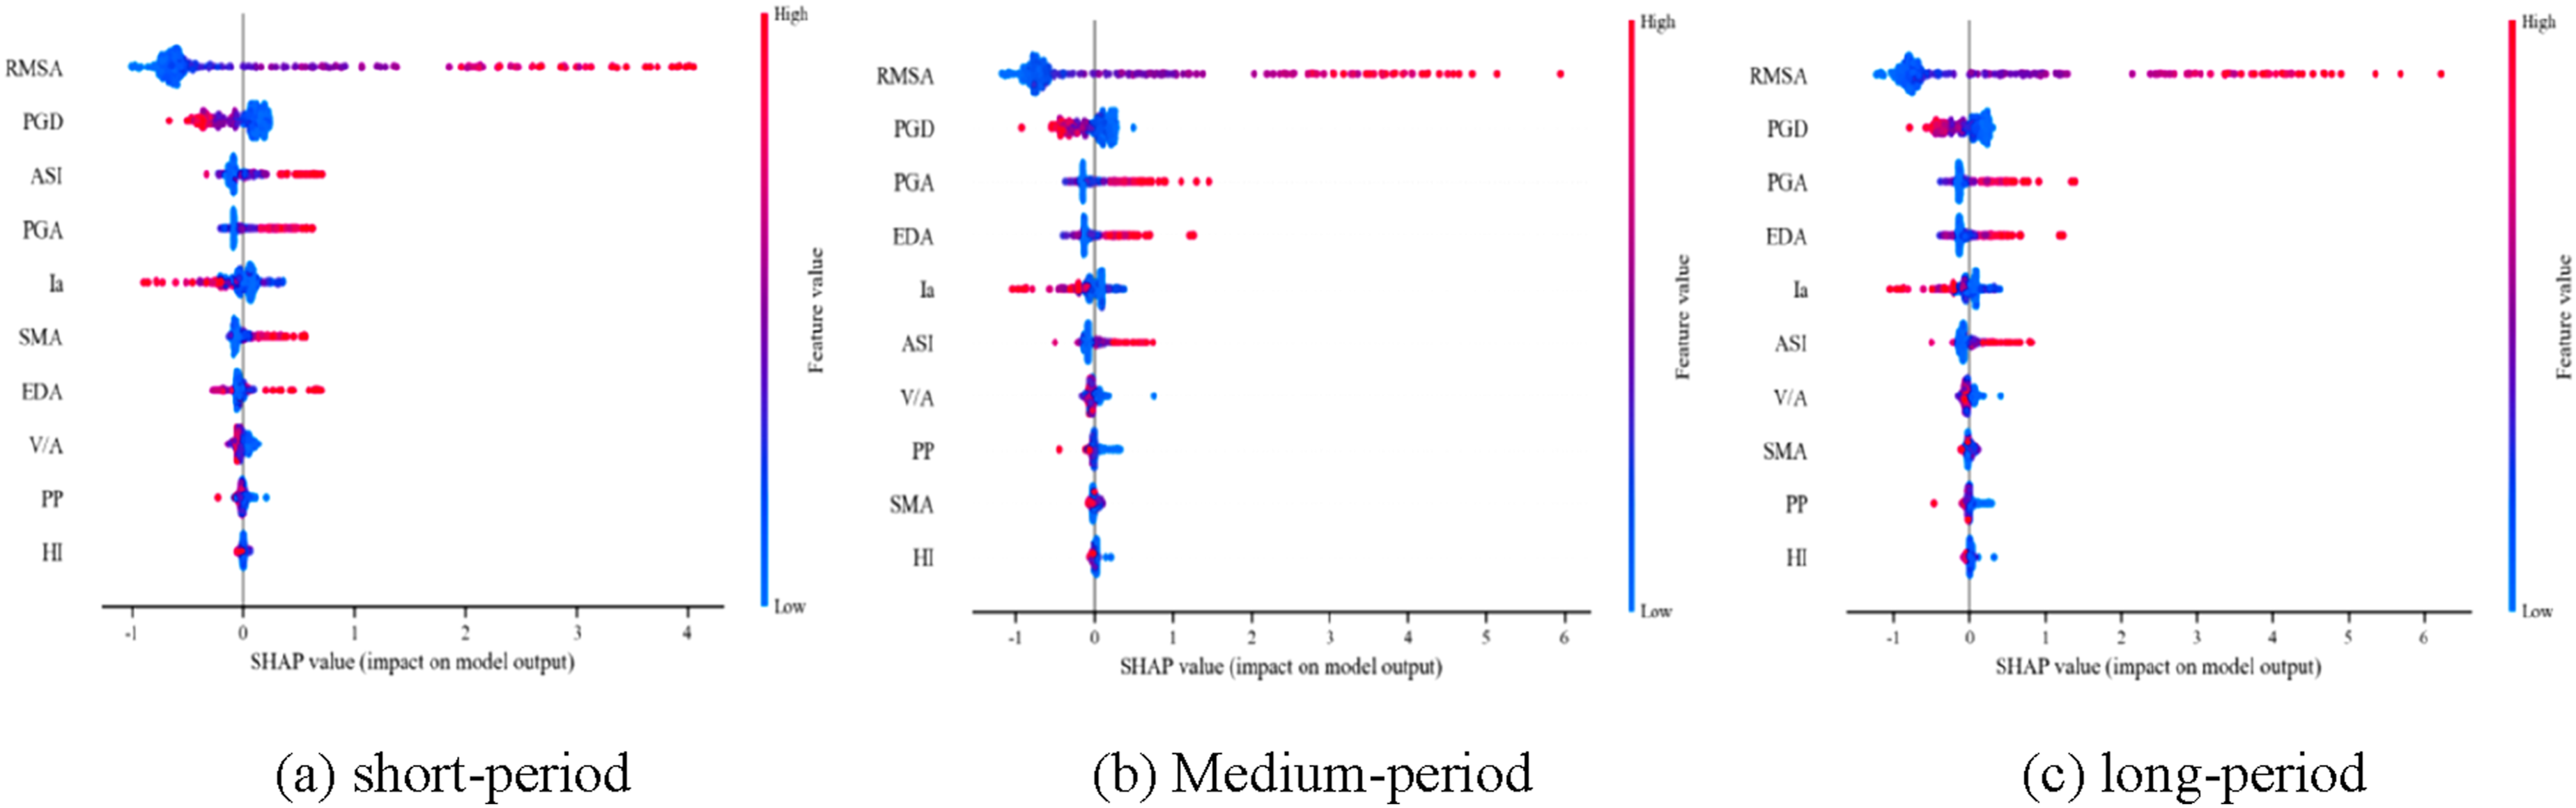
By examining the SHAP plots of inter-story drift-related parameters for MDOF structures under near-field non-pulse ground motions, it can be observed that the SHAP values of RMSA and RMSV are widely distributed across short-, medium-, and long-period structures and are mainly positively correlated with inter-story drift. This indicates that these parameters are highly sensitive to inter-story drift, and as their values increase, the maximum inter-story drift also increases, consistent with the previously discussed feature importance rankings. The SHAP value distribution of CAV in short-period structures is wider than in medium- and long-period structures, suggesting that CAV is another key parameter influencing inter-story drift in short-period MDOF structures, primarily exhibiting a negative correlation. Similarly, the SHAP value distribution of PP in medium- and long-period structures is wider than in short-period structures, indicating that PP significantly affects inter-story drift in these structures. The SHAP diagrams clearly illustrate the sensitivity of other parameters to inter-story drift as well. Analysis of SHAP plots for both inter-story drift and floor acceleration under other types of ground motions shows consistency with the feature importance rankings, confirming that the prediction model is reliable and effective.
According to the ranking of feature importance coefficients and SHAP analysis, RMSA, RMSV, RMSD, PDA, and PGA can be used as the key ground motion parameters affecting different periodic structures under different types of ground motion.
Validation of the proposed method
In this section, three concentrically braced steel frame (CBF) structures are established using OpenSees, with 4, 8, and 16 stories, respectively. Their fundamental periods are 0.8 s, 1.5 s, and 2.1 s. These three models cover short-, medium-, and long-period structural systems (Zhao et al., 2023), and can comprehensively represent the seismic response characteristics of structures with different fundamental periods under earthquake excitation. The story height of each floor is 3.6 m, and the bay width is 7.2 m. Two braced frames are arranged in each horizontal direction. The seismic fortification intensity is set to 7, and the site condition corresponds to Site Class II. The standard values of dead load for floors and roofs are 5.0 kN/m, and the live load is 3.5 kN/m. The constitutive behavior of the structural steel is represented by the Steel02 material model in OpenSees, with a Poisson’s ratio of 0.3. Both beam and column members are modeled as elastoplastic elements.
Elastic-plastic time-history analyses were performed in OpenSees under different types of ground motions, using the seismic records obtained earlier in this study. The maximum inter-story drifts and maximum floor accelerations were extracted to form the sample database. By comparing the key IMs identified in the foregoing analysis with findings from three other studies (Poreddy et al., 2022; Xu et al., 2022b; Zhang et al., 2024), the accuracy of the results was verified. The structural plan and elevation views are shown in Figure 25. Structural configuration of steel frame structures.
Prediction of the maximum structural response
Comparison of evaluation indicators for the model of maximum inter-story drift.

Comparison of evaluation indicators for the model of maximum floor acceleration.
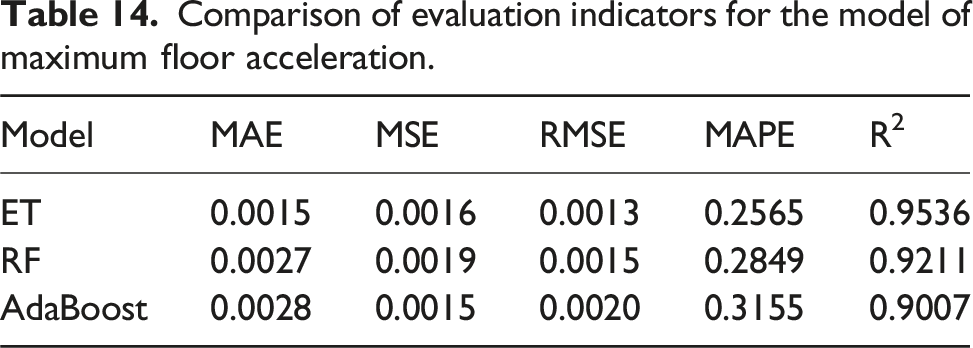
Prediction results of the maximum inter-story drift of the central support steel frame structure.
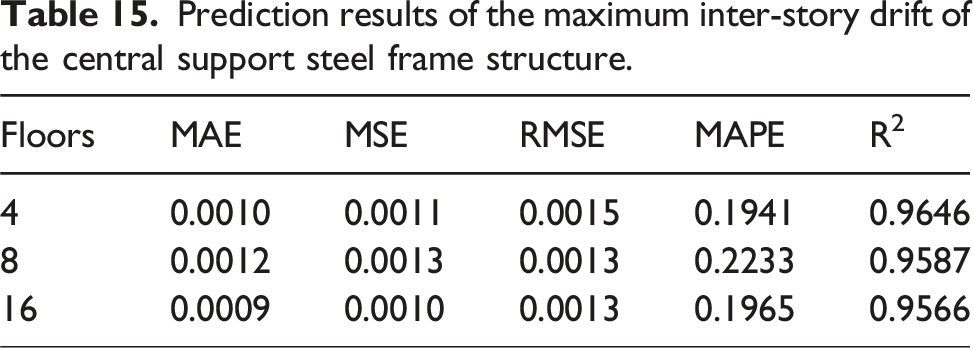
Prediction results of the maximum floor acceleration of the central support steel frame structure.

Tables 15 and 16 list the predicted maximum inter-story drifts and floor accelerations for centrally braced steel frames with different structural periods. The prediction accuracy for the maximum inter-story drift exceeds 0.95. The prediction accuracy for the maximum floor acceleration is higher than 0.93. In addition, the values of MAE, MSE, RMSE, and MAPE are all relatively low. The low MAE values indicate small deviations between the predicted and actual results. The low MSE and RMSE values further confirm the concentration and stability of the prediction errors. The low MAPE values demonstrate reliable prediction performance across different response magnitudes. Overall, the ET based prediction model for maximum structural responses exhibits excellent performance in terms of accuracy and error control. This highlights the high precision and strong robustness of the proposed model.
Result verification
IM values suggested by different references.
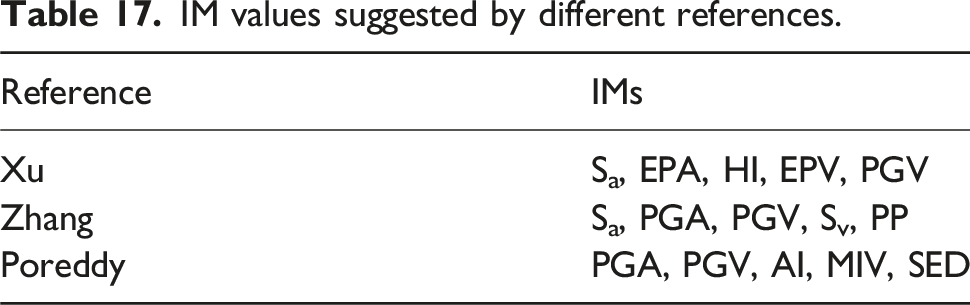
Currently, relevant studies may consider the structural period or ground motion type when establishing databases, but the key IMs recommended in their conclusions do not differentiate between ground motion types or structural periods. This study verifies the reliability of the proposed key IMs under these two factors. First, ground motion types and structural periods are classified, and the prediction accuracy of structures with different periods using varying numbers of IMs under different ground motions is compared, as shown in Figures 26 and 27. The results indicate that the IMs proposed in this study consistently achieve higher prediction accuracy than those suggested in the three referenced studies. Comparison of prediction accuracy for maximum inter-story drift. Comparison of prediction accuracy for maximum floor acceleration.

From Figures 26 and 27, when one to three parameters are used as inputs, the proposed method shows substantial accuracy improvements, with increases of 11.42%–34.87% in the prediction of maximum inter-story drift and 2.89%–26.58% in the prediction of maximum floor acceleration. Even when four parameters are considered, the prediction accuracy remains 6.41%–17.02% and 4.79%–14.78% higher than that of the other studies, respectively. Notably, using the four recommended parameters yields prediction accuracies of approximately 90% or higher, with maximum values of 94.65% and 92.47%, while incorporating all five parameters further increases the accuracy to around 95%, reaching peak values of 97.08% and 97.89%, respectively. The line chart clearly shows that the IMs proposed in this study provide significantly higher accuracy, particularly when only a small number of parameters are used.
This study systematically considers the effects of near-field, far-field, and pulse-like ground motions on the maximum structural responses. The influence of structural period is explicitly incorporated. Prediction models are developed to relate IMs to structural responses across different periods. As a result, the proposed IMs demonstrate superior performance in terms of prediction accuracy. It should be noted that differences in datasets, structural models and evaluation metrics exist across studies. Therefore, these comparisons should be interpreted as indicative rather than strictly equivalent.
Conclusion
Existing research has shown that, although many studies have investigated the influence of different IMs on the accuracy of structural seismic response prediction, there has been no comprehensive consideration of the effects of different types of ground motions on structures with varying periods. This study systematically examines the impact of near-field pulse ground motions, near-field non-pulse ground motions, and far-field ground motions on the prediction accuracy of short-, medium-, and long-period structural responses. Key IMs were identified through correlation analysis. Machine learning prediction models were established using the ET algorithm, with the selected IMs as input and maximum inter-story drift and floor acceleration as outputs. Feature importance and SHAP value analyses were subsequently performed. The effectiveness of the proposed approach was validated using typical structural examples. (1) Under far-field ground motions, RMSD and PGD are identified as key ground motion parameters for predicting the maximum inter-story drift of MDOF structures with short, medium, and long fundamental periods. In addition, SED is recommended for short-period structures, RMSV for medium-period structures, and HI for long-period structures. For the prediction of the maximum floor acceleration, PGA and RMSA are dominant parameters for all structural periods. SMA is suggested for short-period structures, whereas EDA is more suitable for medium- and long-period structures. (2) Under near-fault ground motions, RMSA and RMSV are the key parameters for predicting the maximum inter-story drift across different structural periods. CAV is recommended for short-period structures, while PP is preferred for medium- and long-period structures. For the prediction of the maximum floor acceleration, PGA, EDA, and ASI are identified as the dominant parameters. RMSA is suitable for short-period structures, whereas V/A performs better for medium- and long-period structures. (3) Under pulse-like ground motions, Ia and RMSA play a dominant role in predicting the maximum inter-story drift for all structural periods. PGV is recommended for short-period structures, RMSV for medium-period structures, and HI for long-period structures. For the prediction of the maximum floor acceleration, RMSA, PGD, and PGA are identified as key parameters. ASI is recommended for short-period structures, while EDA is preferred for medium- and long-period structures. (4) When using the same number of seismic parameters as inputs, the recommended parameter sets RMSA, RMSV, RMSD, PGV, and PGA in this study provide higher prediction accuracy for structural response. This improvement is observed both with and without distinguishing ground motion types and structural periods. Compared with three related studies, the proposed parameters improve the prediction accuracy of the maximum inter-story drift by up to about 34.87% and that of the maximum floor acceleration by up to about 26.58% when such distinctions are considered.
Although this study has made some progress, there are still some limitations. The study uses a uniform MDOF structural model, assuming that the mass, stiffness, and floor height are the same across all floors. This simplification helps highlight the influence of seismic motion characteristics and structural period, but it ignores variations in mass, stiffness, and floor height. Future research will expand this work by incorporating structures with non-uniform property distributions and severe vertical irregularities. This will broaden the applicability of the proposed prediction framework.
Footnotes

Author contributions
Funding
The authors disclosed receipt of the following financial support for the research, authorship, and/or publication of this article: This study was financially supported by the Natural Science Foundation of Hebei Province (Grant Numbers: E2023208069 and E2025208016), and the Science and Technology Project of Hebei Education Department (Grant Number: QN2024054).
Declaration of conflicting interests
The authors declared no potential conflicts of interest with respect to the research, authorship, and/or publication of this article.
Data Availability Statement
Data will be made available on request.