
Abstract
This study investigates the failure behavior and damage mechanisms of geopolymer concrete (GPC) and ordinary Portland cement (OPC) reinforced concrete beams through a combined experimental and numerical approach. Flexural tests were conducted, and then displacement and crack development were monitored using high-precision total station measurements. Numerical analyses were performed using ABAQUS, and the consistency between experimental observations and numerical predictions was evaluated at yield and failure stages to characterize inelastic behavior and damage progression. The effects of key parameters, including tensile reinforcement ratio, geopolymer concrete formulations, and curing methods, on cracking behavior, stiffness degradation, and failure modes were investigated in detail. The results indicate that increasing the tensile reinforcement ratio enhances flexural stiffness and load-bearing capacity while reducing ductility at advanced damage stages. Compared to OPC beams, GPC beams exhibited narrower and more distributed crack patterns due to their distinct microstructural characteristics. Quantitatively, GPC beams exhibited approximately 15% greater deformation in the compression zone at failure, while tensile reinforcement strains were up to 23% higher at yield compared to OPC beams. In addition, the maximum crack width at failure in GPC beams was approximately 50% lower than that of OPC beams. These results indicate that, despite similar strength levels, GPC beams exhibit higher deformation capacity and more distributed damage behavior. The findings demonstrate that geopolymer concrete exhibits distinct failure characteristics compared to OPC and should be explicitly considered in structural design to improve damage control and failure prediction. Overall, the study highlights the potential of geopolymer concrete as a reliable and sustainable structural material.
Keywords
• Failure mechanisms and damage evolution of geopolymer concrete beams under flexural loading were investigated using combined experimental and numerical approaches. • Crack initiation and crack propagation were identified through experimental observations and crack measurements, while displacement responses were monitored using high-precision total station measurements. • ABAQUS-based finite element simulations were conducted to evaluate inelastic behavior and failure progression. • Geopolymer concrete beams exhibited more distributed cracking and delayed damage localization compared to OPC beams. • Experimental–numerical consistency enabled identification of key damage mechanisms and implications for failure prevention.Highlights
Introduction
Geopolymer concrete (GPC) research has gained momentum as a sustainable alternative to traditional ordinary Portland cement concrete (OPC). By utilizing fly ash, a significant industrial by-product, GPC reduces the environmental impact of cement production and supports waste management efforts. The primary goal of GPC development is to produce eco-friendly materials with mechanical properties that meet or exceed those of OPC. This approach aligns with global efforts to lower carbon footprints and promote sustainable construction practices (Acar et al., 2020). The mechanical properties of GPC differ from those of OPC in several ways. While both materials can achieve similar compressive strengths, GPC typically exhibits a lower elastic modulus and higher tensile strength. These differences significantly affect the structural performance of GPC, including load-bearing capacity, deformation behavior, and cracking resistance. For instance, a lower elastic modulus allows for greater flexibility and deformation capacity, while the higher tensile strength enhances resistance to cracking under tensile stress. These unique characteristics necessitate a re-evaluation of design parameters for structures incorporating GPC (Çelik et al., 2022a; Özbayrak et al., 2023a).
The activation of fly ash in GPC relies on alkali solutions such as sodium hydroxide (SH) and sodium silicate (SS). The ratios of SH and SS, as well as their proportion to fly ash, critically influence the mechanical and dynamic properties of GPC (Kucukgoncu & Özbayrak, 2025, 2025eçen et al., 2023; Özbayrak, 2024). Optimizing these ratios can enhance compressive strength, elastic modulus, tensile strength, and fire resistance while improving microstructural stability and adherence strength between reinforcement and concrete at high temperatures (Aslanbay et al., 2024; Özbayrak et al., 2023b).
The experimental study of GPC faces challenges due to the time, cost, and labor involved in testing. Numerical simulation tools, particularly finite element analysis (FEA), provide a complementary approach by enabling the prediction of structural behaviors that are difficult to observe experimentally (Abdelwahed, 2020; Hassan et al., 2022; Korkut and Karalar, 2023; Venkatachalam et al., 2020; Çelik et al., 2022b). Numerous studies have confirmed the accuracy of FEA in simulating crack patterns, load-displacement relationships, and fracture mechanics for GPC structures. For example, FEA has been instrumental in studying crack initiation, propagation, and the influence of reinforcement on cracking behavior, showing strong agreement with experimental results (Abubakar, 2023; Chong et al., 2022; Darmawan et al., 2022; Zerfu and Ekaputri, 2022). The cracking behavior of GPC beams differs notably from that of OPC beams. While OPC beams typically exhibit wider cracks and sudden brittleness during failure, GPC beams demonstrate narrower crack widths, greater ductility, and enhanced bond strength with reinforcement. These differences are attributed to the higher fracture energy and improved microstructural properties of GPC. Experimental studies indicate that beam size and reinforcement ratio significantly affect cracking behavior (Aziz et al., 2022; Mortar et al., 2022; Wibowo et al., 2022). Numerical analyses further show that these parameters also influence the load-carrying capacity of reinforced concrete beams (Alex et al., 2022; Liu and Yan, 2022; Nofal et al., 2023).
Experimental and numerical studies on full-scale geopolymer beams in the literature have shown a significant correlation between load-displacement values and residual capacity estimates (Fathi et al., 2026; Özbayrak and Kucukgoncu, 2025). The shear behavior of geopolymer concrete beams is affected by the reinforcement ratio and shear span ratio, and the proposed numerical models have shown good agreement with the test results. In addition, the numerical models captured the failure modes and load-displacement behavior (Liu et al., 2025). On the other hand, in many studies on crack propagation, crack patterns, and fracture modes of GPC beams, FRP-based reinforcement has been used instead of steel reinforcement. When the crack width, number of cracks, and failure modes of CFRP geopolymer concrete beams under bending were examined, GPC beams exhibited smaller crack widths than OPC beams (Ahmed et al., 2020). In another study, the flexural performance of T-beams GPC reinforced with GFRP rods was experimentally investigated, and the failure mode was also affected, as the ultimate strain of GPC did not exhibit the same behavior as that of OPC (Hasan et al., 2023). In addition, the cracking patterns and failure modes of beams reinforced with GFRP rods under bending were experimentally investigated, and ductile fracture was observed. However, wide tensile cracks occurred in the concrete in the compression region. As the load increased, flexural cracks gradually formed in the constant moment region and then in the shear span (Junaid et al., 2019). Furthermore, the seismic model developed to study the seismic behavior of a prefabricated bridge made of FRP-reinforced geopolymer concrete has reliably captured the bridge’s damage and revealed the performance of OPC and GPC-reinforced bridges (Ngo et al., 2024).
Despite the increasing number of studies on geopolymer concrete, limited research has addressed the combined experimental–numerical evaluation of damage evolution and failure mechanisms at the structural element level. This study is based on full-scale bending tests, displacement measurements using a high-precision total station, and validated finite element modeling. The damage development and the crack propagation mechanisms of GPC beams were systematically investigated, and the results from GPC beams were compared with those of OPC beams at both the yield and failure stages. Furthermore, the agreement between experimental findings and numerical simulation results derived from ABAQUS was assessed to validate the interpretation of inelastic behavior and damage evolution. Moreover, this research aims to compare the fracture mechanisms and cracking characteristics of GPC and OPC beams using a thorough experimental-numerical methodology. The influence of critical variables, including reinforcement ratio, alkali activator ratio, and curing method parameters, on load-displacement response, deformation capacity, and crack characteristics was also investigated. The findings give quantitative insights into the failure mechanism of GPC beams and contribute to improving their applicability as sustainable alternatives to OPC in structural design.
To achieve the objectives of this study, a systematic experimental–numerical workflow was followed. Initially, GPC and OPC beam specimens were designed, and material characterization tests were conducted. Subsequently, the full-scale four-point bending tests were performed, and displacement and crack development were monitored using high-precision total station measurements. The experimental data, including load–displacement responses and crack patterns, were then used to develop finite element models in ABAQUS. The numerical analyses incorporated CDP modeling, interaction definitions, and Dynamic Explicit procedures to simulate nonlinear behavior and damage evolution. Finally, experimental and numerical results were compared for model validation, followed by a detailed evaluation of failure mechanisms, damage evolution, and structural performance. The overall research methodology adopted in this study is illustrated in Figure 1. The workflow includes specimen design, material characterization, experimental testing, data acquisition, finite element modeling, damage analysis, and model validation, followed by a comprehensive evaluation of structural performance. Flowchart of the research methodology adopted in this study.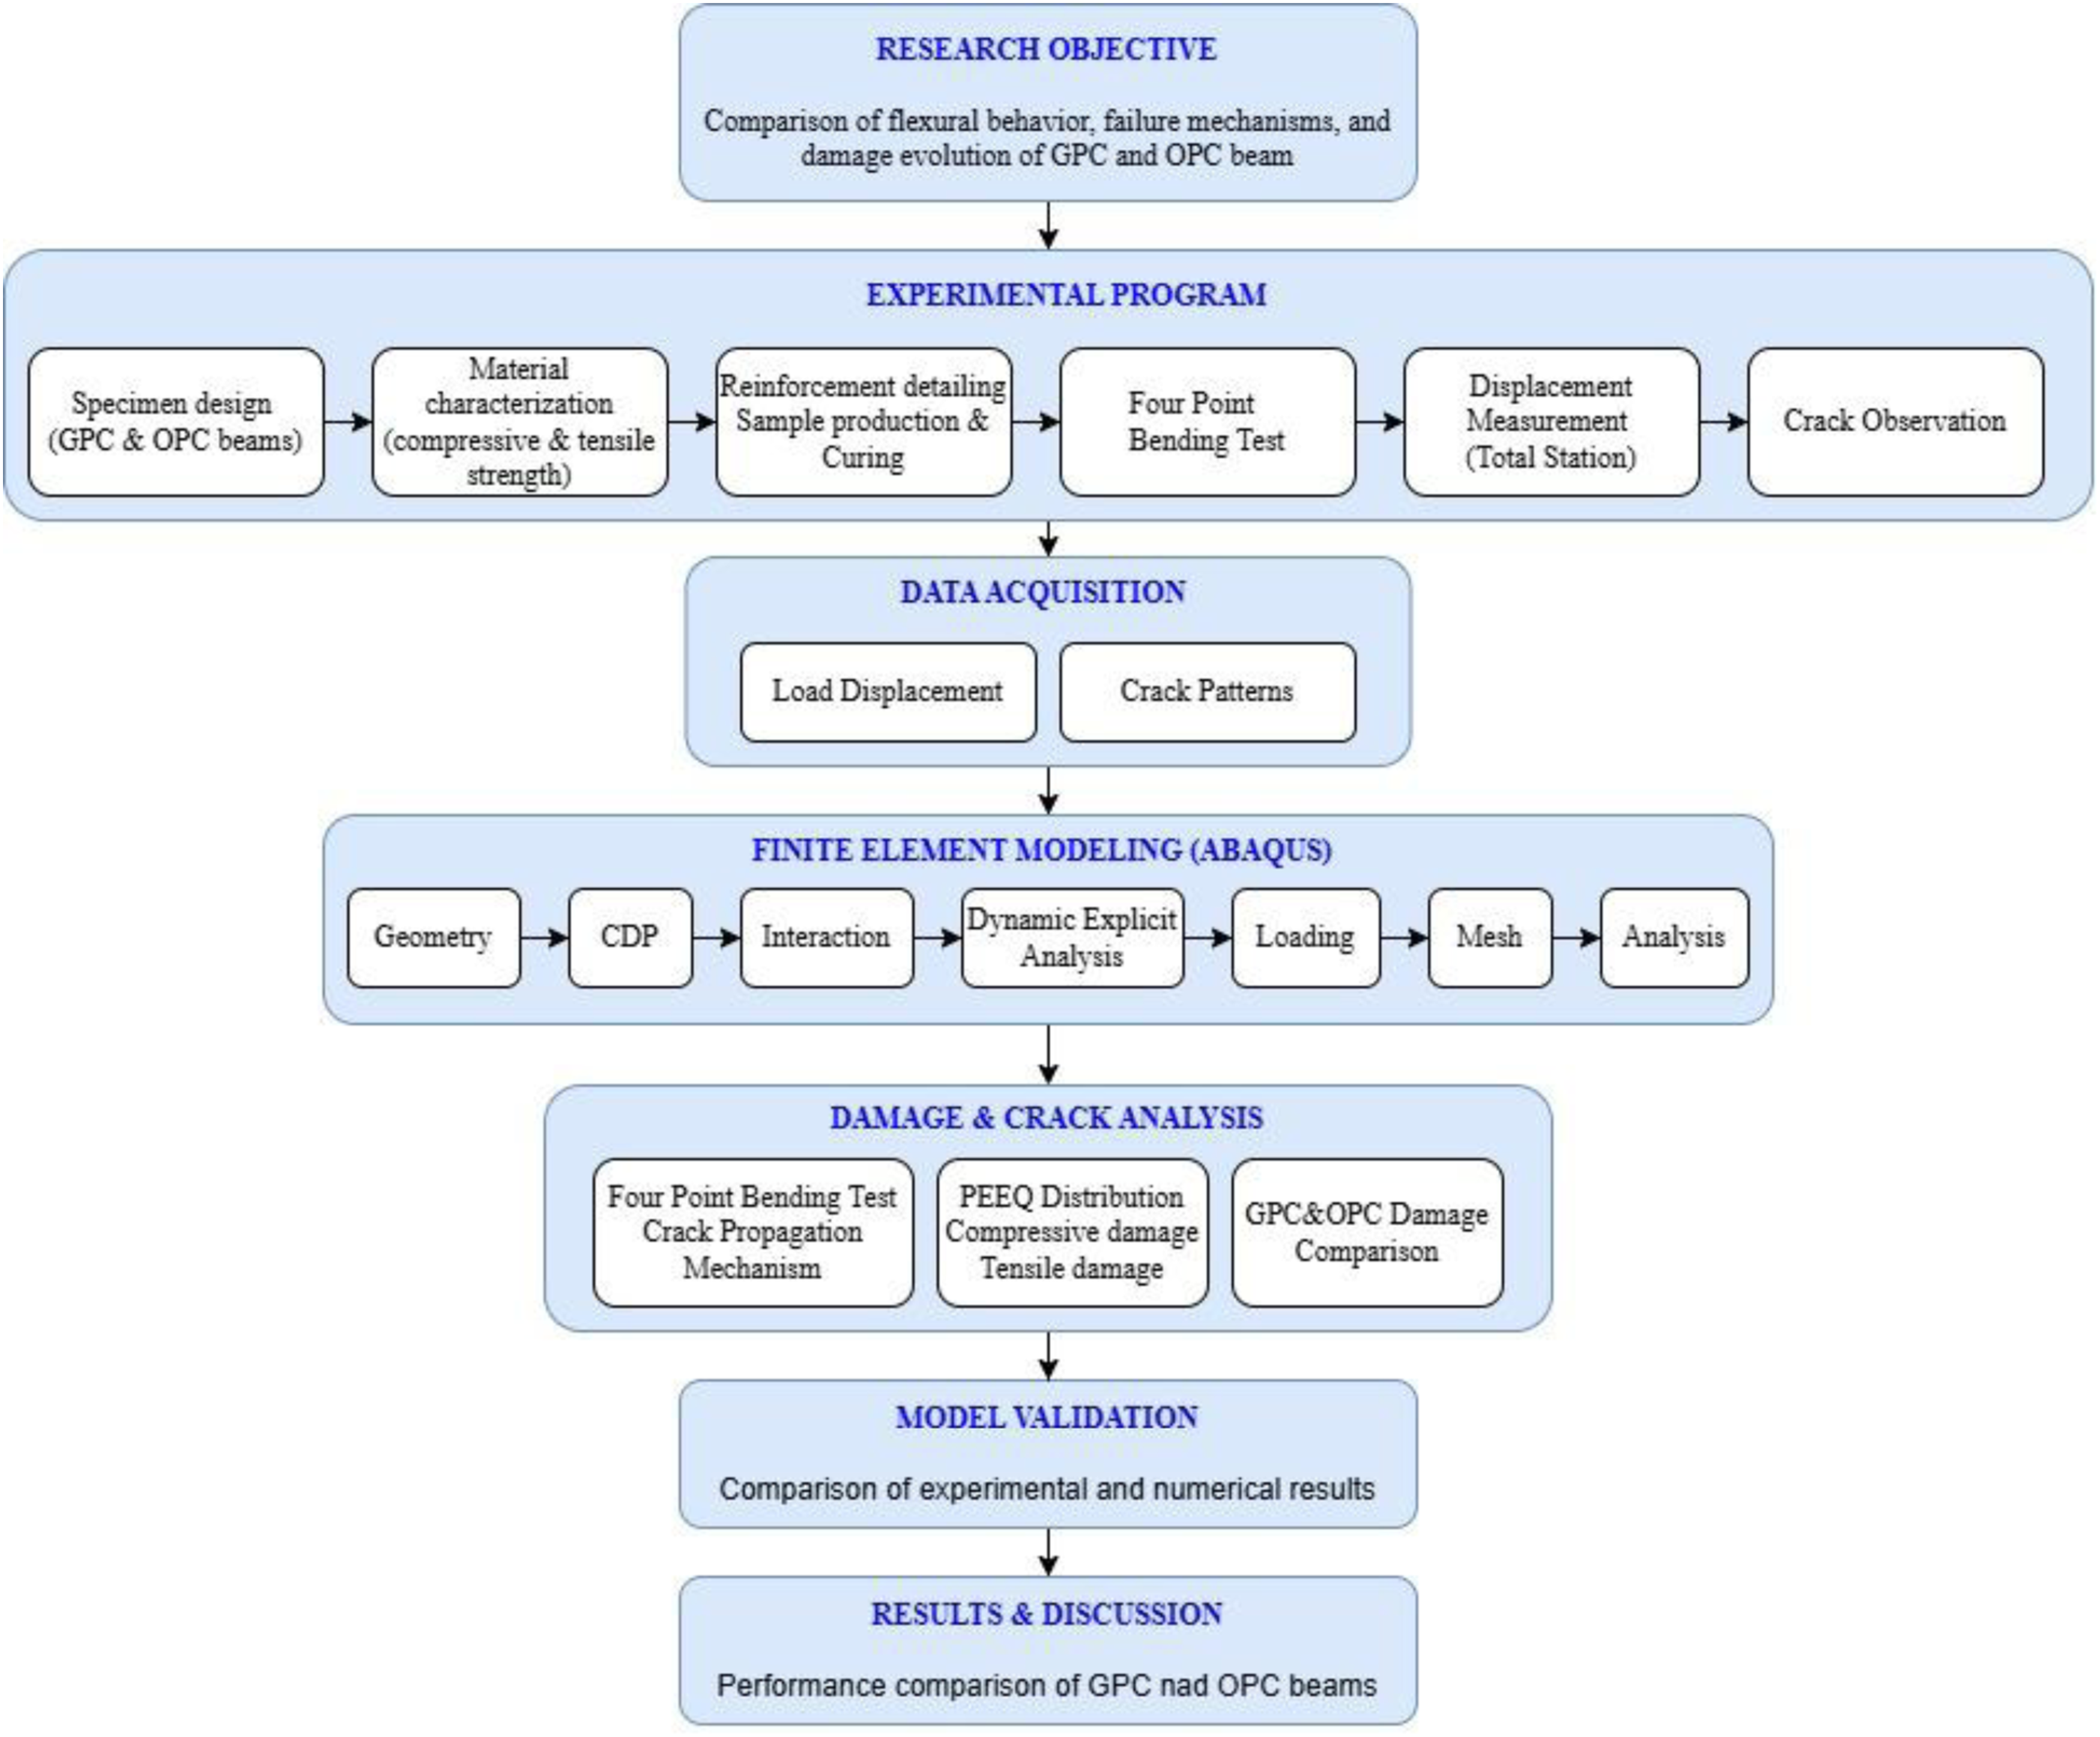
Methodology
Material properties
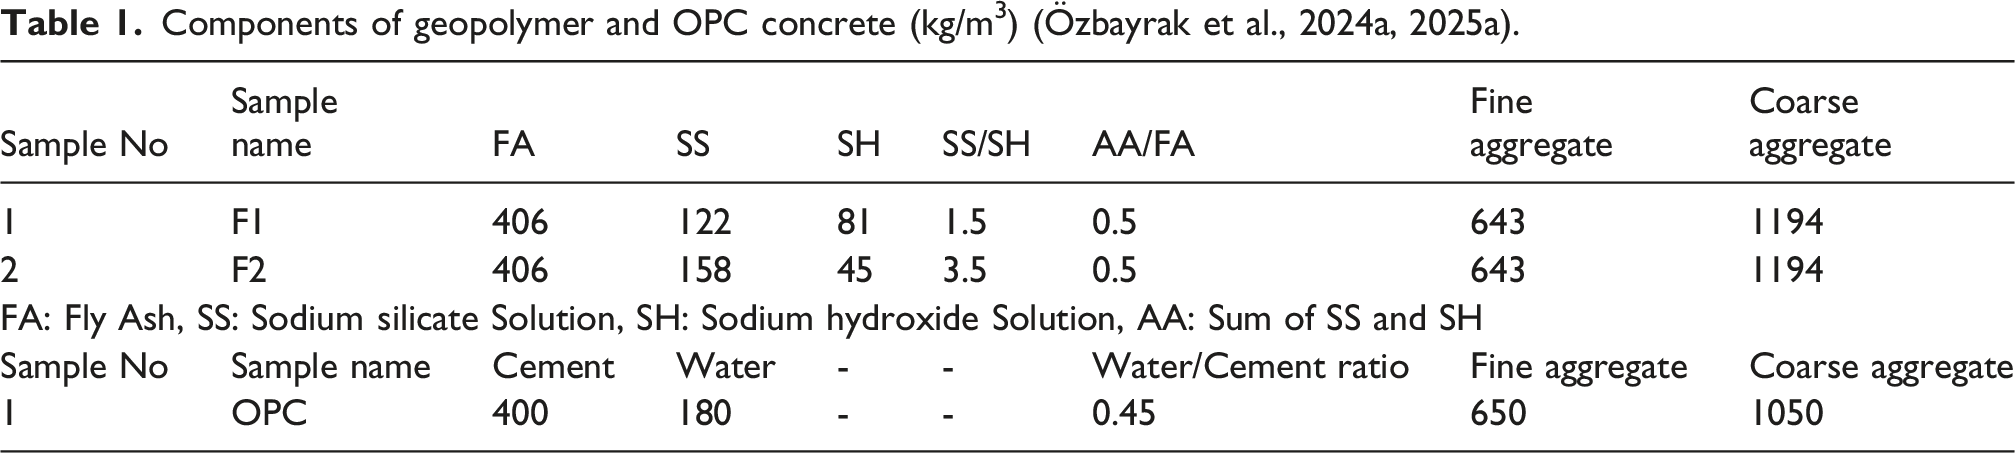
In this study, Class F fly ash, conforming to ASTM C618, was utilized to produce geopolymer concrete (ASTM C311, 2023; ASTM C618, 2022). The material had a density of 2.32 g/cm3. To qualify as Class F fly ash, the combined ratio of chemical components such as SiO2, Al2O3, and Fe2O3 must exceed 70% of the total composition. The fly ash used met this requirement, with a combined SiO2, Al2O3, and Fe2O3 content of 85%. As alkali activators, 14M sodium hydroxide (NaOH) and sodium silicate (Na2SiO3) solutions were employed. The coarse aggregate was crushed stone with a 2.6 g/cm3 density and a 7–14 mm particle size range. River sand with a density of 1.8 g/cm3 and a particle size range of 0.1–4 mm served as the fine aggregate. Both aggregates were used in a saturated surface-dry condition without adding water.
Components of geopolymer and OPC concrete (kg/m3) (Özbayrak et al., 2024a, 2025a).
To characterize the mechanical properties of the GPC and OPC mixtures, compression tests were conducted on cylindrical specimens (100 mm diameter × 200 mm height) using a compressometer. Six specimens were tested for each mixture type to derive compressive strength values and complete stress–strain relationships. In addition, the splitting tensile strength was evaluated via indirect tensile tests, with three specimens per mixture. Direct tensile tests were carried out to assess the mechanical properties of the reinforcement used in the beams. For each bar diameter, three steel samples were tested. Figure 2 presents the experimental setup and procedures for the concrete compression, splitting tensile, and reinforcement tensile tests conducted during the material characterization stage. Material testing of GPC, OPC, and Reinforcement samples: (a) Concrete compressive tests, (b) Concrete splitting tensile tests, (c) Reinforcement tensile tests (Özbayrak et al., 2024a, 2025a).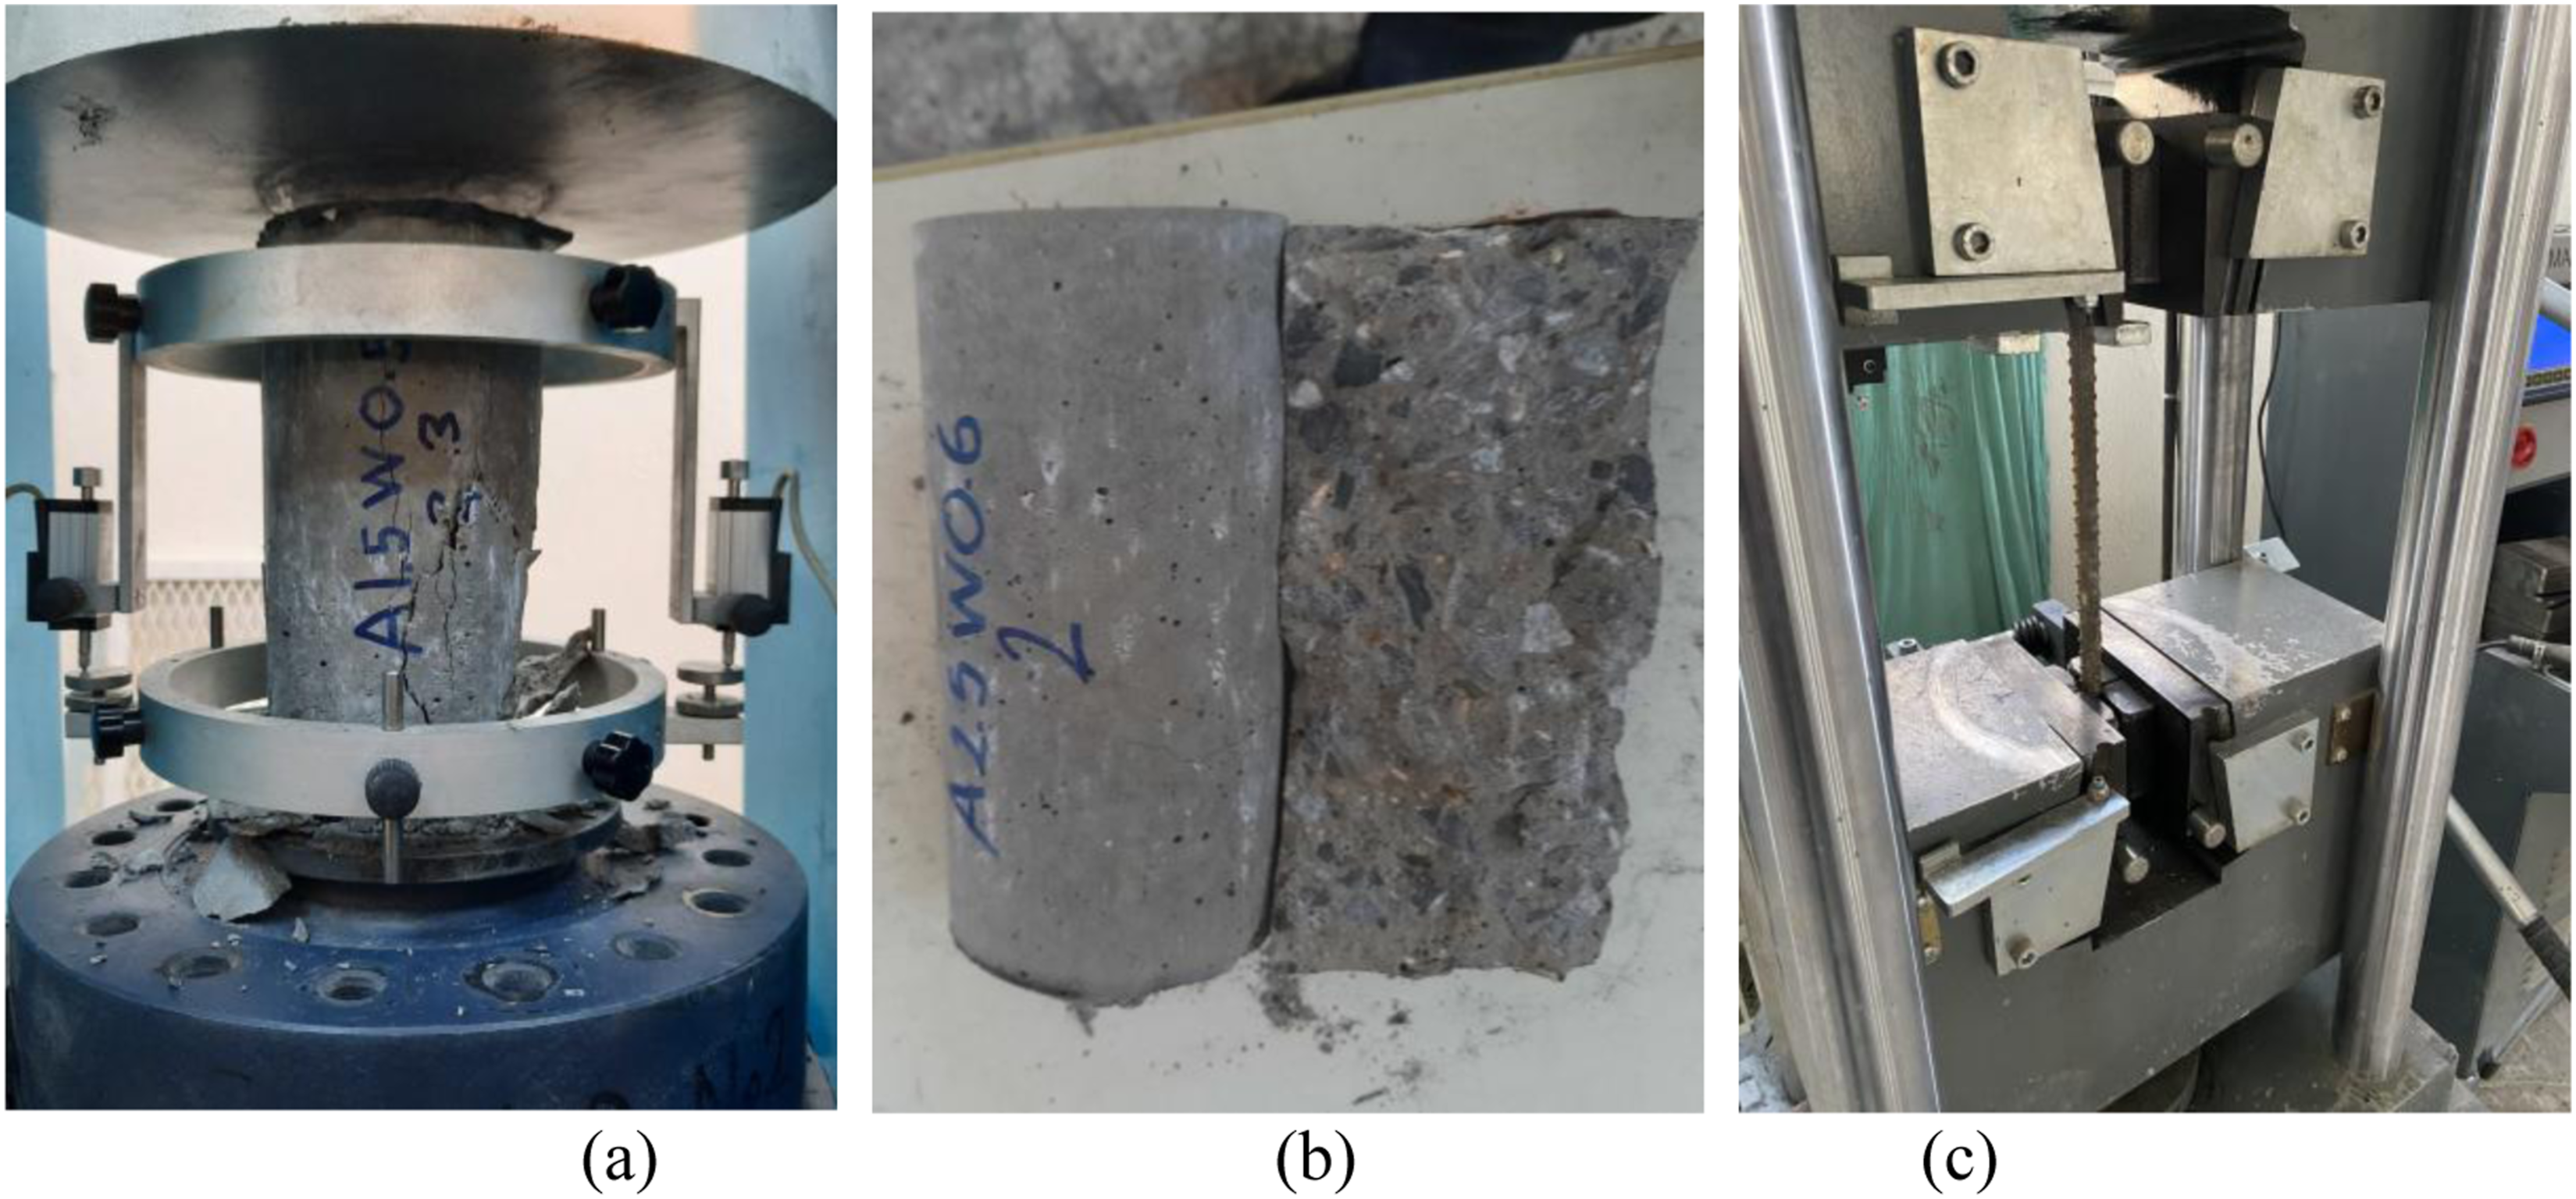
The compressive strength, splitting tensile strength, elastic modulus, and Poisson’s ratio for both GPC and OPC specimens, corresponding to the specific mix proportions, were determined through material testing. The experimentally obtained stress–strain curves for the GPC, OPC, and reinforcement specimens are presented in the numerical modeling section. These curves were adapted to fit the Concrete Damaged Plasticity (CDP) model. To characterize the damage behavior of the materials, the CDP model was calibrated using the mechanical properties of both GPC and OPC. B420 C reinforcing steel was used for numerical simulations, yield, and tensile strength values derived from tensile tests. The stress-strain curves of the reinforcing steel used in the FEM analysis are depicted in the numerical section.
Experimental method
In the numerical study, FEM analyses were conducted on 12 geopolymer concrete (GPC) reinforced concrete beams and three ordinary Portland cement (OPC) reinforced concrete beams, for which laboratory tests had previously been performed within the scope of the TUBITAK-121M236 research project (Özbayrak et al., 2024a). The primary variable parameters for the reinforced concrete beams were the SS/SH ratio, curing method, and tensile reinforcement ratio. GPC concrete mixtures were prepared with SS/SH ratios of 1.5 and 3.5 and an alkaline activator-to-fly ash (AA/FA) ratio of 0.5. The SS/SH and AA/FA ratios used in this study were selected based on preliminary material characterization tests and previous literature. These tests included compressive strength tests on cylindrical specimens, flexural performance of prism beams, and bond strength evaluations. The selected ratios were found to provide improved mechanical and bond performance and are consistent with previously validated mixture formulations reported in the literature (Aslanbay et al., 2024; Özbayrak et al., 2023a, 2023b, 2024a).
The beam samples were thermally cured at 90°C for 24 hours, either immediately after production or after 4 days of ambient storage. Three OPC beams were produced for comparison to evaluate the advantages and limitations of GPC concrete. Laboratory tests were conducted on all samples after 28 days. During the laboratory tests, displacements were measured using a total station, and deformations of the beams were monitored under various load stages, including the first crack, yielding, concrete crushing, and ultimate load conditions (Figure 3). Stress-strain curves and splitting tensile test results from cylindrical samples taken during beam production were utilized for numerical analysis. Finite element analyses were conducted to simulate bending tests, using a beam 150 × 300 × 3300 mm and a 3000 mm span between supports. Samples and setup of experimental and total station (Özbayrak et al., 2024a, 2025a).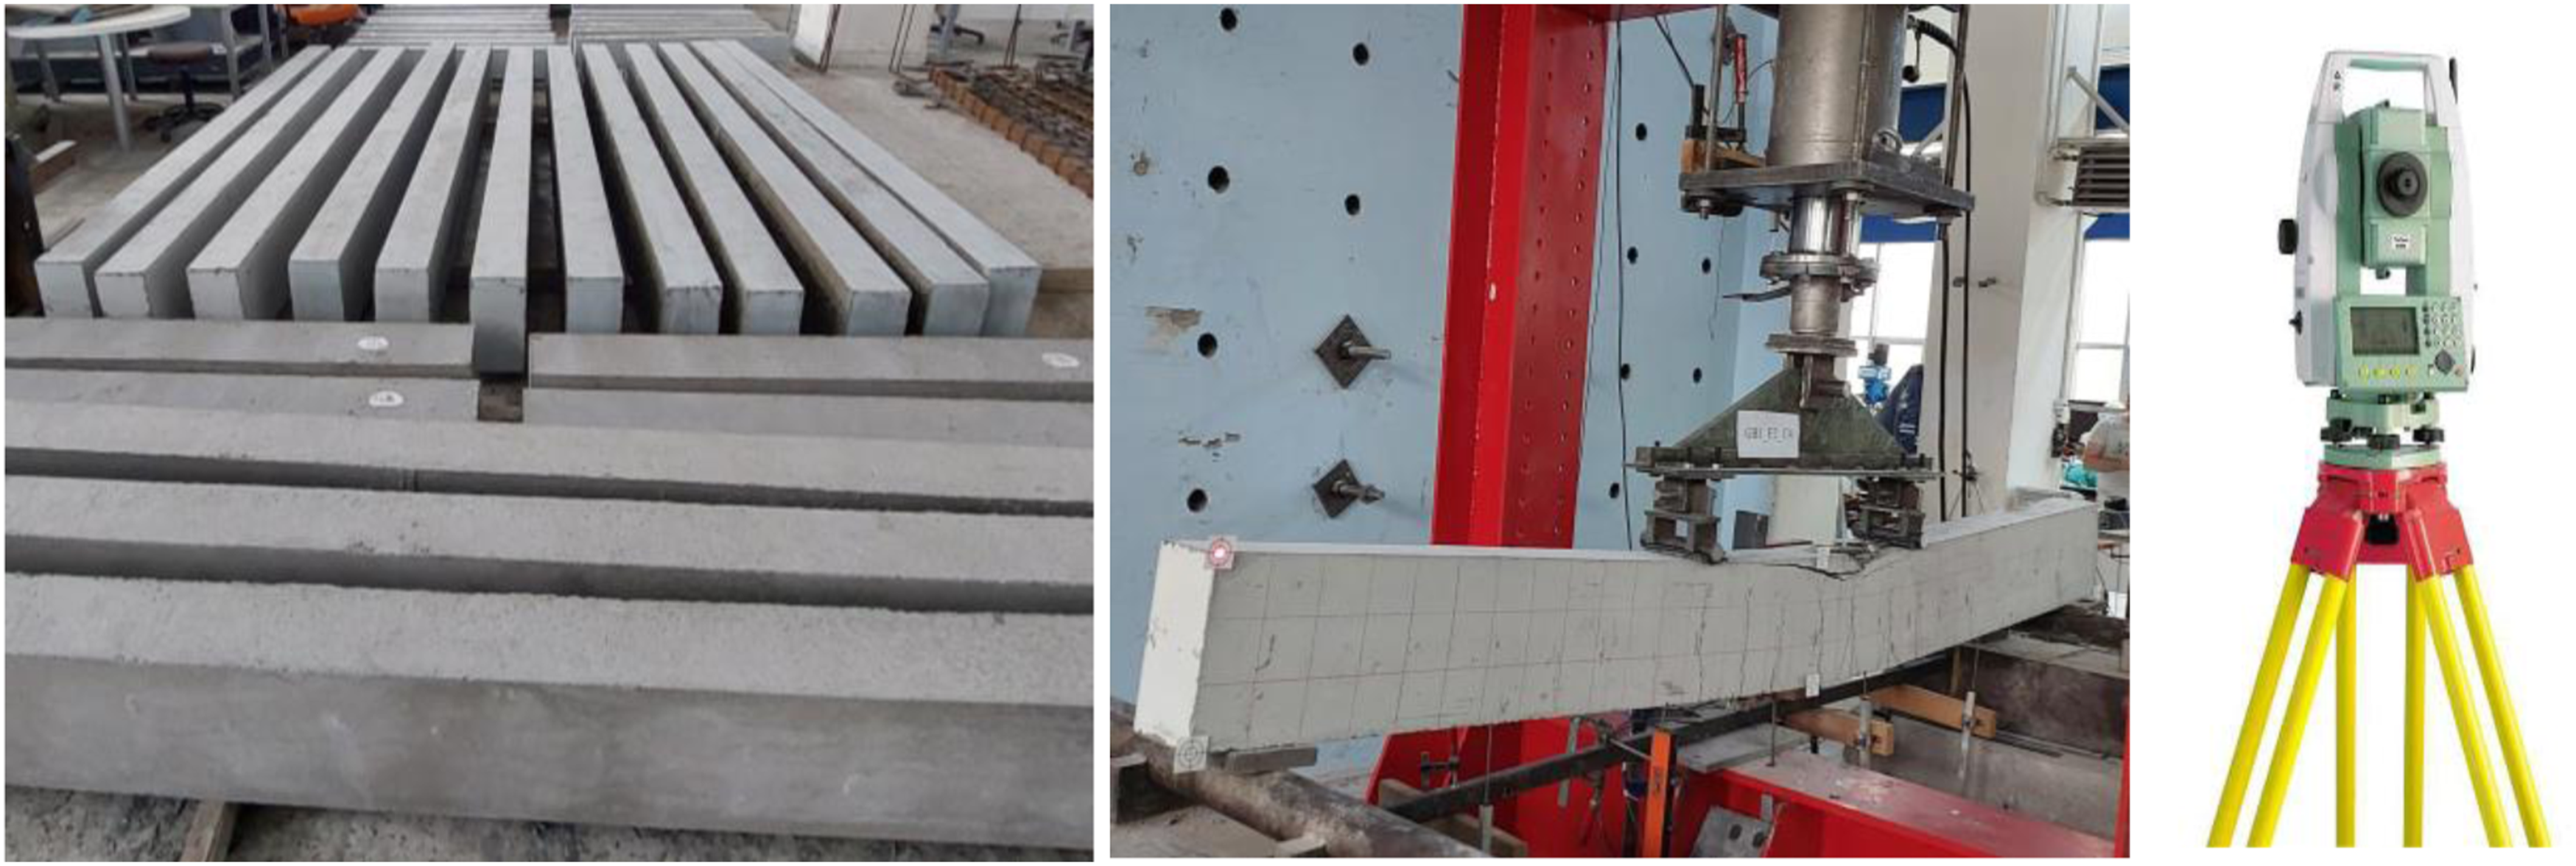
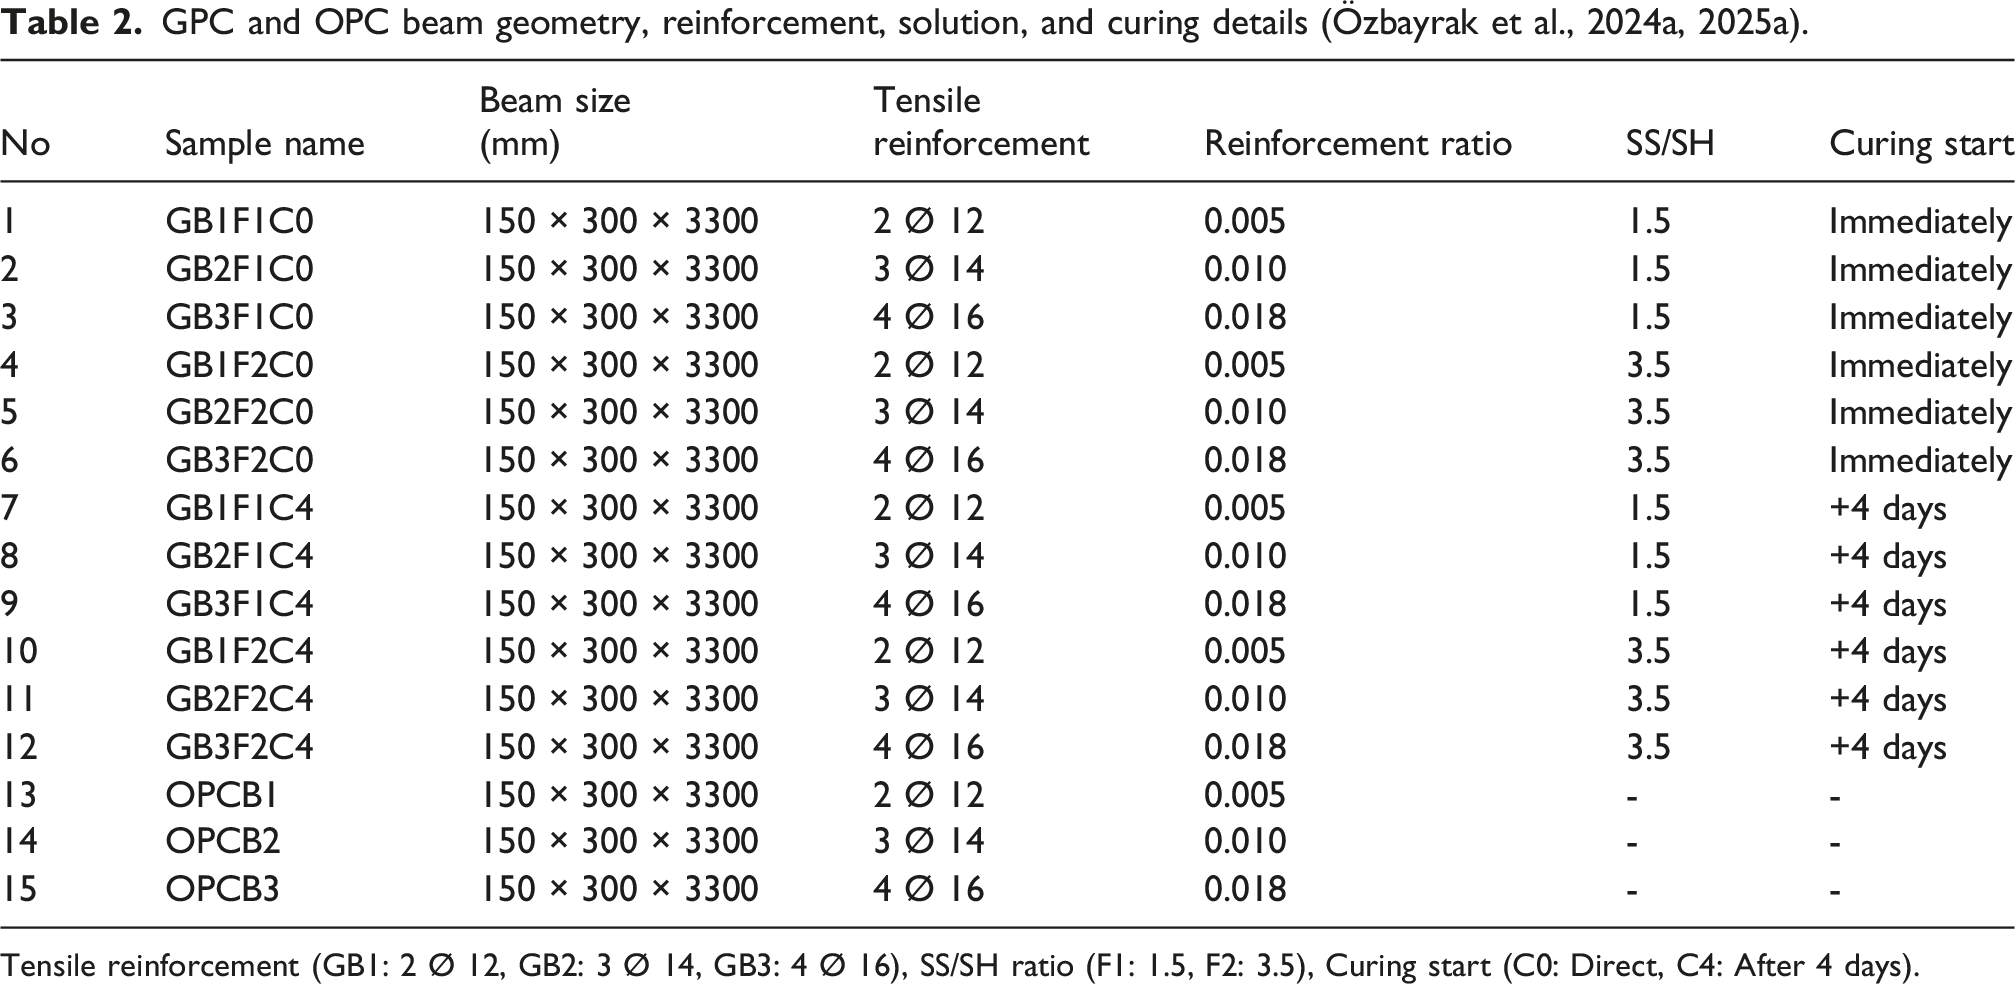
Three tensile reinforcement ratios were used, representing minimum, balanced, and maximum reinforcement limits as specified in the design standards (ACI 318-14, 2014; TS-500, 2000). The concrete cover of the beams is 25 mm, and information on geometric details, solution ratio, curing method, and reinforcement layouts is given in Figure 4 and Table 2. The reinforcement ratios and curing start times were systematically varied across the samples, with tensile reinforcement details as follows: GB1 (2 Ø 12), GB2 (3 Ø 14), and GB3 (4 Ø 16). The SS/SH ratio was 1.5 (F1) or 3.5 (F2). C0 samples that are cured immediately after manufacturing (24 hours at 90°C), and C4 refers to samples that are kept under ambient conditions for 4 days after manufacturing and then heat cured (24 hours at 90°C). The properties of the geopolymer depend largely on the source material, the alkaline activator, the molarity of the activator, and the curing conditions (Benfratello et al., 2025). Curing conditions play an important role in determining the bending performance (Unver et al., 2026). GPC and OPC beam geometry and reinforcement details (Özbayrak et al., 2024a, 2025a). GPC and OPC beam geometry, reinforcement, solution, and curing details (Özbayrak et al., 2024a, 2025a). Tensile reinforcement (GB1: 2 Ø 12, GB2: 3 Ø 14, GB3: 4 Ø 16), SS/SH ratio (F1: 1.5, F2: 3.5), Curing start (C0: Direct, C4: After 4 days).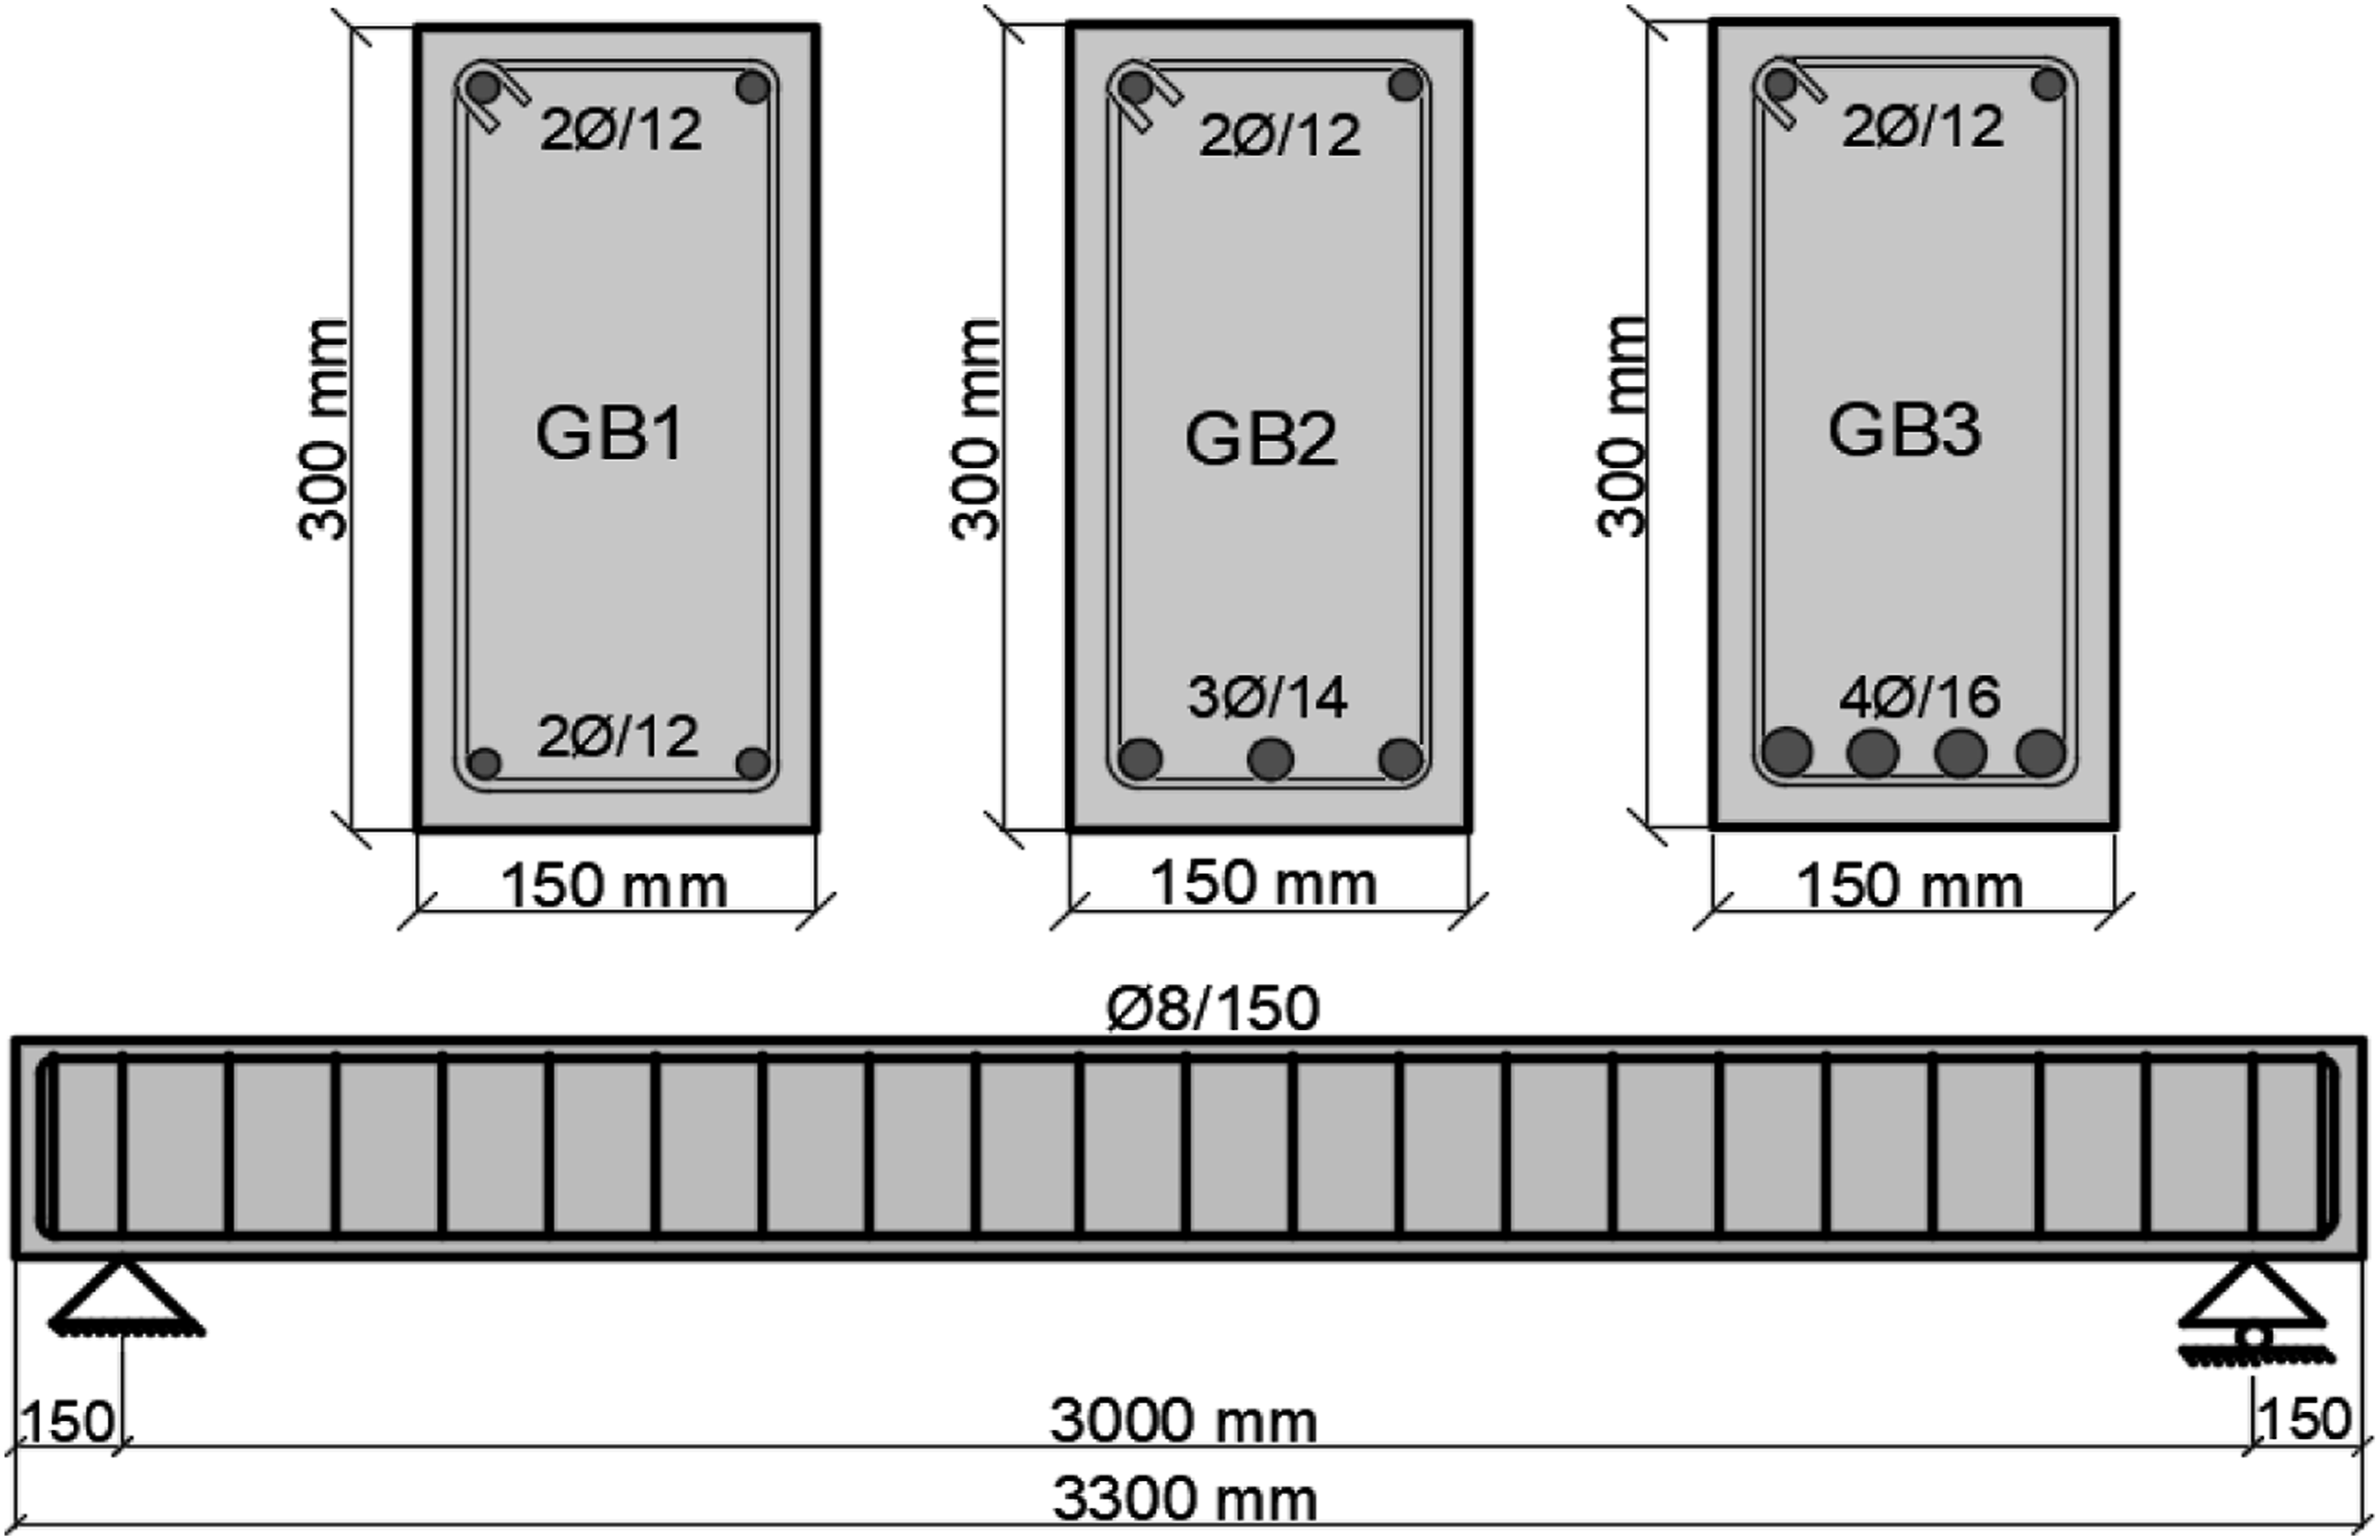
The high-heat-capacity oven shown in Figure 5 was used to cure the GPC beam and cylinder samples. The study provides in-depth insights into the flexural behavior of GPC and OPC beams, accounting for variations in material composition, reinforcement, and curing conditions. In beam tests, the loading rate was 5 kN/min in load-controlled loading and 3 mm/min in displacement-controlled loading. Production and curing of GPC beams (Özbayrak et al., 2024a, 2025a).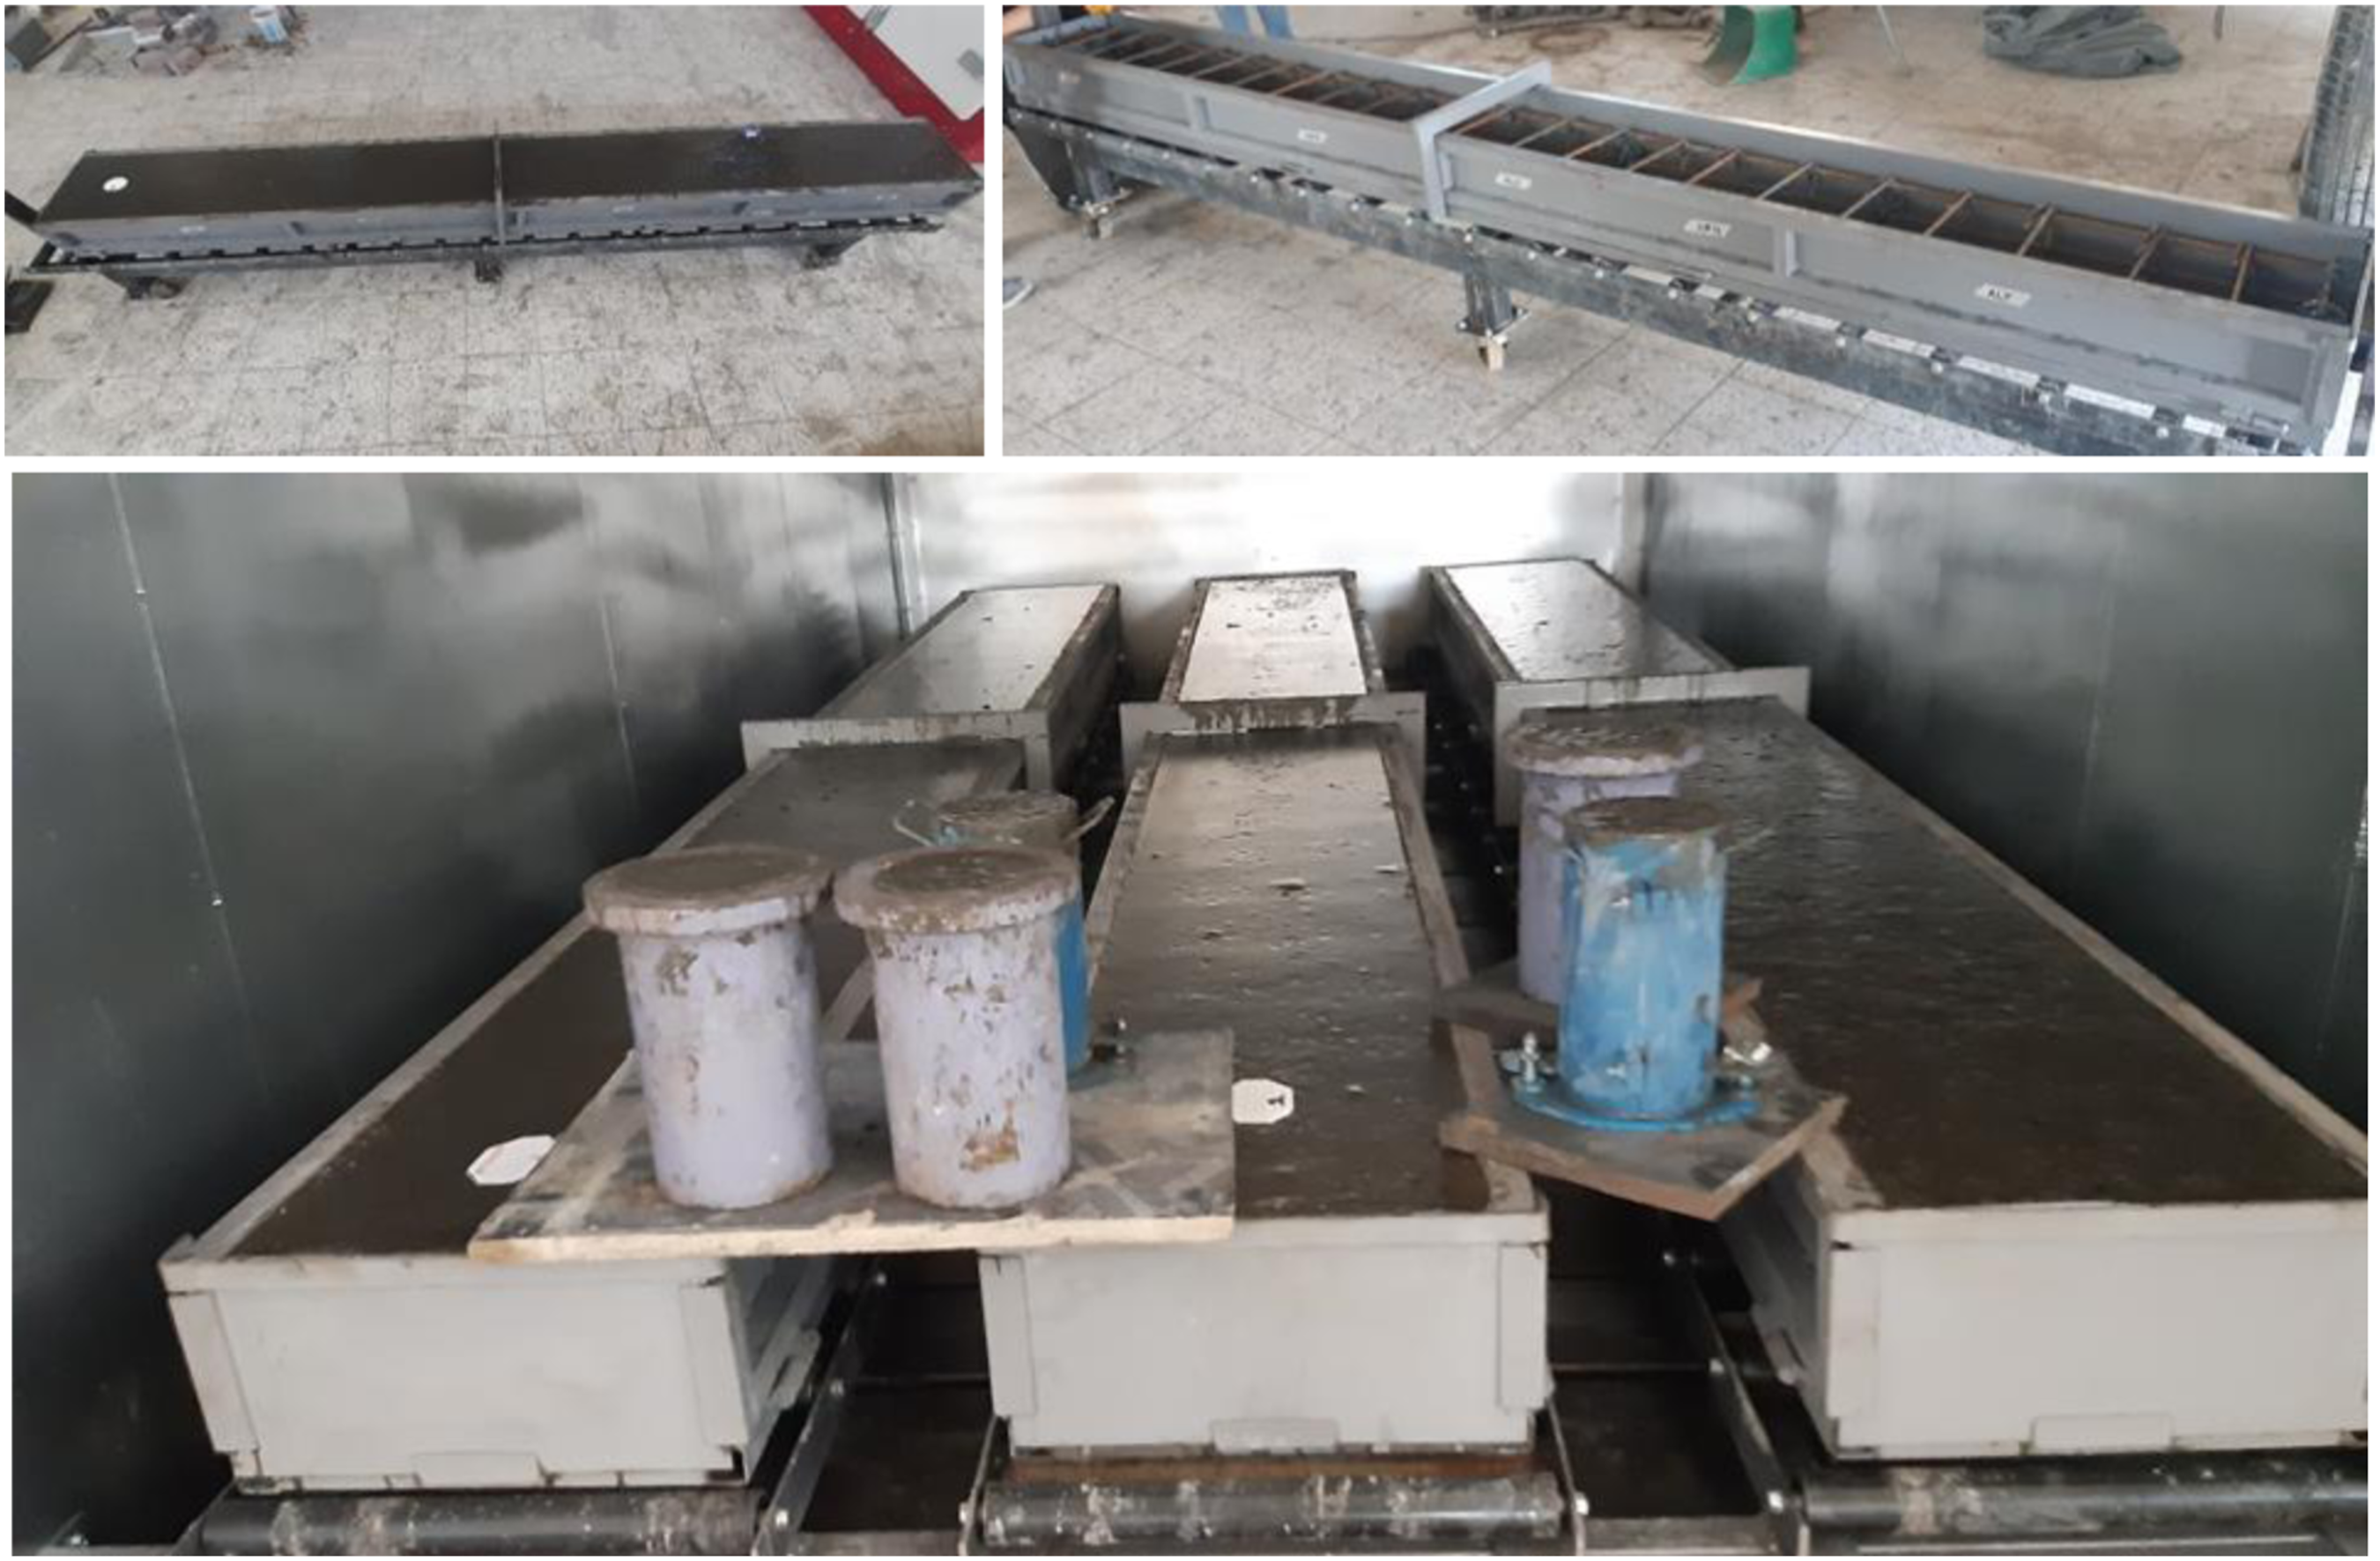
Numerical method
The finite element simulations of GPC and OPC beams were performed using ABAQUS (ABAQUS v6.12, 2018), which is a widely adopted tool for modeling the nonlinear structural behavior of reinforced concrete elements (Demir et al., 2016; Khennane, 2013). Recent studies have demonstrated that finite element models developed in ABAQUS can accurately predict the flexural response and damage distribution of geopolymer concrete beams when validated against experimental results (Dong et al., 2026; George et al., 2023).
The analyses were carried out through the Dynamic Explicit procedure, and all modeling processes adhered to the SI unit system (Özbayrak et al., 2024a). The Dynamic Explicit procedure is an explicit time-integration scheme for highly nonlinear problems without iterative equilibrium calculations. It was adopted in this study for its robustness in modeling cracking, stiffness degradation, and damage evolution in reinforced concrete, while avoiding convergence difficulties associated with implicit analyses. To realistically represent the mechanical response of concrete under multi-axial loading, both elastic and inelastic properties were defined. The Concrete Damaged Plasticity (CDP) model was selected to simulate damage evolution and crack formation in concrete (Özbayrak et al., 2025b). This constitutive model incorporates isotropic elasticity subjected to degradation and models tensile and compressive plasticity in a coupled manner, enabling the accurate prediction of post-peak behavior (Cichocki et al., 2015; Lee and Fenves, 1998; Lubliner et al., 1989; Martin, 2010). The input parameters for the CDP model were determined from experimental results from compression and splitting tensile tests on cylindrical specimens prepared alongside the beam elements. Separate material definitions were created for geopolymer concrete mixes with two distinct SS/SH ratios (1.5 and 3.5), each subjected to different thermal curing conditions, namely, immediate demolding and delayed curing after 4 days.
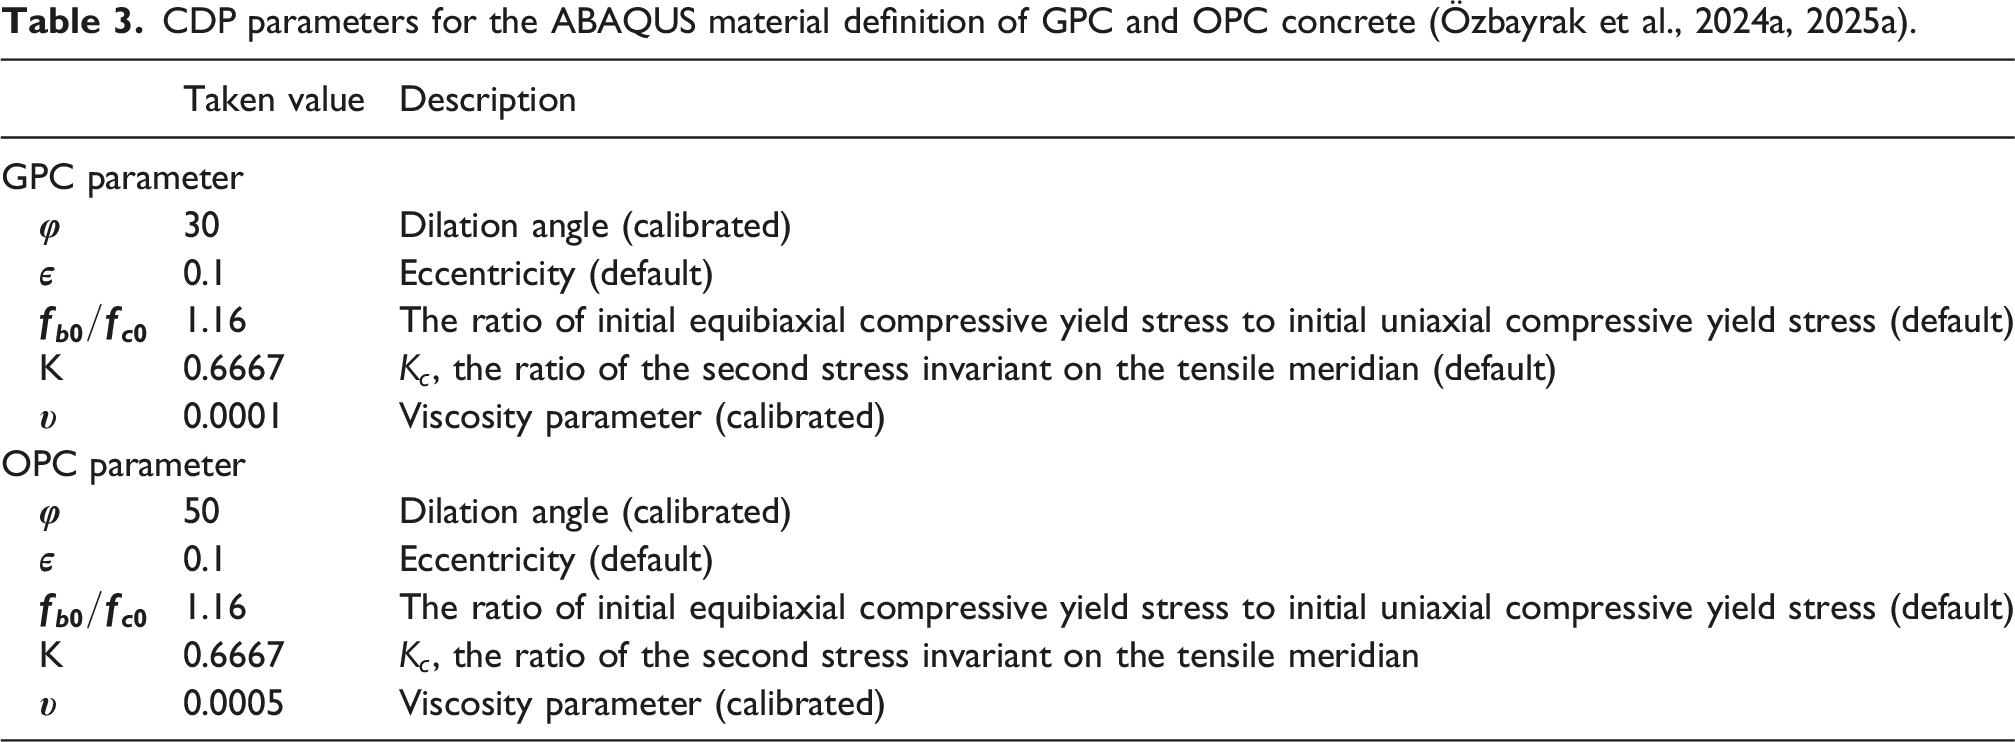
CDP parameters for the ABAQUS material definition of GPC and OPC concrete (Özbayrak et al., 2024a, 2025a).
GPC and OPC material models
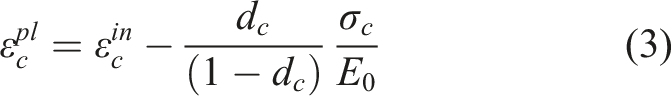
The stress–strain relationships obtained from uniaxial compression tests for each concrete type were incorporated into the constitutive material model. For all specimens, mechanical input parameters, including yield stress, ultimate compressive strength, and the corresponding strain values associated with these states, were defined in the finite element software. The elastic modulus for each mix was calculated from test data and assigned accordingly. The nonlinear behavior of concrete was represented using the Concrete Damaged Plasticity (CDP) model (Özbayrak et al., 2025c). The compressive stress–strain response of concrete was modeled according to established procedures, and the resulting constitutive behavior is presented in Figure 6 (Hibbitt et al., 2013). For compressive behavior modeling in ABAQUS, key parameters such as yield stress values and their corresponding inelastic strain components are required. These inelastic strains begin at the point of initial yielding and represent the deformation accumulated beyond the elastic range. The inelastic strain values were computed using equation (1) as proposed by Kamali (2012), while the corresponding stress values were obtained using equation (2). Although the software internally converts inelastic strain into plastic strain, this transformation was also explicitly computed using equation (3) for consistency. Compressive behavior of concrete in the post-cracking phase (Özbayrak et al., 2024a, 2025a).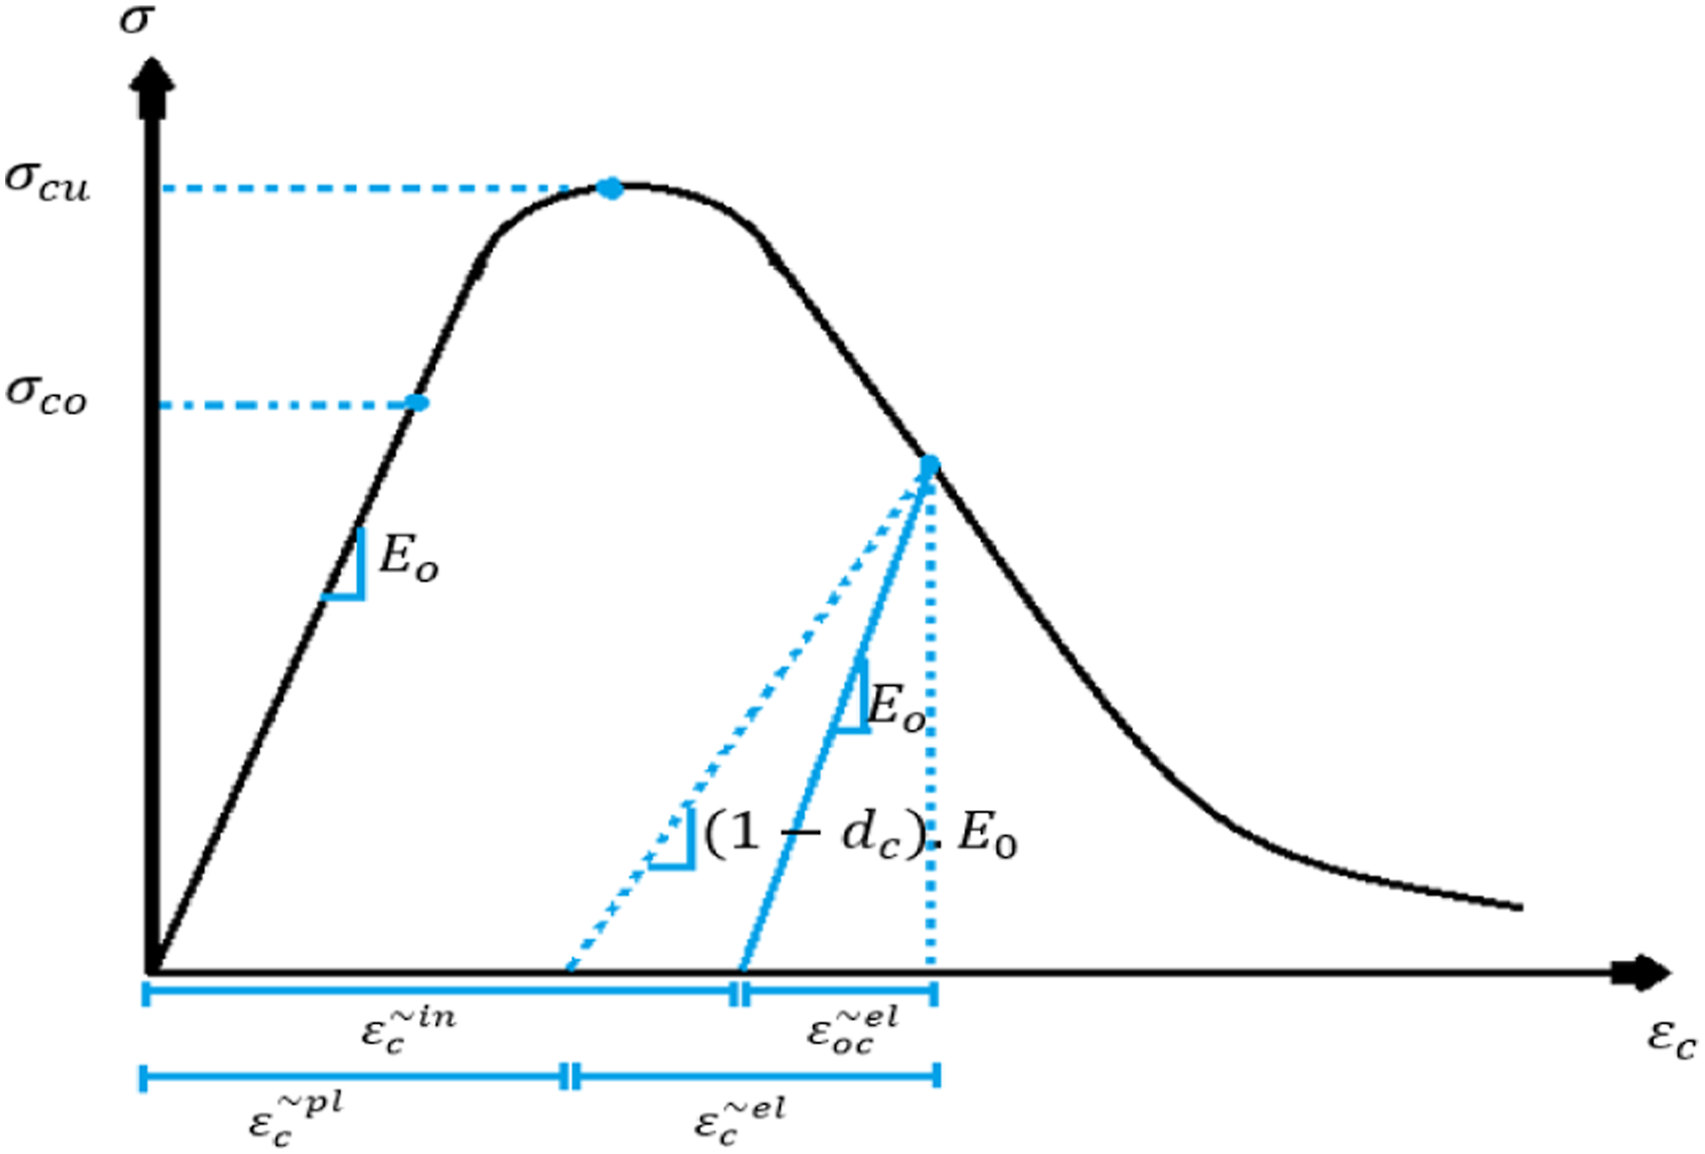
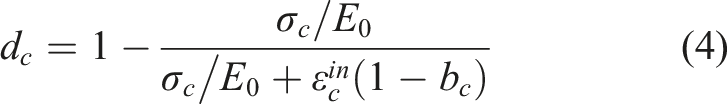
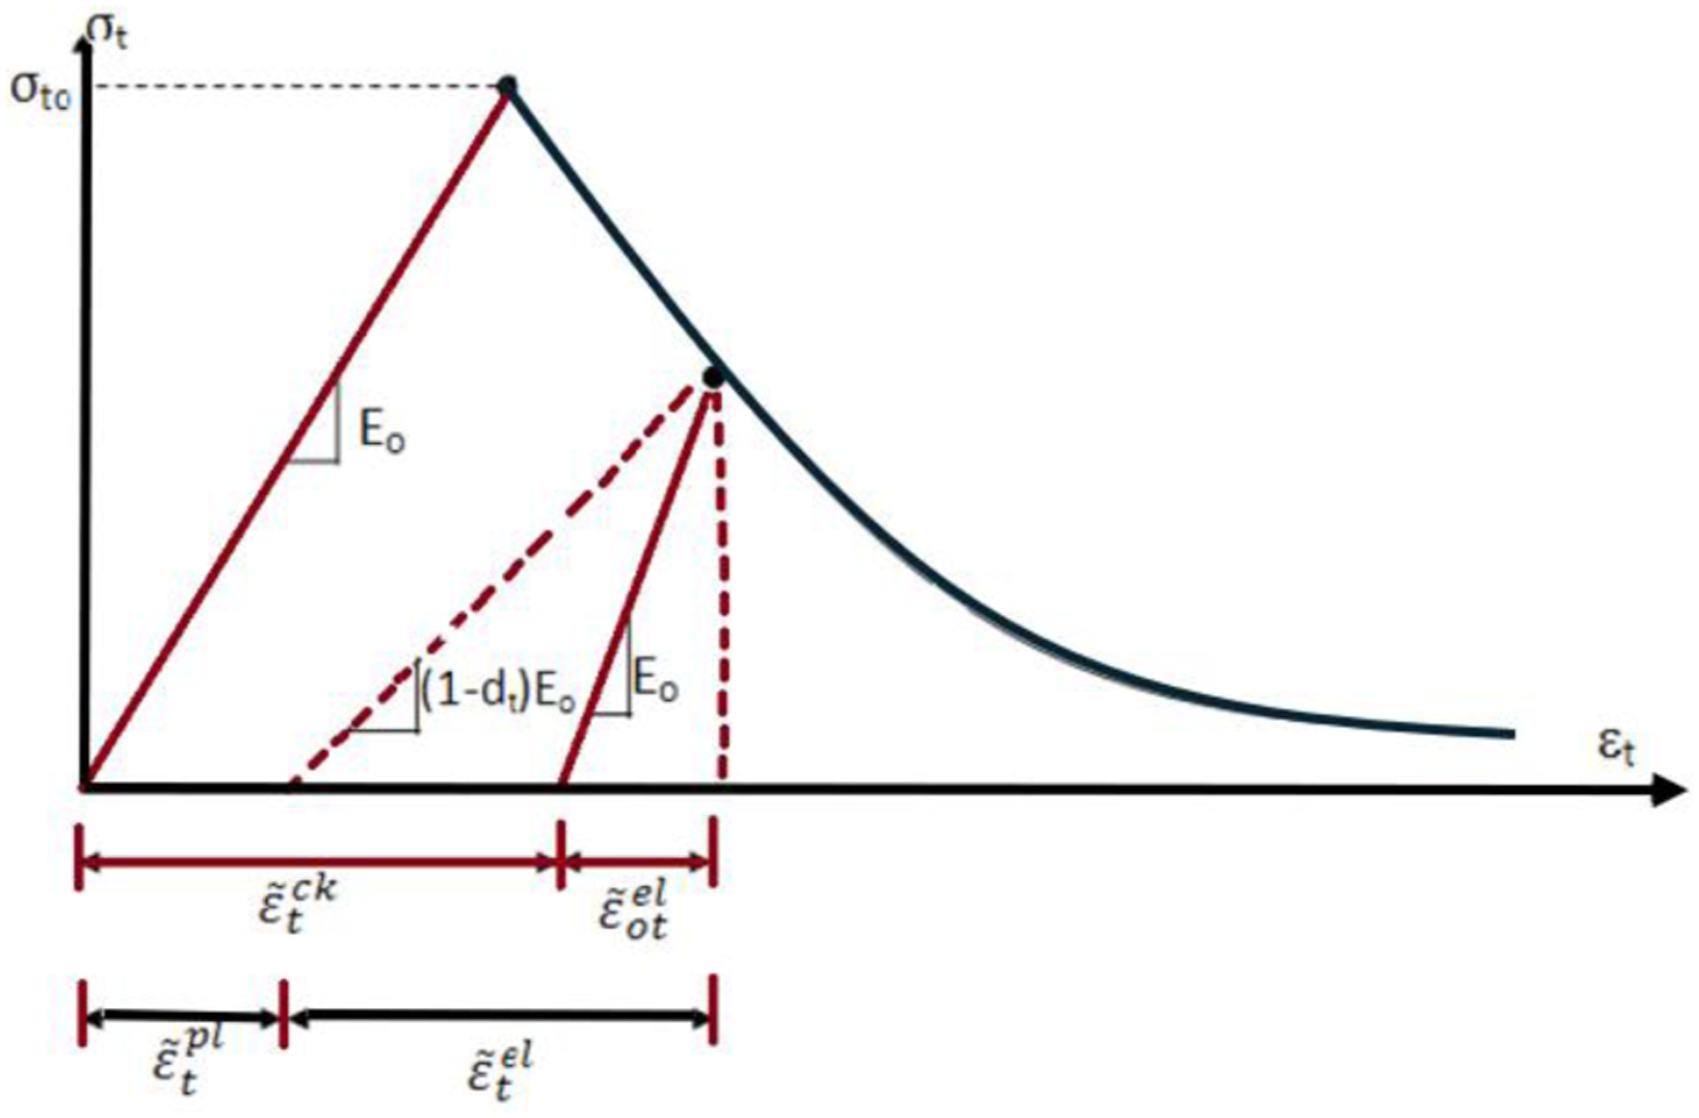
Additionally, the damage parameter under compressive loading, denoted as d c , was introduced through equation (4). This coefficient quantifies the degradation in elastic stiffness following the peak compressive strength and plays a critical role in accurately replicating the post-peak softening behavior of concrete within the CDP framework. Proper calibration of the d c value is essential for simulating the material’s damage mechanics realistically, and its determination was guided by the empirical approach defined in the literature (Kamali, 2012). The parameter b c , as defined in the governing equations, denotes the ratio of plastic strain to inelastic strain. Based on findings in current literature, this ratio typically ranges from 0.5 to 0.7 for concrete materials (Birtel and Mark, 2006; Grassl, 2004; Hany et al., 2016; Hibbitt et al., 2013; Krätzig and Pölling, 2004; Mercan et al., 2010). Under uniaxial tensile loading, the stress–strain (σ t - ε t ) response of concrete remains linear-elastic up to the peak tensile stress (σ t0 - f ctk ), as illustrated in Figure 6. The corresponding strain at peak stress, εt0, is computed by dividing the peak stress by the initial elastic modulus (E 0 ).
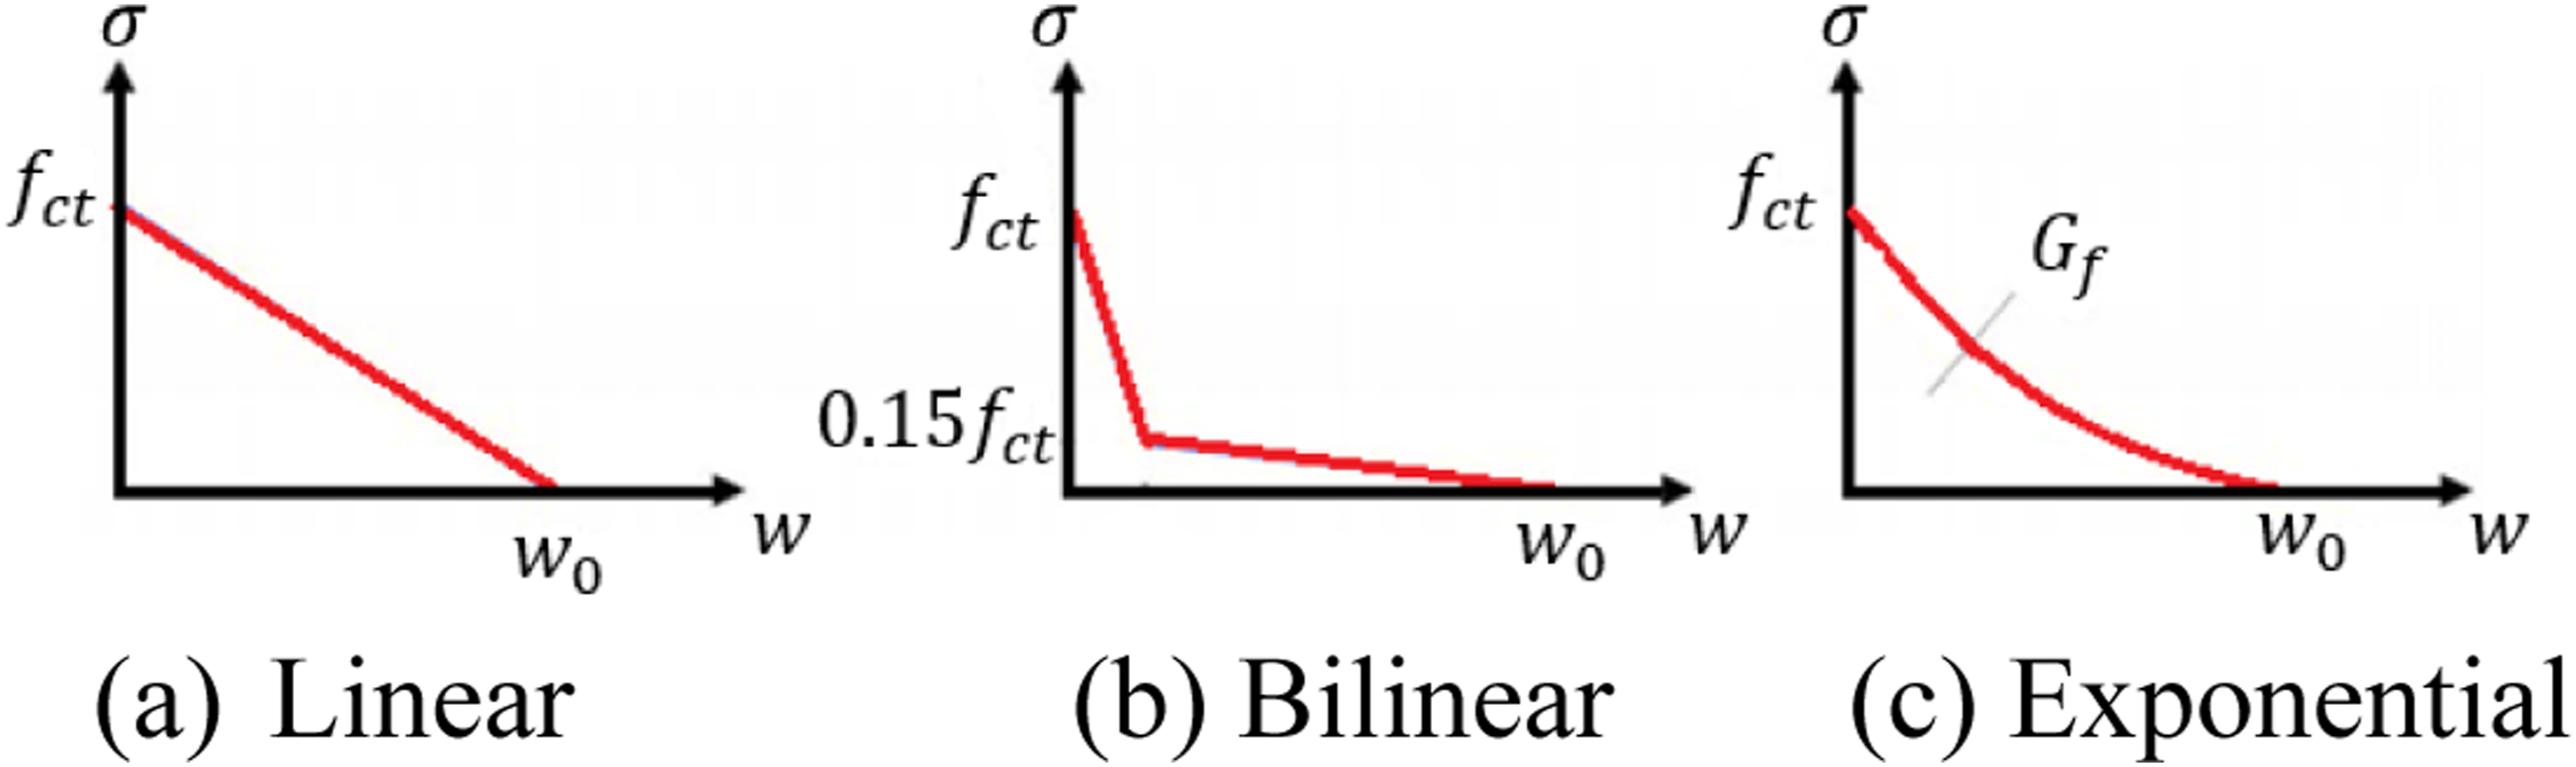
The tensile behavior of concrete is shown in Figure 7 (Hibbitt et al., 2013), while different modeling approaches, including linear, bilinear, and exponential tension softening curves; are demonstrated in Figure 8 (Earij et al., 2017), where w represents the crack width. To simulate post-cracking tensile responses in ABAQUS, it is essential to define the softening behavior of concrete beyond the cracking threshold. According to the implemented constitutive model, the tensile stress values (σ
t
) are calculated using equation (5), and the corresponding plastic strain values (ε
t
pl
) are derived via equation (6) (Hibbitt et al., 2013). The d
t
parameter quantifies tensile damage and is computed using equation (7), while the inelastic strain after cracking, denoted ε
t
ck
, is calculated with equation (8) (Kamali, 2012; Lopez-Almansa et al., 2014). Literature suggests that the Tensile response curve of concrete (Özbayrak et al., 2024a, 2025a). Tensile behavior of concrete in the post-cracking stage (Özbayrak et al., 2024a, 2025a).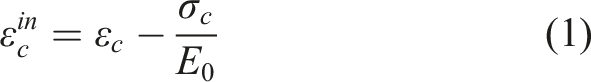


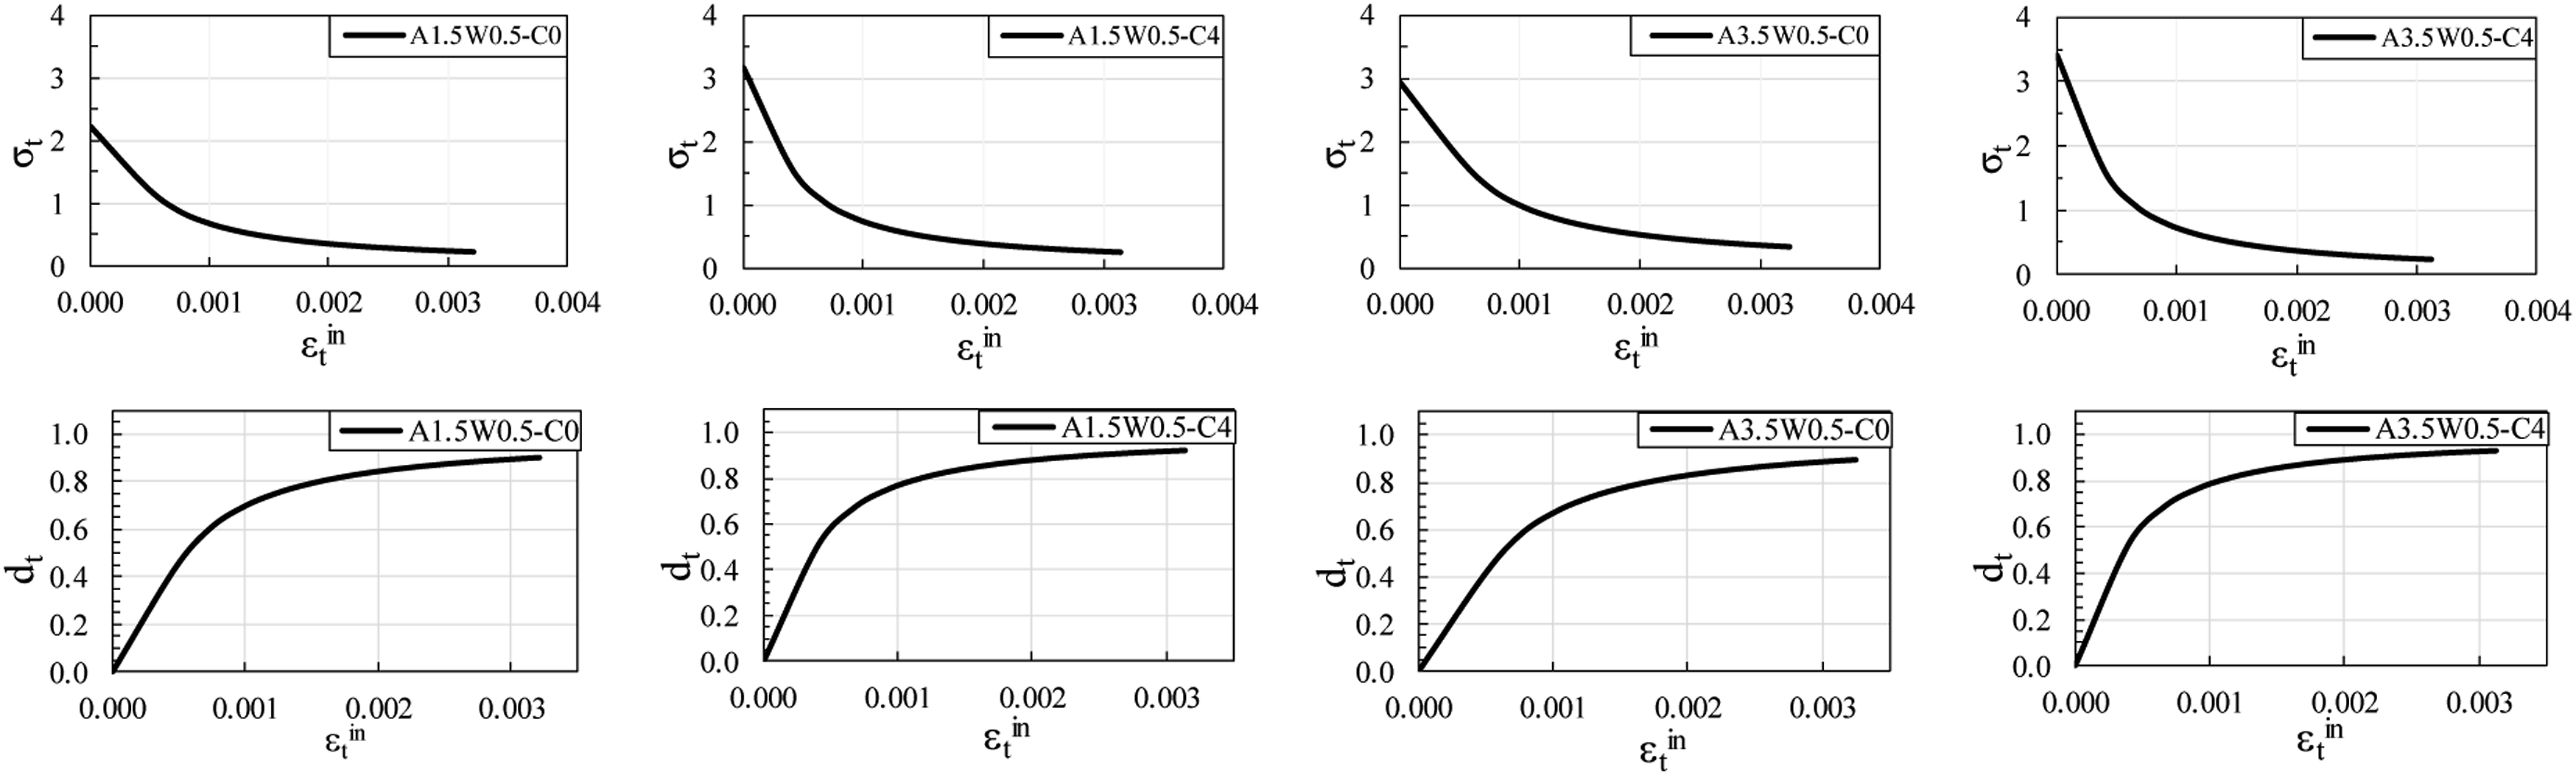
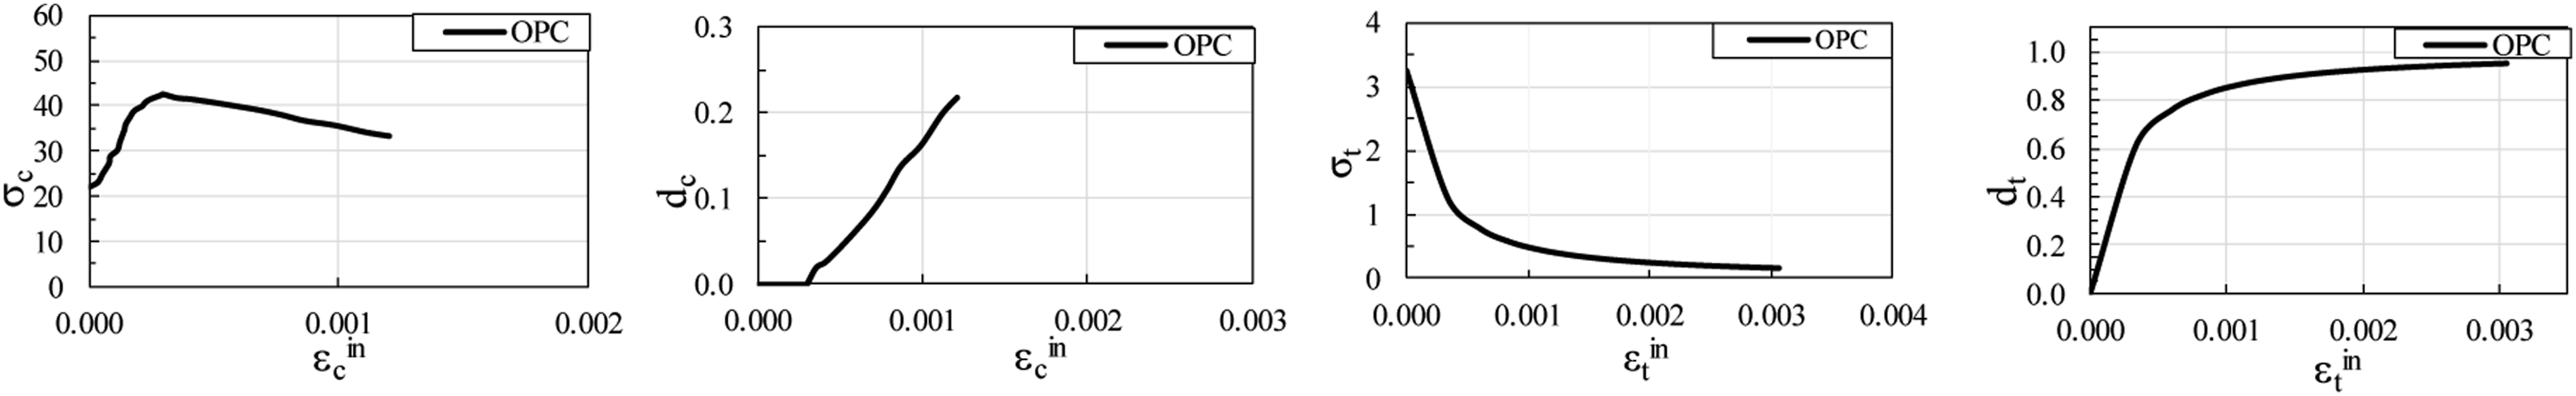
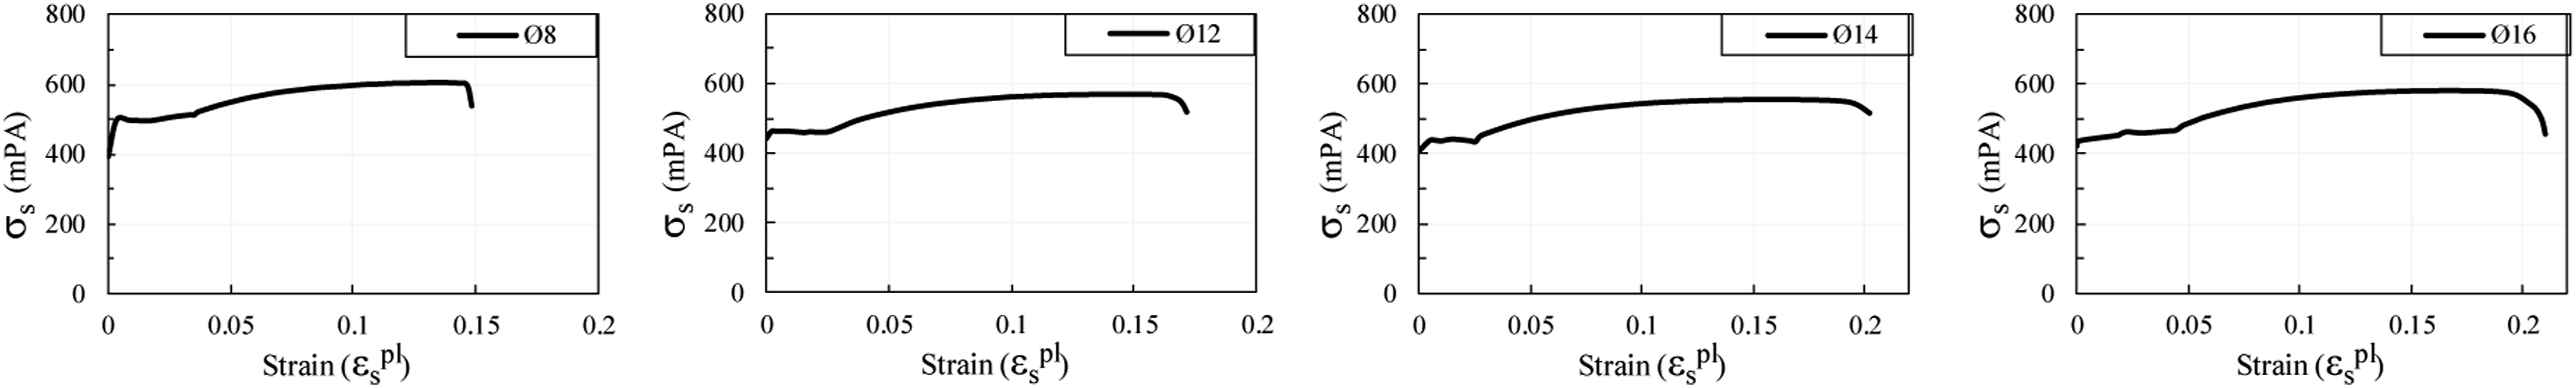
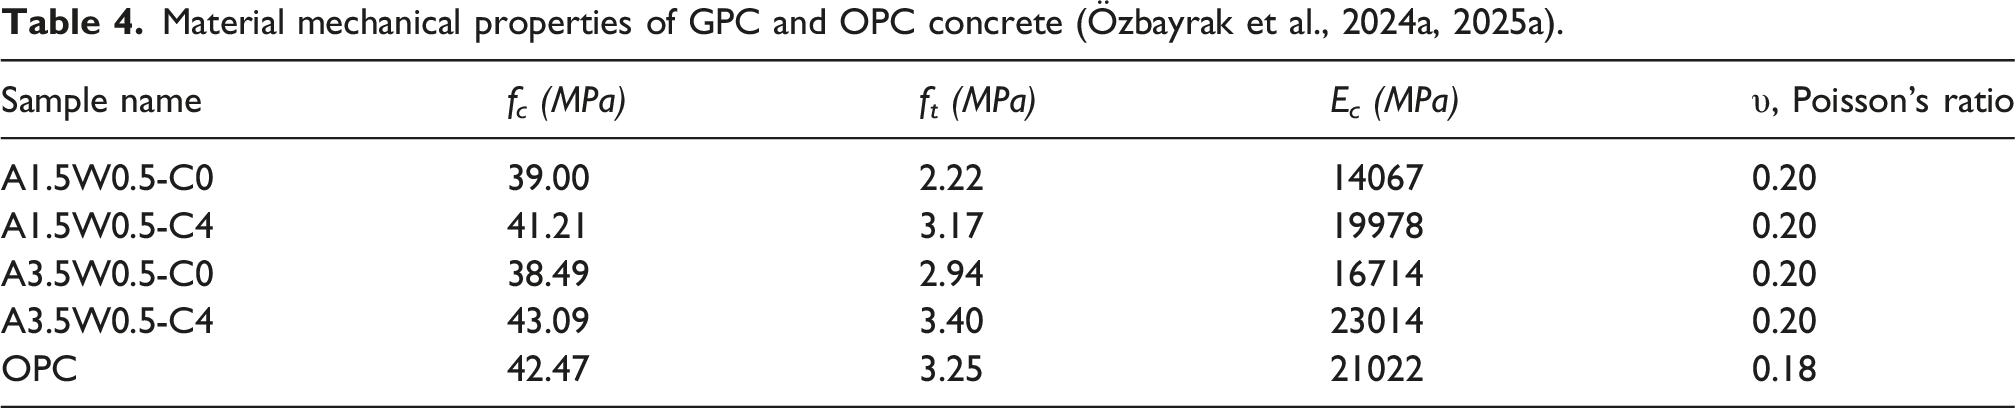
The mechanical properties of all material models were established based on compressive and tensile experimental data. Compressive stress–strain curves and corresponding damage diagrams were developed using the results of cylinder compression tests, while tensile response and damage profiles were obtained through splitting tensile tests. The compressive and tensile damage behavior of GPC mixtures, as derived from the experimental results and modeled through the aforementioned equations, is shown in Figures 9 and 10, respectively. The corresponding graphs for OPC specimens are presented in Figure 11. Moreover, the tensile stress–strain relationship for the steel reinforcement used in the experimental program was defined using the CDP model and implemented into the finite element simulation (Birtel and Mark, 2006; Earij et al., 2017; Grassl, 2004; Hany et al., 2016; Hibbitt et al., 2013; Krätzig and Pölling, 2004; Lopez-Almansa et al., 2014; Mercan et al., 2010; Pham et al., 2021). These curves, reflecting the plastic response of the reinforcement materials, are shown in Figure 12. An elastic modulus of 200000 MPa and a Poisson’s ratio of 0.3 were assigned to the reinforcement. The detailed material properties used for both GPC and OPC specimens are summarized in Table 4. Compressive and damage behavior curves of GPC samples obtained from the numerical model (Özbayrak et al., 2024a, 2025a). Tensile and damage behavior curves of GPC samples obtained from the numerical model (Özbayrak et al., 2024a, 2025a). Compressive and tensile damage behavior curves of OPC samples obtained from the numerical model (Özbayrak et al., 2024a, 2025a). Plastic strain curves of rebar with different diameters (Özbayrak et al., 2024a, 2025a). Material mechanical properties of GPC and OPC concrete (Özbayrak et al., 2024a, 2025a).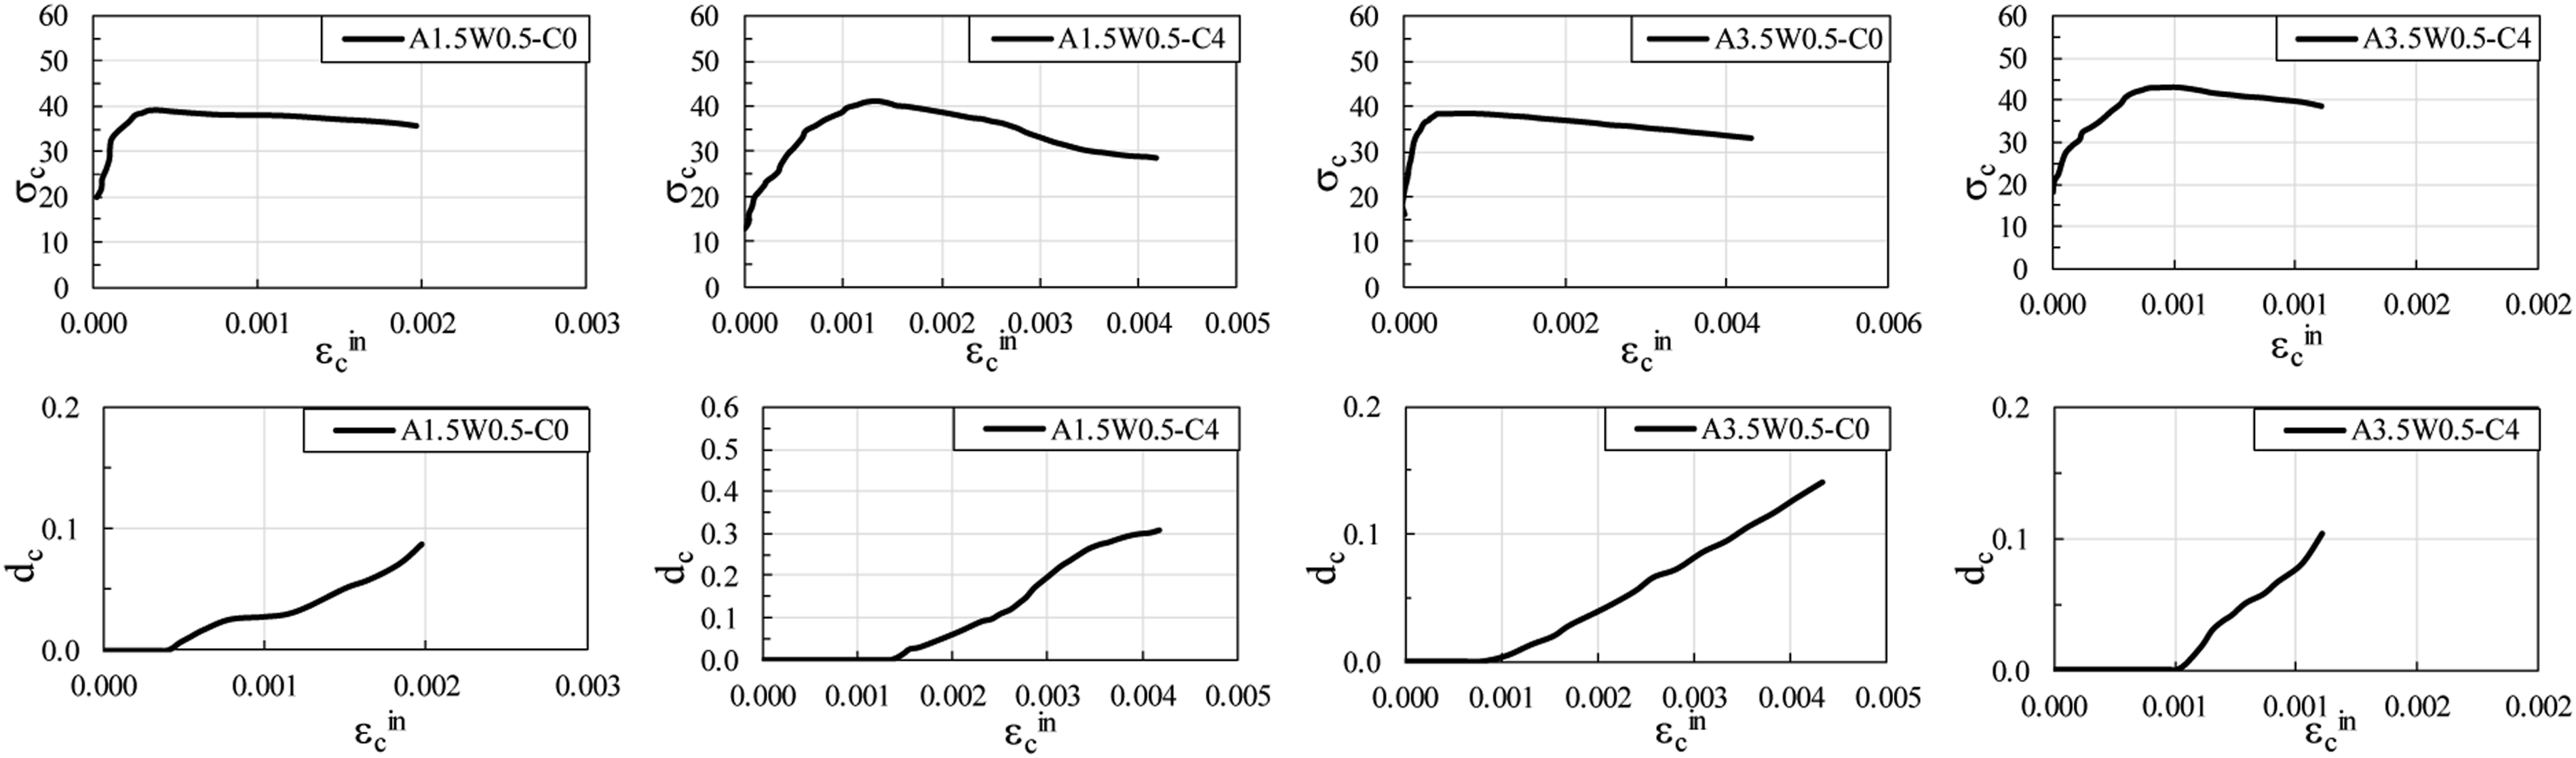
Numerical modeling setup and simulation parameters
In the finite element model, the interaction between the reinforcement and the surrounding concrete was modeled using the embedded region technique, which allows the two materials to act as a fully bonded system. In this approach, the reinforcement elements (embedded) are kinematically constrained to the host concrete elements such that they share the same degrees of freedom, resulting in no relative slip or separation throughout the analysis. This assumption simplifies bond modeling and assumes perfect adherence between the two materials. In the present model, the embedded-region technique was adopted under the assumption of a perfect bond between reinforcement and concrete. This approach was considered appropriate because the numerical analyses were intended to capture the global flexural response and damage evolution of the beams, while previous bond-related studies on similar geopolymer concrete systems indicated adequate reinforcement–concrete interaction for structural-level modeling (Aslanbay et al., 2024; Demir et al., 2016; Khennane, 2013; Özbayrak et al., 2024a).
For the contact definition between the concrete specimen and the loading and support plates, a tie constraint was implemented. This ensures that the surfaces remain bonded throughout the analysis, preventing any sliding or detachment at the interfaces. The boundary conditions were defined by numerically coupling the degrees of freedom at the constrained surfaces, allowing them to displace together during the simulation. The applied loading configuration replicates a standard four-point bending test, with a 900 mm spacing between the two loading points. A prescribed displacement was assigned to the loading regions, and the loading amplitude was defined based on the duration and control settings of the explicit dynamic analysis. Structural responses, including deformation and load transfer, were monitored throughout the simulation. The load–displacement curves were generated by extracting reaction forces at the supports corresponding to the imposed displacements. The analysis was performed using the explicit dynamic solution method, which is particularly suitable for problems involving material degradation, cracking, and failure progression. Its ability to account for inertia and damping effects makes it appropriate for simulating post-cracking behavior and failure mechanisms observed in experimental conditions. During meshing, element types and mesh sizes were defined separately for concrete and reinforcement components.
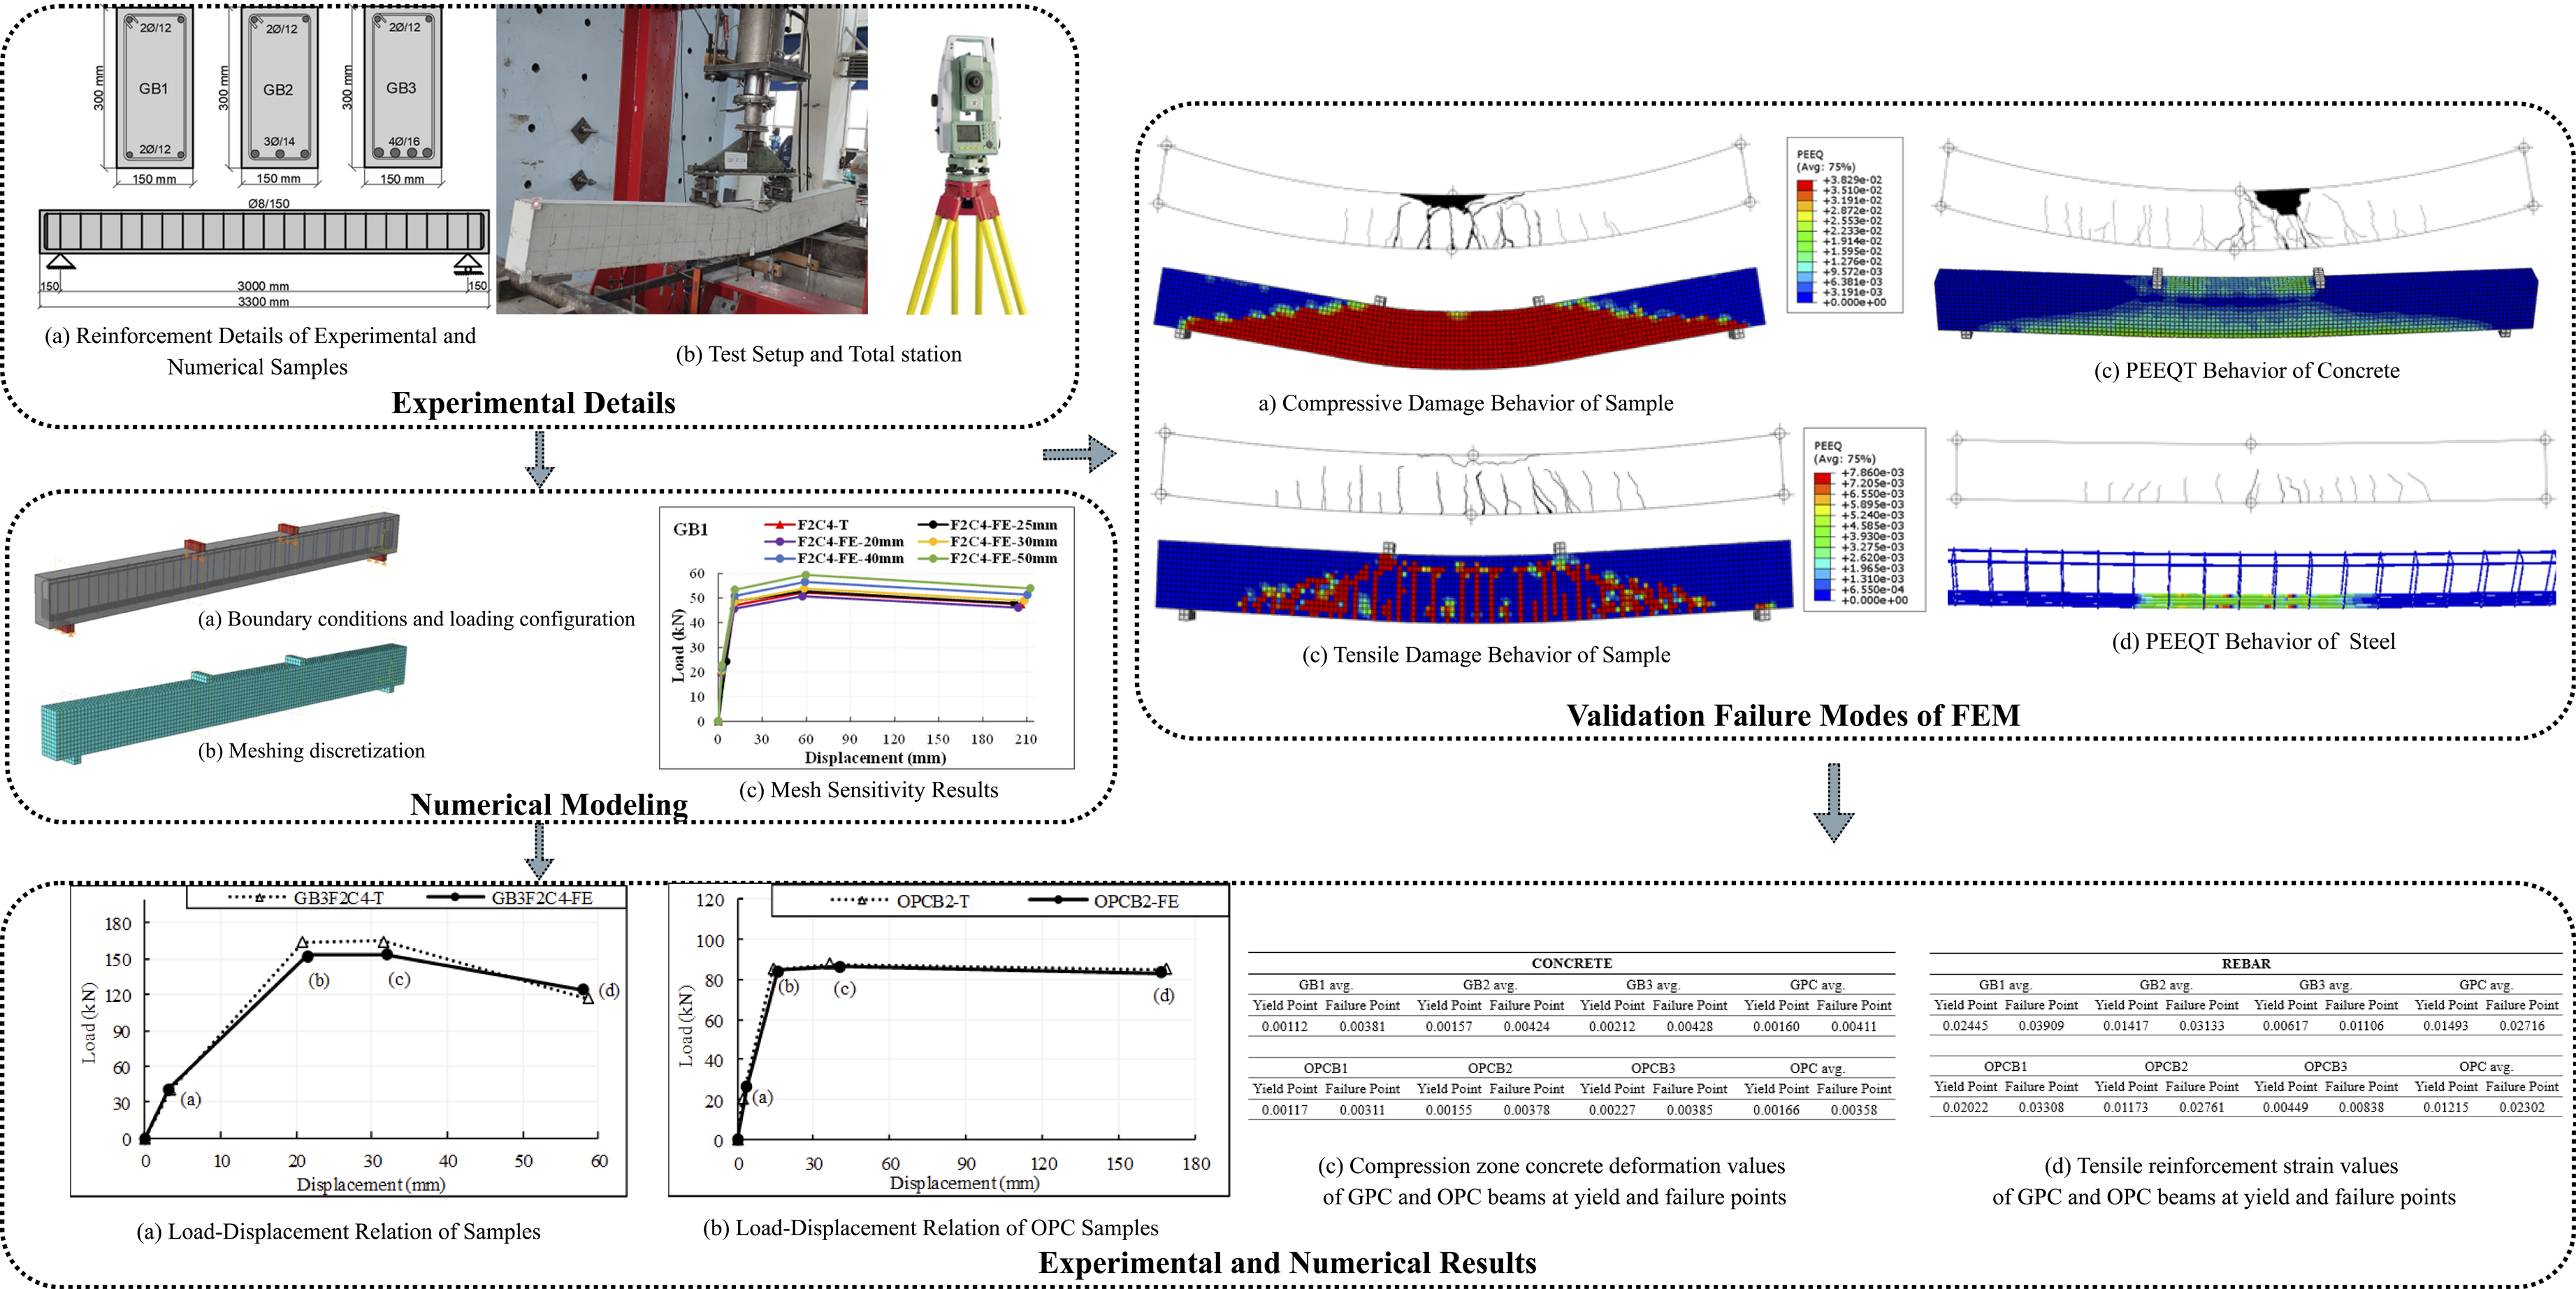
For the concrete domain, C3D8R eight-node linear hexahedral elements with reduced integration were used to model nonlinear deformation in three dimensions accurately. Longitudinal and transverse reinforcements (including stirrups) were modeled using T3D2 elements, two-node truss elements designed to simulate bar-type behavior in 3D space. Mesh refinement was applied to the reinforcement and adjacent concrete regions to ensure accurate interaction representation. A parametric mesh sensitivity study was conducted to determine the optimal element size for concrete. Mesh sizes of 20, 25, 30, 40, and 50 mm (with an aspect ratio of 1:1:1) were evaluated. Based on the results, a mesh size of 25 mm was selected as the optimum for both concrete and reinforcement, offering a balance between computational efficiency and accuracy (Özbayrak et al., 2024a, 2025a). Loading and support plates were meshed with the same size to maintain geometric and bond consistency with the experimental specimens. The final finite element mesh and model configuration are illustrated in Figure 13, reflecting the structural layout, loading arrangement, and refined meshing strategy adopted in the numerical simulations. Numerical model representation: (a) Boundary conditions and loading configuration, (b) Meshing discretization accuracy (Özbayrak et al., 2025a).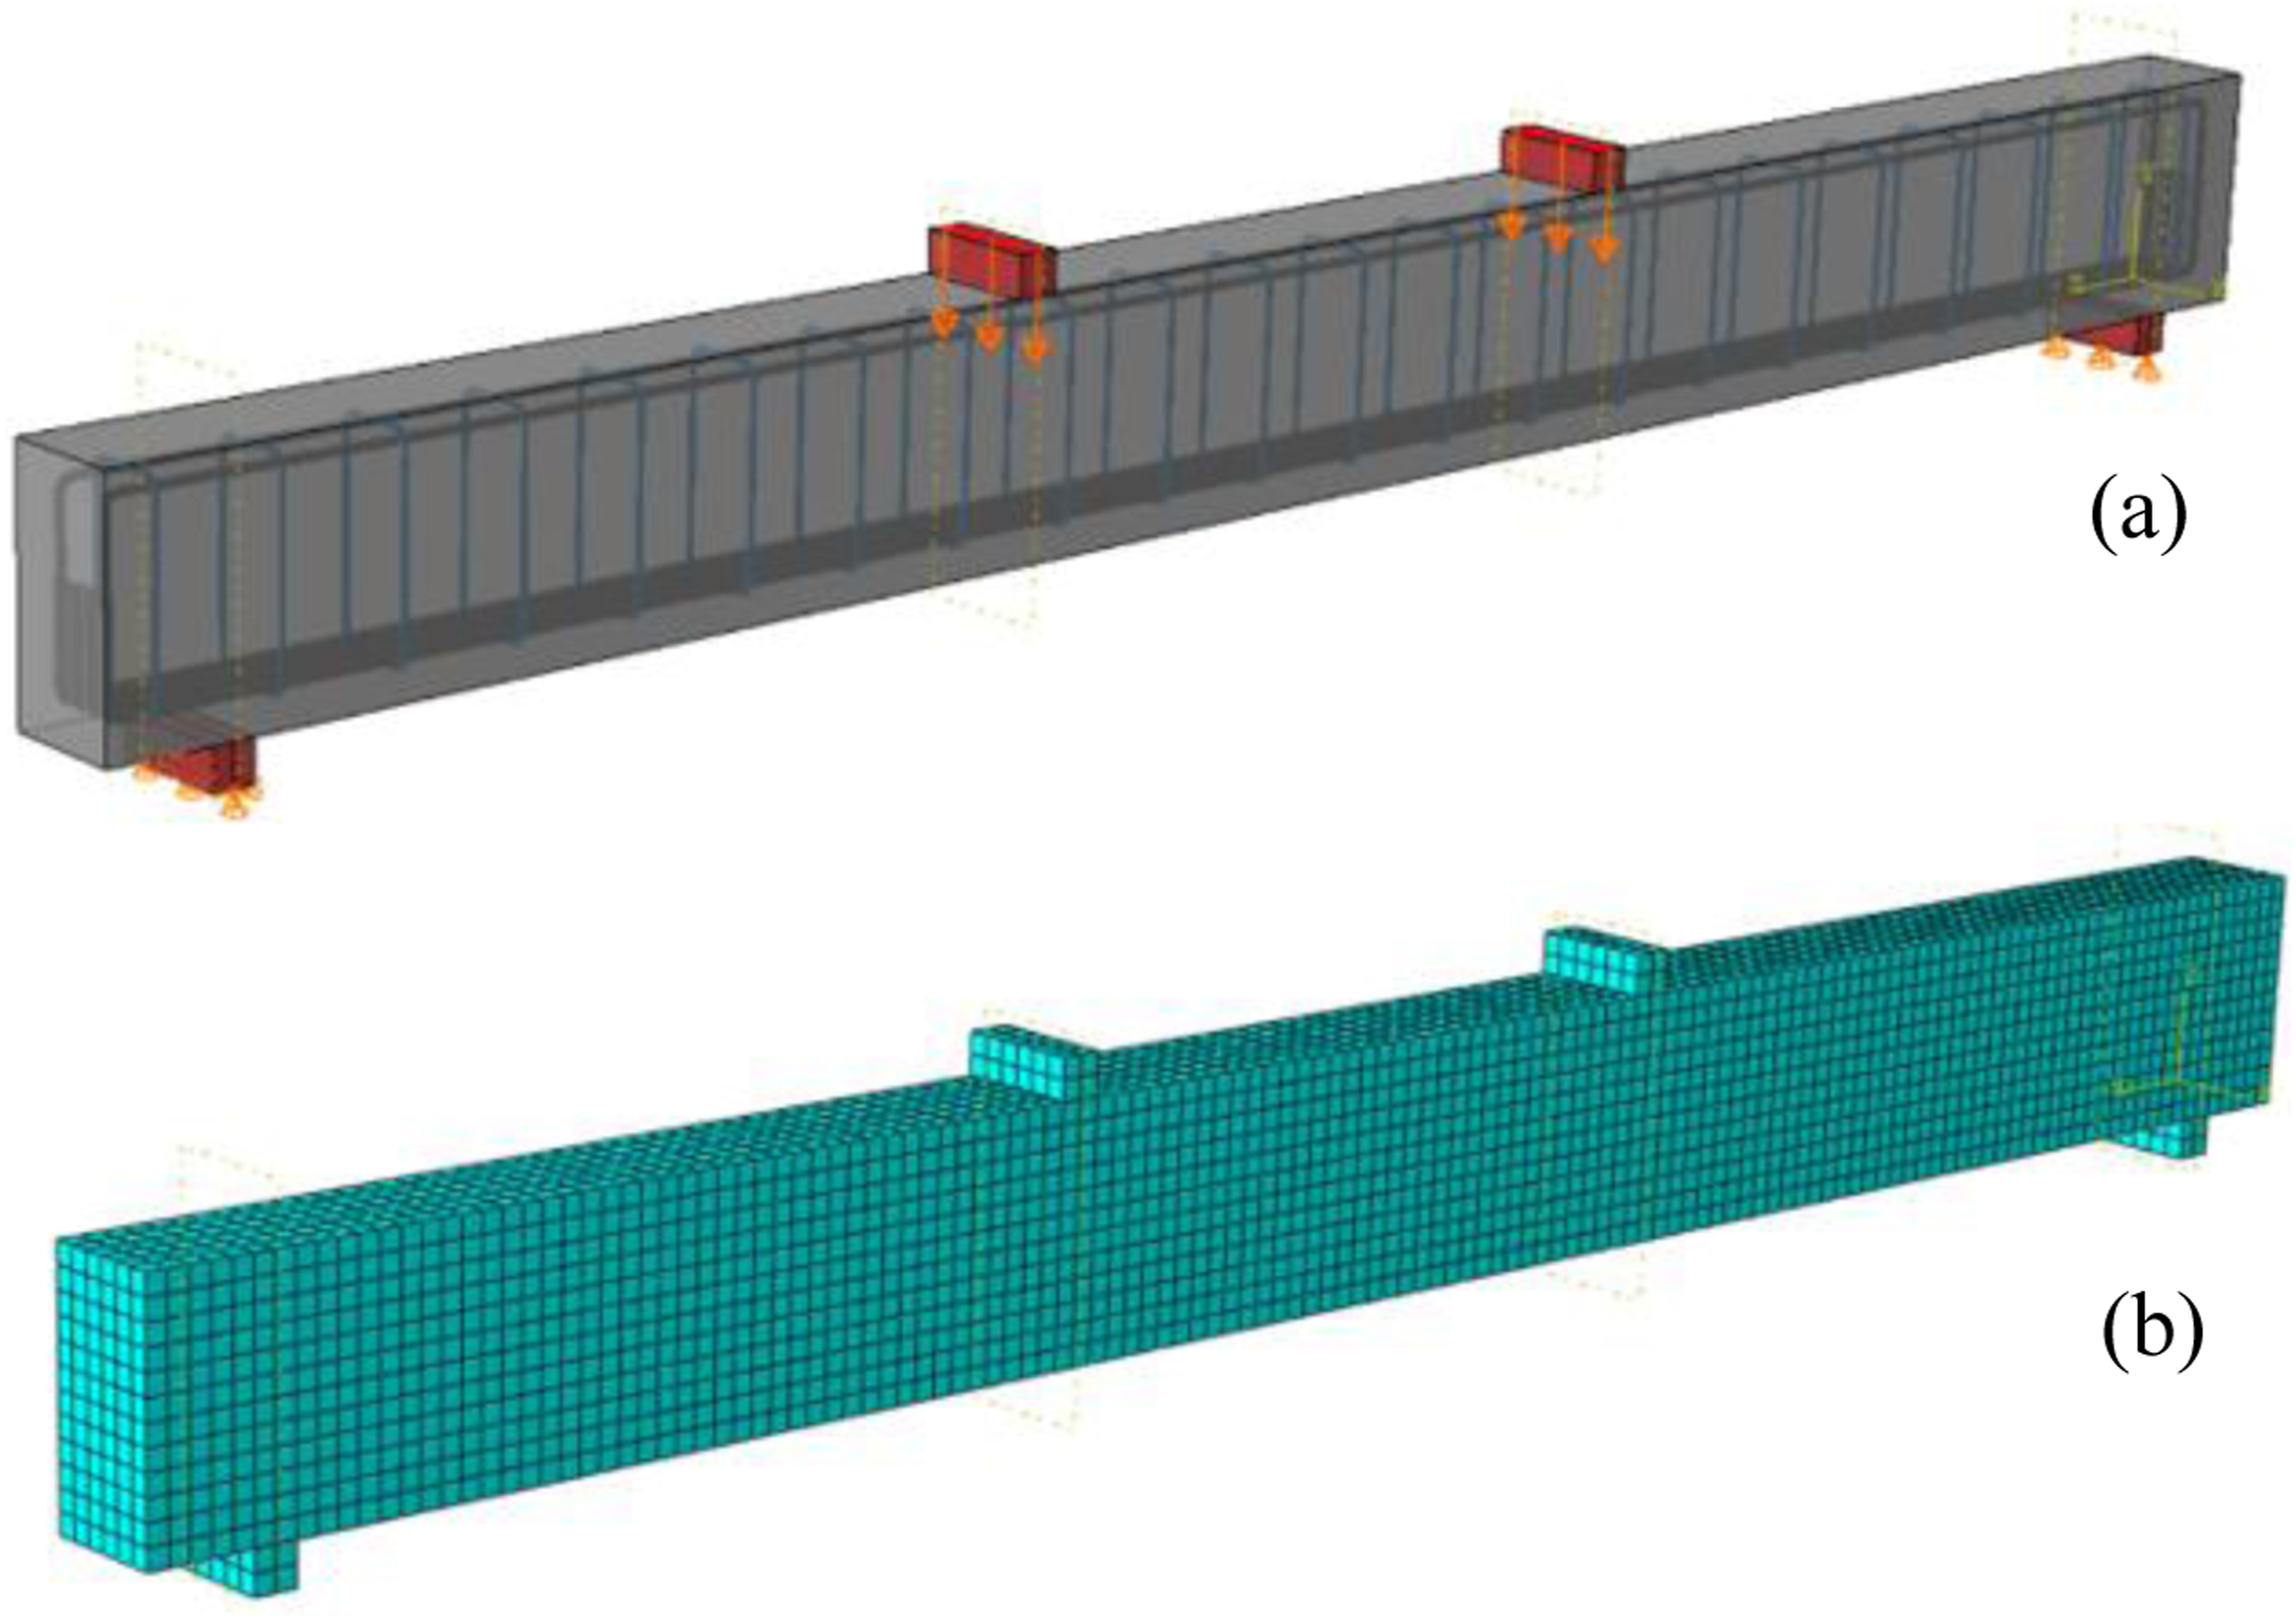
Mesh sensitivity
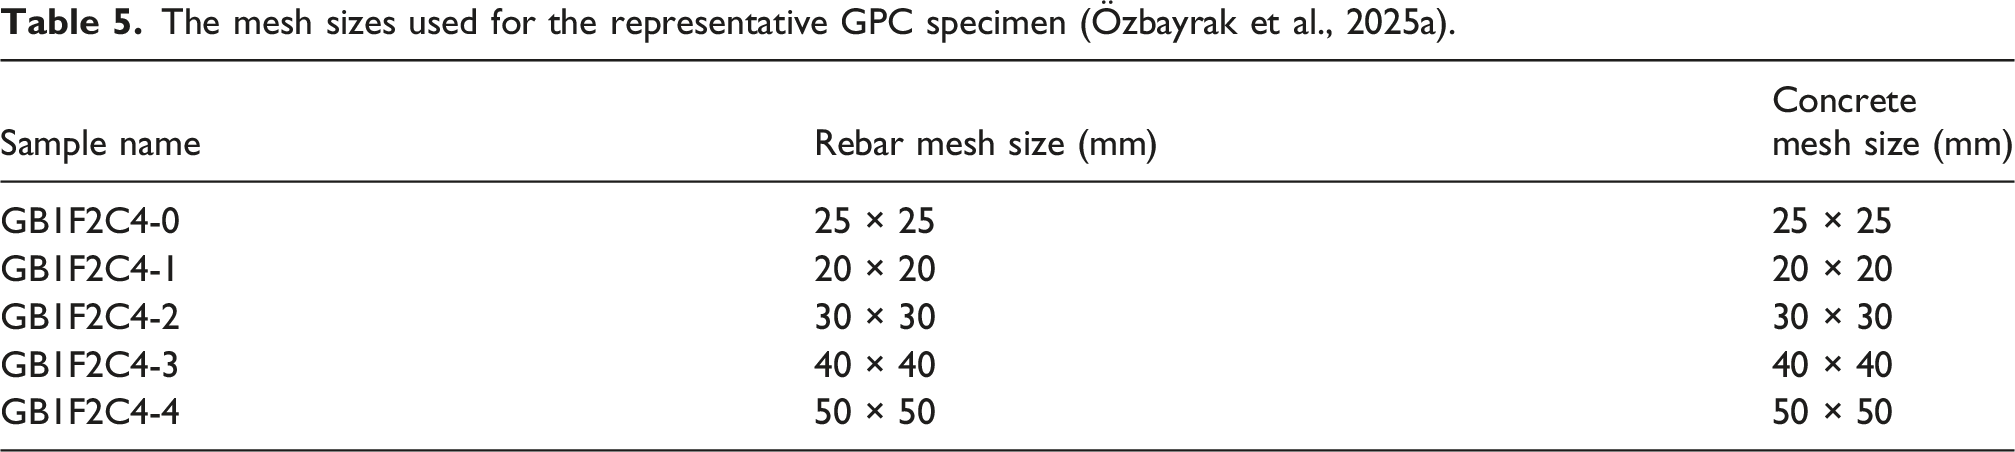
The mesh sizes used for the representative GPC specimen (Özbayrak et al., 2025a).
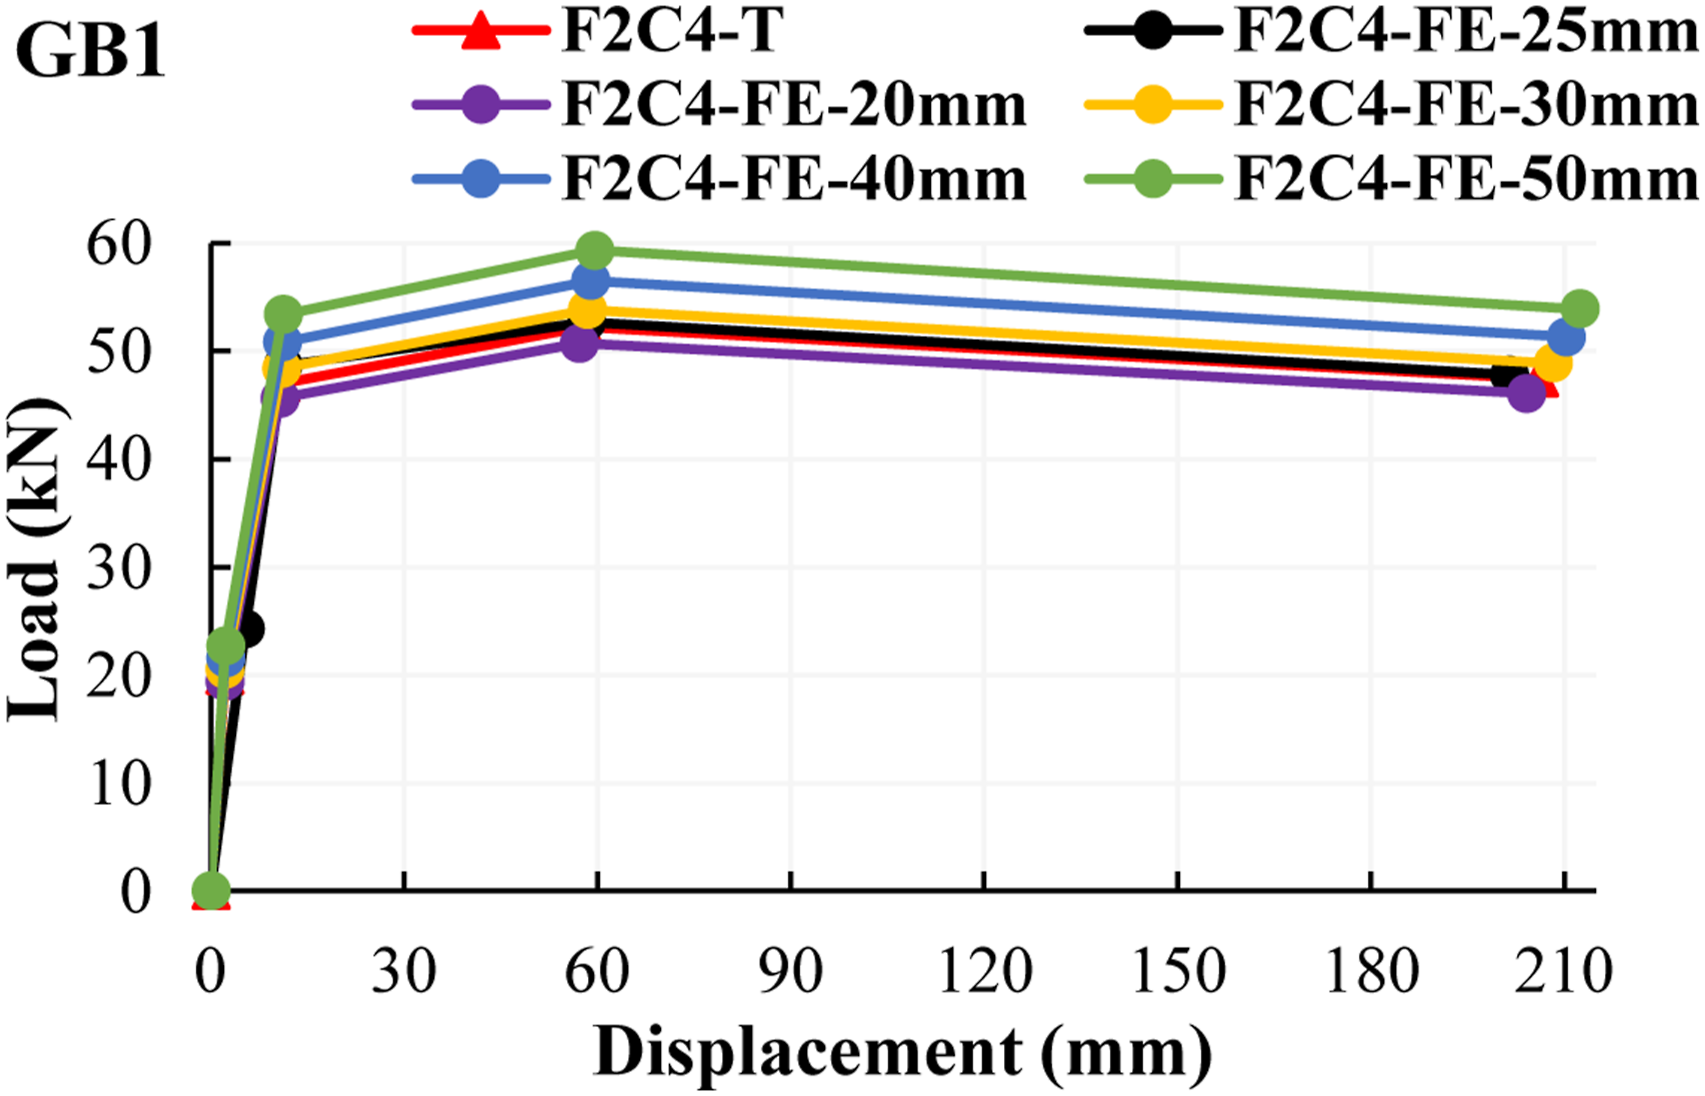
Load–displacement curves of the representative GPC specimen at different mesh sizes (Özbayrak et al., 2025a).
The comparison of numerical and experimental load–displacement responses revealed that finer mesh configurations tend to yield lower predicted load capacities. Among the mesh sizes evaluated, a 25 mm discretization provided the closest alignment with the experimental behavior, particularly for the GB1F2C4 specimen. This mesh size demonstrated optimal accuracy in replicating the structural response observed in physical testing. Based on the mesh sensitivity analysis, a mesh dimension of 25 × 25 mm was selected as the most effective resolution for both the concrete matrix and the reinforcement elements of the specimen (Özbayrak et al., 2025a). This mesh density offered a balanced trade-off between computational cost and fidelity of the results. The same mesh configuration was subsequently employed for all other GPC and OPC beam specimens, as it consistently produced simulation results in strong agreement with the corresponding experimental data. Accordingly, the 25 mm mesh size was adopted as the standard discretization approach throughout the numerical modeling process.
Results and discussion
The results discussed in this section are derived from the GPC and OPC beam models developed and analyzed within the scope of the present study. This section presents both the experimental and numerical findings, including load–displacement behavior, deformation characteristics, and crack patterns. In addition, a detailed discussion is provided to interpret the damage evolution and to compare the structural performance of GPC and OPC beams.
Comparison of the results for GPC and OPC beams
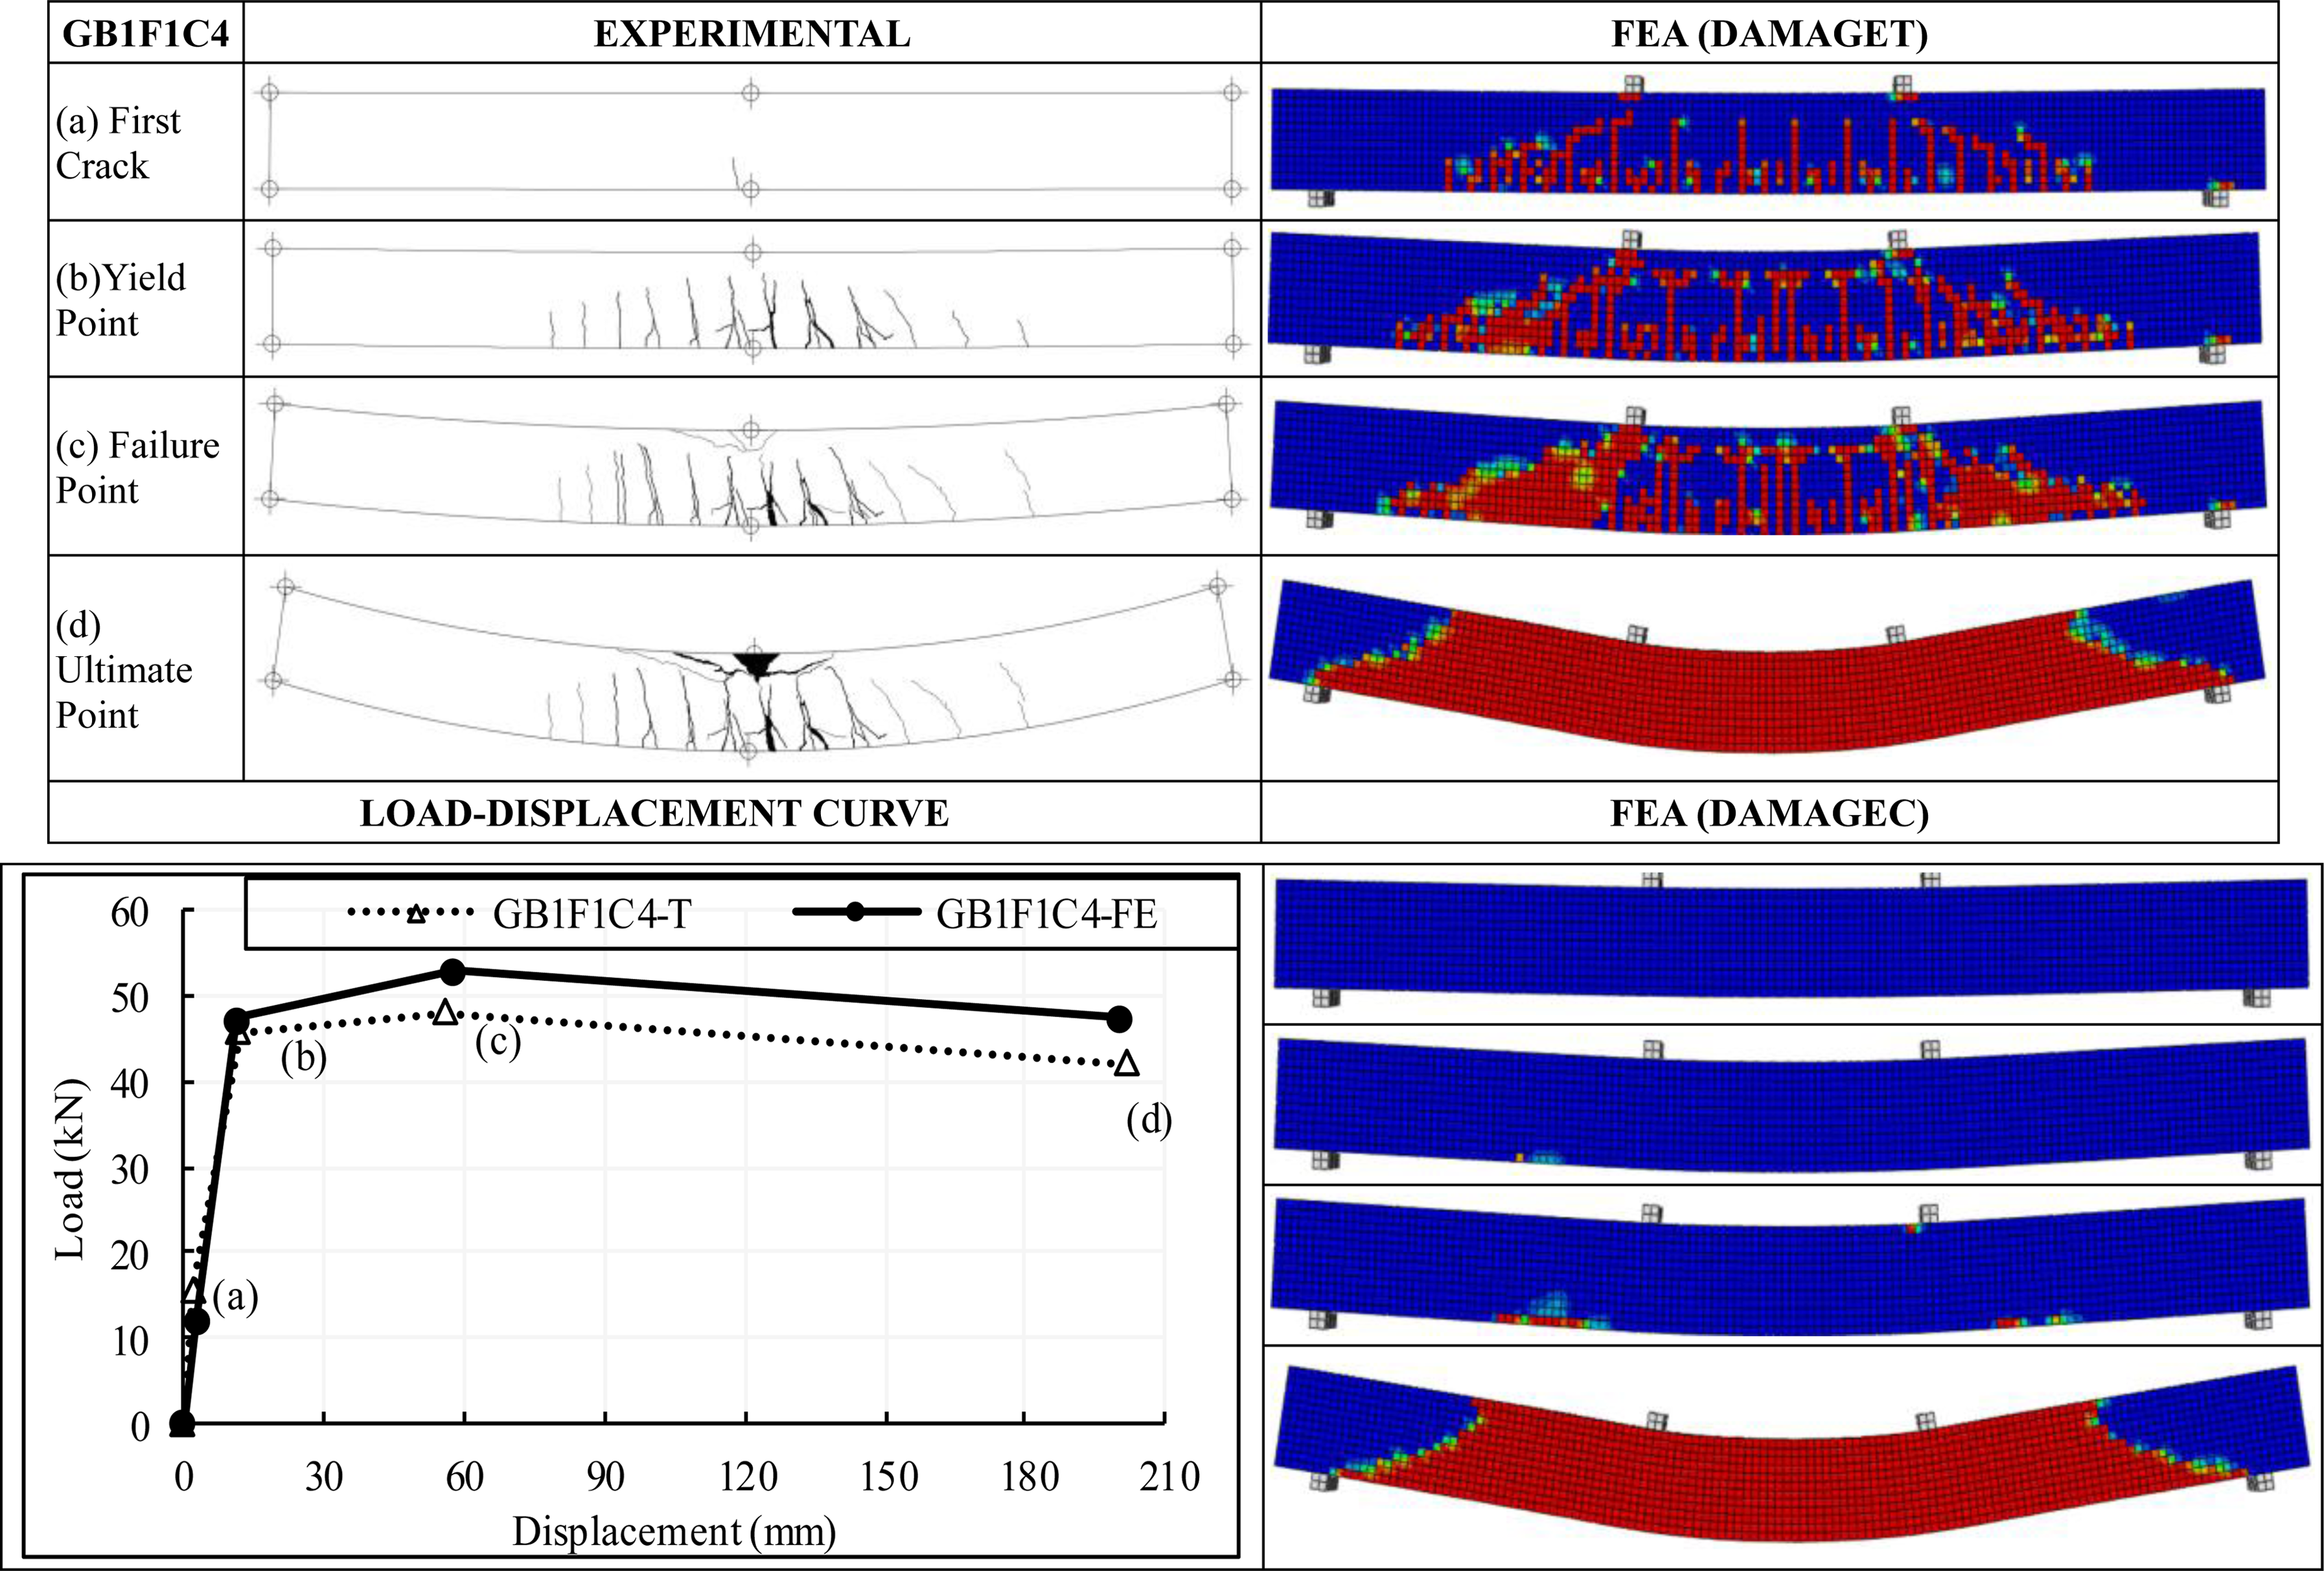
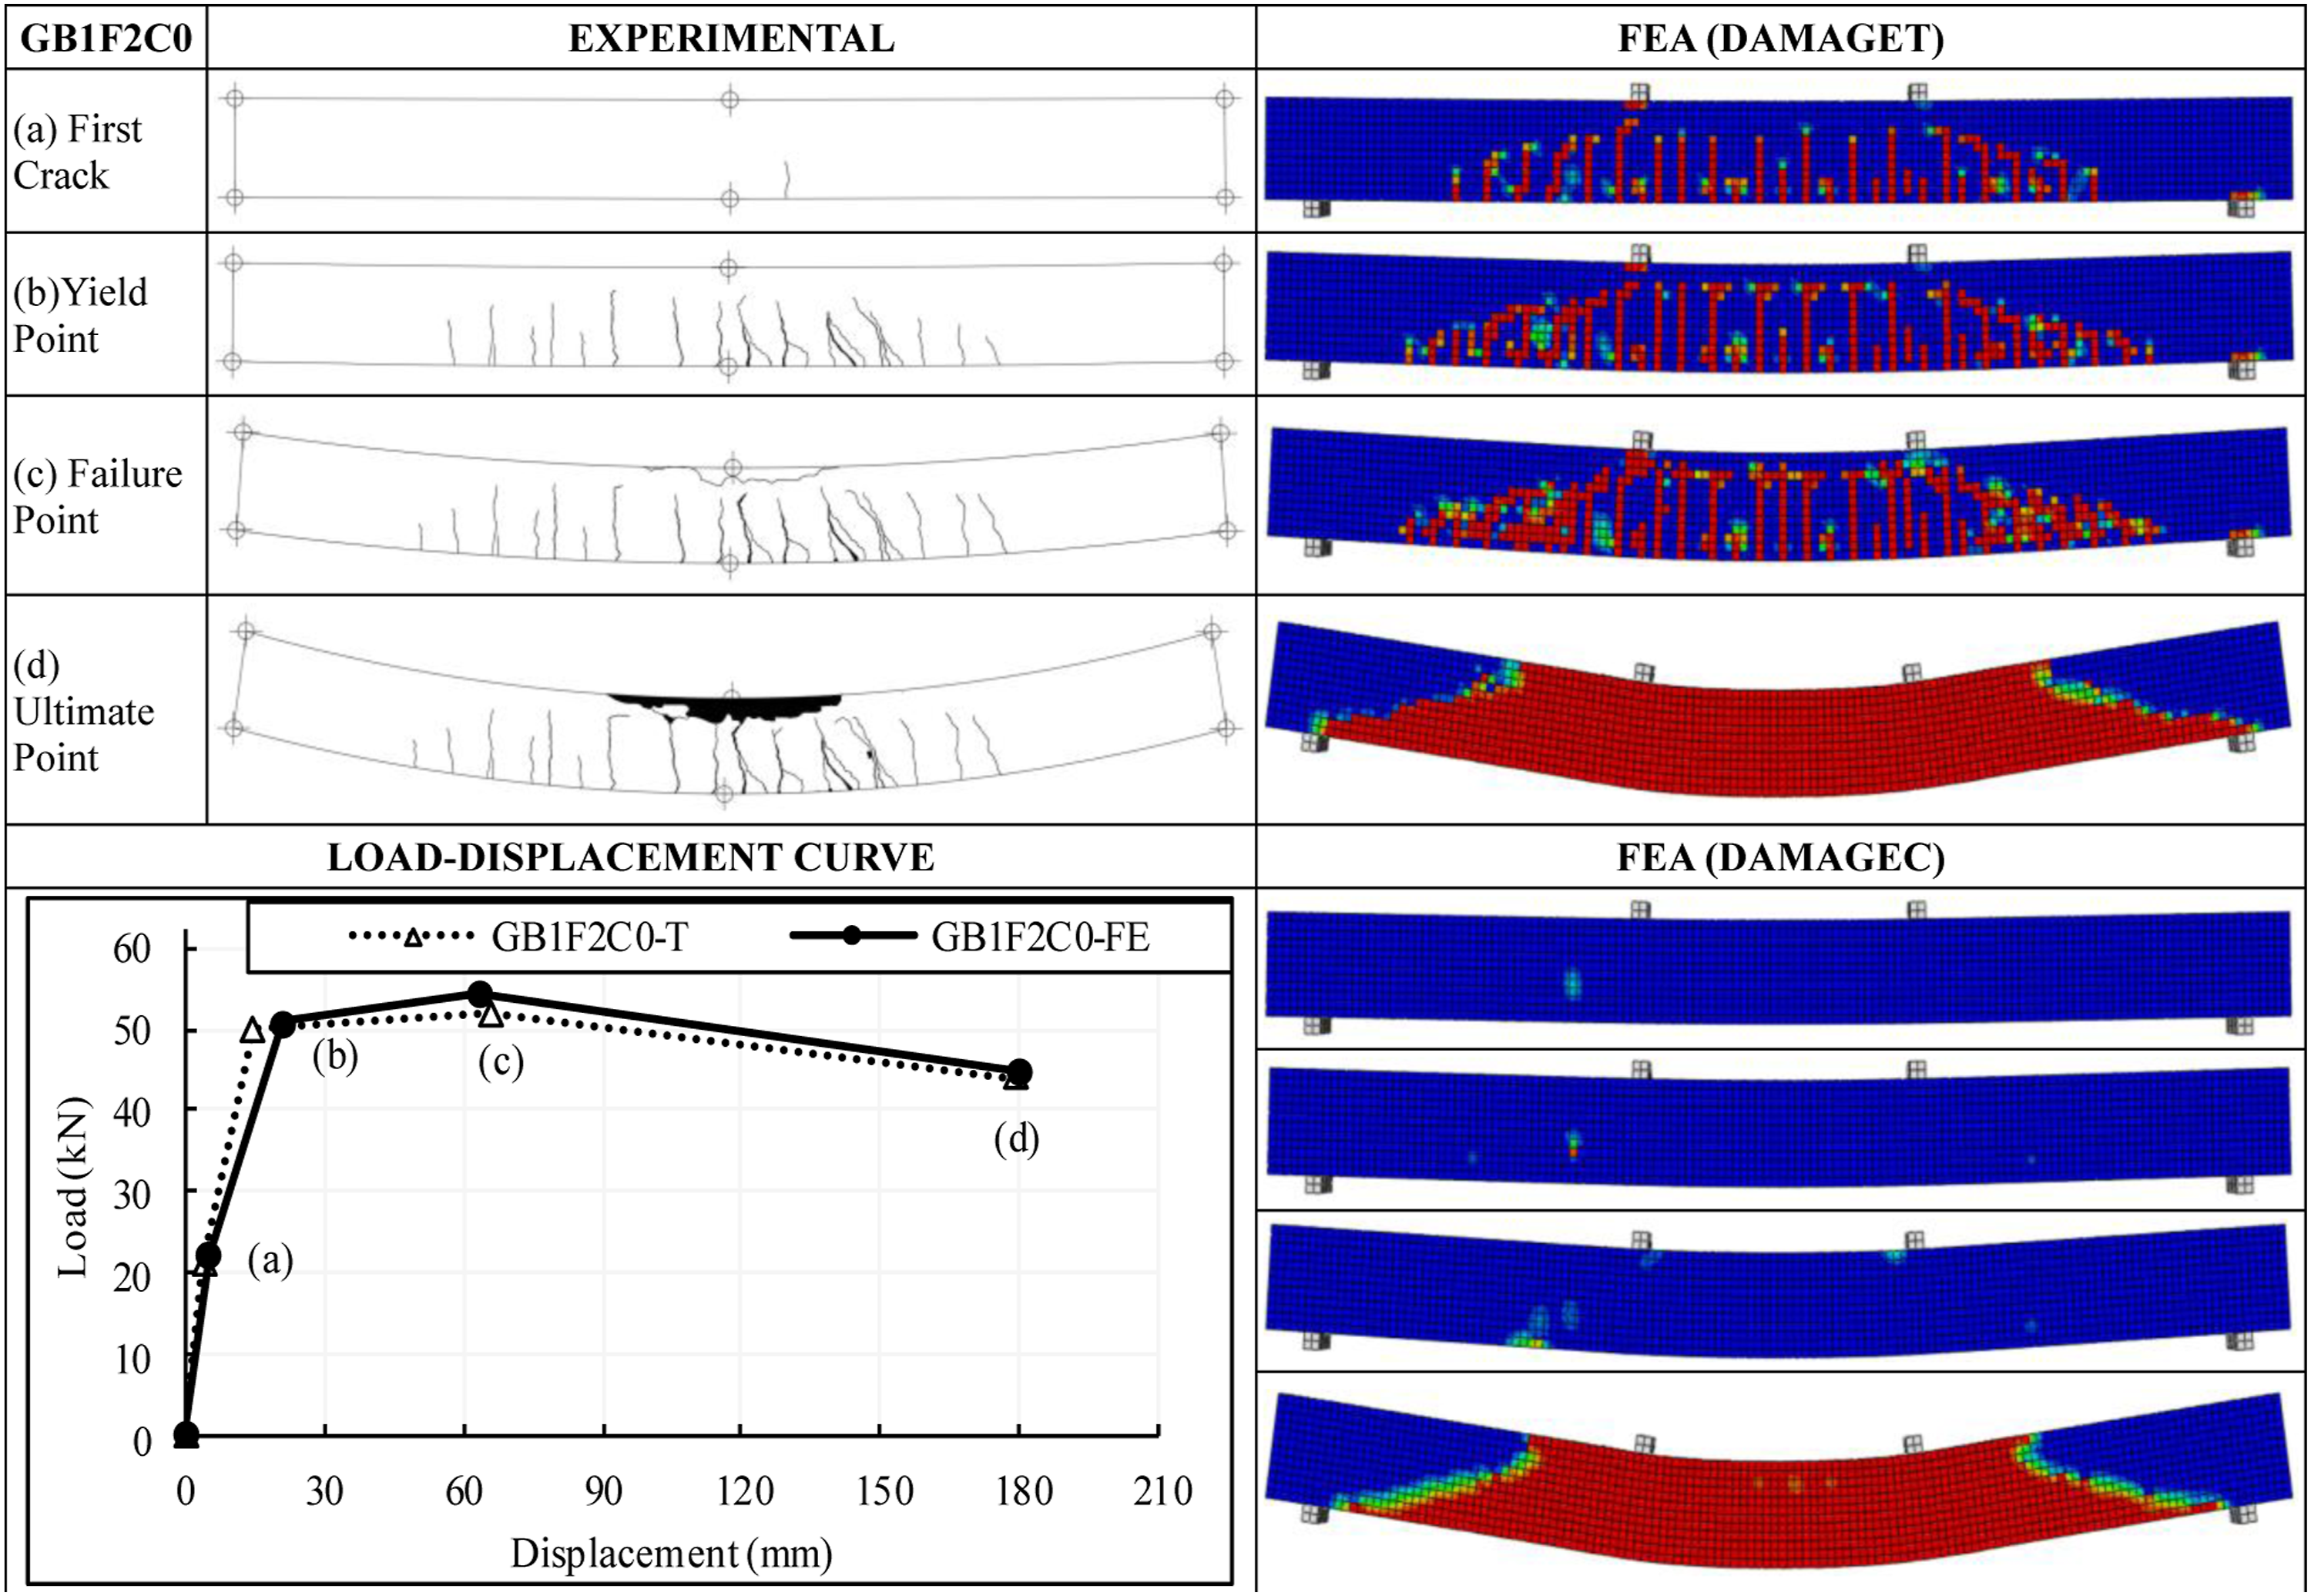
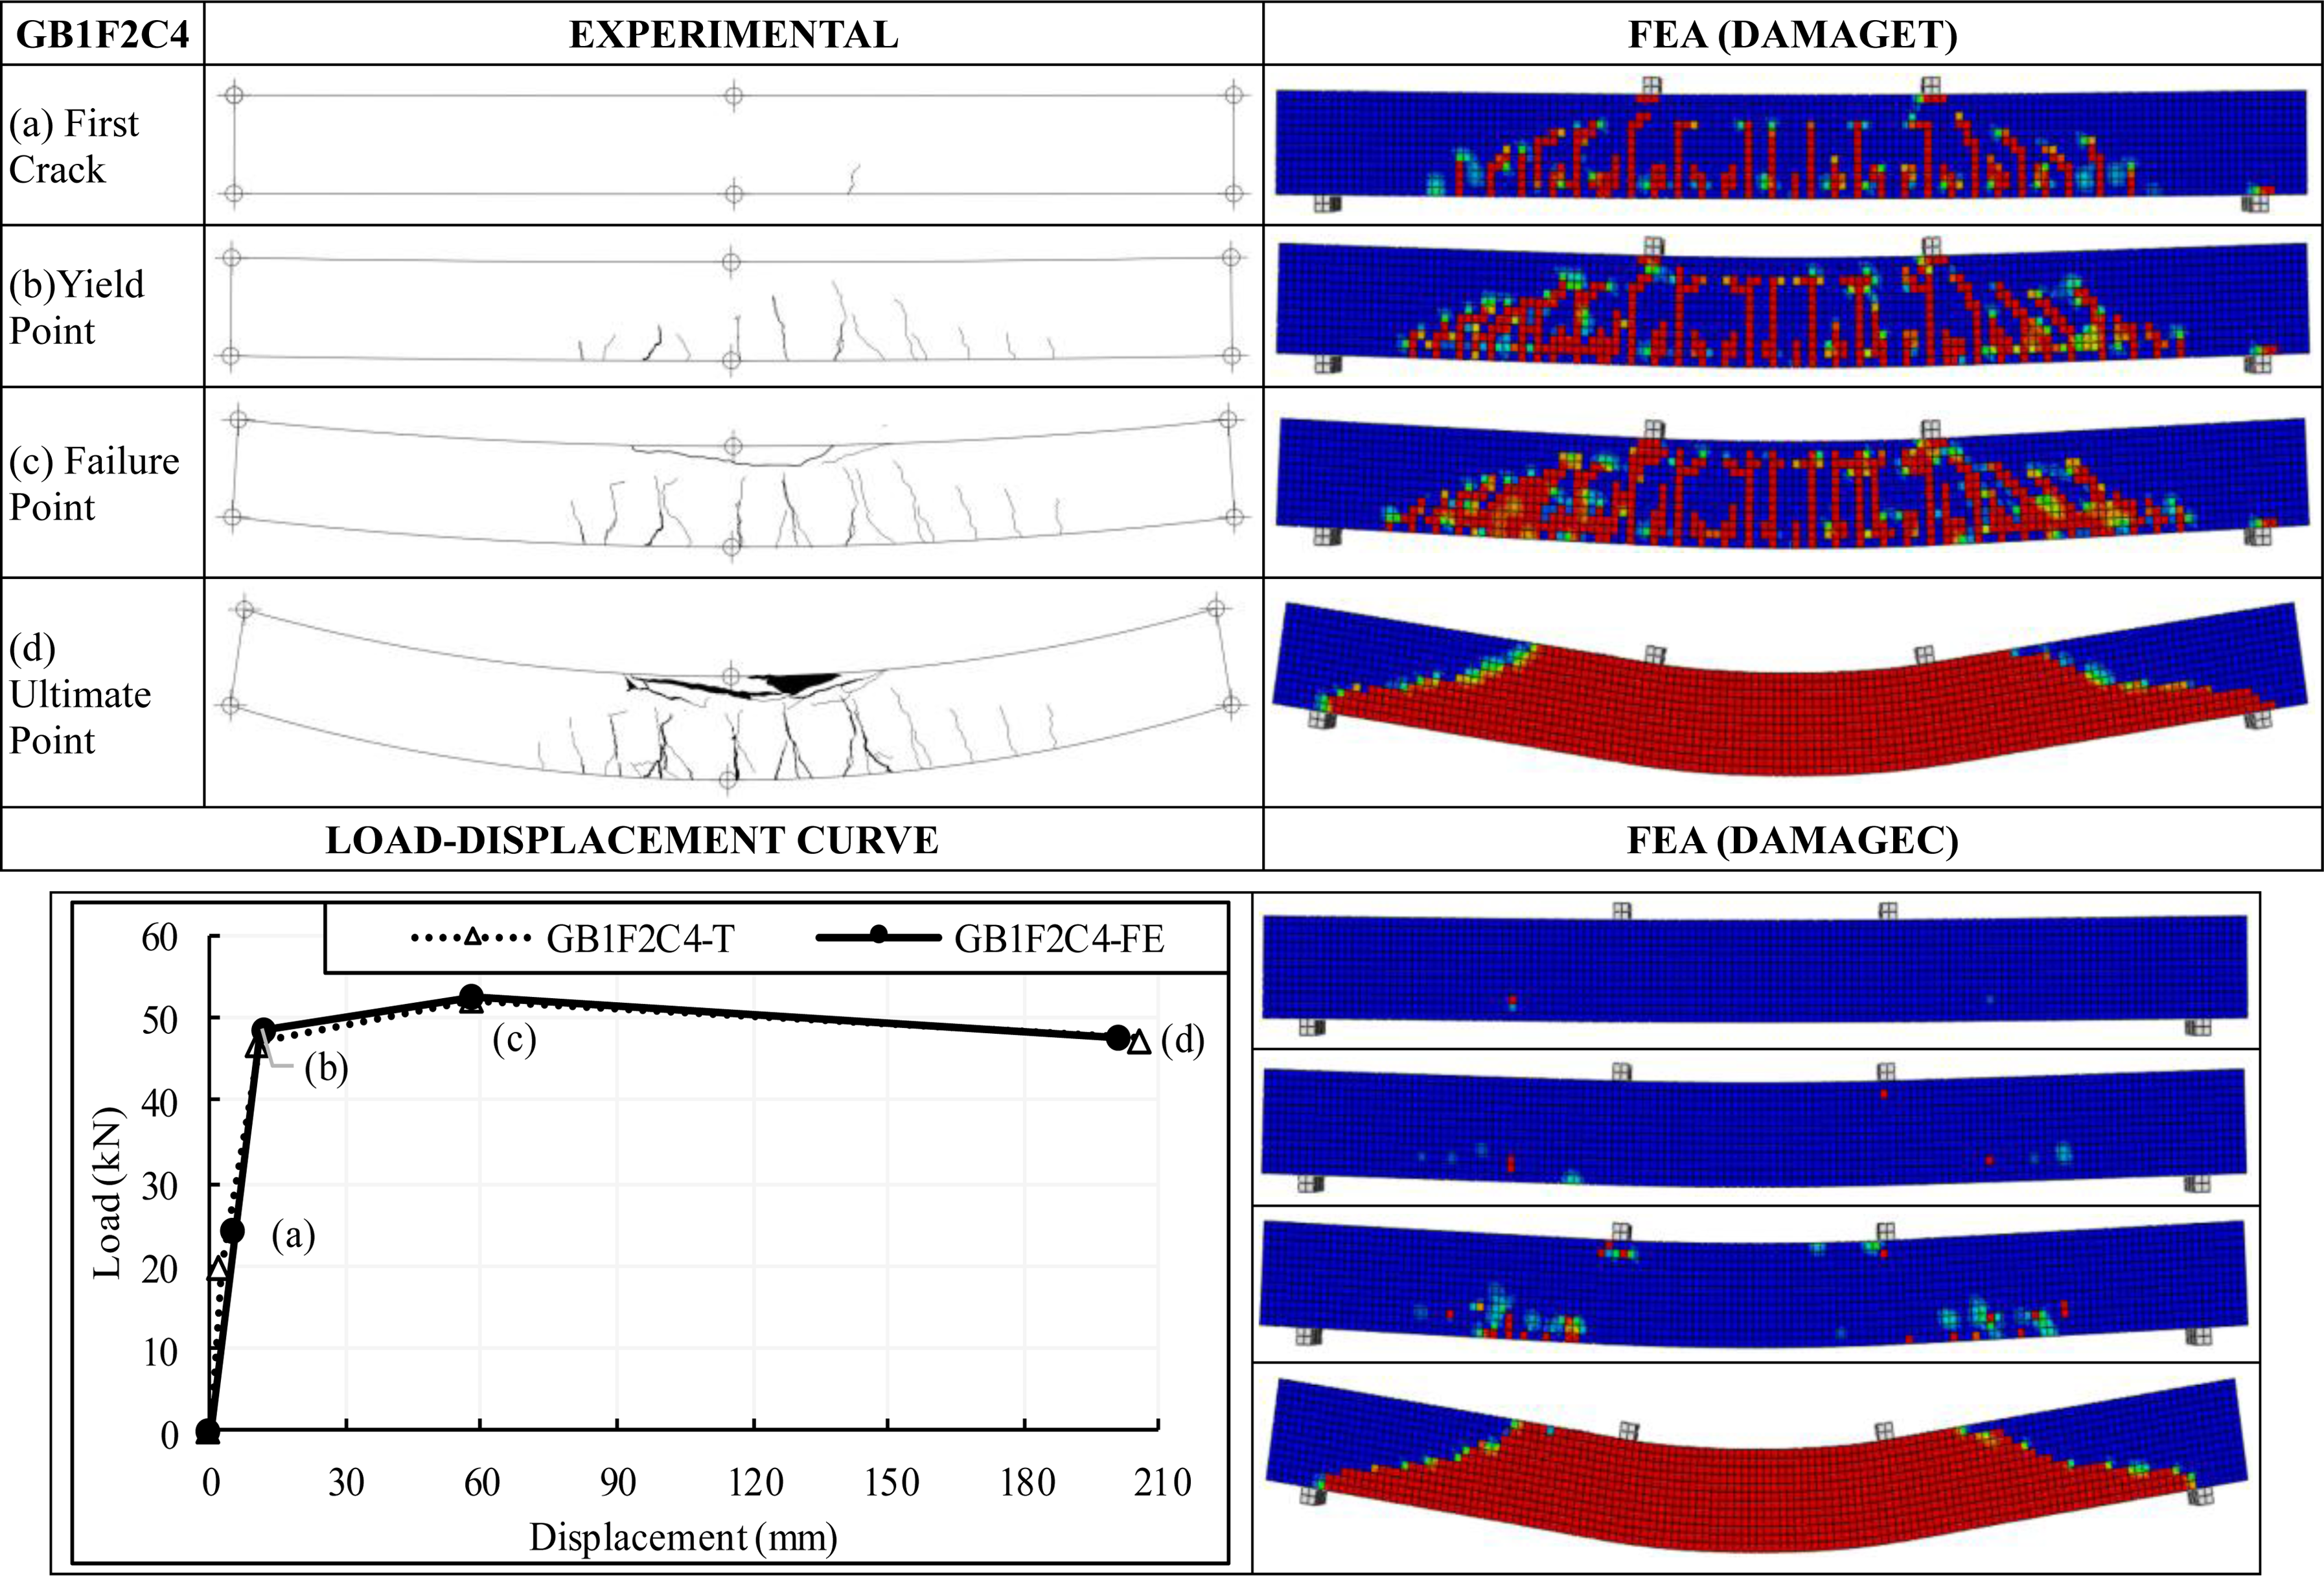
During the experiments, displacement readings were obtained using a total station placed at six points along the reinforced concrete beams. These readings enabled precise determination of displacement geometries at key stages, including the appearance of the first crack, the yield point, the crushing of the compression zone, and the final state. Additionally, damage patterns in the tensile and compression zones were monitored and systematically compared to the numerical model results. The analysis evaluated the similarities and differences in the behavior and crack development of OPC and GPC beams under loading, both experimentally and numerically. Using the finite element method (FEM) analyses, deformations in steel and concrete that were difficult to assess during laboratory experiments were investigated in more detail. This allowed for a strong comparison of how OPC and GPC-reinforced concrete beams behave and the types of damage they exhibit, despite having similar compressive strength. The load–displacement behavior, together with the compression and tensile damage responses for the GB1 beam and the corresponding OPC series, is illustrated in Figures 15–19, enabling a detailed comparison between experimental results and FEM predictions. Comparison of GB1F1C0 experimental and finite element analysis results. Comparison of GB1F1C4 experimental and finite element analysis results. Comparison of GB1F2C0 experimental and finite element analysis results. Comparison of GB1F2C4 experimental and finite element analysis results. Comparison of OPCB1 experimental and finite element analysis results.

% differences in reinforced concrete beams with longitudinal tensile reinforcement 2Ø12 (GB1).
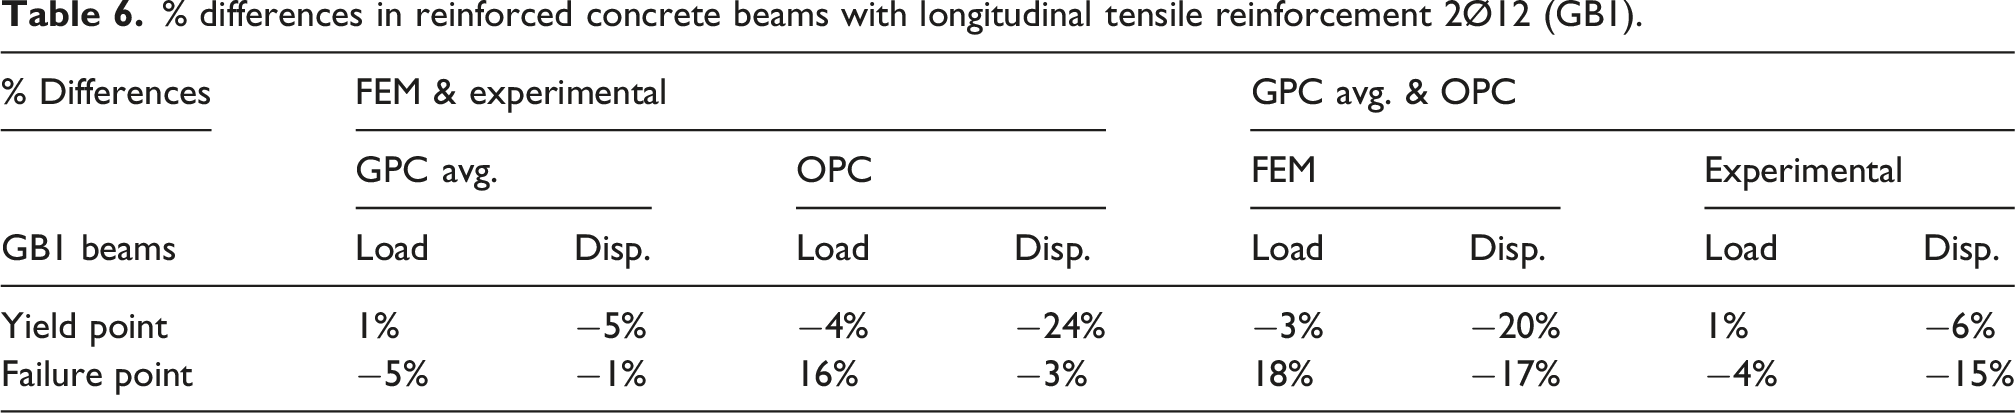
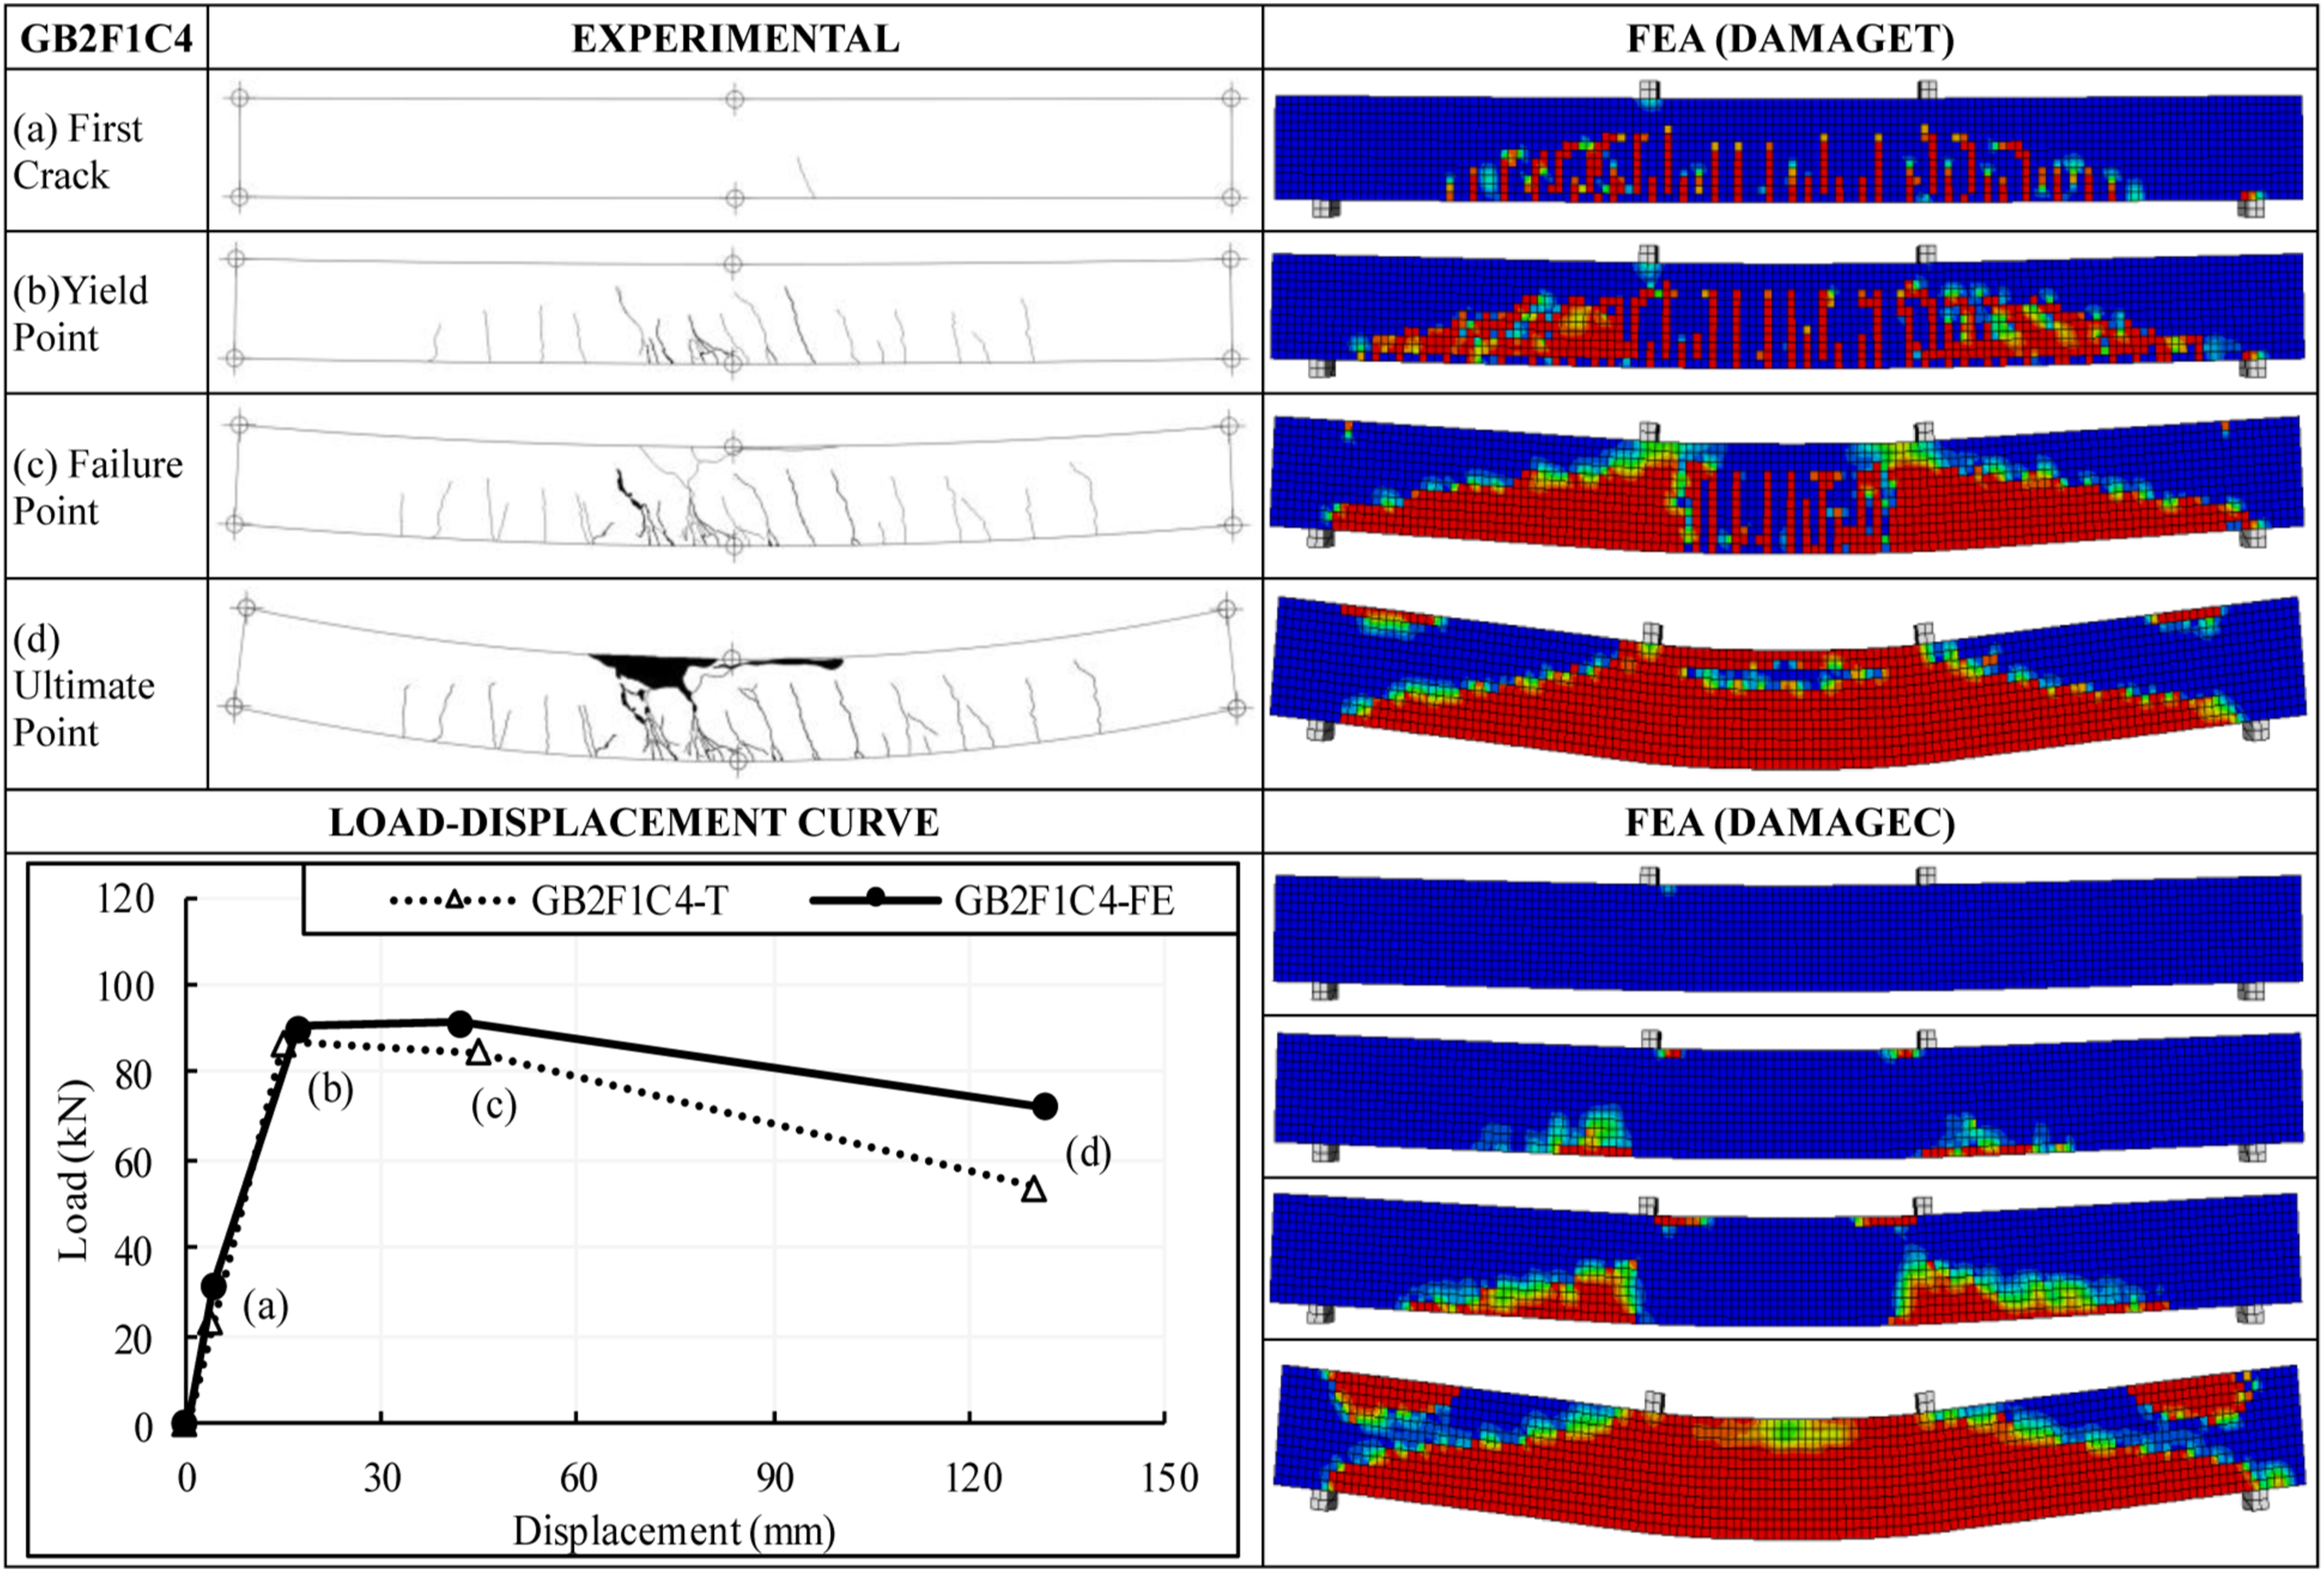
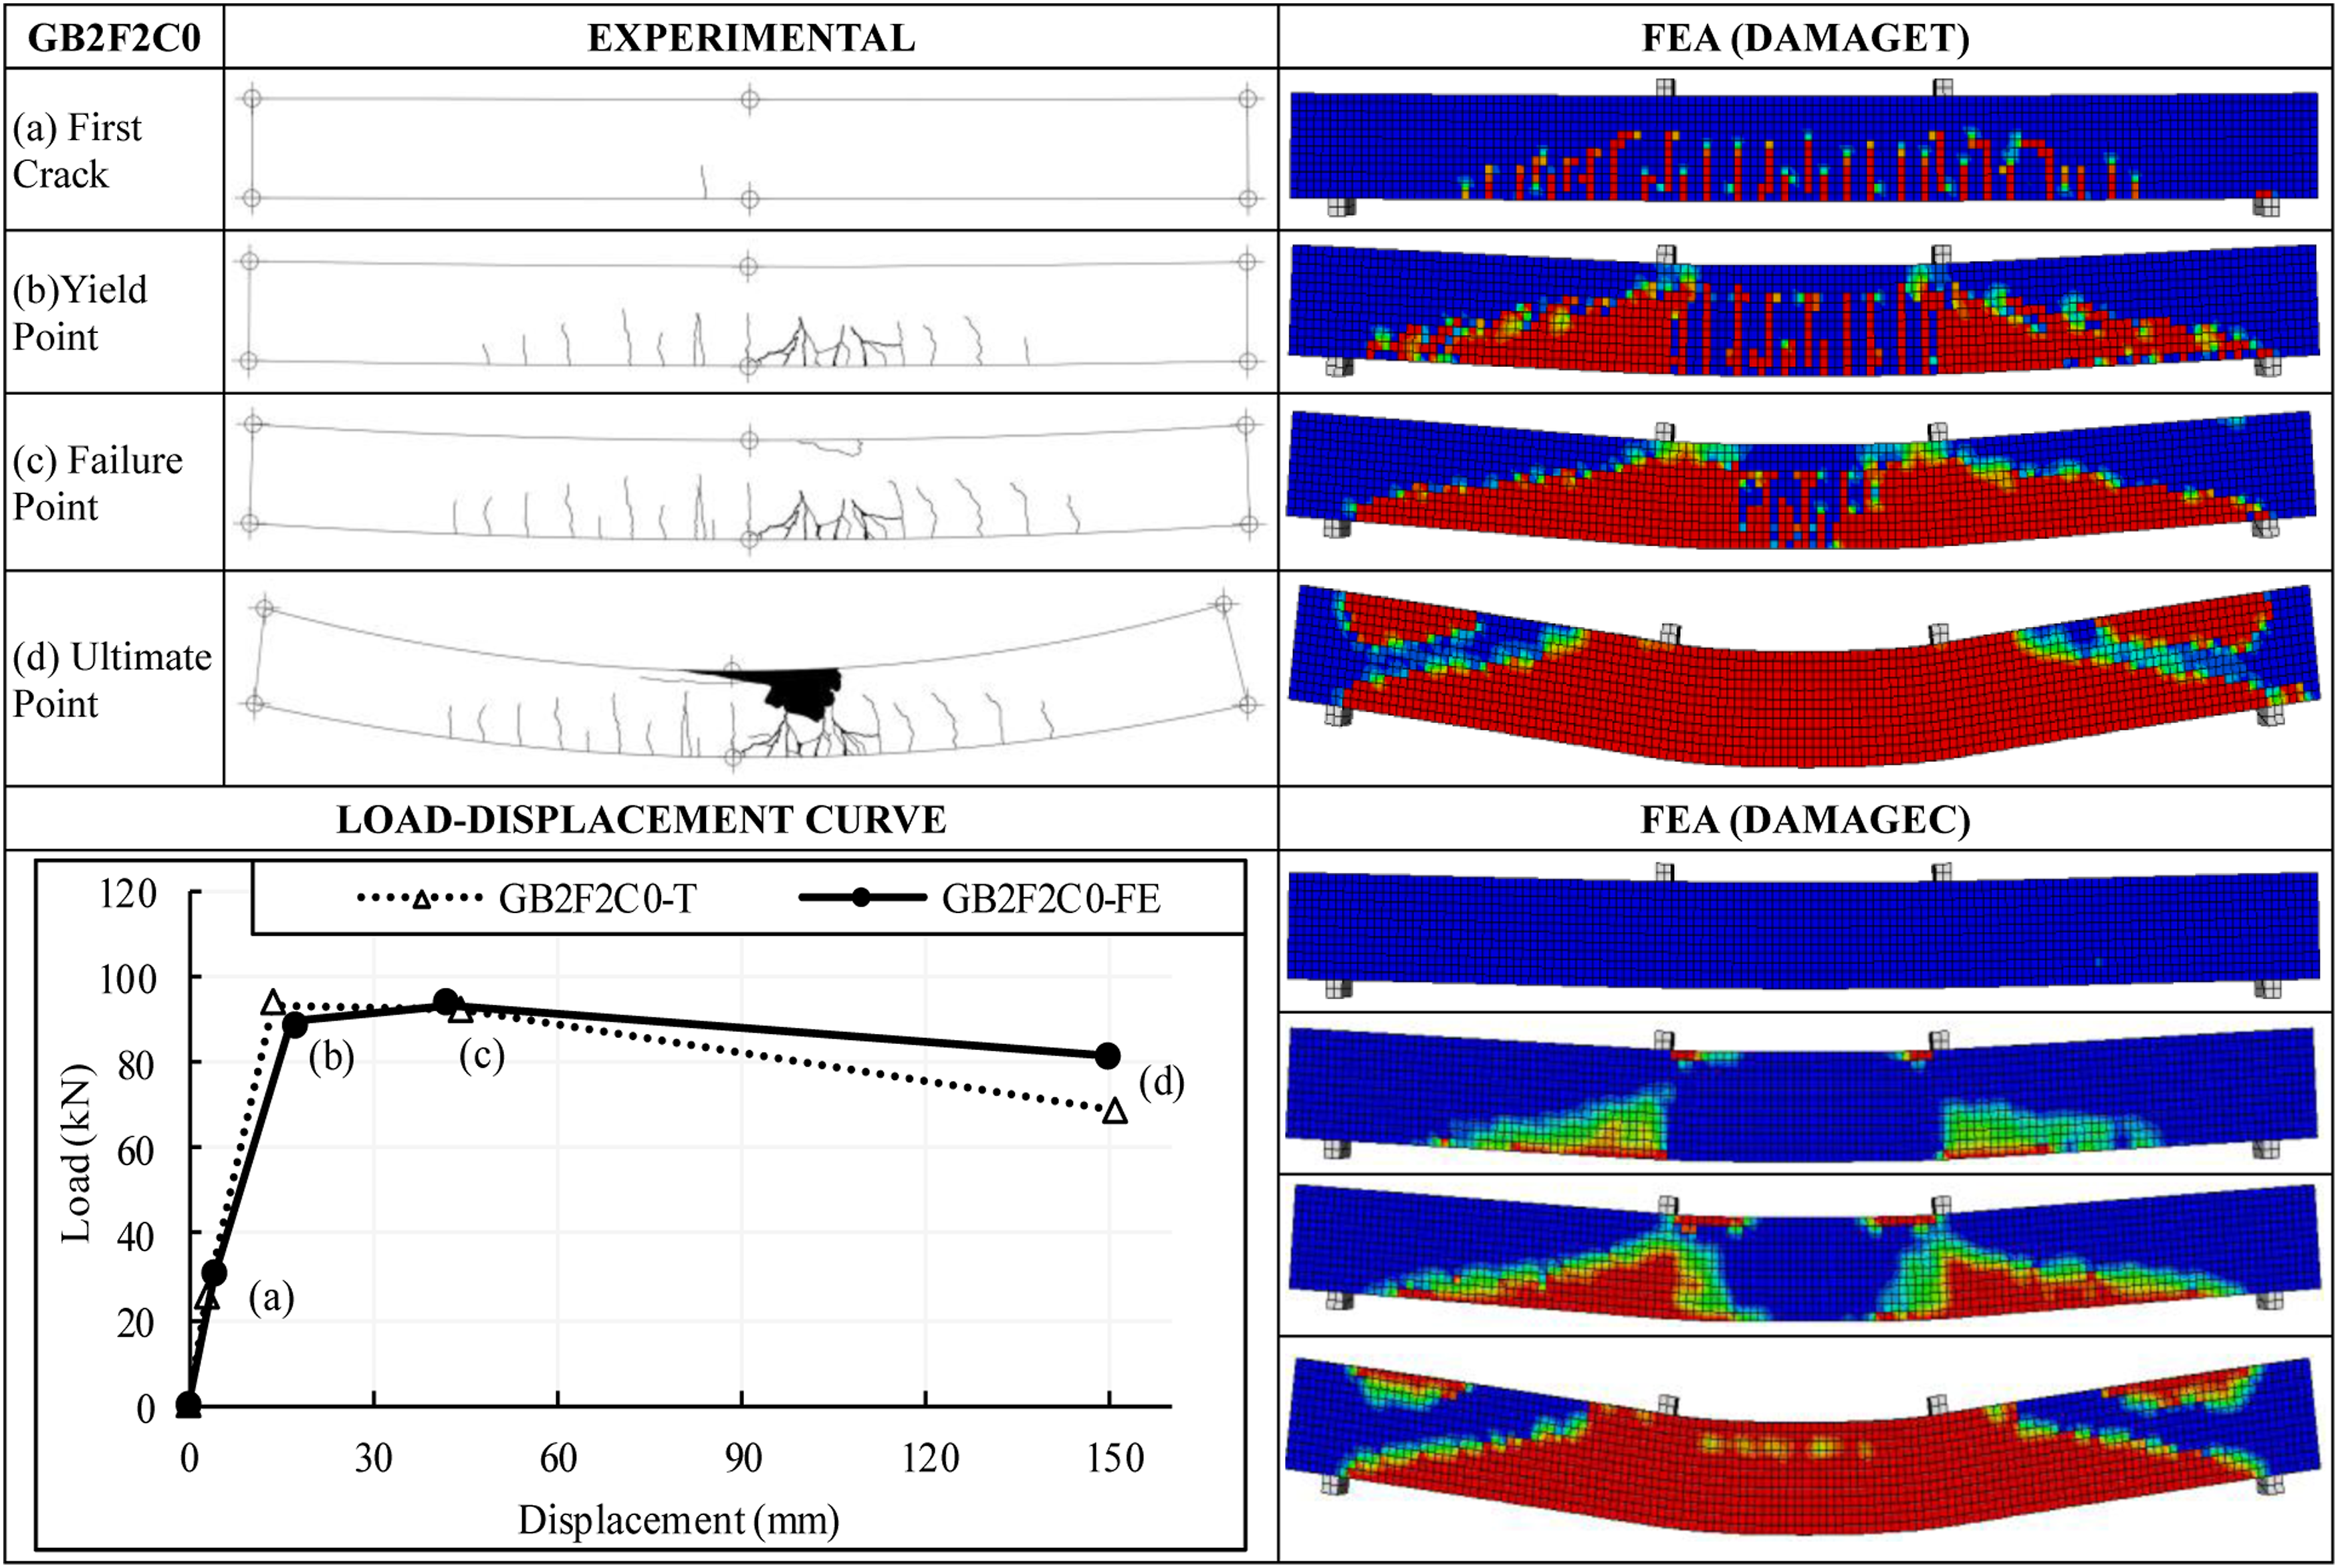
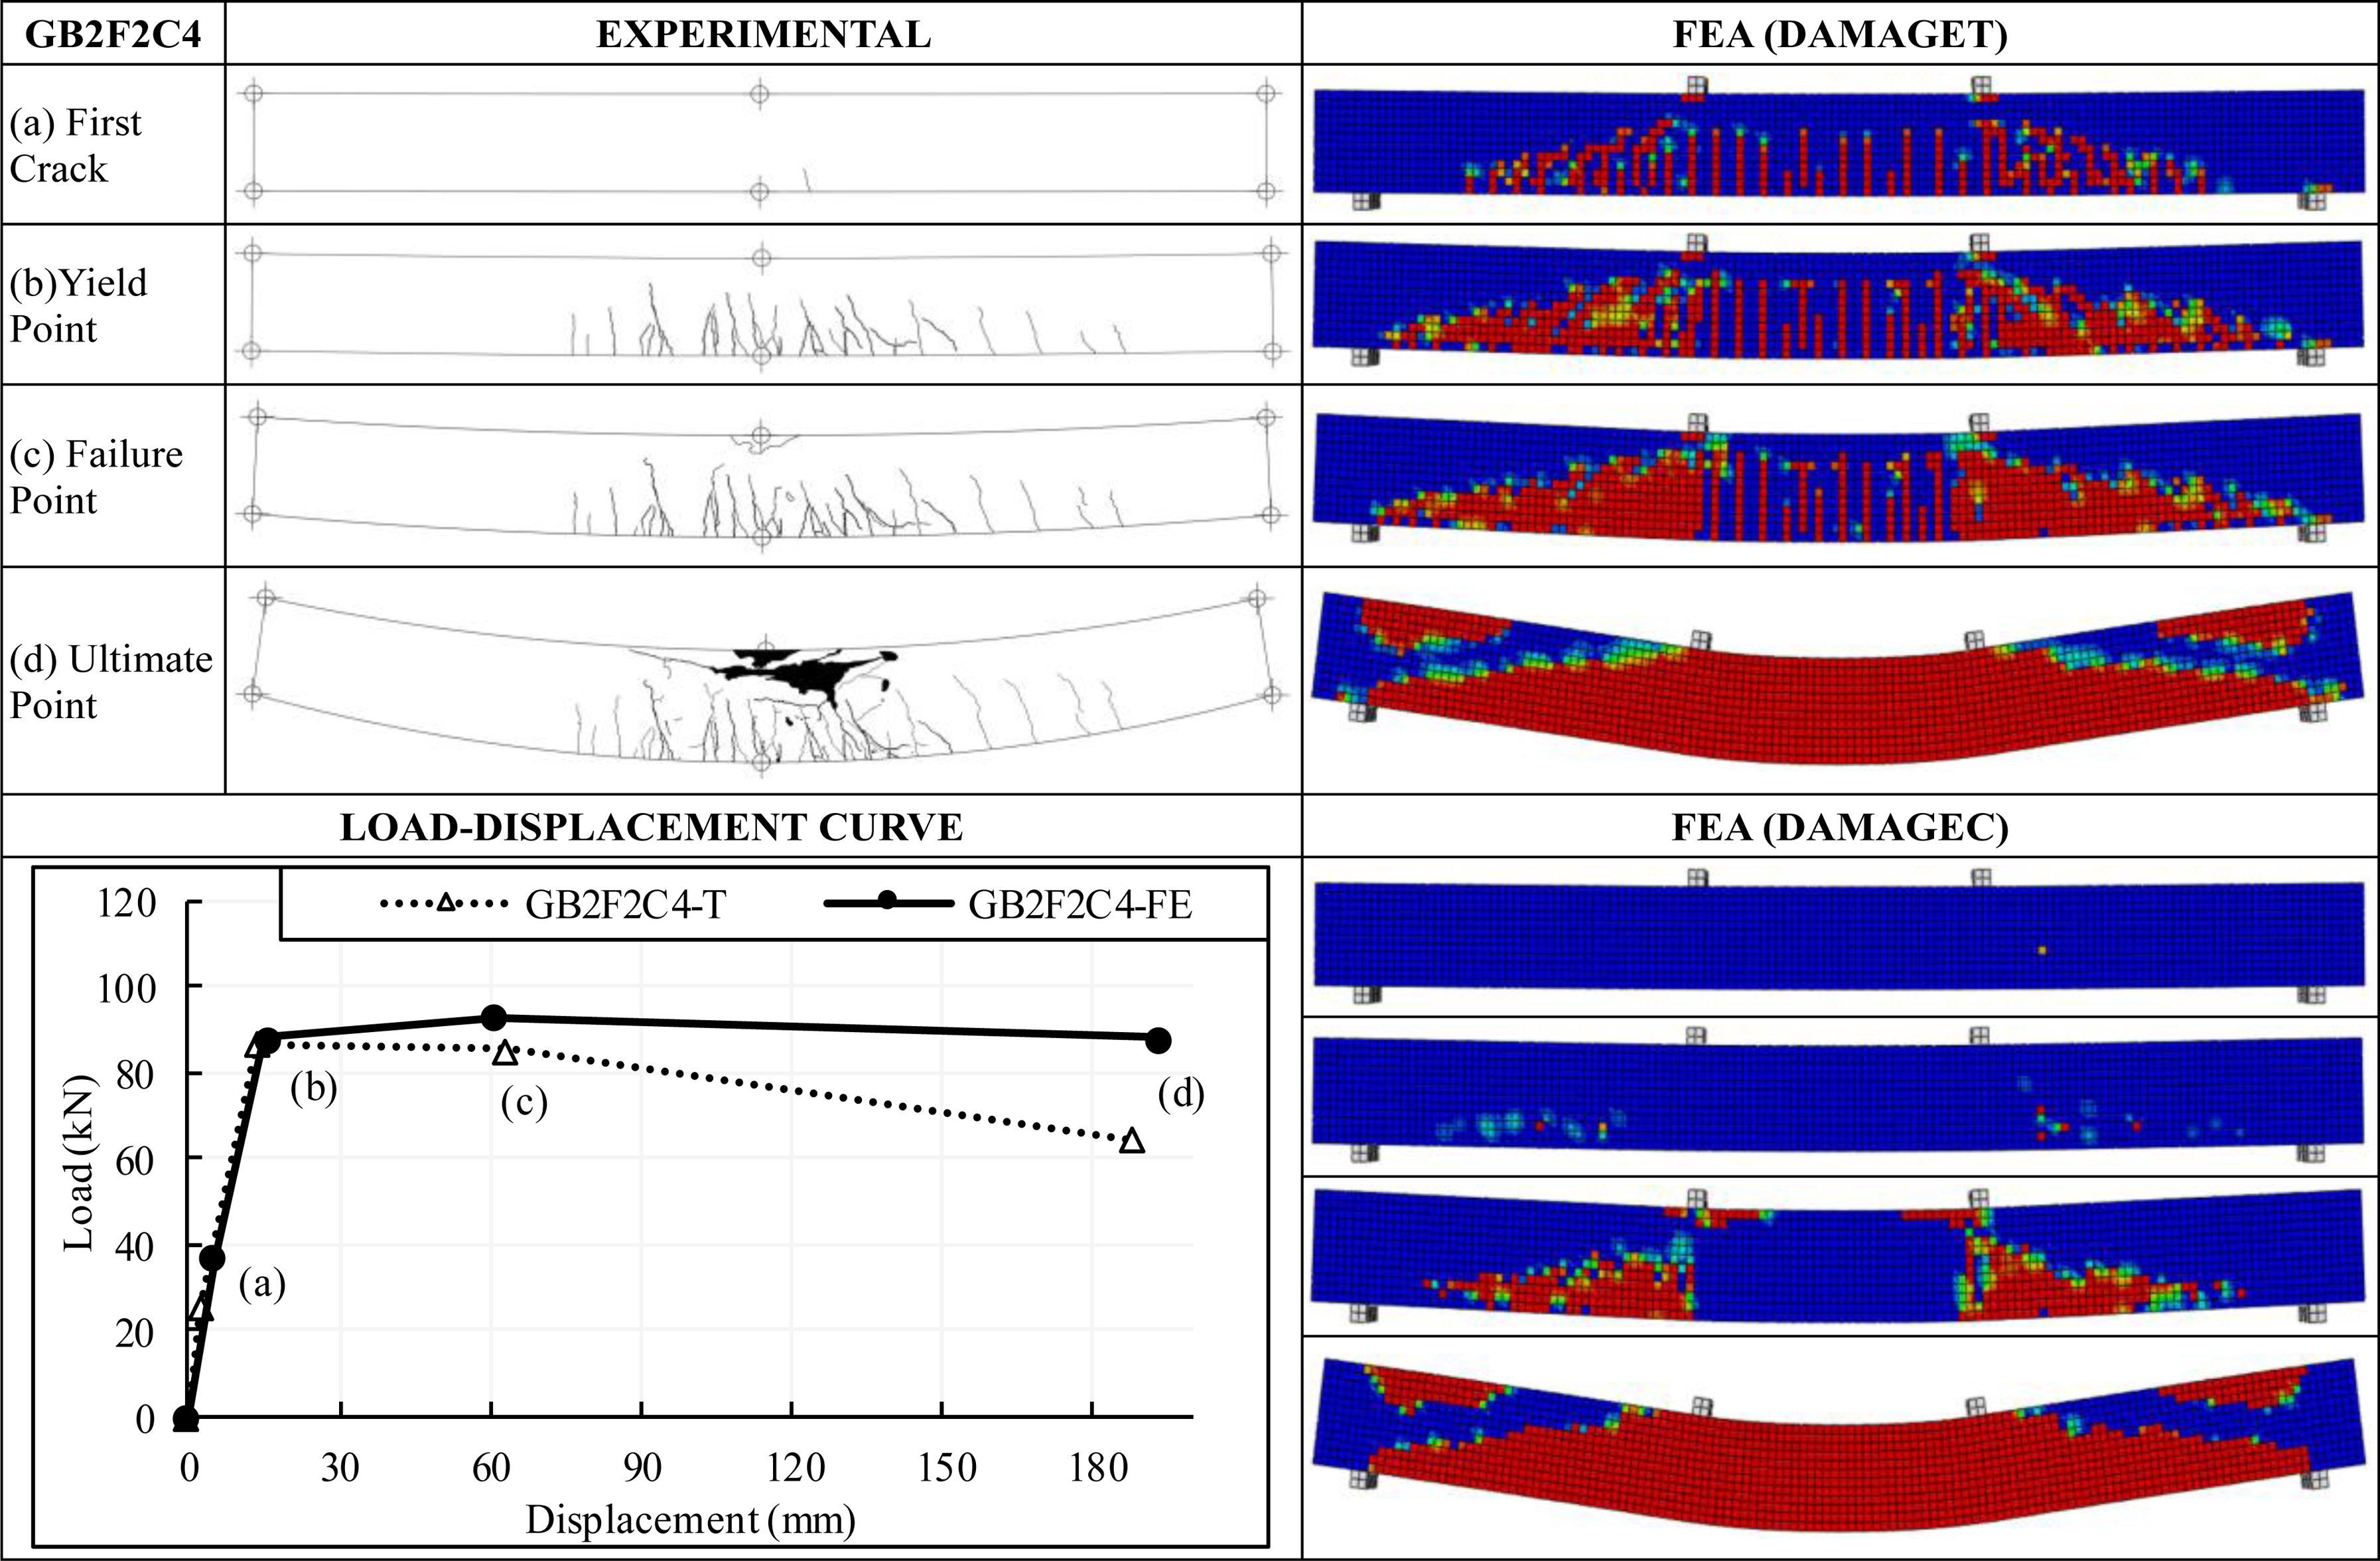
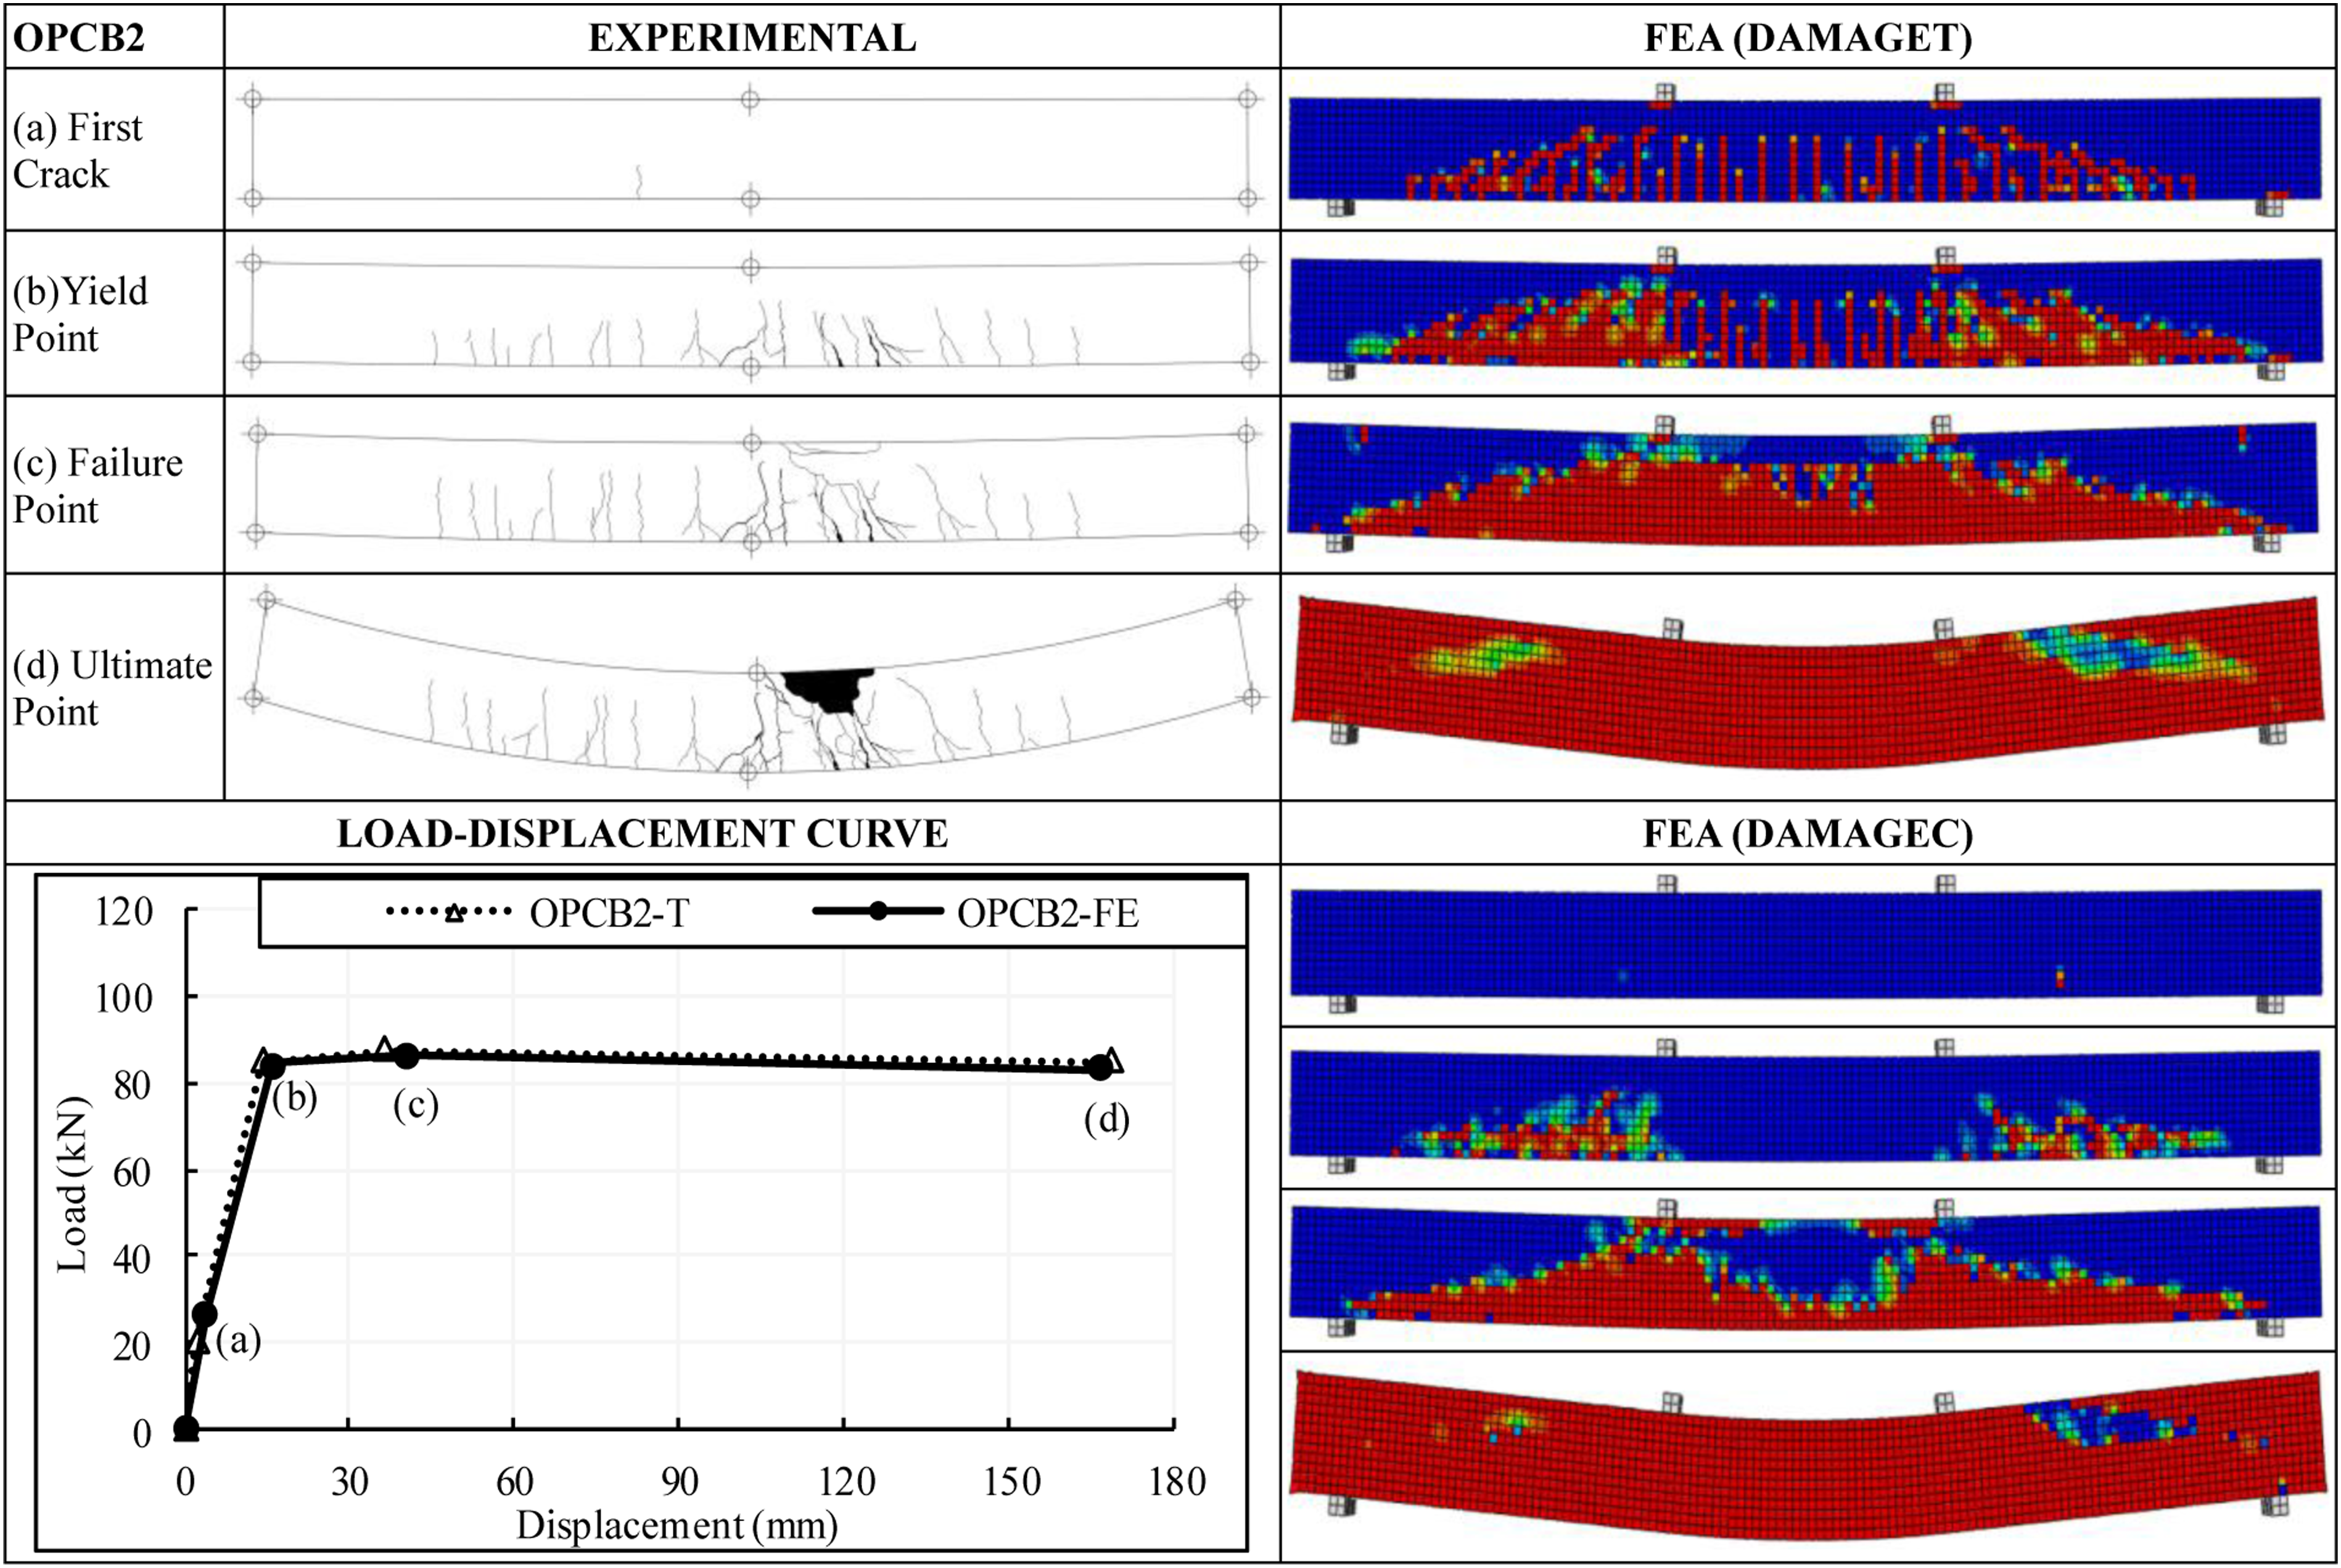
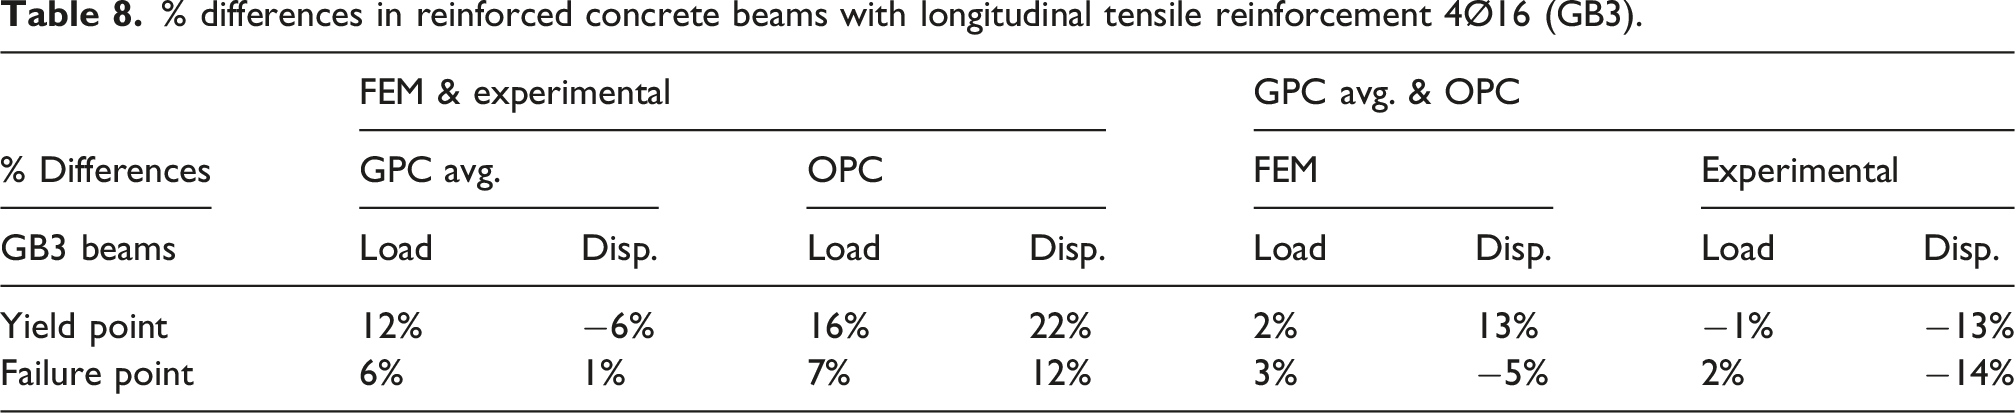
The experimental and FEM analysis results for GPC beams with 2Ø12 tensile reinforcement were found to be compatible. However, a notable observation is that while the load values of OPC beams matched those of GPC at the yield point, geopolymer beams exhibited less deflection than traditional reinforced concrete beams at both the yield and failure points. This indicates that OPC beams outperform GPC beams in terms of energy dissipation at a minimum reinforcement ratio. During crack monitoring and analysis, the maximum crack width in all beams was measured as 0.5 mm at the yield point and 5 mm at the failure point. These results suggest that the maximum crack widths of GPC and OPC-reinforced concrete beams at both the yield and failure points in the plastic phase are equivalent. Overall, the crack development and patterns in GPC beams were similar to those of OPC beams, consistent with findings in the literature (Chaudhari et al., 2017; Ranjbar et al., 2016; Sumajouw and Rangan, 2006; Tran et al., 2019; Yost et al., 2013). However, cracks in GPC beams propagated more frequently and were thinner, whereas OPC beams exhibited fewer, wider cracks. FEM analysis also revealed that the compressive and tensile damage at the failure point differed between OPC and GPC beams due to the higher number of wide cracks observed in OPC beams. Another contributing factor to these differences is the higher splitting tensile strength of GPC compared to OPC, as determined in prior cylindrical tests (Özbayrak et al., 2023a). Additionally, the elastic modulus of GPC under compression was lower than that of OPC in these studies (Ganesan et al., 2014; Nguyen et al., 2016; Noushini et al., 2016; Olivia and Nikraz, 2012; Pan et al., 2011). The low tensile reinforcement ratio highlights the influence of concrete tensile strength on deflection. Consequently, OPC-reinforced concrete beams exhibited more significant deflection and severe damage in the compression zone. In contrast, the higher tensile strength of GPC reduced deflection in these beams. However, the low elastic modulus of GPC, combined with a flexural strength comparable to OPC, increased the deformation demand required for damage to occur in the compression zone. As a result, no visible damage was observed in the compression zone of GPC beams that deflected less in FEM analyses. Conversely, the damage distribution in OPC beams was more pronounced at the failure point. Load-displacement graphs, compression and tensile damage behavior graphs for GB2 and the related OPCB2 series are shown in Figures 20–24. Comparison of GB2F1C0 experimental and finite element analysis results. Comparison of GB2F1C4 experimental and finite element analysis results. Comparison of GB2F2C0 experimental and finite element analysis results. Comparison of GB2F2C4 experimental and finite element analysis results. Comparison of OPCB2 experimental and finite element analysis results.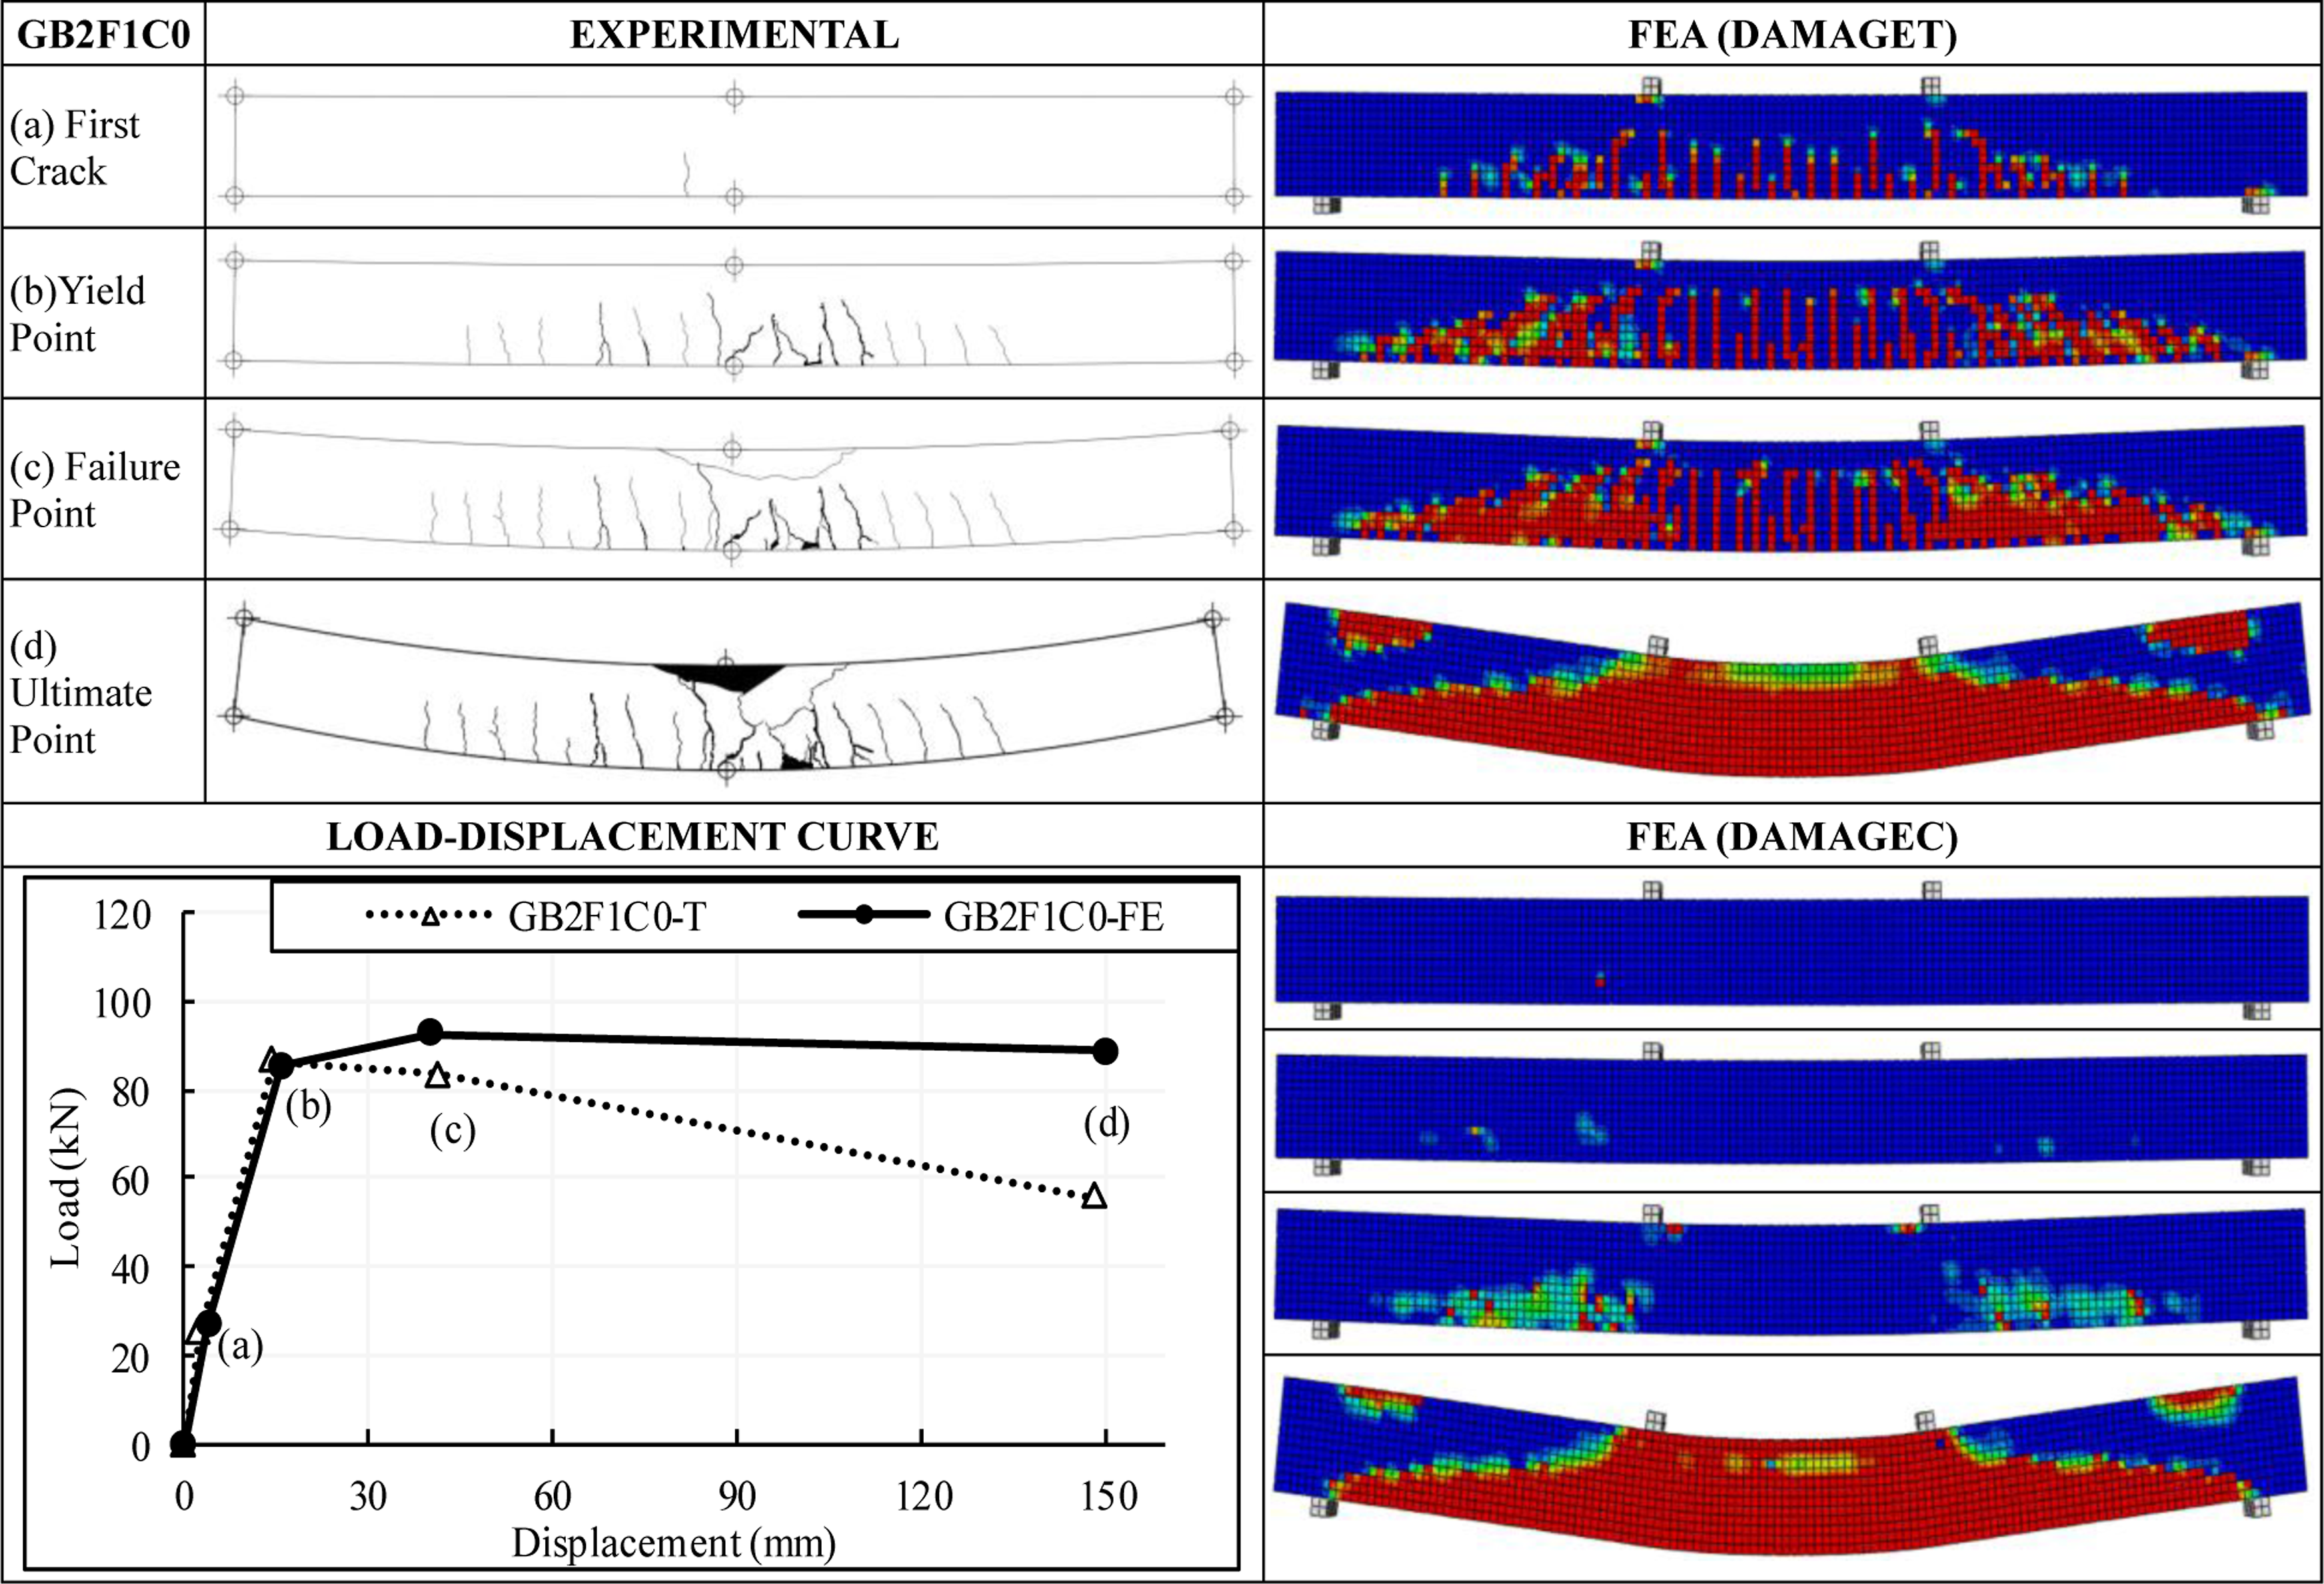
% differences in reinforced concrete beams with longitudinal tensile reinforcement 3Ø14 (GB2).
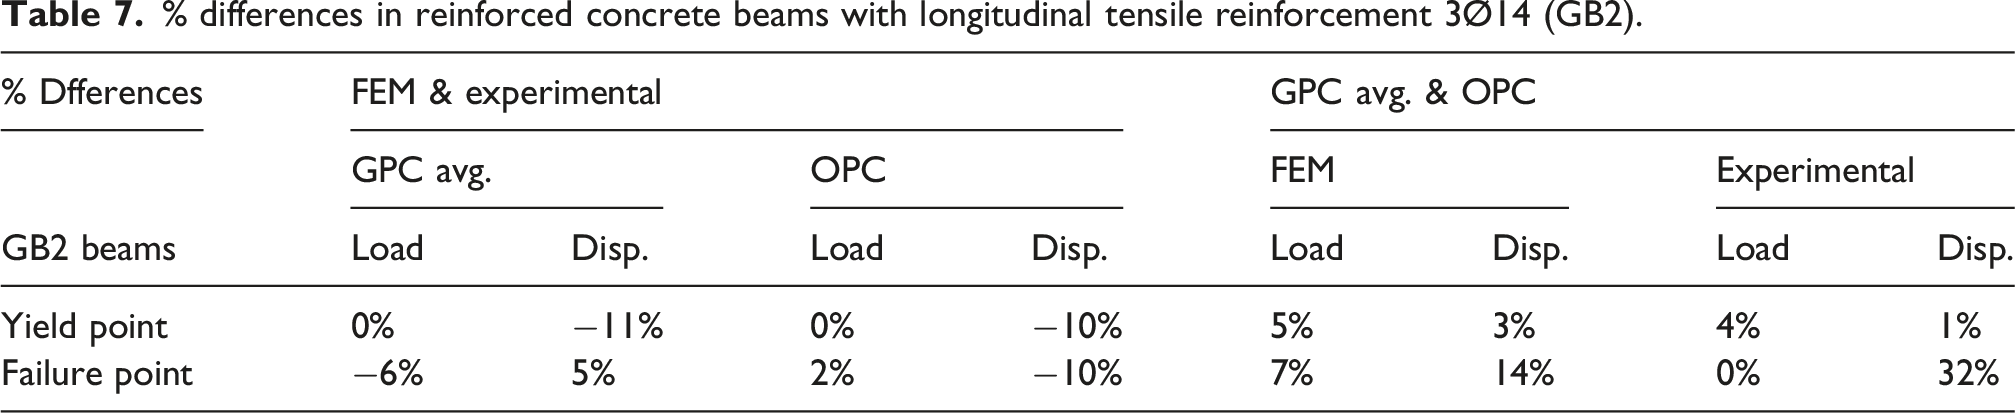
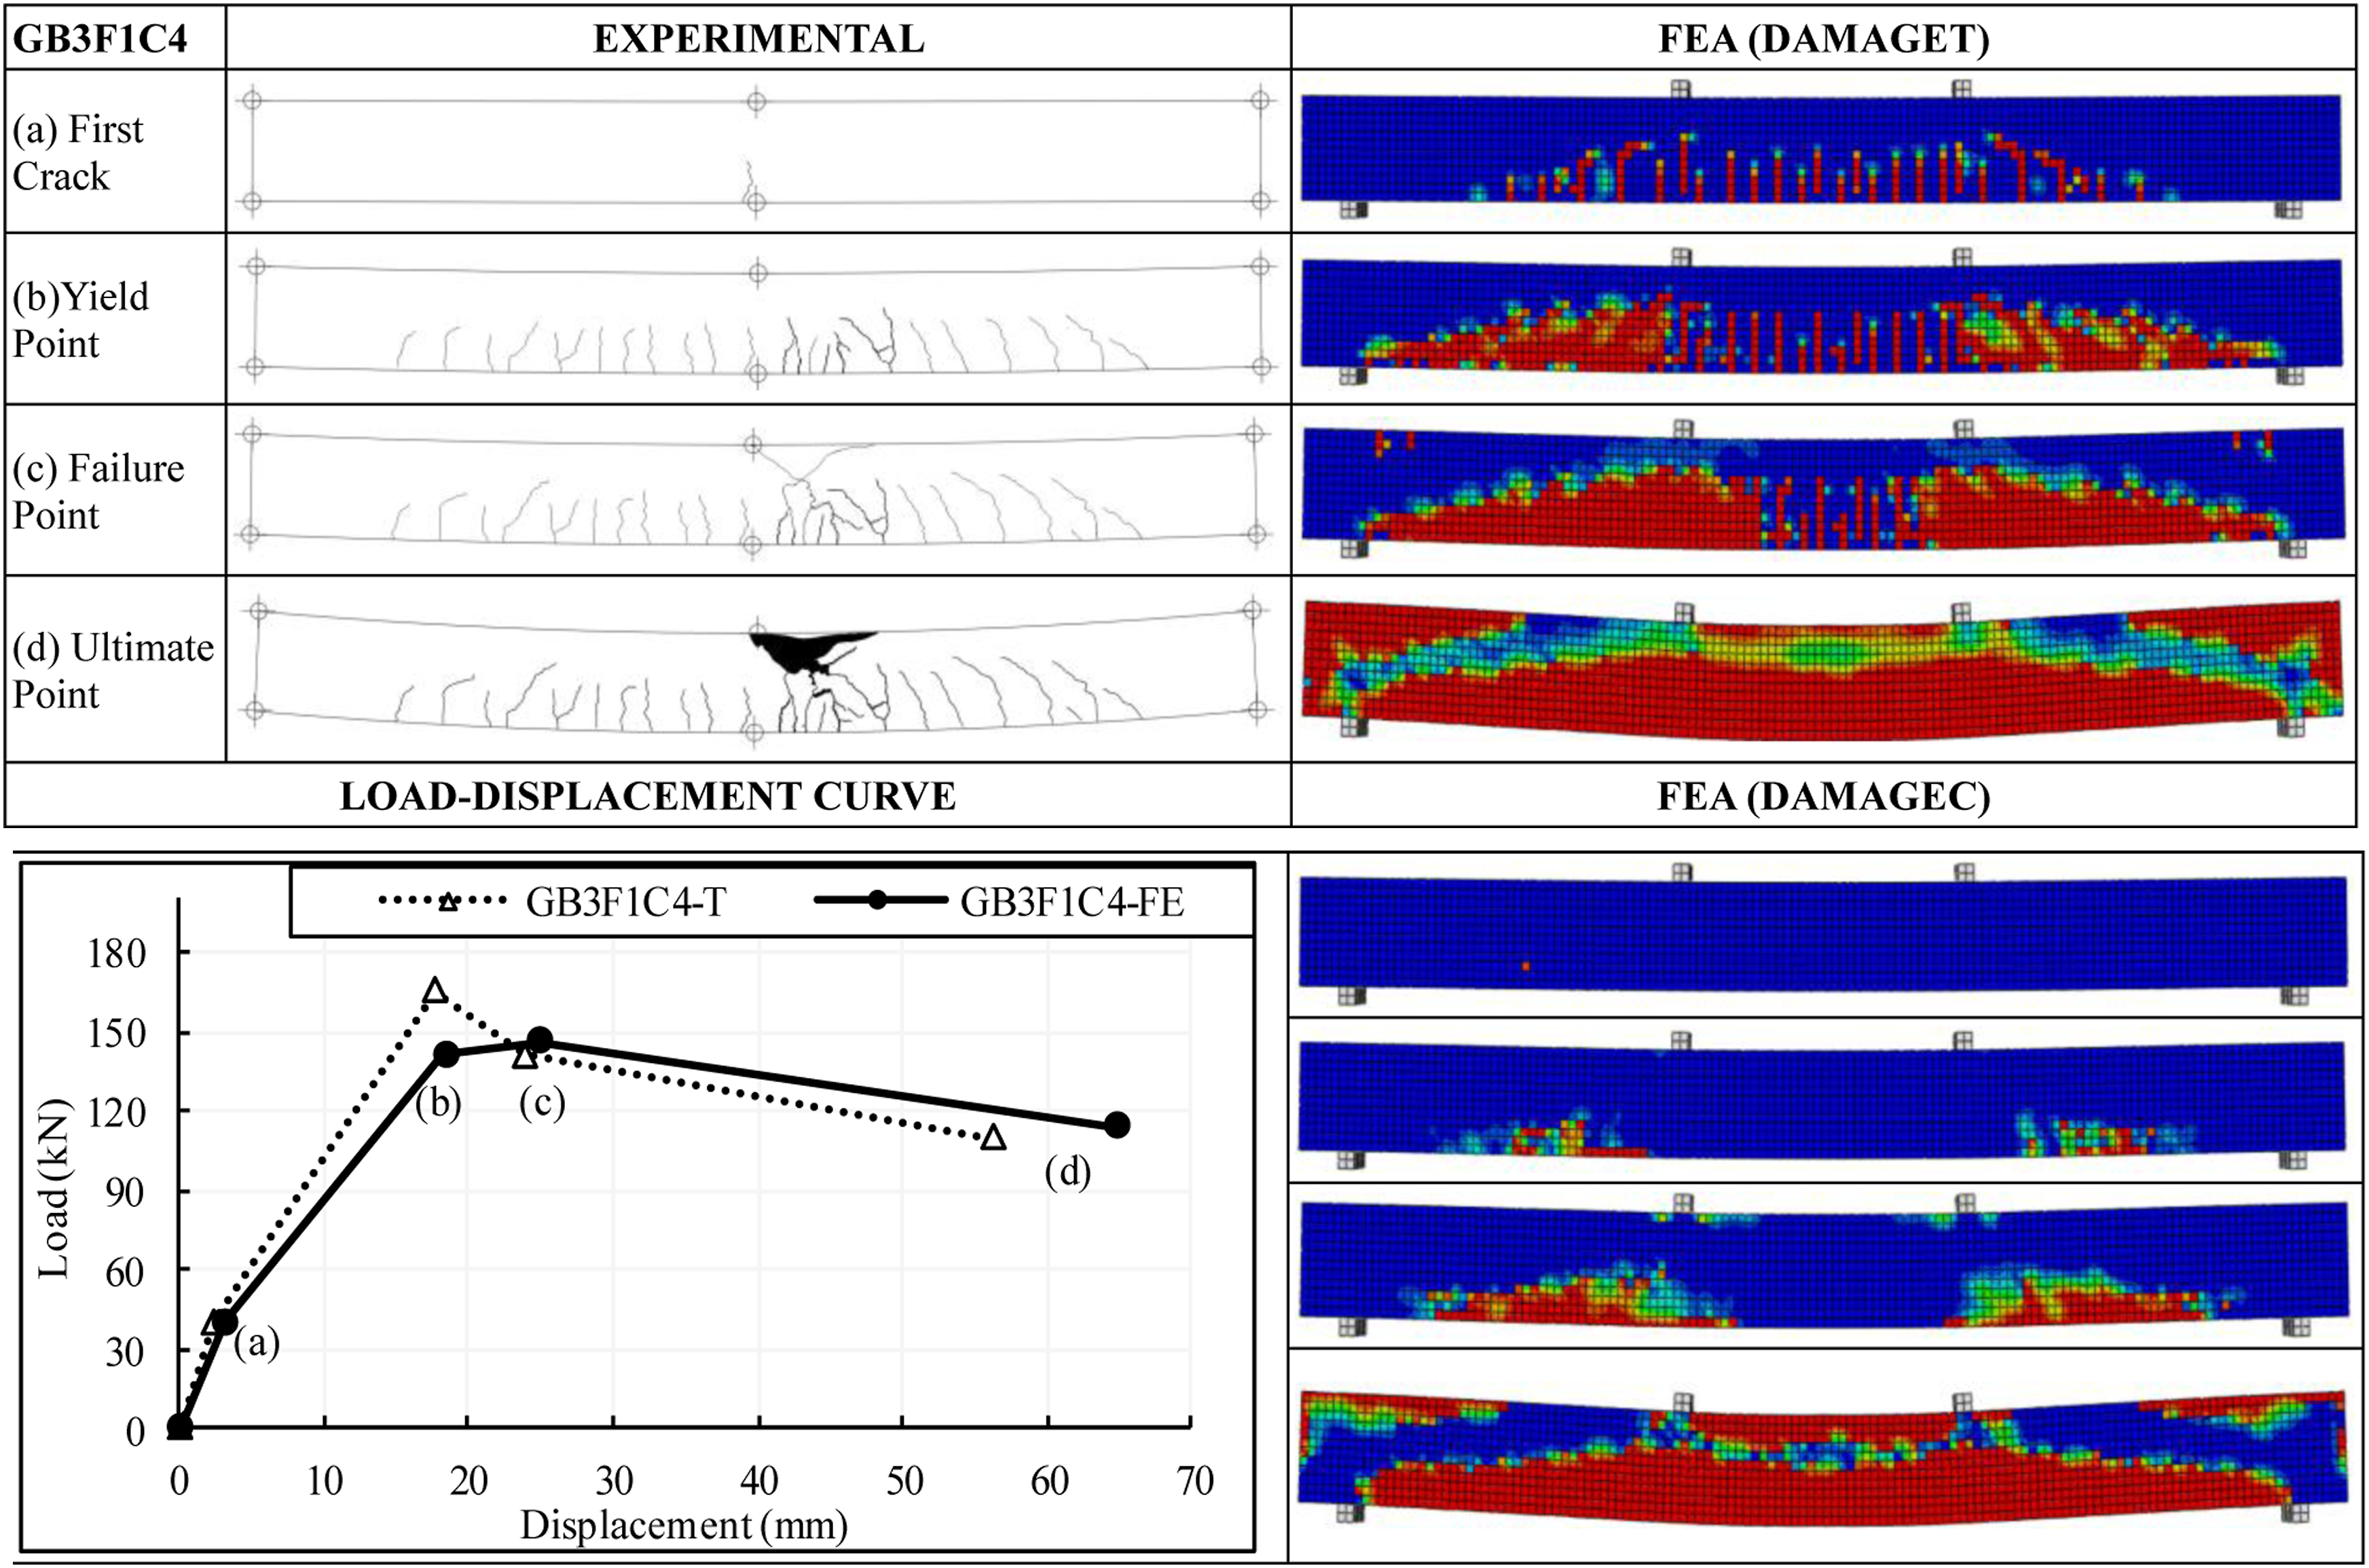
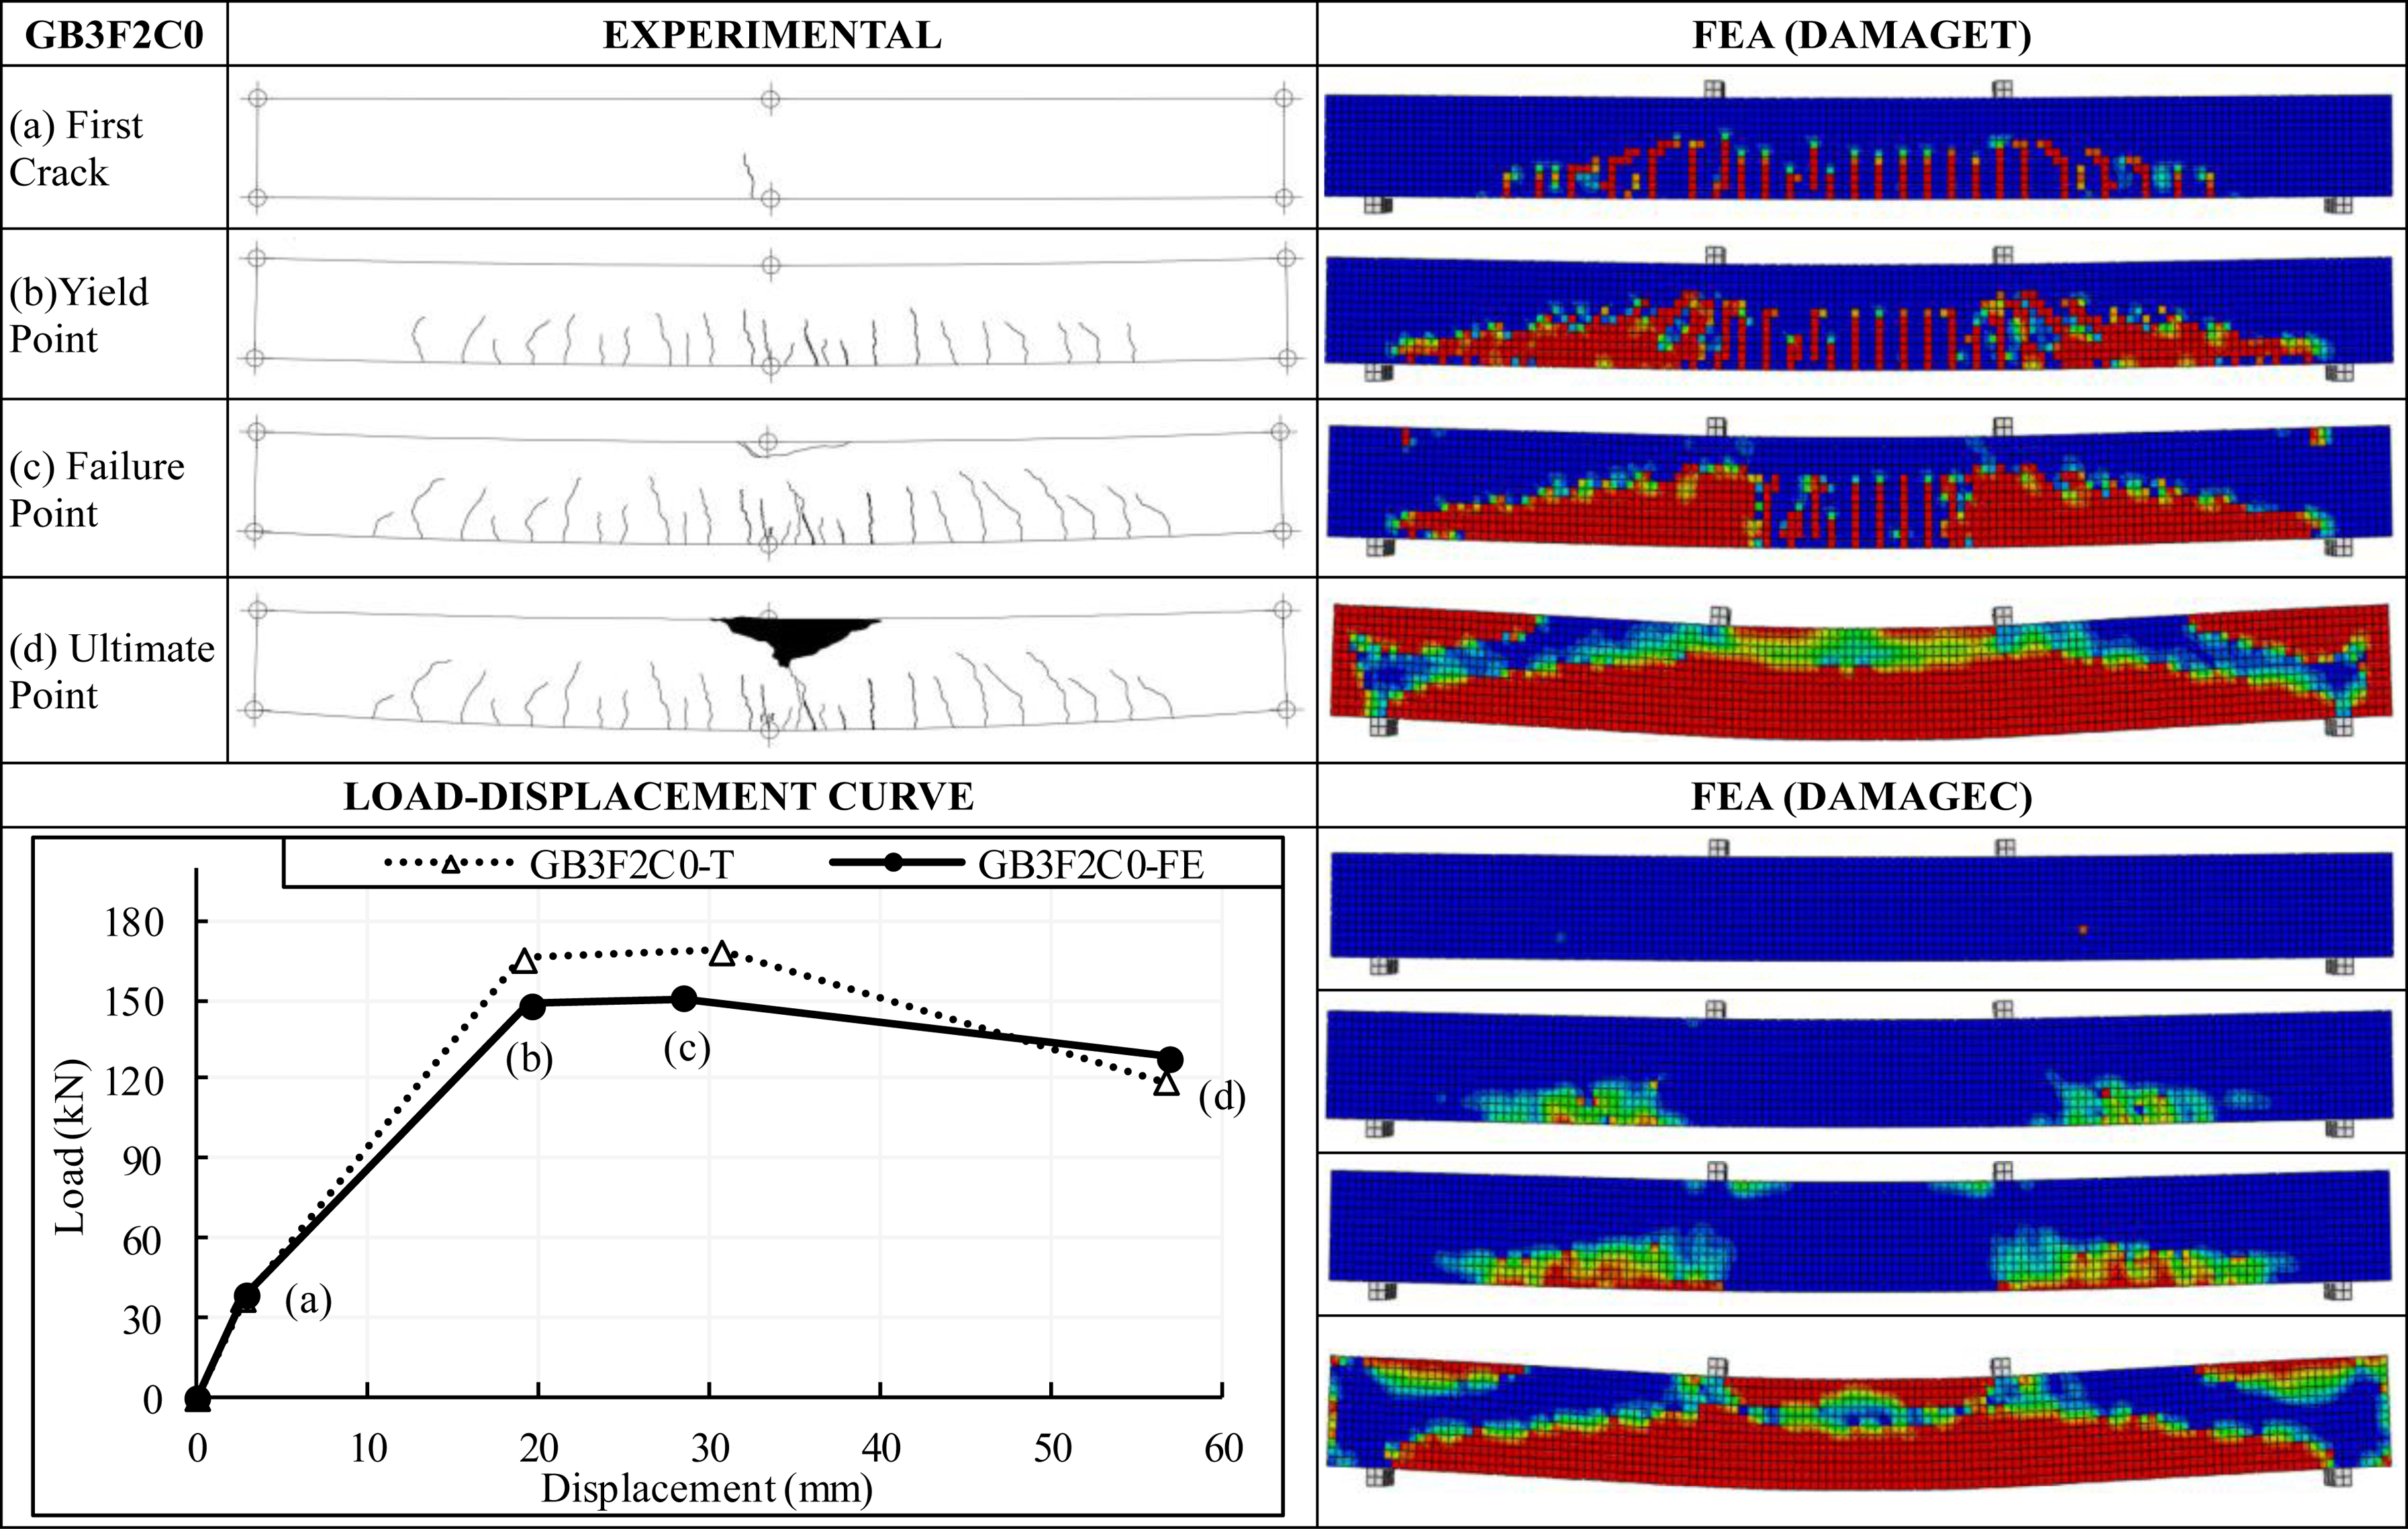
As shown in Table 7, experimental and FEM analysis results for GPC beams with 3Ø14 tensile reinforcement were found to be compatible. While no difference in load was observed at the yield point, experimental displacement results for GPC and OPC concrete were approximately 10% lower than the numerical results. The yield-point results for GPC and OPC beams are consistent; however, at failure, GPC beams exhibited greater deflection than OPC beams, as evidenced by both experimental and numerical data. Increasing the tensile reinforcement and approaching the balanced reinforcement ratio has a decisive effect on beam deflection. GPC beams, characterized by a lower modulus of elasticity, were crushed later and exhibited more significant deflection while consuming more energy during the crushing phase in the compression zone, attributed to their high deformation capacity (Özbayrak et al., 2024b). The difference in elastic modulus makes the tensile reinforcement ratio particularly significant, leading to fundamental behavioral differences between GPC and OPC. Numerical analyses also reveal differences in failure patterns and the extent of tensile and compressive damage. Crack monitoring and analysis showed that all beams’ maximum crack width at the yield point was 0.1 mm, increasing to 3 mm at the failure point. Experimental results indicate that GPC and OPC beams differ significantly regarding crack propagation and width at the yield and ultimate points. Numerically, OPC beams sustain more damage than GPC beams in failure and ultimate damage distributions. This difference can be attributed to the broader tensile cracks in OPC beams compared to GPC beams, which exhibit both wide and narrow cracks. Load-displacement graphs, compression and tensile-damage behavior graphs for GB3 and the related OPCB3 series are shown in Figures 25-29. Comparison of GB3F1C0 experimental and finite element analysis results. Comparison of GB3F1C4 experimental and finite element analysis results. Comparison of GB3F2C0 experimental and finite element analysis results. Comparison of GB3F2C4 experimental and finite element analysis results. Comparison of OPCB3 experimental and finite element analysis results.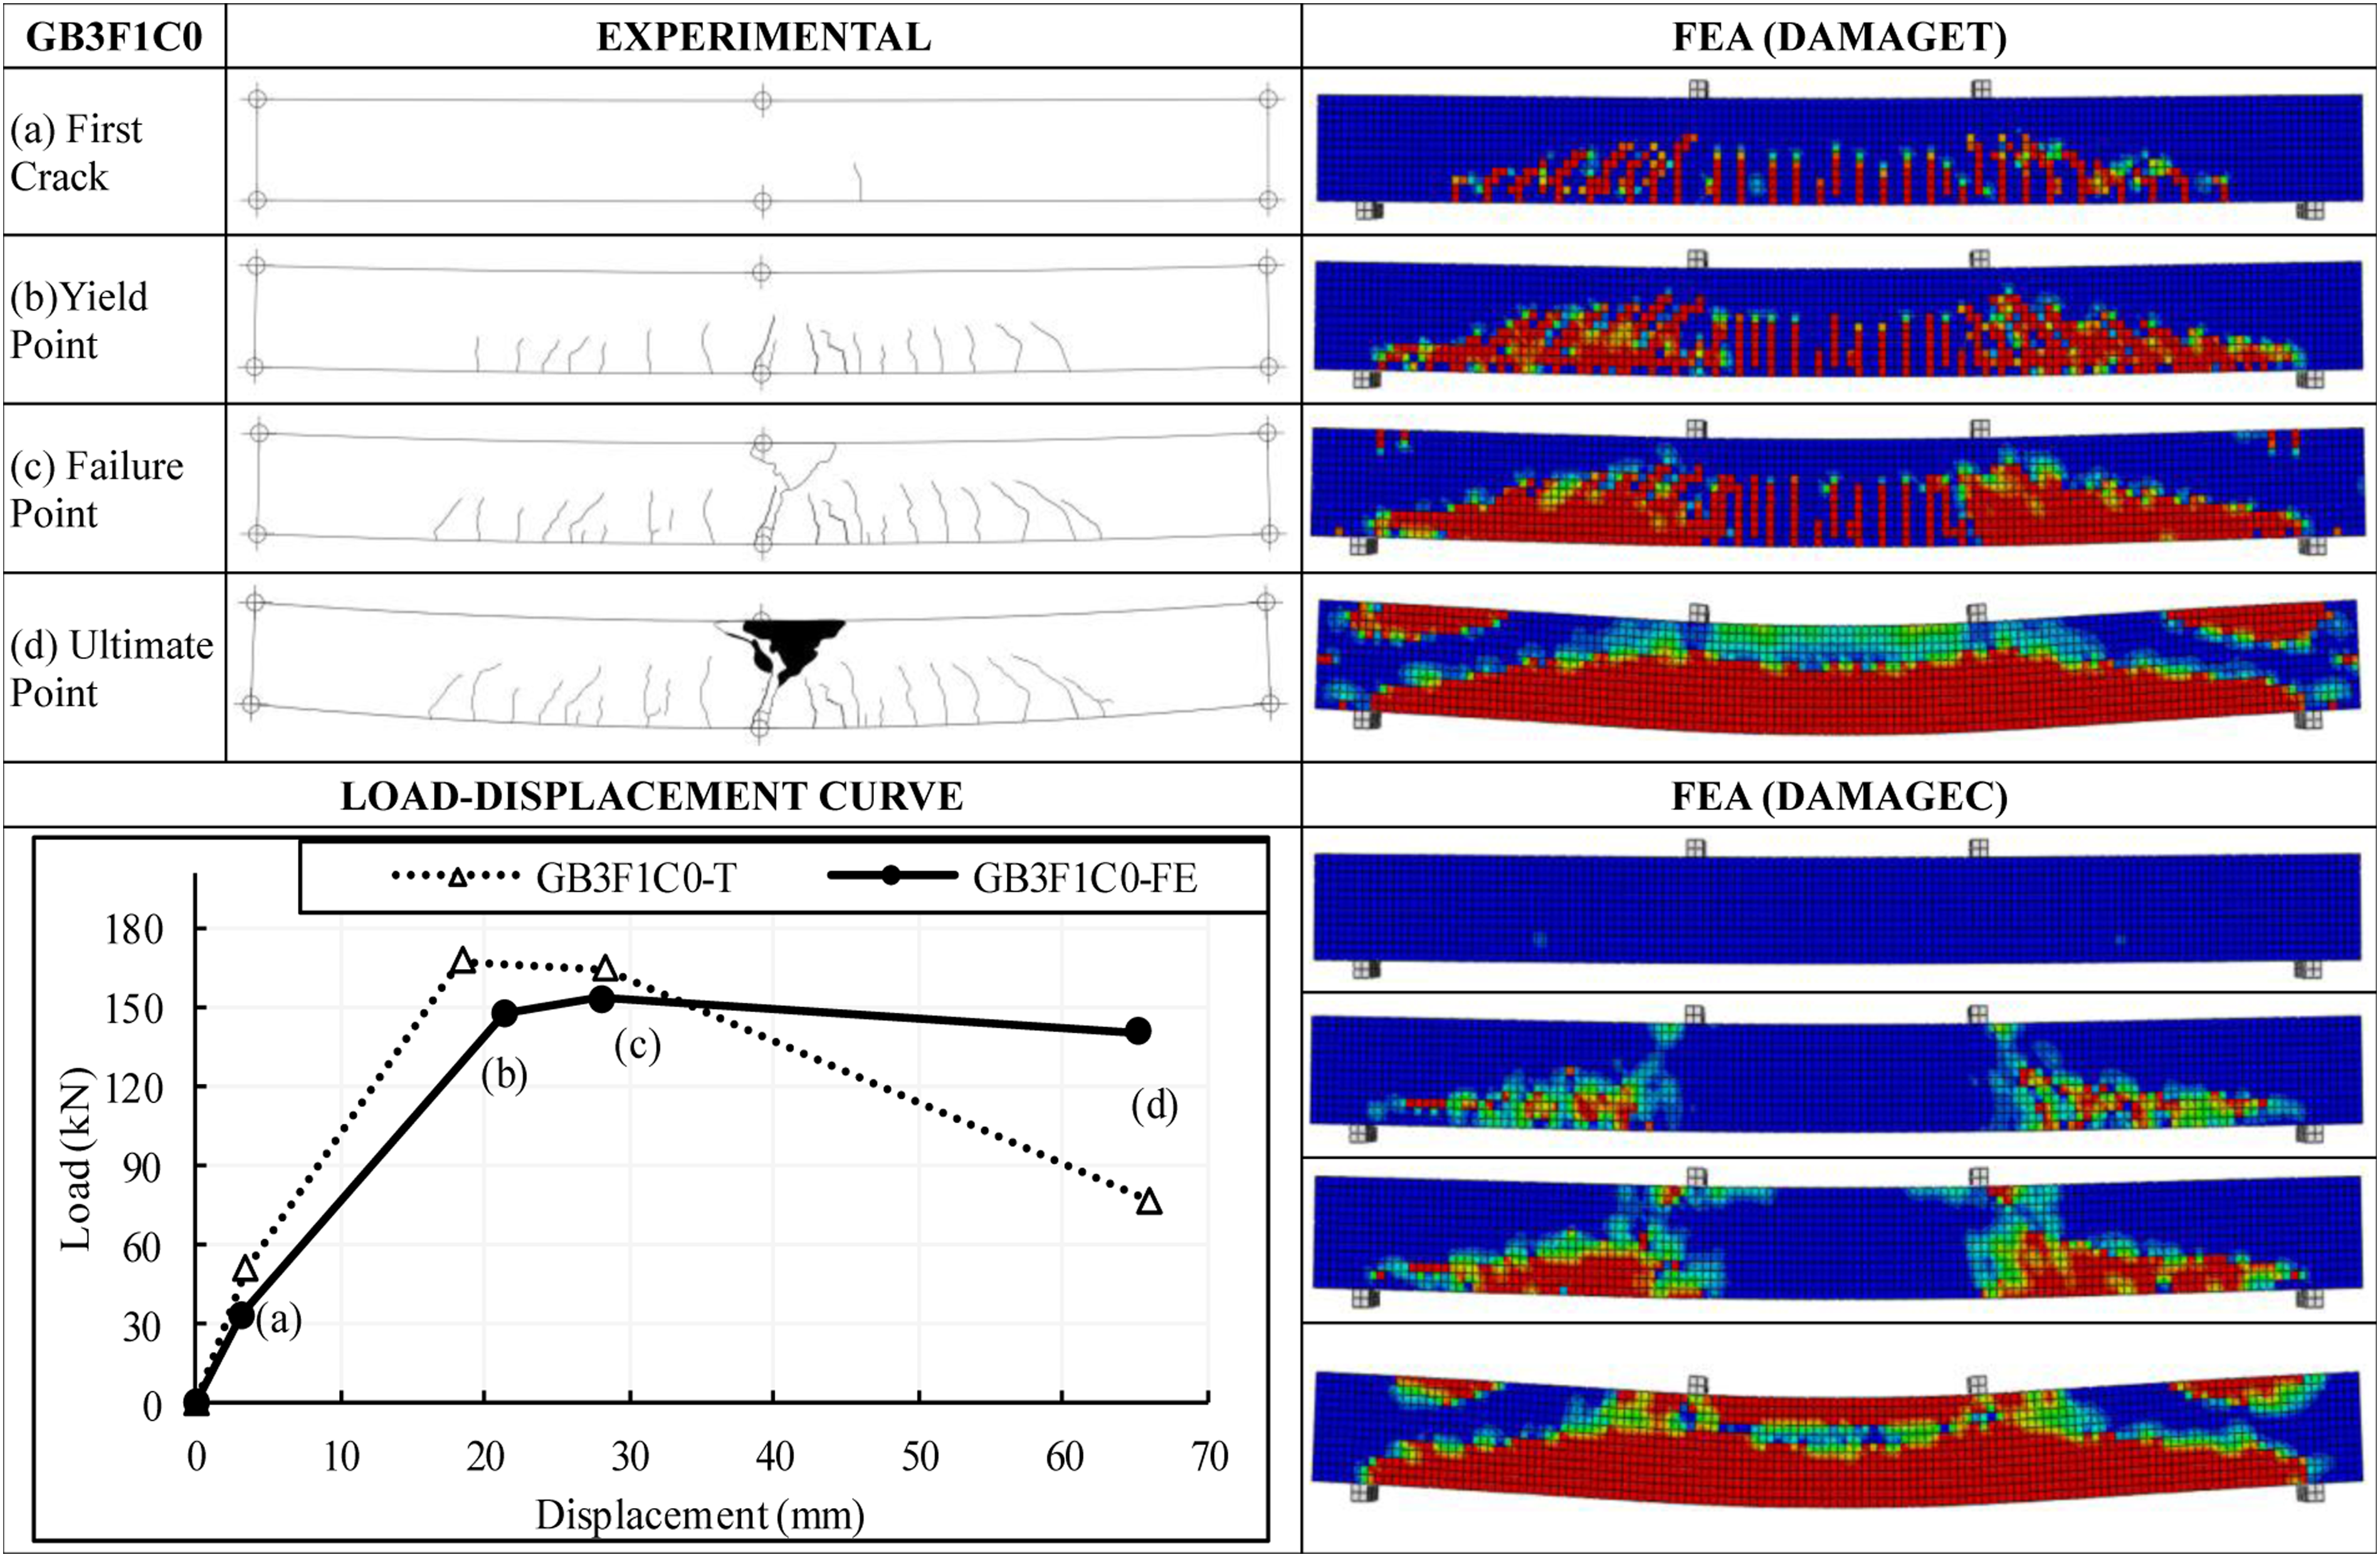
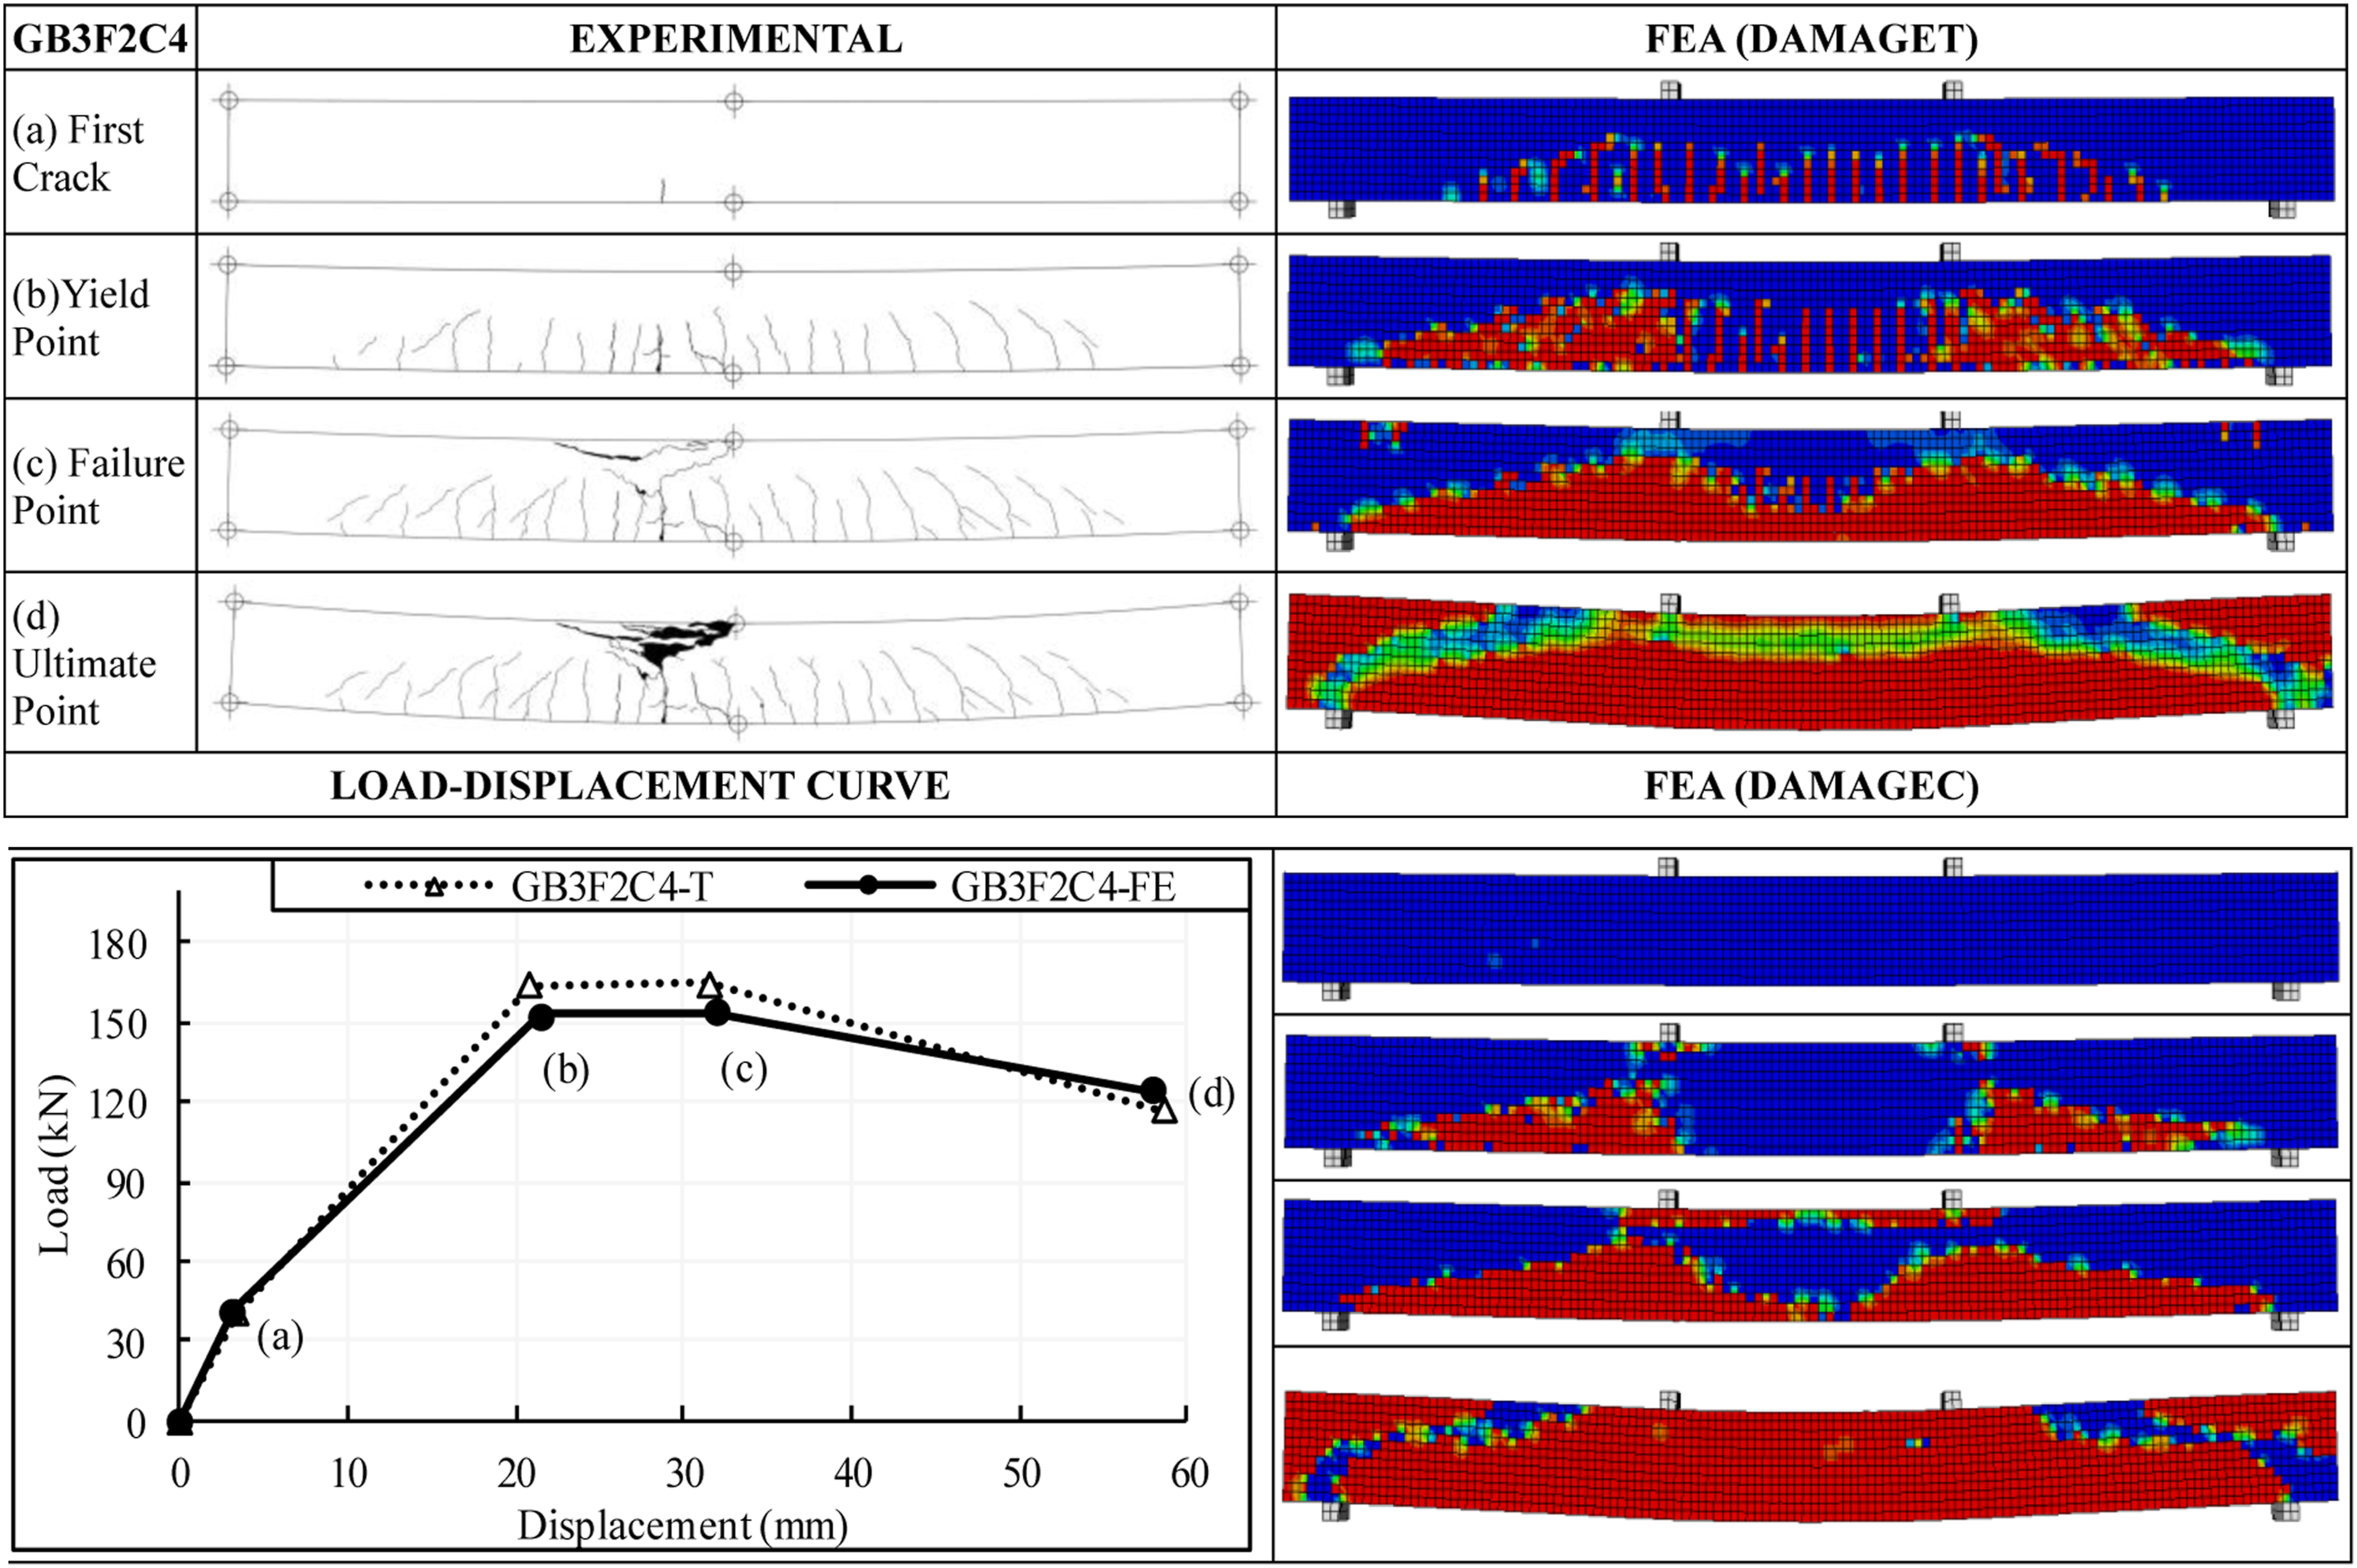
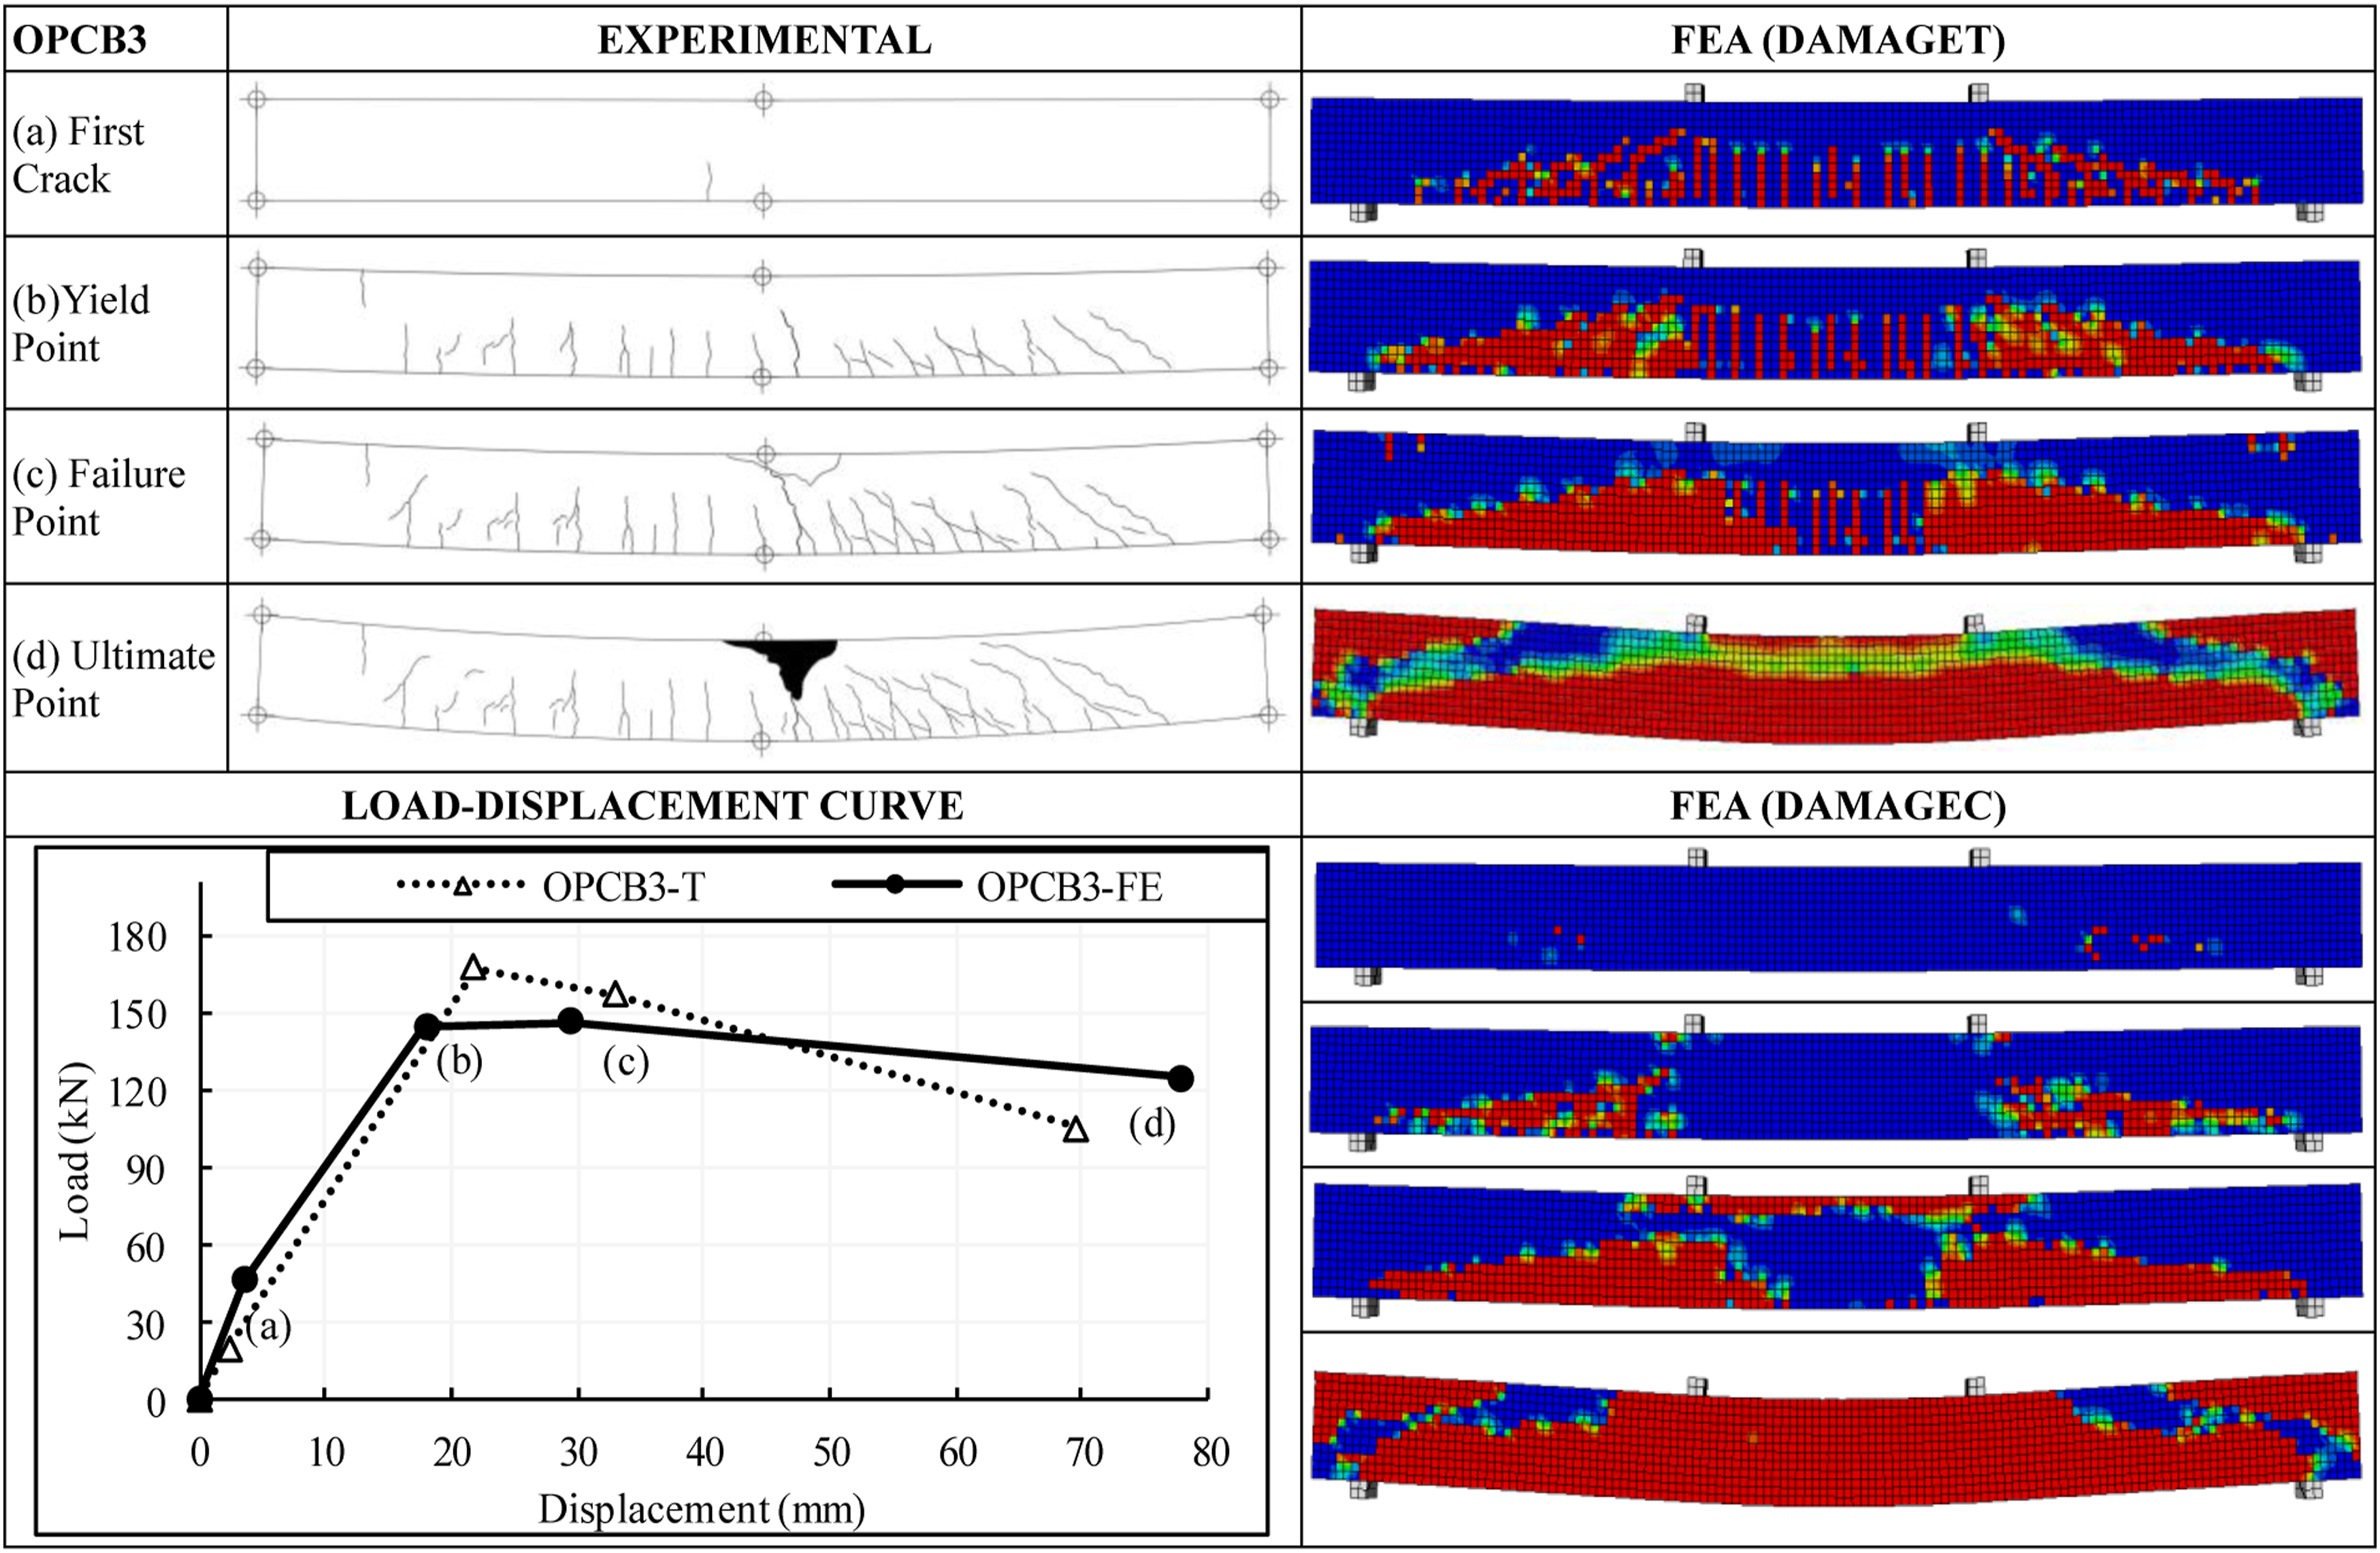
% differences in reinforced concrete beams with longitudinal tensile reinforcement 4Ø16 (GB3).
% differences between the OPC and the numerical and experimental load-displacement results for GPC formulations.
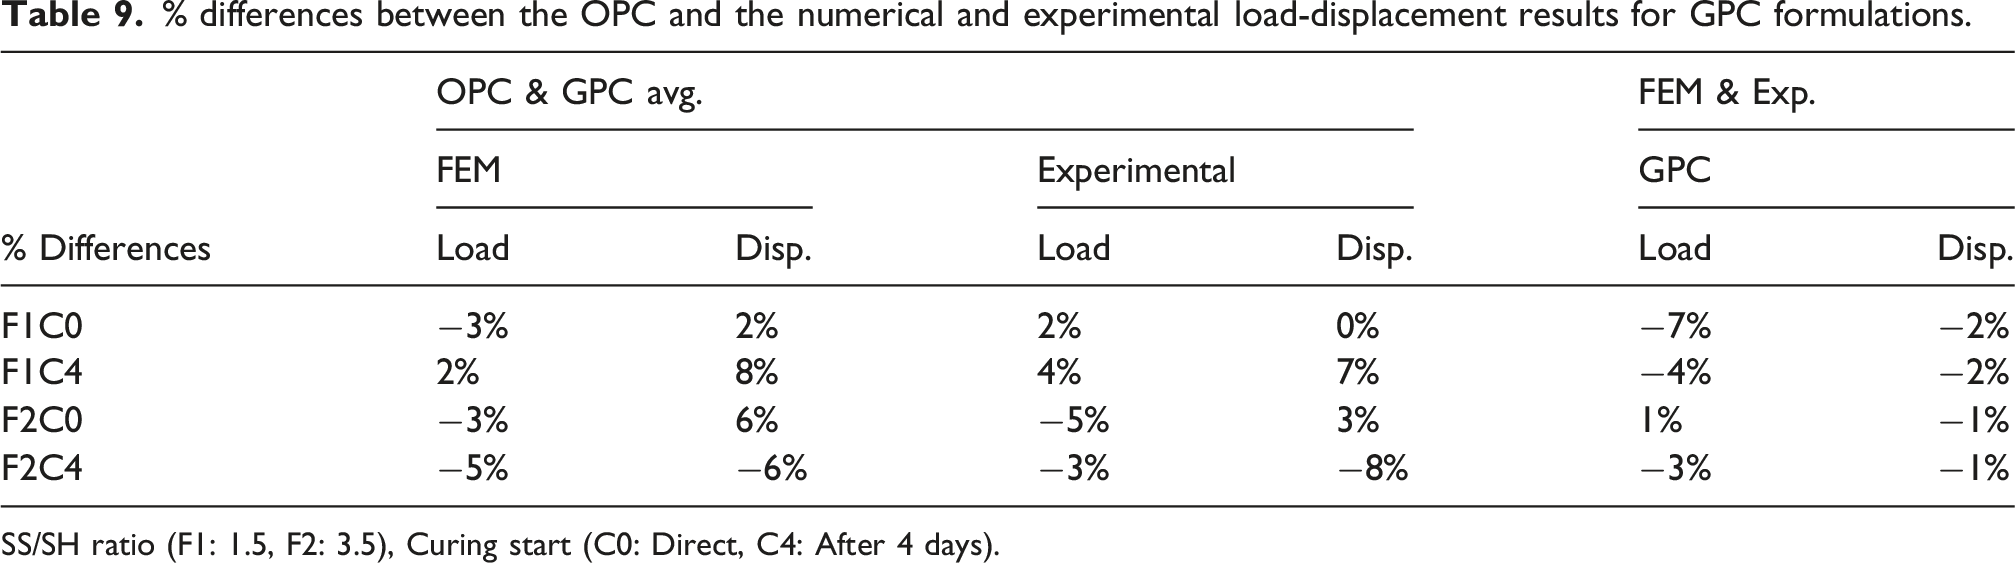
SS/SH ratio (F1: 1.5, F2: 3.5), Curing start (C0: Direct, C4: After 4 days).
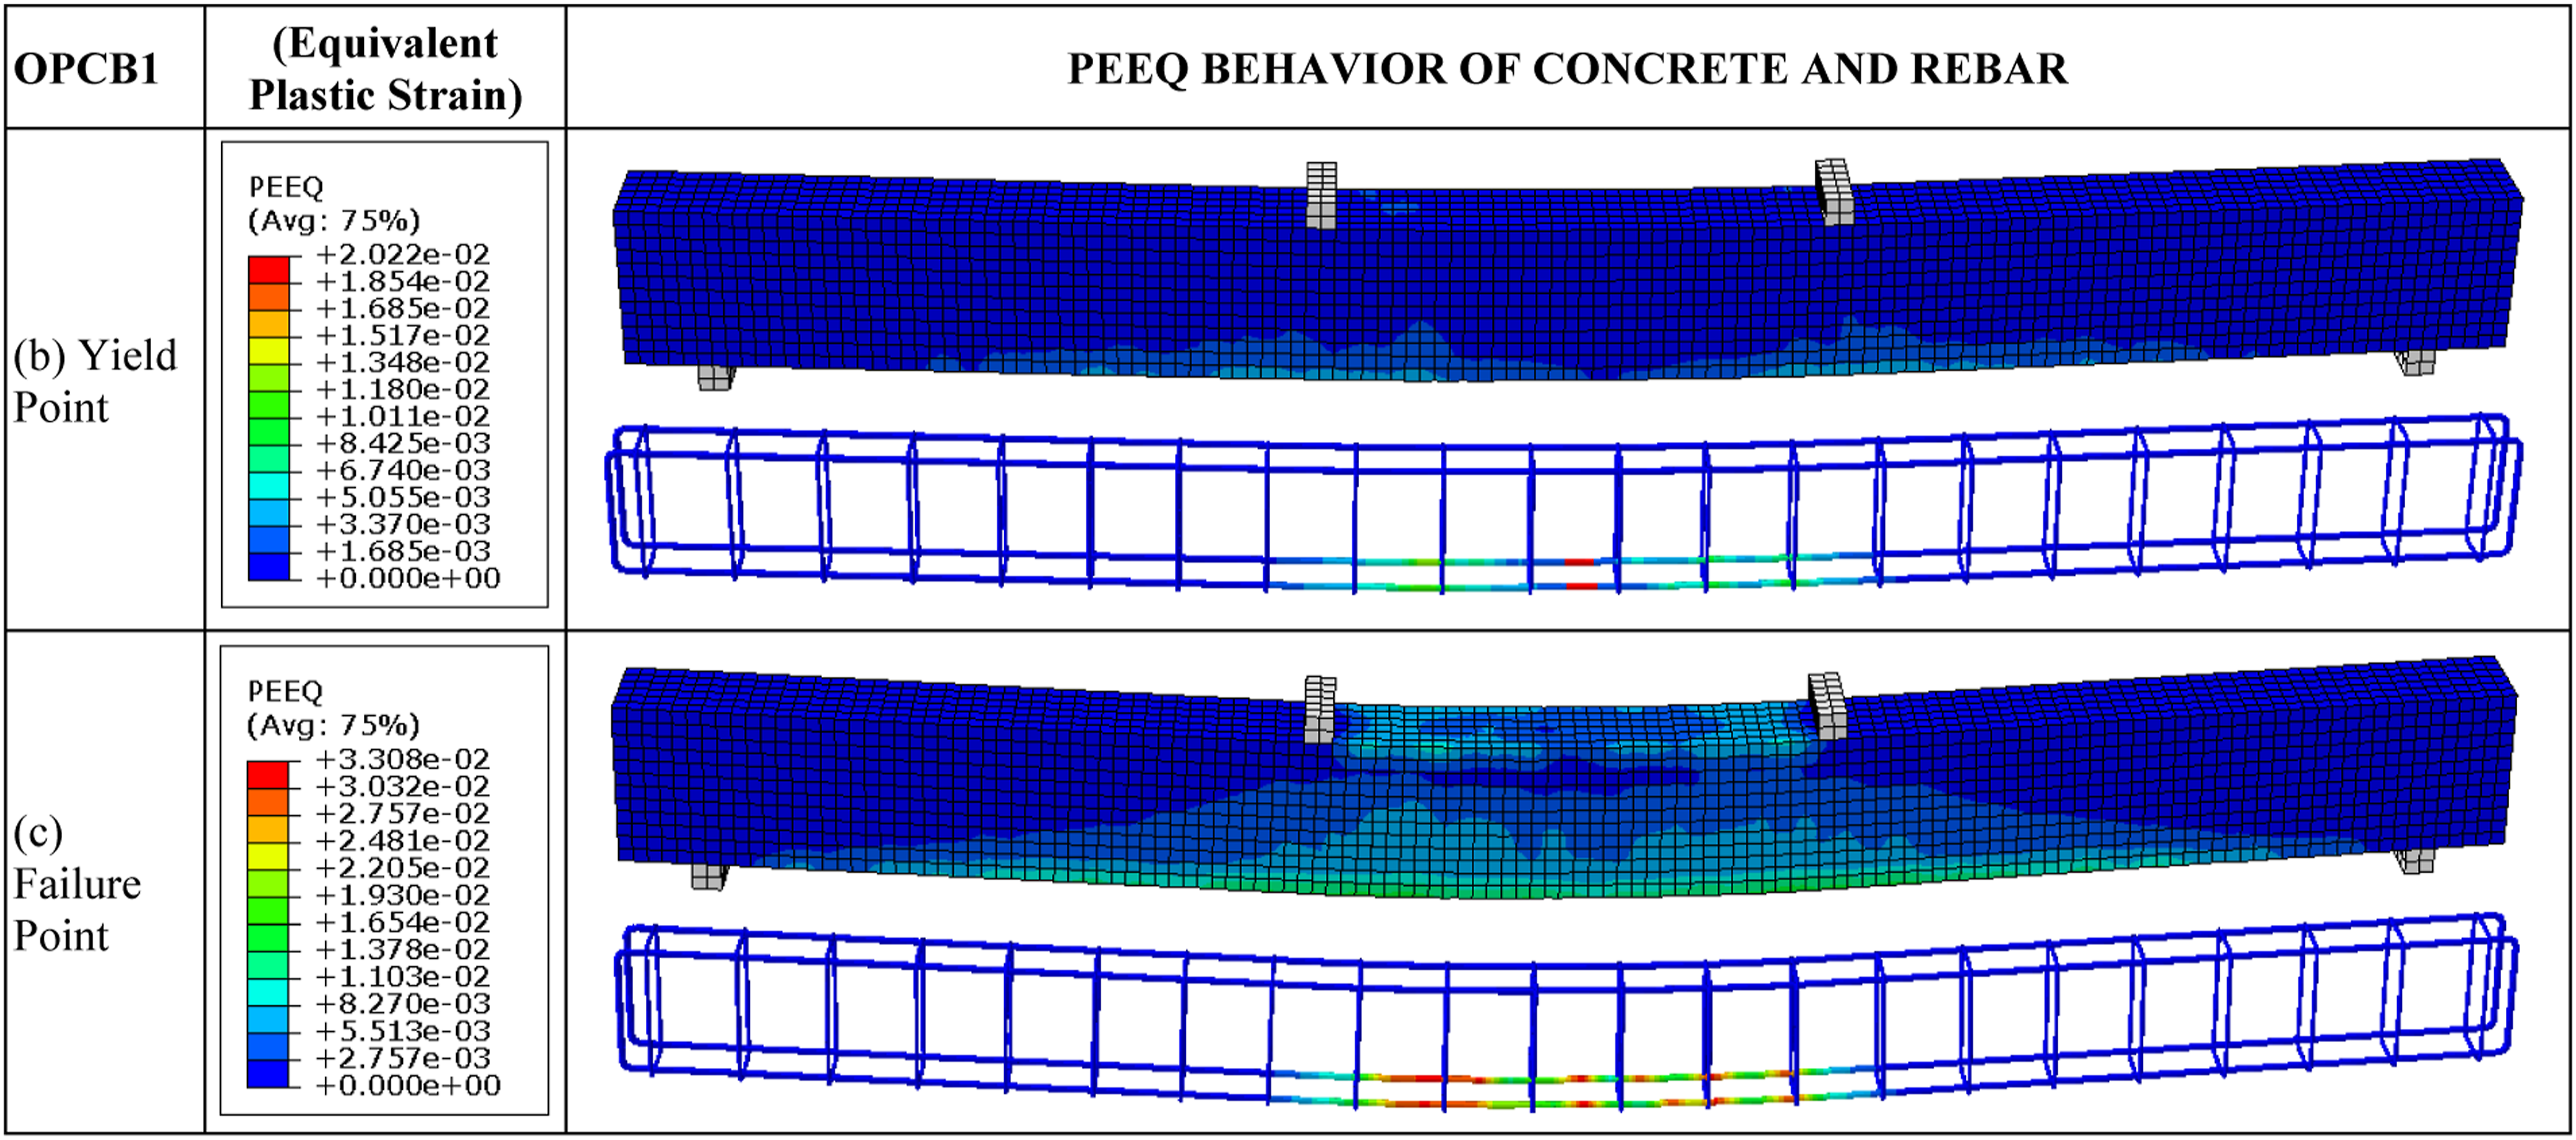
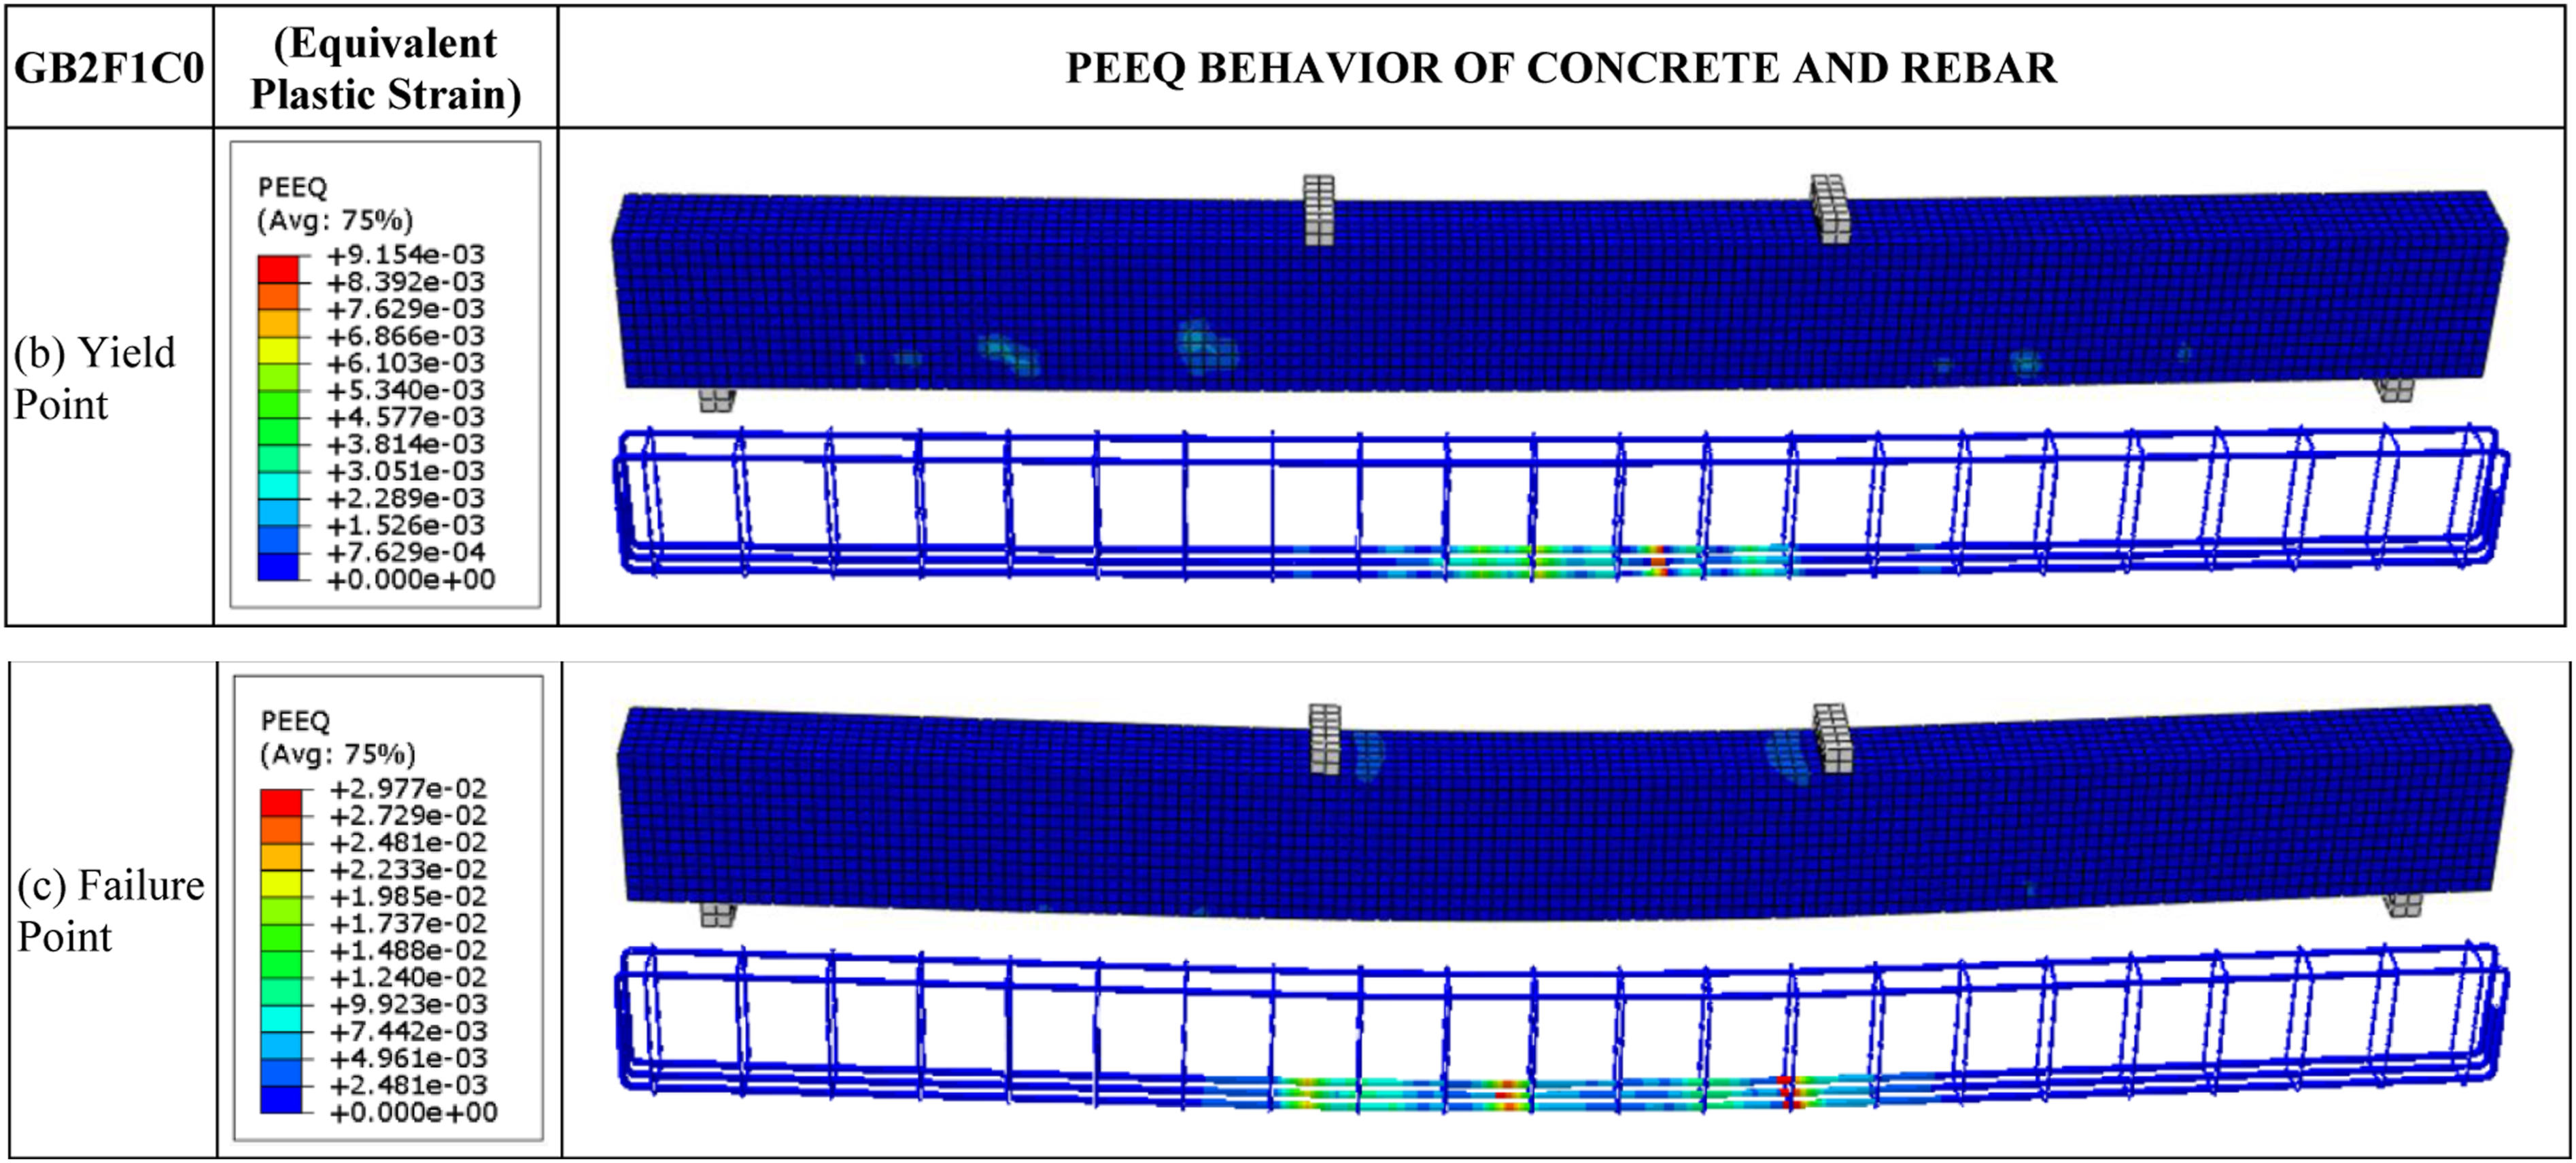
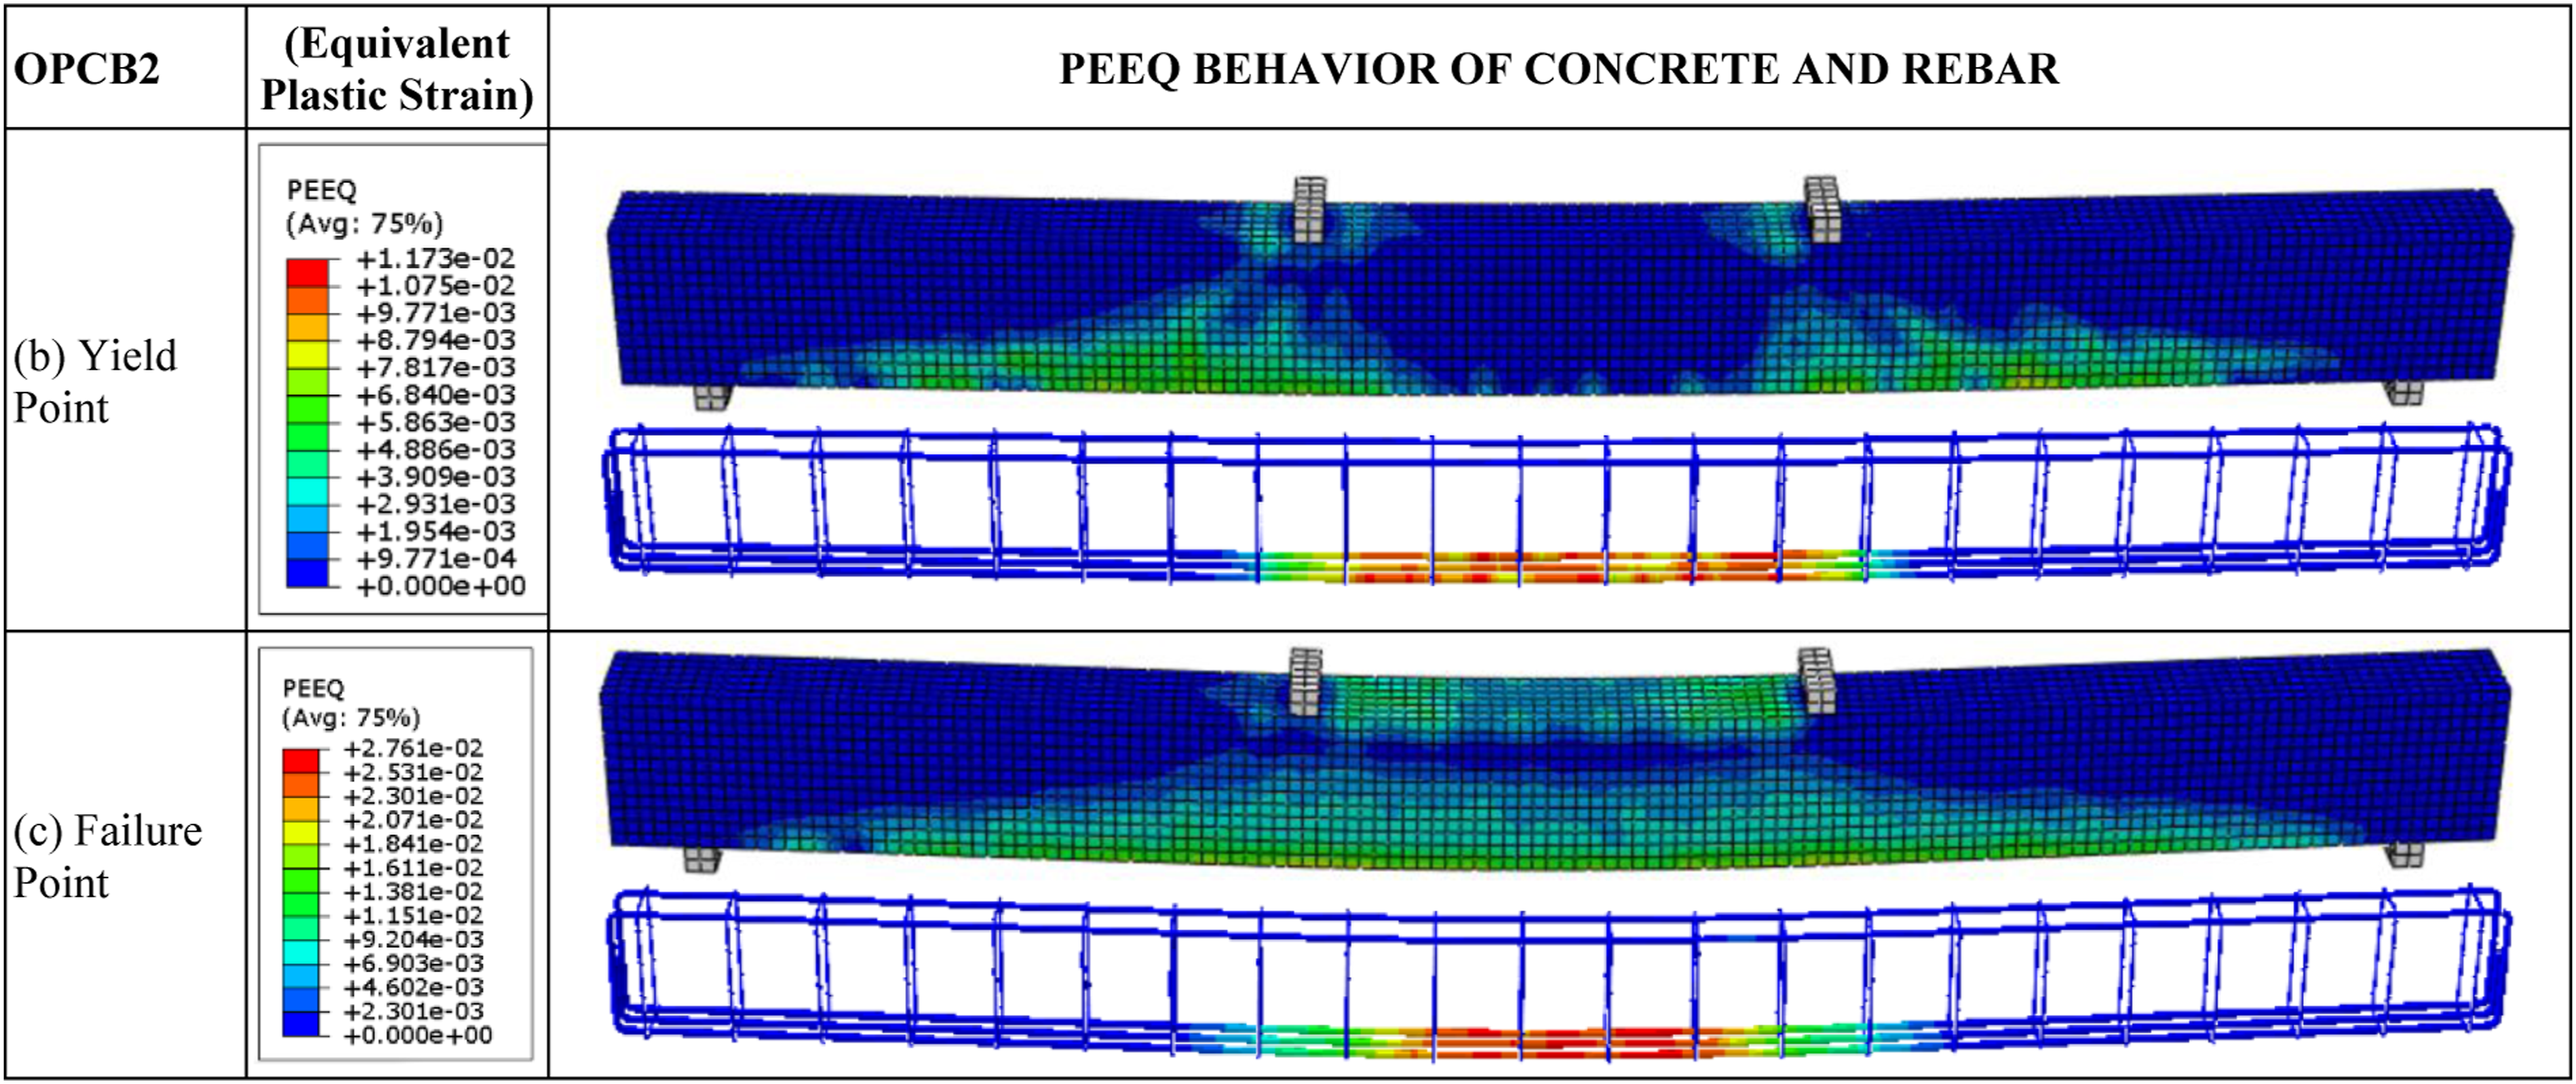
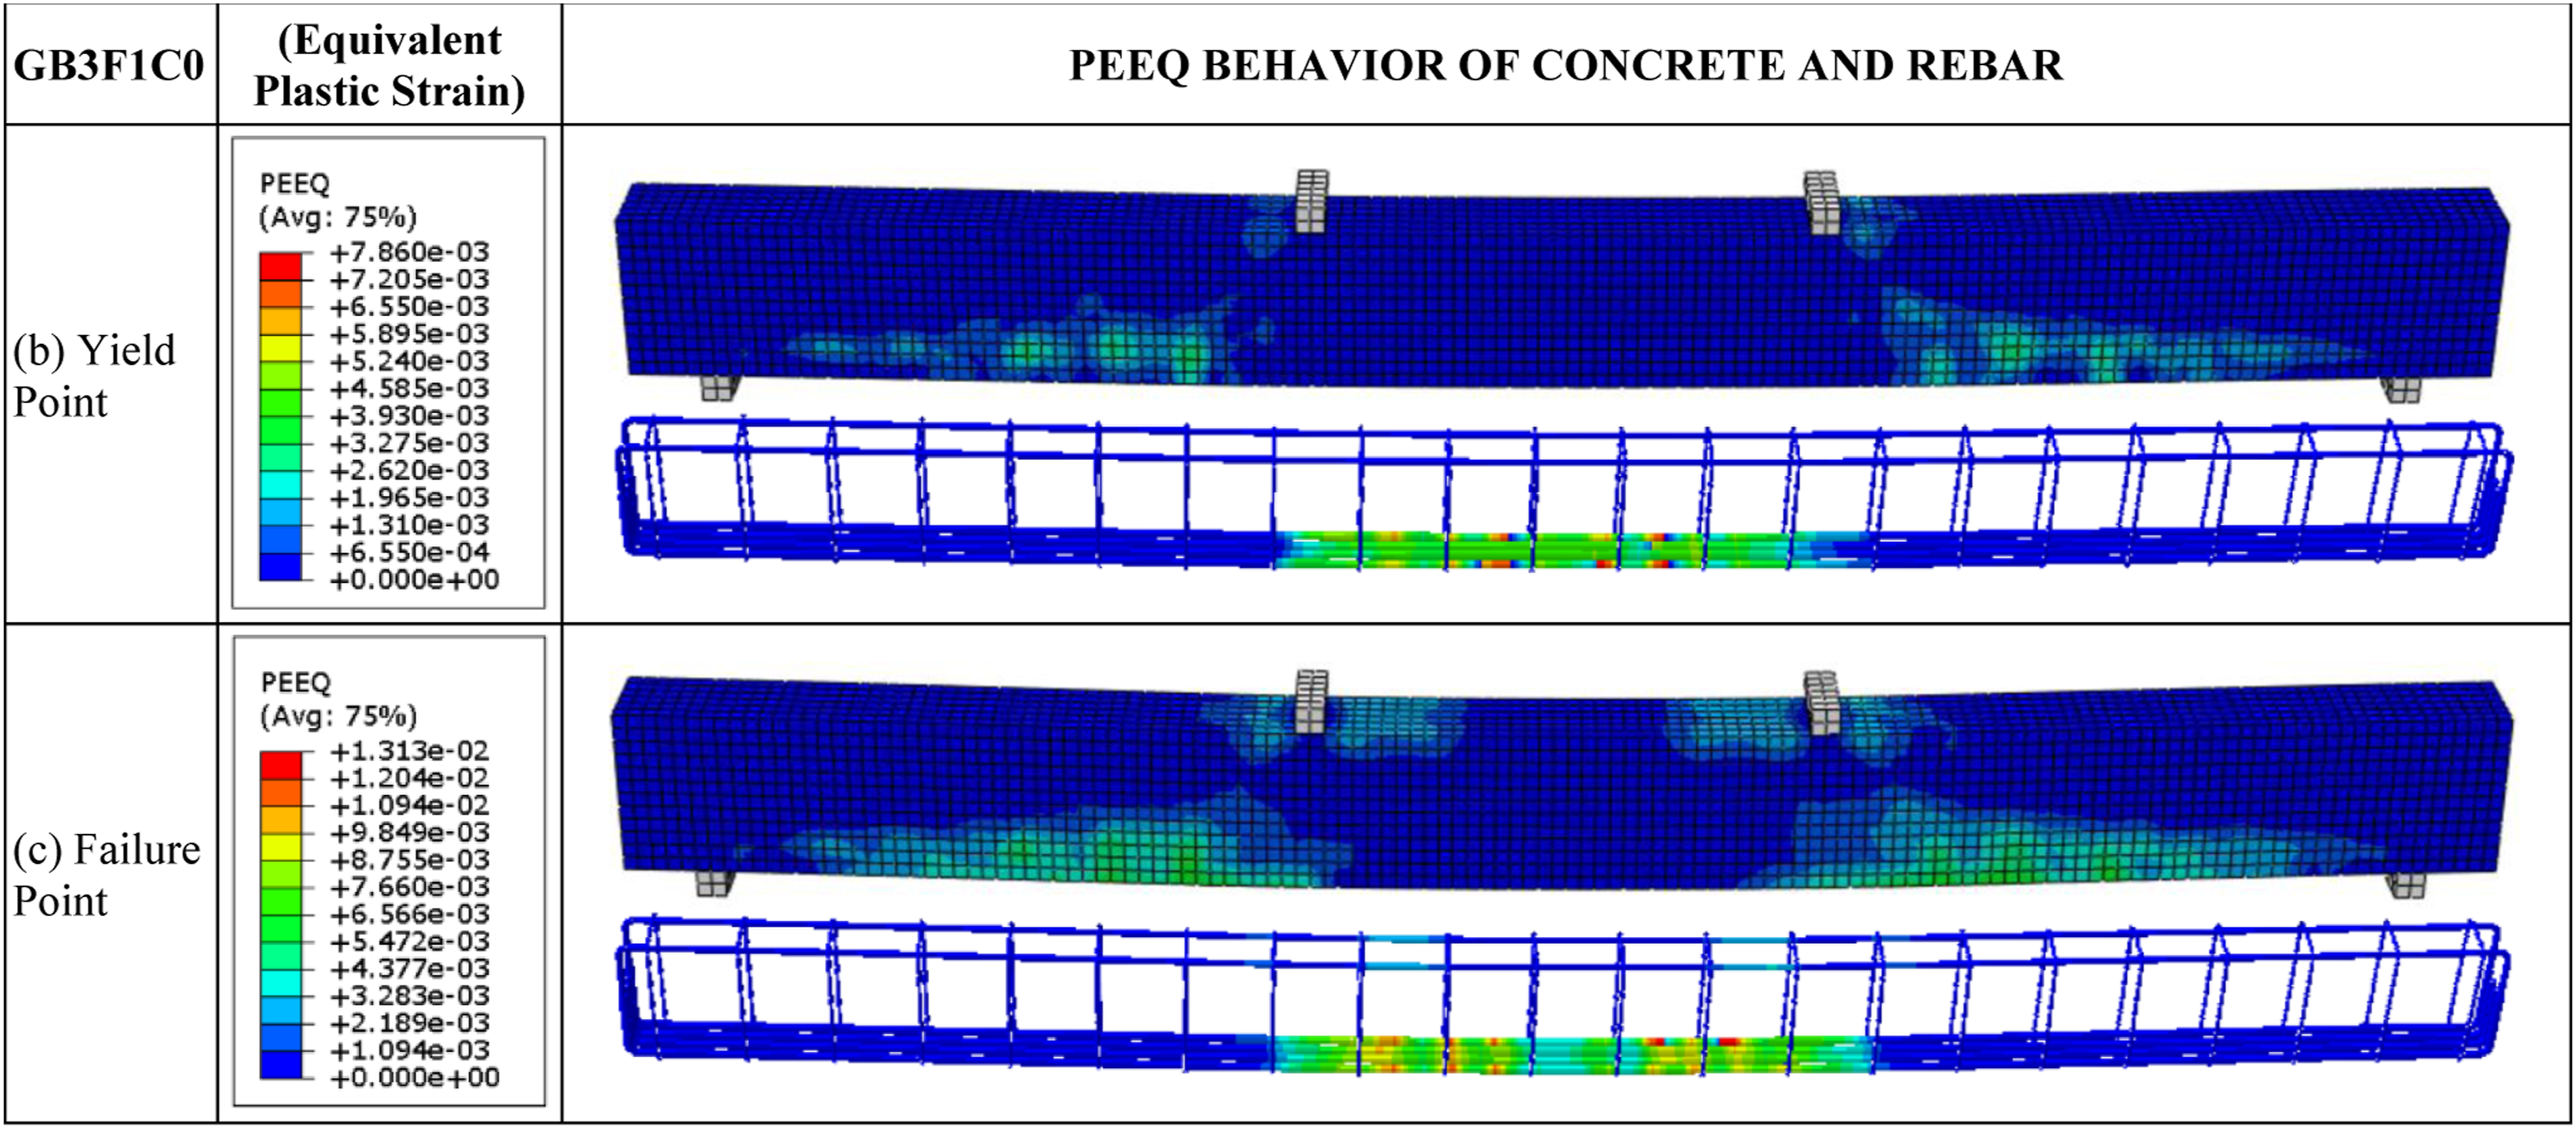
Average results for GPC formulation results, regardless of tensile reinforcement ratio, were compared with OPC results experimentally and numerically. Additionally, the percentage differences between numerical and experimental GPC results were calculated to evaluate the effects of curing methods and alkaline activator ratios in detail. According to Table 9, the SS/SH ratio and curing method did not significantly affect the load-displacement relationship when comparing the experimental and numerical results of OPC and GPC. Among GPC formulations, the maximum (F2C4) and minimum (F1C4) results showed differences of 7–8% in load and 15–16% in displacement. Increasing the SS/SH ratio from 1.5 (F1) to 3.5 (F2) increased the bending capacity and energy consumption of thermally cured beams kept at ambient temperature for 4 days. The alignment of numerical results with experimental findings allows further exploration of unmeasured test data through numerical simulations. Strain values in the compression zone and in the tensile reinforcement were investigated numerically to better understand GPC behavior under yielding and failure conditions. Except for the F2C4 samples, OPC beams exhibited greater deflection than GPC. OPC experimental results were 1% lower in load and 4% lower in deflection than numerical results, indicating substantial agreement. However, GPC’s lower elastic modulus increased its deformation demand to achieve a similar load-bearing capacity. These findings were validated numerically, with strain values at yield and failure points calculated using ABAQUS. Examples from the F1C0 and OPC series are shown in Figures 30-35. Strain values of the GB1F1C0 beam at the yield and failure point. Strain values of the OPCB1 beam at the yield and failure point. Strain values of the GB2F1C0 beam at the yield and failure point. Strain values of the OPCB2 beam at the yield and failure point. Strain values of the GB3F1C0 beam at the yield and failure point. Strain values of the OPCB3 beam at the yield and failure point.
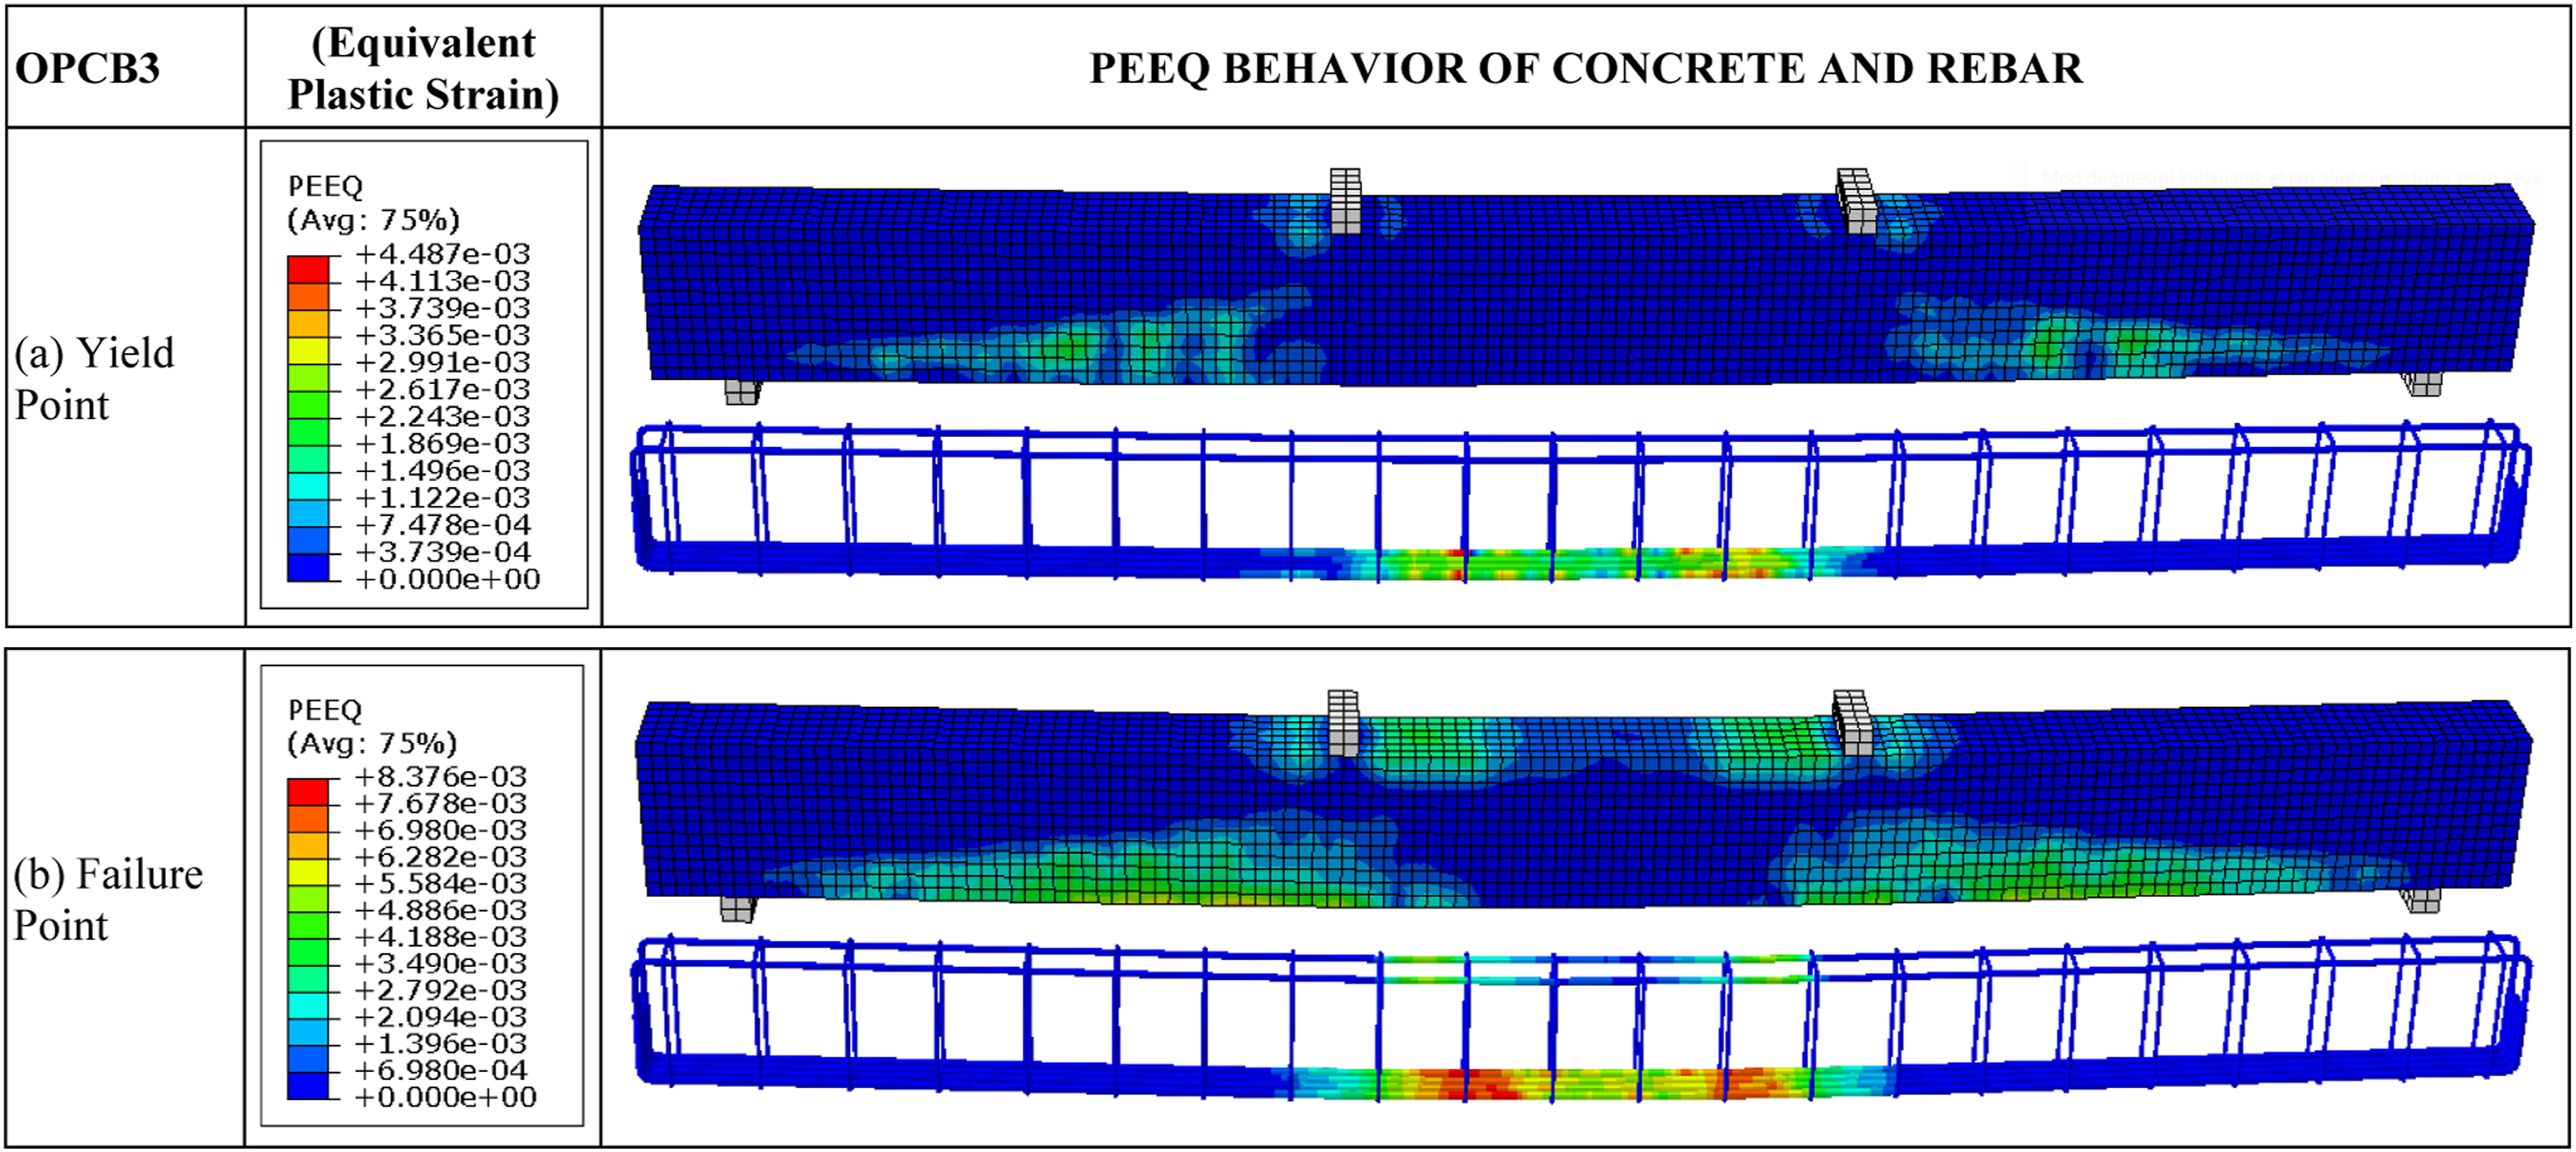
Compression zone concrete deformation values of GPC and OPC beams at yield and failure points.
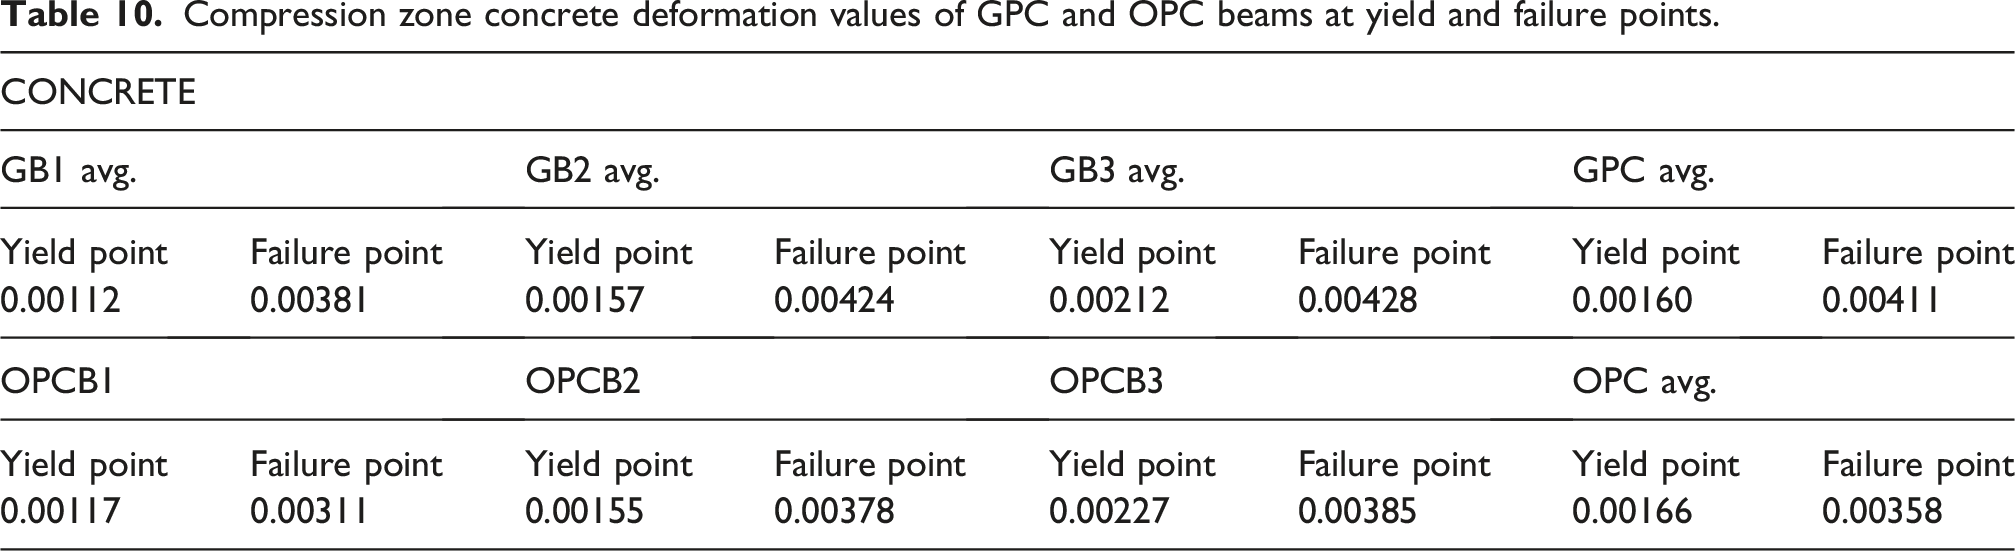
Deformation in the compression zone
Tensile reinforcement strain values of GPC and OPC beams at yield and failure points.
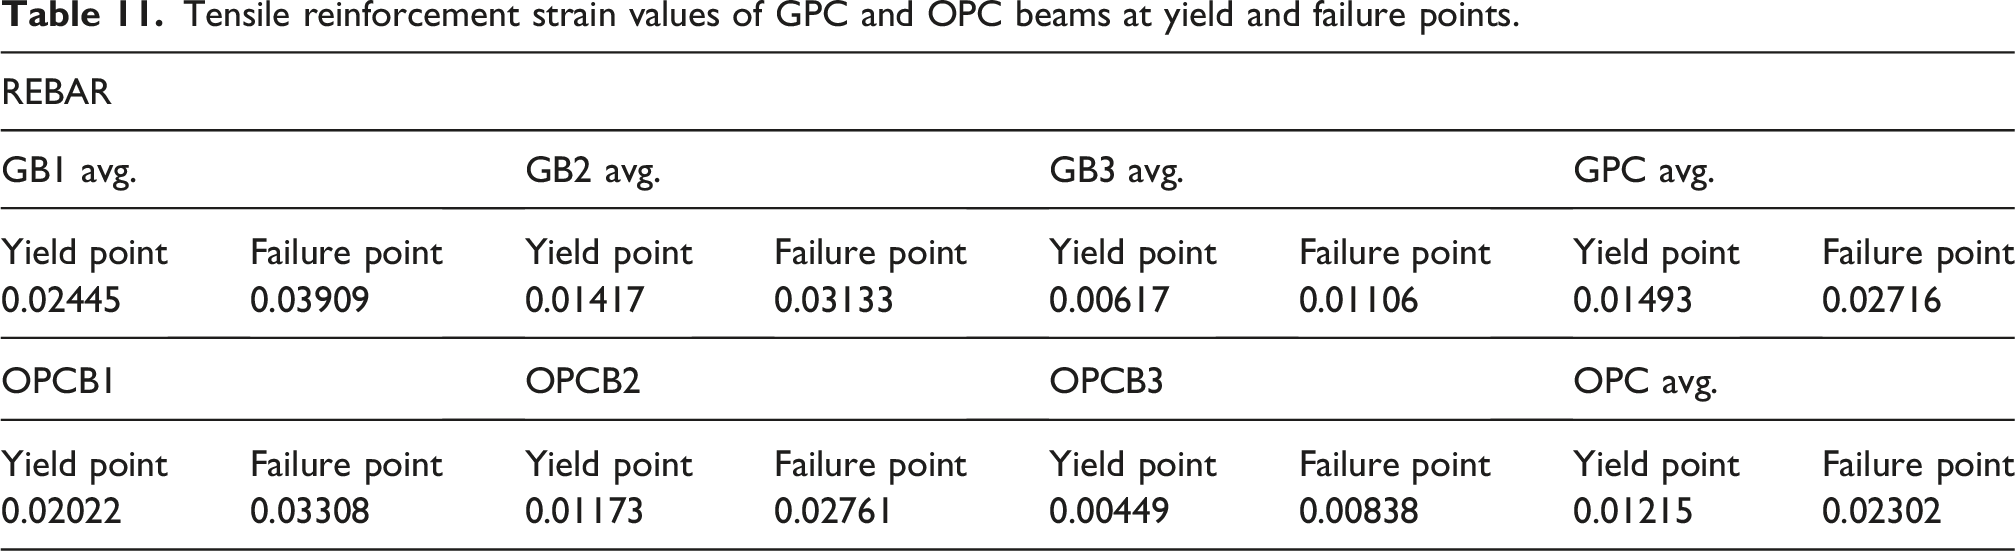
Deformation in tensile reinforcement
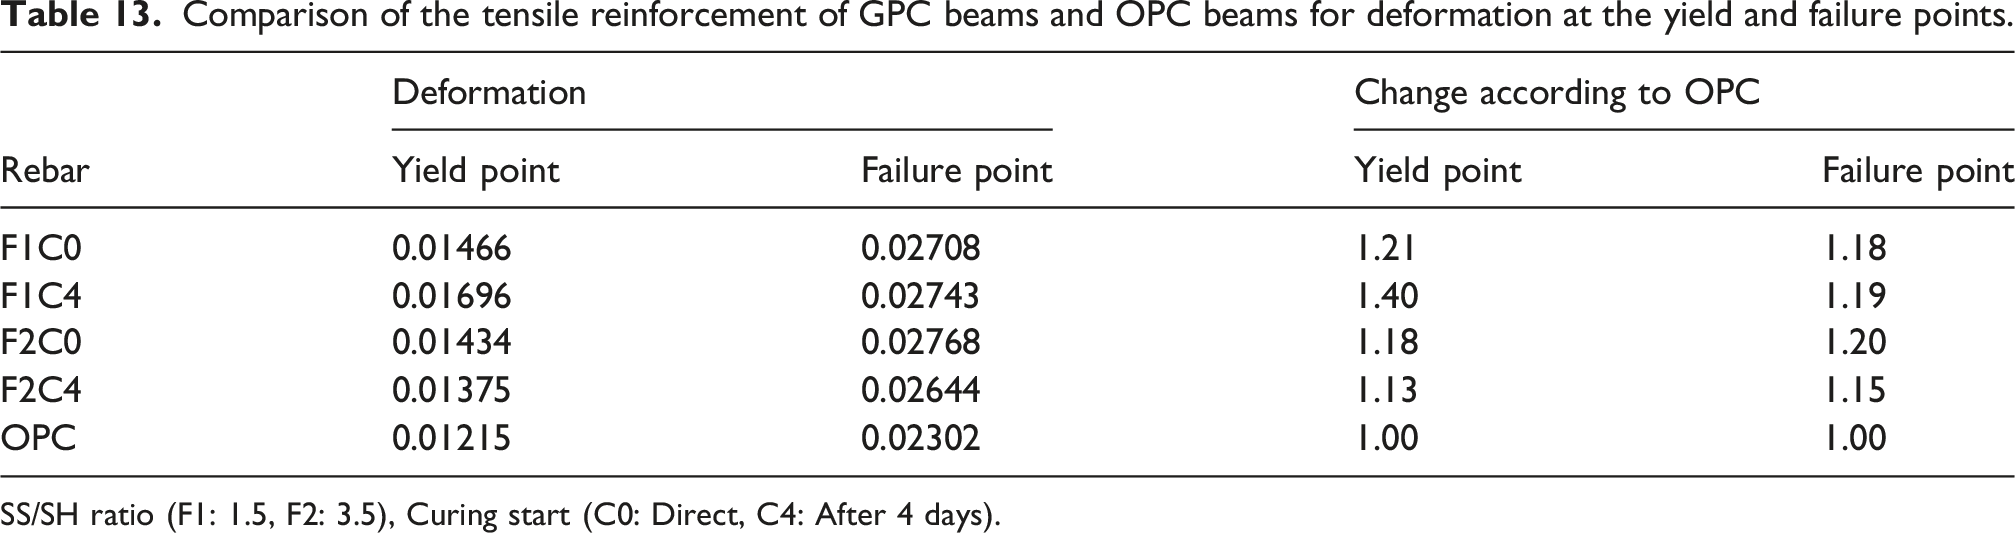
As presented in Table 11, the strain values of GPC tensile reinforcement were 23% higher on average at the yield point compared to OPC, exceeding the steel yield strain limit of 0.002 for B420 C steel. At the failure point, GPC reinforcement deformed 18% more than OPC. These differences are attributed to GPC’s lower elastic modulus, which requires greater deformation in concrete and reinforcement to achieve similar strength. Increasing the tensile reinforcement ratio reduced the reinforcement deformation rate for both GPC and OPC beams. Average failure strains were 0.027 for GPC and 0.023 for OPC, confirming that numerical results aligned with experimental findings.
Influence of SS/SH ratio and curing methods
Comparison of compression zone concrete of GPC and OPC beams for deformation at yield and failure points.
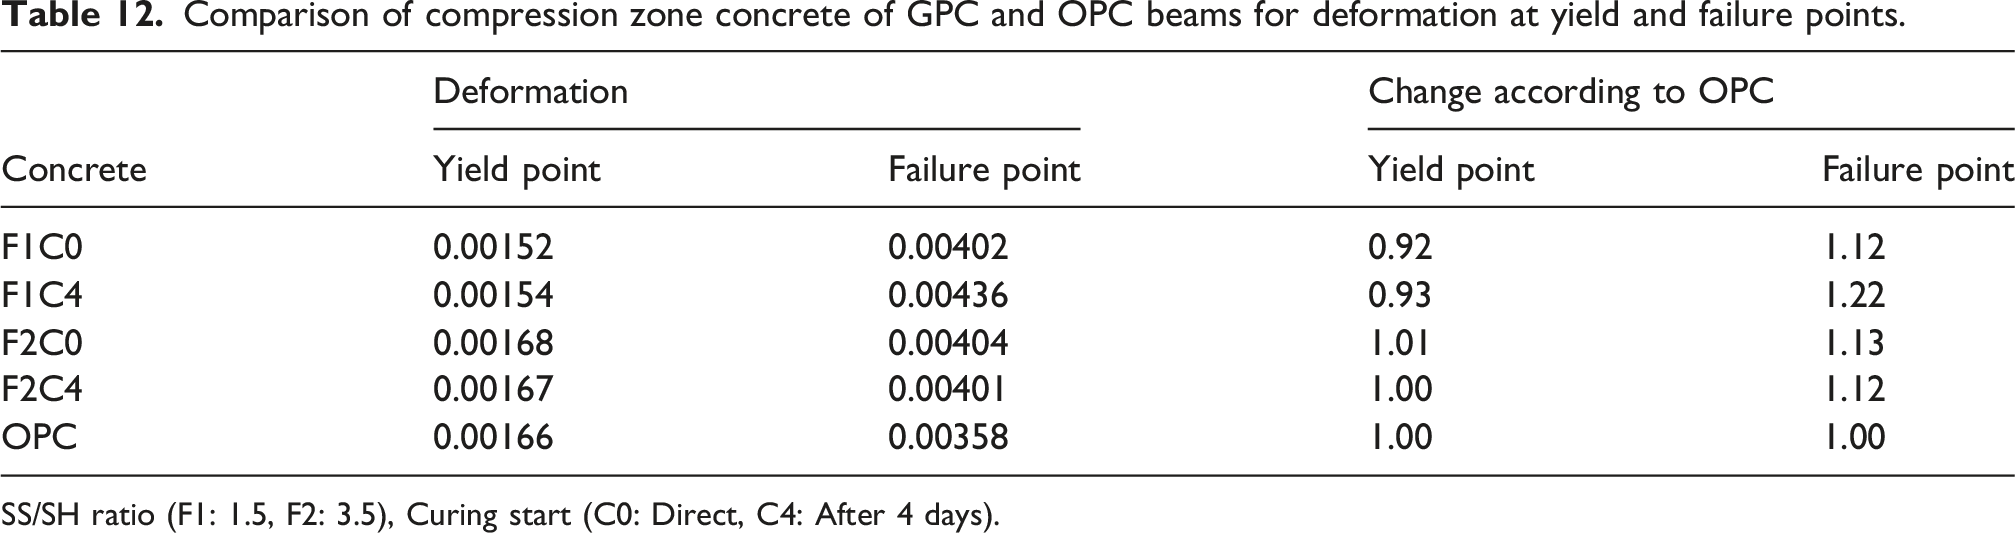
SS/SH ratio (F1: 1.5, F2: 3.5), Curing start (C0: Direct, C4: After 4 days).
Comparison of the tensile reinforcement of GPC beams and OPC beams for deformation at the yield and failure points.
SS/SH ratio (F1: 1.5, F2: 3.5), Curing start (C0: Direct, C4: After 4 days).
For tensile reinforcement (Table 13), the maximum differences were 23% at the yield point and 5% at the failure point, with yield point differences attributed to SS/SH ratio variations. Besides, the SS/SH ratio increases, and the deformation at the reinforcement yield point decreases. When comparing curing methods, for samples with an F1 mix ratio, reinforcement deformation increases at both the yield and failure points with the C4 curing method, whereas for samples with an F2 mix ratio, a decrease is observed with the C4 curing method. Therefore, the SS/SH ratio was the primary factor contributing to reinforcement deformation. The curing method also played a role. Thermally cured beams with a higher SS/SH ratio (F2C4) displayed enhanced deformation behavior, reflecting increased bending capacity and energy absorption. While GPC and OPC beams exhibit comparable strength and bearing capacity, their deformation behavior differs due to the lower elastic modulus of GPC. This increases deformation demands, particularly in GPC’s compression zone and tensile reinforcement. These differences align with previous research findings (Özbayrak et al., 2024b). Evaluating GPC using current reinforced concrete design specifications may be inadequate, as elastic modulus variations affect critical parameters such as stress block properties, balanced reinforcement ratios, and dynamic responses. Therefore, design calculations should incorporate these deformation-related differences, particularly inelastic behavior.
Evaluation of the results for GPC and OPC beams
The comparative evaluation of GPC and OPC beams based on tensile reinforcement ratios, GPC formulations, and curing methods reveals significant differences in strength, behavior, and deflection. Key results and interpretations are summarized below.
Tensile reinforcement ratio effects
(1) (2) (3)
Load-displacement behavior
GPC and OPC beams exhibit similar load values at yield and failure points across all tensile reinforcement ratios. However, deflection behavior varies with reinforcement ratios. (1) (2)
Influence of SS/SH ratio and curing methods
(1) According to Table 9, load-displacement differences between OPC and GPC beams remain within ±8%, demonstrating consistency between experimental and numerical results for failure analysis. (2) The SS/SH ratio and curing methods have a slight effect on deformation in both the concrete compression zone and the tensile reinforcement, as indicated by the numerical results from the failure analysis.
Deformation analysis
The concrete and reinforcement deformation behaviors were investigated in detail by using numerical data derived from ABAQUS software for failure analysis. (1) (2) (3)
Key behavioral differences
GPC beams exhibit higher deformation in both compression and tensile zones than OPC beams under similar loads, primarily due to GPC’s lower elastic modulus. Despite comparable strength, the deformation characteristics of GPC necessitate modifications to traditional reinforced concrete design parameters, such as stress block properties, balanced reinforcement ratios, and deformation limits. These findings underscore the need to adapt current reinforced concrete design specifications to account for the unique deformation and behavioral characteristics of GPC beams. By integrating these differences into design calculations, engineers can better harness GPC’s benefits in terms of ductility, energy absorption, and crack control, particularly for structures that require sustainable, high-performance materials.
Conclusion and recommendations
Conclusion
In this study, numerical models of 12 geopolymer concrete (GPC) and three ordinary Portland cement (OPC) reinforced concrete beams were developed and evaluated under varying parameters, including the SS/SH ratio, curing method, and tensile reinforcement ratio. Experimental flexural tests were conducted, and displacement responses were monitored using high-precision total station measurements. The experimental observations were compared with ABAQUS-based numerical analyses, with particular emphasis on load–displacement behavior at yield and failure stages to characterize inelastic deformation and damage progression. The close agreement between experimental results and numerical predictions confirms the reliability of the adopted failure analysis methodology.
Although GPC and OPC beams exhibited comparable ultimate strengths, significant differences were observed in their deformation demand and failure characteristics. GPC beams required higher deformation to reach similar strength levels due to their lower elastic modulus, leading to distinct inelastic response and damage development. Differences in crack initiation, propagation patterns, and crack widths were identified between the two material systems. The enhanced gel-based microstructure of geopolymer concrete improved the bond between reinforcement and concrete, resulting in more effective stress redistribution, increased formation of fine capillary cracks, and suppression of localized wide cracks that typically precede brittle failure.
The results further indicate that while the curing method alone did not directly govern the failure behavior, its combined interaction with the SS/SH ratio influenced the deformation capacity of concrete and reinforcement, as well as damage evolution. These interactions affected crack growth rates and stiffness degradation, highlighting the importance of mixture design parameters in controlling failure mechanisms.
From an engineering failure analysis perspective, the findings demonstrate that conventional reinforced concrete design assumptions may not fully capture the damage and failure characteristics of geopolymer concrete elements. In particular, the higher deformation demand and altered cracking mechanisms observed in GPC beams should be explicitly considered in design and assessment procedures to enhance damage control and prevent premature failure. Overall, geopolymer concrete has strong potential as an alternative structural material, offering comparable load-bearing capacity to OPC while providing improved crack distribution and stress transfer characteristics that are beneficial for failure mitigation and structural safety.
Recommendations
Based on the findings of this study, GPC beams can be considered as an effective alternative structural member to OPC beams when designed with appropriate reinforcement ratios and mix proportions. The results indicate that GPC exhibits higher deformation capacity and more distributed cracking behavior, which may contribute to improved damage tolerance. The enhanced microstructural characteristics and gel formation of geopolymer concrete also promote better interaction between reinforcement and concrete, reducing stress concentrations and limiting the formation of wide cracks. However, the present study is limited to monotonic loading conditions. For future research, it is recommended to investigate the behavior of GPC beams under cyclic and repeated loading, particularly to evaluate stiffness degradation, energy dissipation capacity, and hysteretic response. Such studies might provide further insight into the seismic performance and long-term structural reliability of GPC members. Additionally, future work might consider different reinforcement configurations, varying mix proportions, and extended durability assessments to enhance the applicability of GPC in structural design.
Footnotes
Acknowledgments
We would like to thank the Proofreading & Editing Office of the Dean for Research at Erciyes University for copyediting and proofreading service for this manuscript.
Author contributions
Funding
The authors disclosed receipt of the following financial support for the research, authorship, and/or publication of this article: This research was supported by TÜBİTAK (The Scientific and Technological Research Council of Türkiye) under Grant Number 121M236.
Declaration of conflicting interests
The authors declared no potential conflicts of interest with respect to the research, authorship, and/or publication of this article.
Data Availability Statement
The data that support the findings of this study are available from the corresponding author upon reasonable request.