
Abstract
Bridges are critical components of transportation infrastructure, yet many face structural and safety risks due to aging design and increasing traffic volumes. In Kansas, recent incidents involving vehicular collisions have highlighted the need for predictive frameworks that can proactively identify vulnerable bridges. This study introduces a multi-model framework for assessing bridge vulnerability under vehicular collision exposure by integrating crash, traffic, and structural datasets. An Occurrence Factor was calculated from crash frequency within spatial buffers (25–100 m), representing external risk, while internal resilience was modeled using sufficiency rating, age, and posted speed limits. Three analytical approaches: Rule-Based Scoring, Machine Learning (Random Forest and XGBoost), and Fuzzy Logic, were developed to compute Resilience Factors. A Hybrid model synthesized these outputs to derive a robust Heat Factor quantifying bridge-level vulnerability. Applied to 5638 bridges across Kansas, the framework produced consistent high-risk rankings and heatmap visualizations, revealing that structural resilience and collision exposure are largely independent. These findings support data-informed prioritization for inspection, retrofitting, and safety intervention.
Introduction
Bridge infrastructure plays a critical role in supporting transportation networks, economic activity, and public safety. In the United States and worldwide, thousands of aging bridges are subject to increasing loads, environmental stressors, and crash-related risks. Kansas state ranks 10 in the United States in the number of structurally deficient bridges (ARTBA Bridge Report, 2026). The change in load demands on bridges due to advancement in research that accurately estimates the loading as well as the development of nature of bridge use such as heavier vehicles and more commuters (Abdelkarim and ElGawady, 2017; Buth et al., 2011; El-Tawil et al., 2005; Salahat et al., 2023), imposes continuous upgrading and maintenance. Stakeholders in the transportation community, such as the Kansas Department of Transportation (KDOT), face growing challenges in prioritizing inspection, maintenance, and retrofitting efforts, especially given limited resources and diverse structural profiles.
While traditional bridge condition assessments and maintenance decisions rely on physical inspections and aggregate ratings, these approaches often fall short in capturing real-time risk and dynamic exposure, particularly the risk of vehicular collisions. The effect of vehicle collisions on bridge components and quantifying the Vehicular Collision Force (VCF) has been subject to recent research due to the catastrophic consequences of such events (Salahat, 2023; Salahat et al., 2023, 2024a, 2025). The risks of such events require a quantitative resilience index that accounts for design age, load demands on bridge components, structural health, and localized crash patterns. Therefore, addressing this gap needs novel modeling approaches that integrate structural data, crash history, and traffic volume, while offering scalable, interpretable, and data-informed risk metrics.
The intent of this study is to propose a comparative framework for evaluating bridge resilience against VCF and prioritizing maintenance actions across Kansas state bridges using multiple modeling strategies. The study considers Kansas State as the case to implement the proposed framework, however, the methodology that will be presented in this research is applicable when similar datasets to those used here are available. The study will leverage available bridge datasets for Kansas state as input for extracting related features. The extracted features will be subject to analysis and models training to develop insightful output.
Similar approach of operating on datasets and train models using machine learning techniques is used in recent studies that consider resilience of bridge infrastructures. Ventura et al. used artificial neural networks to predict the severity of exceeding design traffic loads on highway bridges to help road authorities traffic managements safeguard bridges from overloading risks (Ventura et al., 2024). Shaffiee Haghshenas et al. (2025) deployed hybrid machine learning models to predict the load crash severity and improve road safety assessment. Malekjafarian et al. (2019) proposed a two-stage machine learning approach for bridge damage detection. They measured the response of a passing vehicle to train a prediction model, then they deployed the prediction model to measure errors that were used as indicators to structural health.
To address the limitations of traditional assessment methods and enhance the precision of bridge risk evaluation, this study introduces a multi-model framework comprising four complementary approaches. First, a Rule-Based Scoring model is developed, leveraging expert-derived criteria to establish baseline resilience assessments. Second, a Machine Learning model is trained on integrated structural, traffic, and crash data to uncover complex, data-driven patterns associated with bridge vulnerability. Third, a Fuzzy Logic model is employed to accommodate uncertainty and ambiguity in qualitative expert judgments, especially where thresholds and classifications are not sharply defined. Finally, a Hybrid model combines the outputs of these three methodologies to derive a robust and interpretable Heat Factor, which quantifies bridge-level vulnerability to vehicular collision forces. This integrative approach not only captures the diverse dimensions of risk, from deterministic engineering assessments to data-informed predictions, but also enhances the credibility and adaptability of the proposed framework for use in real-world decision-making and infrastructure prioritization.
Similar to the approach followed by AASHTO on quantitatively evaluating the collision probability (American Association of State Highway and Transportation Officials, 2024), at the heart of our framework is a unified Heat Factor, which represents the vulnerability of a bridge by combining an occurrence factor (based on crashes and traffic volume) with a resilience factor (derived from structural sufficiency, age, and load demand indicators). All models were trained and evaluated using a comprehensive geospatial dataset of Kansas bridges (Kansas Maps and GIS Resources, 2026a), enriched with crash data, traffic exposure and speed limits (Kansas Maps and GIS Resources, 2026b). The goal is not only to assess model alignment but also to determine whether these approaches converge in identifying the state’s most critical bridge infrastructures under vehicular collision crash hazards.
The framework presented in this study offers critical value for policymakers, engineers, and city officials tasked with safeguarding public infrastructure and allocating limited resources efficiently. As aging bridge structures continue to face increasing demands from higher traffic volumes and heavier vehicles, the need for proactive, data-informed decision-making has become more urgent than ever. This research provides a scalable and adaptable toolset for identifying high-risk bridges based on a synthesis of structural, traffic, and crash-related indicators. By integrating rule-based logic, machine learning, and fuzzy modeling into a unified assessment strategy, the framework enables stakeholders to move beyond reactive maintenance toward strategic, evidence-based prioritization of retrofitting and inspection efforts. For policymakers, it offers a defensible, transparent methodology to support funding allocations and risk mitigation policies. For engineers and transportation planners, it provides technical insights into vulnerability patterns and asset performance. And for municipal leaders, it equips decision-makers with intuitive heatmaps and risk metrics that can be incorporated into broader urban planning, emergency preparedness, budgeting, and public safety agendas.
Datasets and integration
Main datasets categories
Datasets categories and description.
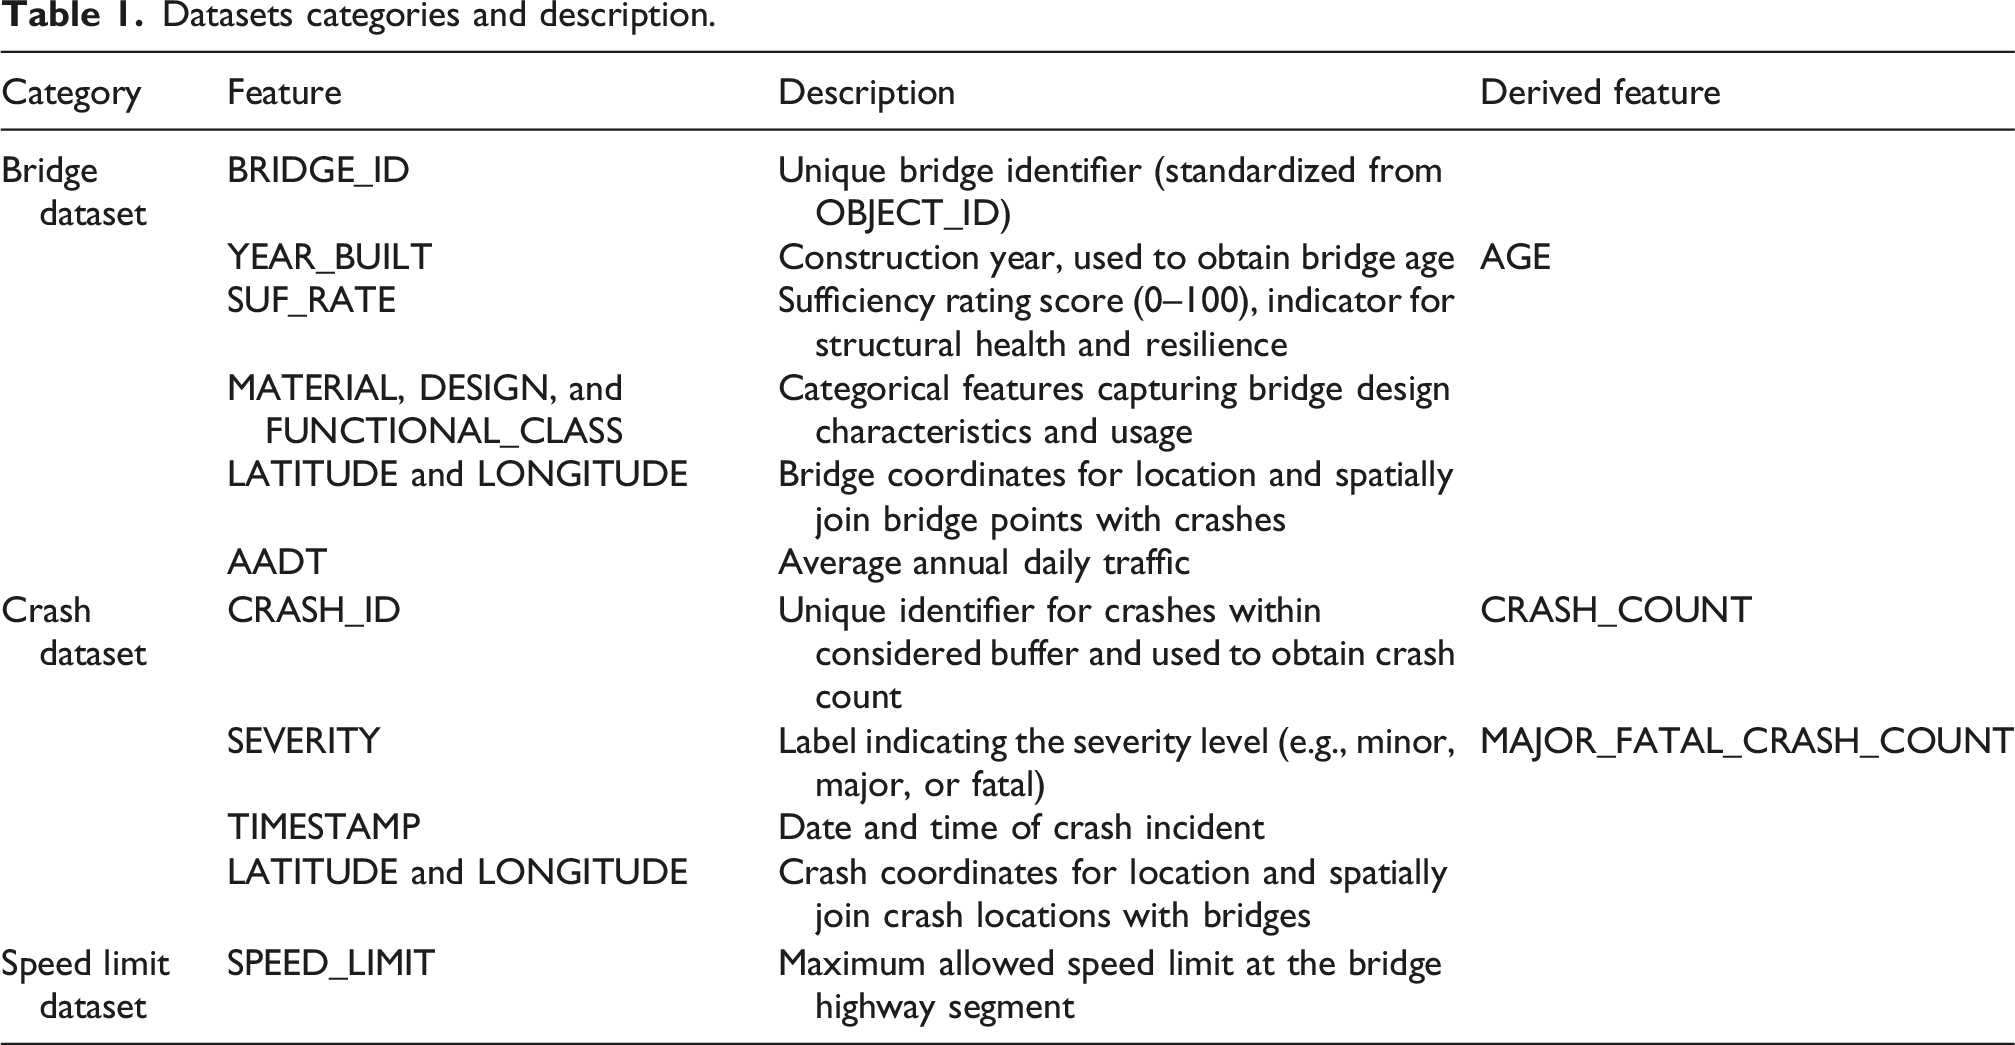
Finally, bridge locations were matched to nearby road segments through nearest-neighbor spatial association to obtain the corresponding SPEED_LIMIT value. This parameter served as an environmental risk indicator and was incorporated into the rule-based assessment (for defining safety zones) and the fuzzy inference model (as an input variable). The assigned values were visually verified using mapping outputs, and speed limits were categorized into qualitative ranges (e.g., low, medium, high) to support fuzzy membership definitions. All spatial processing procedures were carried out in Python using the GeoPandas and Shapely libraries.
Master dataset
A consolidated dataset was created by merging the three categories above. This master file forms the foundation of all modeling experiments and includes: (1) Structural variables: AGE, SUF_RATE, FUNCTIONAL_CLASS, DESIGN (2) Environmental attributes: SPEED_LIMIT (3) Engineered crash metrics: CRASH_COUNT, OCCURRENCE_FACTOR (per buffer size) (4) Derived outputs: Resilience Factor, Heat Factor (computed per modeling method)
The final dataset includes 5636 bridges, each with complete features needed for rule-based scoring, machine learning training, fuzzy inference, and hybrid aggregation. All data preprocessing, spatial joining, and modeling were conducted in a Jupyter Notebook environment. Key Python libraries used include GeoPandas, Scikit-learn, Shapely, and scikit-fuzzy. Full source code and data processing pipelines are provided in the supplementary materials to support reproducibility.
Descriptive analysis of the bridge dataset
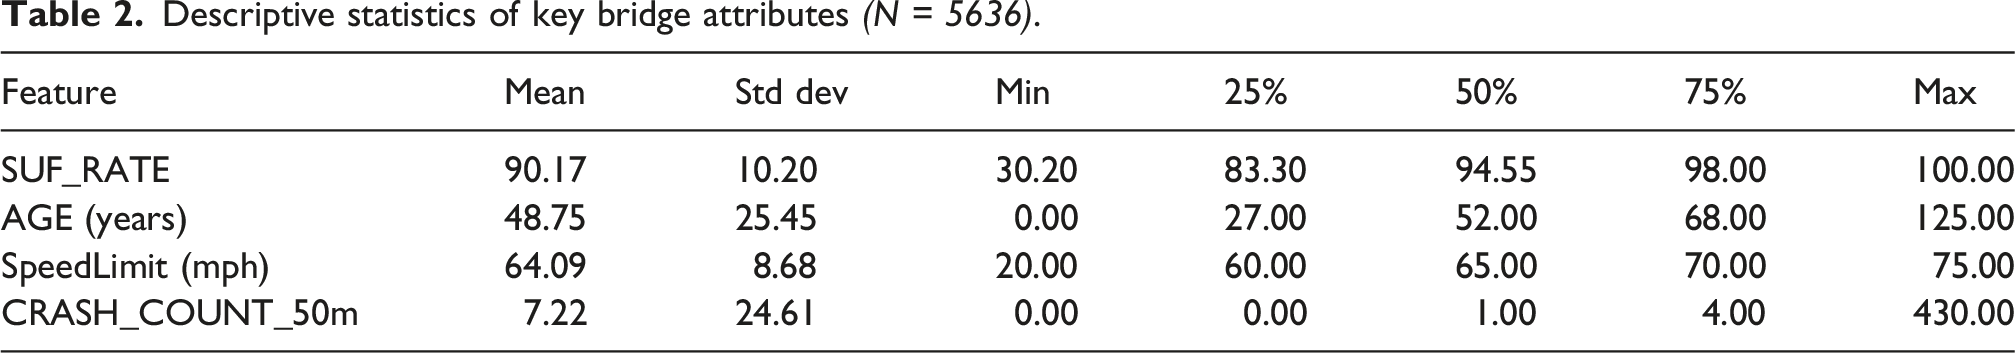
Descriptive statistics of key bridge attributes (N = 5636).
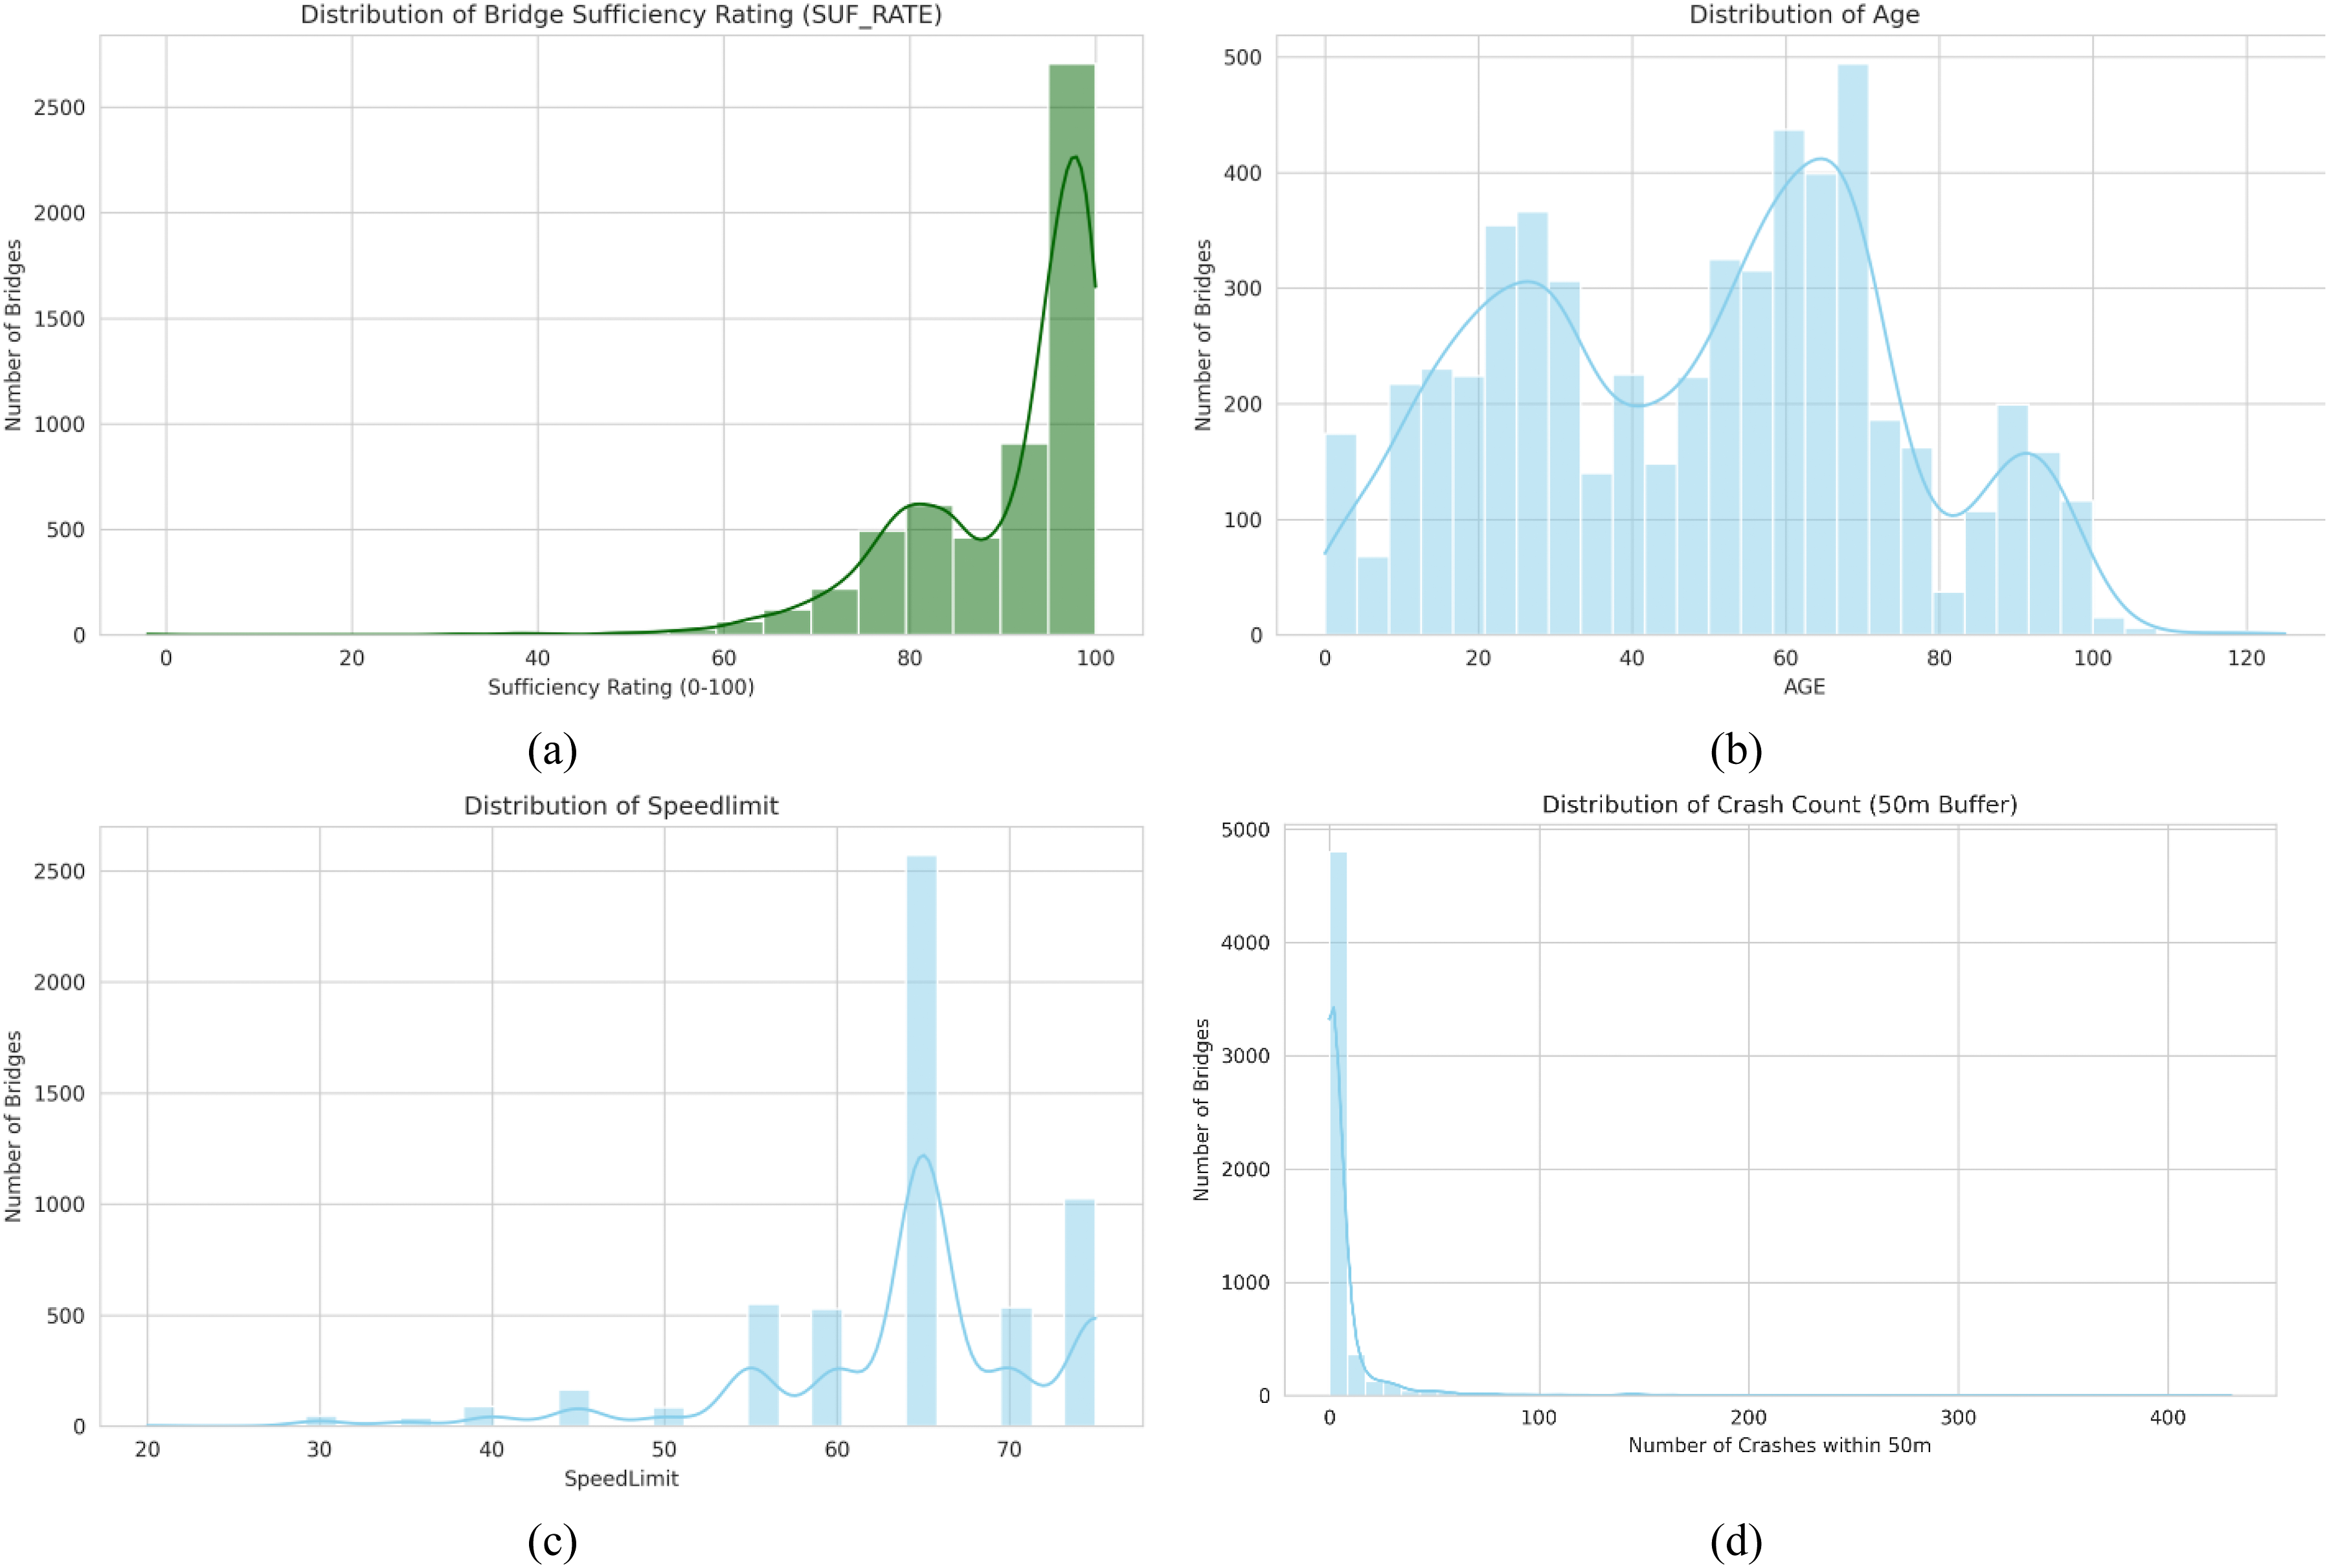
Description of datasets and visualization.
Crash-related variables reveal a highly skewed distribution: although the median number of crashes within a 50 m buffer is just 2, some bridges have recorded over 200 incidents. This indicates that a small subset of bridges accounts for a disproportionate share of crash risk, justifying the need for focused mitigation strategies.
Methodology
This study proposes a multi-model framework for assessing bridge vulnerability across Kansas state by quantifying two critical dimensions: external risk exposure and intrinsic structural resilience. These dimensions are systematically integrated to compute a composite risk score, referred to as the Heat Factor, which serves as a scalable and interpretable indicator of bridge-level vulnerability to vehicular collisions. The overall framework, illustrated in Figure 2, incorporates multiple resilience modeling approaches (Rule-Based, Machine Learning, and Fuzzy Logic) to obtain the Resilience Factor, a standardized Occurrence Factor based on crash exposure, and a final geospatial visualization layer shows the Heat Factor that is used for practical interpretation and infrastructure planning. Proposed framework.
As shown in Figure 2, this study introduces an innovative multi-stage pipeline that unifies diverse datasets and analytical models to reveal hidden vulnerabilities in bridge infrastructure. The framework begins by integrating three independent but complementary datasets including bridge inventory, crash records, and speed limits into a standardized and spatially aligned form. By applying spatial buffering (25–100 m), the framework quantifies localized crash exposure per bridge, capturing nuanced external risk conditions often overlooked in traditional assessments.
Through feature engineering, structural and traffic indicators such as age, sufficiency rating, crash density, and speed limit are transformed into meaningful variables. These are synthesized into a master dataset that feeds into a suite of analytical models, each capturing a different dimension of resilience: (1) A Rule-Based Model codifies domain expertise, (2) A Machine Learning Model uncovers non-obvious patterns, (3) A Fuzzy Logic Model handles ambiguity and threshold vagueness, and (4) A Hybrid Model aggregates their outputs to create a robust Heat Factor, reflecting bridge-level vulnerability.
What sets this framework apart is the dual-axis modeling of both Occurrence and Resilience Factors, enabling a precise Heat Factor Calculation that goes beyond structural sufficiency or crash frequency alone. This hybridized modeling approach, paired with spatial risk mapping, allows for the identification of clusters of structurally deficient or collision-prone bridges in a defensible, data-informed manner. In essence, the framework is considered innovative for several reasons. First, it includes an integrated model to combine crash density, structural indicators, and traffic context into a single vulnerability metric. Second, it leverages advanced AI techniques (e.g., ML and Fuzzy Logic) alongside rule-based logic to balance interpretability and precision. Third, it uses spatial analysis to localize risk, moving beyond aggregate bridge ratings to micro-level safety insights. Finally, it delivers a visual, actionable tool (i.e., Risk Map) that city officials, engineers, and policymakers can directly use for maintenance prioritization.
Heat factor calculation framework
The Heat Factor (HF) is computed for each bridge using equation (1)
The NOF captures external risk based on historical crash data and traffic exposure. It is computed using a spatial buffer (e.g., 50 m or 100 m) around each bridge to aggregate nearby crash counts and estimate local traffic volumes. Equation (2) gives the calculation of the occurrence factor.
Resilience Factor (RF) modeling approaches
The RF represents the intrinsic ability of a bridge to absorb or resist external stressors. It is modeled using three complementary strategies:
Rule-based scoring model

Resilience factor features and values.

The D score incorporates two reference years: 1998 and 2012. These thresholds correspond to changes in design practice established by AASHTO (American Association of State Highway and Transportation Officials, 2024). Bridges designed before 1998 were not required to consider vehicular collision force (VCF) as a governing limit state. From 1998 to 2012, the prescribed collision design force was 1780 kN (400 kips), while structures designed after 2012 were required to resist an increased force of 2670 kN (600 kips). The S score represents the demand imposed on bridge components during a vehicular impact. Its formulation is based on the principles used in the Manual for Assessing Safety Hardware (MASH) (American Association of State Highway and Transportation Officials, 2016), which designs protective concrete barriers for bridge elements. In MASH, crash severity depends on the impacting vehicle mass, velocity, and impact angle; therefore, greater speeds correspond to greater structural demand. The adopted scoring framework relies on predefined thresholds derived from engineering judgment, allowing the model to remain transparent and interpretable.
Machine learning model
In this approach, a Random Forest regression model (Ashqar et al., 2021; Salahat et al., 2024b) was developed to estimate bridge sufficiency ratings based on the available input attributes. The resulting predicted SUF_RATE values were subsequently converted into an Resilience Factor (RF) using the same classification thresholds applied in the rule-based framework. By relying on an ensemble learning algorithm, the method captures complex nonlinear dependencies and interactions among structural characteristics and surrounding contextual factors automatically.
Fuzzy logic model
The fuzzy logic framework incorporates rule sets derived from expertise together with linguistic classifications to represent uncertainty and gradual variation in bridge properties (Adhikari and Li, 2013; Celikyilmaz and Türksen, 2009). Instead of discrete categories, the approach yields a continuous Resilience Factor ranging from 0 to 1, allowing a more refined assessment of structural condition. The flow of the machine learning and fuzzy logic is shown in Figure 3. Machine learning and fuzzy logic process flow.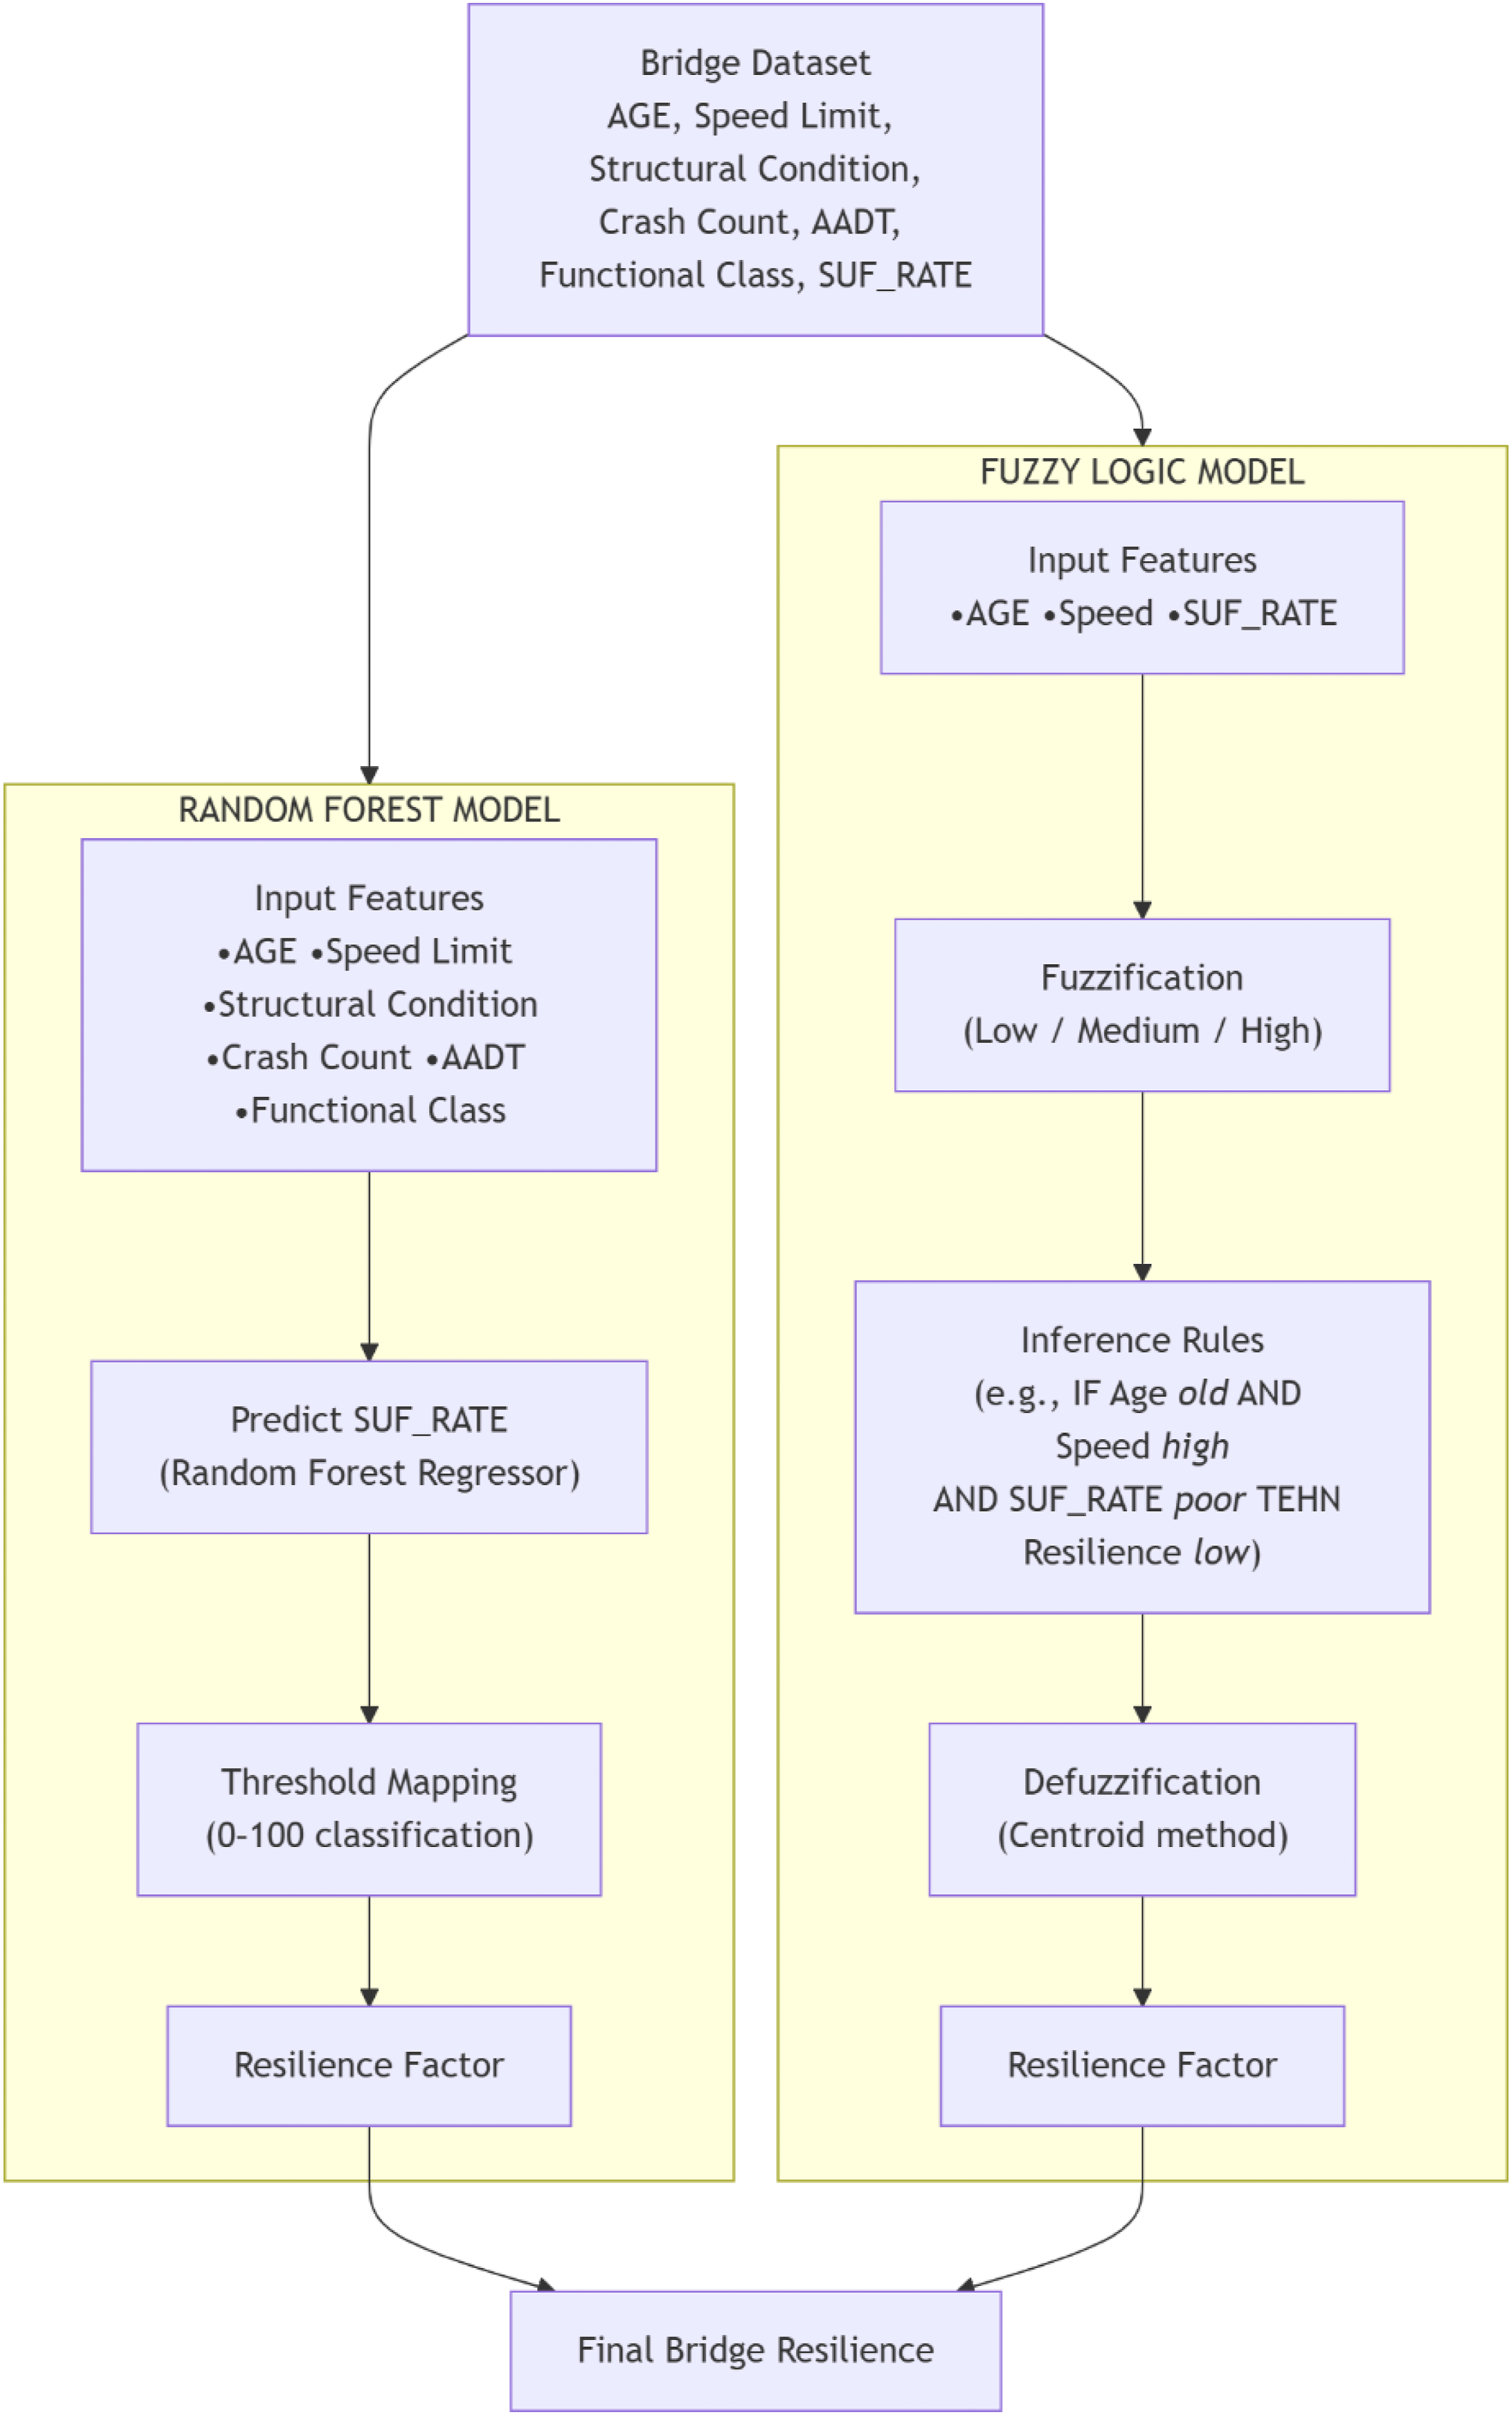
Hybrid model aggregation
To reduce bias and increase reliability, a Hybrid Model is constructed by averaging the Heat Factors produced by the three modeling approaches as shown in equation (4).
Model evaluation and visualization framework
To assess the consistency, robustness, and practical utility of the proposed bridge vulnerability framework, a comprehensive evaluation strategy was implemented. This included comparative analysis across models, sensitivity testing of key parameters, and visual inspection of geospatial risk patterns.
Comparative evaluation of modeling approaches
To compare the outputs of the Rule-Based, Machine Learning, Fuzzy Logic, and Hybrid models, all Heat Factor scores were standardized using a 50-m crash buffer and merged into a unified dataset indexed by BRIDGE_ID.
The evaluation included: (1) Descriptive Statistics: Mean, median, and standard deviation were computed for Resilience and Heat Factors across all models. (2) Distributional Analysis: Histograms and density plots were generated to visualize score distributions and detect skewness or outliers. (3) Inter-Model Agreement: Pairwise scatter plots with R2 values were used to quantify correlations between Heat Factor scores from different models. (4) Correlation Matrix: Pearson correlation coefficients were visualized in a heatmap to assess overall consistency and alignment among resilience and heat scores.
This multi-level evaluation revealed complementary strengths among the modeling approaches and validated the utility of the Hybrid model in smoothing individual model biases.
Sensitivity analysis and buffer justification
To evaluate the robustness of the Occurrence Factor component, spatial buffer distances of 25 m, 50 m, 75 m, and 100 m were tested around each bridge. This sensitivity analysis aimed to assess how varying the buffer radius influences crash count metrics, exposure coverage, and ultimately bridge vulnerability rankings.
As shown in Figure 4, crash counts across different buffer sizes exhibited very high inter-correlations (Pearson’s r > 0.94), particularly between the 50 m buffer and both its adjacent values (25 m and 75 m). This indicates that a 50-m buffer offers a statistically representative and spatially balanced view of crash exposure—capturing sufficient incident density without broadening the area of influence. Correlation matrix of structural, environmental, and exposure features across multiple spatial buffer radii (25–100 m). Strong correlations between buffer-specific crash metrics support the use of a 50 m buffer. Weak correlations between SUF_RATE and crash-related variables affirm the independence of internal and external risk components.
Sensitivity analysis of crash buffers.
These findings support the methodological choice of the 50-m buffer for all subsequent modeling steps. This threshold delivers a practical balance between local specificity and data richness, ensuring that exposure metrics are both statistically valid and spatially meaningful.
Geospatial heatmap visualization
As a final step in the vulnerability assessment framework, a geospatial heatmap was generated to support visual validation and interpretation of bridge-level risk across Kansas. The map was created using the Folium library and integrates each bridge’s computed Heat Factor.
Bridges were color-coded according to their Heat Factor quantile to facilitate intuitive interpretation including low risk as green, medium risk as orange, and high risk as red. This visualization enabled the identification of spatial clusters of high-risk infrastructure and supports decision-making related to targeted inspections, upgrades, or maintenance planning. The heatmap also serves to validate the distribution of model outputs within a real-world geographic context.
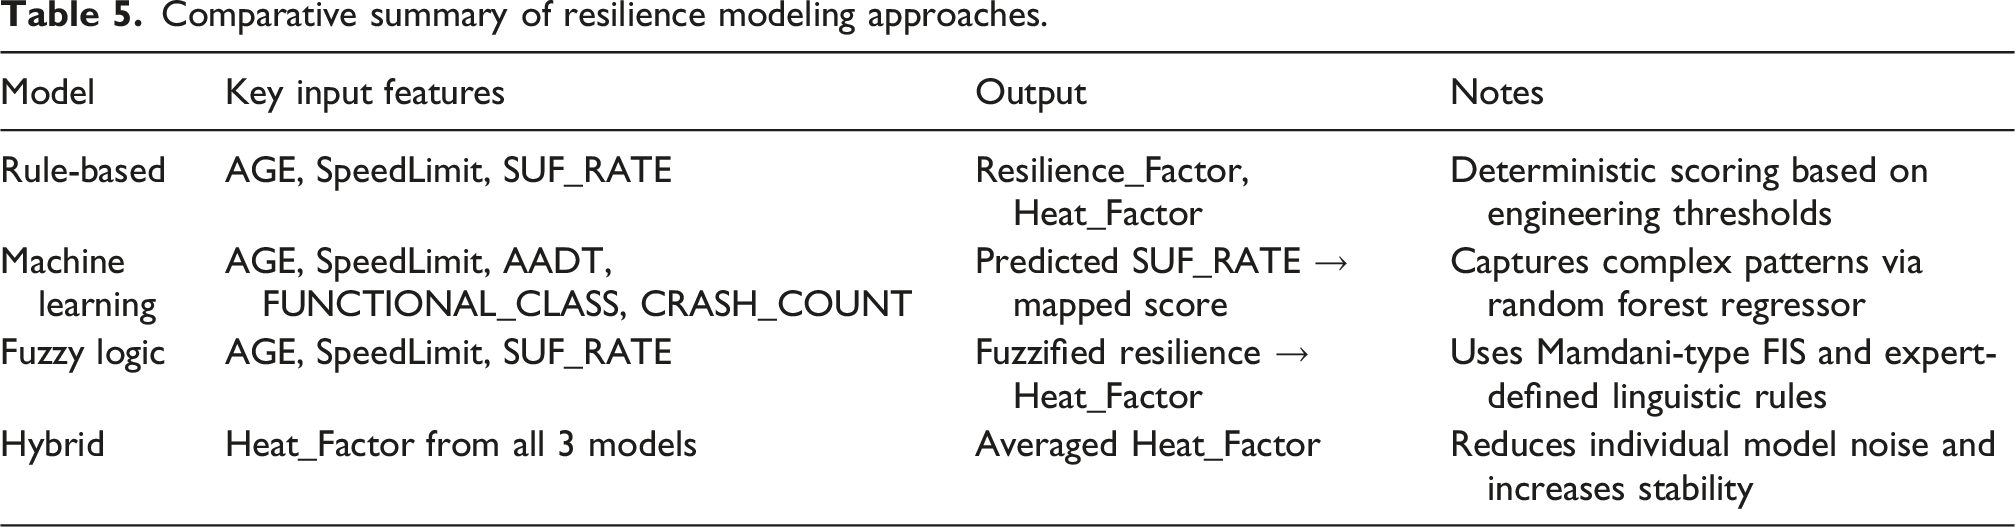
Comparative summary of resilience models
Comparative summary of resilience modeling approaches.
Implementation of prediction models
This section presents the technical implementation of the four modeling approaches used to generate bridge vulnerability scores: Rule-Based, Machine Learning, Fuzzy Logic, and Hybrid Models. Each model outputs a Heat Factor value used to prioritize bridges for maintenance or retrofit.
Rule-based Modeling
The Rule-Based model calculates Resilience Factor scores using an interpretable scoring system based on construction year, posted speed limit, and SUF_RATE. The scoring logic was implemented as a deterministic rule engine using Python. For operational consistency: (1) Missing values were imputed with neutral scores (e.g., 0.5). (2) Component scores were averaged equally without weighting. (3) Classification into risk categories (Good, Rehabilitation, Replacement, Failed) was automated for visualization and tabulation.
The Resilience Factor was then incorporated into the Heat Factor computation using the precomputed OCCURRENCE_FACTOR within a 50-m crash buffer. Each variable was discretized into three categories (e.g., SUF_RATE: Poor < 50, Fair 50–79, Good ≥ 80), and corresponding resilience scores (0.3, 0.6, 1.0) were assigned. These thresholds were derived from engineering standards and prior research on structural sufficiency.
Machine learning-based modeling
To complement rule-based and fuzzy logic approaches, a supervised machine learning strategy was implemented to predict bridge structural health, represented by the Sufficiency Rating (SUF_RATE). This prediction enabled automated estimation of each bridge’s Resilience Factor, which, combined with crash exposure data, produced the final Heat Factor used in vulnerability assessment.
Modeling framework
The modeling task was structured as a regression problem, with SUF_RATE (a continuous value between 0 and 100) as the target variable. A Random Forest Regressor and an XGBoost Regressor were evaluated using the same preprocessing and training pipeline to identify the most suitable model for this context. The final pipeline was built using the scikit-learn and XGBoost libraries and executed in a Python environment.
Feature selection and preprocessing
The input data was drawn from the consolidated master dataset of 5619 bridges, which included structural, environmental, and crash-related attributes. To prepare the data: (1) Records with missing SUF_RATE values were removed. (2) Identifier and geospatial fields (e.g., geometry, BRIDGE_ID) were excluded from model inputs. (3) Numerical features (e.g., AGE, AADT, crash counts) were standardized using z-score scaling. (4) Categorical features (e.g., FUNCTIONAL_CLASS, DESIGN) were encoded via one-hot encoding. (5) Features with low variance or more than 80% missing data were excluded automatically.
This step ensured that the final dataset used for modeling was clean, interpretable, and reproducible. The final feature set included a mix of structural characteristics, traffic exposure metrics, and spatial context variables.
Model training and evaluation
The dataset was randomly split into 80% for training and 20% for testing, using a fixed seed (random_state = 42) to ensure reproducibility. Two ensemble models were evaluated including Random Forest Regressor (n_estimators = 100, n_jobs = −1), and XGBoost Regressor (n_estimators = 100, objective = ‘reg:squarederror’). Each model was wrapped in a pipeline that included preprocessing, imputation, and encoding steps to maintain consistent handling of missing values and data types. Performance on the test set was evaluated using Mean Absolute Error (MAE), Root Mean Square Error (RMSE), and Coefficient of Determination (R2). The Random Forest Regressor achieved slightly better performance (e.g., R2 ≈ 0.79) and was selected as the final model for prediction.
Post-processing and resilience calculation
Predicted SUF_RATE values for each bridge were clipped to the range [0, 100] to ensure validity, and were also normalized to a [0, 1] scale to derive a Resilience Factor. Each bridge was also assigned a qualitative resilience class based on the normalized Resilience Factor including Good (≥ 0.8), Rehabilitation (0.5–0.79), Replacement (0.3–0.49), and Failed (< 0.3). These categories mirrored engineering practice and supported downstream visualization and analysis.
Heat factor computation
The Resilience Factor was then combined with the 50-m crash-based Occurrence Factor to compute each bridge’s Heat Factor using equation (1). This Heat Factor allowed bridges to be ranked by vulnerability, with higher values indicating greater risk due to the combination of weak structure and high crash exposure.
Fuzzy logic modeling
To capture the nuanced and imprecise aspects of bridge vulnerability, a Mamdani-type Fuzzy Inference System (FIS) was developed to estimate a continuous Resilience Factor. This approach integrates expert knowledge and linguistic reasoning to assess structural strength based on uncertain or qualitative parameters. The output of this model is further used in computing a Heat Factor that quantifies bridge-level vulnerability to vehicular collisions.
System inputs and membership functions
Three input variables were selected for the fuzzy system based on engineering relevance and availability including AGE as the years since bridge construction, Speed Limit, which is the posted speed limit (mph), and SUF_RATE, which is the structural sufficiency rating (0–100), used as a proxy for physical condition.
Each input variable was fuzzified using triangular membership functions defined over empirically derived ranges. For instance, AGE was categorized as new, moderate, and old, while SUF_RATE was represented as poor, fair, and good. The consequent variable, Resilience Score, was defined over the interval [0,1] and divided into three fuzzy sets: low, medium, and high.
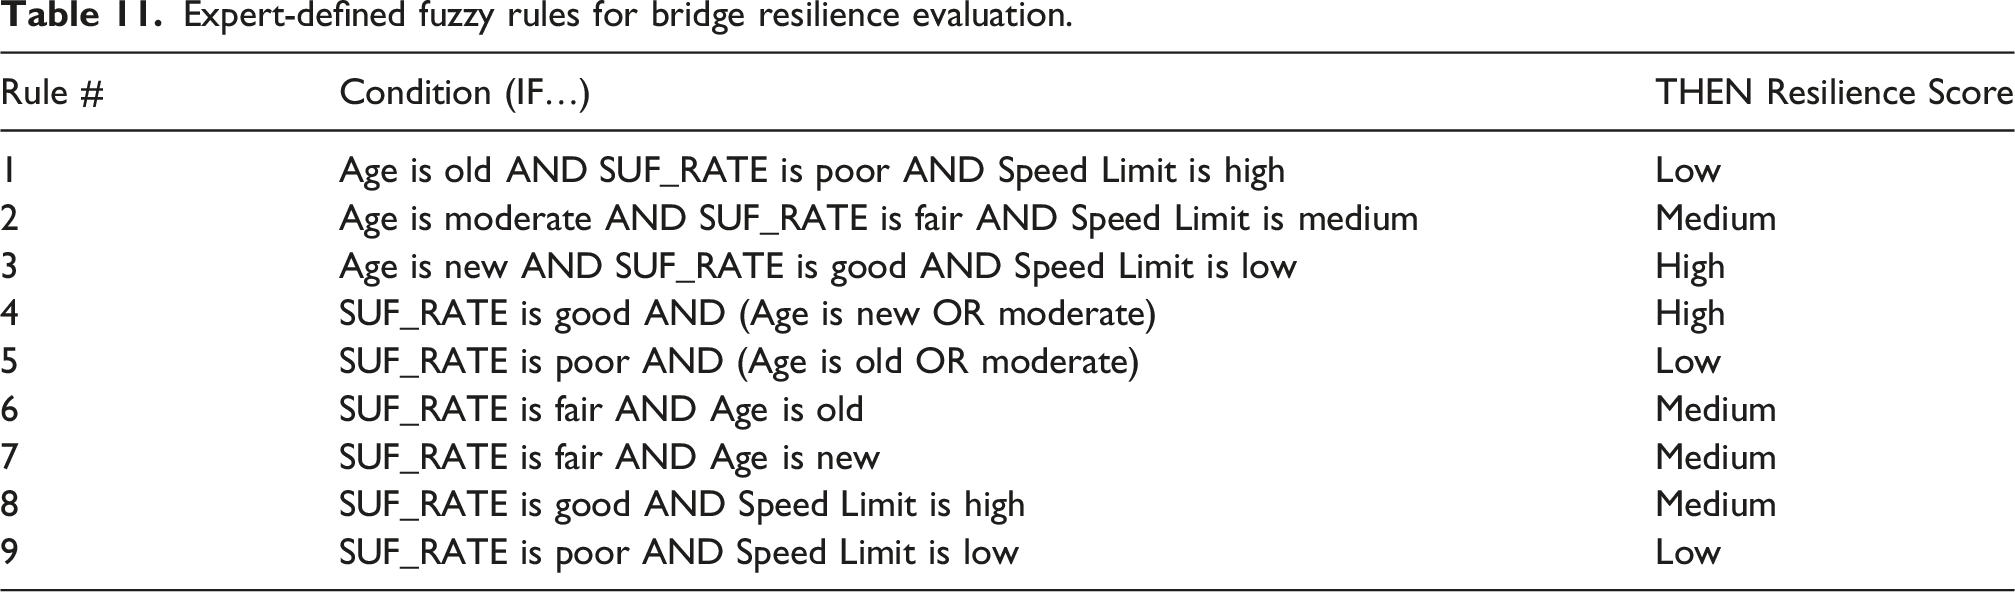
Rule base and inference
A total of nine fuzzy rules were developed based on domain expertise and simulated scenarios to capture the complex interactions among key structural variables. For example, a bridge with an old age, poor sufficiency rating (SUF_RATE), and a high-speed limit is classified as having low resilience. Conversely, a newer bridge with a good SUF_RATE and low speed limit is considered highly resilient. In cases where the sufficiency rating is fair, but the bridge is old, a medium resilience level is assigned. These rules were implemented using the skfuzzy. control module, and centroid-based defuzzification was applied to generate a crisp Resilience Factor ranging from 0 to 1 for each bridge.
Model execution and data integration
The fuzzy inference model was applied to a geospatially enabled master dataset comprising 5638 bridges across Kansas. To ensure compatibility with the model, missing values for key inputs such as age, speed limit, and sufficiency rating (SUF_RATE) were imputed using median values. For each bridge, input variables were processed through the FIS to compute a Resilience Score, which was then appended to the dataset. In cases where outputs could not be generated (i.e., typically due to edge-case inputs) the dataset-wide mean Resilience Factor was assigned to maintain consistency. The resulting continuous Resilience Factor, ranging from 0 to 1, was further categorized into four qualitative resilience classes: Good (≥ 0.80), Rehabilitation (0.50–0.79), Replacement (0.30–0.49), and Failed (< 0.30).
Hybrid modeling
To integrate the complementary strengths of the Rule-Based, Machine Learning, and Fuzzy Logic models, a Hybrid Modeling approach was implemented. This method combines individual Heat Factor values, derived from each model independently, to produce a unified Hybrid Heat Factor, offering a more robust and generalizable measure of bridge vulnerability across Kansas.
Data integration and preprocessing
The Hybrid model was constructed using a unified dataset containing spatial, structural, and risk-related variables for 5638 bridges. First, the following three model-specific outputs were loaded and merged with the master dataset: (1) Heat_RuleBased_50m and Resilience_RuleBased (2) Heat_MLBased_50m and Resilience_MLBased (3) Heat_Fuzzy_50m and Resilience_Fuzzy
All Heat Factor values correspond to a 50-m crash buffer, ensuring spatial consistency in exposure measurement.
During merging, bridge IDs were standardized to string format, and geometries were reconstructed from either WKT strings or latitude-longitude points. Missing values were handled using inner-merge joins, with fallbacks applied in subsequent steps.
For each bridge, the Hybrid Heat Factor was computed as the mean of all available Heat Factor values from the three models as shown in equation (4). If one or more Heat Factor values were missing, the average was computed using available values. Bridges lacking all three estimates were assigned the dataset-wide mean Hybrid Heat Factor to maintain comparability. This ensemble approach ensures robust ranking even when individual models diverge and supports broader generalization across different bridge conditions and exposure environments. If one or more values were missing, the mean was computed from the remaining available values (i.e., skipna = True).
Analysis and results
This section presents and interprets the outputs of the four resilience modeling approaches-Rule-Based, Machine Learning (ML), Fuzzy Logic, and Hybrid-used to assess bridge vulnerability across the state of Kansas. The models generate two key metrics for each bridge: the Resilience Factor, capturing internal robustness, and the Heat Factor, quantifying external vulnerability via crash exposure.
Rule-based model results
Descriptive statistics
Descriptive statistics of rule-based model outputs (n = 5636).
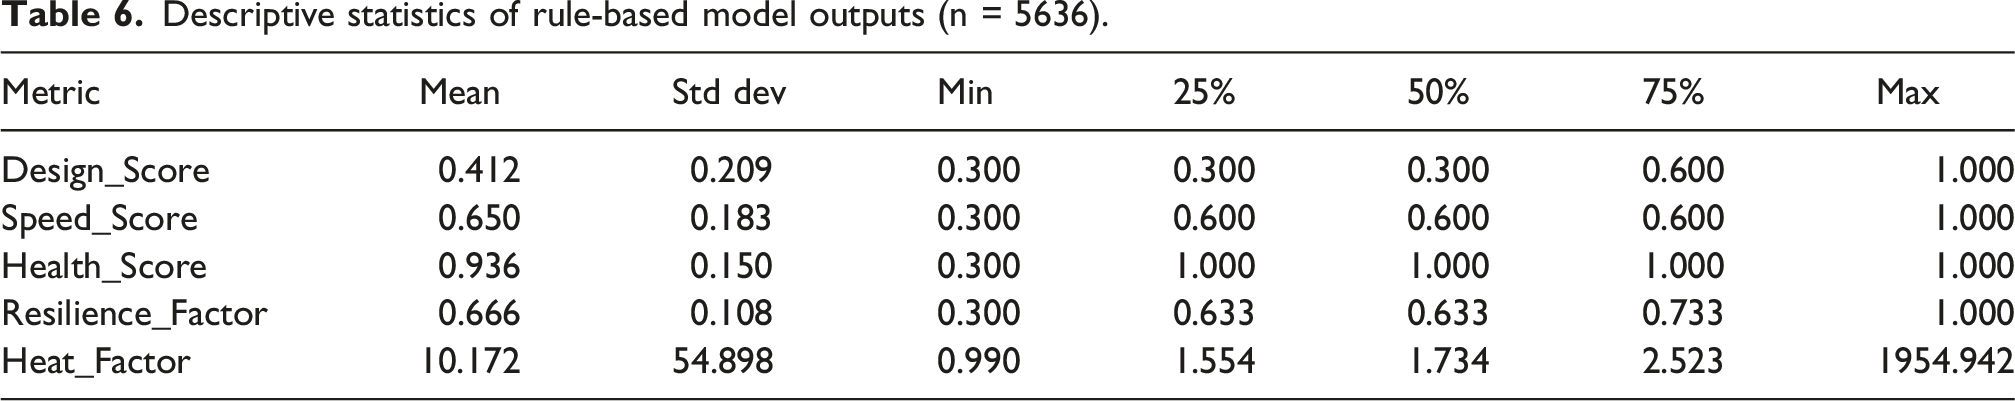
Most bridges have high Health Scores (mean = 0.936), indicating strong structural condition. However, low Design Scores (mean = 0.412) reflect aging infrastructure. The Heat Factor distribution shows significant skew, with a few extreme outliers indicating highly vulnerable bridges due to crash exposure.
Top ten most vulnerable bridges
Top 10 bridges by heat factor for rule-based model.
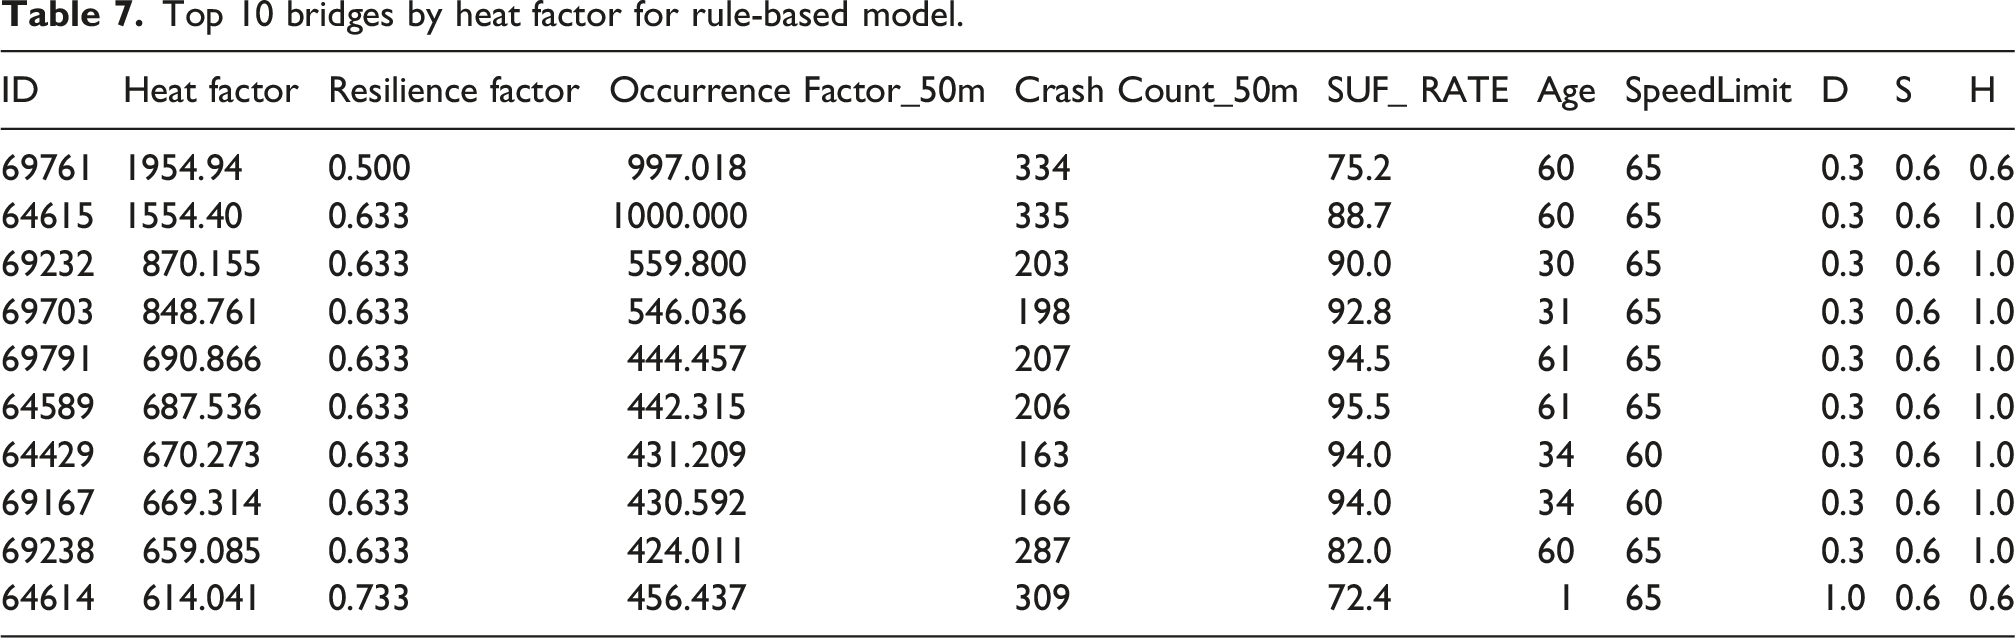
Bridge ID 69761 has the highest Heat Factor due to extremely high crash density near the structure (997 incidents within 50 m) and only moderate resilience. Most top-ranked bridges have good health (SUF_RATE > 80) but suffer from older design scores and high-speed environments, reducing their overall resilience.
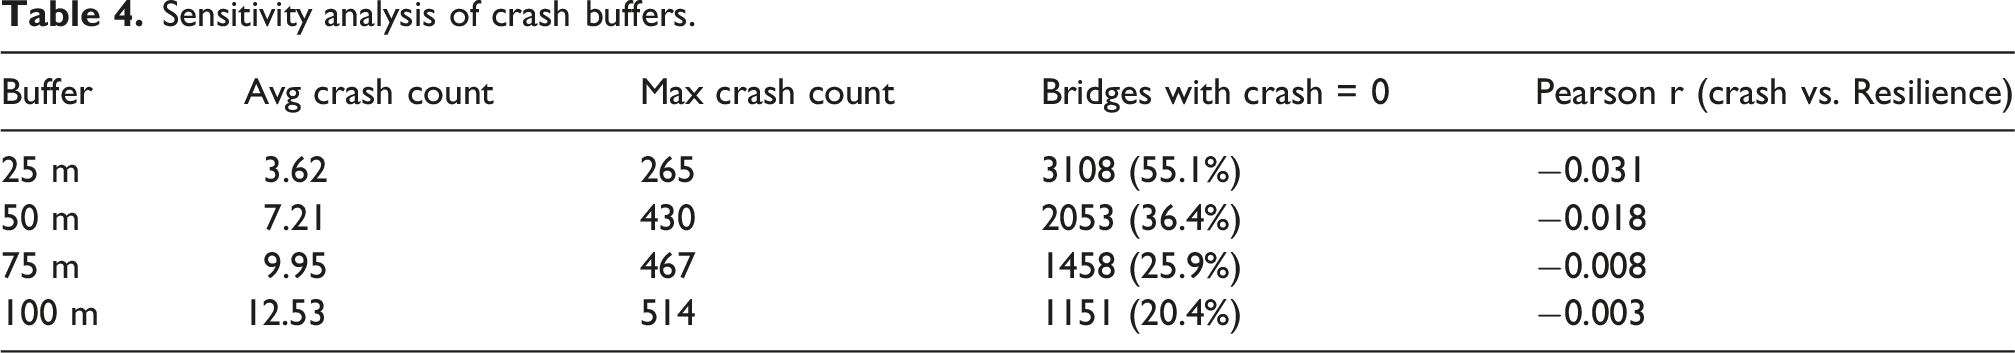
Sensitivity analysis across buffer radii
To assess how spatial scale affects crash exposure metrics, we recalculated crash counts and their correlation with resilience across four buffer distances: 25 m, 50 m, 75 m, and 100 m as shown in Table 4.
As the buffer increases, the average crash count also rises, and fewer bridges have zero incidents. However, the correlation between crash count and resilience is weakly negative and near zero at all distances, suggesting resilience (based on age, speed, and health) is not strongly predictive of crash frequency.
Machine learning-based model results
Performance metrics of ML models for SUF_RATE prediction.

Random Forest outperformed XGBoost across all metrics, with an R2 of 0.6824, capturing over 68% of the variance in SUF_RATE. Consequently, Random Forest was selected as the primary model for subsequent analysis.
Descriptive statistics
Descriptive statistics for ML-derived metrics.

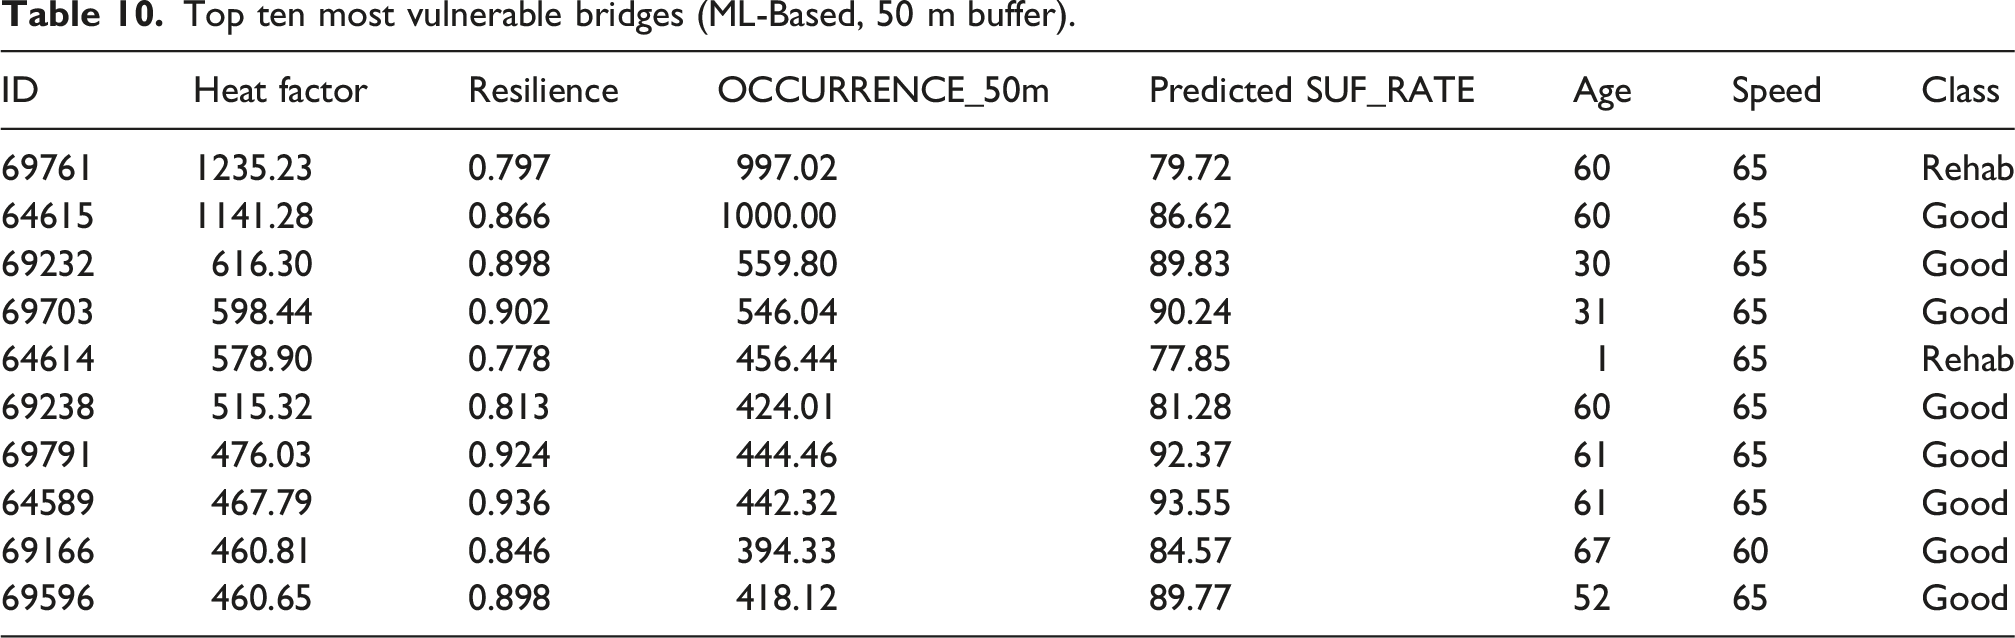
Top ten most vulnerable bridges
Top ten most vulnerable bridges (ML-Based, 50 m buffer).
Fuzzy logic model results
Fuzzy system initialization and data handling
The Fuzzy Logic model was applied to the master dataset comprising 5638 bridges across Kansas. Where geometric coordinates were missing or invalid, latitude and longitude values were used to reconstruct spatial positions. A Mamdani-type fuzzy inference system was initialized with three input variables including AGE, SpeedLimit, and SUF_RATE to generate a continuous Resilience Factor as output.
Expert-defined fuzzy rules for bridge resilience evaluation.
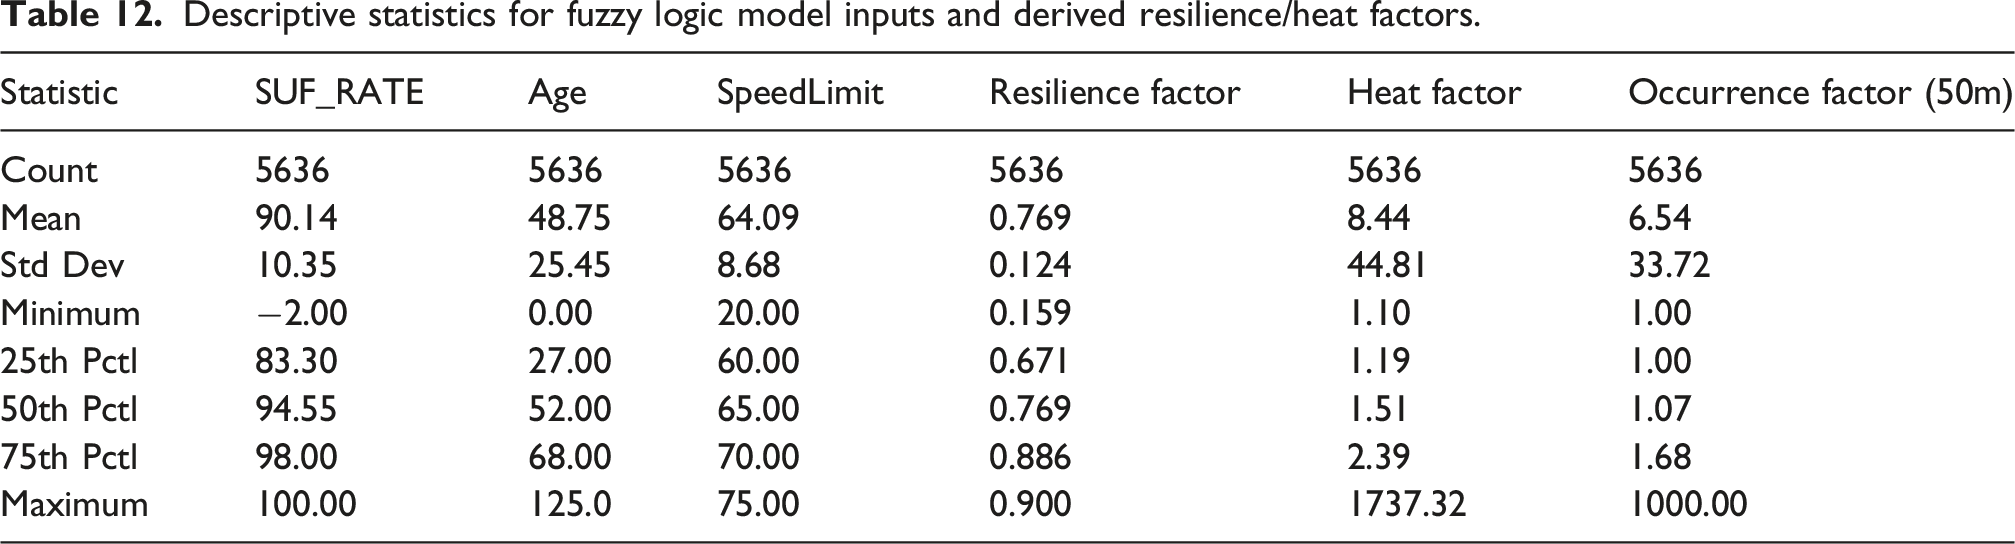
Descriptive statistics of fuzzy-derived metrics
Descriptive statistics for fuzzy logic model inputs and derived resilience/heat factors.
Top ten most vulnerable bridges (fuzzy model)
Top ten most vulnerable bridges ranked by heat factor (fuzzy logic, 50 m buffer).

Hybrid model results
Descriptive statistics of hybrid heat factor
Descriptive statistics for the hybrid heat factor (50 m buffer).

Top ten most vulnerable bridges (hybrid model)
Top 10 most vulnerable bridges based on hybrid heat factor (50 m buffer).

Inter-model correlation analysis and comparisons
The relationships between the Heat Factors derived from the Rule-Based, ML-Based, Fuzzy Logic, and Hybrid models were examined using Pearson correlation analysis These results are further visualized in Figure 5, which confirms strong agreement across models (r > 0.99), supporting the robustness of the Hybrid Heat Factor. Correlation matrix of Resilience and Heat Factors derived from Rule-Based, ML-Based, Fuzzy Logic, and Hybrid models (50 m crash buffer). The Heat Factors show near-perfect alignment (r > 0.99).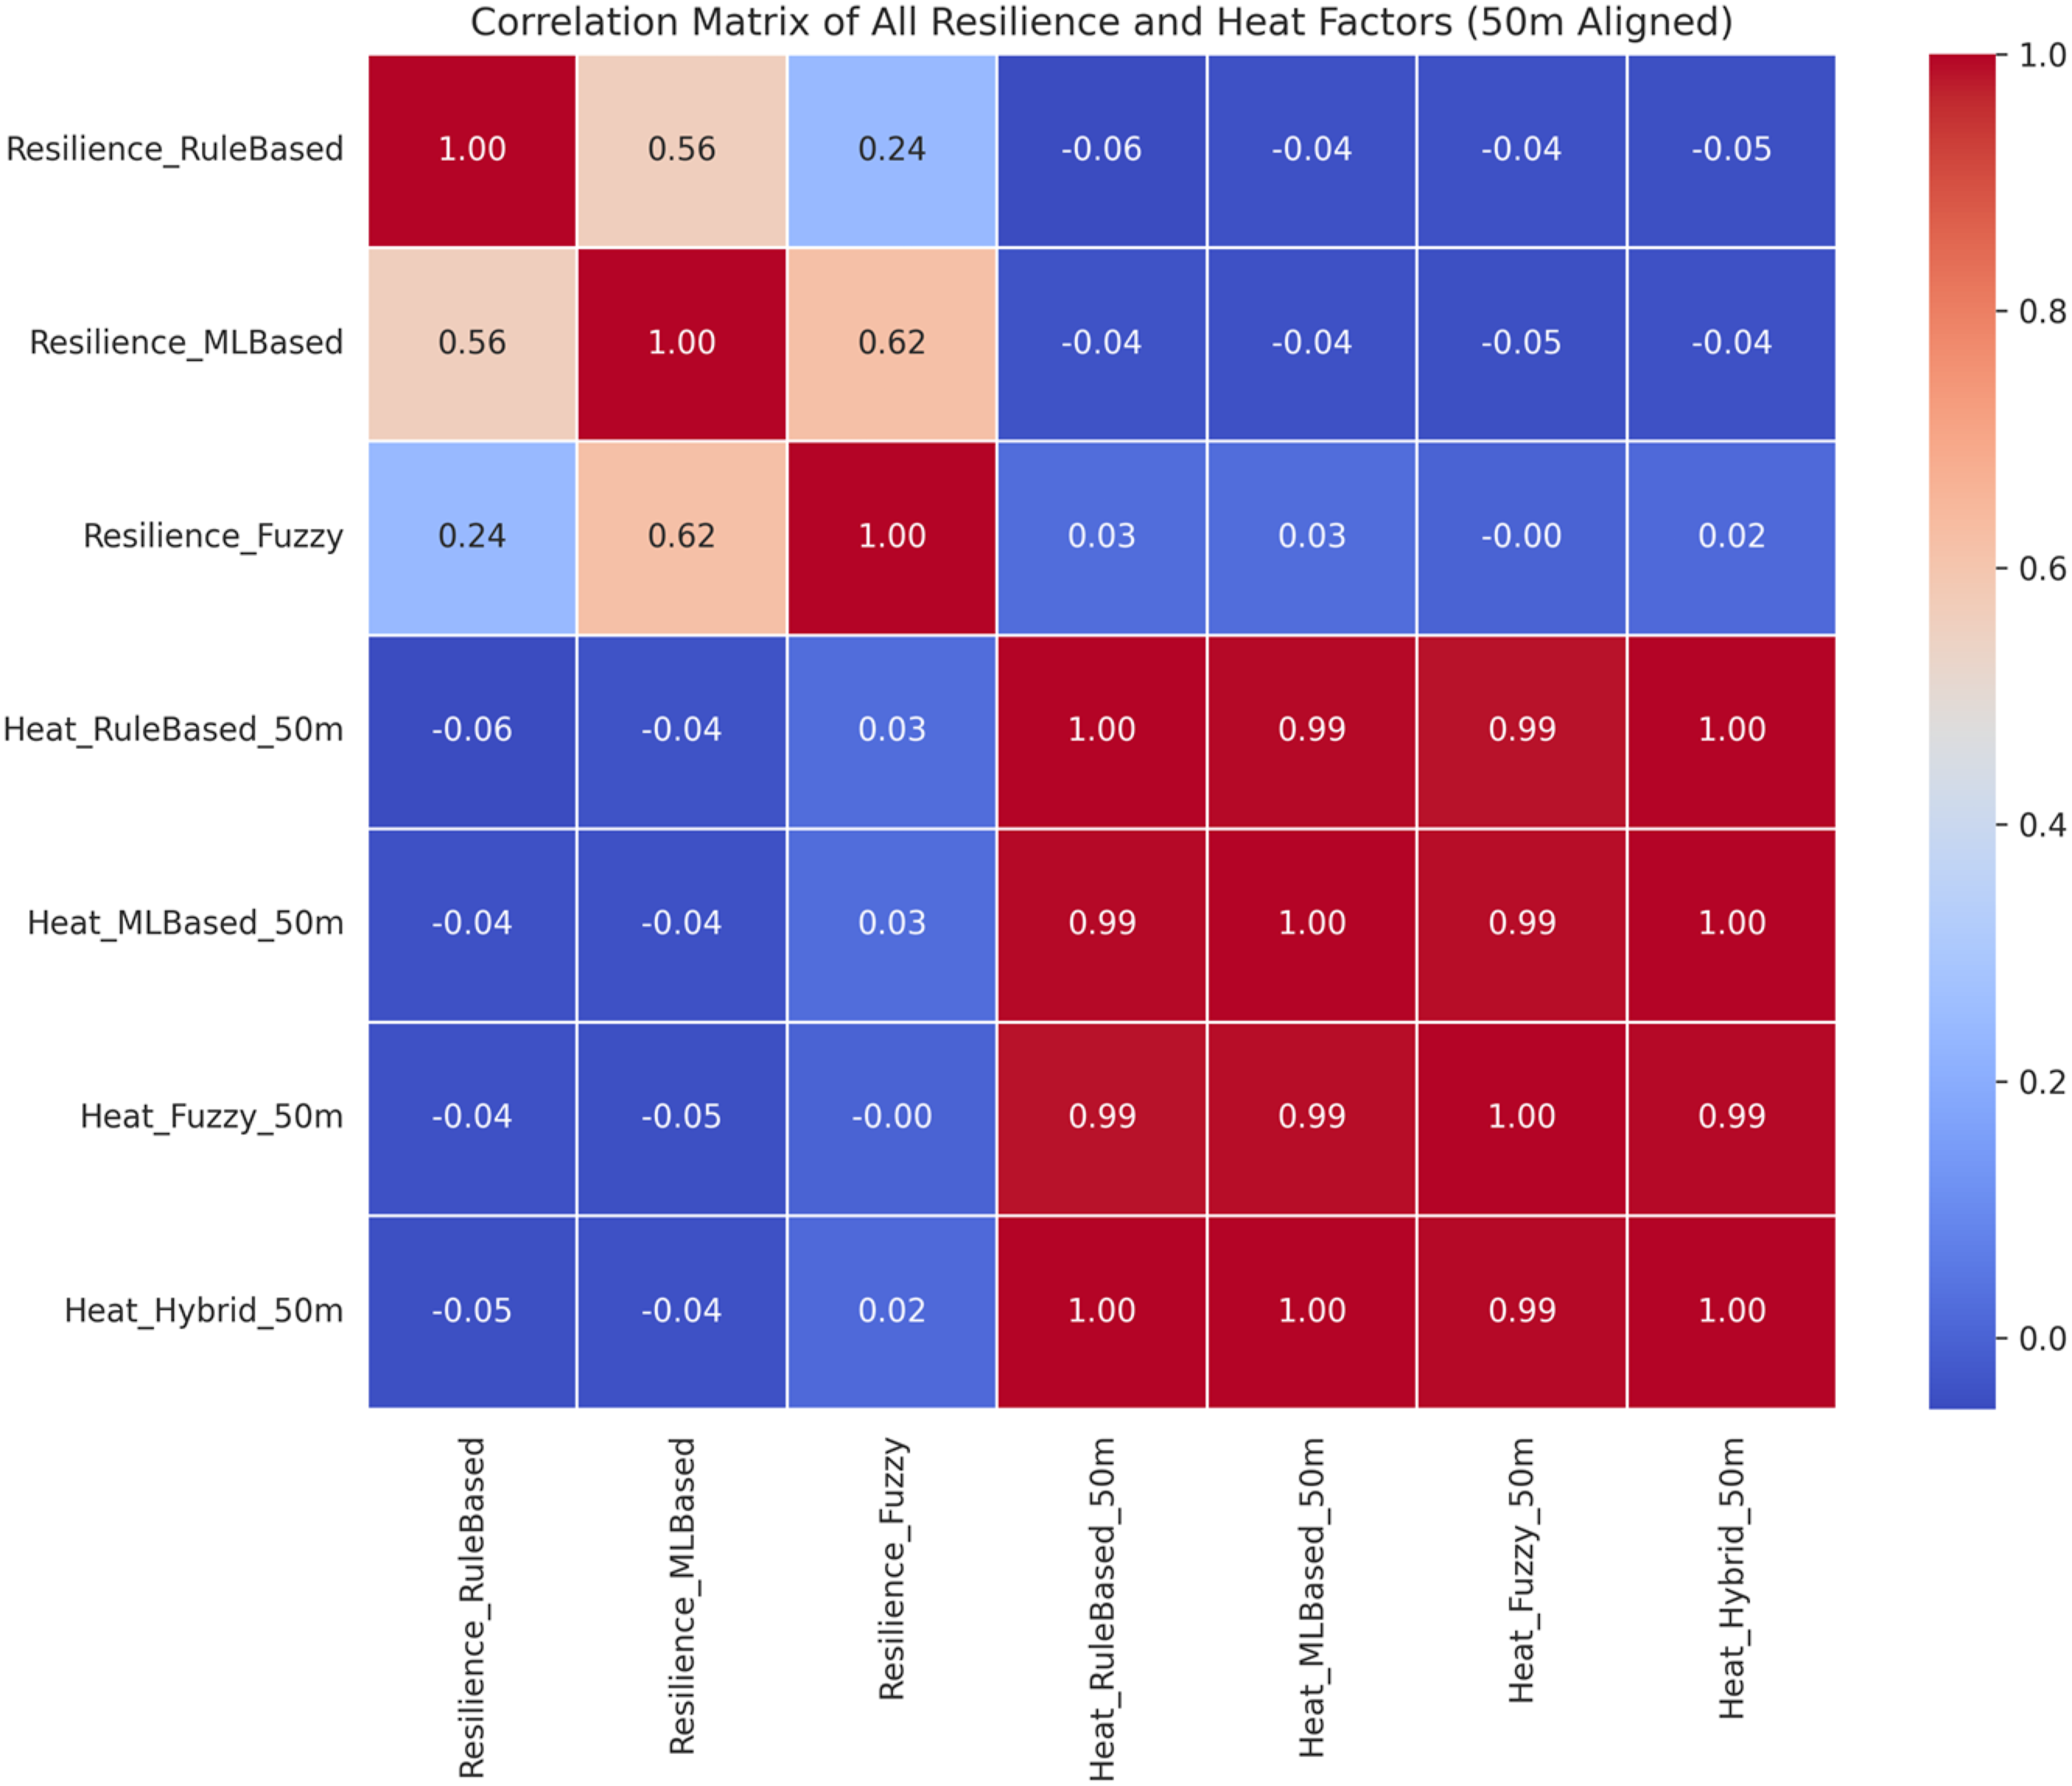
First 5 rows of merged comparative data across all models (50 m buffer).

Geospatial visualization of bridge vulnerability
To support spatial interpretation of the Heat Factor outputs, Figure 6 presents geospatial heatmaps for all four models using a 50-m crash buffer. Each bridge in Kansas is color-coded based on its calculated vulnerability level: green indicates low risk, orange denotes moderate risk, and red highlights high-risk structures. Geospatial risk Heatmaps of Kansas bridges based on heat factors (50 m Buffer) bridges are color-coded by vulnerability level: red (high risk), orange (moderate), green (low). (a) Rule-based modeling, (b) machine learning-based modeling, (c) fuzzy logic modeling, and (d) hybrid modeling.
The heatmaps reveal consistent clusters of red zones across models, particularly near major transportation corridors and urban centers such as Kansas City and Wichita. Notably, the Hybrid Model synthesizes insights from all individual approaches, producing a balanced and consensus-driven representation of vulnerability. This multi-model convergence enhances confidence in identifying bridges that warrant prioritized intervention.
A key insight from Figure 6 is that bridges along major transportation corridors are consistently identified as relatively higher vulnerability across all approaches. However, Figure 6(a), the Rule-Based model, shows sharper transitions between categories and assigns moderate vulnerability to a larger portion of highway bridges due to its reliance on fixed threshold criteria, leading to more abrupt spatial contrasts. In contrast, Figures 6(b)–5(d) exhibit more balanced and spatially continuous distributions. The Machine Learning, Fuzzy Logic, and Hybrid models smooth the classification boundaries by capturing feature relationships and effects, resulting in fewer abrupt shifts and a more proportionate distribution of moderate- and high-risk bridges. Overall, the Rule-Based model appears more threshold-sensitive, while the remaining three approaches provide more stable and evenly distributed geospatial risk patterns.
For example, Bridge ID 69761, Figure 7(a) and Bridge 64241, Figure 7(b) received the highest Heat Factors in the hybrid (Table 16) and the merged comparative (Table 17) due to the moderate resilience and elevated crash exposure. The authors used the spatial coordinates and Google Maps image to investigate the bridge; as shown in Figure 7, the structural deterioration of the bridge deck and bridge piers. Interestingly, some scratches, repairs, and paints were observed on the bridge piers, which is likely to be a result of vehicle impact with the pier. Investigation of Bridges with high heat factor for vehicular collision vulnerability. (a) Bridge ID 69761 (38°55′55.6″N 94°40′03.5″W). (b) Bridge ID 64241 (37°45′34.6″N 97°24′29.6″W). Source: captured from https://google.com/maps.
This observation is supported by a study conducted by Salahat et al. (2023) which shows how vehicle collisions cause structural damage to bridge piers when placed close to the roadway, as shown in Figure 8. Vehicular loads on bridge piers.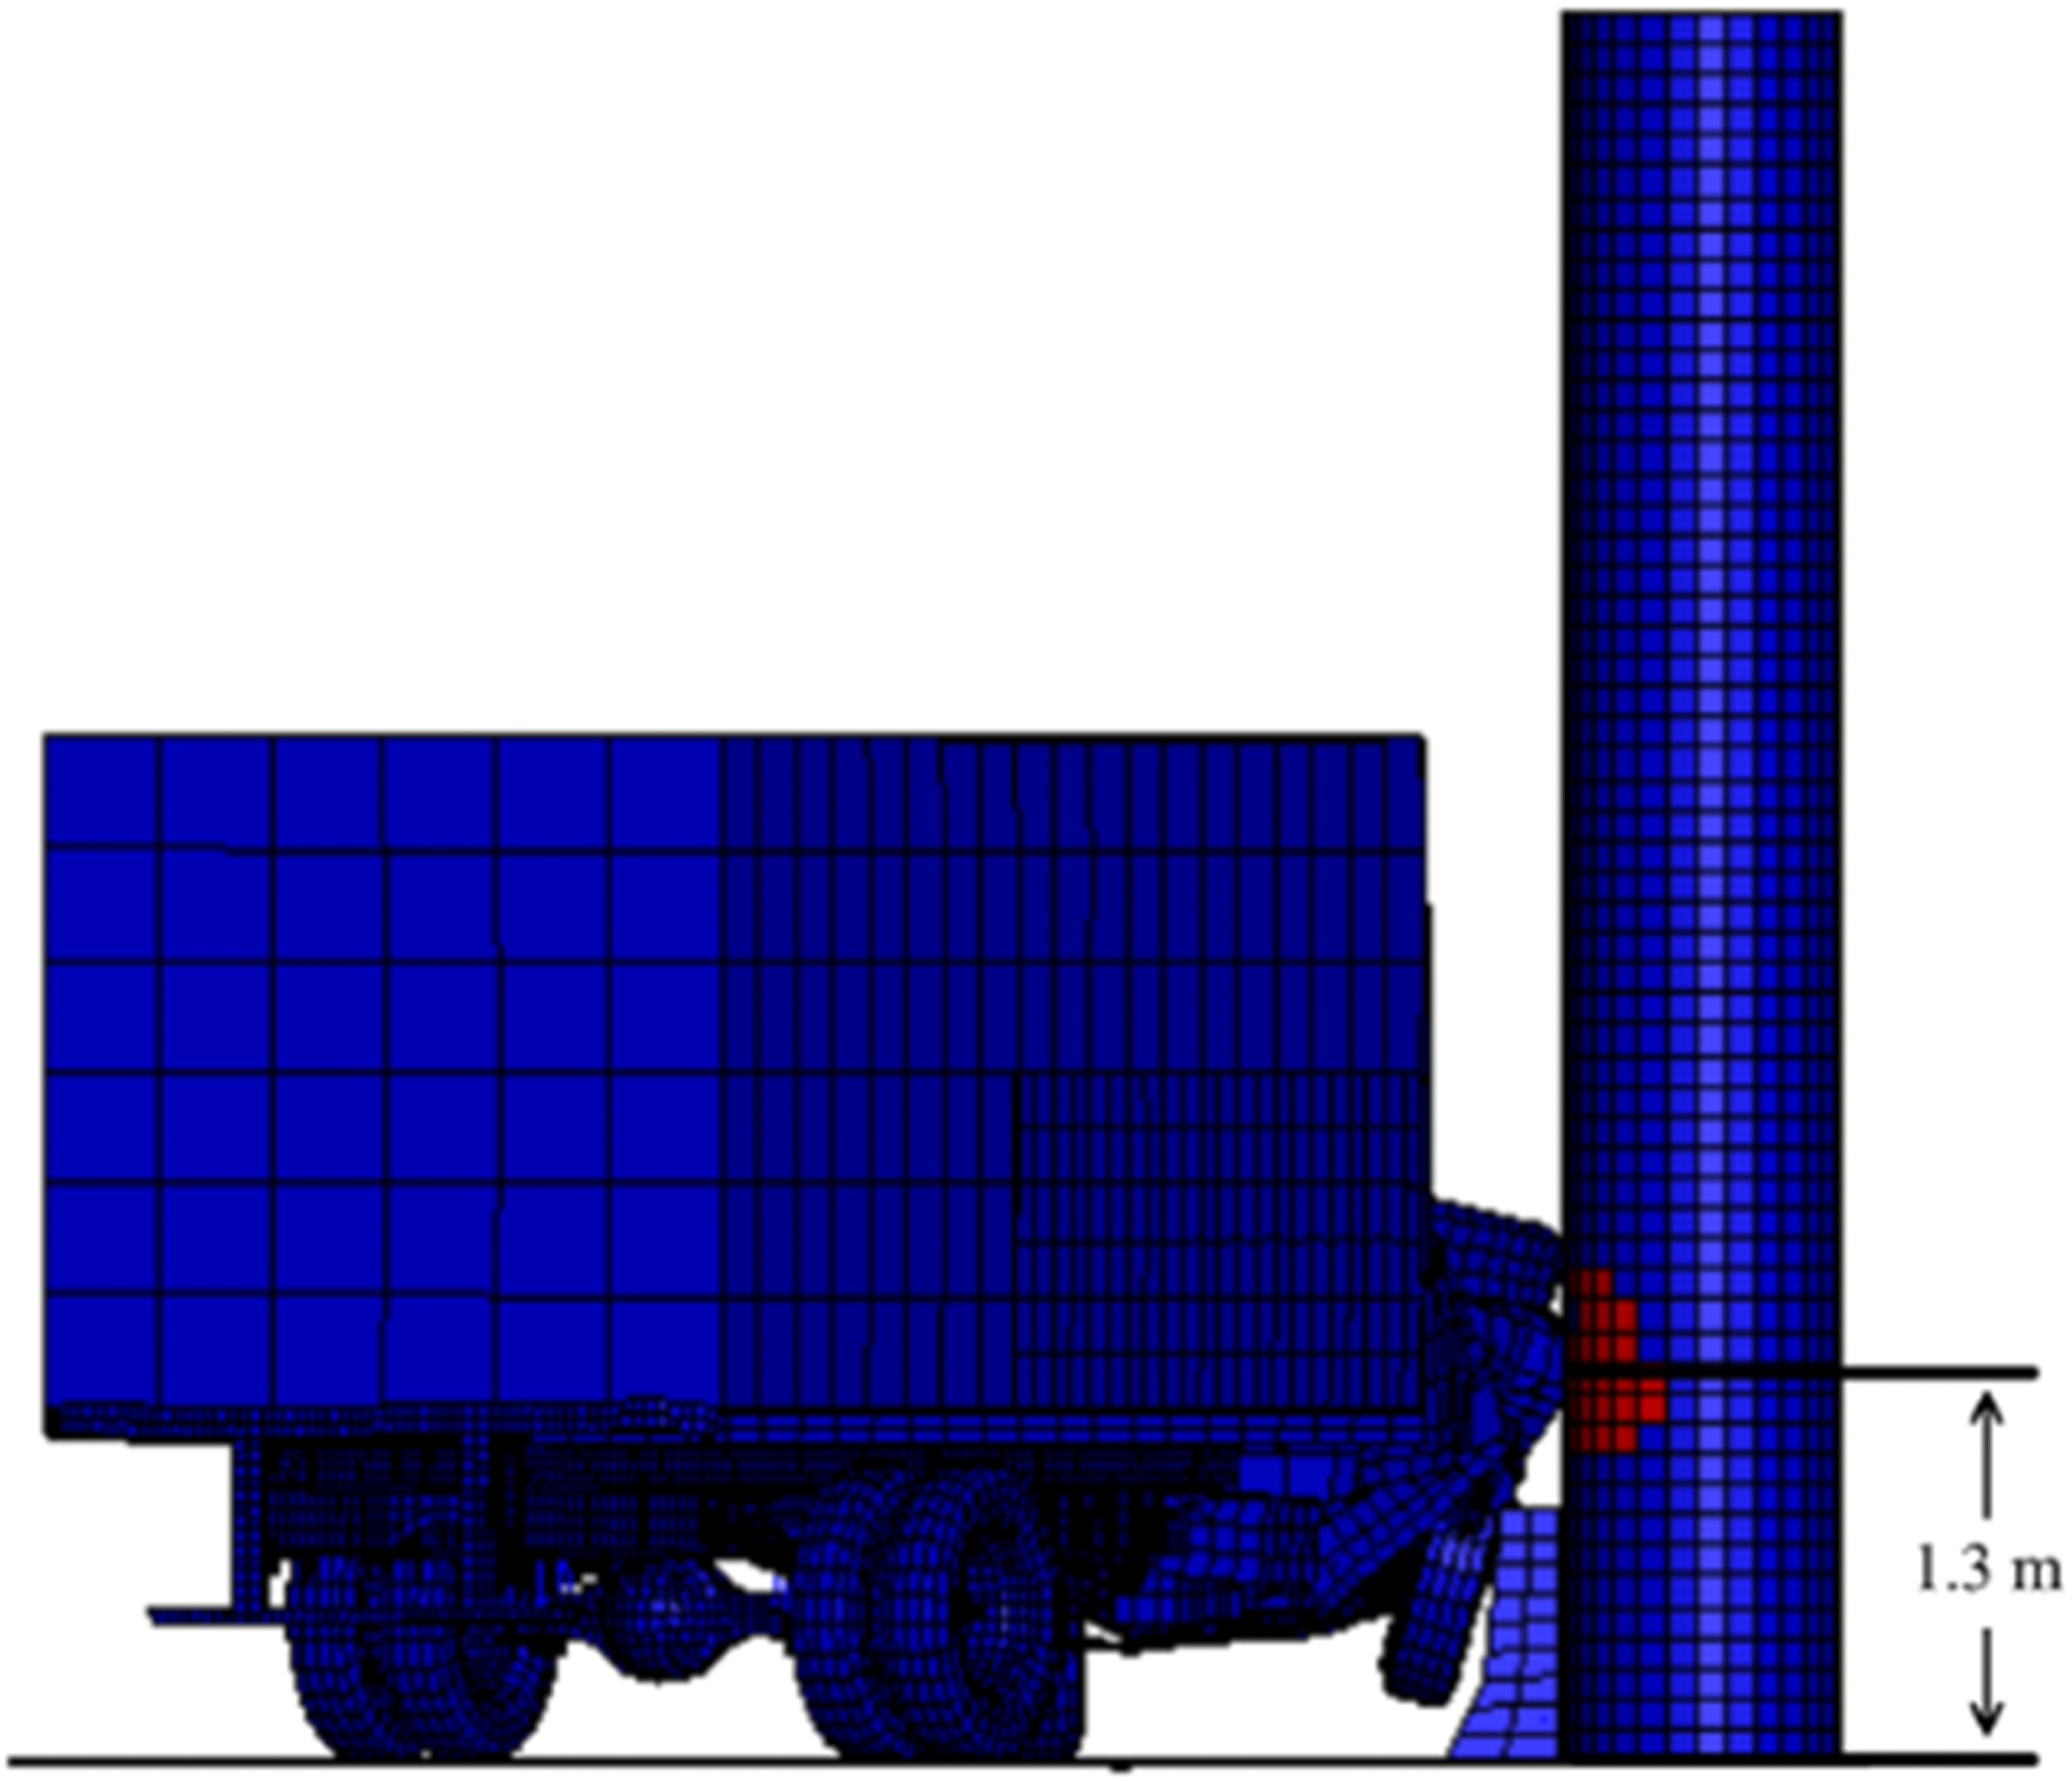
Discussion
This study presents a novel, multi-model framework for assessing bridge vulnerability to vehicular collisions by integrating structural, traffic, and crash datasets across Kansas. The comparative results from the Rule-Based, Machine Learning, Fuzzy Logic, and Hybrid models offer compelling insights into both the internal resilience and external exposure of bridge infrastructure. Across all modeling strategies, certain bridges, most notably ID 69761 and ID 64615, consistently ranked among the most vulnerable due to their high crash exposure and moderate to low resilience indicators. This convergence across distinct methodologies strengthens the reliability of the vulnerability classification and reinforces the framework’s robustness.
The Rule-Based model effectively incorporates engineering logic and offers interpretability, while the Machine Learning model captures complex, nonlinear interactions between features, producing high predictive accuracy for structural health. The Fuzzy Logic model accounts for uncertainty in structural conditions and enables nuanced classification, particularly in borderline or ambiguous cases. The Hybrid model, which synthesizes all three, demonstrates strong inter-model agreement and provides a balanced, consensus-based Heat Factor. This integrated approach ensures that bridges are evaluated not solely by condition but also by the risks posed by their environmental and operational context.
The spatial heatmaps further support decision-making by providing intuitive visualizations that highlight critical clusters of vulnerable bridges, particularly in urban areas with high traffic density. A key insight from the geospatial analysis is the weak correlation between crash frequency and structural resilience, indicating that both internal and external factors must be addressed concurrently in any comprehensive maintenance or mitigation strategy.
Moreover, field verification, such as the investigation of Bridge ID 64241 using Google Maps imagery, validates the modeling results and demonstrates how structural vulnerabilities, such as collision marks or pier placement, can align with predicted Heat Factors. This affirms the framework’s real-world applicability and diagnostic power.
Recommendations
Drawing on the outcomes of this investigation, several recommendations are proposed to improve bridge safety and support practical deployment of the methodology: (1) Implement the Hybrid Heat Factor Approach: Transportation agencies are encouraged to incorporate the proposed Heat Factor metric within existing asset management platforms to help identify and prioritize bridges requiring inspection or maintenance. A first step was taken by the authors of this research to deploy this framework of the multi-model as a software platform (Salahat et al., 2026). (2) Strengthen Impact Protection Strategies: Some bridges exhibiting high Heat Factor values remain vulnerable primarily due to higher risk exposure rather than structural condition (e.g., ID 64615). Installing protective barriers, crash cushions, or modifying pier locations can reduce collision risk. (3) Improve Data Quality and Integration: The effectiveness of the framework depends on reliable structural, traffic, and crash datasets. Agencies should develop standardized formats and real-time data acquisition systems to enable continuous risk evaluation. (4) Utilize Geospatial Visualization in Planning: Integrating risk mapping and visual analytics into regular planning processes can enhance transparency and support informed decision-making. (5) Extend the Method Beyond Kansas: As shown using Kansas data, the methodology is transferable and can be applied by other regions with comparable datasets to evaluate infrastructure vulnerability. (6) Encourage Cross-Disciplinary Cooperation: Effective implementation requires collaboration among policymakers, engineers, and data analysts. Training programs in data analytics and infrastructure-focused artificial intelligence can help translate model output into actionable policy.
Conclusion
This work presents and evaluates a comprehensive, data-oriented methodology for detecting bridges with elevated risk levels across the state of Kansas. The approach integrates information on crash exposure, structural conditions, and traffic characteristics within a scalable analytical framework. By merging engineering judgment with analytical techniques such as rule-based evaluation, machine learning models, and fuzzy reasoning, the method delivers a unified assessment of bridge vulnerability.
A central outcome of the study is the formulation of the Heat Factor indicator, which measures risk by jointly considering resilience and exposure to vehicular incidents. The metric supports objective ranking of bridges for inspection, maintenance, or rehabilitation, particularly when resources are limited. Analysis results show recurring vulnerability patterns across modeling approaches, where certain bridges are consistently classified as high-risk due to inadequate design ratings combined with high-speed and crash-prone surroundings.
The proposed framework is intended to assist transportation agencies, planners, and infrastructure managers in moving toward proactive asset management strategies. Its capacity to combine heterogeneous datasets, represent uncertainty, and produce interpretable outputs makes it well suited for informed, data-supported decision making.
Footnotes
Funding
The authors received no financial support for the research, authorship, and/or publication of this article.
Declaration of conflicting interests
The authors declared no potential conflicts of interest with respect to the research, authorship, and/or publication of this article.