
Abstract
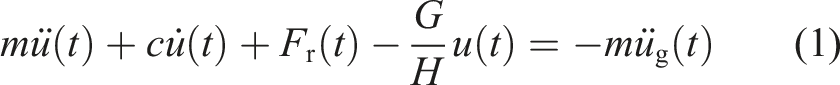
Current seismic design codes use drift ratios to define collapse-limit states in global structural response, making it difficult to accurately identify the initial collapse story and trace progressive collapse path. To address the above issues, this study proposes a mechanical index based on the effective secant stiffness and effective tangent stiffness (i.e., for evaluation of the static equilibrium state and dynamic stability of structures simultaneously and for coupling mechanism of strength degradation and instability). Meanwhile, two types of collapse assessment indices were introduced: (1) a displacement index based on the story drift ratio (with a clear threshold but insufficient precision and scientific rigor); (2) an energy stability function based on the energy balance relationship (i.e., verification for collapse assessment from the perspective of global energy input and dissipation). A tri-linear hysteretic backbone curve model including strength and stiffness degradation was adopted, which was also combined with the I-K hysteretic rules to describe the full-range mechanical behavior of structures. In comparison between the shaking table results of 1:2 scaled RC frame and predictions of ETABS refined model, the collapse times predicted by the proposed mechanical index and energy index (18.12 sec and 18.57 sec, respectively) were in good agreement with the actual collapse time of the test (18.367 sec), while the FEMA 350-based displacement index (17.48 sec) exhibited relatively poor precision. For simple evaluation, collapse assessment addressing the P-Δ effect and mechanical performance degradation was applied to single-degree-of-freedom and multi-degree-of-freedom systems. SDOF system revealed engineering applicability of the proposed mechanical and energy indices, and 2-DOF and 3-DOF systems could accurately identify the initial collapse story in vertically regular and irregular structures. This study establishes a set of accurate and practical seismic collapse identification and localization methods, providing a reliable theoretical basis and engineering reference for structural seismic safety assessment.
Keywords
Introduction
Earthquakes are sudden, unpredictable, and destructive natural hazards that pose a major threat to the safety of building structures. The structural dynamic responses (e.g., transient vibration and elastoplastic deformation) and subsequent collapse damage directly determine the post-earthquake survival state of buildings, which are even the critical factors restricting structural seismic safety. Over the past decade worldwide, statistics from a series of major seismic disasters reveal that approximately 85% of casualties result from direct damage, such as crushing and burial caused by structural collapse, while 90% of direct economic losses are jointly caused by building destruction and subsequent chain reactions including fires, secondary geological hazards, and paralysis of public facilities (United Nations Office for Disaster Risk Reduction, 2022). These findings highlight the important role of seismic collapse resistance in reducing disaster losses. Currently, there still exist a large number of special types of civil building groups in many regions around the world: Existing buildings in old urban areas; self-built houses in rural regions; cheaply and rapidly constructed structures; and early buildings without consideration of seismic design codes. Such buildings usually lack systematic seismic design or rely only on simplified seismic measures. Deficiencies in detailing, material performance, and structural systems, together with insufficient consideration of ductility demand, make them unable to meet current seismic design code requirements. (Xu et al., 2025; GB 50011-2010, 2010). Thus, for structures with poor seismic performance, it is necessary to overcome the limitations of complex models, which are computationally demanding and unsuitable for rapid assessment, and to develop simplified calculation models, collapse identification indices, and weak-story localization methods with both efficiency and accuracy (Yu et al., 2018). These methods can improve seismic safety assessment by enabling dynamic tracking of mechanical-state evolution during collapse, thereby supporting seismic performance enhancement and resilience-based design (Xu et al., 2026).
With the in-depth development of earthquake engineering research, structural collapse assessment criteria can be mainly classified into six categories: methods based on strength, deformation, stiffness, energy dissipation, displacement-energy dual criteria, and incremental dynamic analysis (IDA) (Ma et al., 2010; Azarbakht and Dolšek, 2011; Fanaie and Ezzatshoar, 2014). These criteria can evaluate the anti-seismic collapse capacity of structures from different perspectives, each with its own applicable cases and advantages, but they also have limitations, such as restricted application scope, incomplete characterization of damage/deformation, and high parameter dependence on experience or large computational load. However, structural collapse assessment should consider damage development, stiffness degradation, strength deterioration, residual displacement, and global stability. Rather than only judging whether collapse occurs, it should capture the evolution of mechanical stability during collapse and accurately determine the collapse initiation time (Mehanny and Deierlein, 2001). In addition, the most direct approach for investigating structural collapse under seismic excitation is to analyze prototype structures. However, despite conducting shaking table tests or finite element analysis, it is difficult to directly and efficiently judge structural collapse.
In contrast, reasonably simplifying a structure into an equivalent SDOF model (Adam et al., 2004; Shi et al., 2011, 2012) can reduce the cost of structural collapse analysis, approximately evaluate the structural collapse performance, and quickly obtain the seismic collapse capacity of the structure. Existing studies have verified the applicability and reliability of SDOF model in structural seismic analysis from multiple aspects. Huang et al. (2016) reported that the equivalent SDOF model achieved the highest accuracy when the model was constructed based on the parabolic loading pattern and the displacement shape vector corresponding to the peak load of the pushover curve. Shi et al. (2012) proposed an equivalent SDOF model suitable for building structure collapse analysis, and verified its applicability and accuracy for the collapse analysis of reinforced concrete (RC) structures. Han et al. (2010) adopted the pushover analysis method to investigate the influence law of higher-order vibration modes on the fragility curves of steel moment frames, and reported that the higher-order vibration modes were negligible, thus verifying that the equivalent SDOF model based on the first-order modal pushover analysis was applicable to structural collapse analysis. Tsitos et al. (2018) adopted the equivalent SDOF model of structures to systematically investigate the influence law of structural degradation characteristics on the collapse limit state of structures under earthquake loads, and the structural degradation was critical to evaluate the structural anti-seismic collapse capacity. Ibarra et al. (2005) proposed a restoring force model capable of simulating the strength and stiffness degradation characteristics of structural members under strong earthquakes, which was applicable to the equivalent SDOF model of structures.
Meanwhile, to accurately simulate the geometric nonlinearity of structures under strong earthquakes, the P-Δ effect simulation method of the equivalent SDOF model was considered. Liang et al. (2013) proposed an equivalent SDOF model including a tri-linear backbone curve to consider the strength degradation characteristics induced by the P-Δ effect. Adam et al. (2004) adopted the elastic and inelastic stability coefficients to characterize the P-Δ effect of structures in an equivalent SDOF model. In equivalent SDOF collapse analysis, structural strength and stiffness degradation under seismic loading should be properly considered. However, existing SDOF and MDOF models mainly describe macroscopic structural responses, without clearly defining the critical mechanical conditions for collapse initiation or revealing the collapse mechanism of multi-story structures. As a result, they cannot accurately capture the transition from damage accumulation to collapse, and fail to provide a rigorous and practical criterion for engineering assessment. Therefore, collapse-resistant design and retrofitting still largely rely on empirical code provisions, which are insufficient for refined safety assessment under complex seismic actions.
To fill this gap, this study focuses on the equivalent SDOF model of moment frame structures and evaluates the limitations of displacement-based indices and the applicability of the energy stability function in collapse assessment. Considering the P-Δ effect and structural degradation, a mechanics-based collapse assessment index is proposed to simultaneously evaluate static safety and dynamic stability, thereby reducing the assessment lag of single static or dynamic indices in time-varying responses. The proposed index can better capture the coupled process of strength degradation and instability under large deformation, improve the identification accuracy of the critical collapse state, and be further extended to collapse-story localization in MDOF structures. This method can determine global collapse and localization of weak stories revealing progressive collapse paths, which complements existing methods and addresses limitations of existing methods in identifying interstory damage. On this basis, an accurate and efficient method for seismic collapse identification and collapse story localization was ultimately established, which could provide practical engineering support for the seismic safety assessment of structures.
Mechanism of the proposed SDOF system
Second-order effect
An equivalent SDOF system is one of the fundamental models used for simplified analysis of structural dynamic responses in the field of earthquake engineering, as shown in Figure 1. For vibration response under unidirectional seismic excitation, the dynamic analysis framework should comprehensively consider three types of dynamic loads (i.e., inertial force I, damping force D, and structural restoring force Fr). This study considers geometric and mechanical characteristics, such as low lateral stiffness, significant self-weight ratio (i.e., ratio of structural self-weight to total structural weight), and excessively large aspect ratio (i.e., ratio of structural height to its width, generally greater than 4 (Zhu, B. Y.,2013)). Thus, the second-order (P-Δ) effect of gravity induced by structural displacement would be significantly amplified during vibration, but it is neglected in conventional simplified analysis. Based on D’Alembert’s principle (Petrosian, 2024), dynamic equation of an equivalent SDOF system including the P-Δ effect can be defined as follows: SDOF earthquake response.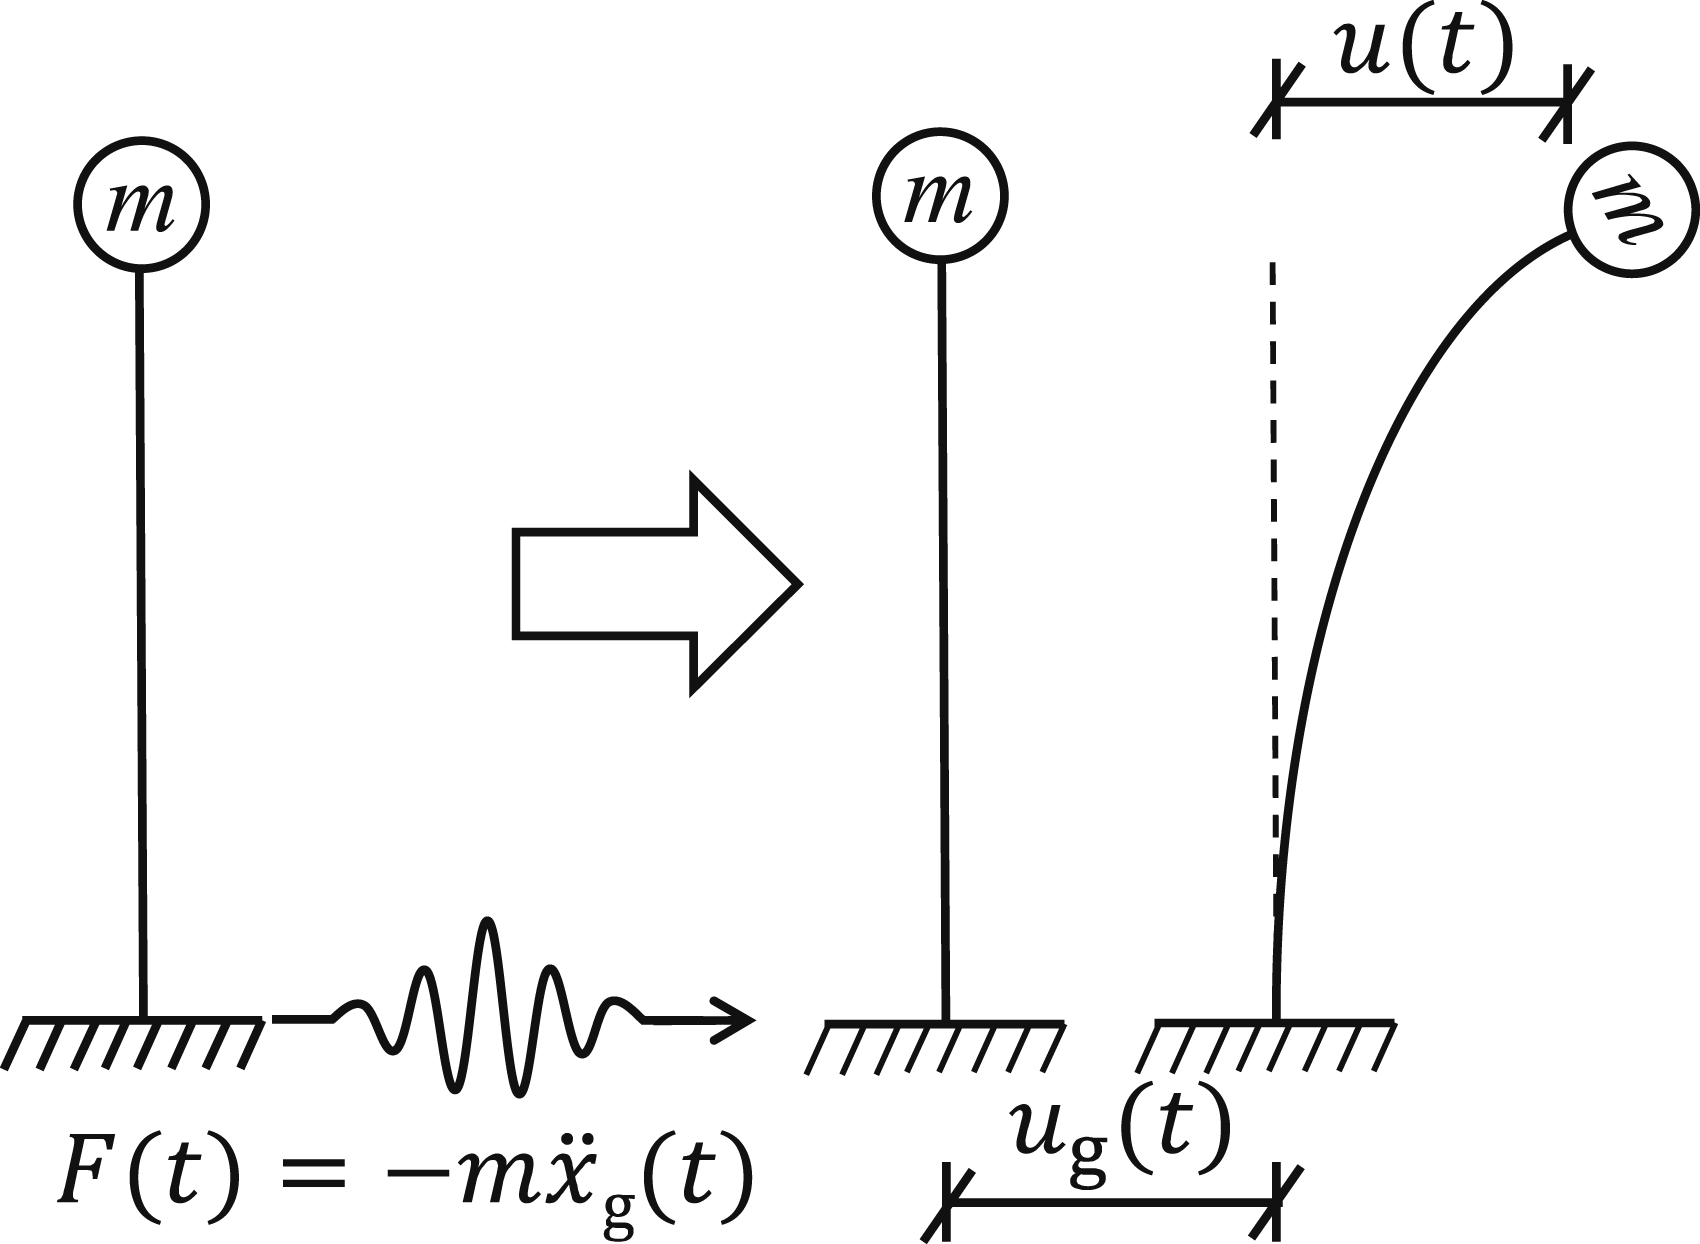
Structural restoring force
For precise seismic analysis of an equivalent SDOF system, it is important to successfully establish both the backbone curves by connecting the peak points of each hysteretic loop and cyclic curves that correctly represent structural hysteretic behavior. To realize comprehensive structural performance evaluation, it is impossible to rely solely on backbone curve models that ignore deterioration of strength, stiffness, and energy dissipation capacity under cyclic loading. The required model should be able to correctly describe all key degradation phenomena, such as a structural restoring force model incorporating stiffness degradation and strength degradation (Figure 2) (Kunnath et al., 1997; Ibarra et al., 2005; Sengupta et al.,2013; Kottari et al., 2014) as well as hysteretic behavior. In this study, the hysteretic behavior of structures was implemented using the hysteretic rule from the I-K model (Ibarra et al., 2005). Structural restoring force model.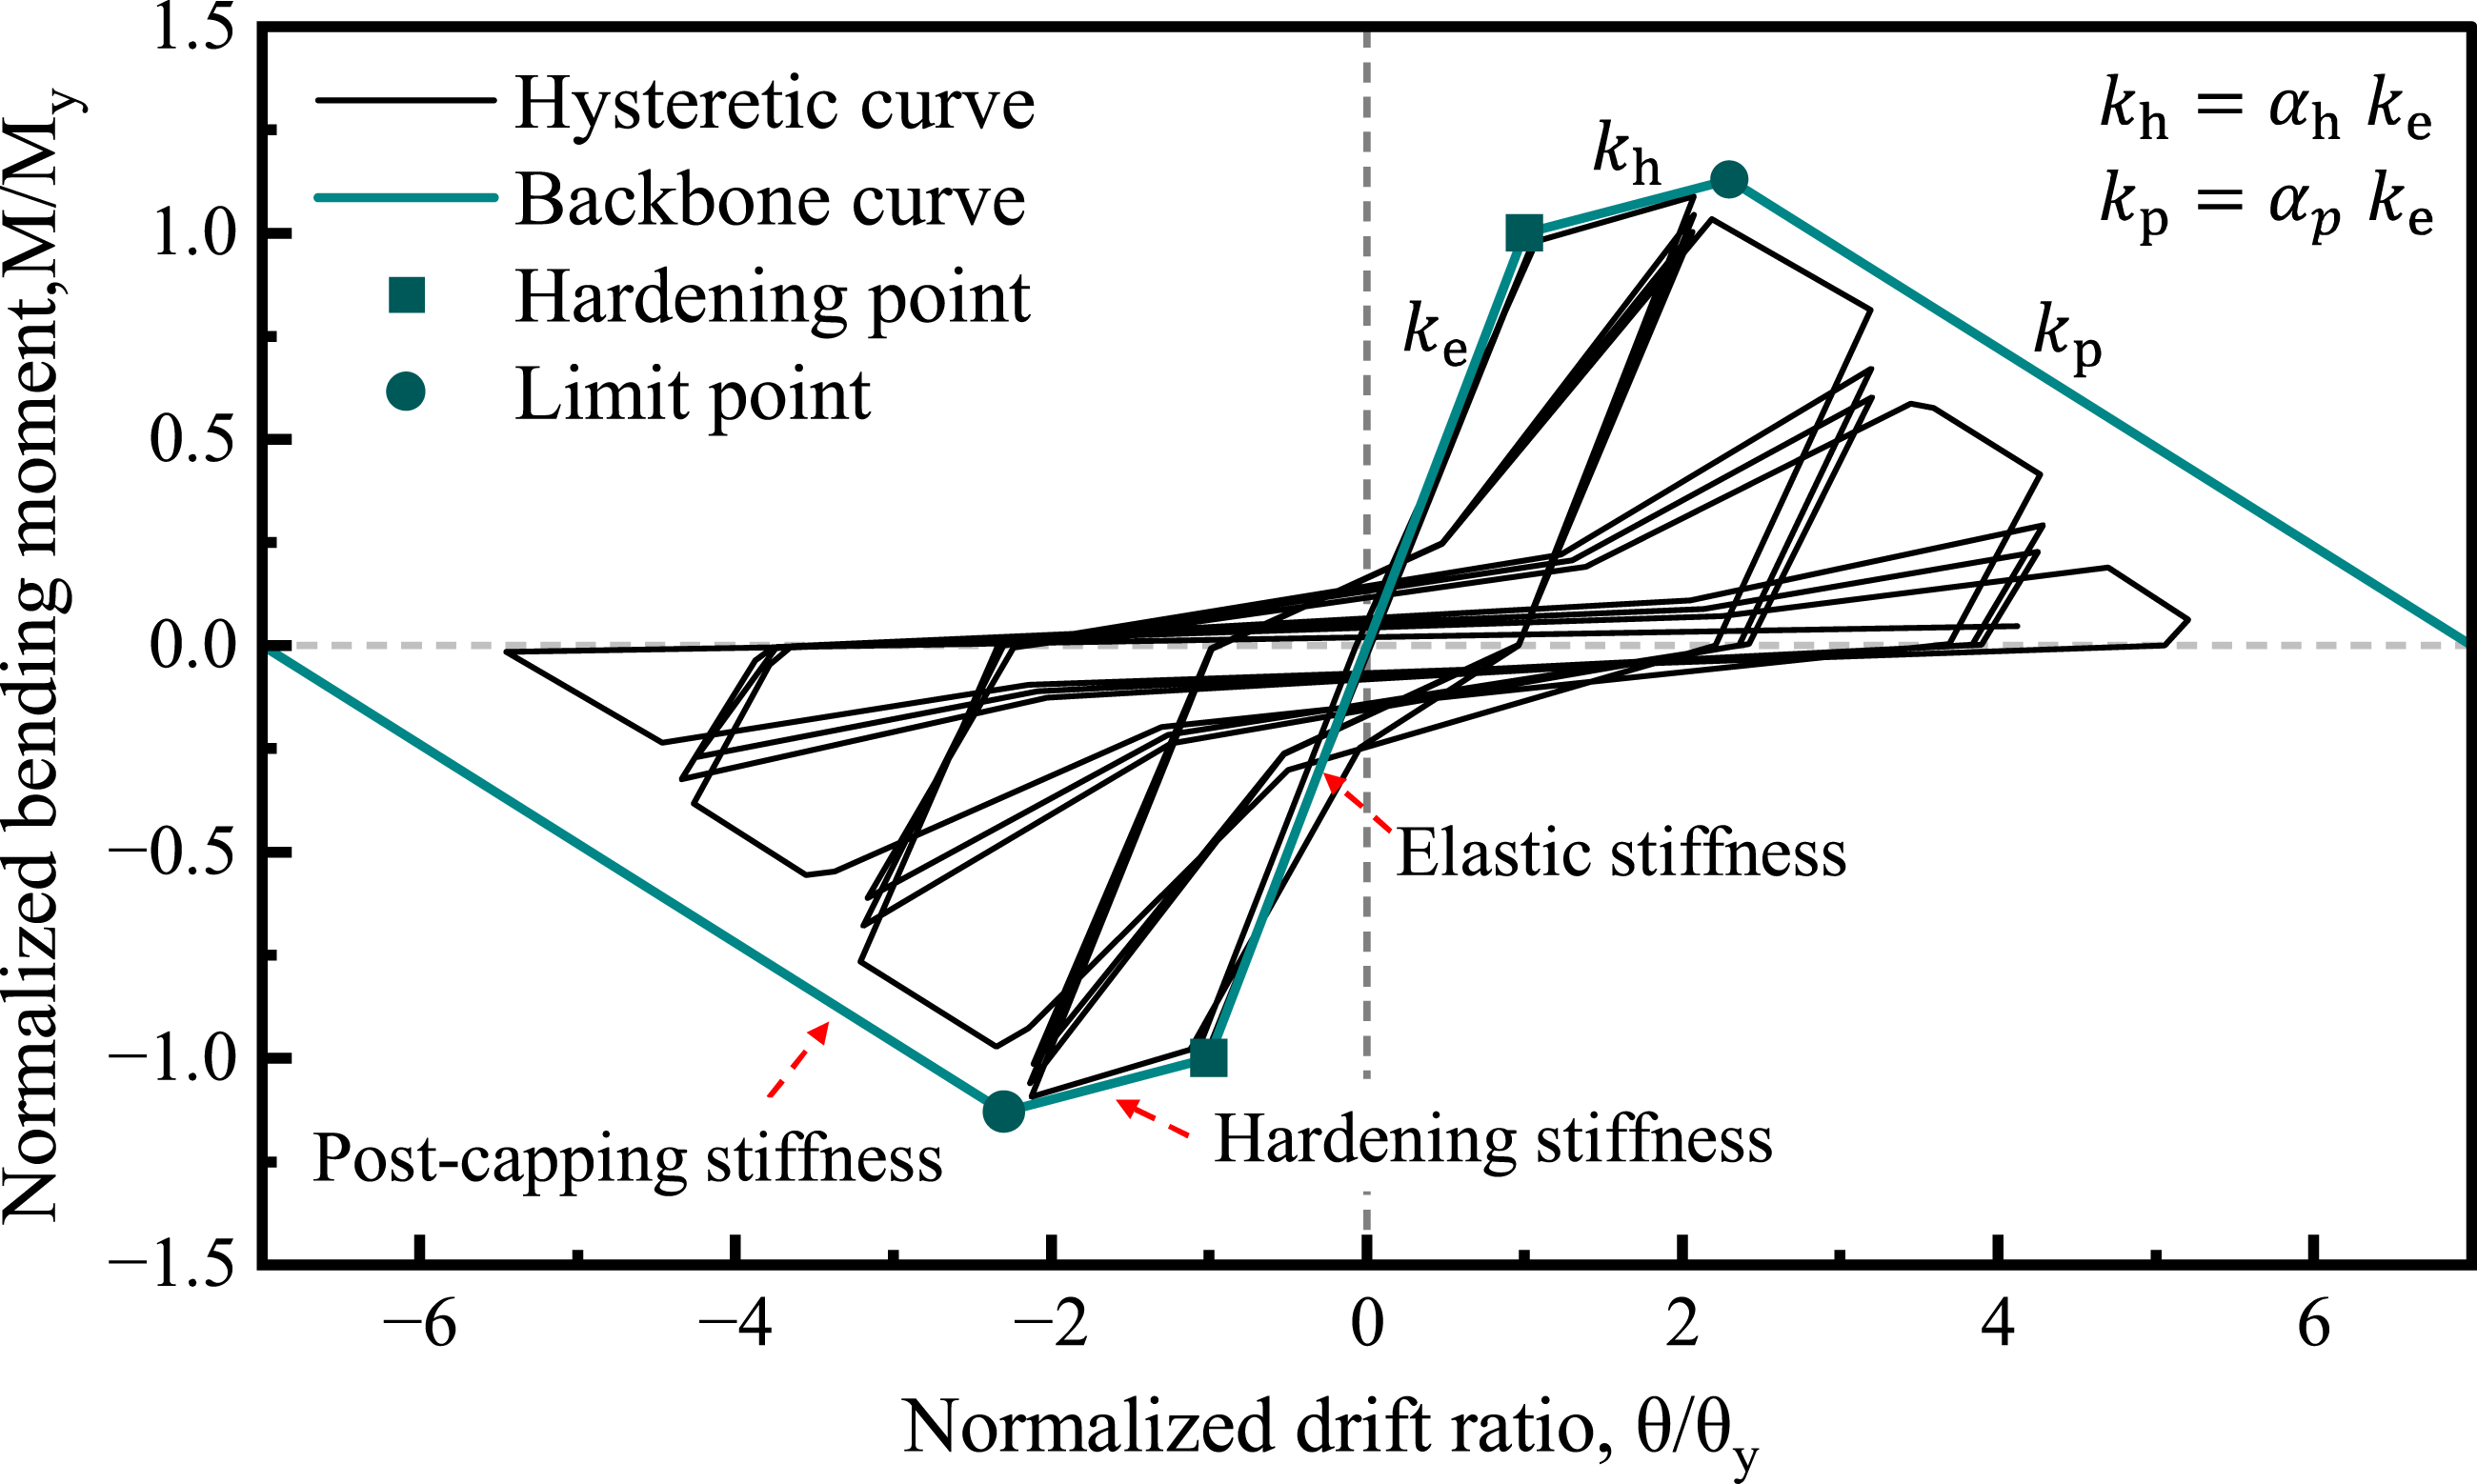
Due to the P-Δ effect, large lateral displacement generates additional column bending moments and significantly increases lateral instability risk. Therefore, the restoring force model should accurately describe post-yield degradation to capture the coupling between P-Δ effects and structural resistance under large deformation. The I-K model is based on well-defined force–deformation backbone curves and cyclic deterioration rules, and can capture strength deterioration, post-peak softening, unloading stiffness degradation, and reloading stiffness degradation. Therefore, it can describe the full degradation process from yielding and peak strength to residual resistance and ultimate deformation. Compared with bilinear and ideal elastoplastic models (Riddell, 1979), the I-K model better reflects negative stiffness and resistance degradation after peak load. Unlike the Clough model (Chopra and Kan, 1973), it considers both stiffness degradation and strength deterioration. In addition, its degradation mechanism is clearer than that of the Bouc-Wen model (Wen, 1976). Thus, the I-K model is suitable for the numerical simulation in this study.
Effective stiffness of structures
Effective secant stiffness
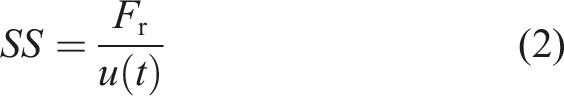
The secant stiffness (SS) of structures (Gulkan and Sozen, 1974; Pourali and Khosravi, 2023; Qu and Ye, 2011; Sullivan et al., 2004; Valvo, 2025) is defined as the slope of the line connecting the origin and load-displacement state point at a given deformation on the structural load-displacement curve (i.e., backbone curve). It macroscopically characterizes the average deformation resistance capacity of a structure from the initial state to a specific deformed state. The average lateral restoring force stiffness of the structure is defined as follows:
Thus, the effective secant stiffness (ESS) of the structure after accounting for the second-order effect can be defined as follows:
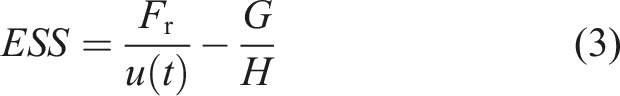
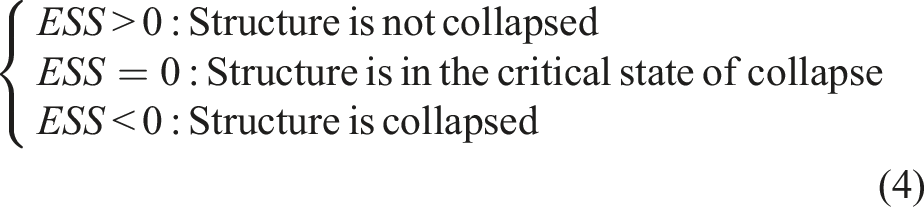
From the perspective of static equilibrium, the effective secant stiffness (ESS) can be used to assess whether a structure loses its equilibrium capacity, leading to the corresponding collapse criterion.
Effective tangential stiffness
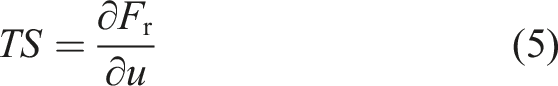
The tangent stiffness (TS) of structures (Brothers et al., 2014; Wang and Deng, 2008) is defined as the slope of the tangent line drawn at the load-displacement state point corresponding to a specific deformation on the structural load-displacement curve. It reveals the instantaneous mechanical properties and stability of the structure under a given stress state. The tangent stiffness of the structure at any time is defined as follows:
Considering the adverse influence of the structure’s gravity-induced P-Δ effect, the effective tangent stiffness (ETS) of the structure at any given time can be defined as follows:

By substituting the ETS into equation (1) of motion for an equivalent SDOF system, the equation of motion incorporating the gravity-induced P-Δ effect can be derived.

Under earthquake loads, as the intensity of seismic excitation varies continuously, the structure may enter different stress stages, and the corresponding ETS changes accordingly. According to the relevant theories of nonlinear dynamics, when ETS < 0, the structure is in a state of dynamic instability, which serves as an important warning signal for potential collapse.
In this study, G/H denotes the equivalent negative geometric stiffness induced by the P-Δ effect, where the gravity load G is assumed constant and the story height H is taken as the effective moment arm. Under lateral displacement
Collapse determination method
Structural collapse can be systematically assessed from three perspectives: displacement, mechanics, and energy. From the displacement perspective, collapse assessment is commonly based on deformation indicators such as story drift ratio. When the deformation exceeds a critical threshold, the structure is considered to approach or enter collapse. From the mechanical perspective, collapse is evaluated through static equilibrium and dynamic response characteristics, emphasizing the interaction between seismic action and structural resistance. When structural resistance can no longer balance external loads, mechanical equilibrium is lost and collapse occurs. From the energy perspective, structural equilibrium can be evaluated based on energy conservation and dissipation mechanisms, focusing on the balance among seismic input energy, elastic strain energy, and plastic strain energy. When the input energy exceeds the structural energy dissipation capacity, plastic deformation accumulates continuously, stable resistance is lost, and collapse may occur (Liao et al., 2017).
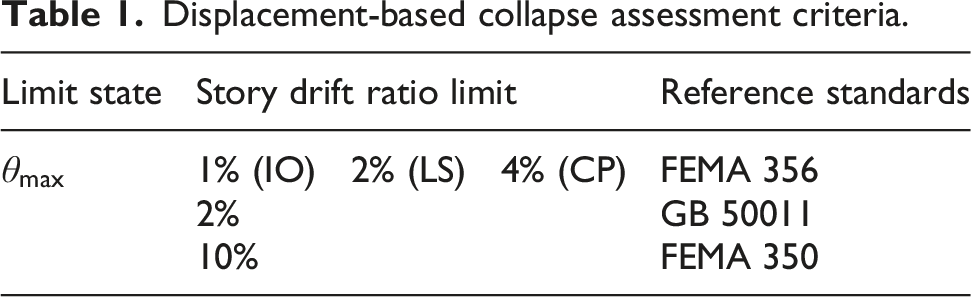
Displacement-based collapse determination
Displacement-based collapse assessment criteria.
Energy instability function
Integrating the equation of motion (equation (1)) for an equivalent SDOF system under earthquake loads yields the energy balance equation for the structural system over the seismic analysis time interval (0, t), as follows:
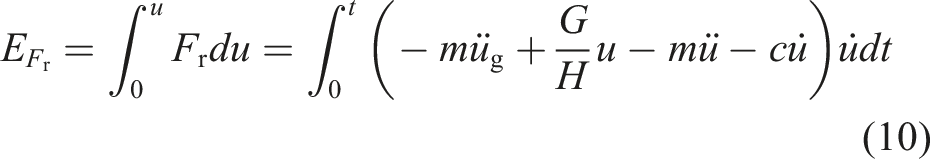
Under earthquake loads, the work done by the generalized external force on an equivalent SDOF system is defined as equation (9), while the work done by the structural restoring force is defined as equation (10).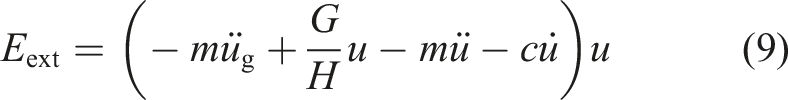
Accordingly, the difference ΔE between the 
The seismic input energy 
Mechanical collapse criterion
Mechanical indices for structural collapse.
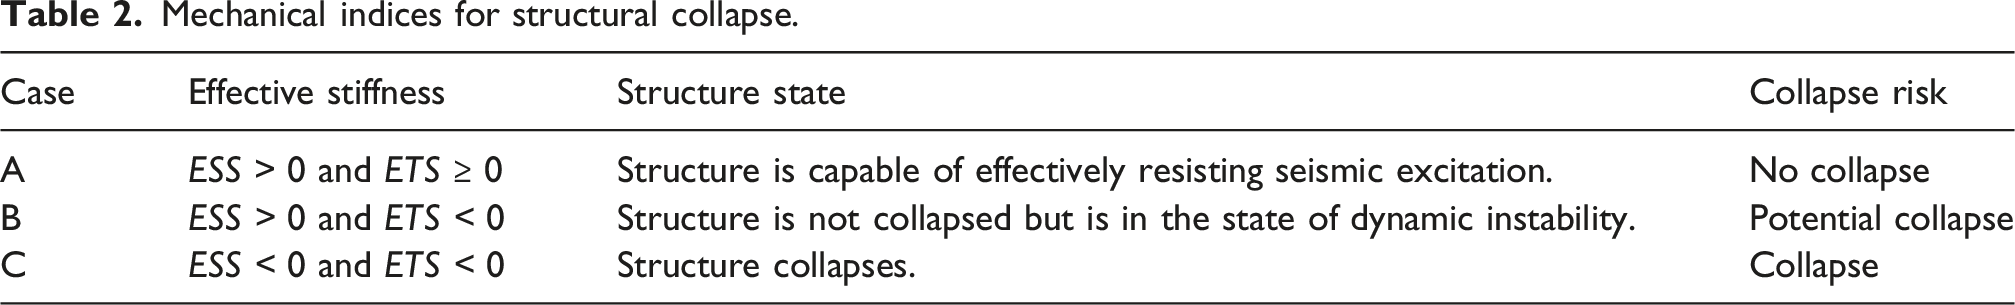
For the proposed mechanical indices, ESS and ETS have different mechanical meanings. ESS reflects the average lateral resistance of the structure under the current deformation state considering the P-Δ effect, and can be used as a decisive index for identifying loss of global static equilibrium and final collapse. In contrast, ETS represents the instantaneous tangent stiffness and mainly reflects dynamic stability. Therefore, ETS can serve as a supplementary index for recognizing pre-collapse dynamic instability. By combining ESS and ETS, the proposed method can determine collapse occurrence and capture the mechanical evolution process before collapse.
Under seismic excitation, structural collapse can be identified through the time-history evolution of effective stiffness. Condition A indicates a safe vibration state, while Condition B only represents a temporary dynamic instability of the corresponding story and cannot be directly regarded as overall collapse. Collapse is judged only when Condition C first appears and persists, during which the effective secant stiffness remains continuously negative and obvious dynamic instability occurs. In contrast, occasional short-term negative ESS values should not be used as collapse initiation criteria, because cyclic loading, unloading, restoring-force reversal, and shear redistribution may cause transient negative stiffness. Such instantaneous values only indicate insufficient lateral stiffness reserve at a specific moment, rather than irreversible collapse. Therefore, ESS = 0 can be regarded as the critical threshold. When ESS remains positive but approaches zero, the structure is near collapse, and slight seismic excitation, stiffness degradation, strength deterioration, or increased displacement may cause ESS to become continuously negative, eventually leading to collapse.
Criteria for determining collapse story in MDOF structures
In seismic response of MDOF structures, although the drift ratio serves as a macroscopic characterization of the independent stability state of each story, and the plastic hinge model effectively distinguishes between the elastic deformation of structural members and plastic deformation at plastic hinges, the drift ratio itself cannot couple the effects of the P-Δ effect and mechanical performance degradation. For this reason, it is difficult to accurately define the critical threshold of a single story to transition from cumulative damage to the initiation of collapse, and it cannot synchronously reflect the static equilibrium state and dynamic stability of the story. Further, due to the interlayer coupling effect of MDOF structures, it is difficult to accurately characterize the independent stability state of each story. As seismic energy focuses on the overall structure, the global energy cannot be effectively decomposed into each story. Also, due to complicated transfer mechanisms of inter-story energy, it is impossible to directly map the energy state to the stability of specific stories. On the other hand, the mechanical-based collapse assessment index can be extended to determine the collapse story in MDOF structures. Through layered calculation combining the mechanical characteristics of each story of the MDOF structure and the P-Δ effect, this method directly reflects the independent static equilibrium state and dynamic stability of each story, avoids the interference of interlayer coupling on the assessment results, and achieves accurate localization of the initial collapsed story.
Simplification of MDOF structures and applicability prerequisites
During seismic excitation, two- and three-story MDOF structures exhibit relatively clear mechanical responses. The force state of each story and the load transfer between adjacent stories can be clearly distinguished, which distinctly reflects the gradual transfer and accumulation of seismic effects and P-Δ effects along the structural height. Therefore, to elaborate the extended application of mechanical indicators in collapse story identification for MDOF structures, this study selects two- and three-story MDOF systems as research objects to carry out mechanical analysis, develop the collapse story identification method, and verify its effectiveness. For collapse story assessment of other high-rise MDOF structures, the mechanical indicators can also be extended and applied following the same technical idea.
To simplify the nonlinear dynamic response and collapse analysis of MDOF structures, the lumped mass models can be established through equivalent simplifications (Figure 3). In this figure, u
i
denotes the story drift; H
i
denotes the story height; G
i
denotes the weight of the i-th floor; P
i
denotes the total vertical gravity load at the i-th floor; F
i
denotes the structural inter-story force; V
i
denotes the inter-story shear force; and M
i
denotes the bending moment induced by the P-Δ effect of the upper floors acting on the i-th floor. Masses are lumped at the nodes of each floor, and the overall lateral stiffness and damping characteristics of the structure are uniformly characterized through equivalent conversion. Simplified structural diagram.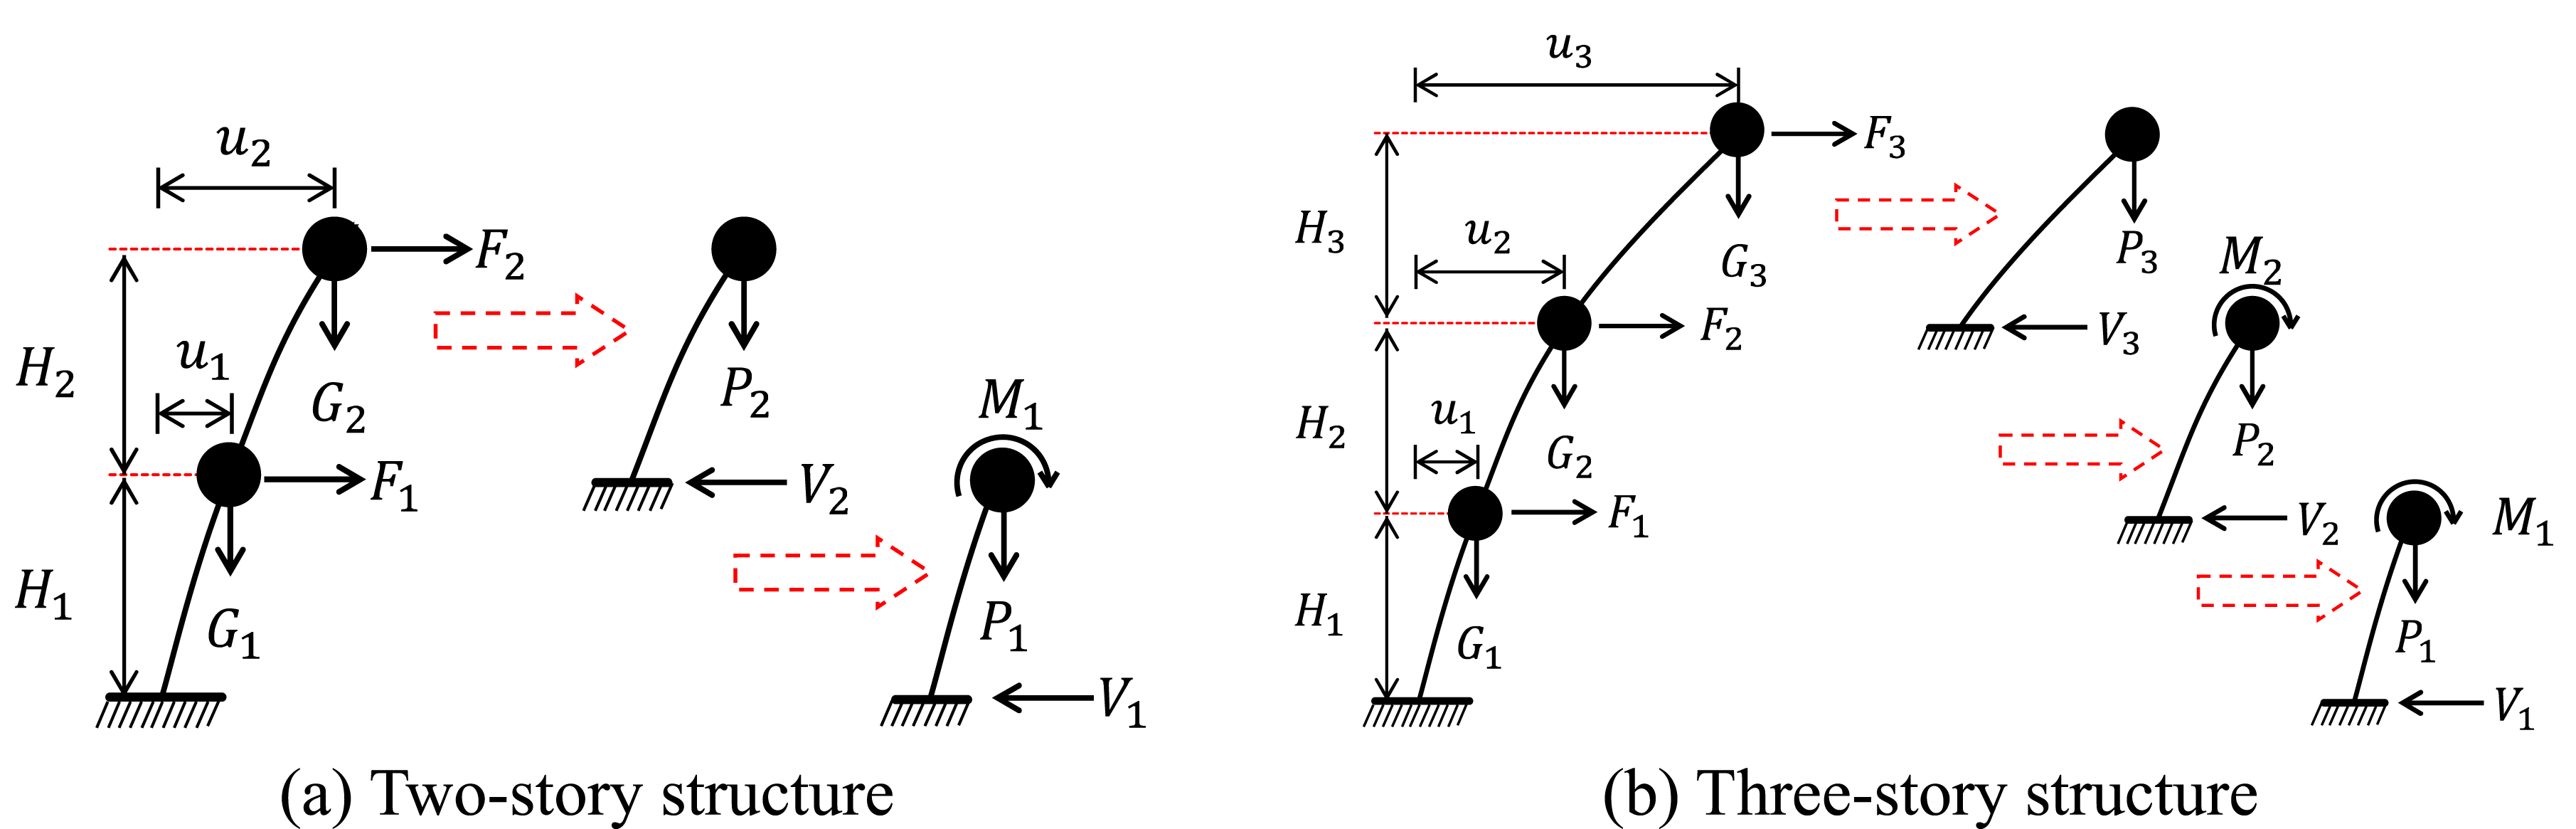
Analysis of structural force at each level and additional effect from upper levels
For the lumped-mass models of two- and three-story structures under horizontal seismic excitation, the overall force relationship and dynamic equilibrium equations should be derived to clarify the effective stiffness and inter-story force transfer mechanism. The responses of such multi-story systems are jointly governed by seismic excitation, gravity load, and story drift, showing evident inter-story coupling. Therefore, the derivation should consider story inertial force, P-Δ-induced additional moment, and lateral restoring force. By combining the dynamic equilibrium equations of each story with story-drift compatibility, the key mechanical quantities of each story can be obtained.
Structural force of each floor.
Calculation of structural layer stiffness considering second-order gravitational effects
Based on the effective secant stiffness and effective tangent stiffness defined in Section 2.3, each floor is simplified as an equivalent SDOF subsystem according to its force state listed in Table 3. The corresponding effective secant and tangent stiffness are then calculated and defined as the story-level stiffness indices. Meanwhile, it can be observed that since SDOF structures are not subjected to additional overturning moments transferred from upper floors, their equivalent negative stiffness solely originates from the P-Δ effect (i.e.,
Effective stiffness of each floor.
Determination rules of collapsed floor
Under seismic excitation, the collapse floor can be identified by tracking the effective secant stiffness and effective tangent stiffness of each floor according to the mechanical indicators in Table 2. When Case C first appears and continuously persists in a certain floor, its effective secant stiffness remains negative with dynamic instability, indicating initial collapse; this floor is therefore defined as the initial collapse floor. In contrast, occasional short-term negative stiffness followed by stable vibration recovery should not be regarded as collapse initiation. After the initial collapse floor is identified, negative stiffness and large displacement responses in other floors are treated as cascade responses caused by damage redistribution and classified as subsequent collapse propagation.
Evaluation of the proposed method
Case verification
Validity verification
To verify the applicability of the collapse simulation, ETABS was adopted to simulate and reproduce the structural collapse test (Luo et al., 2005). A 1:2-scaled non-ductile RC portal frame was tested under the near-fault ground motion records of the 1999 Taiwan Chi-Chi Earthquake (TCU082, TCU076) as seismic input. Counterweights were used in the vertical direction to simulate the actual floor loads. For detailed information, such as specific counterweight configurations and reinforcement details can be found in the literature (Luo et al., 2005). In ETABS, a full-scale structural model was established with identical structural reinforcement. The actual floor loads were simulated by setting area masses, and the same ground motions were selected as horizontal X-direction input. Concrete employed the Mander constitutive model (Mander et al., 1988) to account for the confinement effect, and reinforcement utilized the Takeda constitutive model (Takeda et al., 1970) to accurately characterize cyclic behavior. The nonlinear behavior of the structure was simulated by defining plastic hinges. The modeling of plastic hinges is realized based on FEMA 356 (FEMA 356, 2000 and the I-K model (Ibarra et al., 2005), with M3-type flexure-dominated plastic hinges arranged at beam ends and Fiber P-M2-M3-type plastic hinges adopted for column ends. The details for the selection of hysteretic rules can be found in the literature (Ibarra et al., 2005).
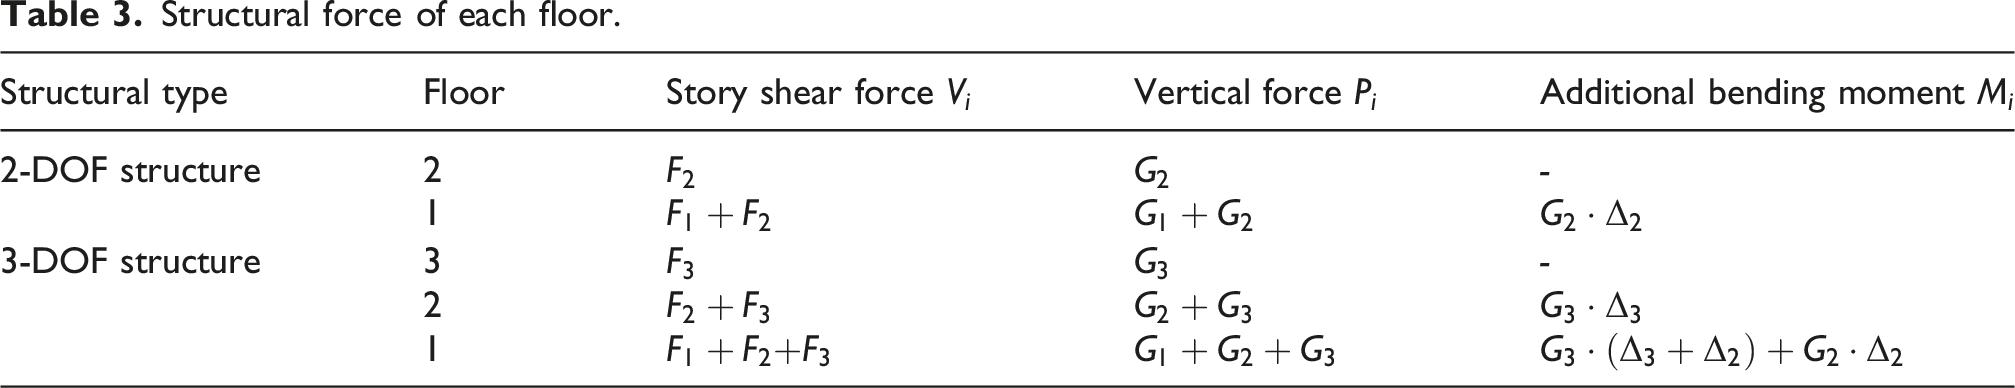
Figure 4 compares the top-floor drift obtained from the test and analysis results of Test Building No.3 under ground motion of TCU082ew (PGA = 1.16 g). As shown in the figure, before 13 sec, the structure was mainly in the elastic-plastic development stage, with limited global stiffness degradation, and the ETABS results agreed well with the shaking table test. After 13 sec, damage localized and developed rapidly in key components, leading to accelerated strength and stiffness degradation and bringing the structure close to instability. Since the degradation parameters in ETABS are generally preset and relatively fixed, the model cannot fully capture the highly path-dependent rapid degradation behavior at this stage, resulting in some discrepancies from the test results. Nevertheless, the overall displacement time-history trend remains consistent, verifying the rationality and reliability of ETABS for elastic–plastic time-history analysis. Moreover, ETABS can record various energy components during vibration, so it is used for the subsequent index verification. Comparison of lateral displacement.
Analysis results
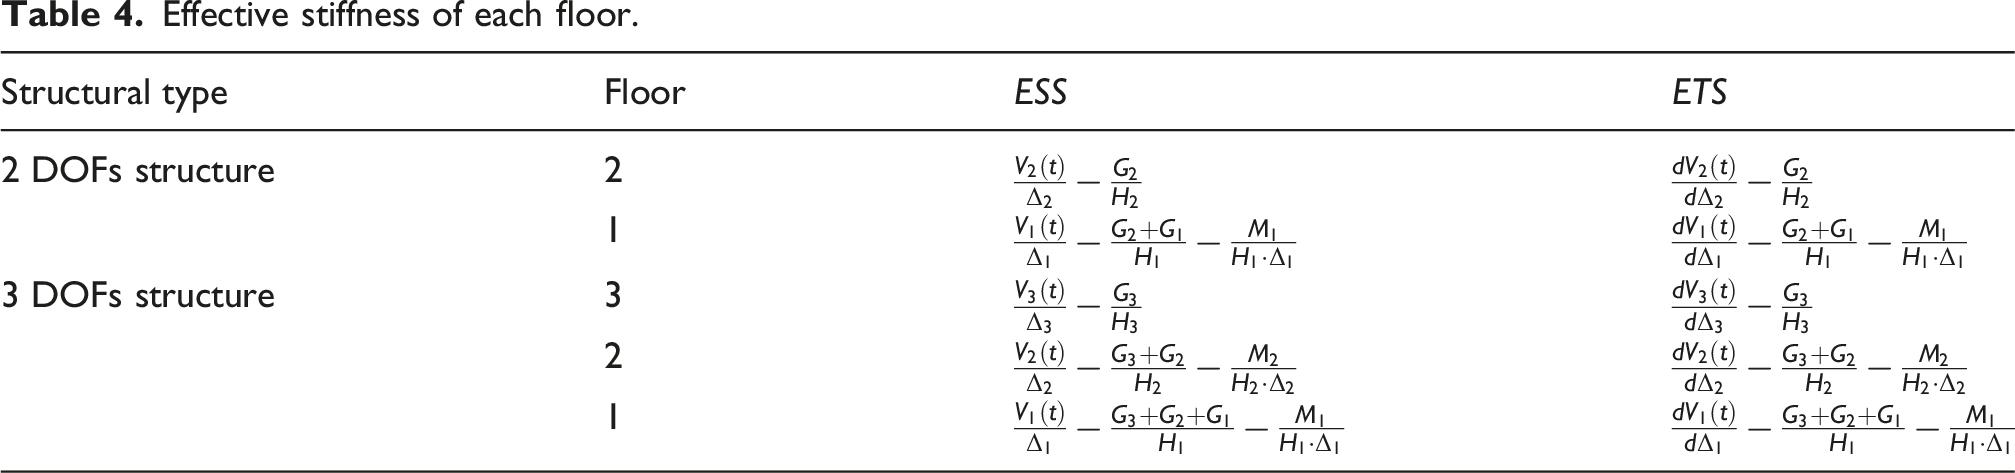
The collapse test reported in the literature (Luo et al., 2005) was simulated. Figure 5(a) presents the corresponding displacement time-history curve and structural collapse limit drift ratio based on the displacement index. Using the structural displacement and restoring force obtained from the ETABS analysis results, the secant stiffness (SS) was calculated from equation (2), which was expressed as natural log scale in Figure 5(b). In this figure, the restoring force reduction term ( Dynamic analysis results of ETABS.
Displacement time-history analysis
As seen in Figure 5(a), the structure exceeded the allowable maximum story drift ratio specified in GB 50011 multiple times during the vibration process but still remained in safe operation without collapse. At t = 14.4 sec, the story drift ratio exceeded the allowable maximum story drift ratio specified in FEMA 356, but there was still a tendency of reciprocating motion in the subsequent vibration process. The results indicated that the structure did not undergo an immediate collapse but continued to vibrate under subsequent seismic actions until collapse occurred. On the other hand, FEMA 350 predicted the collapse time of t = 17.48 sec, which was close to the structural test collapse time (18.367 sec), indicating that the maximum story drift ratio specified in FEMA 350 for collapse assessment enables a more accurate determination of the actual collapse time of the structure.
Mechanical time-history analysis
As seen in Figure 5(b), before t = 18.12 sec, the structural SS was consistently greater than or close to the NS, with multiple light gray shaded areas. In a word, the effective secant stiffness (ESS) of the structure remained positive during this period, and there were several periods where the effective tangent stiffness (ETS) was less than 0. According to Table 2, the structure was in a safe vibration state before t = 18.12 sec (i.e., Cases A and B). Although the short-term dynamic instability (Case B) occurred, the structure could still recover to a safe working state, and the collapse risk was eliminated. However, after t = 18.12 sec, the structural SS was less than the NS, indicating that the ESS of the structure was less than 0 and the structure collapsed (Case C). In the original test, the actual collapse time of the structure was 18.367 sec, which was close to the collapse time determined by the mechanical collapse assessment indicator, thus verifying the validity of the proposed indicator.
Energy time-history analysis
As seen in Figure 5(c), before t = 18.57 sec, the energy stability function S(t) (equation (12)) was consistently greater than 0 (i.e., the seismic input energy was always larger than the structural feature energy, and the structure remained in a safe working state. At t = 18.57 sec, the S(t) became less than 0, indicating the structure collapse. The prediction time of 18.57 sec was close to the actual collapse time of 18.367 sec, verifying the validity of the proposed energy stability function for structural collapse assessment.
Based on the above evaluation, the FEMA 350 maximum story drift ratio provides more accurate collapse assessment than GB 50011 and FEMA 356 among displacement-based methods. However, it remains an empirical threshold derived from statistical observations and does not fully reflect structural deformation characteristics, degradation mechanisms, or dynamic equilibrium states. In contrast, the proposed mechanical and energy indices are based on structural mechanical behavior and energy balance, showing better reliability and engineering applicability in seismic collapse identification.
Mechanical assessment indicators are based on the limit state of structural members or the overall structure, and can directly reflect abrupt mechanical failure. In contrast, energy-based indicators focus on the balance among energy input, dissipation, and accumulation. Since structures may still retain certain energy dissipation capacity after mechanical failure begins, the collapse times identified by the two methods are close but not completely consistent. Mechanical indicators are more intuitive, stable, and convenient for engineering application, while energy indicators involve more complex calculations and energy transformation mechanisms. Therefore, mechanical indicators are recommended as the primary method for collapse assessment, with energy indicators used as auxiliary verification to improve assessment accuracy and reliability.
Furthermore, the proposed indices are validated mainly under unidirectional horizontal seismic excitation, and the calculations of ESS and ETS are based on unidirectional displacement, restoring force, and P-Δ-induced equivalent negative stiffness. For bidirectional or three-dimensional ground motions, collapse assessment should further consider bidirectional lateral resistance coupling, second-order effects in both horizontal directions, torsional amplification, and biaxial bending-axial force interaction. In such cases, the scalar stiffness indices need to be extended to stiffness matrix-based indices. Since this study does not include three-dimensional nonlinear models, multidirectional excitations, or shaking table tests, the application of the proposed criterion to multidirectional seismic collapse assessment remains limited.
Collapse assessment for equivalent SDOF system
Structural design
To further verify the validity of the mechanical collapse assessment indicator and energy stability function for structural collapse assessment, an equivalent SDOF system was adopted to conduct the corresponding structural collapse analysis.
Figure 6(a) showed the equivalent SDOF model, with a structure height of H = 5 m and a concentrated mass of m = 20000 kg. To achieve elastoplastic analysis, a custom plastic hinge was employed in the ETABS to simulate nonlinear behavior, and the hysteretic rules were adopted from the literature (Ibarra et al., 2005) (refer to Figure 2). Based on the structural restoring force model in Section 2.2, two strength levels of skeleton curves were designed to define the structural plastic hinge (Figure 6(b)), where My,r and θy,r denoted the yielding moment and yielding rotation of the benchmark backbone curve, respectively. The reference skeleton curve (RSC) indicated the modified skeleton curve model proposed by Ibarra et al. (Ibarra et al., 2005), while the weakened skeleton curve (WSC) was set at 80% of the RSC. The RSC and WSC facilitated collapse assessment for equivalent SDOF systems of varying strengths and served as a reference for setting conditions in subsequent MDOF structural collapse layer assessments. Rayleigh damping was applied, with a damping ratio of ζ = 0.025. The P-Δ effect was taken into account, and the Newmark method (with γ = 0.5 and β = 0.25) was adopted for nonlinear time-history analysis. The time step was set to 0.01 sec. El Centro seismic wave was employed as the horizontal X-direction input, with PGA amplitude ranging from 0.1 g to 0.5 g and an amplitude gradient of 0.1 g. Single-degree-of-freedom structural cases and skeleton curve.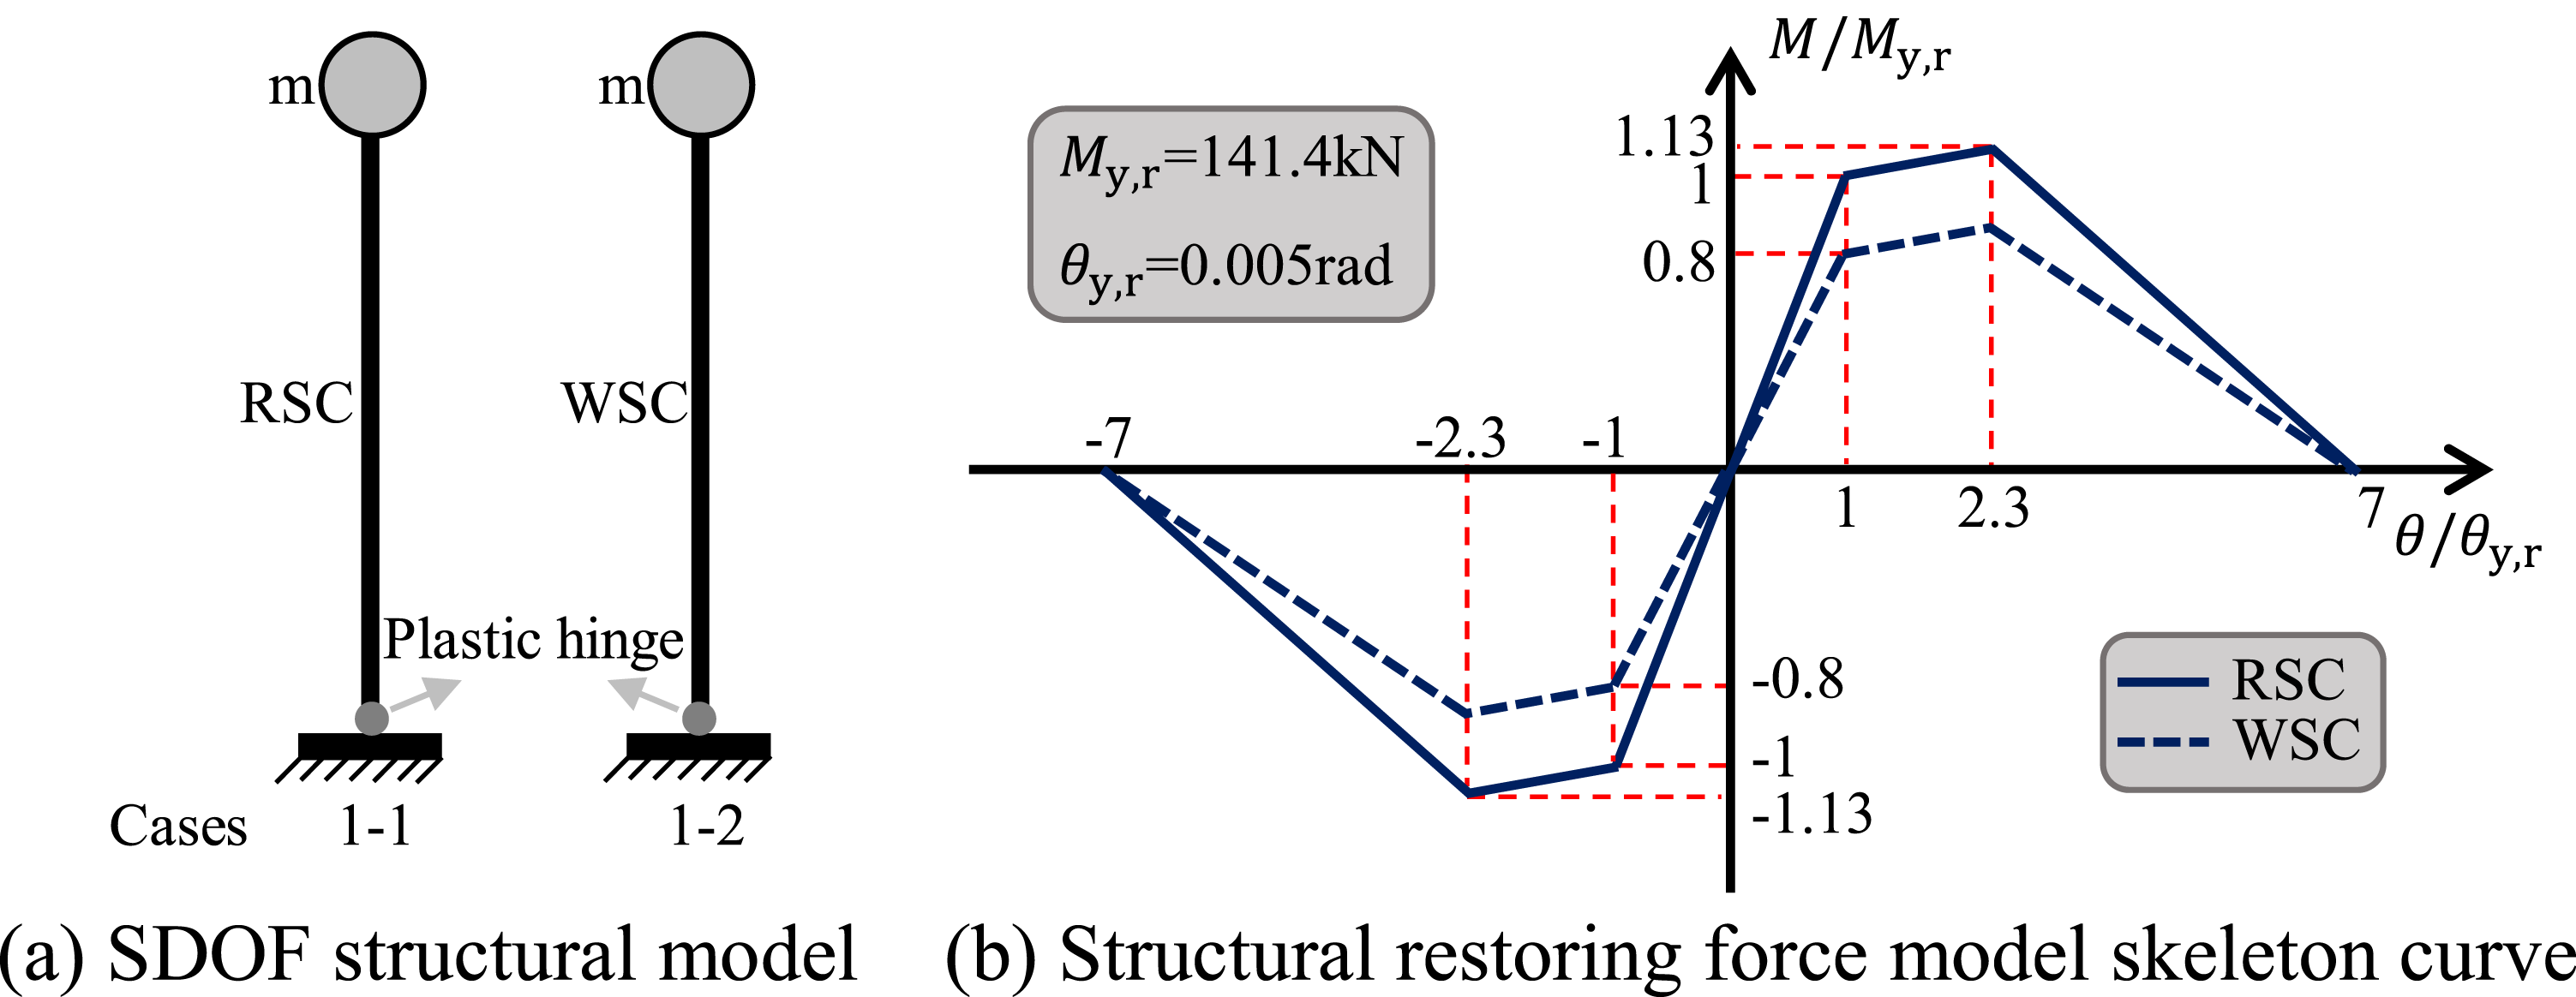
Analysis results
The analysis results of the equivalent SDOF system were processed in accordance with the data calculation method specified in Section 5.1.2. The drift ratio, stiffness variations, and energy variations for RSC and WSC are presented in Figure 7. Note that if the displacement exhibited sustained non-convergent growth at the end of the calculation, it was regarded that the structure collapsed under the corresponding seismic action. The structure with RSC collapsed at PGA of 0.5 g, while the structure with WSC collapsed at PGA of 0.4 g. This result demonstrated that the structure with RSC had superior seismic performance to that with WSC, which was in line with the expected scenario settings. Dynamic analysis results of the equivalent SDOF system.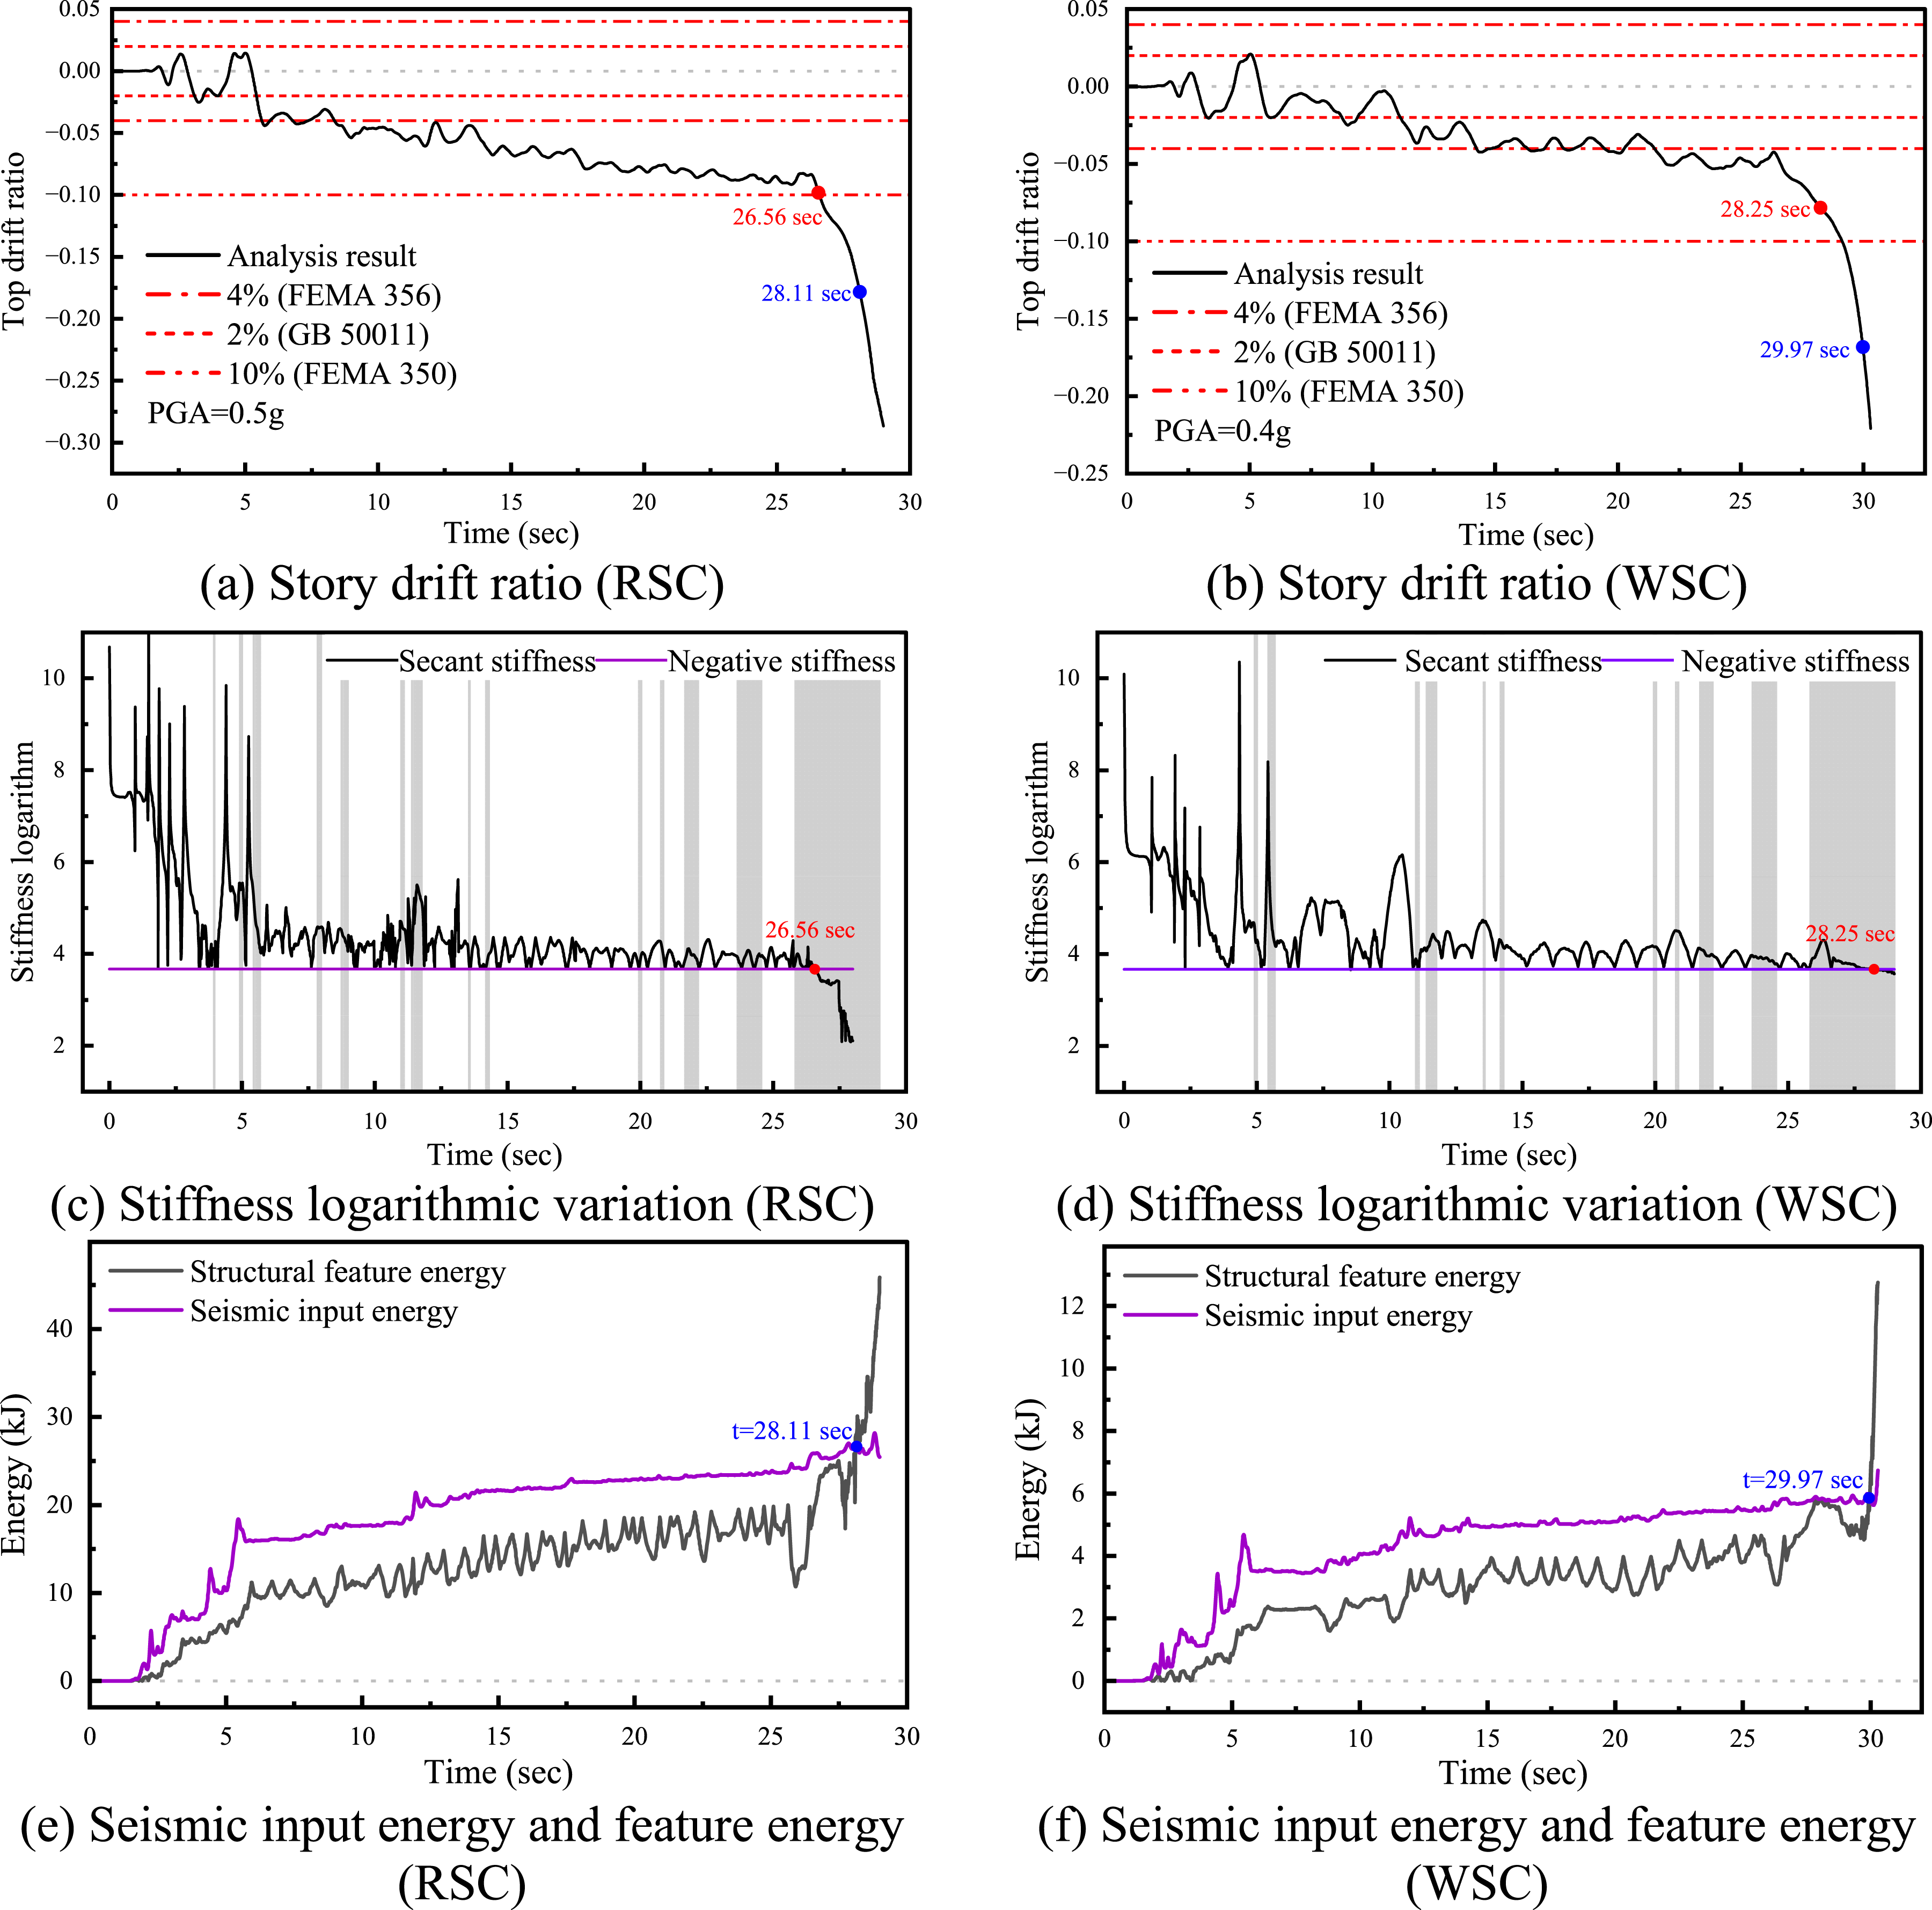
Displacement time-history analysis
As seen in Figure 7(a), the structure of Case 1-1 exceeded the allowable maximum story drift ratio specified in GB 50011 at t = 5.42 sec and specified in FEMA 356 at t = 8.38 sec. However, according to the development trend of the story drift ratio curve, the structure exhibited the tendency of reciprocating motion in the subsequent vibration process, indicating that the structure did not immediately collapse. In contrast, after t = 26 sec, the drift response of the structure showed sustained non-convergent growth, denoting that the structure initiated to collapse. FEMA 350 predicted the structural collapse time of t = 26.59 sec, which was within the interval where the structural story drift ratio exhibits sustained non-convergent growth. A similar conclusion was obtained for Case 1-2 (i.e., the predicted structural collapse time of t = 29.14 sec for FEMA 350).
Mechanical time-history analysis
Taking Case 1-1 as an example, as seen in Figure 7(c), the structural SS was less than the NS after t = 26.56 sec (i.e., the effective secant stiffness (ESS) was negative). According to the assessment indicators defined in Table 2, the structure collapsed (Case C), with the collapse time predicted as t = 26.56 sec. According to the story drift ratio time-history curve of Case 1-1, the story drift ratio of the structure exhibited sustained non-convergent growth after the moment, which was consistent with the collapse characteristics. Before the predicted collapse time of t = 26.56 sec, there were multiple sections of light gray shading in Figure 7(c), i.e., ETS < 0, meaning that the structure experienced short-term dynamic instability (Case B) for multiple times, posing the collapse risk. However, the structural system recovered to the safe working state under the sustained seismic excitation, and the collapse risk was thus eliminated accordingly. A similar conclusion was obtained for Case 1-2, and the collapse time of Case 1-2 under the PGA of 0.4 g was predicted as t = 28.25 sec. Comprehensive comparison of the analysis results between the displacement indices and mechanical indices in Case 1-1 and Case 1-2 reveals that the mechanical criteria can not only accurately identify the structural collapse moment, but also systematically characterize the evolution characteristics of the full-range mechanical state of the structure from elastic vibration and short-term dynamic instability to ultimate collapse under seismic action. The mechanical indices complement the limitations of the displacement indices that rely solely on deformation thresholds and fail to reflect the inherent dynamic equilibrium and stability changes of a structure. This also explains the phenomenon that the error in the collapse time judged by the two types of indices is small in Case 1-1 but relatively large in Case 1-2, and that the mechanical indices can more accurately identify the structural collapse moment.
Energy time-history analysis
The calculation results of the structural feature energy and seismic input energy from the time-history analysis of Cases 1-1 and 1-2 are shown in Figure 7(e) and (f). According to the energy-based structural collapse assessment indicator (equation (12)) and the calculation results, S(t) < 0 for Case 1-1 occurred after t = 28.11 sec (i.e., structural collapse time); and S(t) < 0 for Case 1-2 occurred after t = 29.97 sec. A separate comparison of the displacement time-history curves for each case in Figure 7(a) and (b) showed that the structural displacement response exhibited sustained non-convergent growth after these moments, which was consistent with the collapse characteristics. In addition, combined with the analysis results in Sections (1) and (2), it can be concluded that the collapse times obtained by the energy index, mechanical index, and FEMA 350-based displacement index in structural collapse assessment are relatively close.
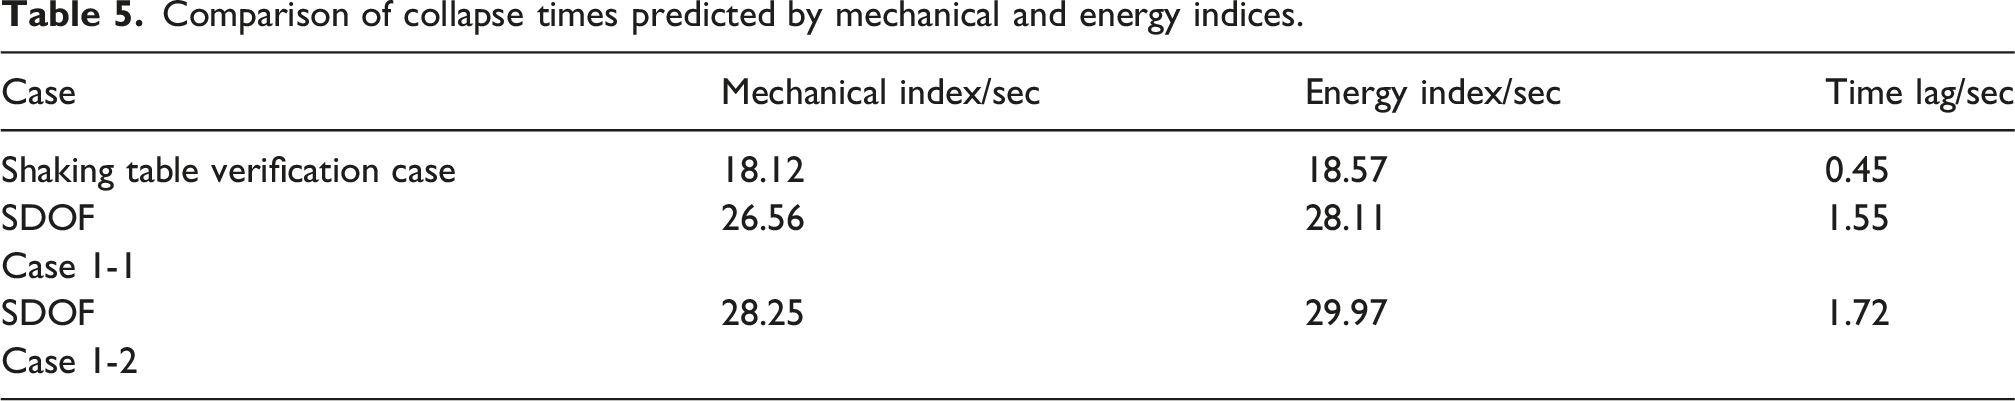
Discussion on time lag of collapse identification
Comparison of collapse times predicted by mechanical and energy indices.
Collapse assessment of MODF structures
Composition of MDOF structures.
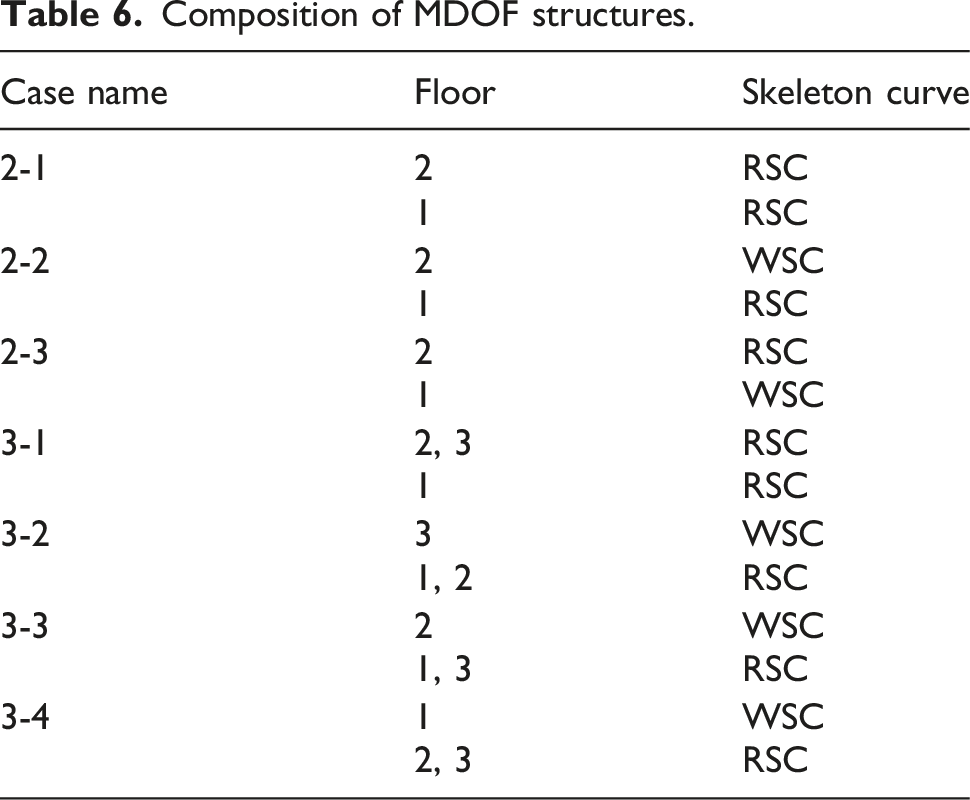
Collapse assessment of 2-DOFs structures
The analysis results of the 2-DOFs structure under three cases were presented in Figure 8. Cases 2-1, 2-2, and 2-3 collapsed at PGA of 0.4 g, 0.3 g, and 0.2 g, respectively. The earthquake load resistance and stability performance of the vertical regular structure (Case 2-1) were overall superior to those of the vertical irregular structures (Cases 2-2 and 2-3), consistent with the expected case settings. Dynamic analysis results of 2-DOFs structures.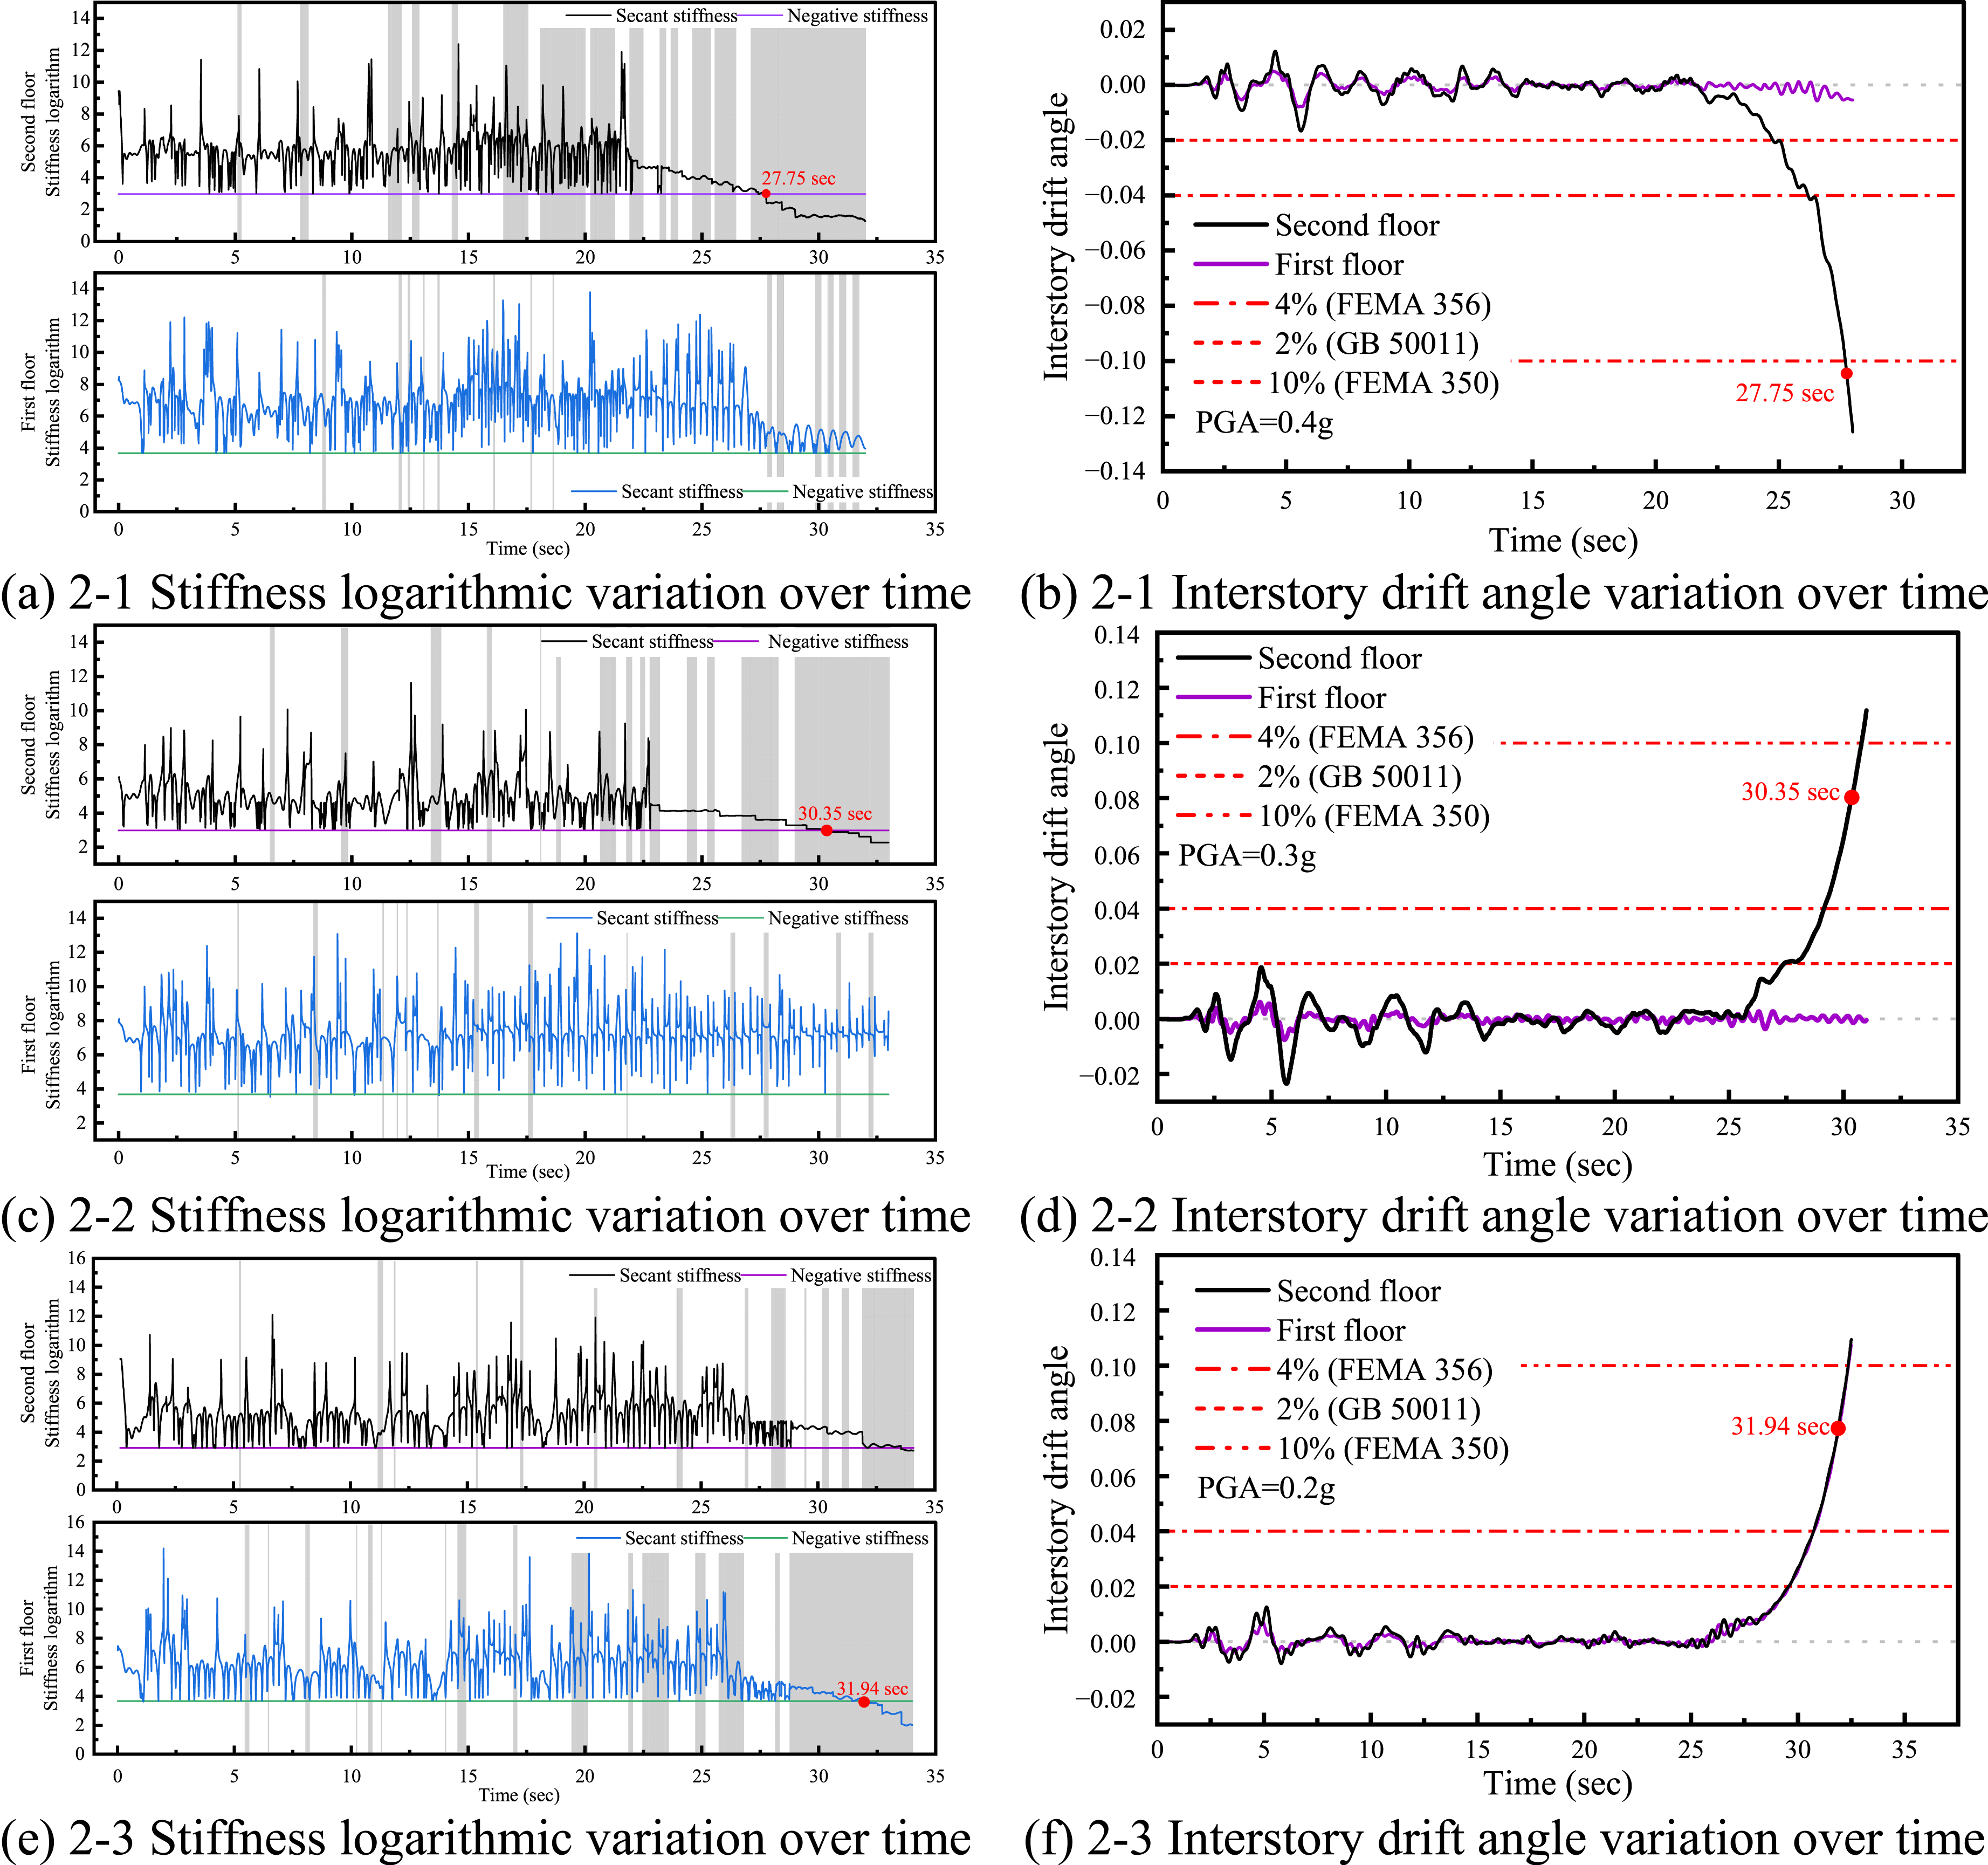
In Case 2-1, as shown in Figure 8(a), several short light-gray regions before t = 17.5 sec indicate transient dynamic instability with negative ETS. However, the structure subsequently returned to the safe state, suggesting that these responses only represented temporary collapse risk. After t = 17.5 sec, the duration of negative ETS increased, indicating intensified dynamic instability. In the near-collapse stage (t = 27.1∼30 sec), the ESS of the second story changed from positive to negative at approximately t = 27.75 sec, indicating loss of stability and collapse of the second story. Meanwhile, its story drift ratio showed continuous non-convergent growth, consistent with collapse behavior. In contrast, the ESS of the first story remained positive after t = 27.75 s, and its drift response stayed stable, indicating that the first story did not collapse.
In case 2-2, the ESS of the second floor turned negative first, indicating collapse initiated in the second floor. The ESS of the first story remained positive throughout, confirming that the structure did not collapse entirely.
In case 2-3, the ESS of the first floor turned negative first, indicating that its collapse preceded the second floor’s negative ESS shift, demonstrating story drift ratio chain reaction triggered by lower-story instability. According to the comprehensive evaluation above, the proposed MDOF structural collapse identification metric can effectively determine the collapsed floor location of 2 DOFs structures under earthquake loads.
Collapse assessment of 3-DOFs structures
The analysis results of the 3-DOFs structure under four cases are presented in Figure 9. Cases 3-1, 3-2, 3-3, and 3-4 collapsed at PGA of 0.4 g, 0.3 g, 0.3 g, and 0.2 g, respectively. The vertically regular structure (Case 3-1) exhibited superior seismic performance and stability, compared with the vertically irregular structures (Cases 3-2, 3-3, and 3-4), consistent with the expected case settings. Dynamic analysis results of 3-DOFs structures.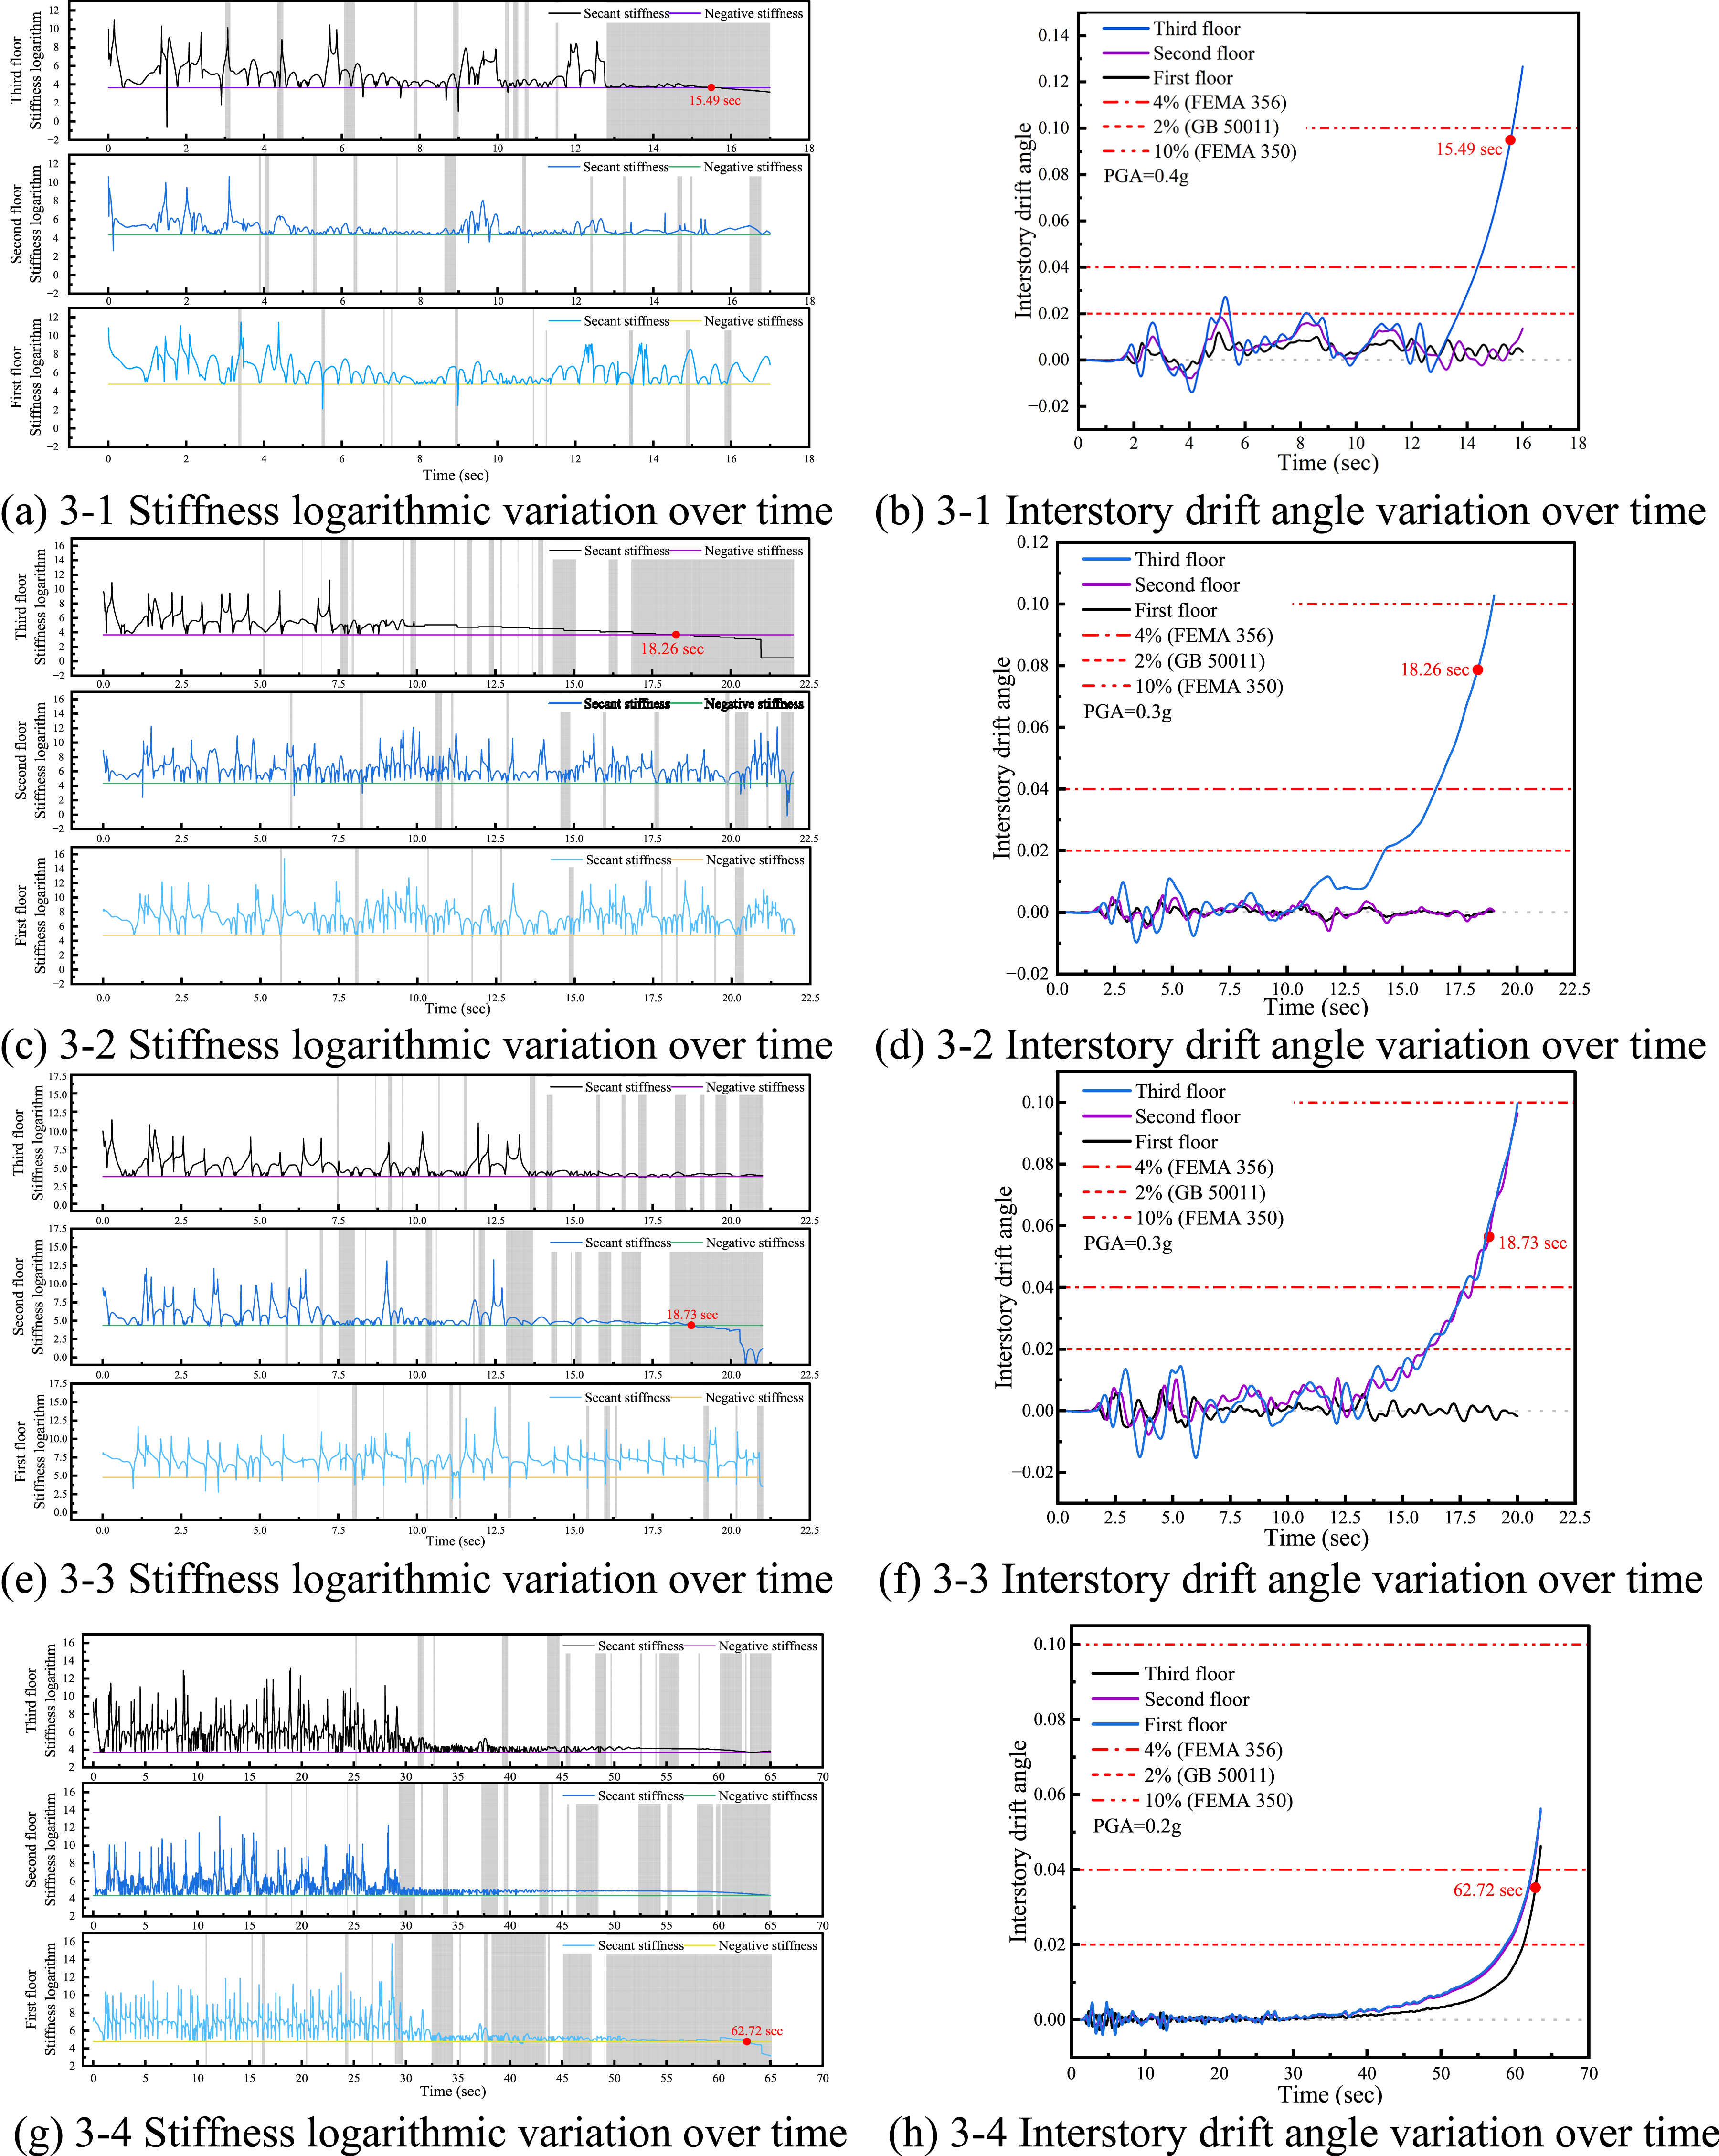
Taking case 3-1 as an example, although the structure exhibited transient dynamic instability during vibration (Case B), it rapidly recovered to the stable vibrational state (Case A) under seismic forces. Ultimately, when collapse occurred (Case C), the structure first entered the state of dynamic instability. Subsequently, during vibration, when the ESS transitioned from positive to negative, the structure began to collapse. Simultaneously, it could be observed that throughout the entire vibration process, the weak layer failed to effectively transmit forces to the upper structure after yielding. As a result, the tangent stiffness of the weak layer and the upper structure showed similar trends in their numerical time-history curve changes, with only minor variations above the safety threshold. Ultimately, the ESS curve of the weak layer first crossed the safety threshold, leading to structural collapse. Through the above analysis and verification, the proposed collapse story localization method in this study exhibits high accuracy and scientific rationality in identifying the collapse story of three-story structures under seismic excitation.
Based on the numerical results of the two-story and three-story structures under vertically regular and irregular conditions, the lumped mass model can effectively reveal the mechanical mechanism and rationality of the proposed collapse-story localization method. The method clearly characterizes the dynamic evolution process from elastic vibration and plastic development to final collapse. However, for vertically irregular structures, the equivalent simplification of the lumped mass model may cause deviations from the actual seismic response of real frame structures. Abrupt changes in stiffness, strength, and mass can alter modal characteristics and enhance higher-mode effects, making collapse initiation jointly affected by higher-mode responses, local deformation concentration, dynamic amplification, and story shear redistribution. These complex effects cannot be fully captured by the lumped mass model. Therefore, this study preliminarily verifies the feasibility of applying the proposed mechanical indicators to MDOF collapse-story identification, while further validation using practical frame models with vertical regularity and irregularity is still needed.
Conclusions
This study focused on the core issues of collapse identification and initial collapsed story localization in RC frame structures under earthquake loads. Through theoretical modeling, indicator development, and case validation, an integrated seismic collapse analysis method that accounts for both P-Δ effects and mechanical property degradation was proposed. The principal conclusions are as follows: (1) A structural restoring force backbone curve model addressing the strength degradation, stiffness degradation, and P-Δ effect was established, and the I-K hysteresis rule was combined for cyclic behavior. The coupling mechanism between P-Δ effect and structural performance degradation under cyclic loading was quantified to describe the mechanical response during large-deformation stage at subsequent collapse. (2) Three categories of structural collapse indicators were defined: (1) Displacement indicators based on story drift ratio; (2) Mechanical criteria indicators based on static equilibrium states through effective secant stiffness (ESS) and dynamic stability through effective tangent stiffness (ETS); (3) Energy stability function based on the equilibrium relationship between seismic input energy and structural characteristic energy. (3) Comparison between 1:2-scaled RC frame shaking table test and ETABS analysis result revealed that the mechanical criteria and energy criteria predicted well the collapse time. In particular, the mechanical criteria can not only intuitively reflect the basic mechanical mechanisms of structural static and dynamic equilibrium, but also possess the simplicity and operability required for engineering practice. (4) For the SDOF system, the dynamic equation considering the P-Δ effect was derived, and the collapse response was simulated using a trilinear degrading backbone curve and the I-K hysteretic rule. The proposed mechanical and energy indices accurately identified the collapse moment and showed good consistency with actual collapse behavior. The mechanical index reveals the evolution of static equilibrium and dynamic stability, overcoming the limitations of traditional displacement-based indices with simple calculation and stable results. The energy index provides supplementary verification from the perspective of global energy balance, and their combined use improves the accuracy and reliability of collapse assessment. (5) For MDOF systems, existing structural collapse detection methods cannot accurately decide the initial collapsed floor. This study derived the force transmission patterns across floors, proposed a method for calculating effective inter-story stiffness, and established criteria for identifying the collapse initiation floor. In case studies of 2 and 3-story regular and irregular structures, the proposed method efficiently identified vulnerable stories and precisely traced progressive collapse paths.
Footnotes
Funding
That research was sponsored by the National Natural Science Foundation of China (Grant No 52278498 and No 51878268), the Huxiang Youth Talent Support Program of Hunan Province, China (2021RC3041), and the National Research Foundation of Korea (NRF) grant funded by the Korea government (MSIT) (No RS-2024-00409719).
Declaration of conflicting interests
The authors declared no potential conflicts of interest with respect to the research, authorship, and/or publication of this article.