
Abstract
This paper presents estimation of 28 GHz band wave propagation using machine learning. Electromagnetic waves in millimeter wave (mmWave) band, such as 28 and 39 GHz, are used for 5G communications. Because electromagnetic waves in the mmWave band are affected by obstructions, estimation of radio propagation is necessary. In this study, we use machine learning to estimate the wave propagation of electromagnetic waves in the 28 GHz band in order to estimate the effect of obstacles. The analytical model and results obtained by the ray tracing method was used as the training data for the machine learning. The results obtained by the convolutional neural network yielded good estimates. Its coefficient of determination was 0.91.
Introduction
5th generation mobile communication system (5G) uses electromagnetic waves in the millimeter wave (mmWave) band such as 28 and 39 GHz, which has a wide frequency band width for high-speed communications. 1 Furthermore, 6G communications have been considered for the use of sub-THz band electromagnetic waves. Millimeter waves have the disadvantages of large free space path loss and susceptibility to obstructions. To overcome this problem, it is necessary to monitor and dynamically control the mmWave propagation. 2 5G communications dynamically control the transmitted electromagnetic waves by beamforming technique. To control radio propagation, metasurfaces that use PIN diodes to change the phase of reflected waves 3 and liquid crystals to change the reflection angle of reflected waves 4 have been proposed. Several models of propagation path loss of line of sight and non-line of sight scenarios have been proposed to predict electromagnetic wave propagation. 5 In addition, estimation of radio propagation using machine learning has been reported.6–8 Electric field due to the placement of walls, windows, and doors is estimated by machine learning. 6 The received power strength of Wi-Fi in the 5 GHz band is estimated by machine learning using the results obtained by the ray tracing method and small amount of measurement data as training data. 7 And mmWave received power prediction using point cloud data obtained by light detection and ranging is reported. 8
In the actual communication environment, obstacles such as people and robots move randomly, and mmWave electromagnetic waves are affected by obstacles over a wide area. Therefore, it is necessary to estimate the propagation of mmWave due to randomly placed obstacles. In this study, we propose a convolutional neural network (CNN) based prediction of 28 GHz band wave propagation. Analytical models and results of ray tracing method are used as training data set for the CNN. This paper will be organized as follows: in section 2, training data set and network configuration of CNN will be described, and Section 3, the estimation results obtained by CNN and application to measurement data will be presented. Section 4 will explain conclusions.
Machine learning
Training data
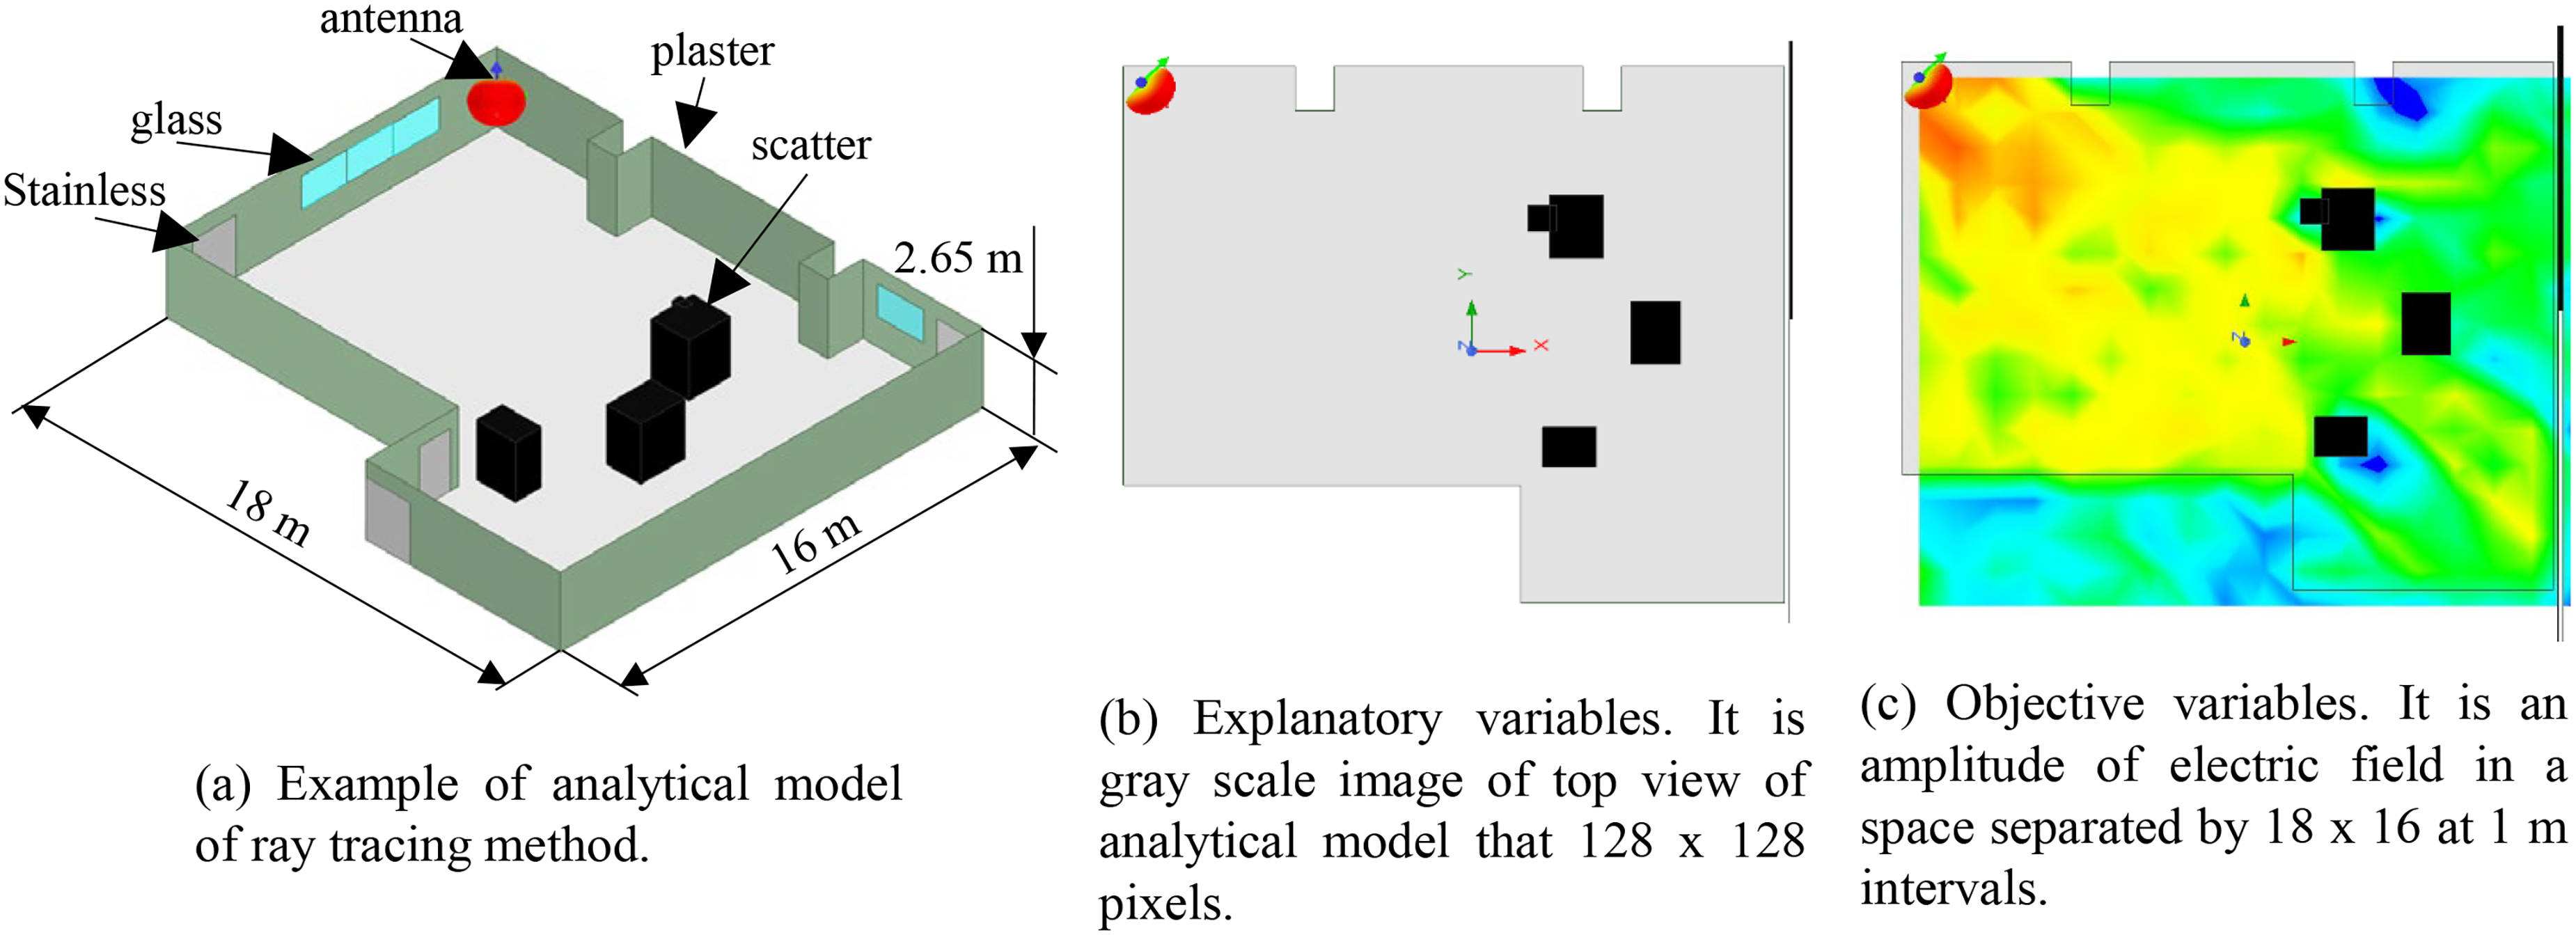
In this research, the training data shown in Figure 1 are used to estimate the change in 28 GHz band radio propagation due to changes in the arrangement of scatters. Figure 1(a) shows an analytical model of room composed of stainless-steel doors, plaster wall, windows, stainless-steel floor, and plaster ceiling with a height of 2.65 m. Scatters are randomly placed in the room. In the ray tracing method at 28 GHz band, radio waves incident on a stainless and scatter plane are reflected, and radio waves incident on a glass and plaster are transmitted and refracted according to its dielectric constant. The scatterers have the following specifications: 1) number: 1 to 4, 2) width and depth: 0.5 m to 2 m, 3) height: 2 m, 4) material: aluminum.
Training data set obtained by ray tracing method.
Figure 1(b) shows explanatory variables of machine learning. It is a gray scale image of top view of analytical model that 128 × 128 pixels. Figure 1(c) shows contour plots of objective variables. It is an amplitude of the electric field in a room separated by 18 × 16 at 1 m intervals. The antenna is positioned in the upper left corner as shown in Figures 1(b) and (c). A horizontal beam width is 120 deg and vertical beam width is 60 deg. In this study, 1500 training data sets and 100 test data sets with randomly placed scatterers are created by ray tracing method. We used HFSS SBR + version 2023 R2 for the ray tracing method. CPU is the Intel (R) Xeon (R) Gold 6230, and GPU is a Quadro RTX 6000. The analysis time to create one training data set was 11 min.
Convolutional neural networks
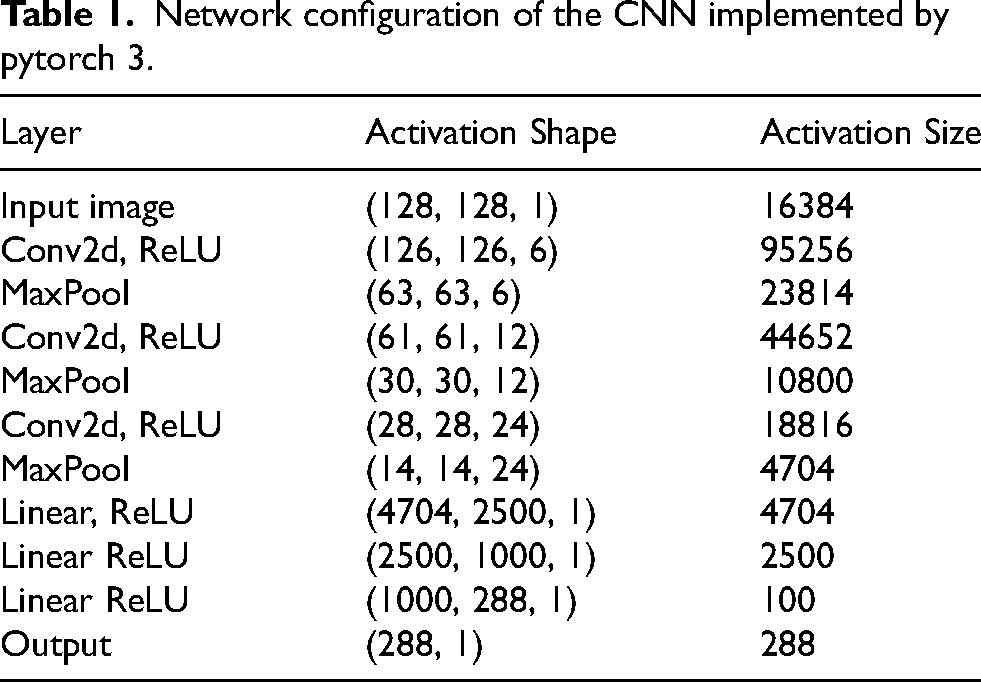
The effect of wave propagation due to the movement of the scatterers is estimated by convolutional neural networks (CNN) in this research. The CNN in this study is implemented using Pytorch 3 as shown in Table 1. Conv2d and ReLU indicate that the convolutional layer and the rectified linear unit. An activation shape of Conv2d shows (Input dimension, Input dimension, Number of filters). MaxPool is a max pooling layer with 2 × 2 kernel. Linear shows fully-connected layer. An activation shape of Linear shows (Input unit, Output unit, Dimension). In this CNN, the number of batches is 100, the loss function is mean squared logarithmic, optimization method is an adaptive moment method.
Network configuration of the CNN implemented by pytorch 3.
Estimation results
Estimation by CNN
Figure 2 shows wave propagations with metal scatter in the room shown in Figure 1(a). The determination coefficient R2 is expressed as

Estimation electromagnetic wave obtained by ray tracing method and CNN.
Figure 2 shows that the estimation by the CNN agrees well with the results calculated by the ray tracing method. Figure 2(a) and (b) show radio propagation obtained by ray tracing method and the results best and worst estimated by CNN. It can be seen that radio waves are emitted from the upper left of the figure, and the tendency for the magnitude of the radio waves to decrease behind obstacles is well estimated. Estimation results are best when the number of obstacles is one. The average R2 values for different numbers of scatterers are shown in Table 2. It can be seen that the estimation accuracy deteriorates as the number of obstacles increases.
Average R2 for the number of scatterers.

Application to measurement results
The estimation results obtained by CNN is plied to the measurement results obtained by the 5G user equipment (UE). In this study, K5G-C-100A manufactured by KYOCERA Corporation is used as the 5G UE. Since the value that can be obtained by 5G UE is received signal strength indicator (RSSI), the following equation is used to estimate the effect of obstacles from the measured data of a reference without obstacles,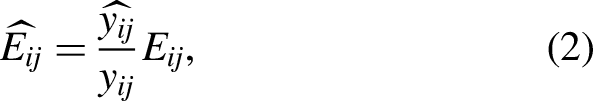
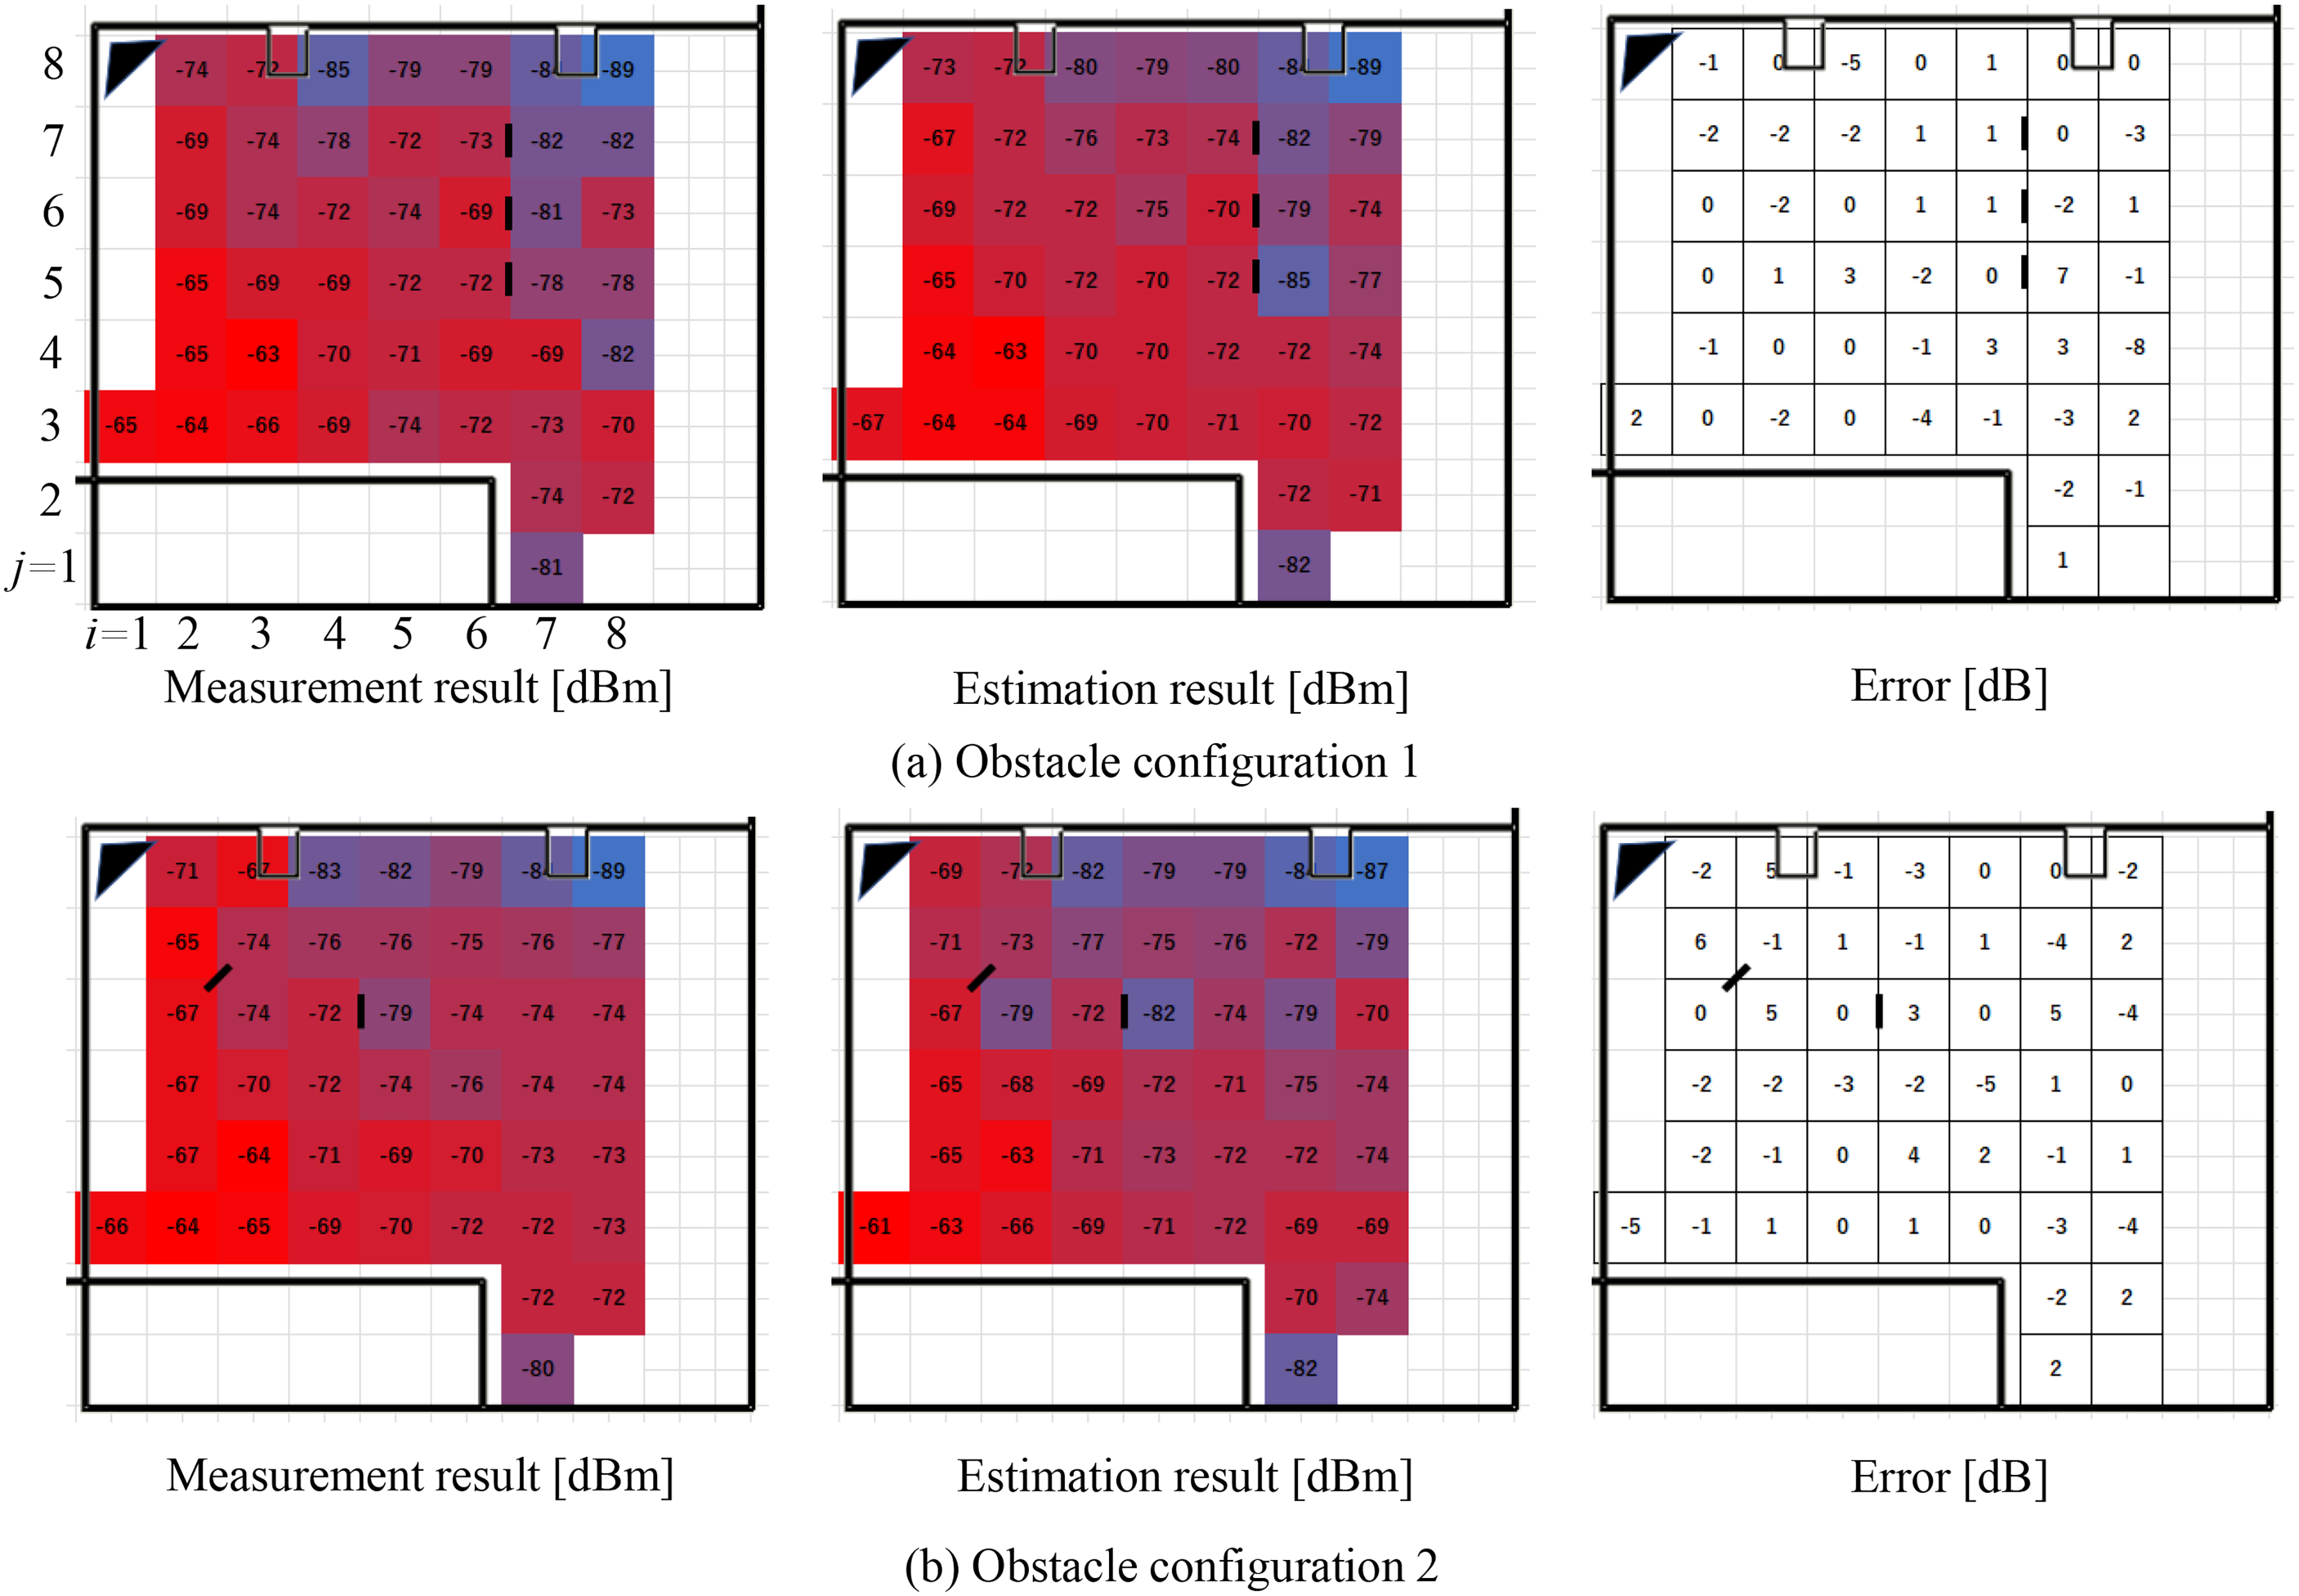
28 GHz band RSSI obtained by measurement and estimation with CNN. The black lines indicate obstructions on the aluminum plate.
In the experiment, several aluminum plates are placed as obstacles as shown in Figure 3. Height, width, and depth of aluminum plates are set to 1 m, 1 m, and 5 mm. Figure 3 shows the RSSI measured by the 5G UE and the estimated value obtained by Equation (2). Figure 3(a) shows the configuration with the three aluminum plates shown in Figure 4, and (b) shows the configuration with 2 aluminum plates near the local 5G base station. The value of each cell in Figure 3 is RSSI [dBm]. The error in Figure 3 shows the discrepancy between the measurement and estimation values. In this experiment, it was found that changes in radio wave propagation due to scatterers can be estimated using a CNN with a maximum error of less than 8 dB and a root mean square error of less than 2.5 dB Figure 3 shows that the estimation results express a trend toward a larger RSSI near the antenna and a smaller RSSI behind the pillars in the upper part of the figure and aluminum obstacles.
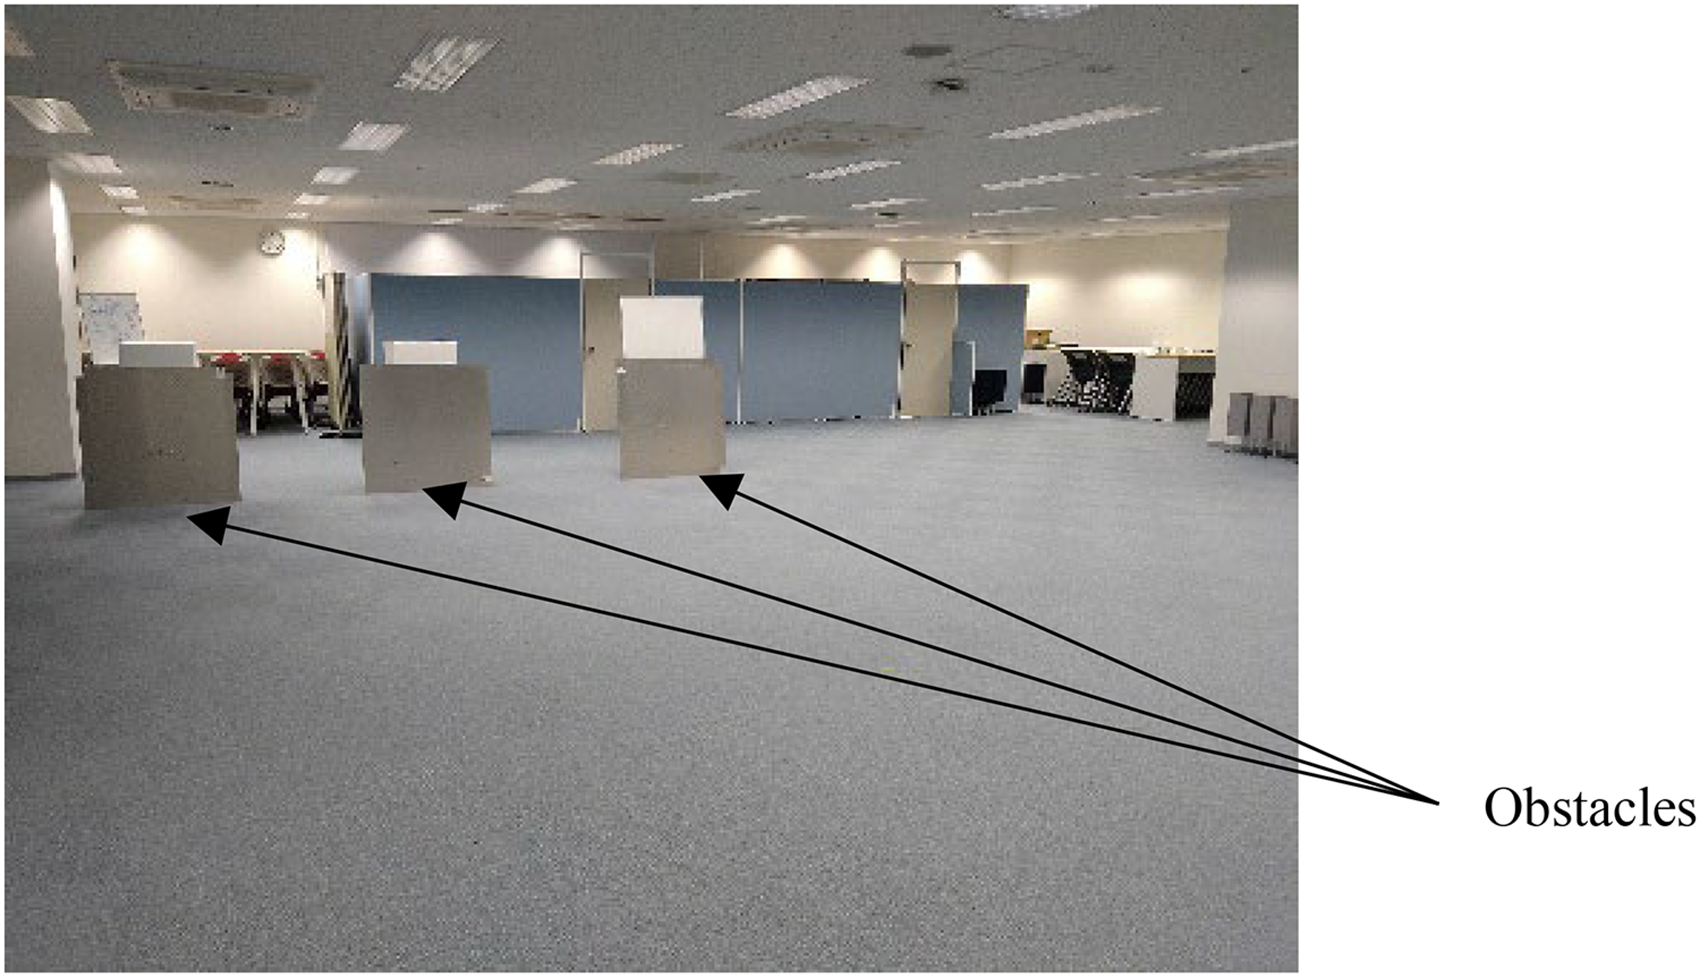
Example of obstacle placement. The obstacle is an aluminum plate that height is 1 m, width is 1 m, and depth is 5 mm,.
Conclusion
The effect of 28 GHz band wave propagation due to changes in the placement of obstacles for 5G communications is estimated by CNN. The analytical model and results of the ray tracing method are used as training data for CNN. The coefficient of determination for the prediction results obtained by the CNN was 0.91. This indicates that the prediction results obtained by the CNN are a good estimate of the analysis results of the ray tracing method. The accuracy of estimation by CNN was found to decrease as the number of obstacles increased.
The ratio of the estimated results in the presence of obstacles to the results in the absence of obstacles was used to estimate the measurement results for 5G UE. Estimation of experimental results was found to represent well the reduction in RSSI behind obstacles that is an aluminum plate.
Footnotes
Funding
The authors received no financial support for the research, authorship, and/or publication of this article.
Declaration of conflicting interests
The authors declared no potential conflicts of interest with respect to the research, authorship, and/or publication of this article.