
Abstract
Background
Functional materials such as piezoelectrics can be used as sensors. Increases in the performance and output power of functional materials will open up new applications. Piezoelectric materials generate electricity when pressure is applied or when they are deformed. Piezoelectrets are materials that store electric charge when a high voltage is applied and generate electricity when electrodes are brought closer or moved apart. This study focused on inexpensive, mass-producible general-purpose rubber. Previously conducted testing with general-purpose rubber mixed with various amounts of lead zirconate titanate revealed that rubber without lead zirconate titanate can also generate electricity.
Objective
In this study, a piezoelectret composed of isobutylene isoprene rubber (IIR) and fluorinated ethylene propylene film (FEP) is proposed. IIR is made of commonly used materials. The power generation model of the proposed piezoelectret is developed and evaluated.
Methods
Surface potential measurements and a cyclic forced overload experiment were conducted. The results obtained using the power generation model for the piezoelectret were compared to experimental results.
Results
The surface potential and piezoelectric stress constant d33 decreased immediately after the corona charge process but were maintained beyond day 7. The average d33 value after 2 weeks was 475.2 pC/N, which is much higher than that for polyvinylidene fluoride (∼40 pC/N), a representative piezoelectric material. The results obtained using a power generation model that considers piezoelectric- and electrostatic-type generation showed qualitatively reasonable agreement with the experimental results.
Conclusions
A piezoelectret made of IIR has potential for high power generation. It was confirmed that piezoelectrets based on general-purpose rubber exhibit high power generation performance. The power generation model showed qualitative agreement with the experimental results.
Keywords
Introduction
Functional materials such as piezoelectrics can be used as sensors. Increases in performance and electric power output would allow devices based on such materials to have diverse applications. For example, a generator that could automatically start up and supply power during a power outage could be used for monitoring and data collection in locations where power is unavailable. For the manufacturing of products such as cars, planes, and ships, digital twins have become more widely used. Therefore, the characterization of new materials is very important.
Many novel materials have recently been developed. Zhong et al. 1 reported that piezoelectret-type devices composed of top and bottom fluorinated ethylene propylene (FEP) electret films, a middle Ecoflex spacer, and gold and aluminum electrodes at the top and bottom surfaces have a high piezoelectric coefficient. Ichikawa et al. 2 proposed an electrostatic energy harvester that comprises an electret and a dielectric elastomer and reported that it generated high power from low-frequency movements. Ghosh et al. 3 reported polyvinylidene fluoride-co-hexafluoropropylene doped with platinum nanoparticles as a new type of ferroelectric nanogenerator. Shi et al. 4 reported that a self-powered piezoelectret sensor made of low-density polyethylene foamed plastic garbage had a high equivalent piezoelectric coefficient. Zhang et al. 5 reported thermally stable electrets made of polytetrafluoroethylene or FEP films. Ennawaoui et al. 6 reported a porous copolymer film with the pseudo-piezoelectric effect, which was produced using a porous ethylene-vinyl acetate film. Zhua et al. 7 reported a power generation method that uses triboelectric nanogenerator technology. Hamdi et al. 8 reported a method for improving the piezoelectric properties of polyethylene electrets with a cellular structure. Bo Wang et al. 9 reported an ultrasensitive cellular carbon fluoride piezoelectret pressure sensor. Zhong Lin Wang et al. 10 reported blue energy harvesting using triboelectric nanogenerator technology. Cao et al. 11 reported ferroelectret polymers with a strong piezoelectric effect and their interface with self-powered and energy storage systems. Ennawaoui et al. 12 reported that porosity has a significant effect on the mechanical proprieties and power of piezoelectric porous polymers. Zou et al. 13 reported the key role of mechanical modulations for energy harvesting. Xi et al. 14 reported the efficient power management of triboelectric nanogenerators using a power management module. Zhao et al. 15 reported that ocean kinetic energy harvesters have potential for powering ocean sensors. Stephen et al. 16 reported that the maximum power flowing into a vibration power generation device depends on the frequency and amplitude of the force and device size. Sabzpoushan et al. 17 reviewed methods for manufacturing and evaluating electrets and reported that lifetime, stability, and charge efficiency are issues. Shi et al. 18 proposed a self-powered piezoelectret sensor with basic material of low density polyethylene (LDPE) foamed plastic garbage. Li et al. 19 introduced a flexible pressure sensor based on tetrafluoroethylene−hexafluoropropylene−vinylide (THV)/cyclic olefin copolymer (COC) piezoelectret nanogenerator. Zhang et al. 20 reviewed an overview of ferroelectret materials for energy harvesting applications. Moreira et al. 21 provided a description of the most relevant methods, starting with a brief introduction of piezoelectret origin and piezoelectret production. Sasaki et al. 22 fabricated prototype piezoelectrets and conducted surface potential measurements and a cyclic forced overload experiment. The piezoelectric stress constant was derived from the results of the experiment. Cao et al. 23 proposed a harvester with a dynamic magnifier that magnifies the base vibration and enhances electric energy in a low-frequency complicated environment. Cao et al. 24 designed a multistable rotation piezoelectric energy harvester that features a beam with a variable cross section and proposed a synergistic transition and regulation mechanism based on the guidance of the harvester's evolution and variable cross-section design. Xie et al. 25 proposed a harvester that utilizes centrifugal force to compress a spring, dynamically adjusting the distance between a magnet on the tip of the cantilever beam and a fixed-end magnet.
Previous studies adopted various materials, such as silicone rubber and a porous polymer, to develop a piezoelectret. Furthermore, improved devices have been proposed to enhance power generation performance, such as increasing power generation capacity in the low-frequency range and enabling variable frequency operation. In the present study, to realize vibration power generation that utilizes the elasticity of rubber, a piezoelectret composed of isobutylene isoprene rubber (IIR) and FEP film is proposed. Prototype piezoelectrets are fabricated and their performance is evaluated. The principle of piezoelectret power generation is unclear. Therefore, a power generation model is developed and evaluated.
Fabrication of piezoelectret
The experimental setup is shown in Figure 1. An IIR sheet (Kurashiki Kako Co., Ltd, thickness: 1 mm, hardness: 60) was sandwiched between FEP films and a corona charge process was performed using a high-voltage power supply (Matsusada Precision Inc., HJPQ-30P1). The IIR sheet was a square with a side length of 30 mm. The thickness of the FEP film (AS ONE, 3-5587-03) was 50 µm. The film was a square with a side length of 50 mm. Spray glue (3 M Japan Limited, Spray Glue 77) was used for adhesion. A voltage of 20 kV was applied to the specimens for 10 min. A gap of 20 mm was maintained between the electrode and the material. The fabricated materials are shown in Figure 2. Five samples were prepared and evaluated. The average values are reported.
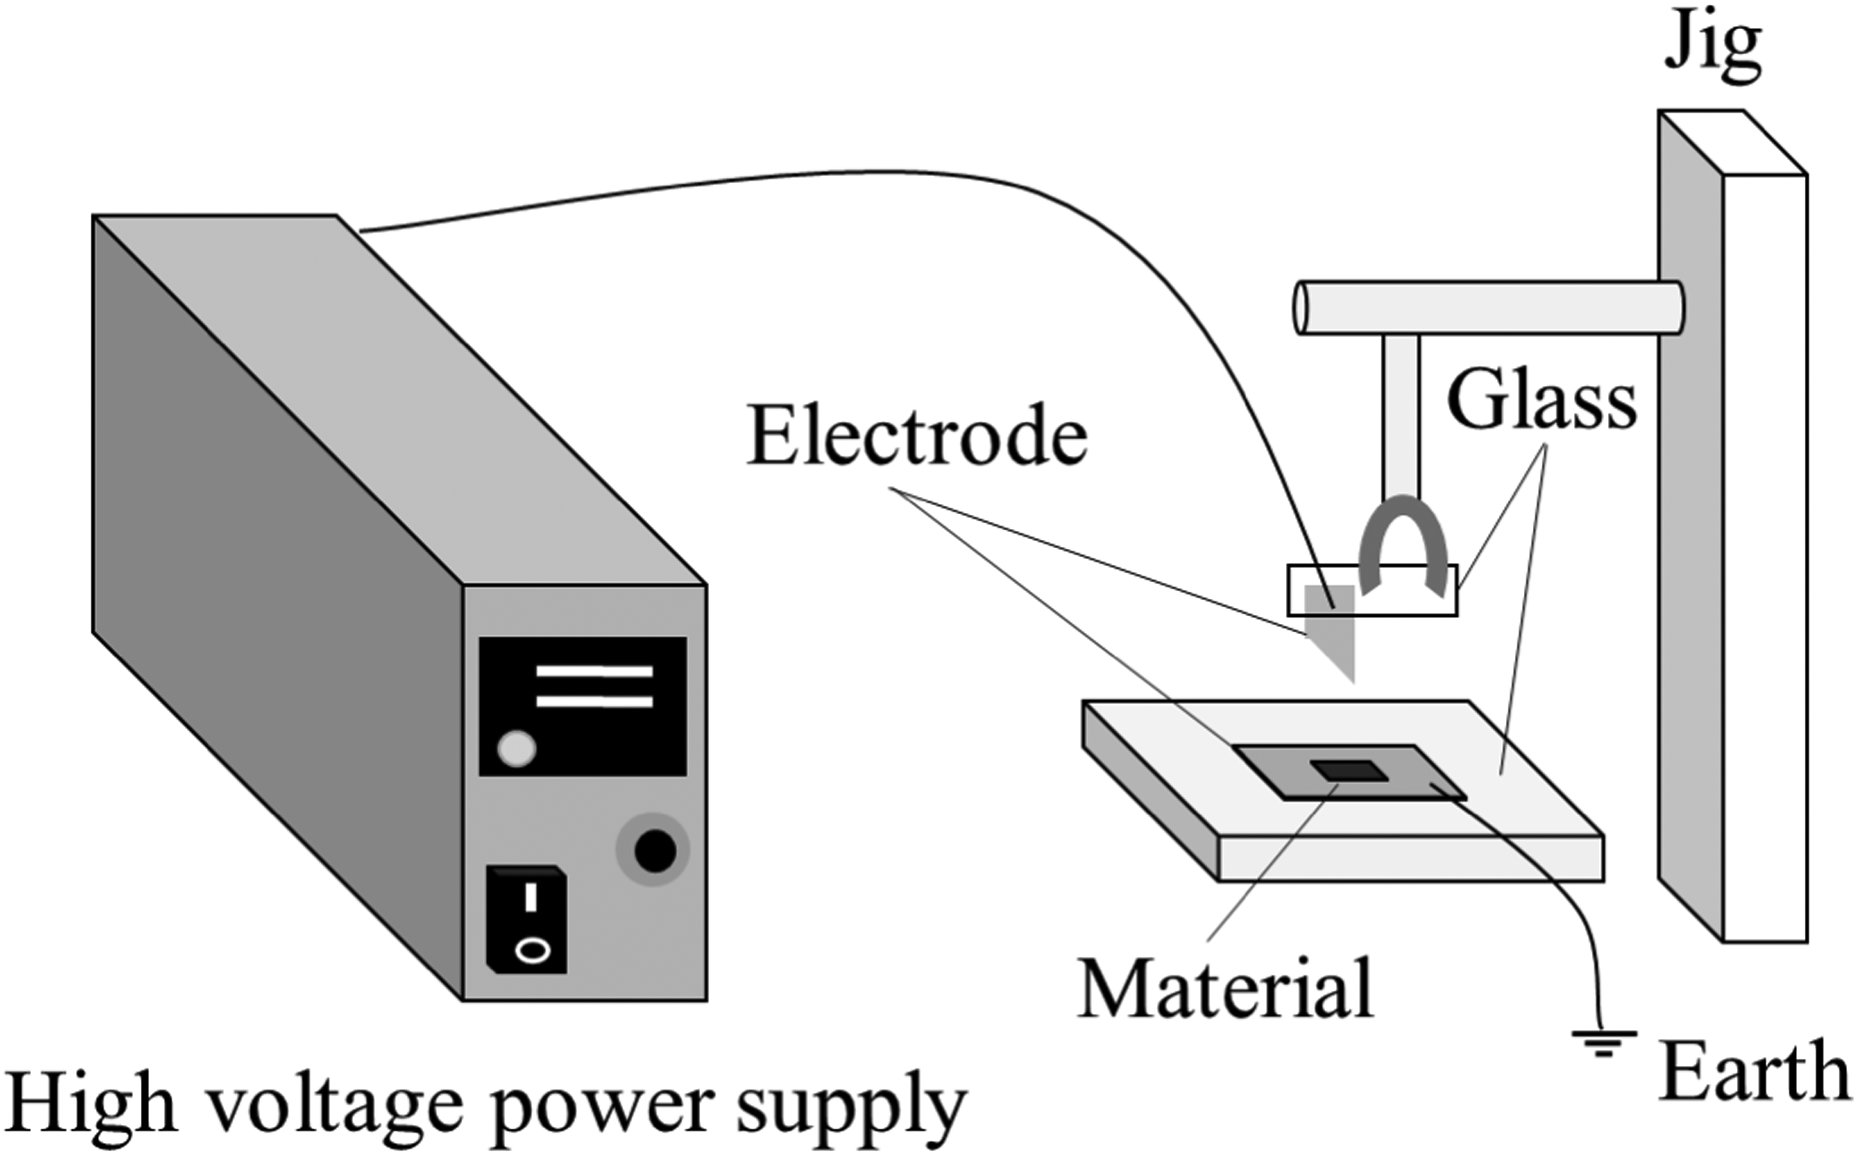
Experimental setup for corona charging.
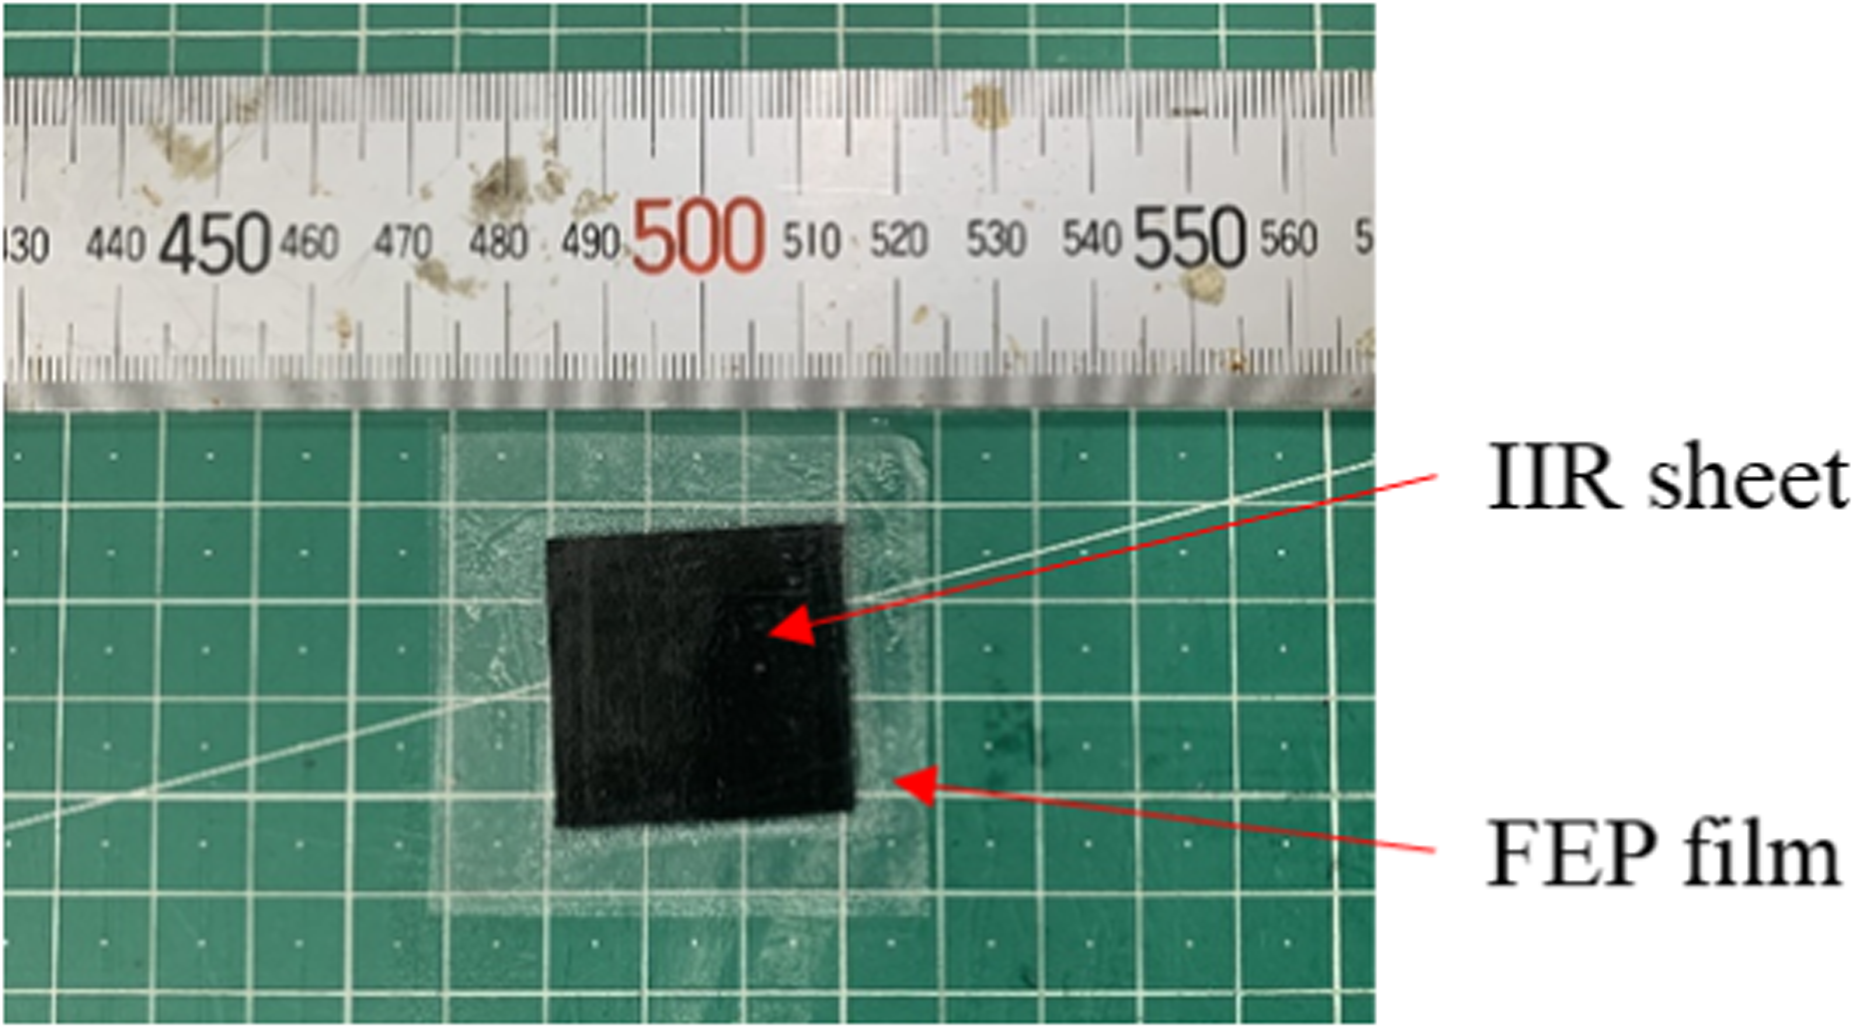
Photograph of test specimen.
Surface potential measurement
Equipment used for surface potential measurement
The measurement equipment, shown in Figure 3, consisted of a surface potential measurement instrument (AS ONE, KSD-2000), a detection probe, and a copper plate. The surface potential measurement instrument was connected to the copper plate and the detection probe. The material was placed on the copper plate. The sensor part of the detection probe was held over the material to measure the surface potential. The potential at five points (i.e., at the corners and center of the material) was measured and the average value was calculated. Measurements were taken every 2 days for 2 weeks.
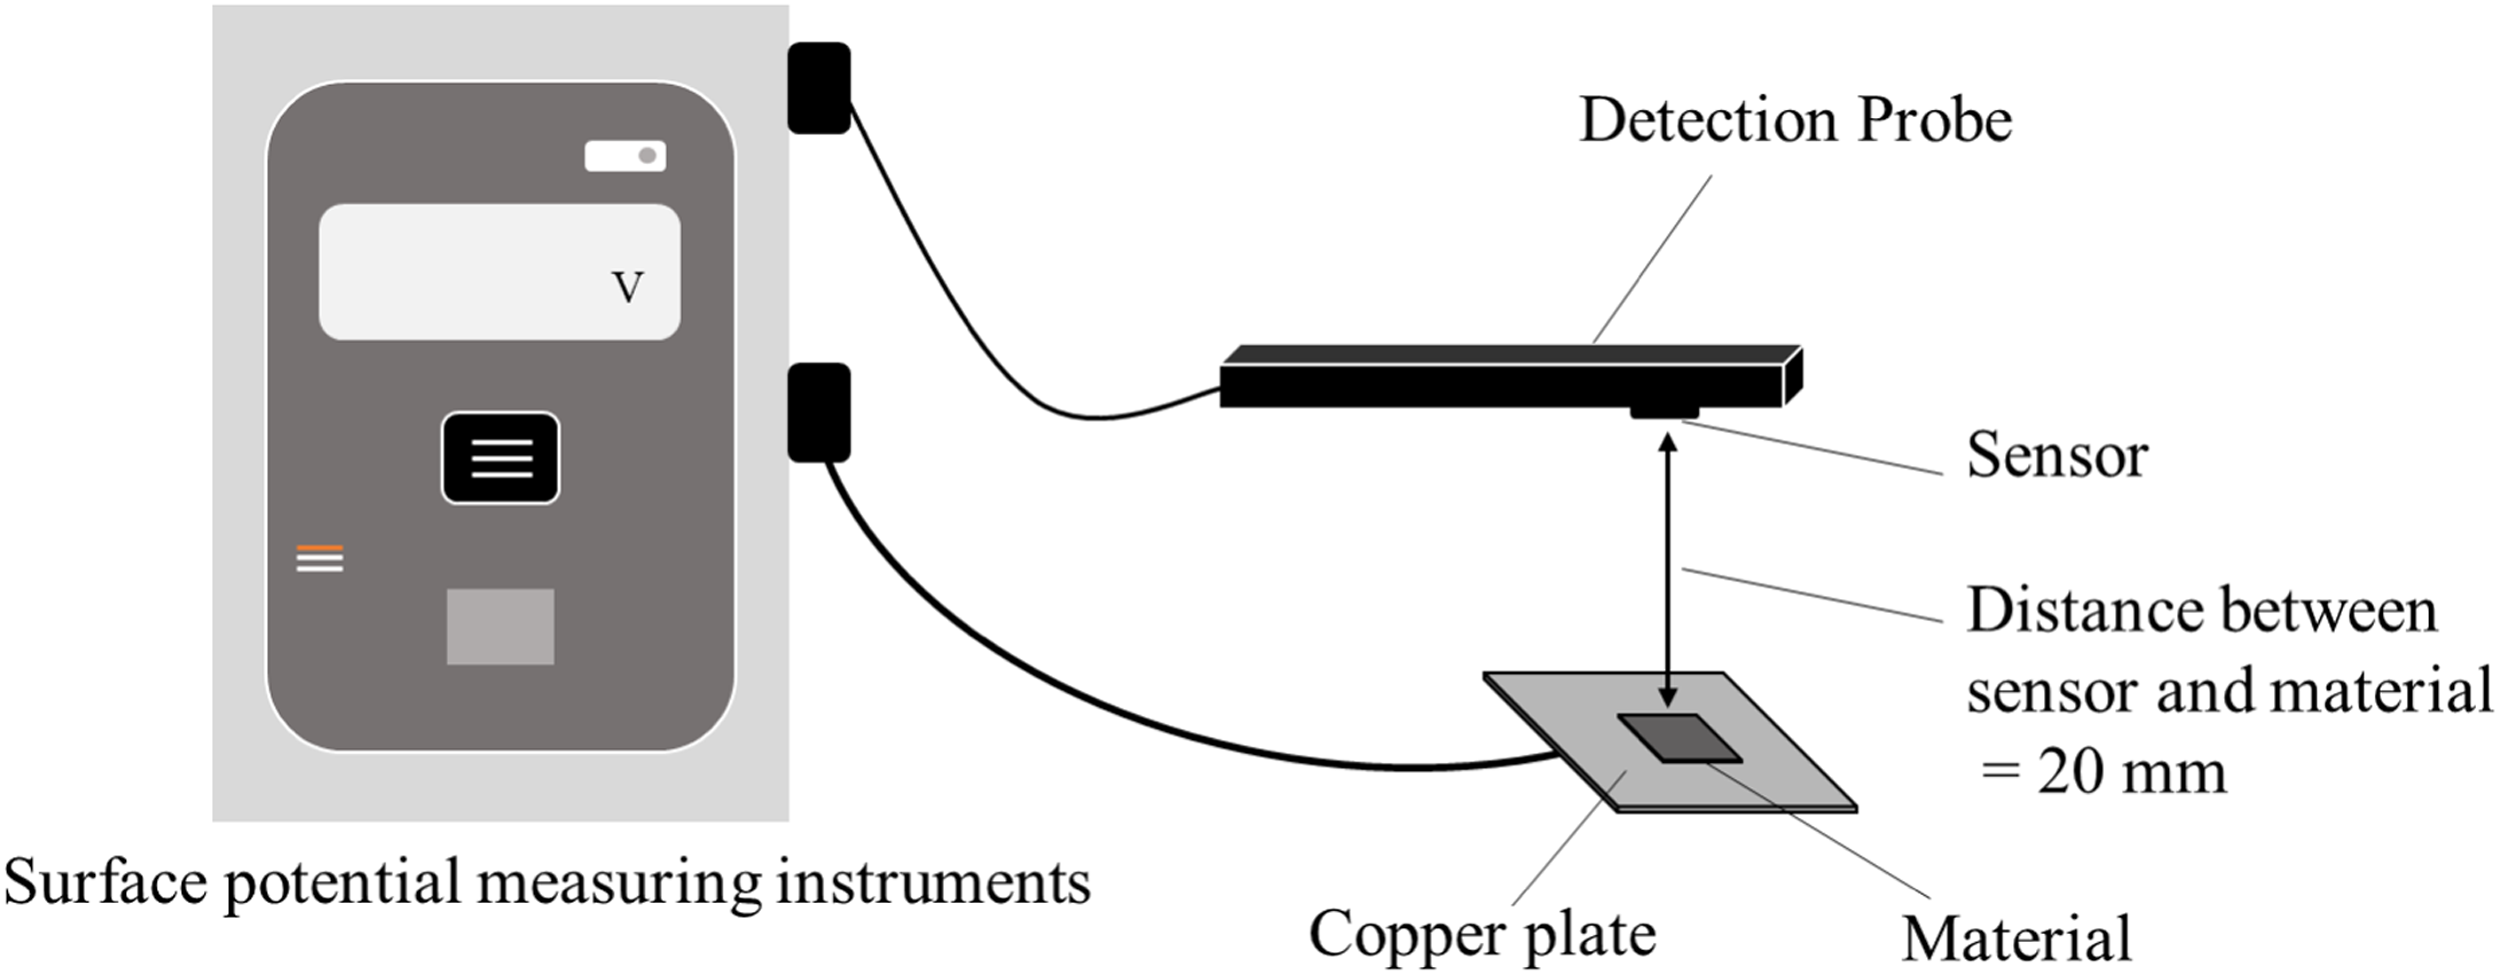
Device setup for measurement of surface potential.
Results of surface potential measurement
The average values and standard deviation of the surface potential are shown in Table 1 and Figure 4. The surface potential significantly decreased shortly after the corona charge process but remained beyond day 7. The surface potential after 2 weeks was −0.31 kV.
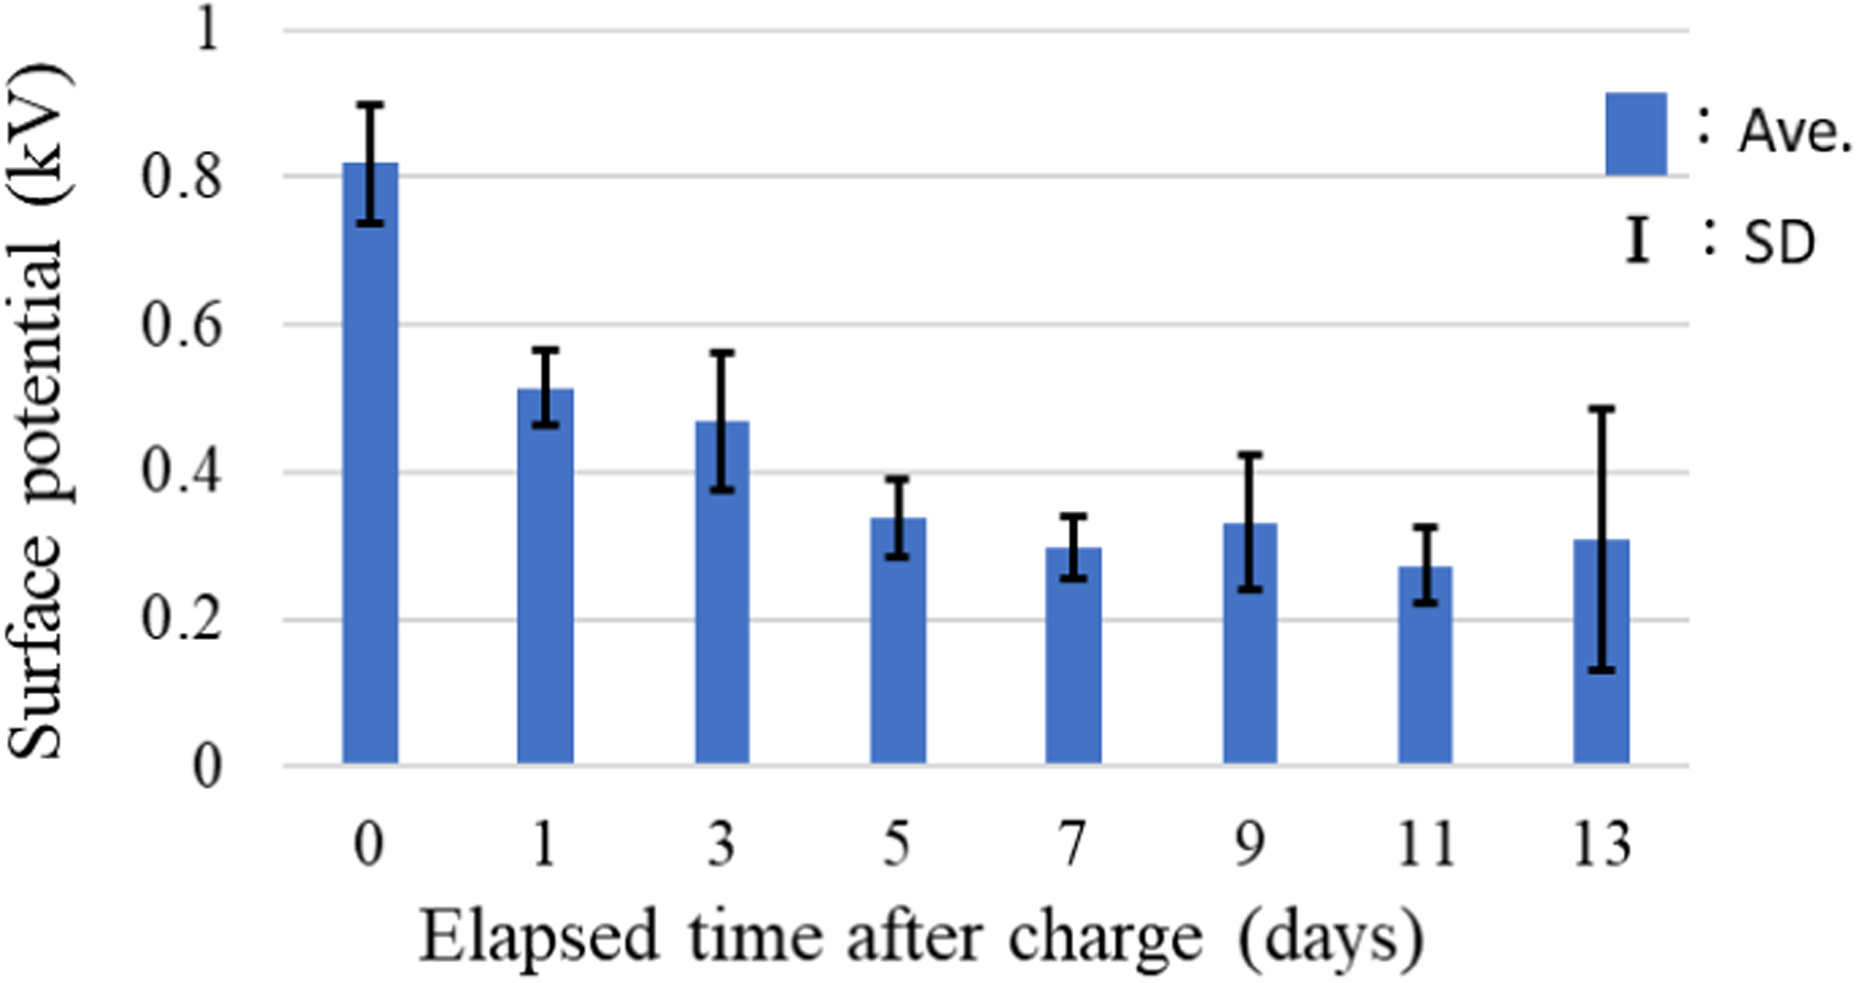
Change in surface potential over time. SD: standard deviation.
Experimental results for surface potential (kV).
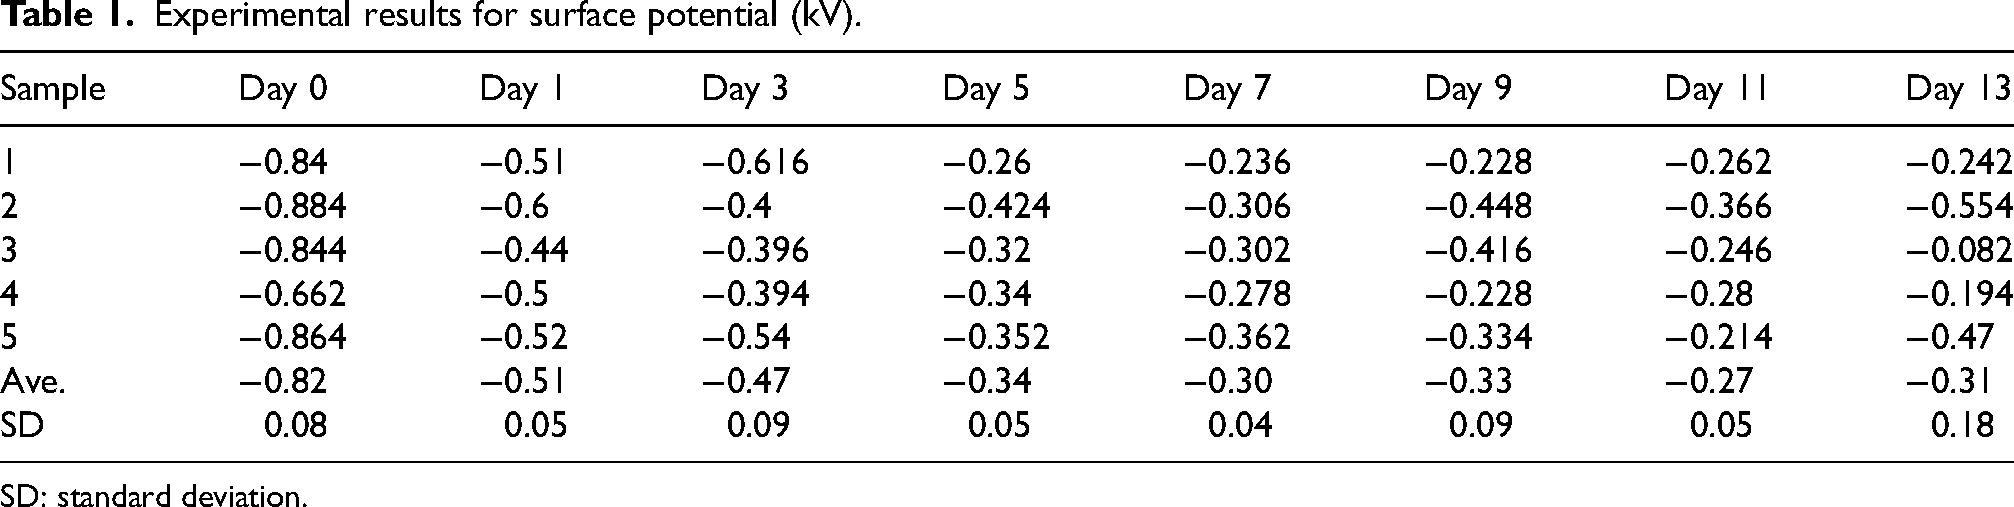
SD: standard deviation.
Cyclic forced overload experiment
Experimental setup
The experimental setup is shown in Figure 5. In the experiment, a shaker (EMIC, 513-B) was used to apply an impact compressive load to the material. The experimental setup consisted of the shaker, a load cell (KTOWA, LUX-B-500N-ID-P), jigs, and a data logger (KEYENCE, NR-400, NR-HV04). The output voltage and load were measured while the shaker vibrated the material, causing it to collide with the load cell. The vibration frequency of the shaker was set to 10, 20, or 30 Hz. The table on the shaker was made of NC nylon. The copper plate was fixed to the table and the material was placed on it. The NC nylon jig was also attached to the load cell. A pad (diameter: 21 mm, hardness: 58.5) with a copper plate attached to the NC nylon was installed. The copper plate under the material and the colliding copper plate were connected to a data logger to measure the generated voltage. The area of the colliding copper plate was 6.0 × 10⁻⁴ m2.
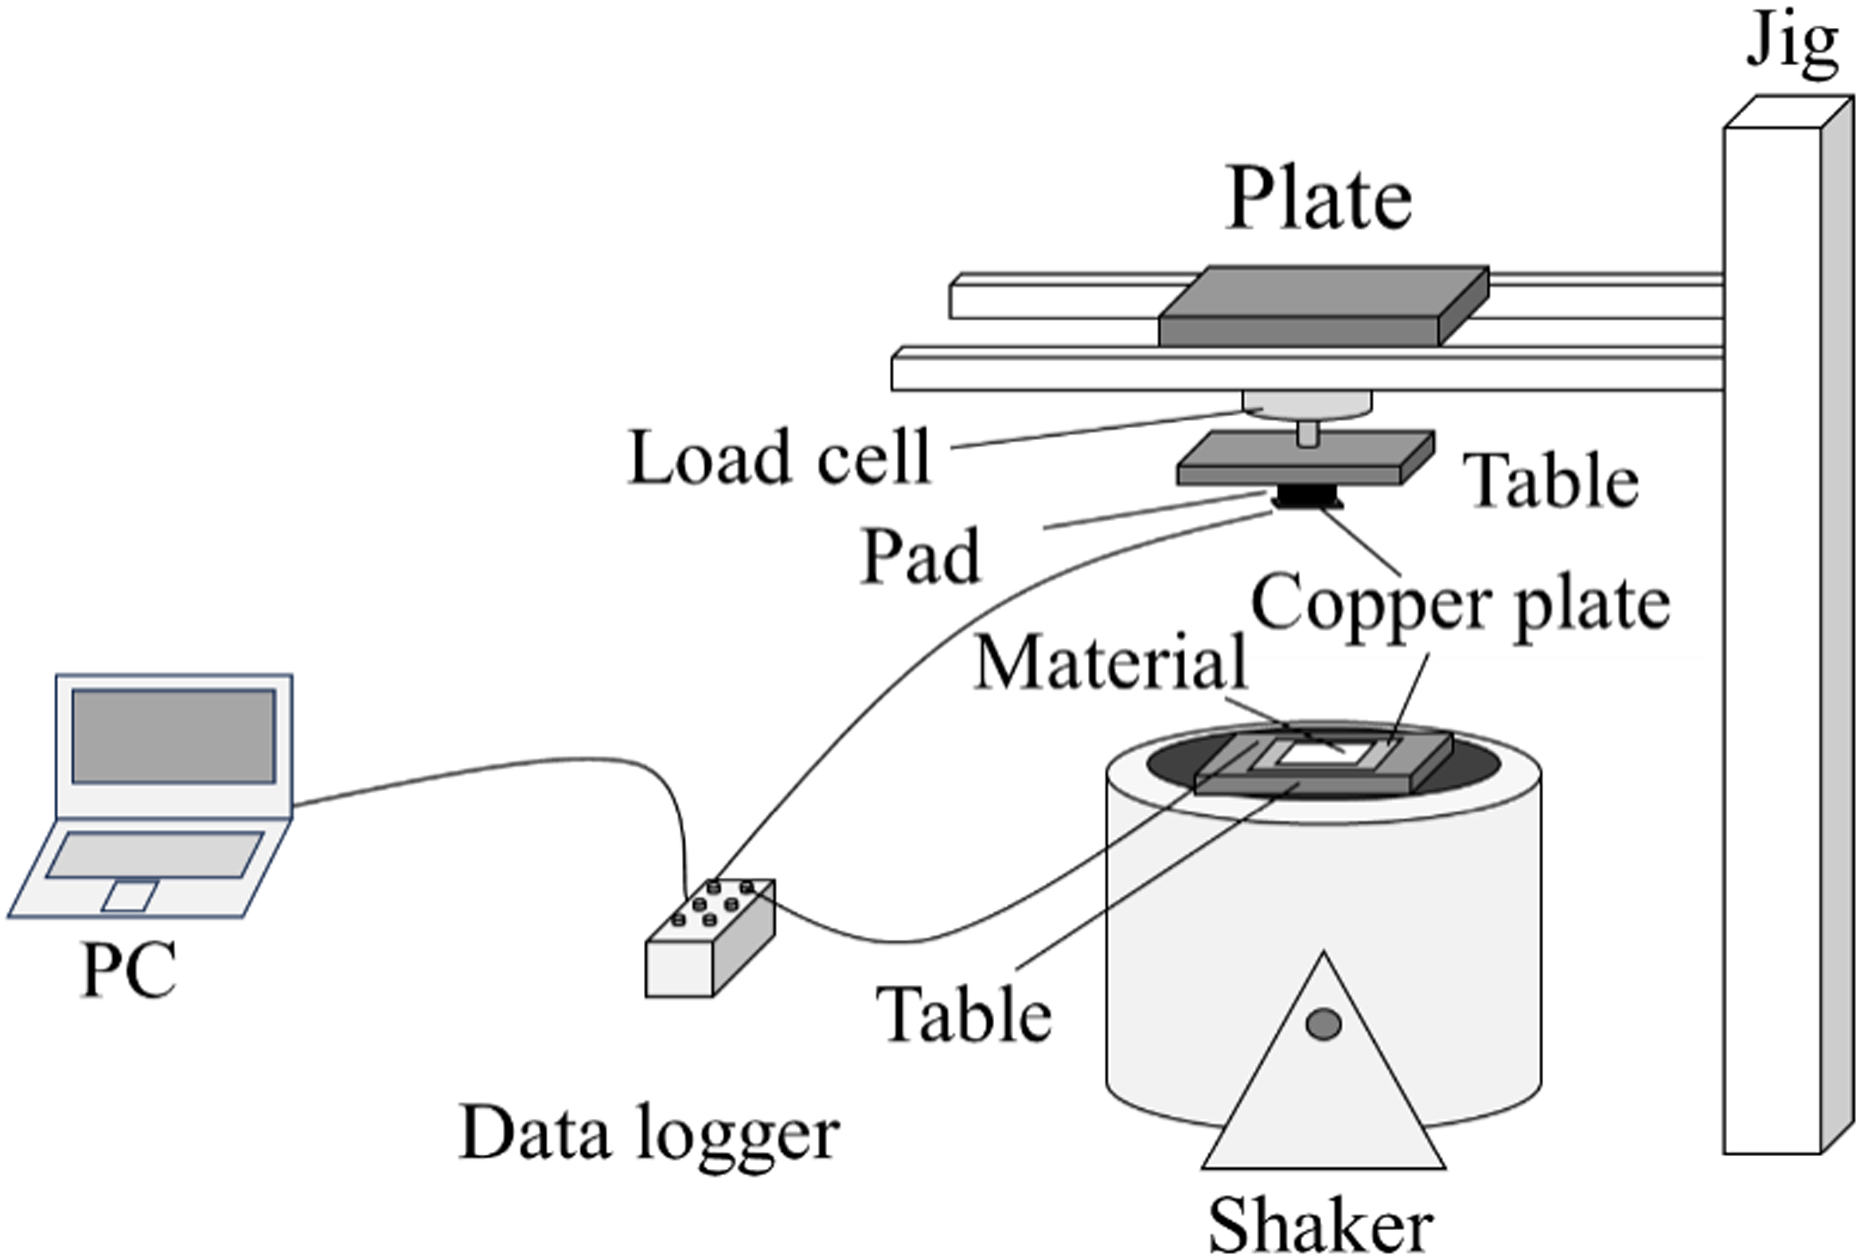
Experimental setup for forced overload experiment.
Results of forced overload experiment
As examples, the measurement results obtained immediately after the corona charge process are shown in Figure 6, those obtained after 1 week are shown in Figure 7, and those obtained after 2 weeks are shown in Figure 8. The results for sample 1 are used. The gap between the material and the pad was adjusted to apply a constant pressure of about 10,000 Pa. The maximum output voltages immediately after the corona charge process were 3.6 V at 10 Hz, 5.1 V at 20 Hz, and 6.1 V at 30 Hz. The maximum output voltages after 1 week were 1.7 V at 10 Hz, 2.1 V at 20 Hz, and 2.5 V at 30 Hz. The maximum output voltages after 2 weeks were 1.1 V at 10 Hz, 1.3 V at 20 Hz, and 2.1 V at 30 Hz. These results show that the impact loading of the half sine wave was applied to the material. Therefore, it was observed that a pulsed output voltage was generated.
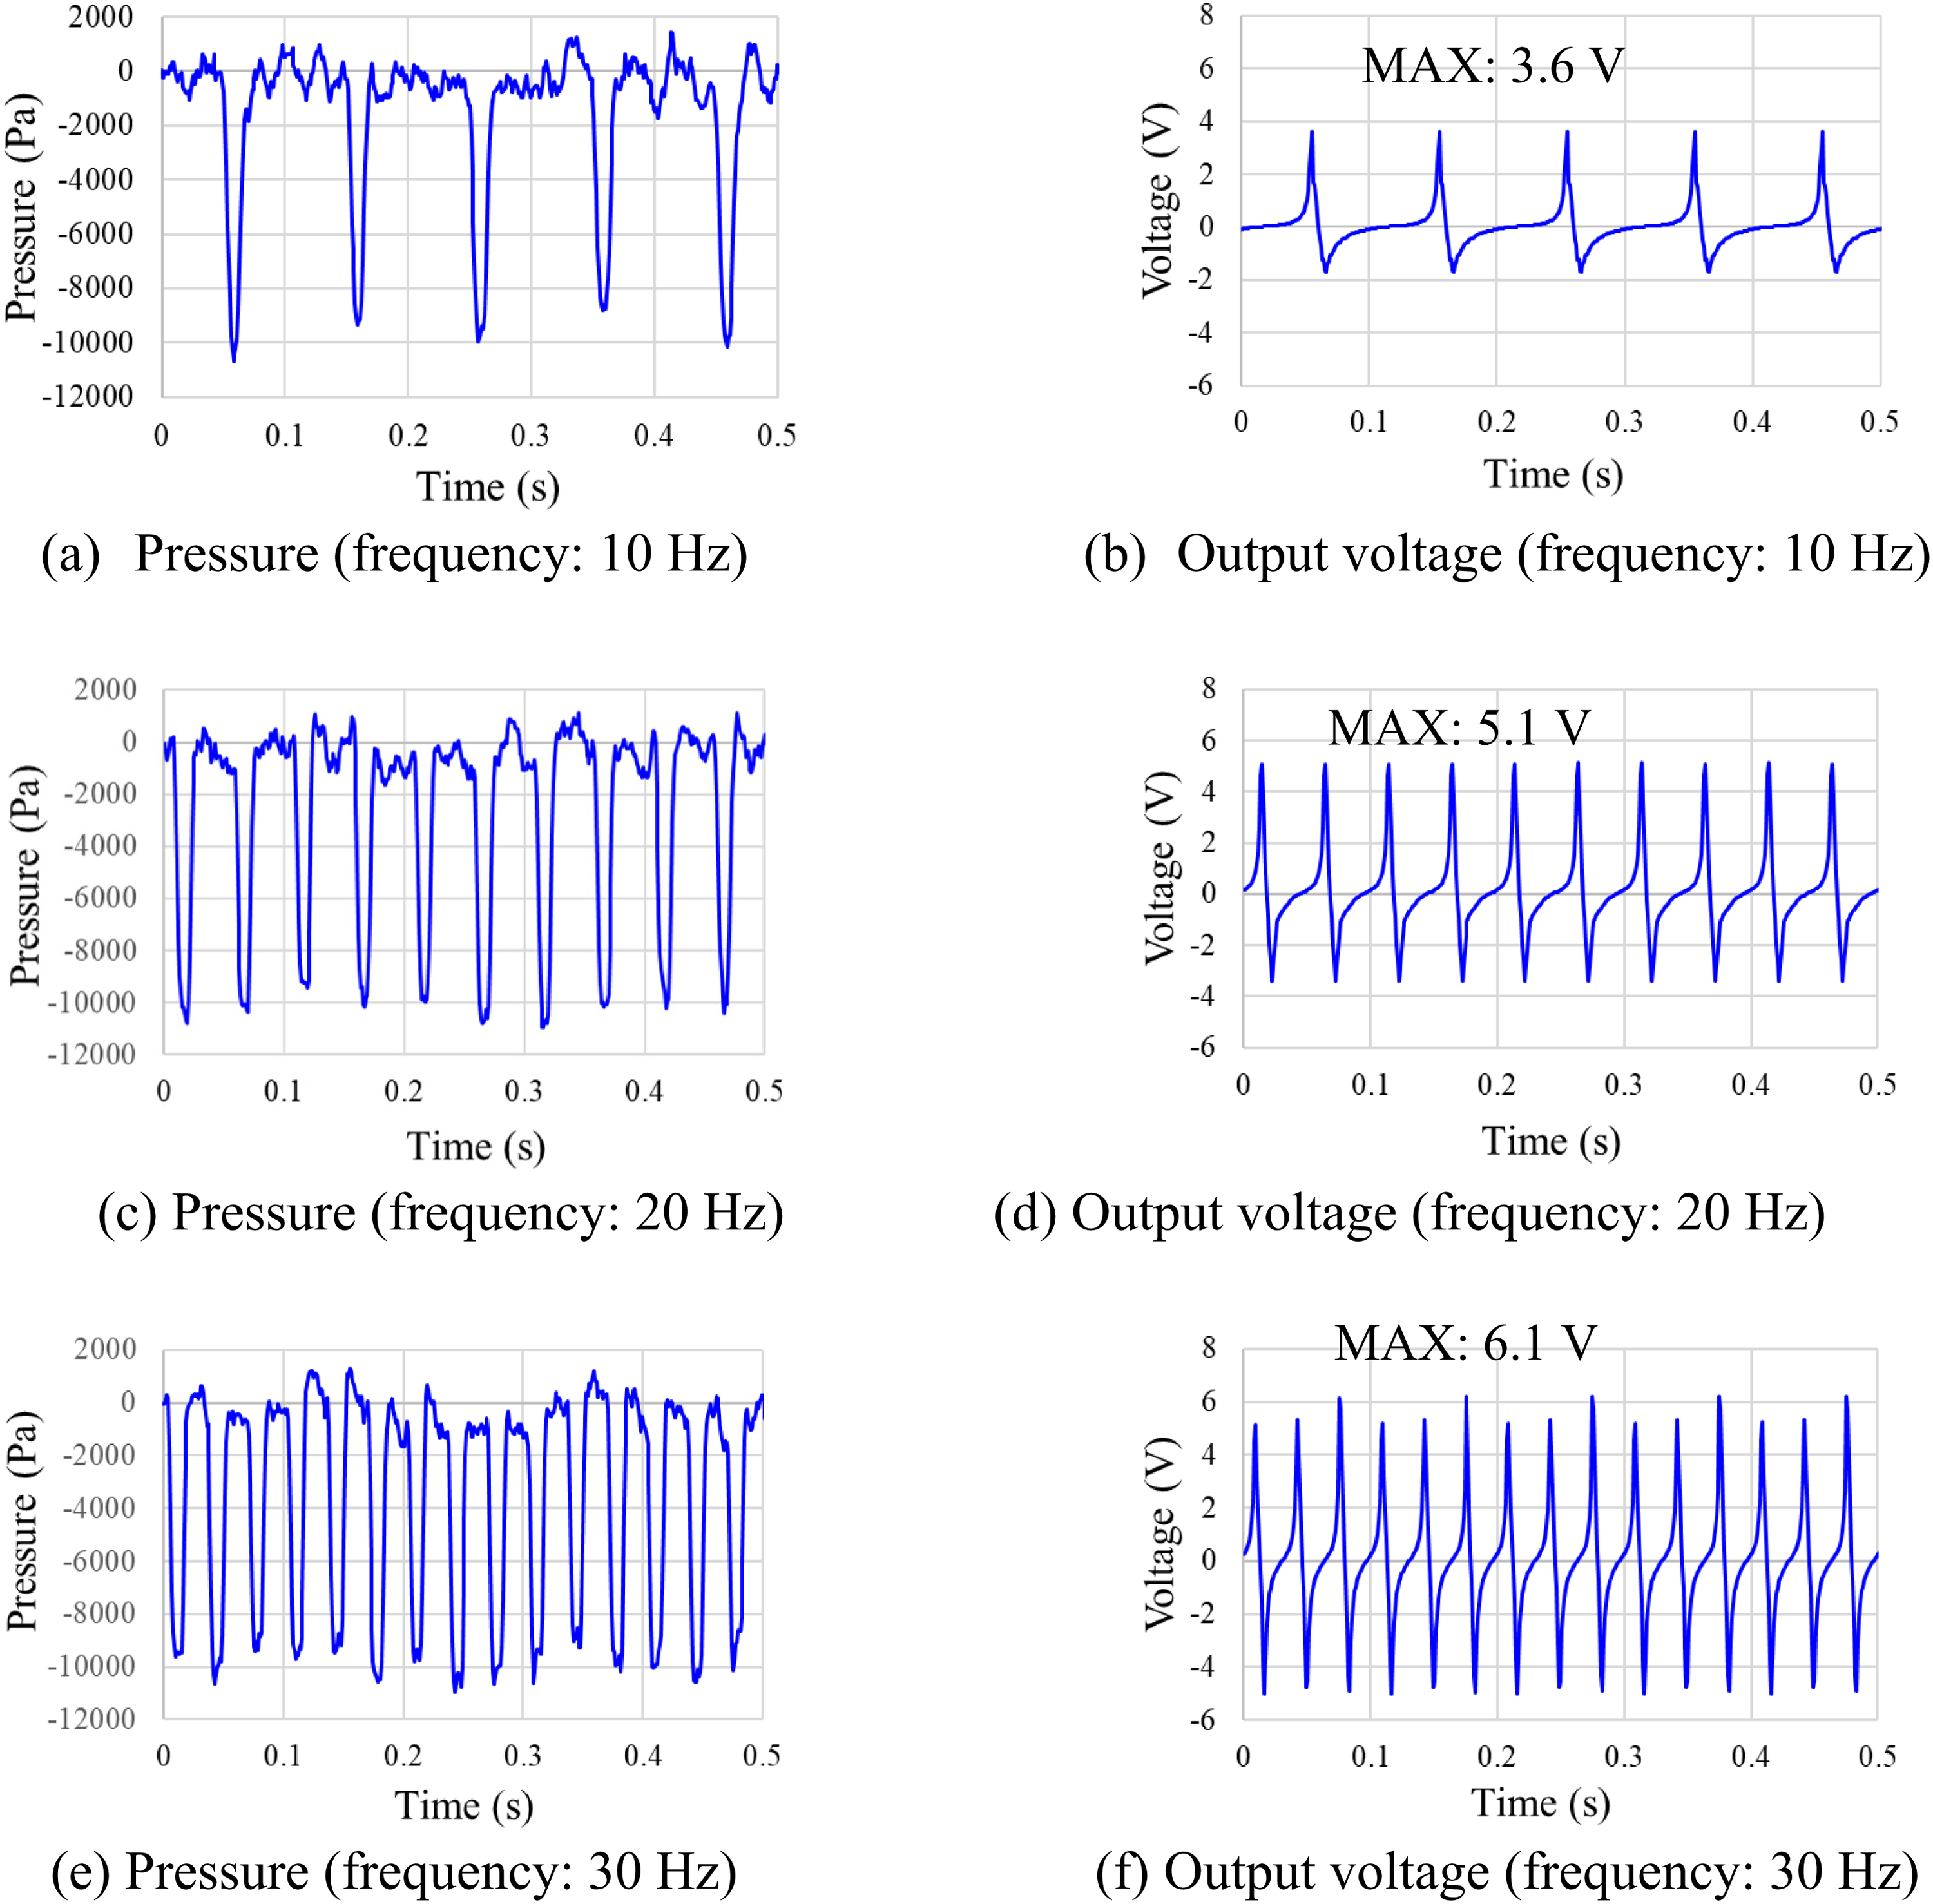
Experimental results obtained immediately after corona charge for various vibration frequencies.
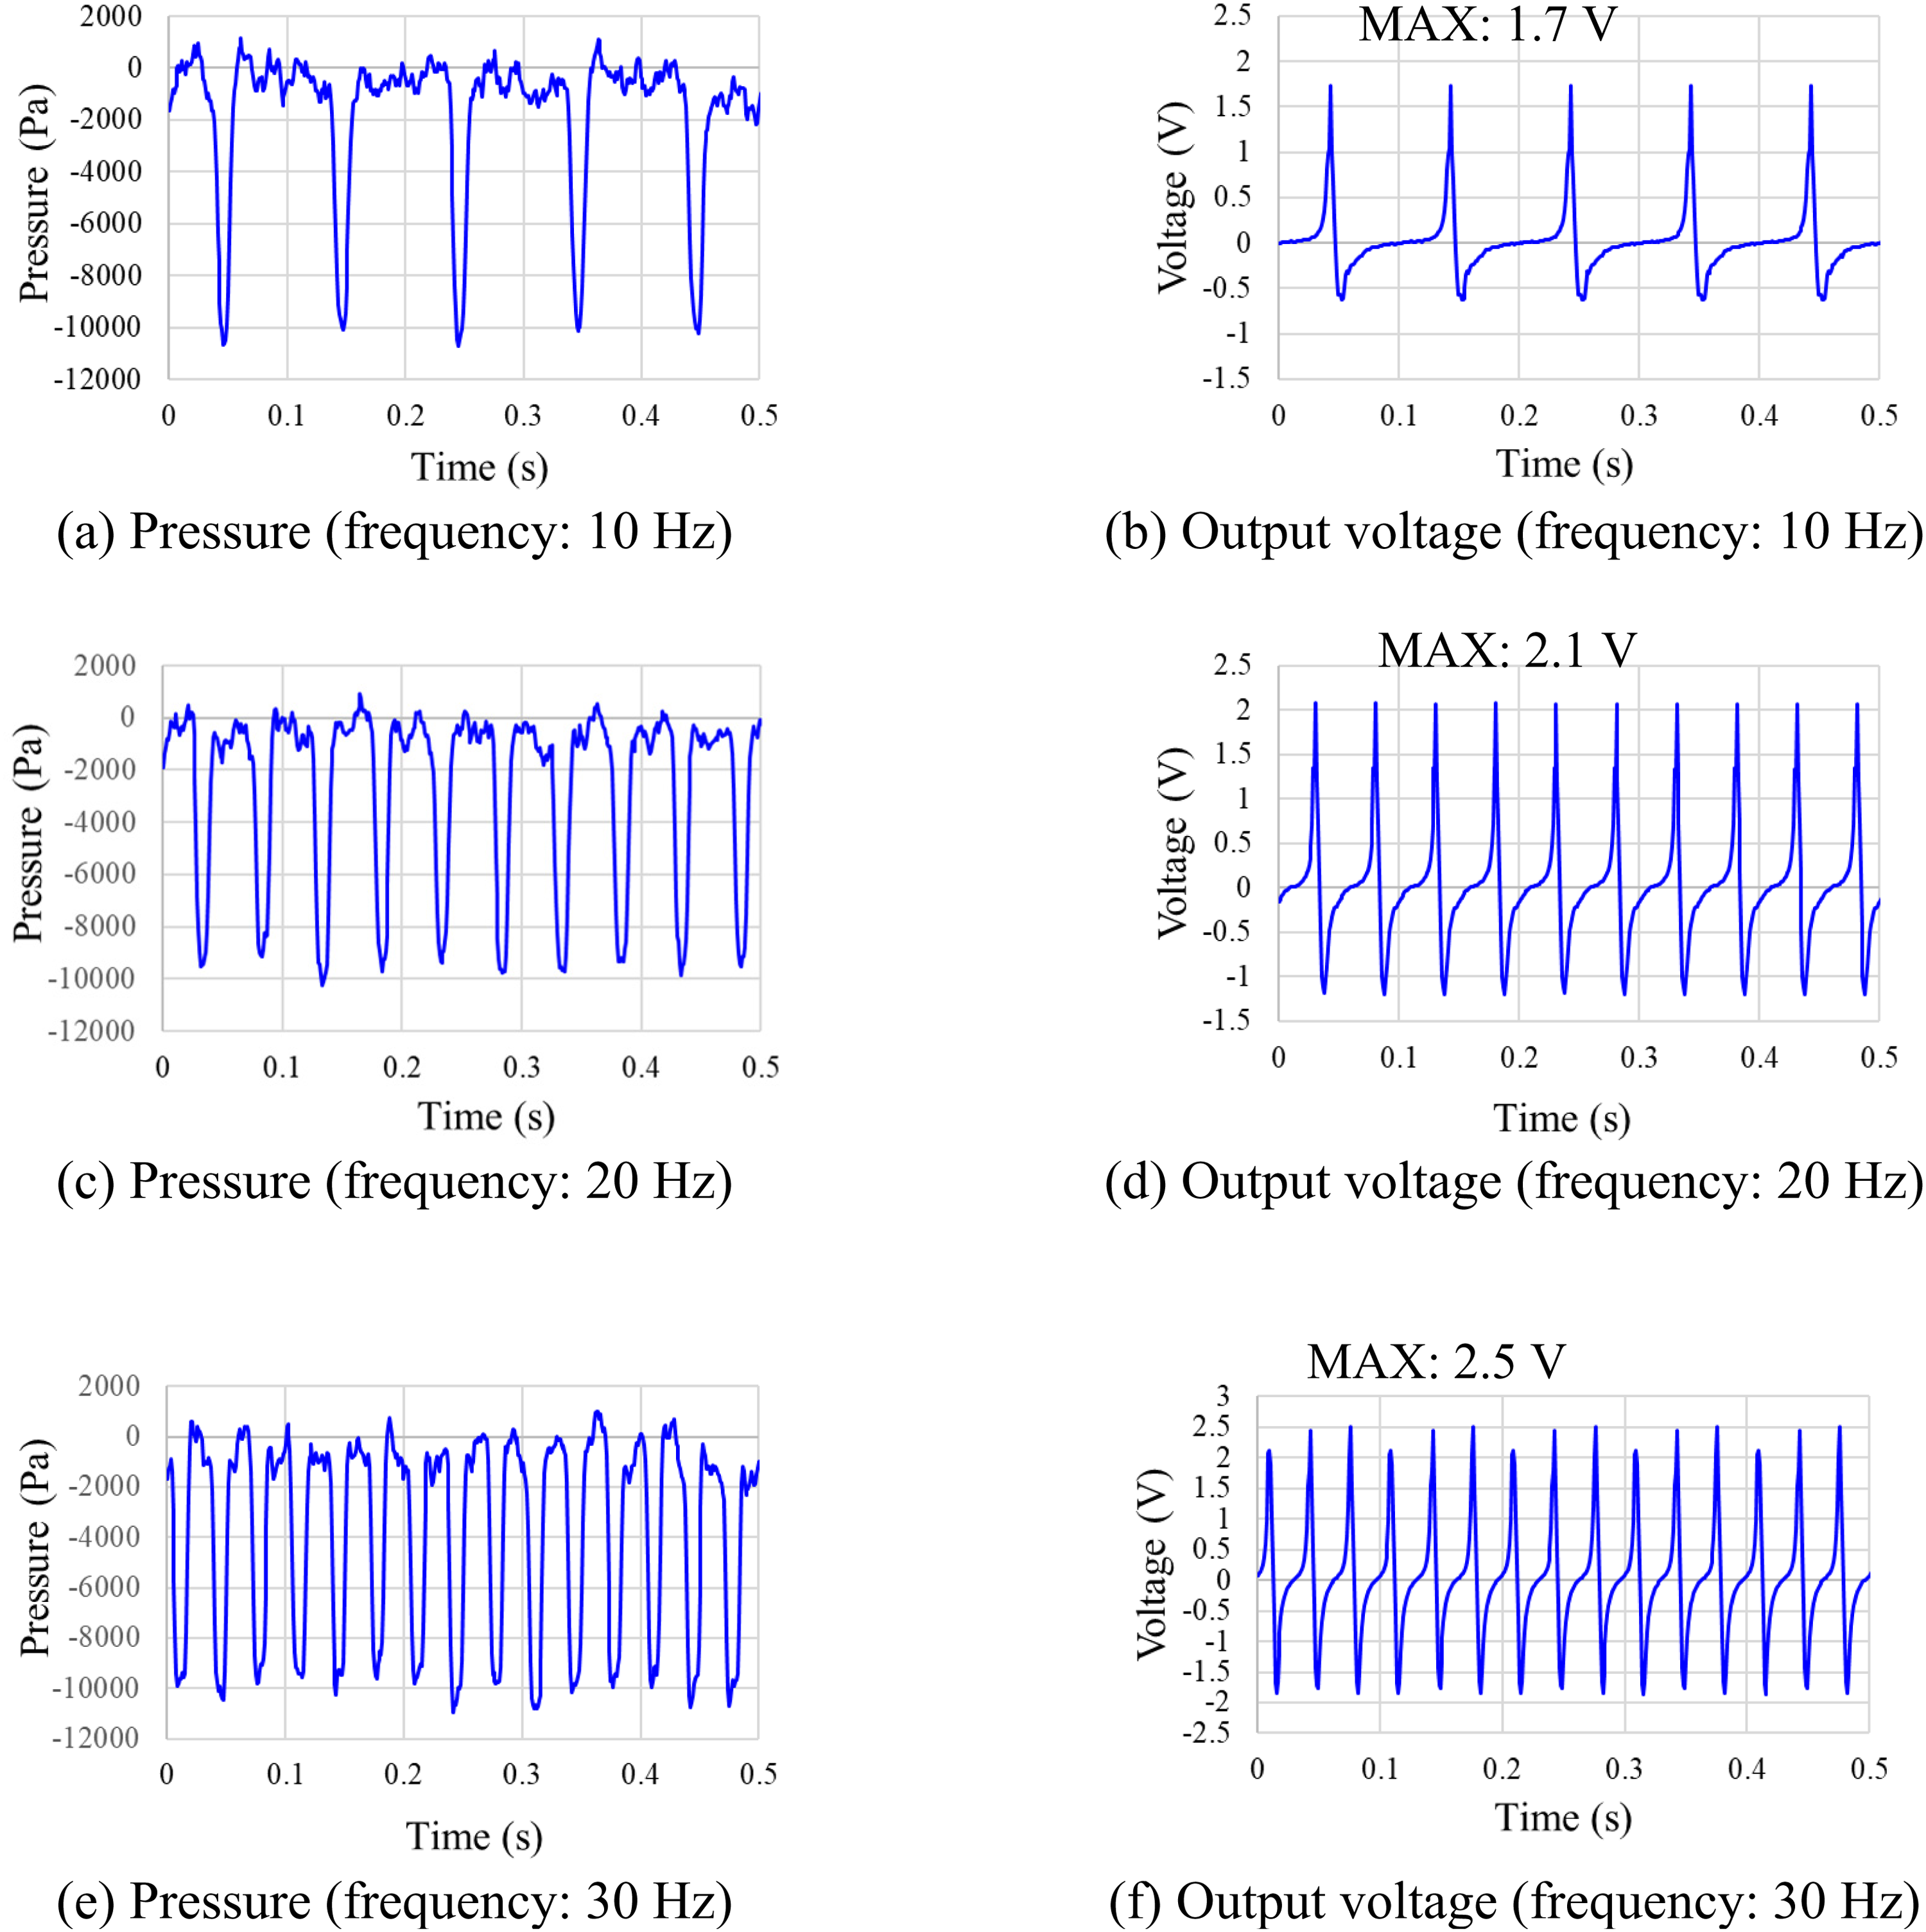
Experimental results obtained after 1 week of corona charging for various vibration frequencies.
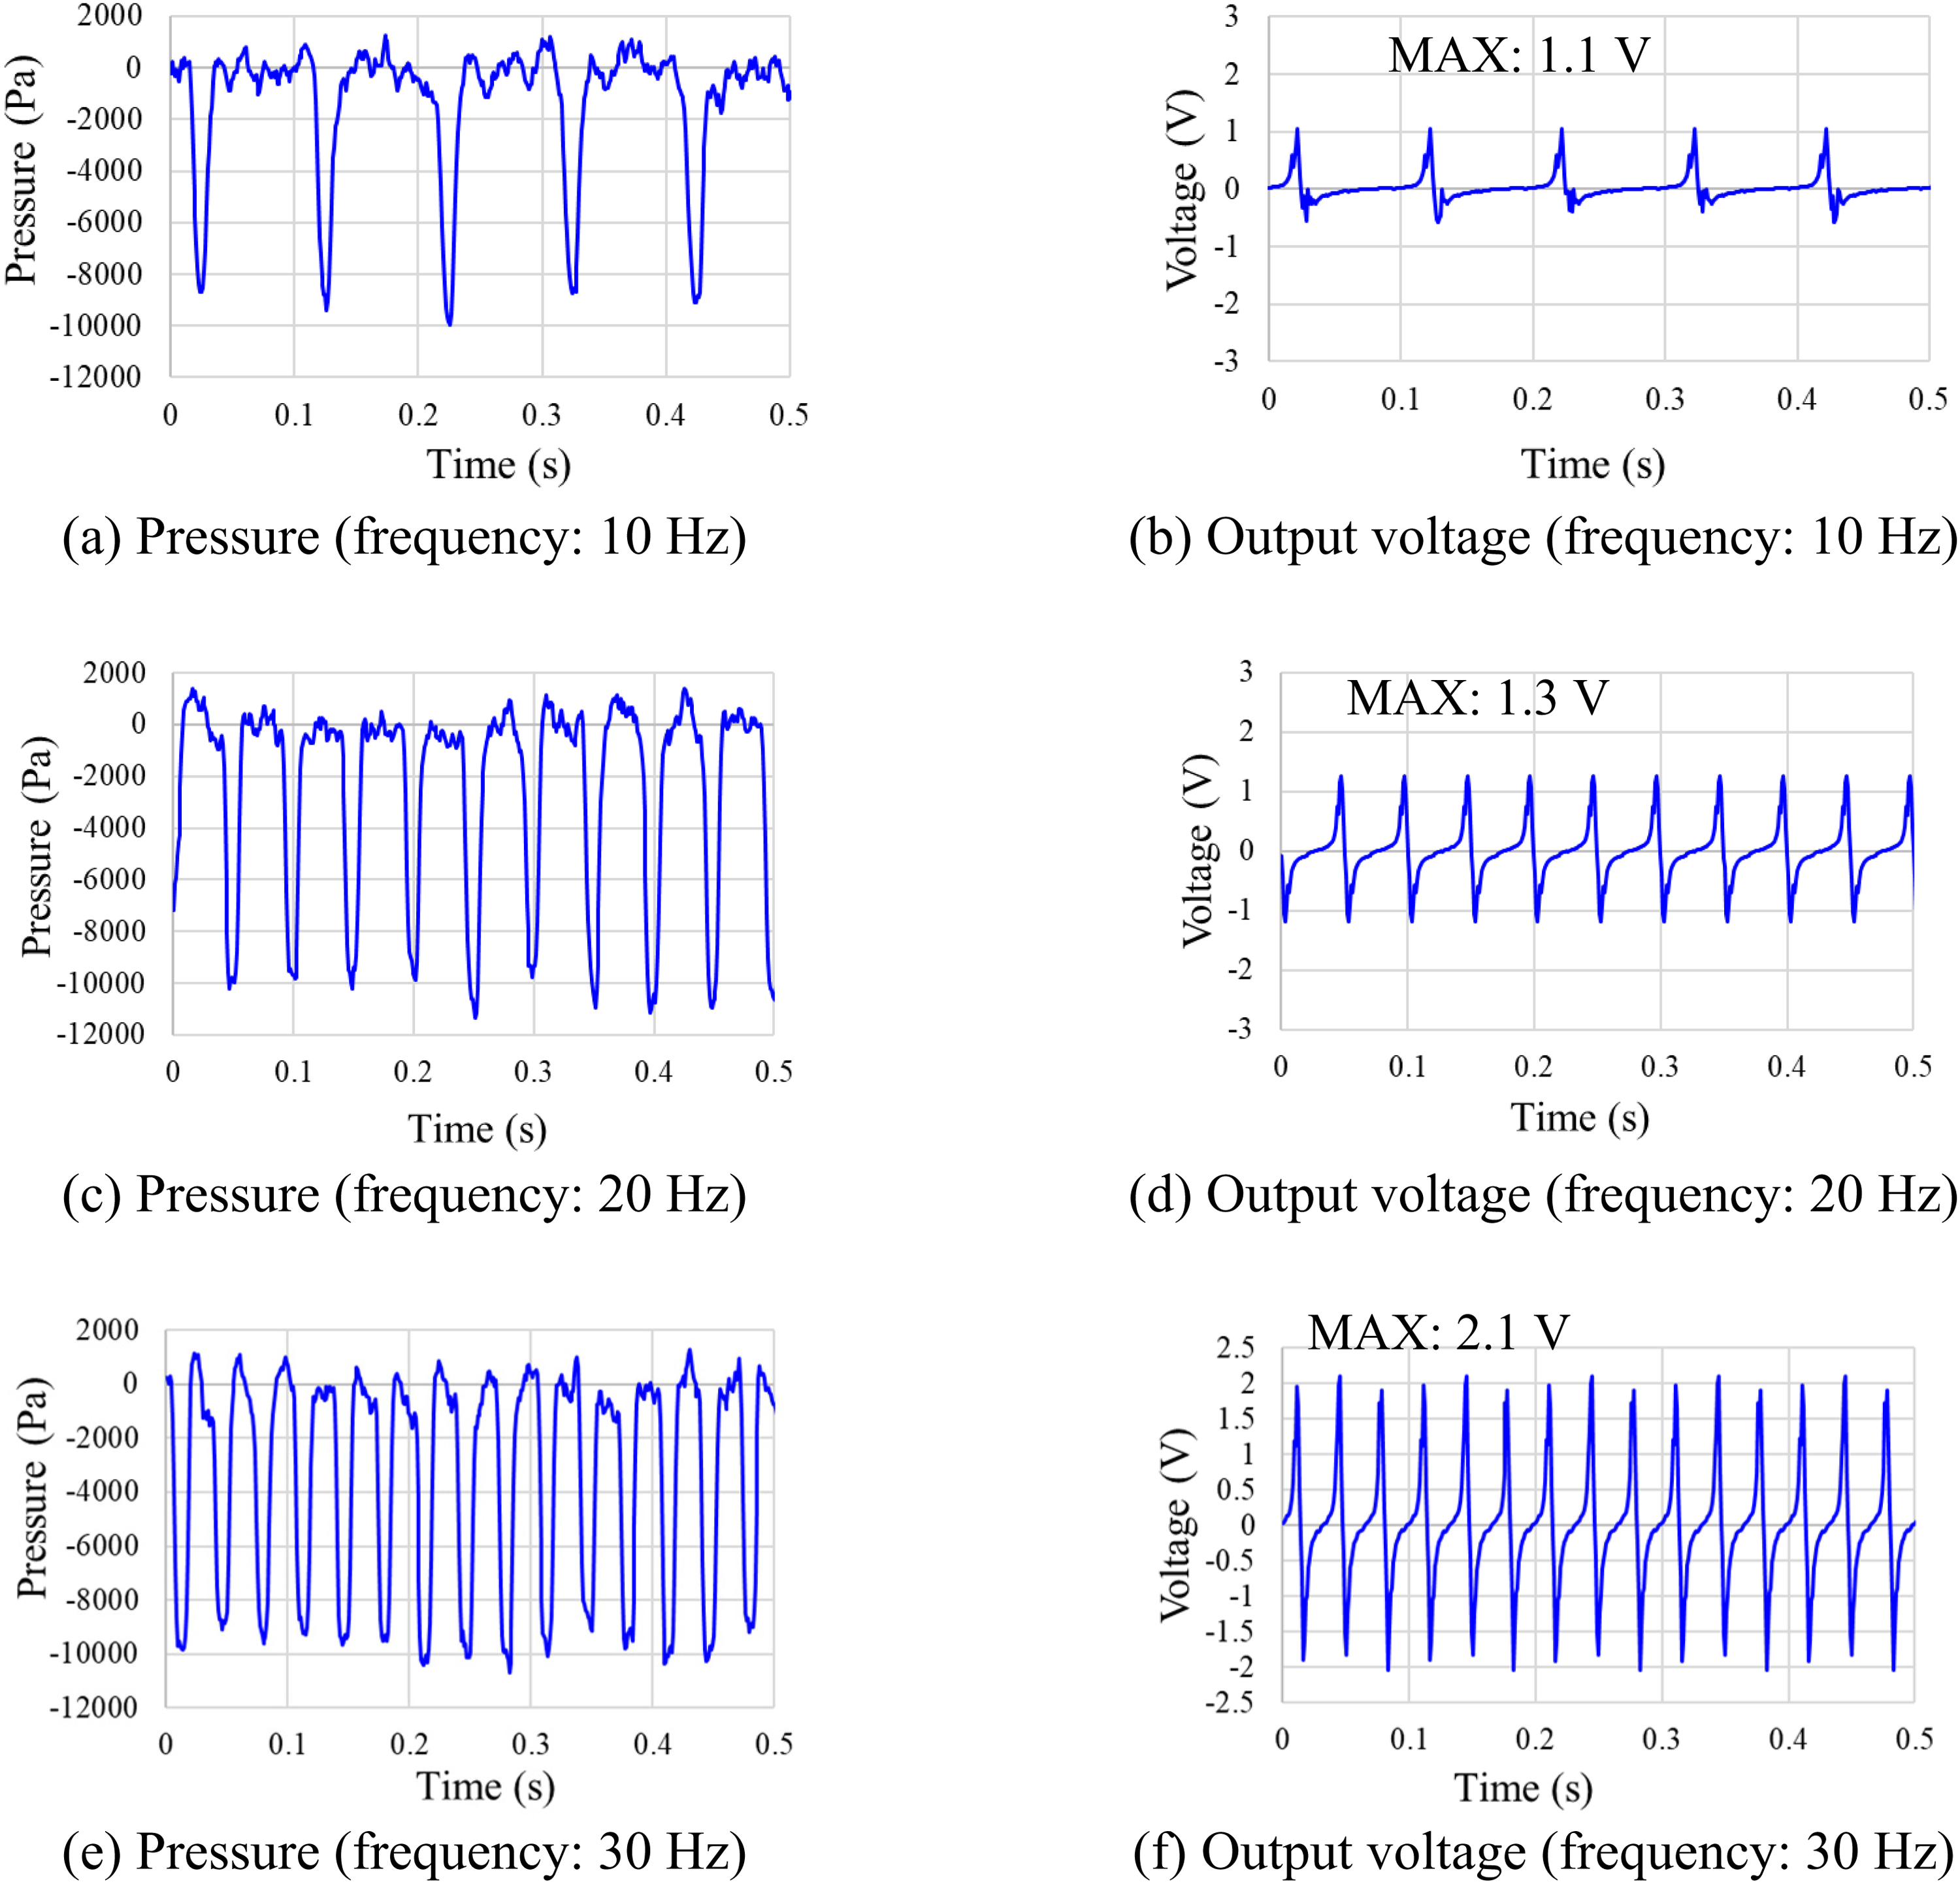
Experimental results obtained after 2 weeks of corona charging for various vibration frequencies.
Evaluation of piezoelectric stress constant d33
Evaluation method
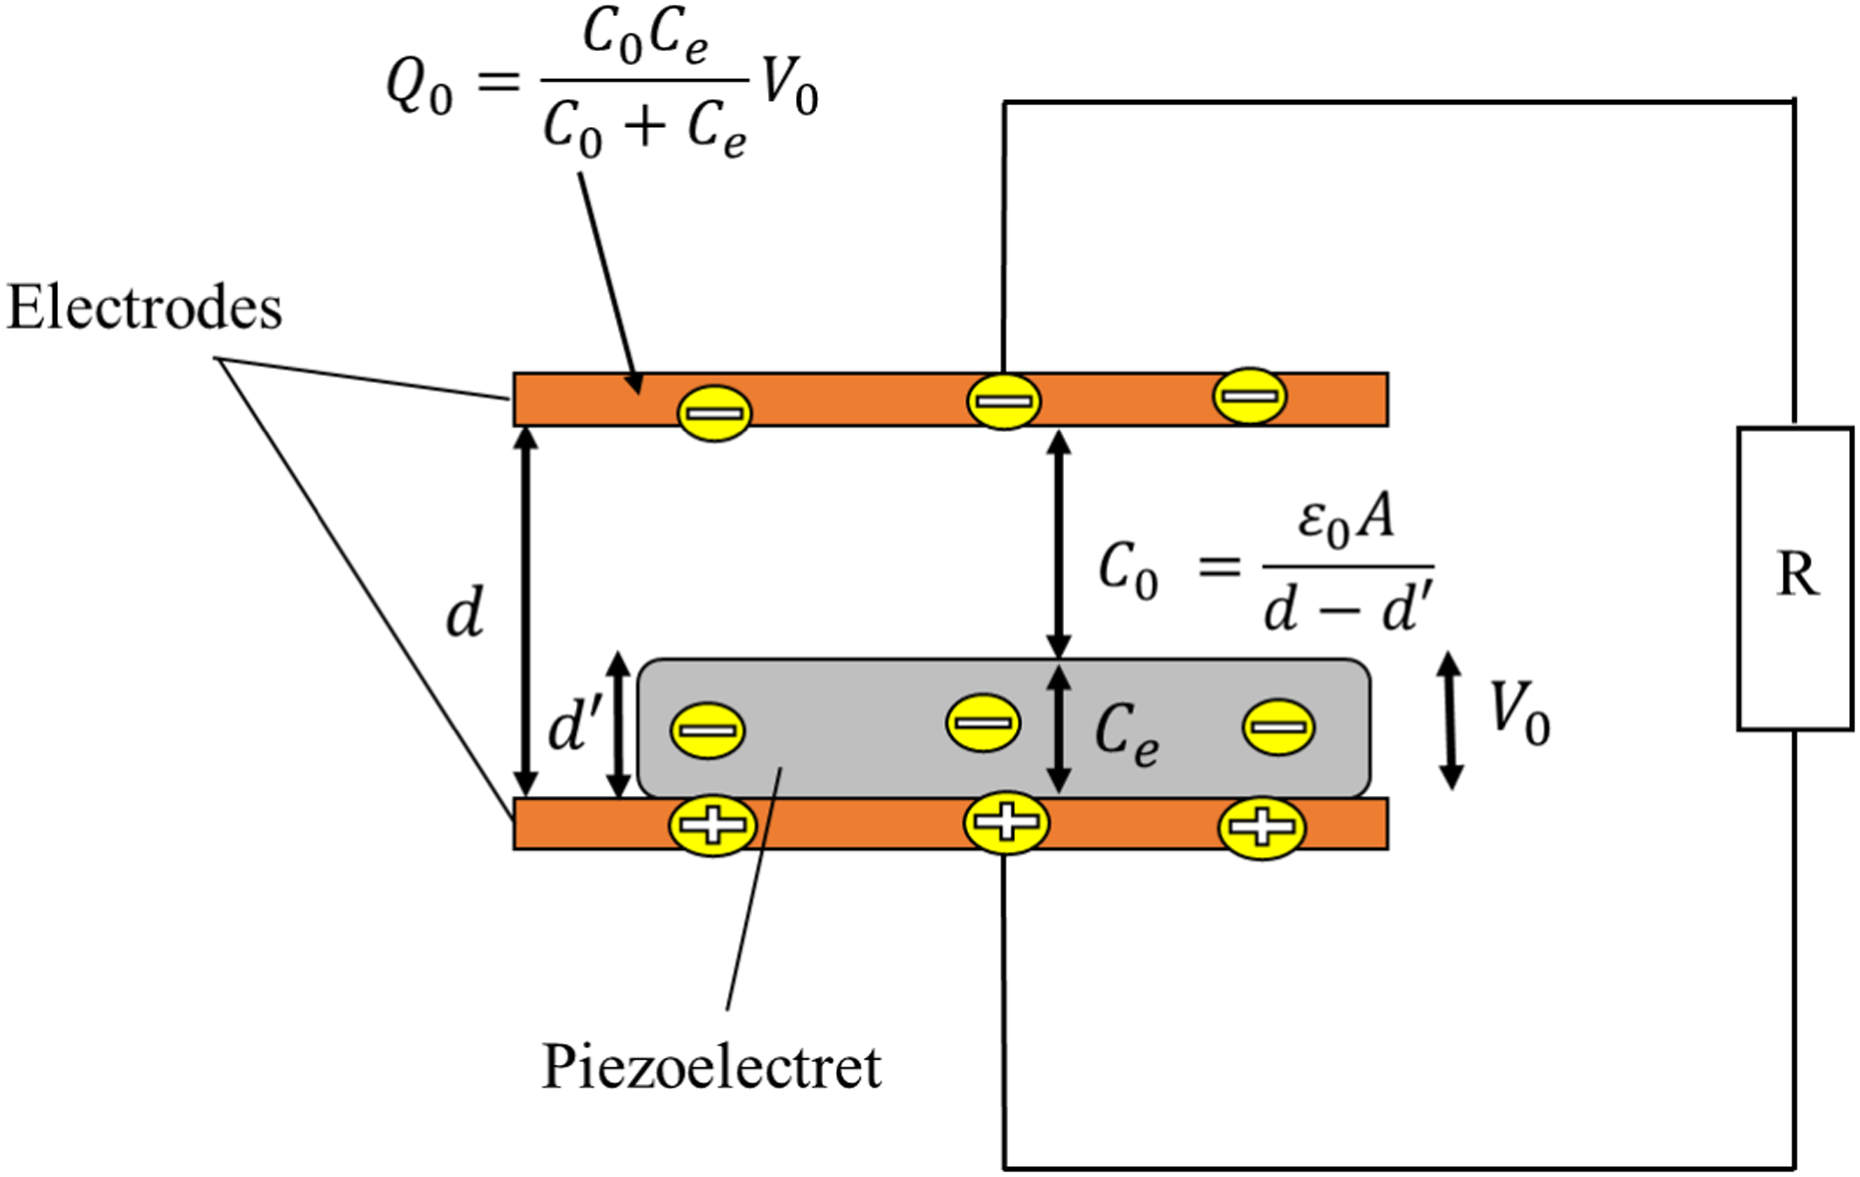
The governing equation for a piezoelectric material considering compression in only one direction is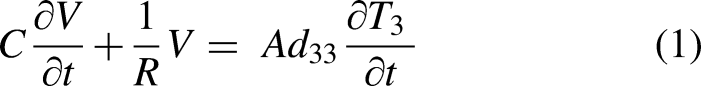
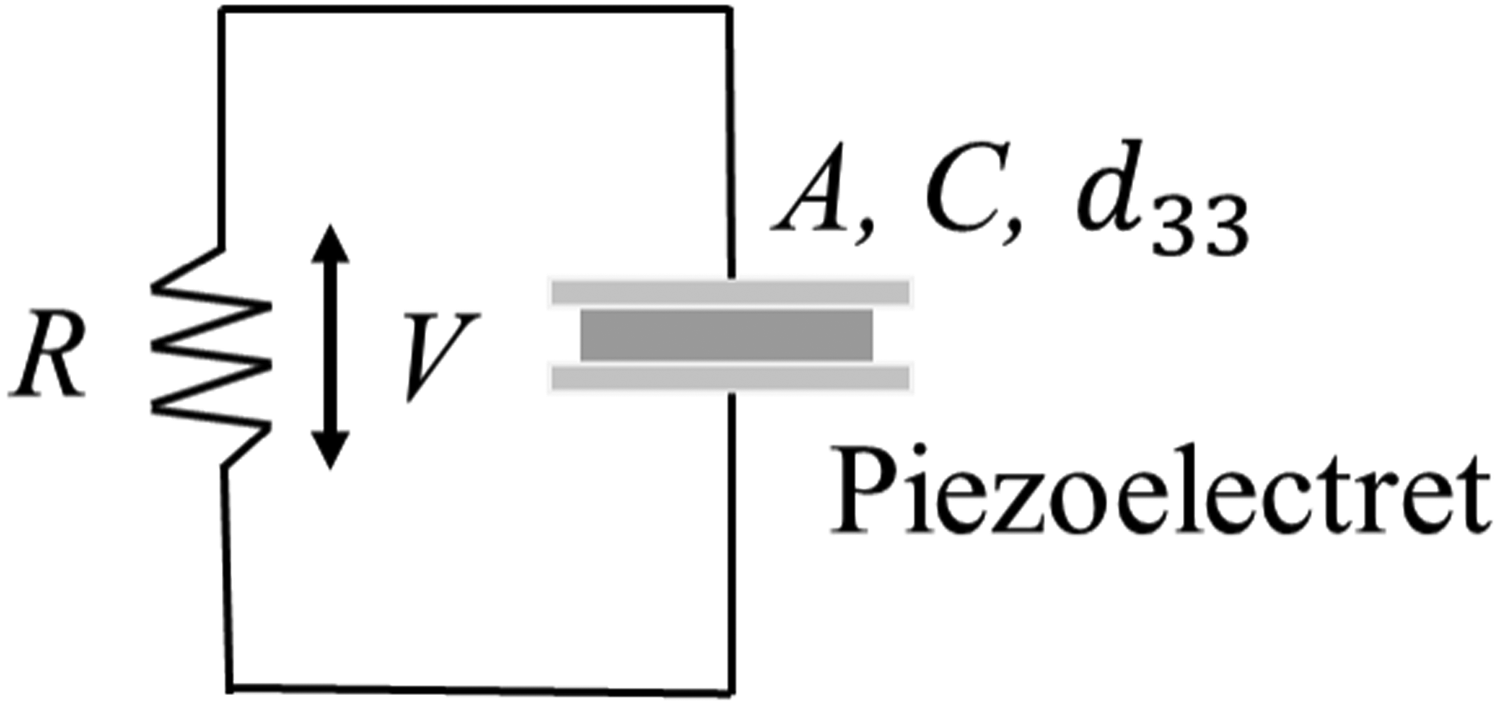
Electrical circuit diagram for calculating piezoelectric stress constant d33.
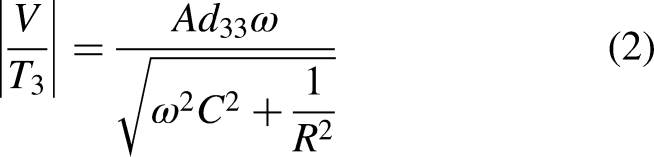
The piezoelectric stress constant d33 is derived by applying the least-squares approximation to the experimental results based on the above equation. 18 We derived d33 for the five piezoelectret samples and calculated the average. In this study, the loading area was 6.0 × 10⁻⁴ m2 and the internal resistance of the experimental setup was 1.0 MΩ. The capacitance property was measured for each material.
Evaluation results
The piezoelectric stress constant d33 was measured every 2 days for 2 weeks to investigate changes over time. The average values and standard deviations of d33 are shown in Table 2 and Figure 10. d33 decreases immediately after the corona charge process but remains at a constant value beyond 1 week. The d33 value after 2 weeks was 475.2 pC/N.
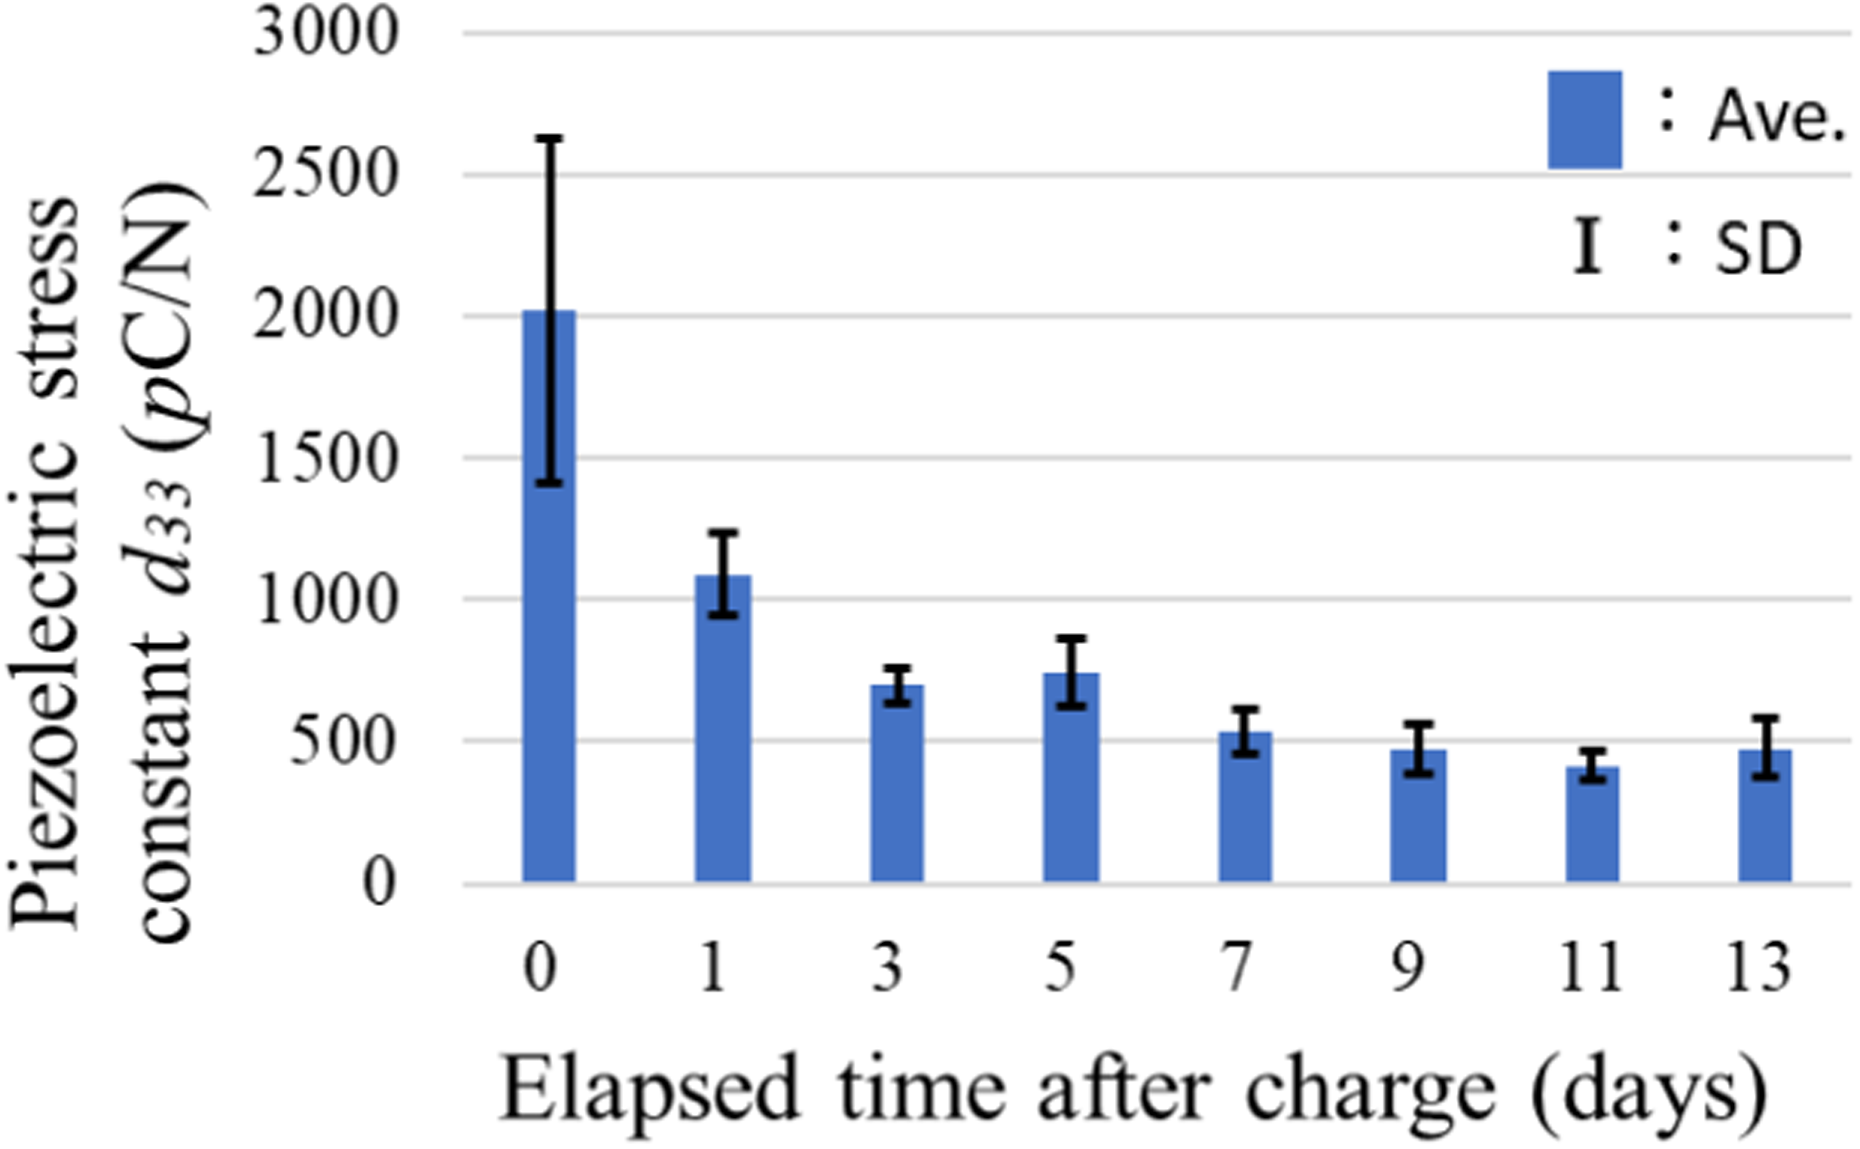
Change in piezoelectric stress constant over time. SD: standard deviation.
Experimental results for piezoelectric stress constant d33 (pC/N).
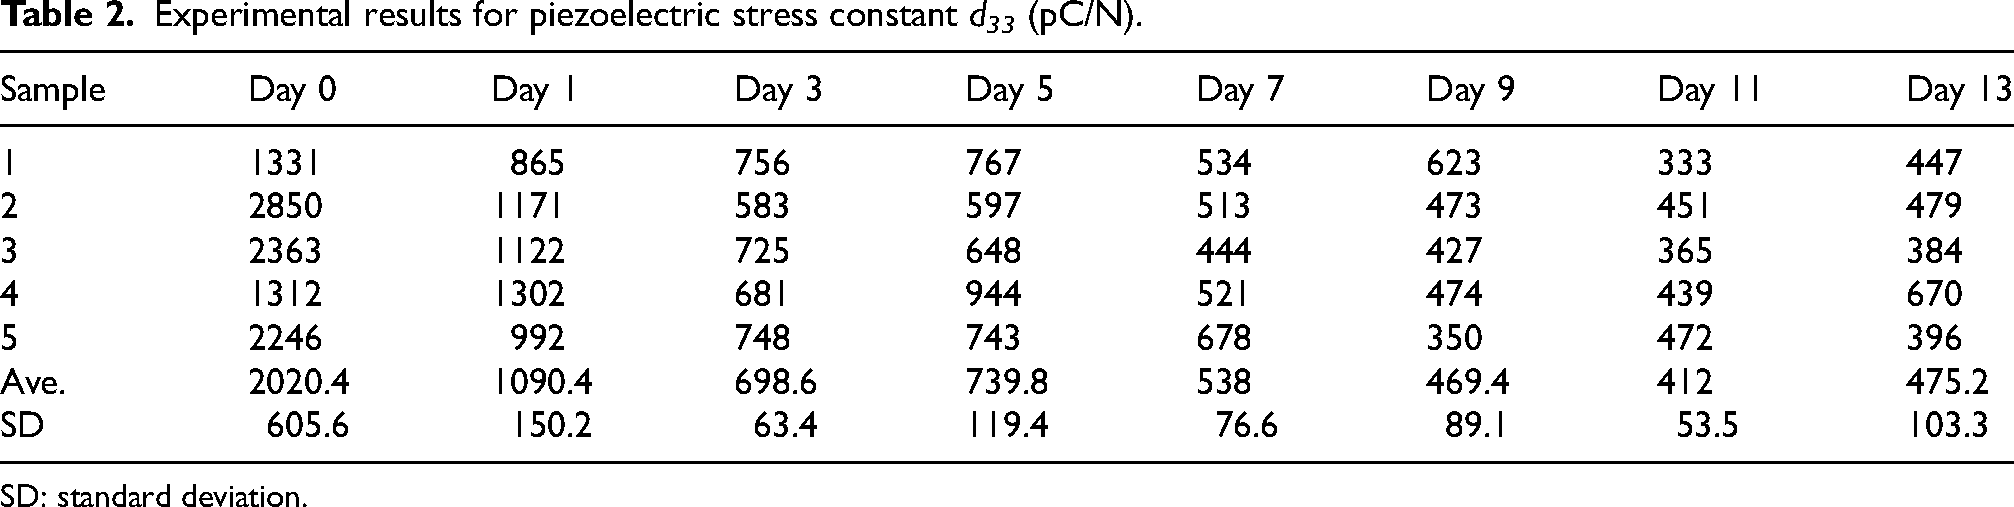
SD: standard deviation.
Power generation model
Overview of power generation model
The principle of power generation for the proposed piezoelectret is unclear. Therefore, we consider the power generation model for a typical piezoelectret. The power generation model for a piezoelectret depends on its type. For the electrostatic-type generation, an electric field is generated by placing the piezoelectret charged by corona charging between the pole plates. The shaker vibration changes the distance between the pole plates, which in turn changes the strength of the electric field, resulting in the transfer of electrons. For the piezoelectric-type generation, power is generated via the piezoelectric effect. The collision of the copper plate with the piezoelectret causes deformation of the piezoelectret and changes the bias and electron transfer.
Theoretical formulation of output voltage
The initial conditions are shown in Figure 11.
Initial conditions.
For the electrostatic-type generation, the electric current is
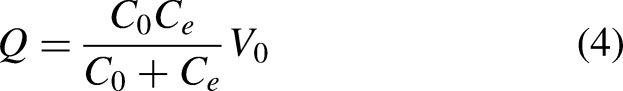
Let d be the distance between the pole plates, 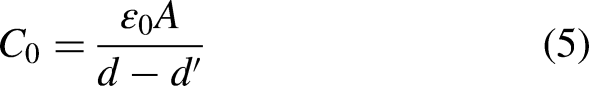
Therefore,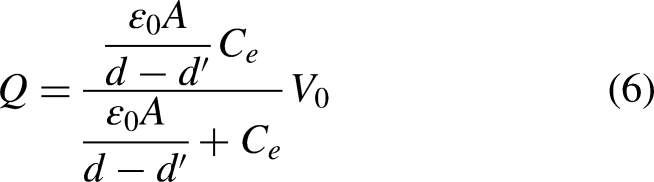
The electric current I is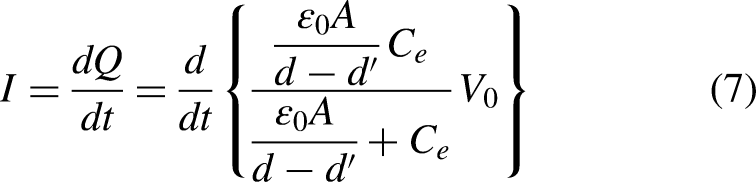
The output voltage V is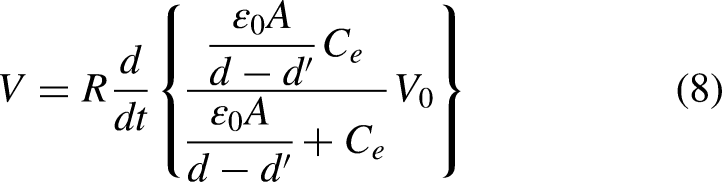
For piezoelectric-type generation, it is assumed that the principle of power generation for the piezoelectret is similar to that for piezoelectric materials. Therefore, the following theoretical equation is obtained based on equation (1).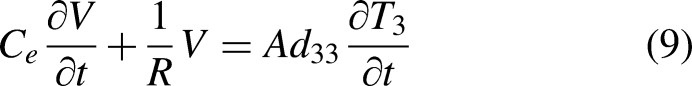
Simulation results
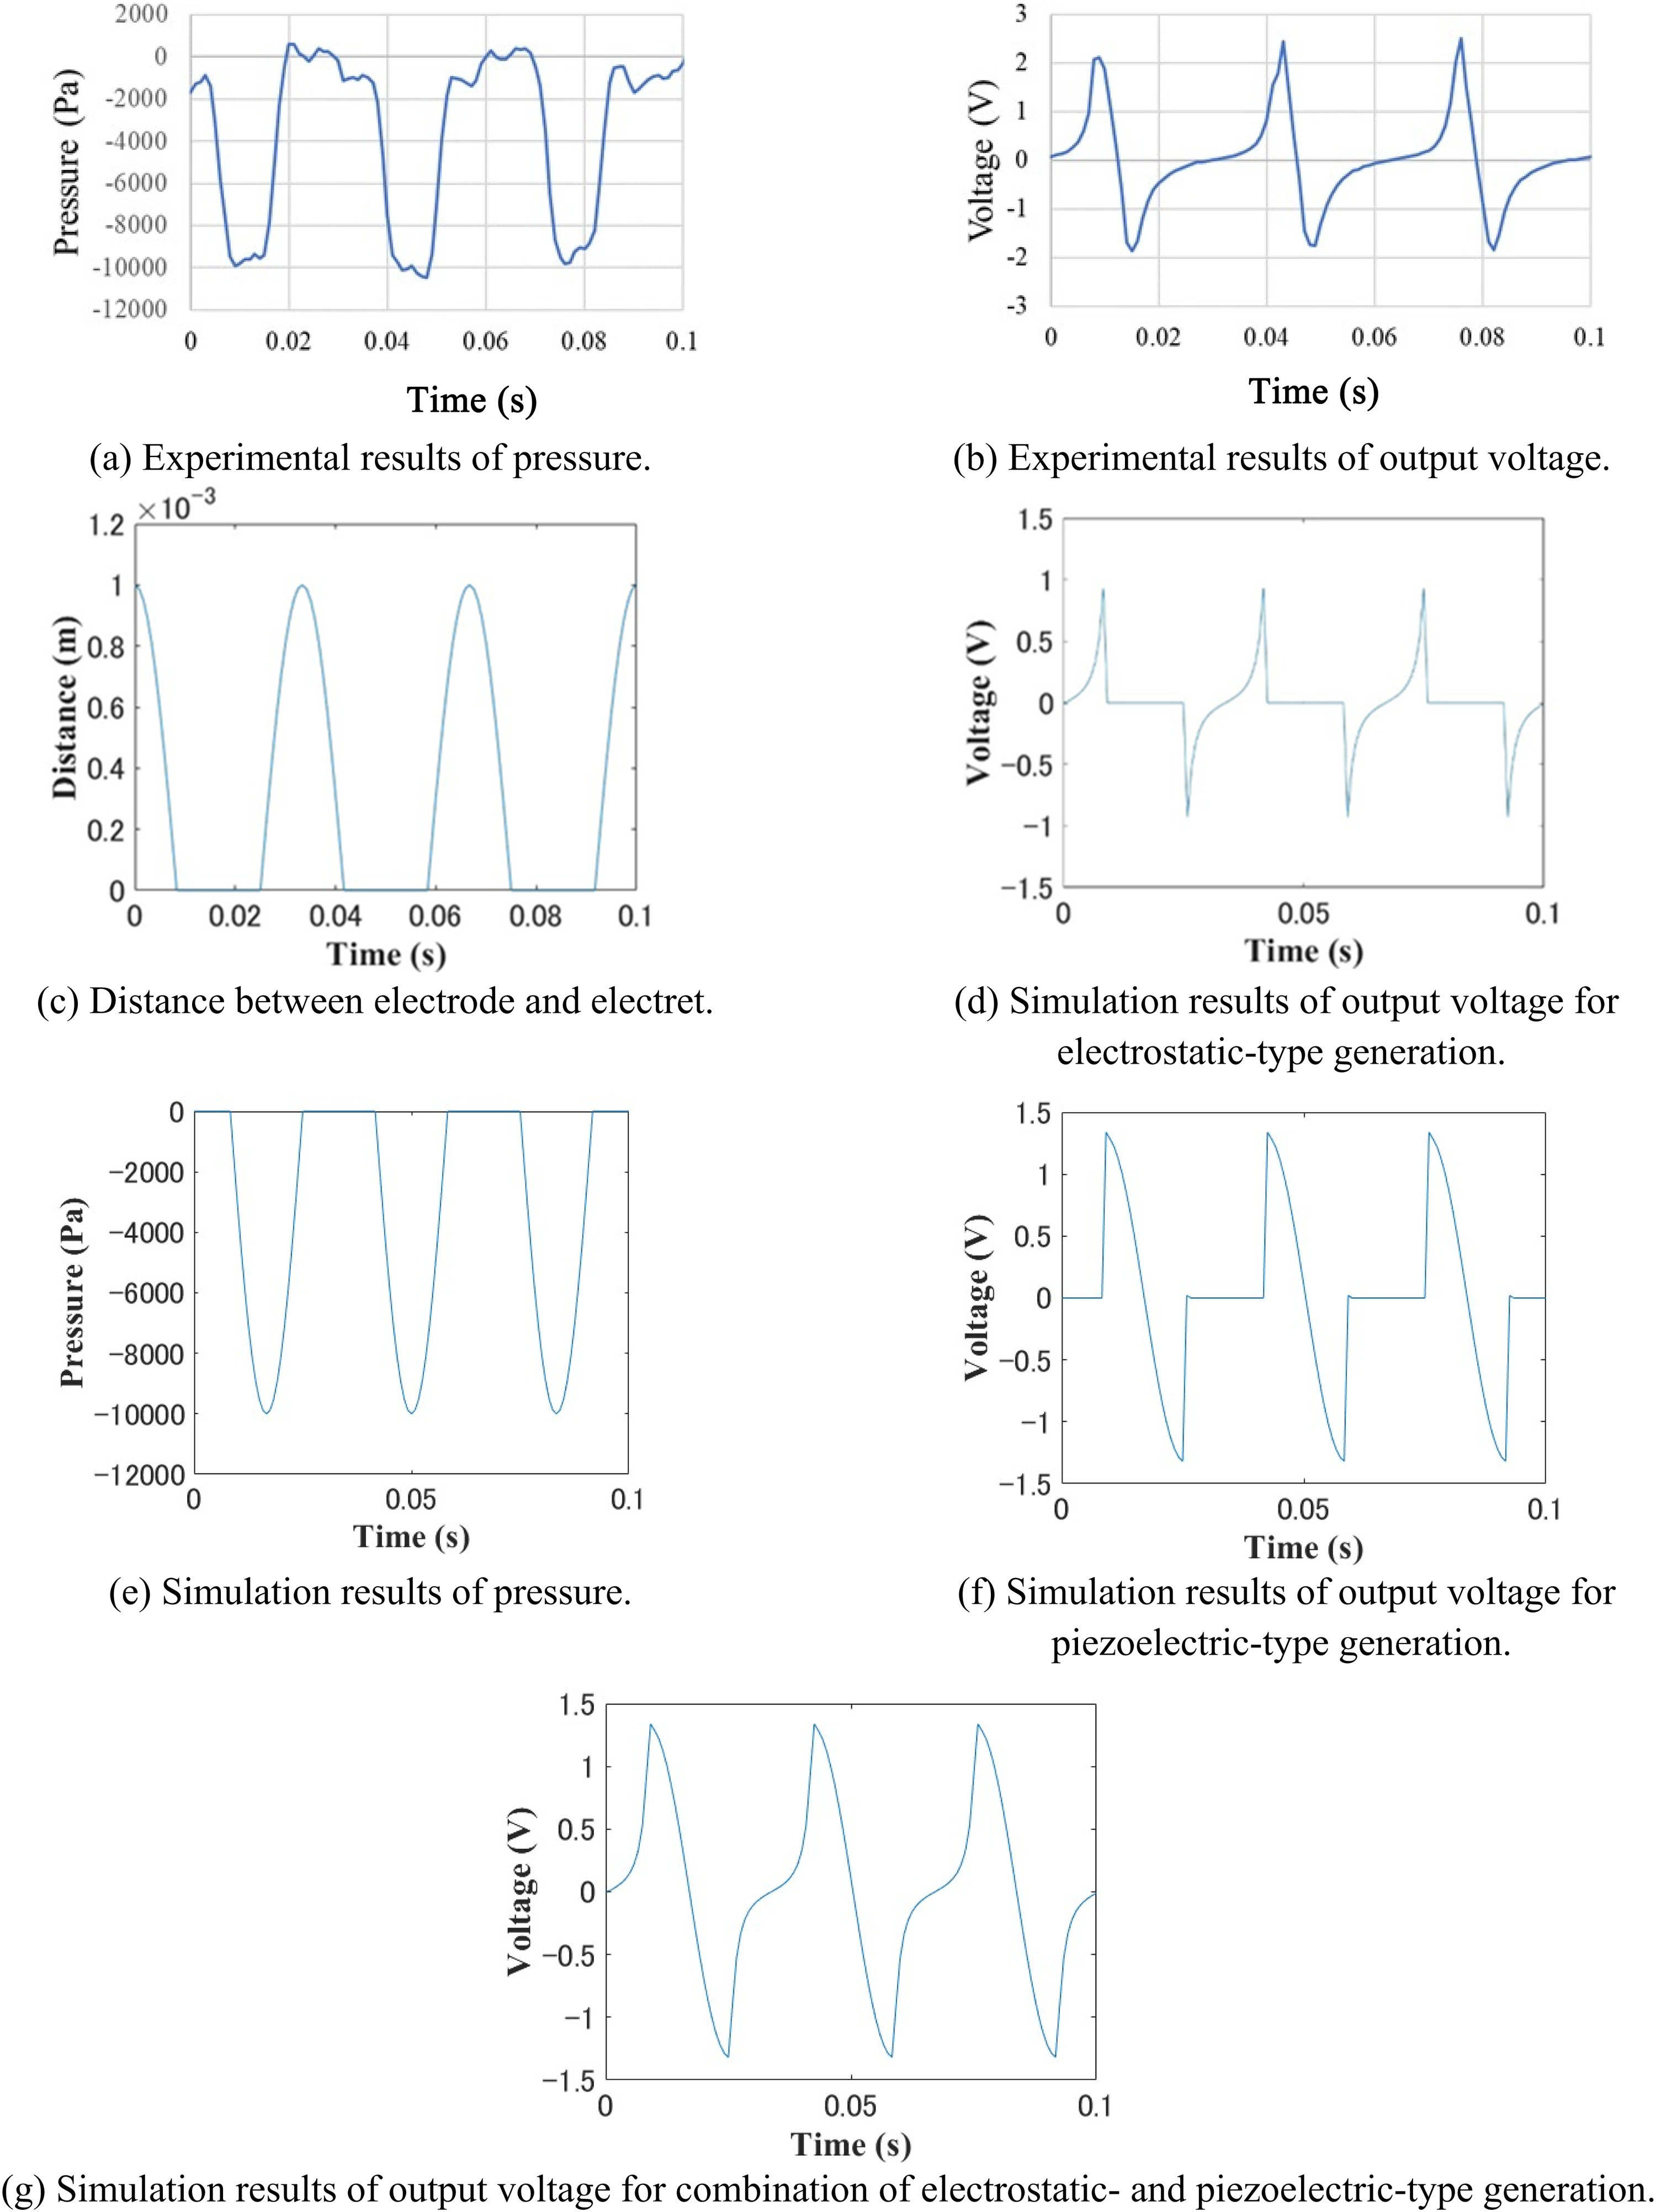
Simulation results obtained using the above derivation method are shown in Figures 12–14. The simulations were performed with three power generation patterns, namely electrostatic type, piezoelectric type, and their combination. As an example, a simulation was performed using the experimental results obtained after 1 week of corona charging for sample 1. The simulation used an electrostatic capacitance of 12.31 pF, a surface potential of 0.236 kV, and a piezoelectric stress constant of 1170 pC/N. The basic sample time for the simulation was fixed at 0.025/f, where f is the frequency. The electrostatic-type generation outputs a voltage based on the distance between the electrode and the piezoelectret. The maximum distance between the electrode and the piezoelectret was 1 mm. The piezoelectric-type generation outputs a voltage based on the pressure. The pressure was 10,000 Pa.
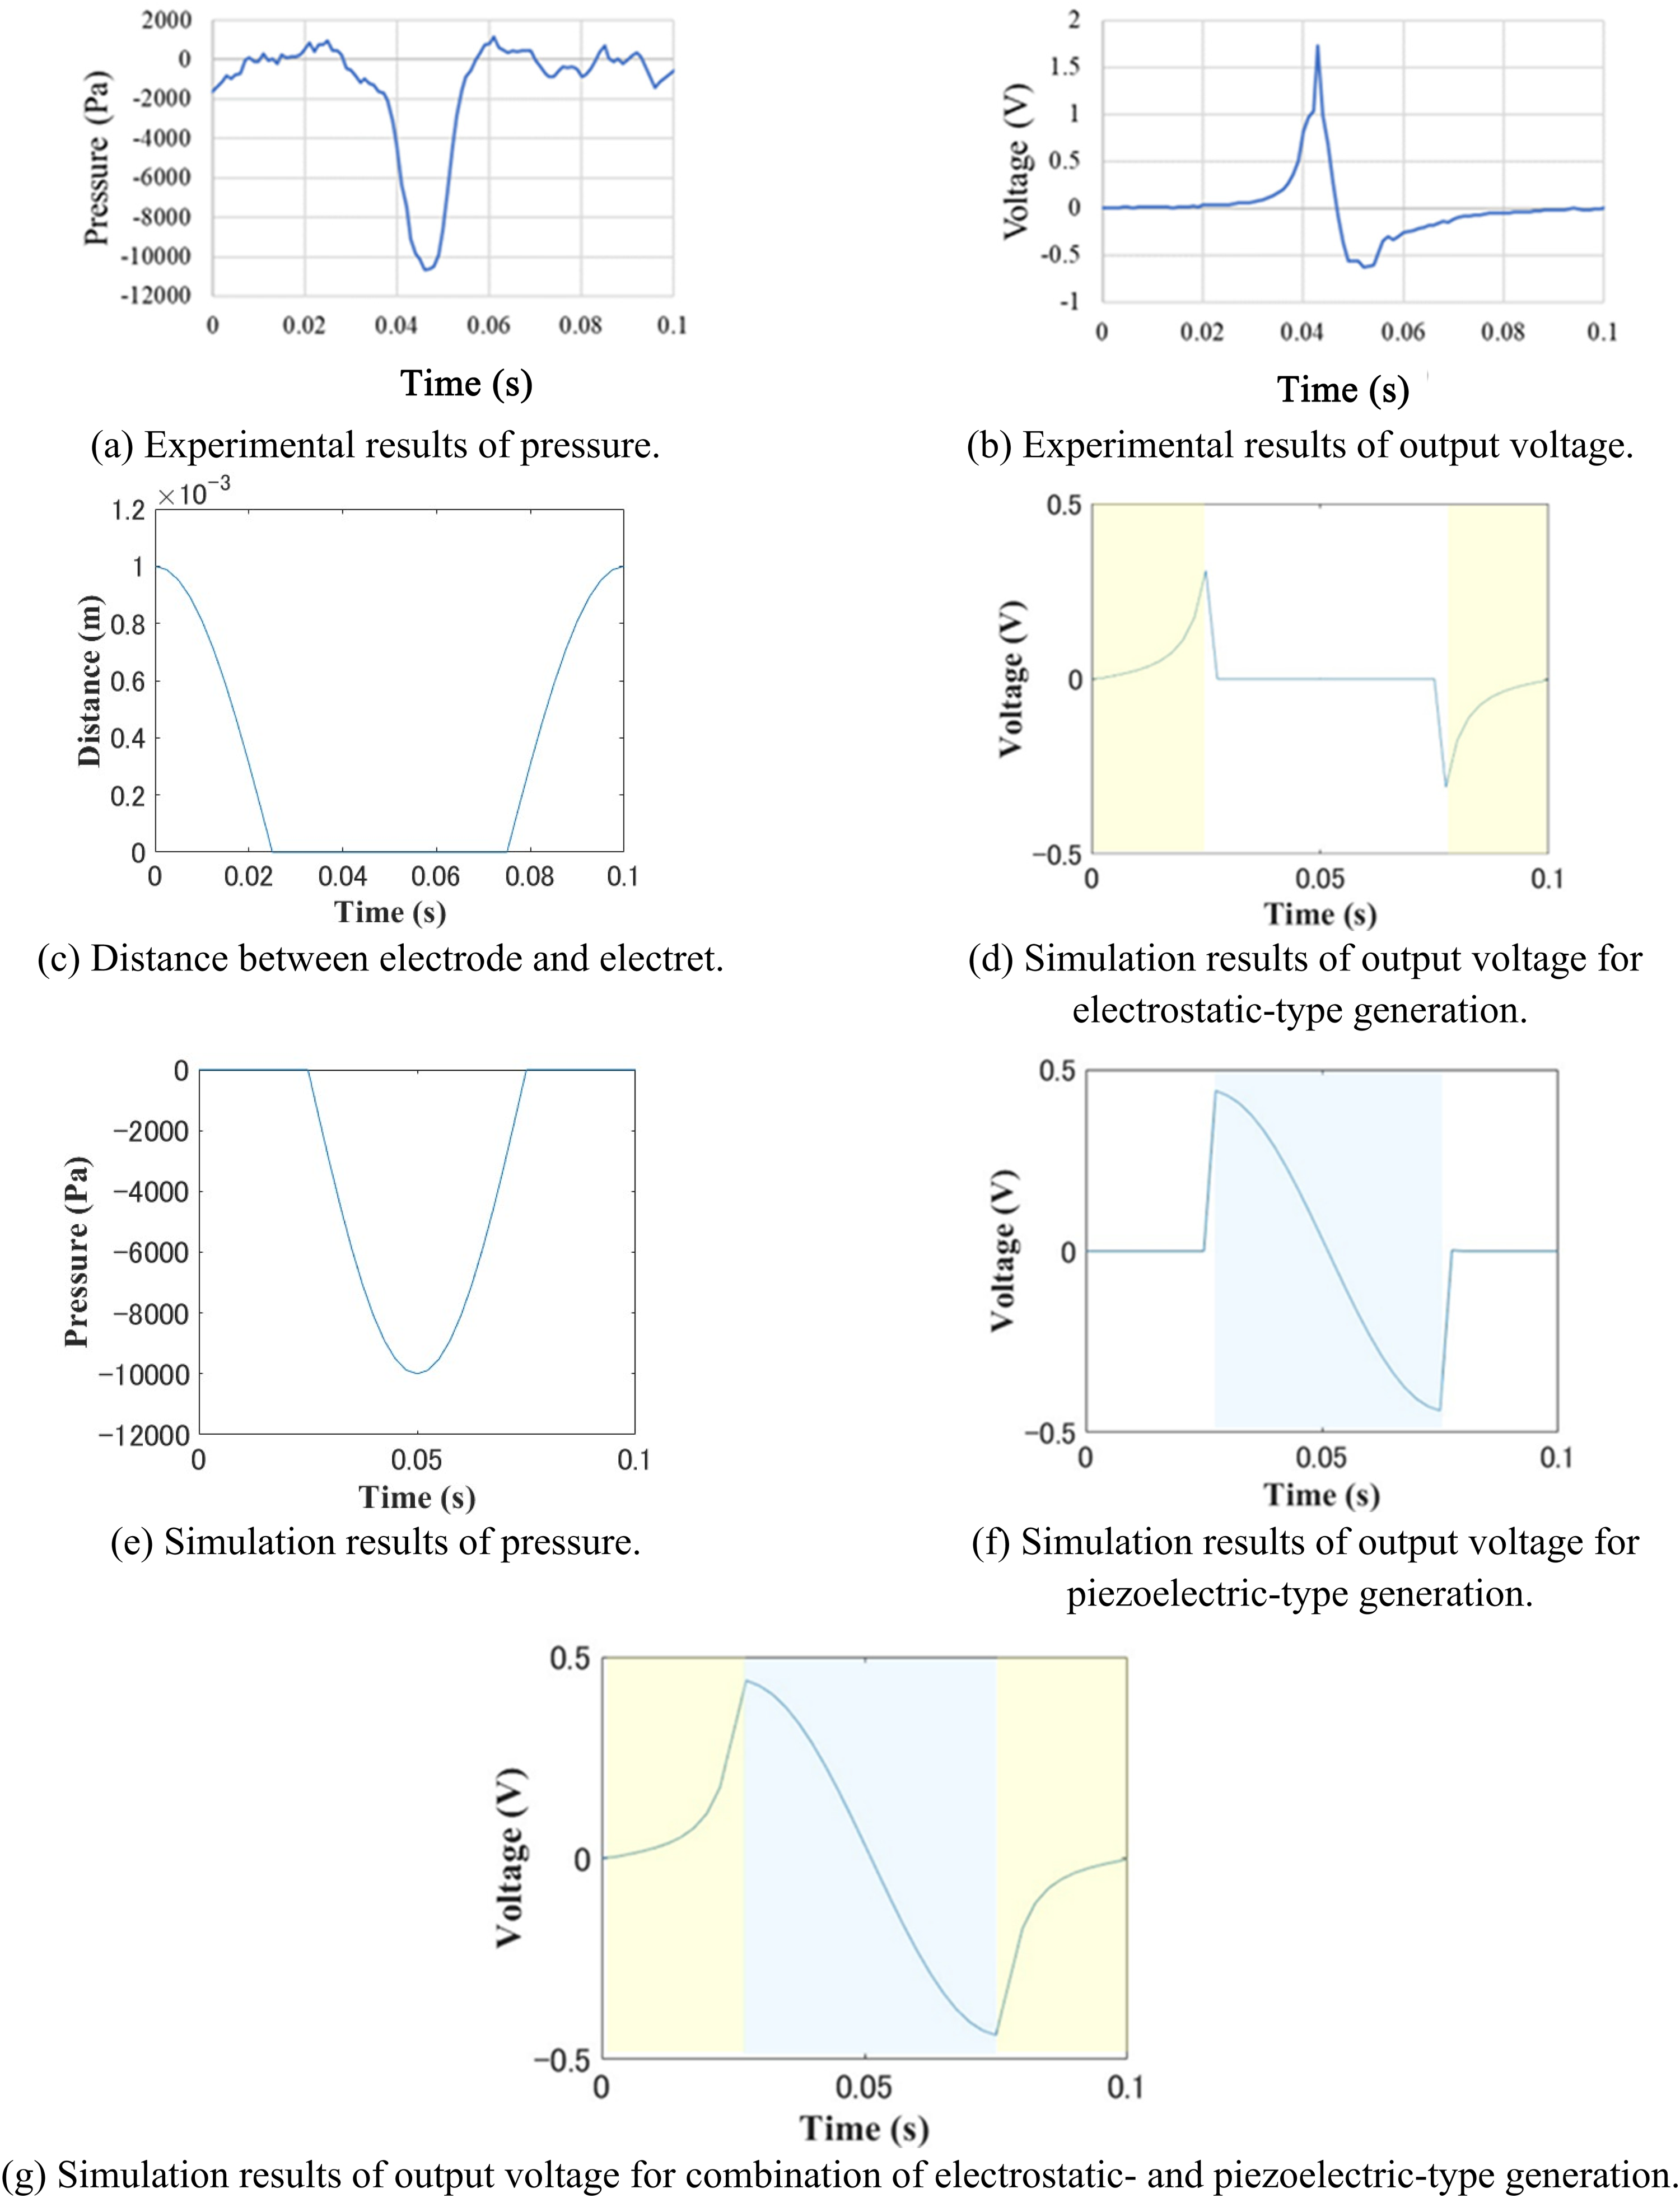
Experimental and simulation results obtained immediately after coronal charging at 10 Hz.
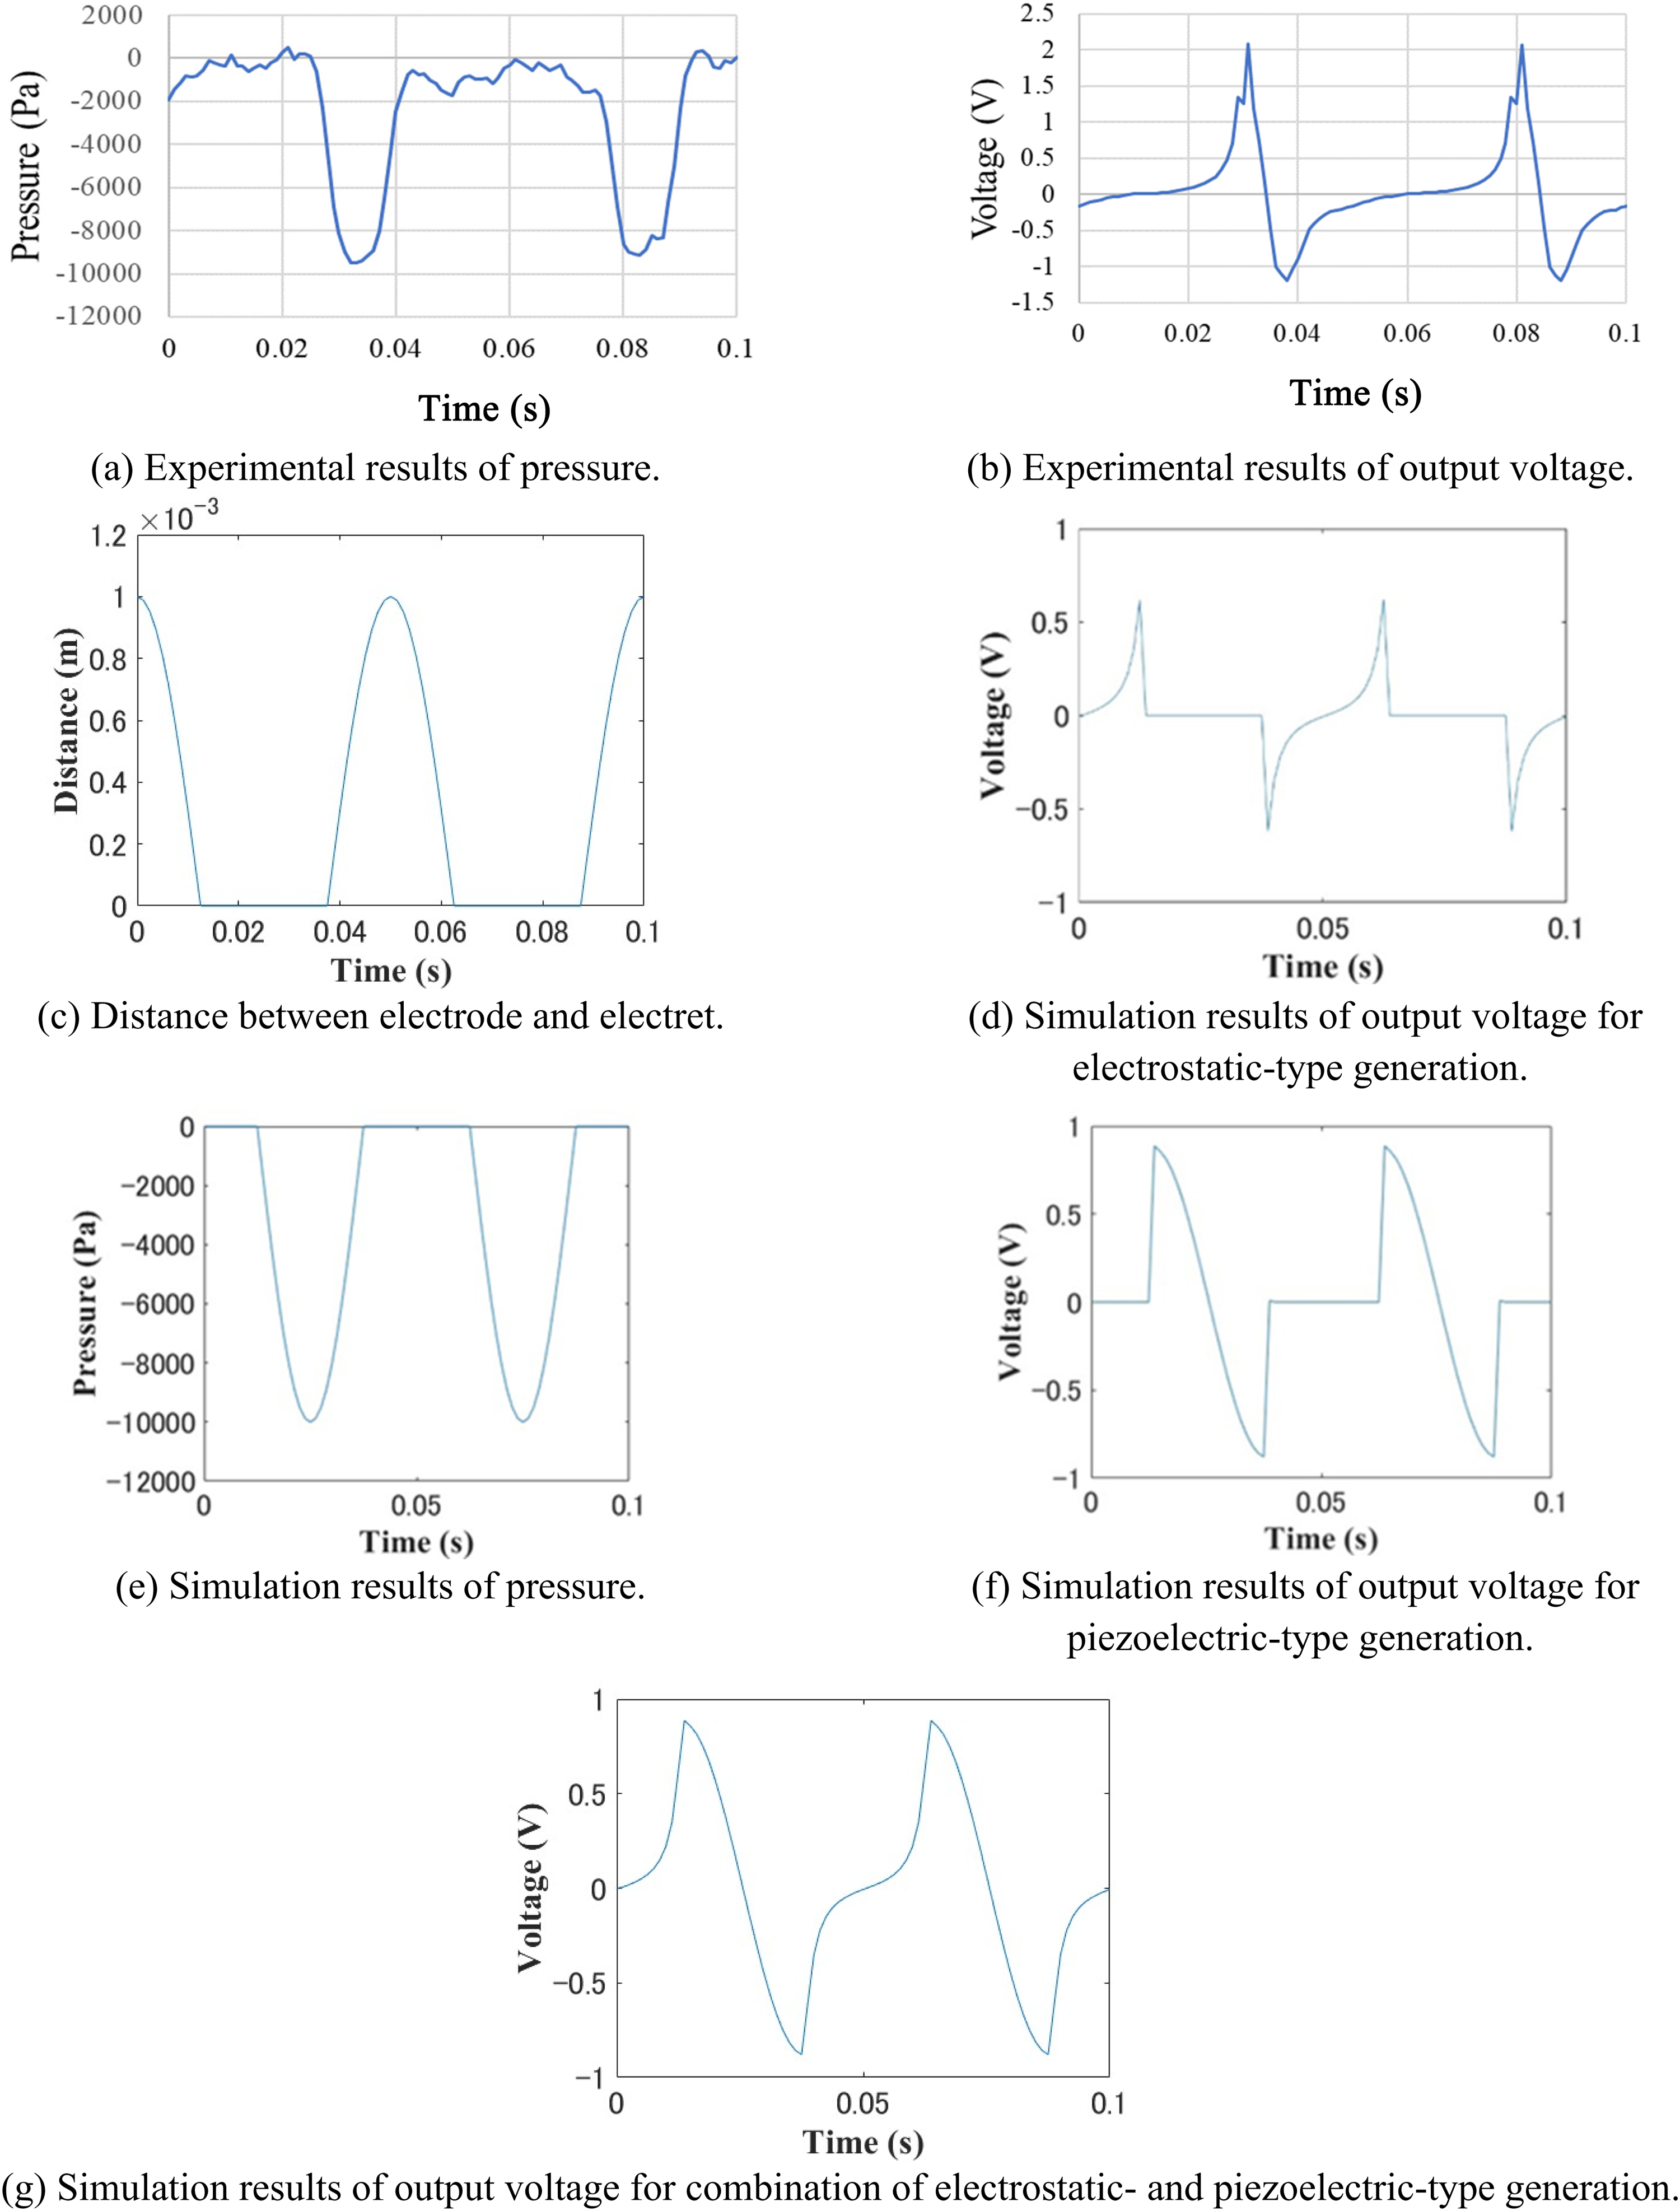
Experimental and simulation results obtained immediately after coronal charging at 20 Hz.
Experimental and simulation results obtained immediately after coronal charging at 30 Hz.
For the combination of the electrostatic and piezoelectric types, when the electrode and piezoelectret were not touching, the electrostatic-type generation was used, and when they were touching, the piezoelectric-type generation was used. When switching from the electrostatic- to piezoelectric-type generation, the value of the electrostatic (piezoelectric) type at the moment the electrode and the piezoelectret touched was the initial value of the piezoelectric (electrostatic) type. As shonw in Figure 12(d), the yellow area is where the electrode is not in contact with the piezoelectret, and during this time, electricity is generated by electrostatic effects. In Figure 12(f), the blue area indicates where the electrode contacts the piezoelectret, during which time electricity is generated via the piezoelectric effect. In Figure 12(g), this graph shows simulation results combining electrostatic (Figure 12(d)) and piezoelectric effects (Figure 12(f)), yielding results close to those obtained experimentally (Figure 12(b)). Similar results have been obtained at other frequencies. It is also confirmed from Figures 12, 13 and 14 that he peak-to-peak output voltage increased as the frequency increased since the electret fabricated has the piezoelectric characteristics.
The simulation results show that the output voltage waveforms obtained for the combination of electrostatic- and piezoelectric-type generation are the closest to the measured output voltage waveforms. This suggests that the power generation model for the piezoelectret is a combination of those for the electrostatic- and piezoelectric-type generation. The peak voltage value was smaller than the measured value. This is caused by the deviation of the surface potential and piezoelectric stress constant d33.
Conclusion
This study proposed a piezoelectret that uses general-purpose rubber instead of porous silicone rubber or rubber mixed with lead zirconate titanate. Using a general-purpose rubber such as IIR for the piezoelectret enables low-cost manufacturing and is expected to contribute to the expansion of the Internet of Things. A prototype piezoelectret made of IIR was fabricated and its performance was evaluated. The surface potential and piezoelectric stress constant d33 decreased immediately after the corona charge process but were maintained beyond day 7. The average d33 value after 2 weeks was 475.2 pC/N. This d33 value is much higher than that for polyvinylidene fluoride (∼40 pC/N), a representative piezoelectric material. The results demonstrate that a piezoelectret made of IIR has potential for high power generation. The power generation model for the piezoelectret was also studied and the generated power was simulated. The results suggest that the piezoelectret generates electricity via a combination of electrostatic- and piezoelectric-type generation. It is believed that the proposed piezoelectret has high power generation performance due to the combined action of electrostatic and piezoelectric effects.
Footnotes
Acknowledgements
All individuals who contributed to this article are listed as co-authors.
Funding
The authors received no financial support for the research, authorship, and/or publication of this article.
Declaration of conflicting interests
All co-authors have approved the submission of this manuscript. There are no conflicts of interest to report for any co-author.