
Abstract
Objective
Aortic stenosis is a common valvular disease in the elderly. This study aimed to investigate changes in whole blood viscosity (WBV), which reflects hemodynamic load and blood flow and is associated with cardiovascular diseases, after percutaneous and surgical interventions for aortic stenosis.
Methods
From 2019 to 2022, 200 patients undergoing Transcatheter Aortic Valve Implantation (TAVI) (n = 100) or bioprosthetic Aortic Valve Replacement (bAVR) (n = 100) were analyzed. WBV at low shear rate (LSR, 0.5 s−1) and high shear rate (HSR, 208 s−1) was calculated from the hematocrit and total protein using the De Simone formula. Pre- and 3-month values were compared using paired and independent t-tests, and correlations and multivariable regression were performed.
Results
The aortic valve area was negatively correlated with HSR (r = –0.340, p < 0.01) and LSR (r = –0.358, p < 0.01). At 3 months, HSR decreased by 0.95 ± 0.31 cP and LSR by 18.92 ± 6.32 cP (both p < 0.001). Reductions were significant in both groups without between-group differences and were mainly related to decreases in non-albumin protein fractions.
Conclusion
Both TAVI and bAVR markedly reduced WBV, independent of the intervention type. WBV may be a useful biomarker for monitoring hemorheological and protein-based changes following valve intervention.
Keywords
Introduction
Aortic stenosis (AS) is the most prevalent form of valvular heart disease, accounting for nearly 43% of all cases. 1 The etiological spectrum of AS includes degenerative calcific changes, congenital bicuspid valve degeneration and post-inflammatory rheumatic involvement. 2 Although traditionally regarded as an inevitable consequence of aging and mechanical wear, contemporary evidence has redefined aortic stenosis as an active disease process characterized by lipid deposition, endothelial dysfunction, and progressive valvular remodeling, sharing pathophysiological mechanisms similar to those observed in atherosclerosis. 3 These mechanistic insights have significantly influenced current therapeutic strategies and risk stratification paradigms.
Hemodynamic alterations in AS are not confined to valvular obstruction alone but exert systemic effects, including chronic shear stress, endothelial activation and inflammatory cytokine release. These processes contribute to increased plasma protein concentrations and heightened erythrocyte aggregation, ultimately leading to elevated whole blood viscosity (WBV). 4 WBV, defined as the ratio of shear stress to shear rate, reflects the resistance of blood to flow and is influenced by hematocrit, erythrocyte deformability and aggregation dynamics. 5 Elevated WBV can exacerbate myocardial workload, impair microcirculatory perfusion and is associated with adverse cardiovascular events, including hypertension and myocardial infarction.6–11
Despite this, limited data exist on how interventional treatment for AS, particularly Transcatheter Aortic Valve Implantation (TAVI) and bioprosthetic Aortic Valve Replacement (bAVR), affects the WBV. Since these procedures may differ in their impact on the valve area, systemic hemodynamic load, and blood flow characteristics, their influence on WBV may not be identical. Therefore, this study aimed to investigate early postoperative changes in WBV following TAVI and bAVR with the goal of improving our understanding of how these interventions affect hemorheological properties.
Methods
This investigation was conducted as a hospital-based, single-center, retrospective cohort analysis examining patients with severe aortic stenosis who underwent either bAVR or TAVI. The study period extended from January 2019 to December 2022, during which a total of 200 patients aged 18 years and older who met the predefined inclusion criteria were systematically recruited from the outpatient cardiology clinic. The inclusion criteria for this study were as follows:age≥18 years and diagnosis of severe aortic stenosis, defined as an aortic valve area indexed to body surface area ≤1.0 cm2 or ≤0.6 cm2/m2, mean transaortic pressure gradient ≥40 mmHg, or peak aortic jet velocity ≥4.0 m/s on echocardiographic evaluation. For patients with low-flow, low-gradient aortic stenosis who did not meet these gradient or velocity criteria, or those with stroke volume index <35 ml/m2, inclusion was based on dobutamine stress echocardiography demonstrating contractile reserve with mean gradient ≥40 mmHg at peak stress, or aortic valve calcium score ≥3000 Agatston units (≥1600 Agatston units for women) on computed tomography, confirming the presence of severe aortic stenosis. All patients had undergone either bAVR or TAVI as their primary therapeutic intervention for aortic stenosis. Additionally, patients were required to have complete pre-procedural and three-month post-procedural laboratory data, including hematocrit levels and total plasma protein concentrations, which are essential parameters for whole blood viscosity calculations using the De Simone formula. Patients were required to have had adequate echocardiographic imaging quality both before and after the procedure to allow accurate assessment of valve hemodynamics and effective orifice area measurements. Furthermore, all included patients were required to have successful procedural outcomes with no more than mild paravalvular aortic regurgitation at the three-month follow-up evaluation, ensuring that residual valve dysfunction would not confound the hemodynamic and rheological assessments. Finally, patients were required to have been available for complete three-month follow-up evaluation and to have provided informed consent for data collection and analysis as part of routine clinical care. Comprehensive patient data were collected from multiple sources including electrocardiographic recordings, echocardiographic examinations, computed tomography angiographic studies and conventional angiographic imaging. All admission summaries and laboratory values were systematically documented and analyzed. Patients with incomplete or missing data were excluded from the analysis to ensure data integrity and statistical validity. Patients were excluded if they presented with hematological disorders, including anemia, polycythemia vera or leukemia, as these conditions could significantly influence blood viscosity parameters. Additionally, individuals with active infectious diseases, including COVID-19 or pneumonia, were excluded due to their potential impact on inflammatory markers and blood rheological properties. Patients suffering from chronic kidney failure or chronic pulmonary diseases were also excluded, as these conditions are known to affect blood viscosity through various pathophysiological mechanisms. Furthermore, individuals with acute or chronic hepatic diseases were excluded due to their influence on plasma protein synthesis and blood coagulation parameters. Finally, patients who exhibited moderate or greater paravalvular aortic regurgitation at the three-month follow-up examination after TAVI or bAVR were excluded to eliminate the confounding effects of residual valvular dysfunction. Figure 1 displays the flowchart summarizing patient selection and exclusion.
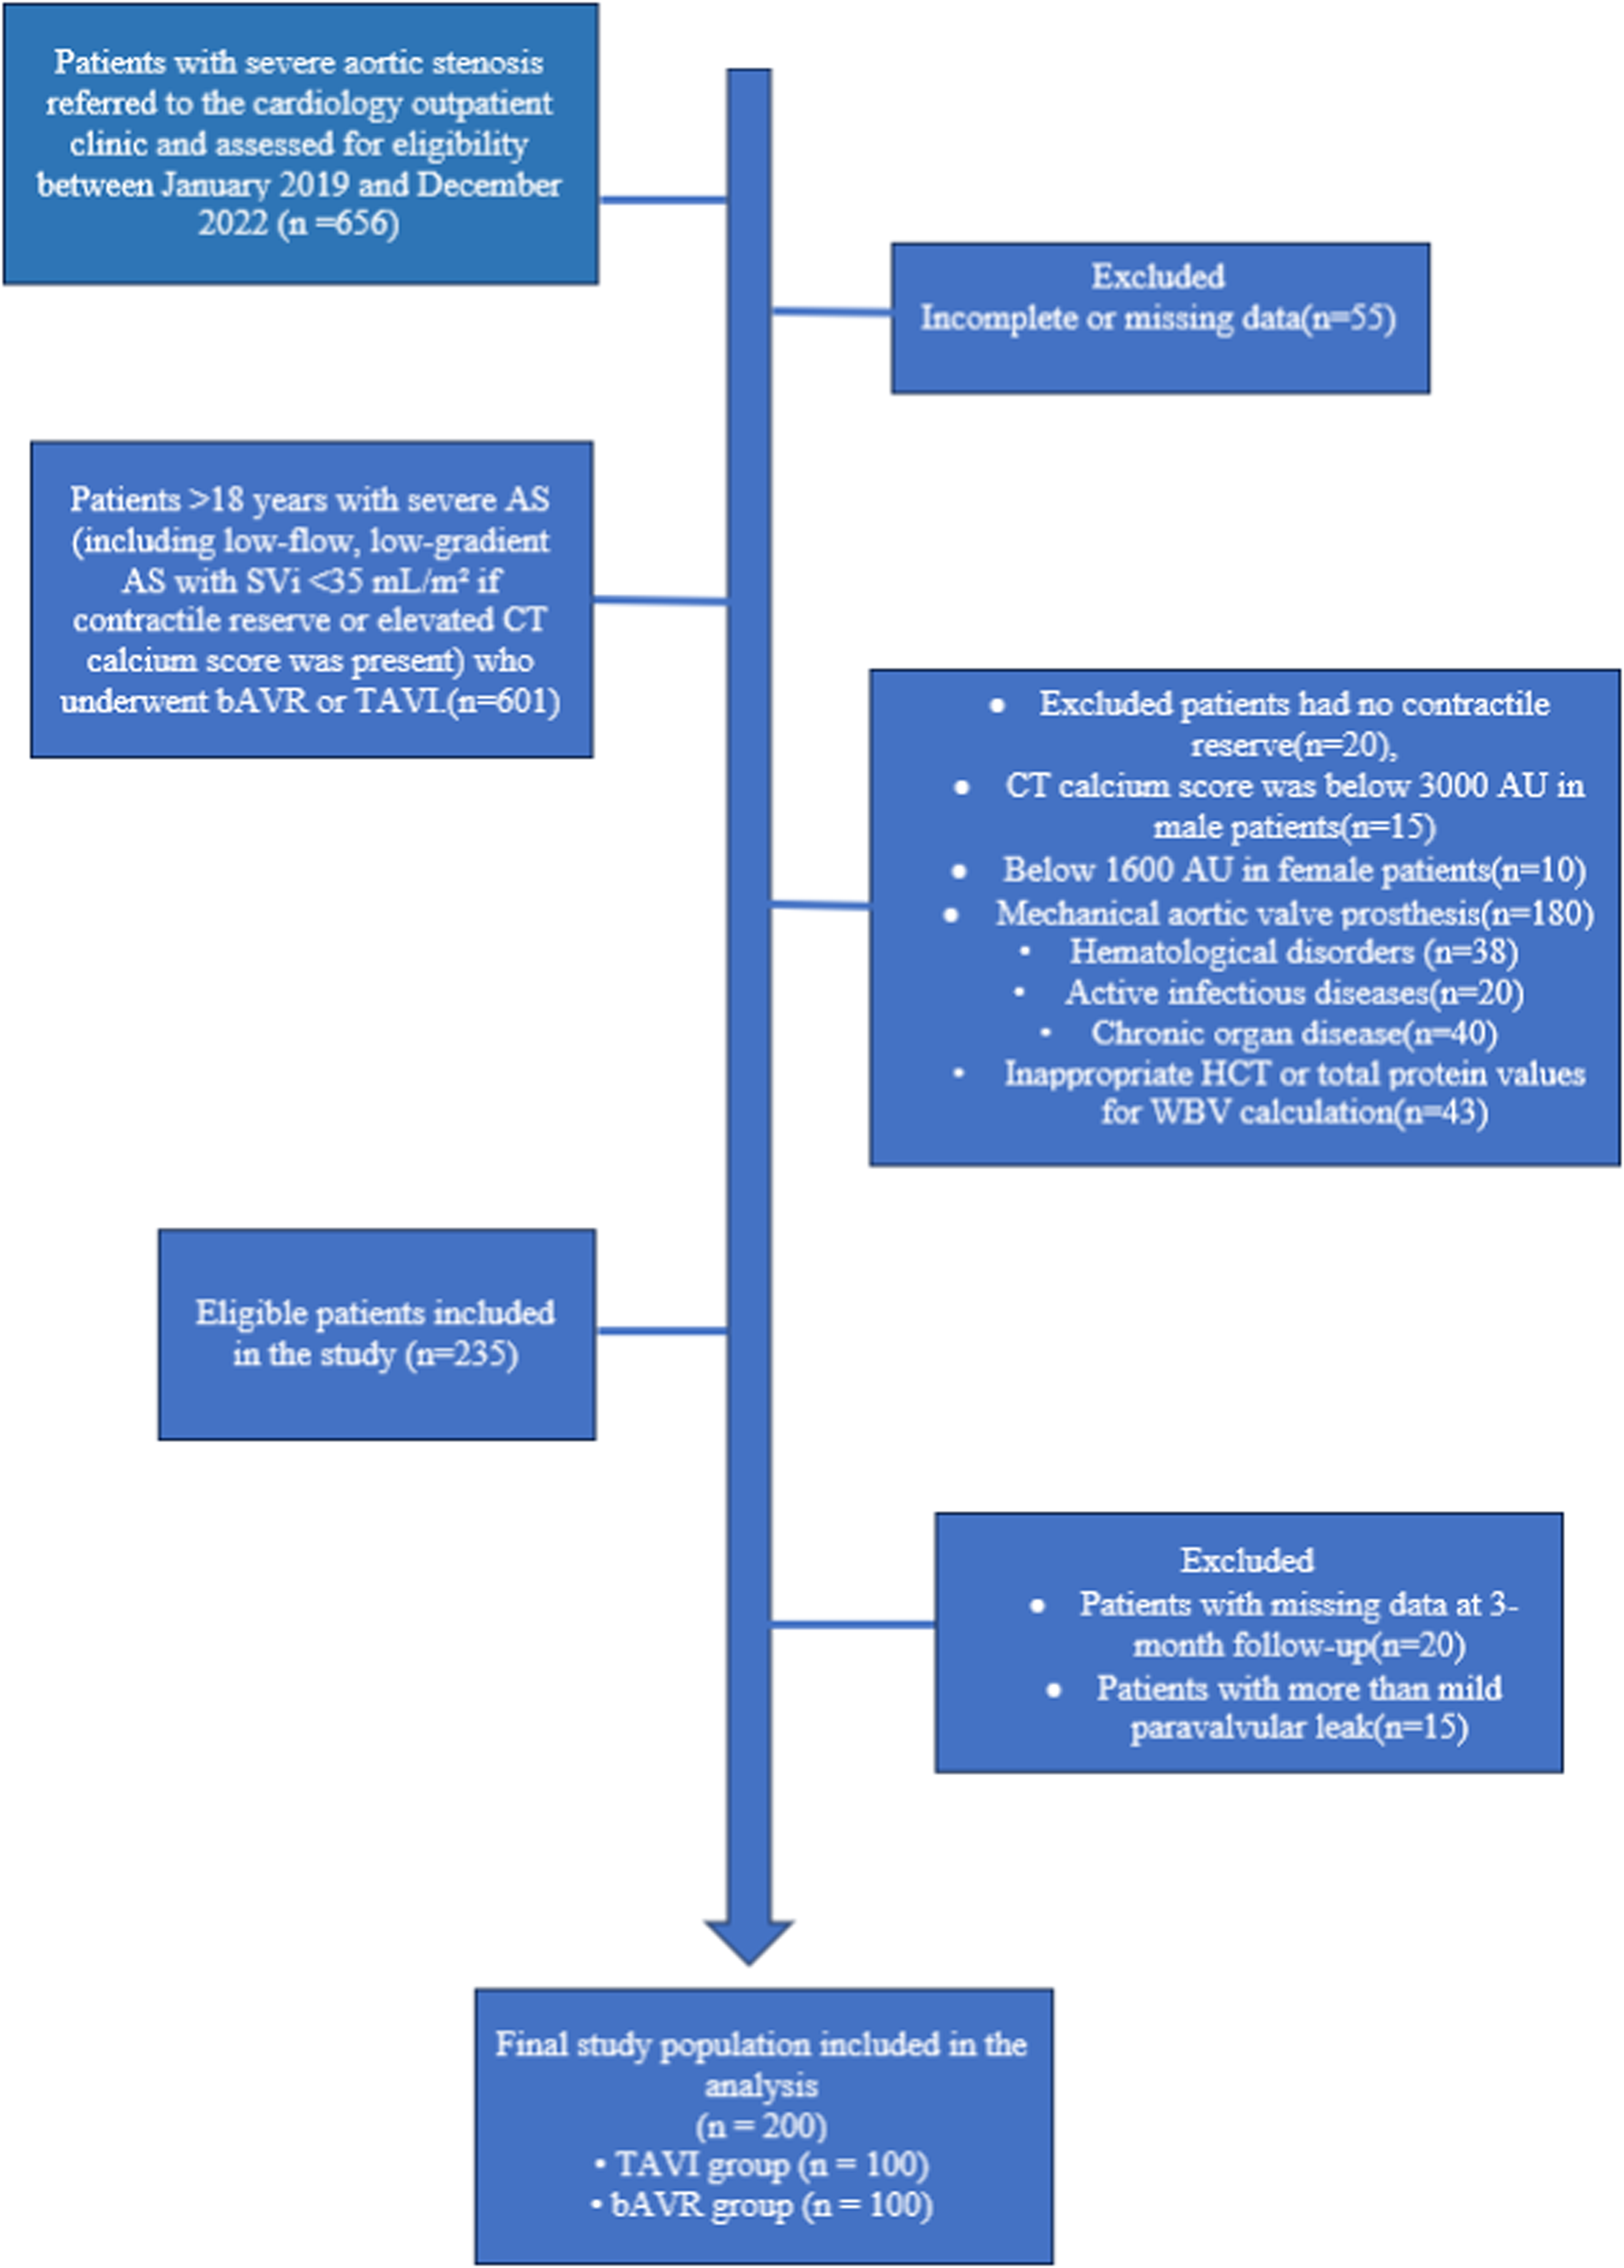
Flow chart of patient inclusion in this study.
Whole blood viscosity (WBV) measurements, along with hematocrit (HCT) percentages and total plasma protein concentrations (g/dL), were systematically assessed at two critical time points: pre-procedurally and at three months post-intervention following both bAVR and TAVI procedures. Blood viscosity calculations were performed at both low shear rate (LSR) of 0.5 s−1 and high shear rate (HSR) of 208 s−1, utilizing the validated computational formulas established by De Simone et al. The specific formulas employed were: HSR (208 s−1) = (0.12 × hematocrit) + 0.17 (total protein - 2.07) and LSR (0.5 s−1) = (1.89 × hematocrit) + 3.76 (total protein - 78.42). 12 These established formulas have been extensively validated in previous cardiovascular research and provide reliable estimates of whole blood viscosity under varying hemodynamic conditions.13,14 To ensure consistency and minimize pre-analytical variability, all blood samples used for viscosity calculations were obtained under standardized conditions. Specifically, venous blood was drawn in the early morning hours (between 08:00 and 09:00 a.m.) after an overnight fast of at least 8 h, both at baseline (prior to the procedure) and at the three-month follow-up visit. Blood samples were collected into EDTA tubes for hematocrit measurement and plain tubes for total plasma protein determination. All laboratory analyses were conducted at the institution's central laboratory using uniform, validated protocols, including automated hematology analyzers for hematocrit and biuret method-based assays for total protein quantification. This standardized approach ensured high analytical reliability and comparability between all samples.
The study protocol was designed and implemented in strict accordance with the ethical principles outlined in the Declaration of Helsinki for medical research involving human participants. Ethical approval was obtained from the Institutional Ethics Committee (approval number: 2022/17/632; approval date: November 1, 2022) prior to the initiation of data collection. All patient data were handled with strict confidentiality protocols, and appropriate measures were taken to ensure patient privacy and data security throughout the research process.
Statistical analysis
All statistical analyses were performed using SPSS v28.0 (IBM Corp., Armonk, NY, USA). Continuous variables are expressed as mean ± standard deviation (SD) or median (interquartile range [IQR]), depending on the distribution, and categorical variables are expressed as counts (n) and percentages (%). Normality was assessed using the Kolmogorov–Smirnov test and Q–Q plots.
For between-group comparisons, the independent samples t-test was used for continuous variables, whereas the χ2 test or Fisher's exact test was applied for categorical variables.
For within-group comparisons of preoperative and 3-month follow-up values, the paired samples t-test was used.
The contributions of hematocrit and total protein to the changes in HSR and LSR were examined using multiple linear regression analysis. In addition, the relationship between aortic valve area and WBV was assessed using Pearson correlation analysis.Independent predictors of WBV were identified using multivariable linear regression models.All statistical tests were two-tailed, and a p-value < 0.05 was considered statistically significant.
Additionally, to account for the repeated measures structure of preoperative and postoperative assessments and interindividual variability, we applied linear mixed-effects models. In these models, ‘time’ (pre vs. 3 months) was specified as the repeated factor, while ‘group’ (TAVI vs. bAVR), valve area increase (VAI), and log-transformed CRP were included as fixed effects. The patient ID was modeled as a random intercept to capture subject-level heterogeneity. The critical interaction term was time × VAI, which tested whether the longitudinal change differed according to the magnitude of the hemodynamic improvement. Results are reported as regression coefficients (β) with standard errors, 95% confidence intervals and FDR-adjusted p-values.
Results
This study analyzed 200 patients undergoing TAVI (n = 100) or bioprosthetic AVR (bAVR; n = 100) between 2019 and 2022 (mean age 76.4 ± 6.3 years; 50% women).
The demographic and echocardiographic characteristics of the patients are presented in Table 1. Compared with bAVR, the TAVI group was older and included more men; hypertension, diabetes, and atrial fibrillation were more prevalent (Table 1; all p < 0.01). Echocardiographically, LA diameter, E velocity, and sPAP were higher and TAPSE was lower in the TAVI group (all p < 0.001), while other baseline measures were comparable.
Baseline clinical and demographic characteristics of the patients.
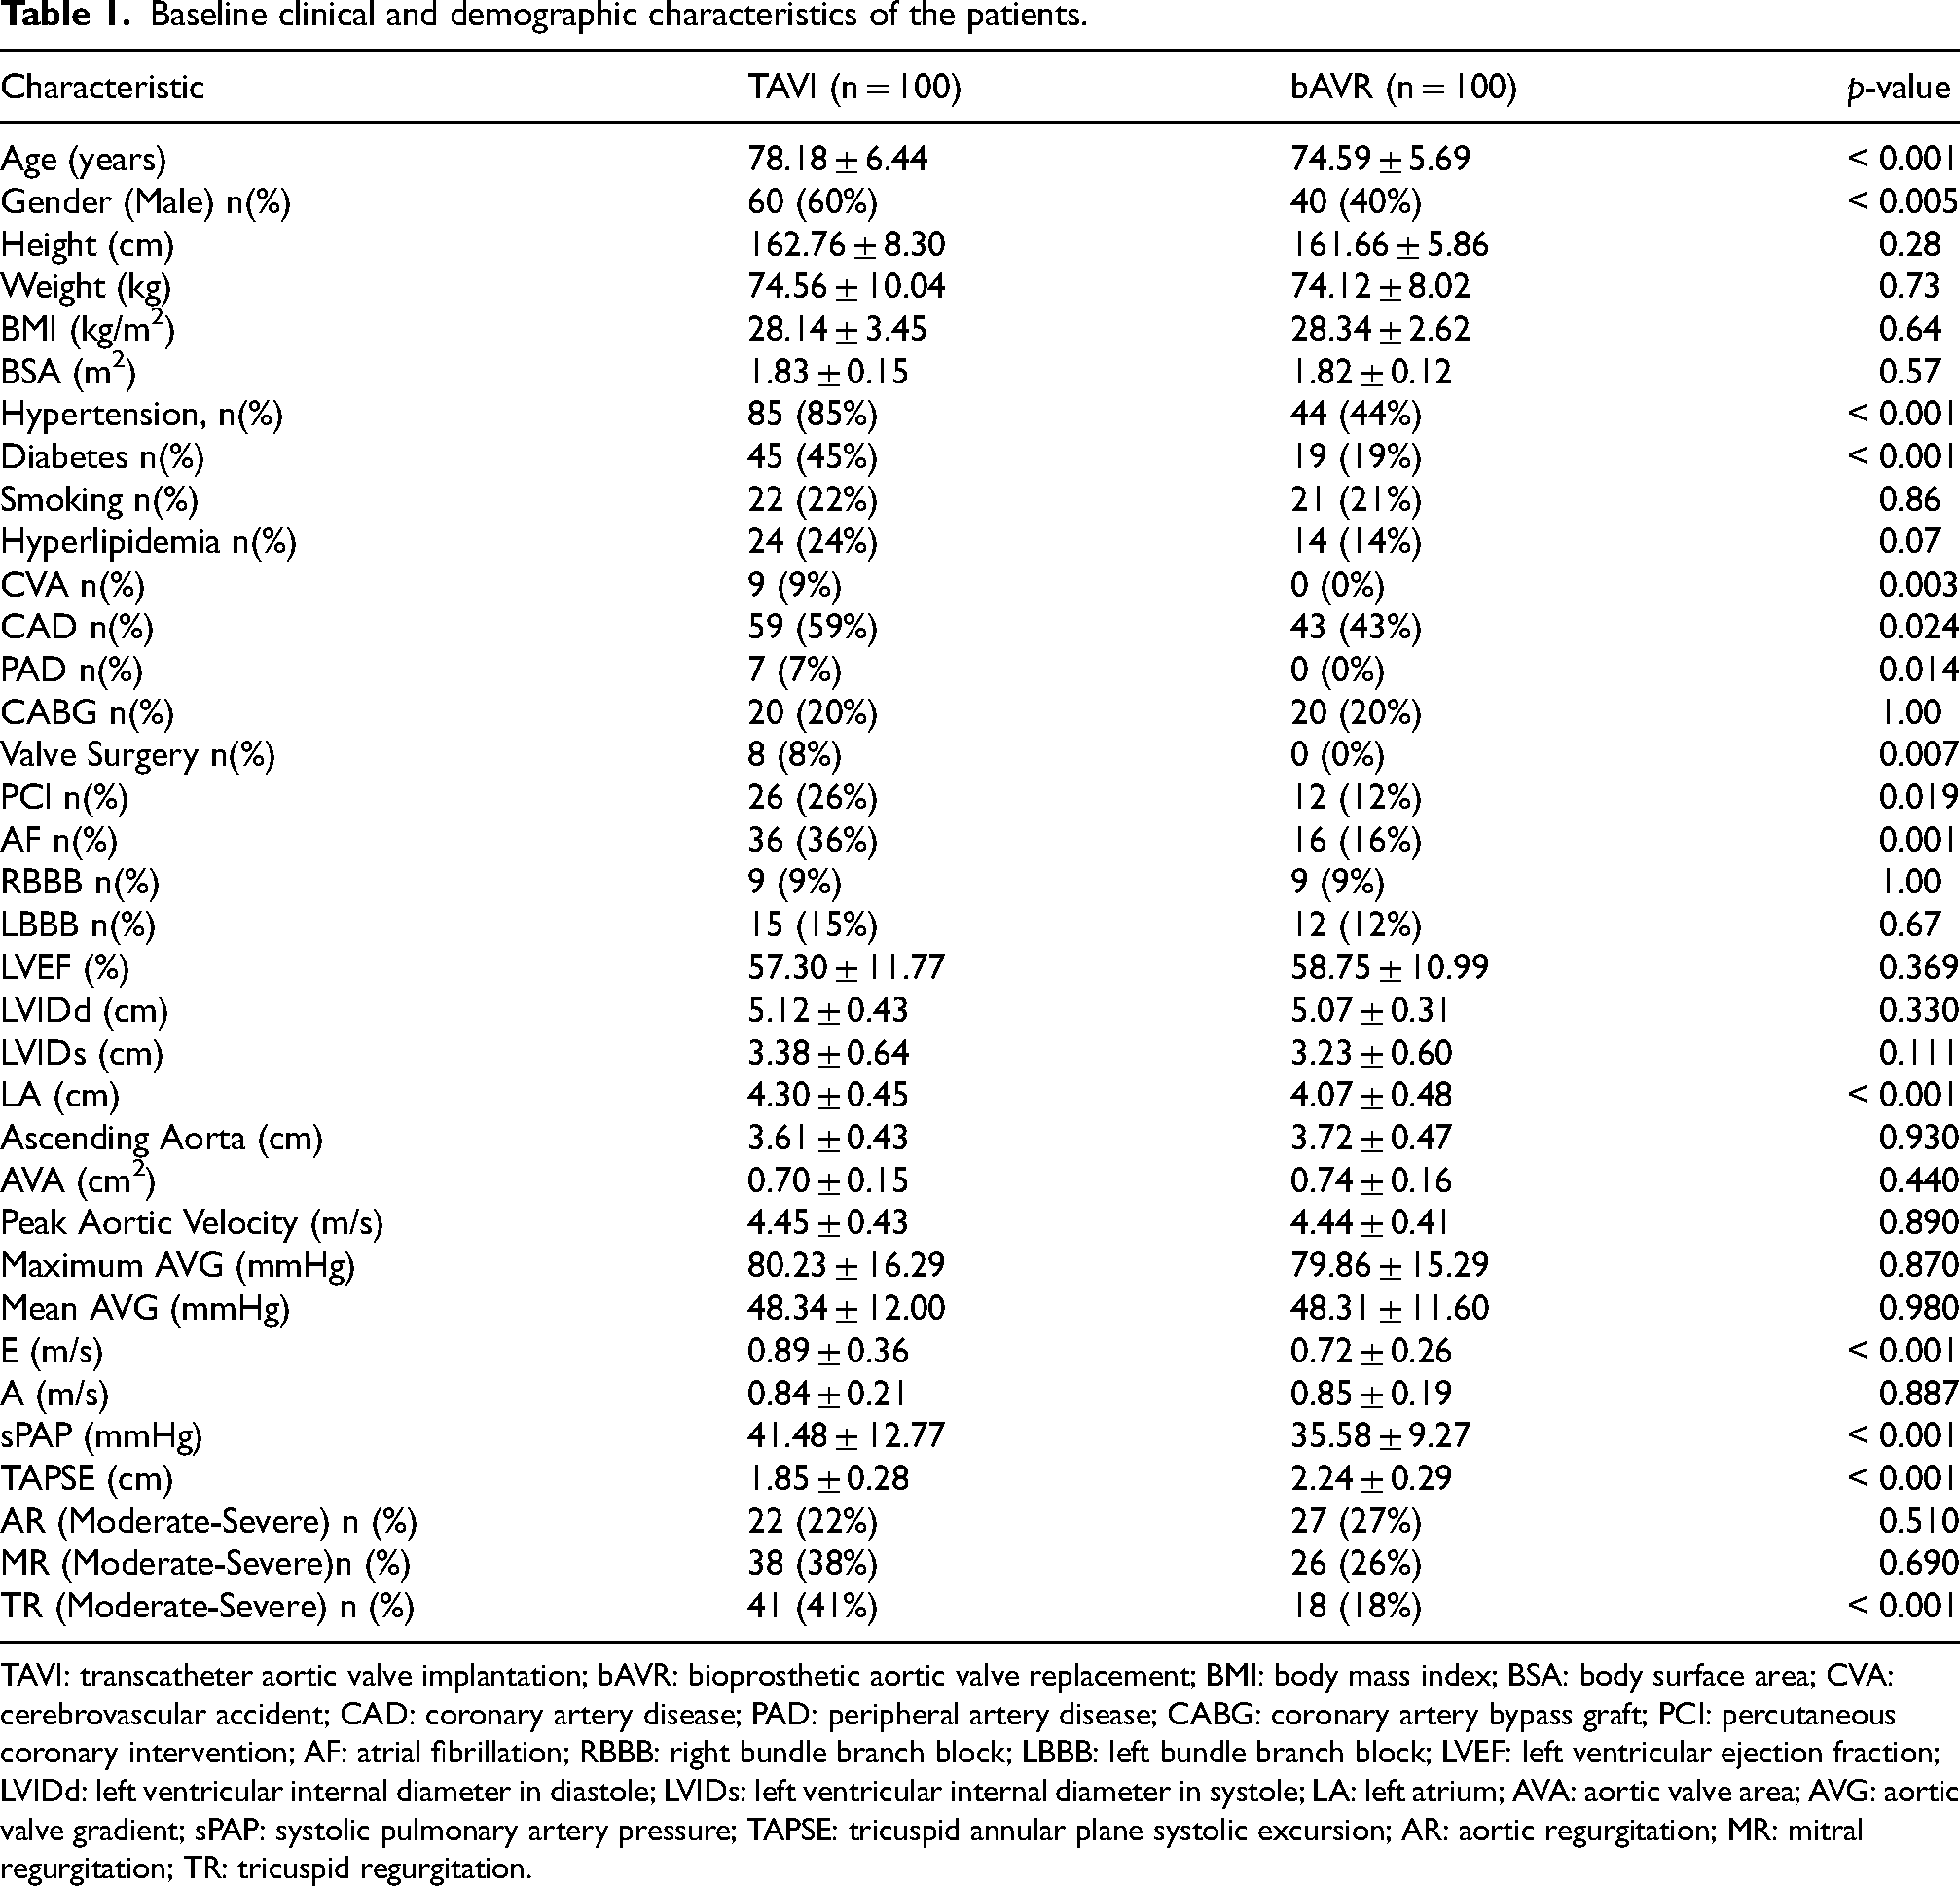
TAVI: transcatheter aortic valve implantation; bAVR: bioprosthetic aortic valve replacement; BMI: body mass index; BSA: body surface area; CVA: cerebrovascular accident; CAD: coronary artery disease; PAD: peripheral artery disease; CABG: coronary artery bypass graft; PCI: percutaneous coronary intervention; AF: atrial fibrillation; RBBB: right bundle branch block; LBBB: left bundle branch block; LVEF: left ventricular ejection fraction; LVIDd: left ventricular internal diameter in diastole; LVIDs: left ventricular internal diameter in systole; LA: left atrium; AVA: aortic valve area; AVG: aortic valve gradient; sPAP: systolic pulmonary artery pressure; TAPSE: tricuspid annular plane systolic excursion; AR: aortic regurgitation; MR: mitral regurgitation; TR: tricuspid regurgitation.
Comparisons of the laboratory parameters between the TAVI and bAVR groups are summarized in Table 2. The neutrophil levels were significantly higher in the TAVI group than in the bAVR group. In contrast, lymphocyte levels were significantly lower in the TAVI group. Mean Platelet Volume (MPV) was also higher in the TAVI group. The total protein levels were lower in the TAVI group than in the bAVR group.
Comparison of laboratory characteristics between groups.
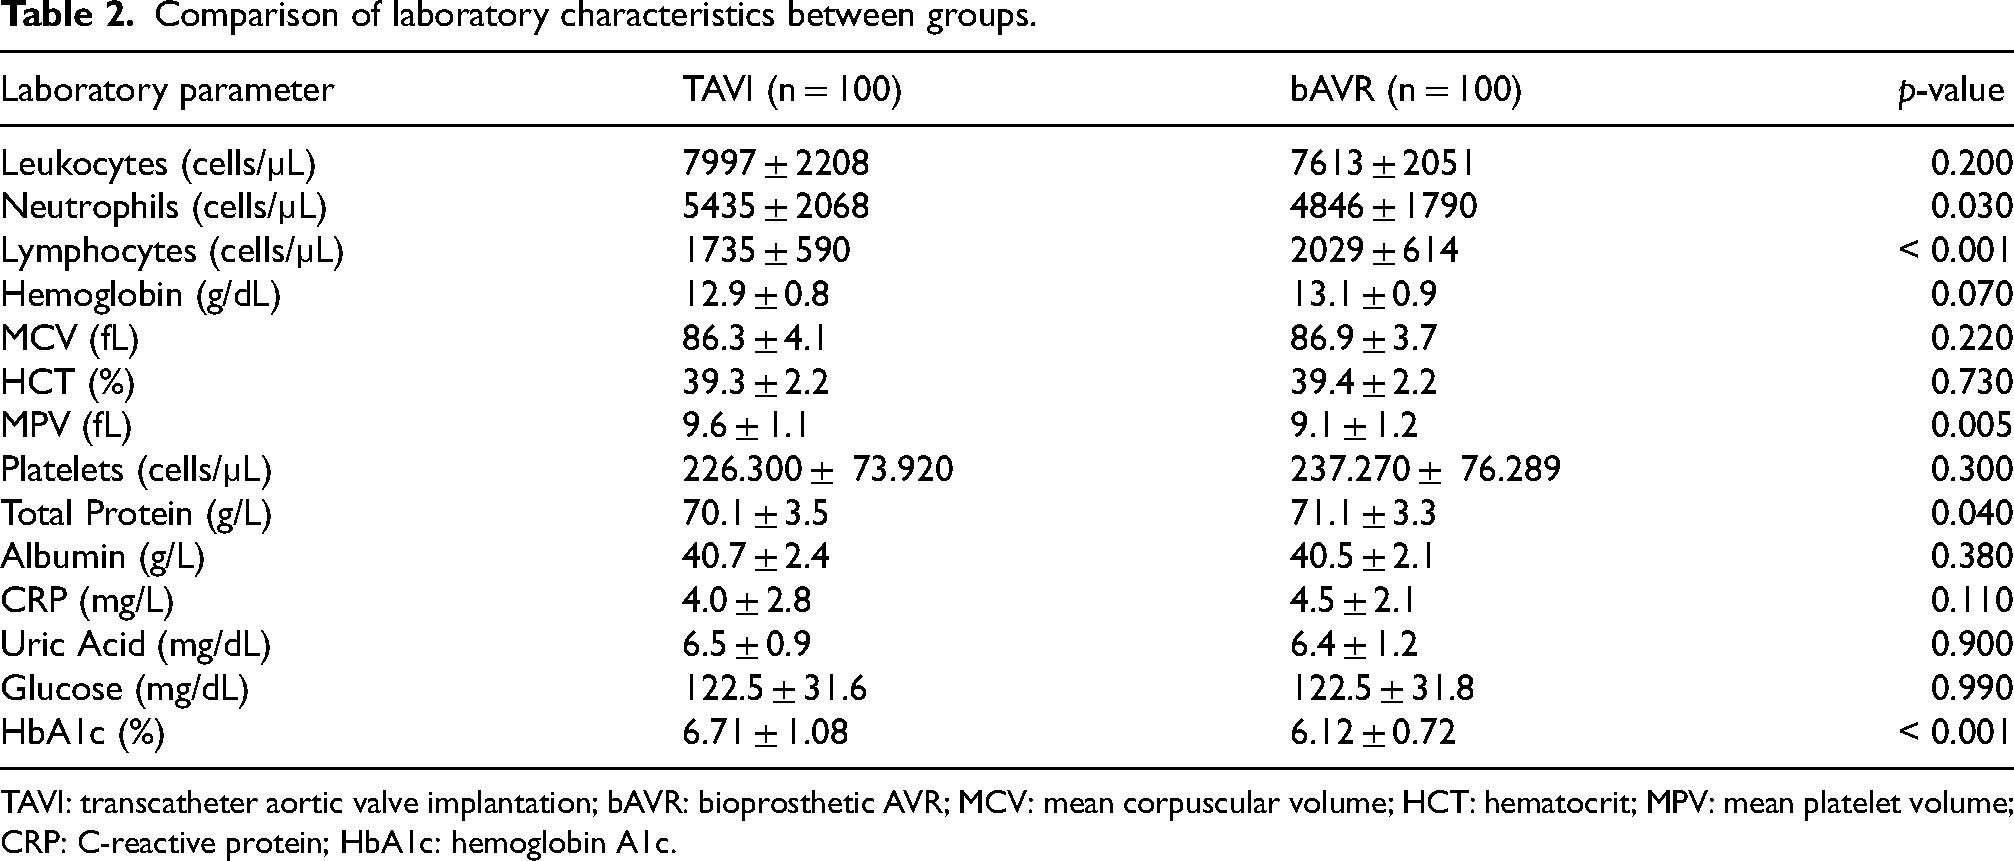
TAVI: transcatheter aortic valve implantation; bAVR: bioprosthetic AVR; MCV: mean corpuscular volume; HCT: hematocrit; MPV: mean platelet volume; CRP: C-reactive protein; HbA1c: hemoglobin A1c.
At 3-month follow-up, both high-shear and low-shear blood viscosity values showed a significant reduction compared with baseline (Table 3, all p < 0.001). Hematocrit and total protein levels also decreased significantly (both p < 0.001), whereas albumin levels exhibited a slight but statistically significant increase (p = 0.042).
At baseline, HSR, LSR, TP, and HCT values were comparable between groups (Table 4, all p > 0.05), whereas albumin was significantly higher in the bAVR group (p = 0.021). At 3 months, no significant differences were observed in HSR, LSR, TP, or HCT (all p > 0.05), while albumin levels remained higher in the bAVR group (p = 0.017). The changes in albumin and HCT did not differ significantly between groups (p > 0.05). There was a trend toward a greater reduction in HSR and LSR values in the TAVI group compared with the bAVR group, although these differences did not reach statistical significance.
Preoperatively, viscosity indices correlated positively with hematocrit and total protein and inversely with aortic valve area (|r| ≈ 0.3–0.4), consistent with Figure 2 (Supplementary Table S1).
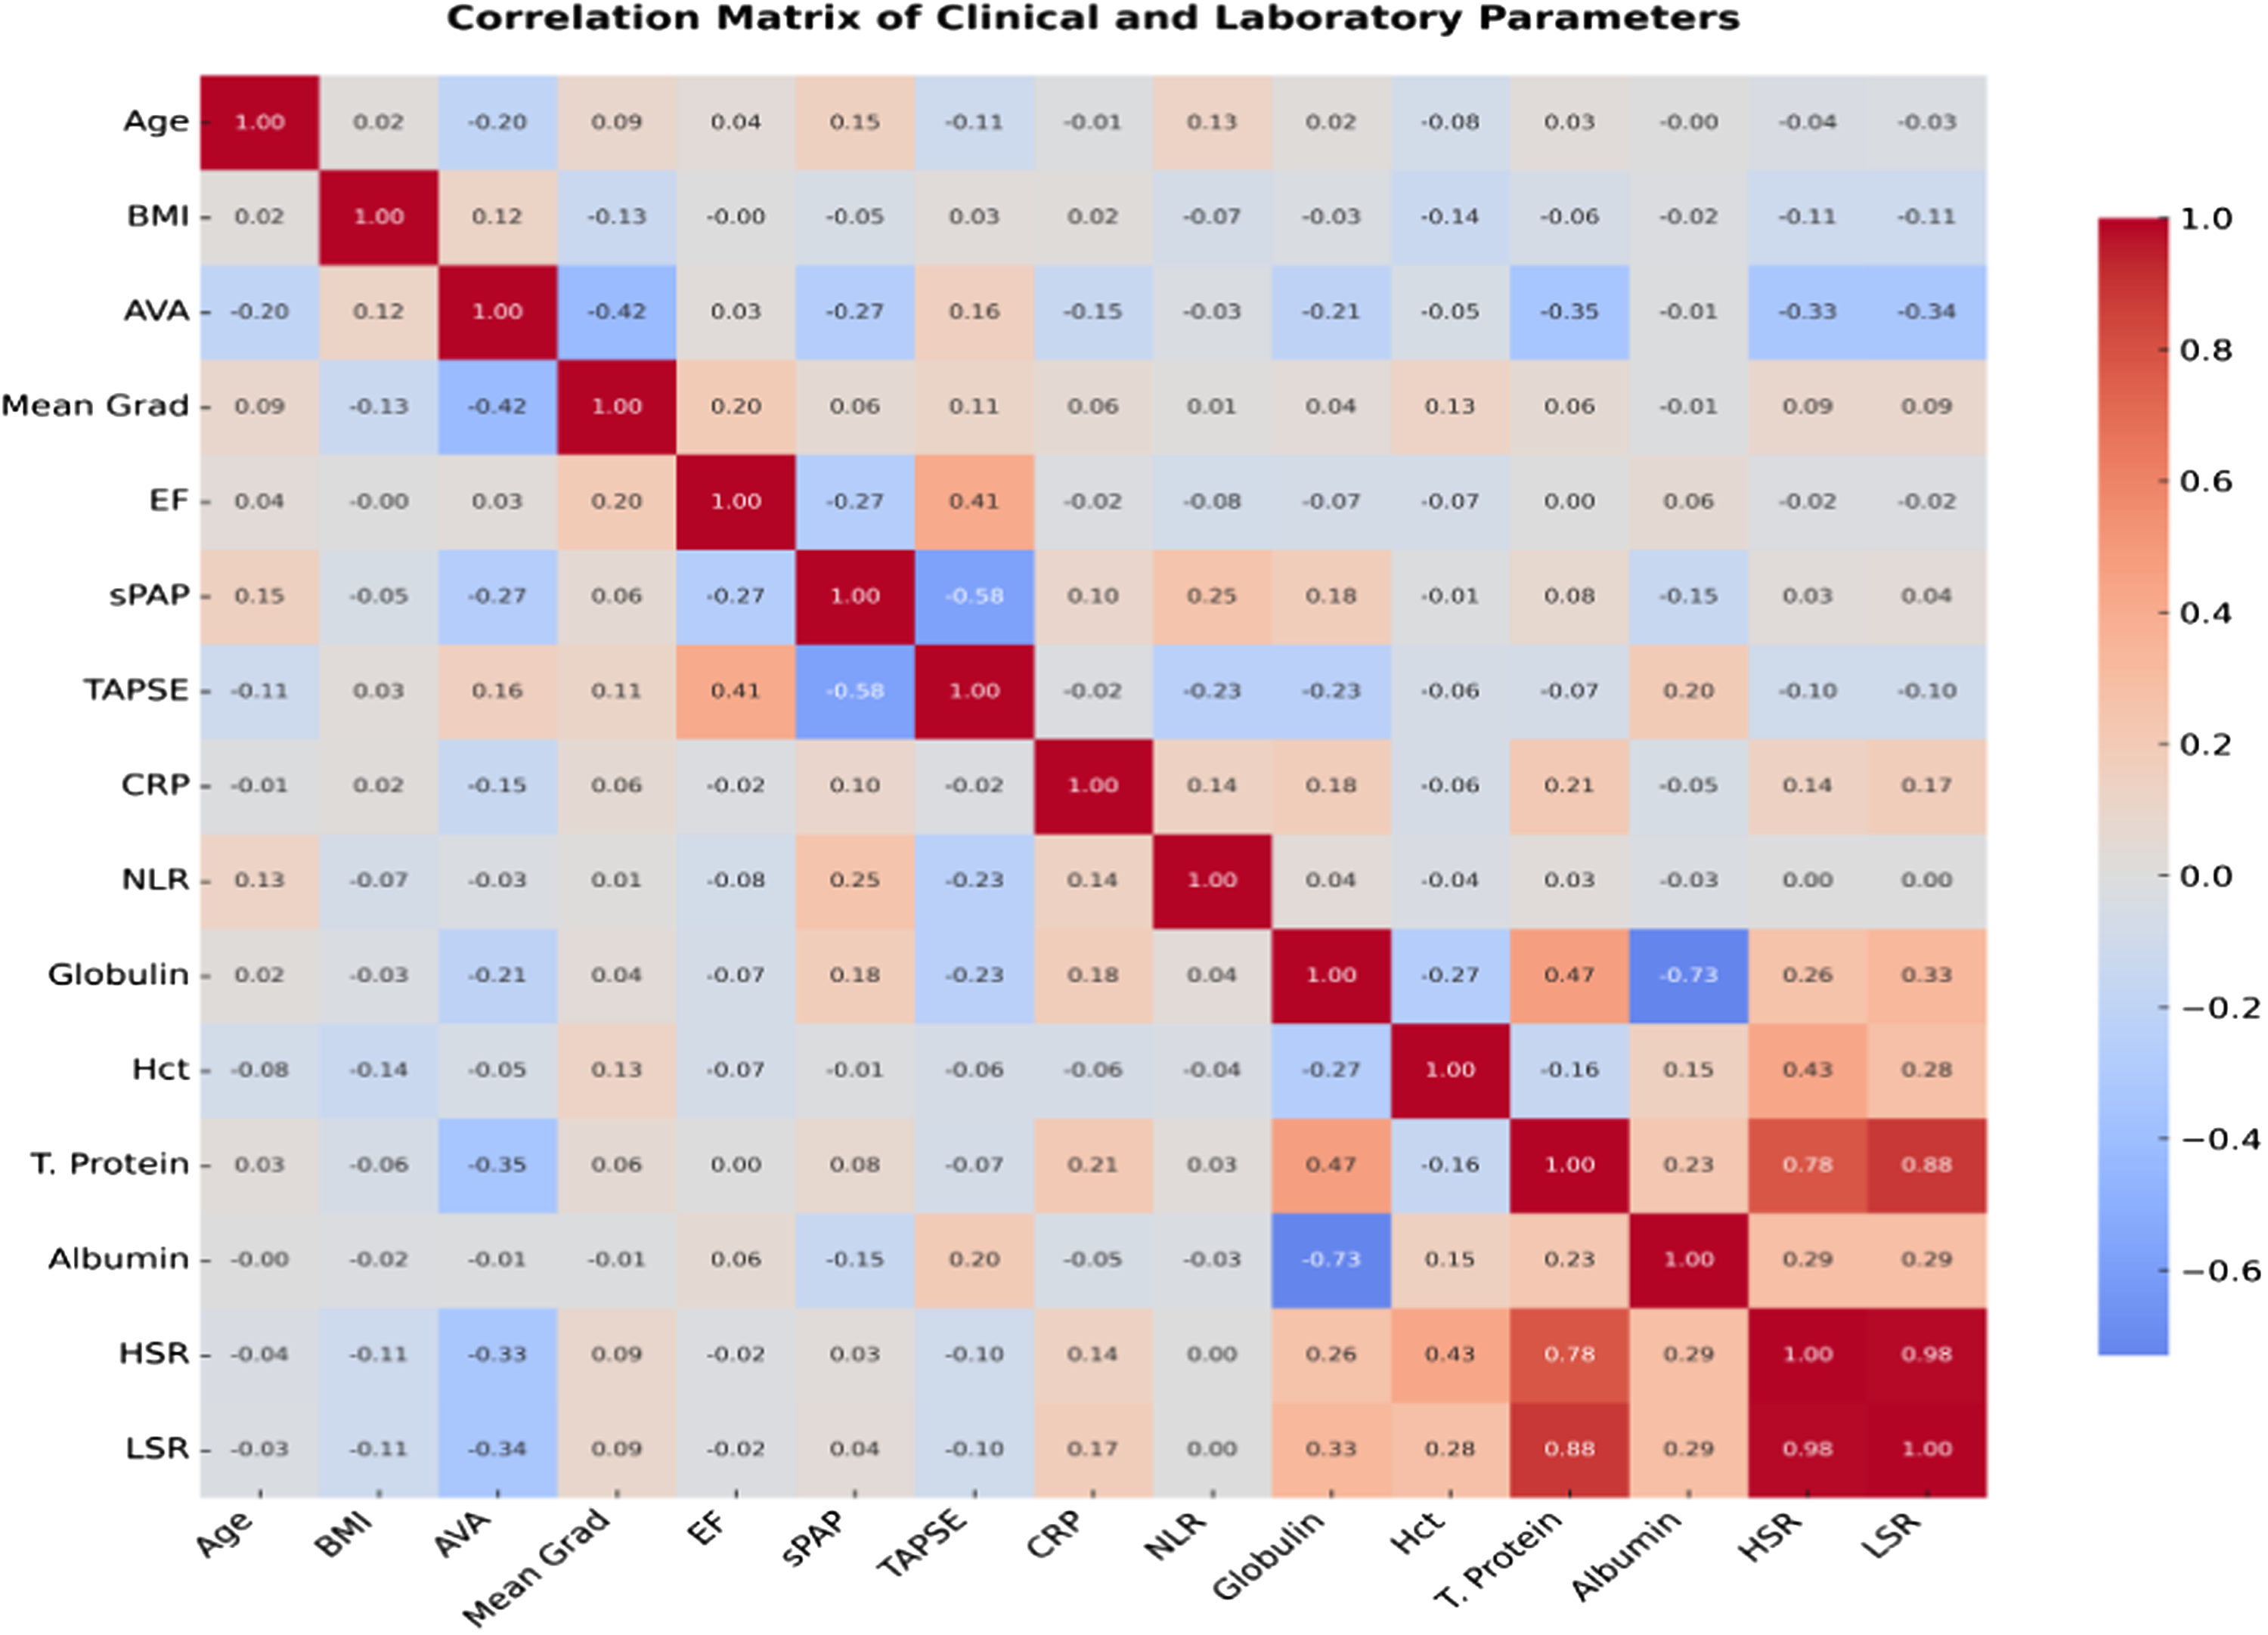
Correlation heatmap of preoperative variables showing positive associations of viscosity indices (HSR, LSR) with hematocrit and total protein and inverse associations with aortic valve area.
Mixed-effects models showed significant postoperative reductions in globulin, hematocrit, HSR and LSR (FDR-adjusted p < 0.001). A significant Time × VAI interaction indicated that larger valve area increases were associated with steeper declines in viscosity and globulin. CRP was a positive predictor of WBV, while procedure type (TAVI vs bAVR) had no independent effect (Table 5).
Changes in whole blood viscosity and related parameters from baseline to 3-month follow-up in the total study population (n = 200).
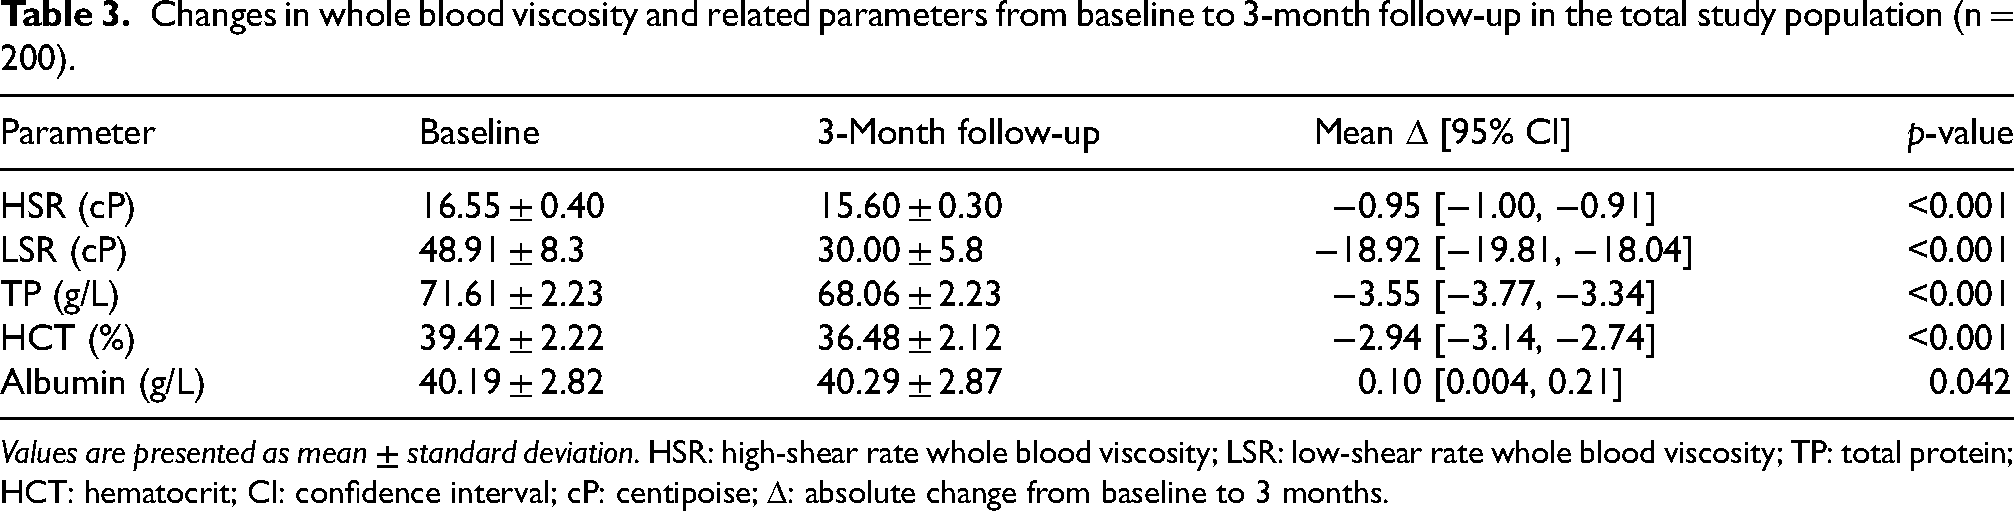
Values are presented as mean ± standard deviation. HSR: high-shear rate whole blood viscosity; LSR: low-shear rate whole blood viscosity; TP: total protein; HCT: hematocrit; CI: confidence interval; cP: centipoise; Δ: absolute change from baseline to 3 months.
Comparison of baseline, 3-month between TAVI and bAVR groups.
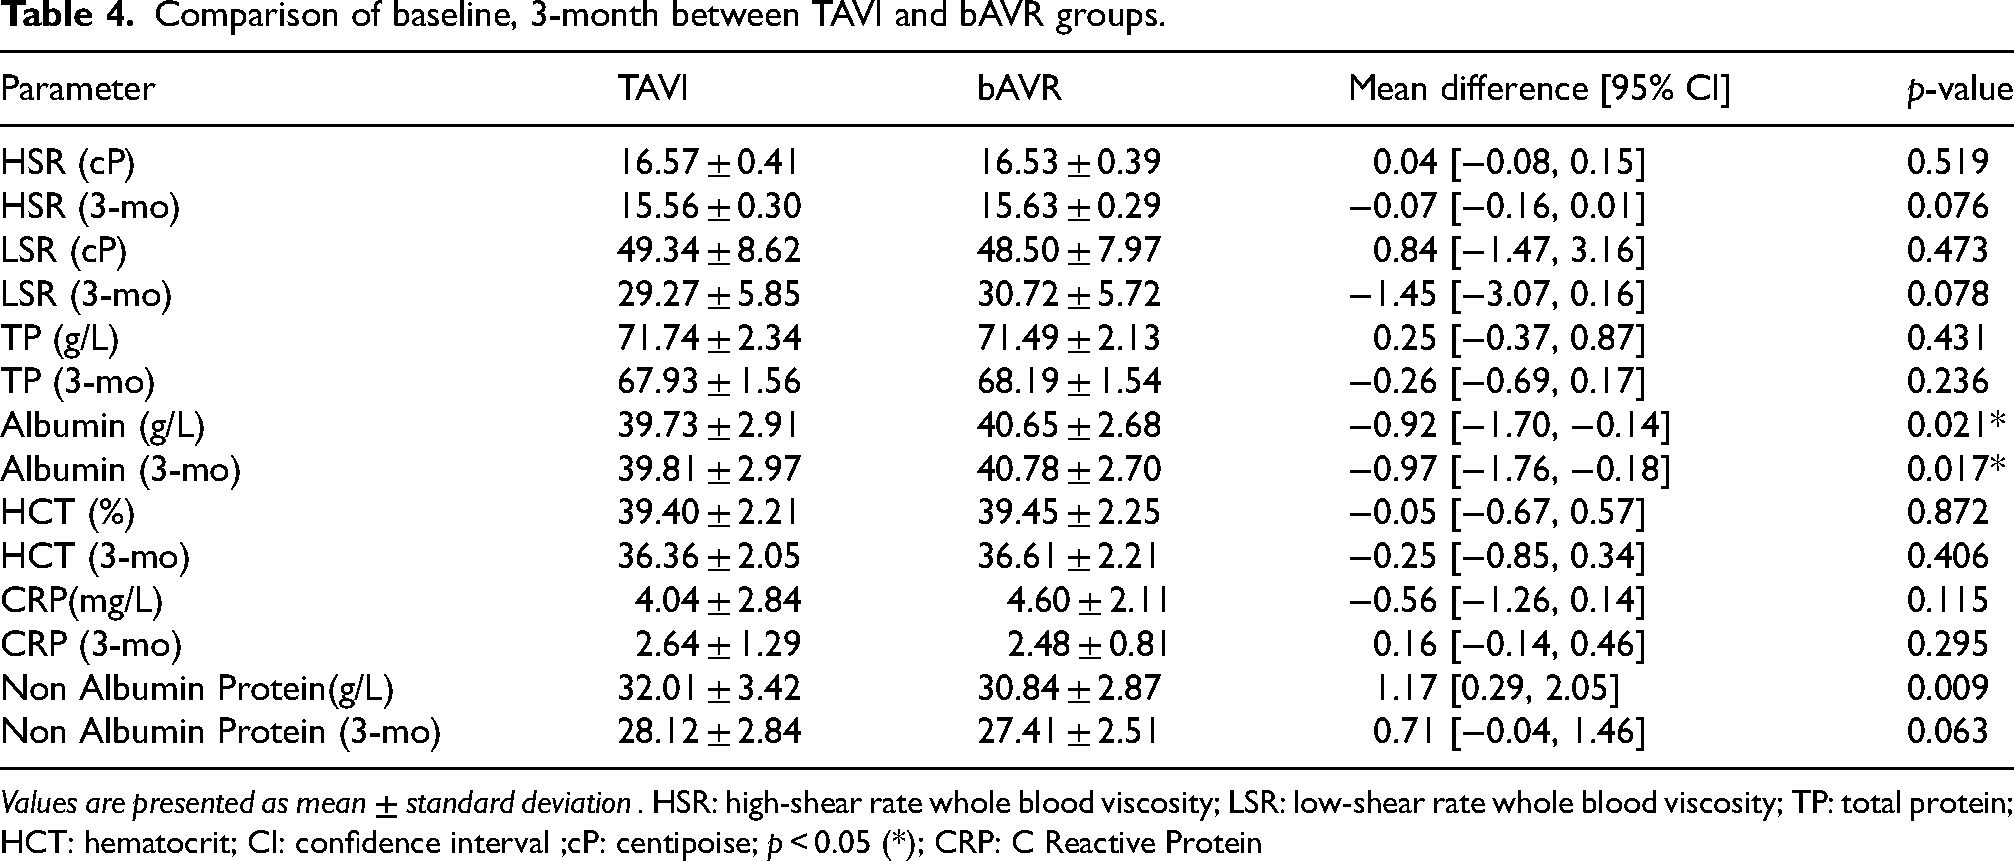
Values are presented as mean ± standard deviation . HSR: high-shear rate whole blood viscosity; LSR: low-shear rate whole blood viscosity; TP: total protein; HCT: hematocrit; CI: confidence interval ;cP: centipoise; p < 0.05 (*); CRP: C Reactive Protein
Results of mixed linear regression models examining the effects of time, group, valve area increase and CRP on hemorheological and inflammatory parameters.
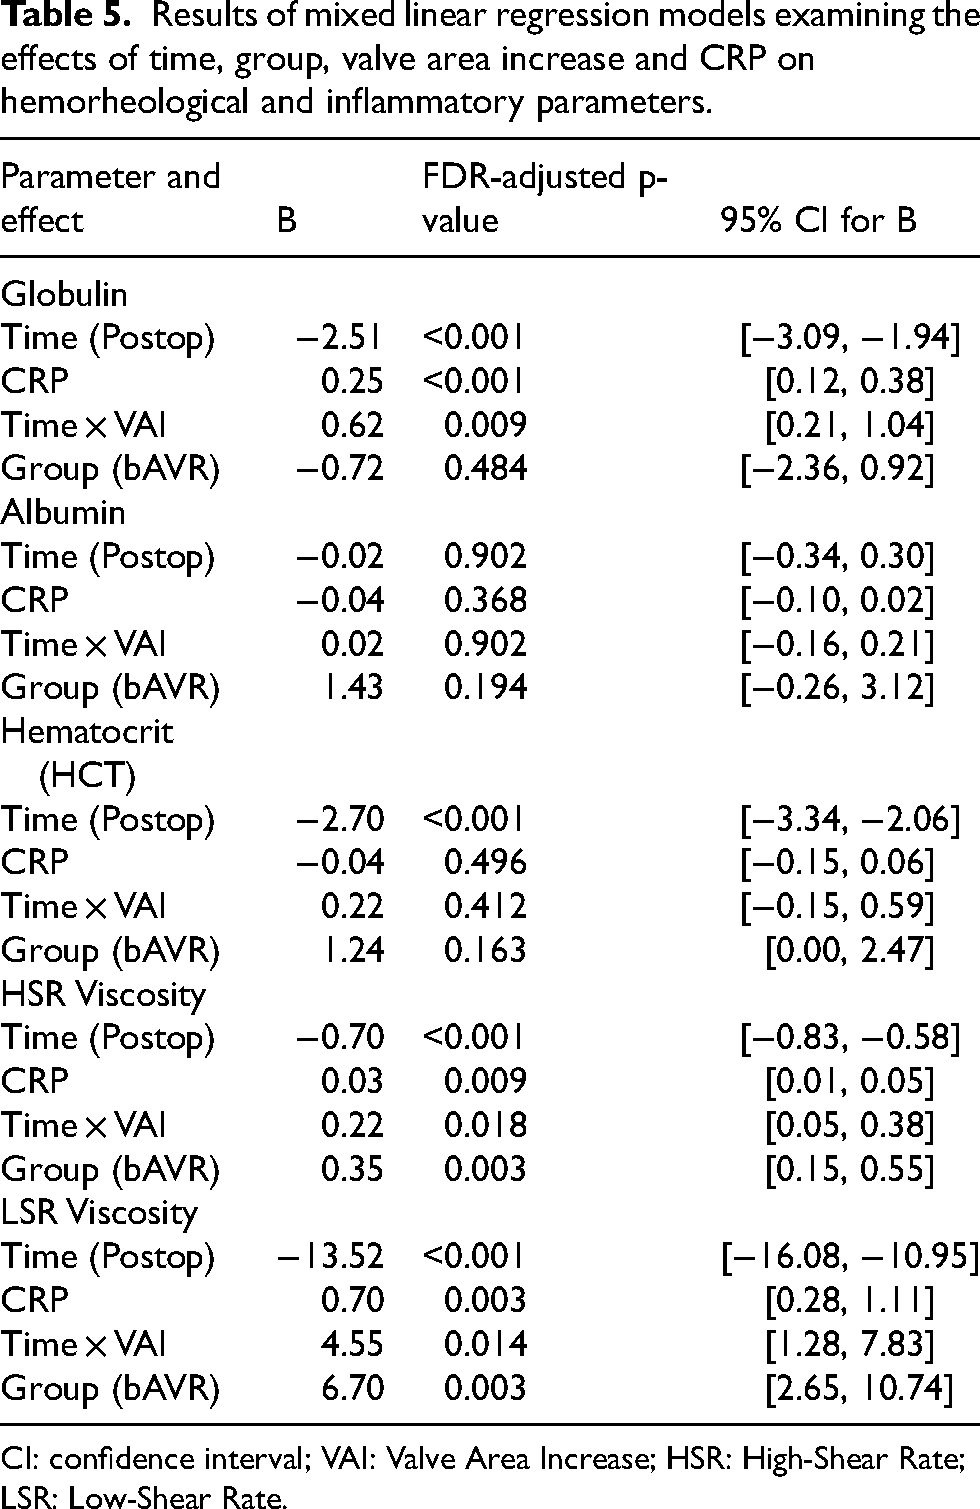
CI: confidence interval; VAI: Valve Area Increase; HSR: High-Shear Rate; LSR: Low-Shear Rate.
In univariable analyses, a smaller aortic valve area and a higher CT calcium score were associated with higher HSR and LSR (both p <0.001). In multivariable models, only the aortic valve area remained independently associated with viscosity (both p < 0.001), whereas the CT calcium score and other covariates were not retained (Table 6, Figure 3).
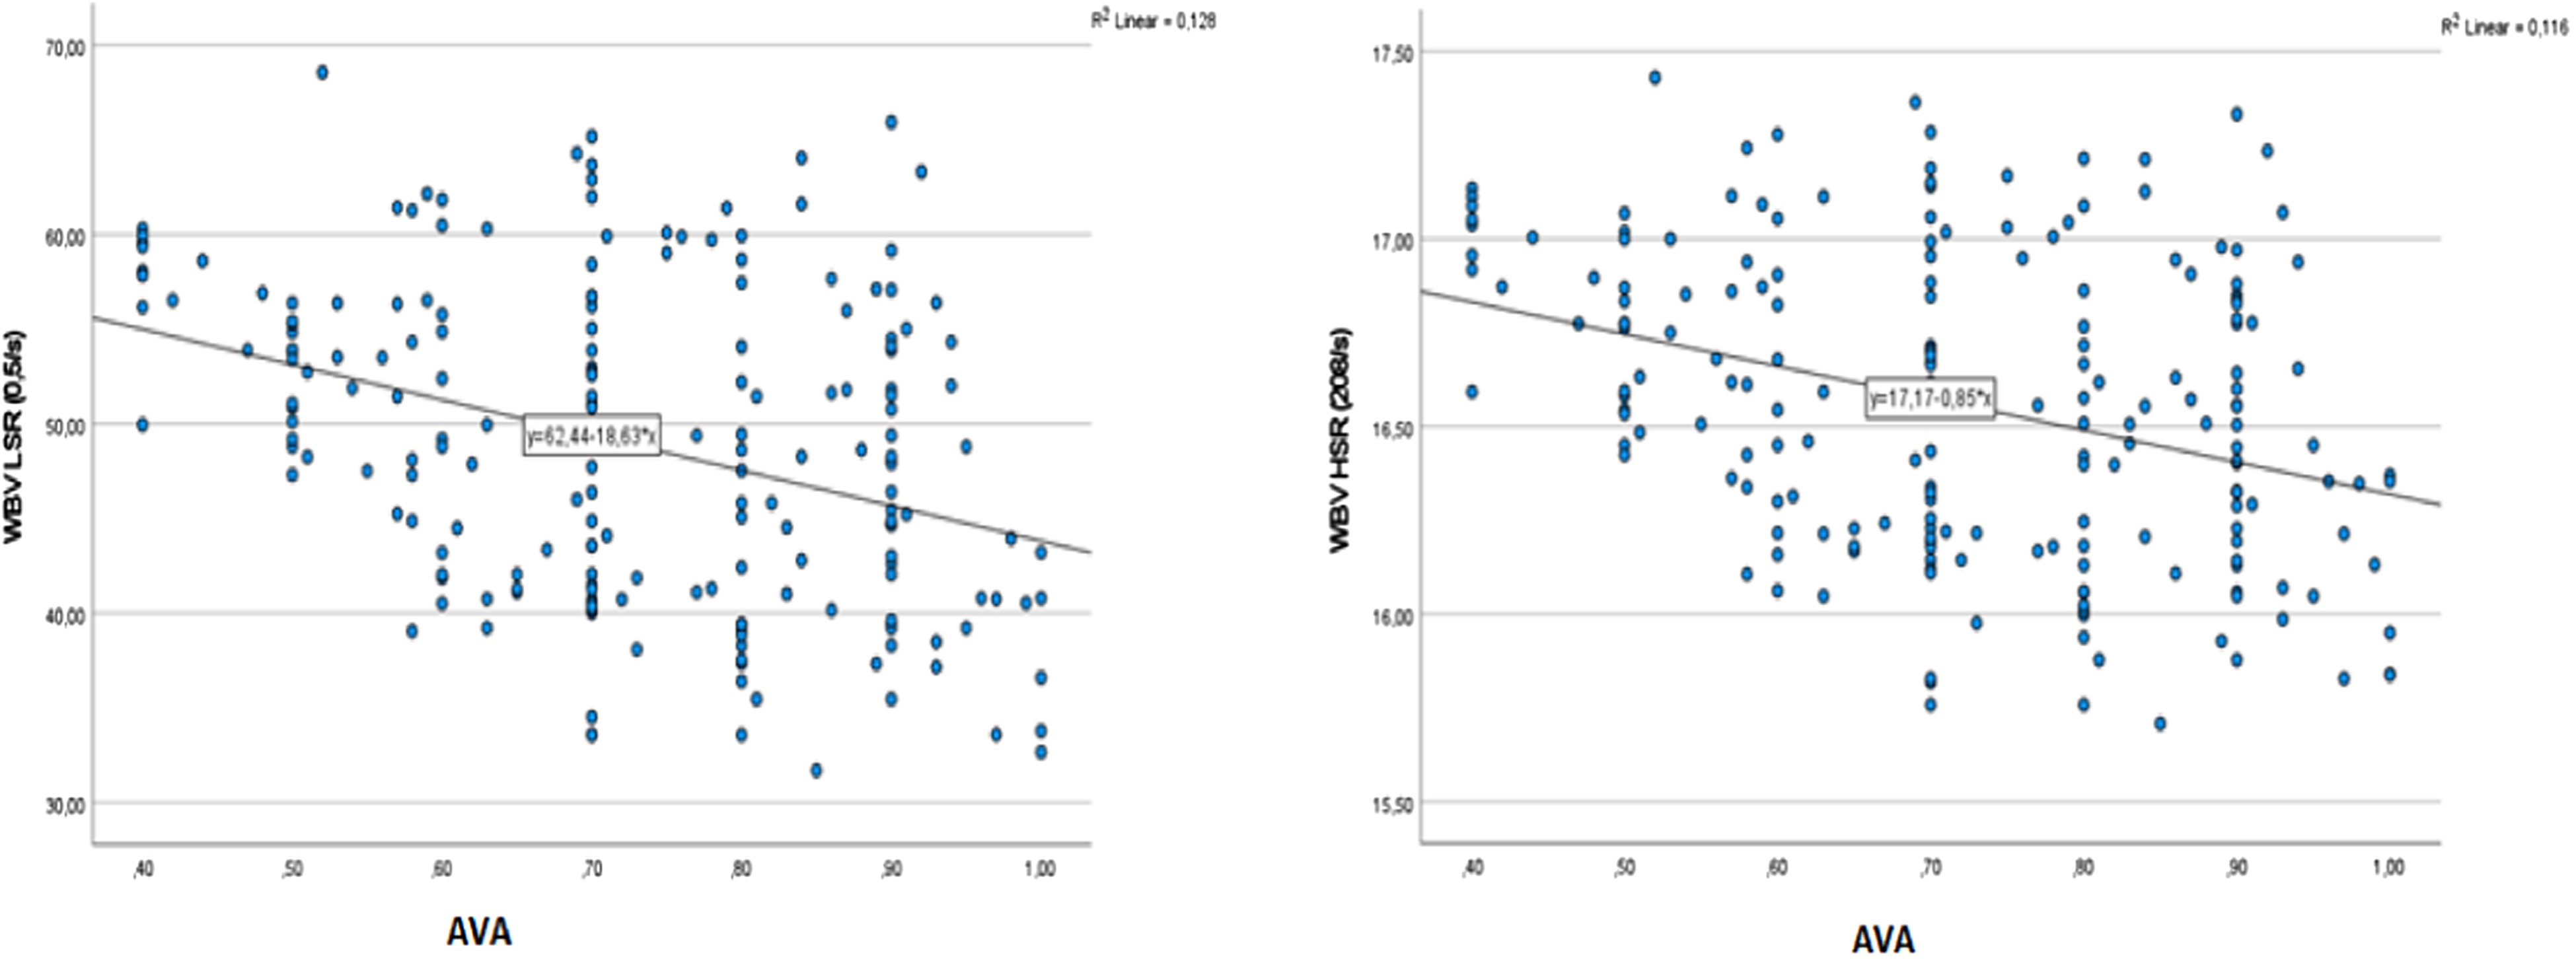
Relationship between aortic valve area and high shear rate and low shear rate blood viscosity.
Univariate and multivariable regression analysis.
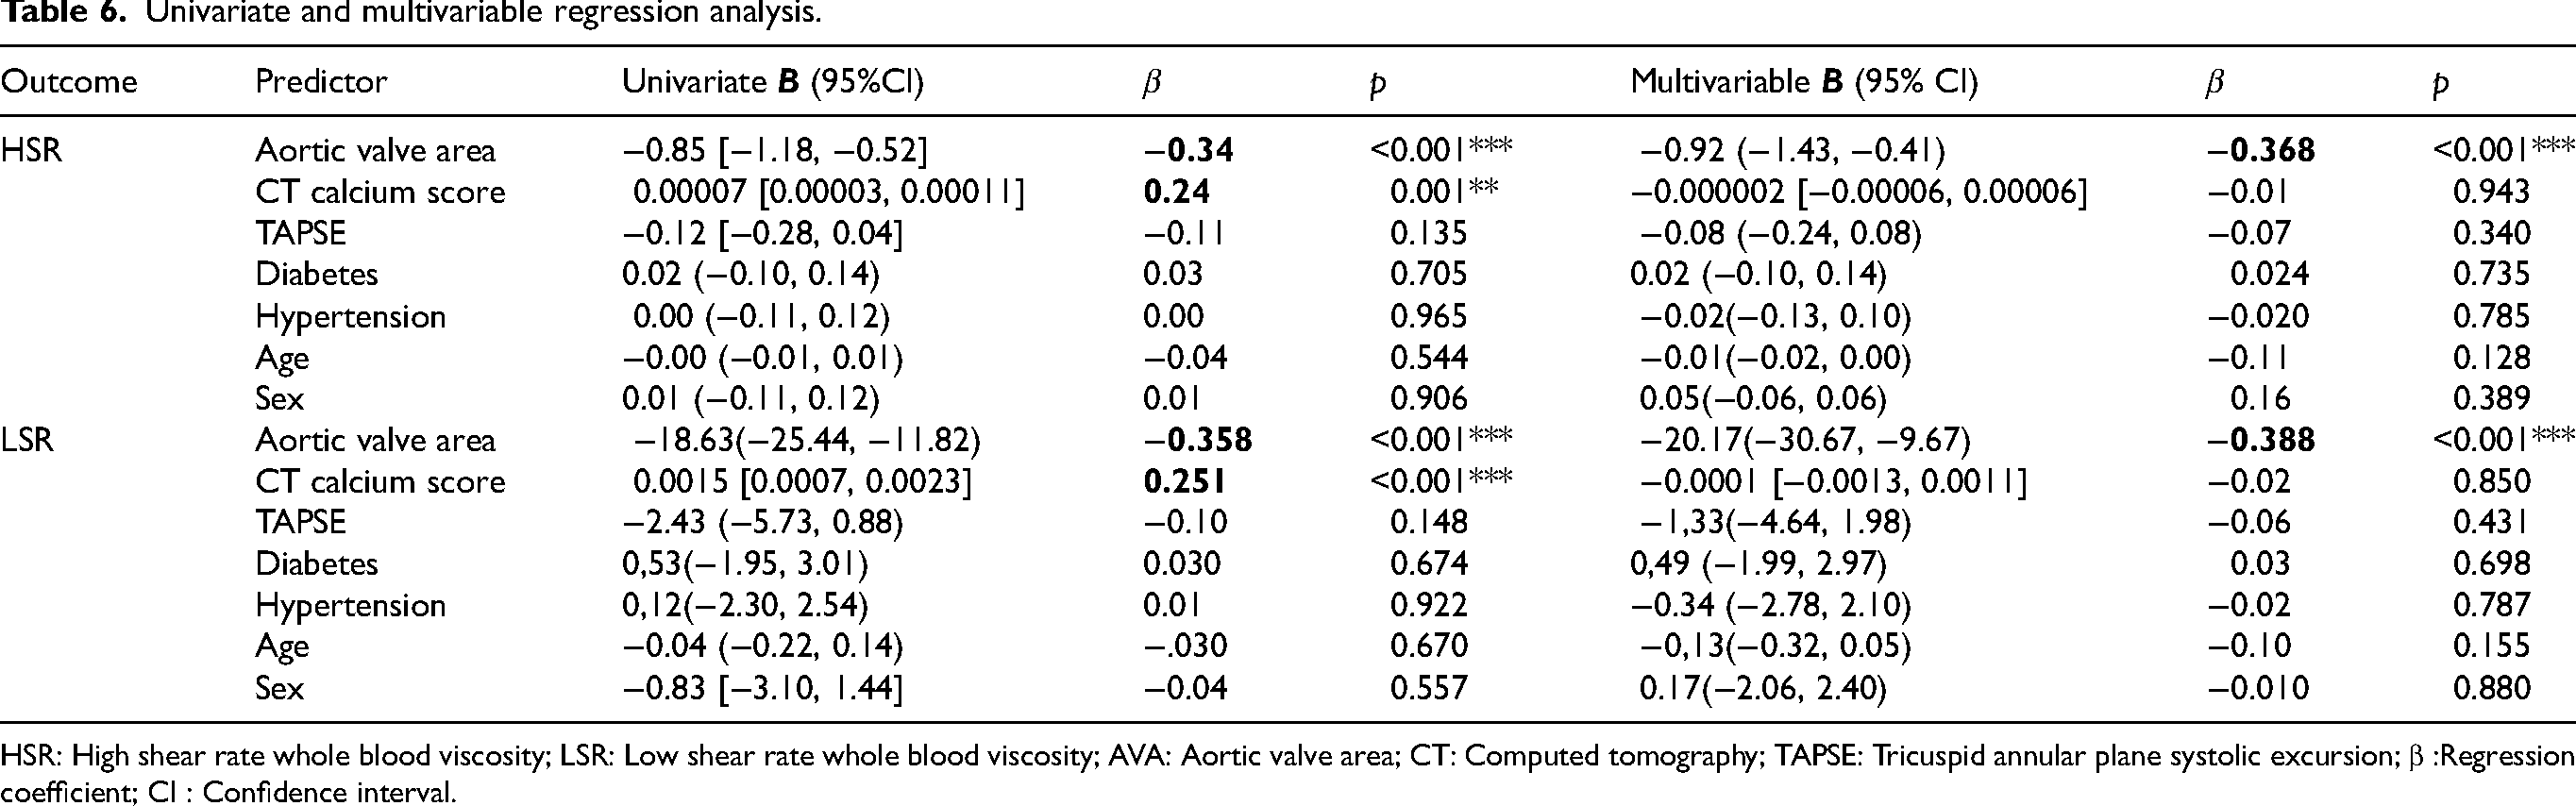
HSR: High shear rate whole blood viscosity; LSR: Low shear rate whole blood viscosity; AVA: Aortic valve area; CT: Computed tomography; TAPSE: Tricuspid annular plane systolic excursion; β :Regression coefficient; CI : Confidence interval.
Discussion
AS represents a complex pathophysiological entity characterized by progressive valvular narrowing that initiates a cascade of hemodynamic, inflammatory and rheological alterations. The narrowing of the aortic valve leads to increased left ventricular pressure and marked hemodynamic alterations. This process has been associated with various adaptive molecular and cellular mechanisms. 15 These interconnected pathways contribute to increased serum protein levels, altered rheological properties, and elevated whole blood viscosity, creating a complex hemodynamic and biochemical alterations that perpetuates disease progression. This study demonstrated significant reductions in both high- and low-shear-rate whole blood viscosity three months following valve intervention, suggesting not only an improvement in hemodynamic status but also secondary changes in plasma protein composition.
In this context, the present study evaluated the differential effects of transcatheter aortic valve implantation and bioprosthetic aortic valve replacement on the calculated whole blood viscosity using the validated De Simone formulas based on hematocrit and total protein levels. In addition to its physiological implications, WBV is a composite hemorheological parameter derived from hematocrit and total protein levels. While hematocrit reflects the cellular component of blood and total protein represents the plasma fraction, each parameter alone captures only a partial aspect of the hemorheological status. The De Simone formula integrates these two determinants into a single continuous variable, thereby providing a unified quantitative estimate of the hemorheological load. From a methodological perspective, the use of a composite parameter allows the combined contribution of these interacting variables to be assessed within a single model, thereby reducing redundancy and facilitating statistical interpretation. Accordingly, WBV may offer a more integrated representation of the hemorheological status than the isolated evaluation of its individual components.
The observed significant reductions in both high-shear-rate and low-shear-rate viscosity values post-procedure highlight the effectiveness of these interventions in restoring physiological vascular dynamics. These findings, in addition to previous studies focusing on biomarker-based risk stratification, such as interleukin-6, fibroblast growth factor-23, and N-terminal pro-brain natriuretic peptide, suggest that hemodynamic parameters, such as viscosity, may also be useful in the assessment of disease burden after intervention. 16
The substantial decreases in whole blood viscosity observed in this study—averaging 0.95 ± 0.31 units for high-shear-rate and 18.92 ± 6.32 units for low-shear-rate—underscore the profound physiological benefits of relieving valvular obstruction. These changes likely reflect improved flow dynamics, decreased turbulence, and reduced shear stress in the ascending aorta, which collectively contribute to enhanced cardiovascular efficiency. Previous literature has demonstrated that successful valve replacement reduces afterload and enhances cardiac output, 17 which in turn stabilizes systemic hemodynamics and promotes cardiovascular recovery. Akdi and Gayretli Yayla reported significantly higher whole blood viscosity levels in patients with severe aortic stenosis compared to healthy controls, with viscosity values closely correlating with transvalvular gradients. 18 The present study extends these findings by demonstrating that both TAVI and bAVR normalize these parameters, likely through improved vascular flow patterns and possibly related to improved flow-mediated vascular conditions. 19
In addition, significant negative correlations were observed between the aortic valve area and both high shear-rate viscosity (r = –0.340, p < 0.001) and low shear-rate viscosity (r = –0.358, p < 0.001). These results suggest that the blood viscosity progressively increases as the valve area narrows. This phenomenon may be related to the enhanced shear forces and turbulent flow patterns in severe aortic stenosis, which promote erythrocyte aggregation and plasma protein interactions.20,21 Collectively, these findings provide convergent evidence supporting the potential role of WBV as a marker of hemodynamic burden. 22
Consistent with the literature, previous hemorheology studies have demonstrated that increases in fibrinogen and globulin levels elevate whole blood viscosity (WBV), thereby impairing microcirculation and adversely affecting tissue perfusion. In particular, Cho and Cho's review entitled “Hemorheology and Microvascular Disorders” highlighted that these plasma proteins promote erythrocyte aggregation, that viscosity rises more prominently at low shear rates, and that this in turn increases capillary flow resistance and contributes to oxygen–trophic disturbances. 23
In our study, we observed a postoperative decrease in non-albumin proteins, accompanied by an increase in albumin levels. This biochemical shift may have partly contributed to the observed reduction in the calculated WBV underlying the marked reduction in WBV. Thus, in line with the literature, our findings indicate that the decline in WBV is attributable not only to changes in hematocrit but also to alterations in plasma protein composition, particularly the reduction in the non-albumin fraction.
Our linear mixed-effects model analyses showed that post-replacement changes in WBV were related to time and the degree of hemodynamic success achieved. Specifically, the Time × Valve Area Increase (VAI) interaction revealed that declines in globulin, HSR, and LSR became steeper in parallel with the magnitude of valve area improvement. This finding suggests that the reduction in viscosity primarily parallels hemodynamic improvement following the relief of valvular obstruction.
In addition, CRP levels were positively associated with globulin and WBV levels. However, given that CRP values were within the normal range and comprehensive inflammatory biomarkers (e.g., cytokine profiles or fibrinogen levels) were not assessed, these findings should not be interpreted as definitive evidence of systemic inflammatory activation.
Nevertheless, procedure type (TAVI vs. bAVR) did not have an independent effect in the multivariable models. Given the baseline clinical and echocardiographic differences between the groups, adjusted longitudinal analyses were performed, and the direction and magnitude of viscosity reduction remained consistent. Overall, these results indicate that WBV changes are driven primarily by hemodynamic gains and changes in protein-related hemorheological parameters, independent of the intervention method used.
This study demonstrated that the effects of TAVI and bAVR on WBV are comparable, with both procedures providing significant early hemodynamic improvement. Calculated WBV may represent a surrogate marker of hemorheological adaptation following valve intervention.
Limitations
This study had several limitations. First, its retrospective and single-center design may have introduced selection bias, despite the inclusion of consecutive patients. Owing to the retrospective nature of the study, the timing of comorbidities and medication use, as well as post-procedural treatment modifications, could not be fully standardized. In particular, the dynamic nature of antithrombotic and cardiovascular therapies may have introduced treatment-related confounding effects on the observed changes in blood viscosity. Second, WBV was not directly measured using viscometers but estimated using the De Simone formula derived from hematocrit and total protein levels. Although validated, this approach does not account for other determinants of viscosity, such as erythrocyte deformability, aggregation, and fibrinogen levels, or plasma protein subfractions potentially limiting the measurement precision and mechanistic interpretation. Third, the biological mechanisms underlying the observed hemorheological changes were not evaluated directly. Only routine laboratory parameters were available, and detailed molecular analyses or plasma protein subfraction assessments were not performed systematically. Therefore, no mechanistic conclusions can be drawn regarding the pathways that contribute to the observed changes.
Fourth, the three-month follow-up period reflects short-term changes and precludes conclusions regarding long-term outcomes, including mortality, rehospitalization, and prosthetic valve durability. Finally, although the observed reductions in WBV were statistically significant, their prognostic relevance remains uncertain because no direct associations with clinical outcomes were demonstrated. Therefore, these findings should be considered hypothesis-generating and warrant validation in larger prospective studies with extended follow-up.
Conclusions
In patients with severe aortic stenosis, a significant reduction in the calculated high-shear-rate (HSR) and low-shear-rate (LSR) whole blood viscosity (WBV) values was observed 3 months after TAVI and bAVR. Considering that WBV was calculated based on hematocrit and plasma protein parameters, this decrease reflected changes in HCT, total protein, and albumin levels and was independent of the type of intervention. Therefore, the calculated WBV may be considered a surrogate marker of hemorheological changes after valve intervention.
Supplemental Material
sj-docx-1-chm-10.1177_13860291261442998 - Supplemental material for Changes in whole blood viscosity in patients undergoing percutaneous or surgical intervention for aortic stenosis
Supplemental material, sj-docx-1-chm-10.1177_13860291261442998 for Changes in whole blood viscosity in patients undergoing percutaneous or surgical intervention for aortic stenosis by Zeynep Esra Guner, Ahmet Karaduman, İsmail Balaban, Barkın Kültürsay, Ravza Betül Akbaş, Uğur Özkan and Regayip Zehir in Clinical Hemorheology and Microcirculation
Supplemental Material
sj-docx-2-chm-10.1177_13860291261442998 - Supplemental material for Changes in whole blood viscosity in patients undergoing percutaneous or surgical intervention for aortic stenosis
Supplemental material, sj-docx-2-chm-10.1177_13860291261442998 for Changes in whole blood viscosity in patients undergoing percutaneous or surgical intervention for aortic stenosis by Zeynep Esra Guner, Ahmet Karaduman, İsmail Balaban, Barkın Kültürsay, Ravza Betül Akbaş, Uğur Özkan and Regayip Zehir in Clinical Hemorheology and Microcirculation
Supplemental Material
sj-docx-3-chm-10.1177_13860291261442998 - Supplemental material for Changes in whole blood viscosity in patients undergoing percutaneous or surgical intervention for aortic stenosis
Supplemental material, sj-docx-3-chm-10.1177_13860291261442998 for Changes in whole blood viscosity in patients undergoing percutaneous or surgical intervention for aortic stenosis by Zeynep Esra Guner, Ahmet Karaduman, İsmail Balaban, Barkın Kültürsay, Ravza Betül Akbaş, Uğur Özkan and Regayip Zehir in Clinical Hemorheology and Microcirculation
Footnotes
Ethical considerations
The study protocol was approved by the Ethics Committee of Koşuyolu Training and Research Hospital (approval number: 2022/17/632; date: 01/11/2022), and it adhered to the ethical principles outlined in the Declaration of Helsinki.
Funding
The authors received no financial support for the research, authorship, and/or publication of this article.
Declaration of conflicting interests
The authors declared no potential conflicts of interest with respect to the research, authorship, and/or publication of this article.
Supplemental material
Supplemental material for this article is available online.
References
Supplementary Material
Please find the following supplemental material available below.
For Open Access articles published under a Creative Commons License, all supplemental material carries the same license as the article it is associated with.
For non-Open Access articles published, all supplemental material carries a non-exclusive license, and permission requests for re-use of supplemental material or any part of supplemental material shall be sent directly to the copyright owner as specified in the copyright notice associated with the article.